findings that cause initiating event occurrences ... · siifi fthign ificance o f th e fi difin...
TRANSCRIPT
Significance Determination of Inspection Findings that CauseInspection Findings that Cause
Initiating Event Occurrences
Steve Vaughn - NRC
1
Opening RemarksOpening Remarks
• Complex technical and programmatic issuep p g• SDP Basis Document language is not written in a
clear and concise manner• Cannot rely on “reading the headlines”• Helpful to understand several abbreviations and
terms (e g Baseline CDF ΔCDF CCDP CDterms (e.g., Baseline CDF, ΔCDF, CCDP, CD sequence)
• Be sensitive to loosely defined terms that can be yused out of context (e.g., there are several flavors of CCDP)
2
Problem Statement/Industry ConcernProblem Statement/Industry Concern
• The metric for the SDP is ΔCDF. /CCDP ≠ ΔCDF - Cannot multiple CCDP by 1/yr to get ΔCDF
The use of CCDP as an SDP metric is programmatically incorrect.
• Several Performance Indicator (PI) thresholds were developed using the ΔCDF metric. In order for PIs and findings to be equivalent inputs in the Action Matrix they
d t th t ineed to use the same metric.• If an inspection finding was the proximate cause of an
initiating event occurrence, the safety significance should t b d l d if th i iti ti t h d thnot be modeled as if the initiating event happened, rather
the initiating event frequency should be increased to a new higher value (i.e., Bayesian Update)
3

NRC Staff PerspectivesNRC Staff Perspectives
• CCDP - CDP ≈ ΔCDF and CCDP* ≈ ΔCDF
• As such, PIs and inspection findings effectively use the same metric and are therefore equivalent inputs in the Action MatrixAction Matrix.
• Bayesian updating the initiating event frequency is notBayesian updating the initiating event frequency is not appropriate for an inspection finding that was the proximate cause of an initiating event occurrence.
4*Inspection finding that causes an IE occurrence

Outside the ScopeOutside the Scope
• Findings that cause an initiating event frequency g g q yto increase but do not cause the initiating event to occur.
• Discussions on “causality”. The SDP basis states the finding should most often be identified as thethe finding should most often be identified as the proximate cause of a degraded condition. This determination of cause does not need to be based on a rigorous root cause evaluation butbased on a rigorous root-cause evaluation, but rather on a reasonable assessment and judgment of the staff.
5

Inspection Program BasicsInspection Program Basics
• Performance deficiency (PD)Performance deficiency (PD)
• More than Minor screening criteria (MTM)
i di h i• Finding = PD that is MTM
• ALL findings are assessed and assigned a safety (or security) significance by the appropriate SDP
6

Inspection and Performance Indicator ( ) l(PI) Program Overlap
• There is an overlap between the PerformanceThere is an overlap between the Performance Indicator (PI) and Inspection Programs.
• If there is an overlap both programs assess• If there is an overlap, both programs assess their respective input.
If b h i h (• If both inputs are greater than green (e.g., White) AND stem from the same underlying
l 1 Whi i ill i hcause, only 1 White input will go in to the Action Matrix (IMC 0308, Att 4, page 11)
7
OutlineOutline
• Recent activitiesRecent activities
• Review SDP basis document language
i h h i l d il f CC d C• Review the technical details of CCDP and CDF
• Proposed resolution
• NRC response to PWROG White Paper (if needed))
• Bayesian Inference (if needed)
8

Recent ActivitiesRecent Activities
• Several recent findings that caused IESeveral recent findings that caused IE occurrences
• NEI Letters• NEI Letters
• Public Meetings – May, November (2013) -J M (2014) ROP WG iJanuary, May (2014) – ROP WG meetings
• Interim Staff Guidance (ISG)
• Industry and NRC White Papers (2014)
9

SDP Technical Basis – IMC 0308, Att 3SDP Technical Basis IMC 0308, Att 3
• Guiding document IMC 0308 Att 3Guiding document IMC 0308, Att 3
• Specifically Section 8 “Use of ΔCDF (and ΔLERF) as the SDP Metric”ΔLERF) as the SDP Metric– Section A – Different Definitions of CCDP
S i B O i– Section B – Overview
– Section C – Basis in RG 1.174 and Mathematical T t t f ΔCDF d CCDPTreatment of ΔCDF and CCDP
10

CCDP Definition – Take 1CCDP Definition Take 1
• “Event” CCDP - represents the probability thatEvent CCDP represents the probability that a core would have gone to a damaged state given that (i.e., “conditioned on”) a specific initiating event occurred AND the actual plant equipment and operator responses are
d f Thi “ ” f CCDPaccounted for. This “event” use of CCDP represents the remaining probabilistic “margin” (related to defense in depth) to coremargin (related to defense-in-depth) to core damage at a precise moment in time, that of the event itselfthe event itself.
11

“Event” CCDPEvent CCDP
• As described in the previous slide, the “event”As described in the previous slide, the event CCDP depicts a risk analysis process that;– Accounts for SSCs unavailable due to test and
maintenance– Accounts for actual (either successful or
f l) iunsuccessful) operator actions– Does not measure an increase in risk above a
baseline valuebaseline valueAt a high-level describes a MD 8.3 or ASP type analysis; not a SDP evaluationy ;
12

“Event” CCDPEvent CCDP
• One key aspect of the “event” CCDP concept isOne key aspect of the event CCDP concept is that it looks at a:
– precise moment in time
h– snapshot
– instantaneous occurrence
13

CCDP Definition – Take 2CCDP Definition Take 2
• “Condition” CCDP - refers to a degradedCondition CCDP refers to a degraded condition which may alter the plant’s risk over a period of time and is related to the plant’s ability to mitigate a number of different possible initiating events.
– Focuses on a “period of time”– Focuses on a “degraded condition” (not defined)– Appears to only focus on “mitigating systems”
14

SDP Basis DocumentSDP Basis Document
• The risk-informed SDP tools are designed toThe risk informed SDP tools are designed to estimate the increase in annualized CDF risk due to identified performance deficienciesdue to identified performance deficiencies that led to unavailability of equipment or safety functions or to the increase in initiatingsafety functions or to the increase in initiating event frequencies.
15

Takeaway 1Takeaway 1
• If a finding was the proximate cause of an• If a finding was the proximate cause of an IE occurrence, to evaluate the safety i ifi f th fi disignificance of the finding:• The nominal IE frequency should be
increased to a new, higher number.
16
Condition CCDPCondition CCDP
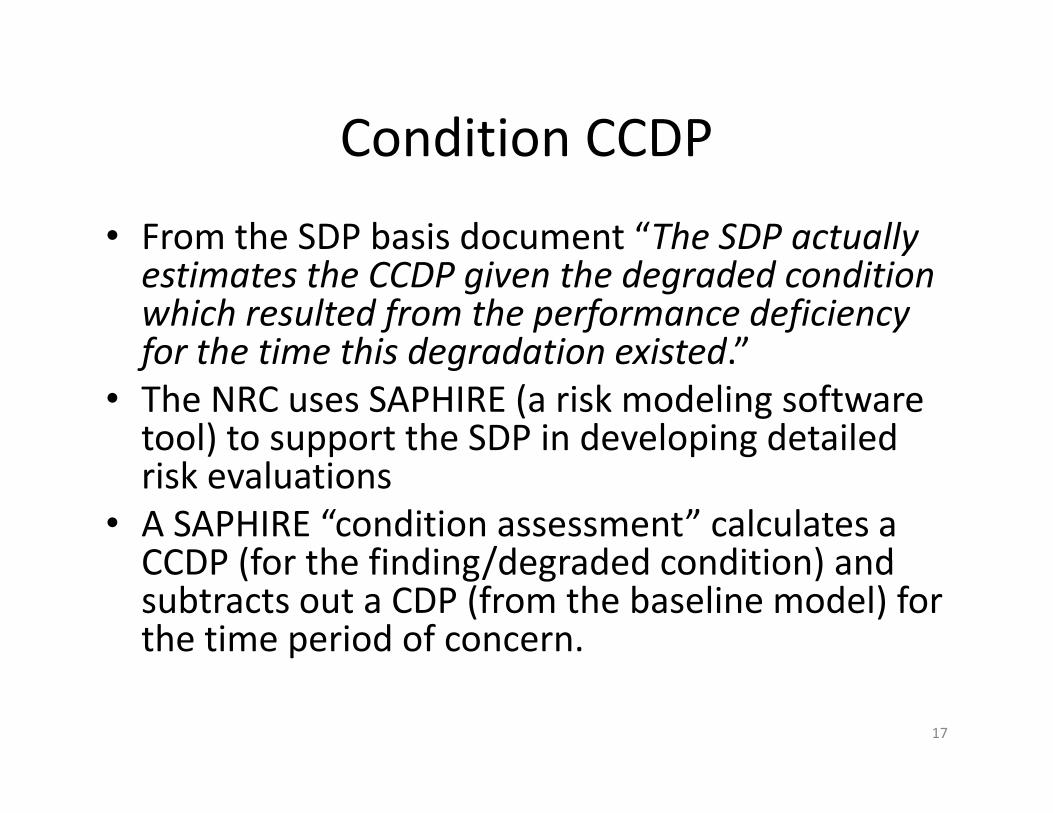
• From the SDP basis document “The SDP actually yestimates the CCDP given the degraded condition which resulted from the performance deficiency for the time this degradation existed ”for the time this degradation existed.
• The NRC uses SAPHIRE (a risk modeling software tool) to support the SDP in developing detailed risk evaluations
• A SAPHIRE “condition assessment” calculates a CCDP (for the finding/degraded condition) andCCDP (for the finding/degraded condition) and subtracts out a CDP (from the baseline model) for the time period of concern.
17
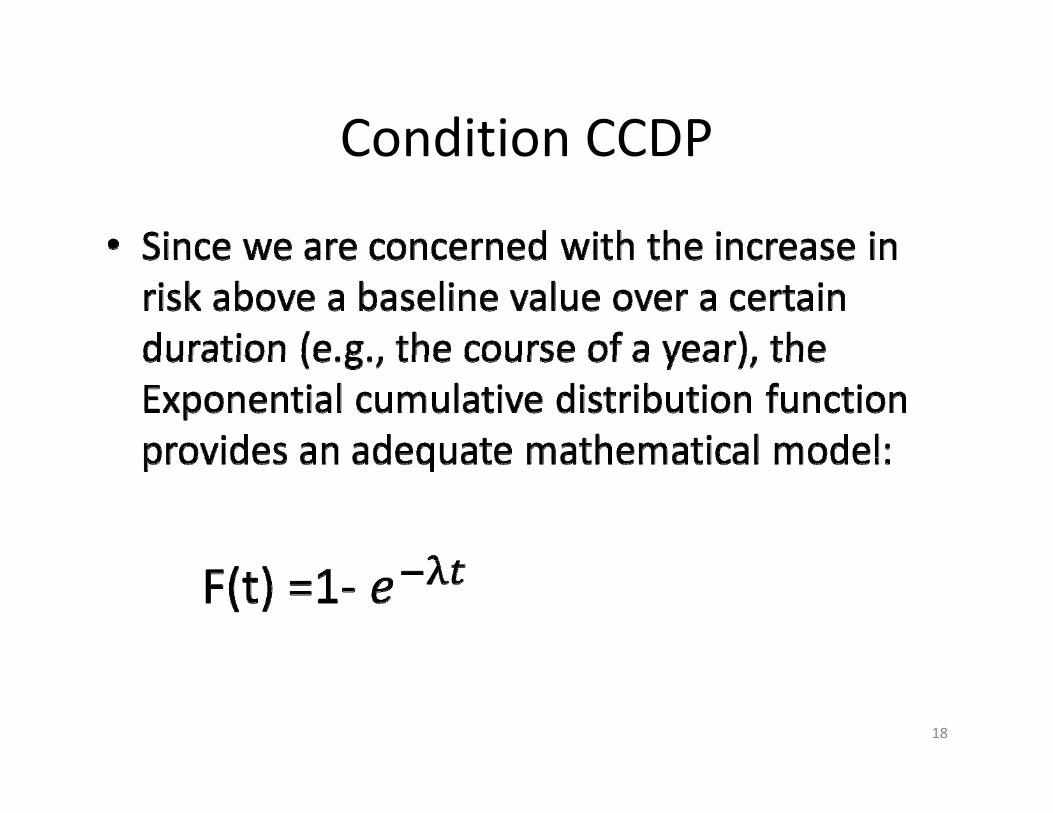
Condition CCDPCondition CCDP
18

Equation BreakdownEquation Breakdown
19

Graph of Cumulative CDP of a plant h l /with a Nominal 5E-5/yr CDF
Cum Dist Function of Baseline CDP
1
1.2
0.6
0.8
CumDist
FunctCDP
0.2
0.4
CDP CDP
0
0
4000
8000
1200
0
1600
0
2000
0
2400
0
2800
0
3200
0
3600
0
4000
0
4400
0
4800
0
5200
0
5600
0
6000
0
6400
0
6800
0
7200
0
7600
0
8000
0
8400
0
8800
0
9200
0
9600
0
1000
00
1040
00
1080
00
1120
00
1160
00
1200
00
1240
00
YearsYears
20

Graph of Cumulative CDP of a plant h l /with a Nominal 5E-5/yr CDF
6.0E-05
5.0E-05
3.0E-05
4.0E-05
CumDist
FunctCDP
CDP
1 0E-05
2.0E-05
CDF
0.0E+00
1.0E 05
0 9 18 27 36 45 54 63 72 81 90 99 108
117
126
135
144
153
162
171
180
189
198
207
216
225
234
243
252
261
270
279
288
297
306
315
324
333
342
351
360
Days
21
Days

Model the Finding – “Condition” CCDPModel the Finding Condition CCDP
22

‹#›

Graph of Baseline CDP for .75 yr and d fFinding CCDP for .25 yr
7.0E-05
5.0E-05
6.0E-05ΔCDF ≈CCDP - CDP
3.0E-05
4.0E-05CCDP (90days)
AndCDP (275 days)
CDP
CCDP
1 0E 05
2.0E-05
CDF Base
CDF Finding
0.0E+00
1.0E-05
0 11 22 33 44 55 66 77 88 99 110
121
132
143
154
165
176
187
198
209
220
231
242
253
264
275
286
297
308
319
330
341
352
363
Days
24
Days

Comparing ΔCDF and CCDP-CDP in a d hSpreadsheet
Delta CDF andDelta CDF and CCDP-CDP Approximation
25Is a MS 1.0 the same as an IE 1.0?

Initiating Events ModelingInitiating Events Modeling
• Two options:
– 1) Increase the frequency to 1/year - same approach as the “condition” CCDP in that the result is a CCDP – CDP (Nothe condition CCDP in that the result is a CCDP CDP (No Bayesian Updating)
– 2) Assume all other IEs did not occur (set to 0.0 probability) and assume the IE of interest did occur (set toprobability) and assume the IE of interest did occur (set to 1.0 probability and subtract out the nominal IEF)
Both options follow the SDP rules Every other aspect ofBoth options follow the SDP rules. Every other aspect of the model not associated with the finding is in its nominal state. (e.g., average T&M, nominal failure probabilities)p )
26

Graph of CDP, CCDP (1/yr), and CCDP ( )(1.0)
7.0E-05
5.0E-05
6.0E-05CCDP (1.0) ≈CCDP (1/yr)
3.0E-05
4.0E-05CumDist
FunctCCDPand
CDP
CCDP (1/year)
2.0E-05
3.0E 05CDP
( /y )
CCDP (1.0)
0.0E+00
1.0E-05
0 10 20 30 40 50 60 70 80 90 100
110
120
130
140
150
160
170
180
190
200
210
220
230
240
250
260
270
280
290
300
310
320
330
340
350
360
DaysDays
27

Proposed ResolutionProposed Resolution
1) The SDP technical basis document language suggests that an “event” CCDP is one that includes the IE occurrence AND actual operator and equipment responses (i.e., akin to a MD 8.3 or ASP analysis)2) Mathematically a CCDP – CDP is very approximate to a ∆CDF.3) Likewise, setting the IE to a 1.0 (i.e., IE occurred) and3) Likewise, setting the IE to a 1.0 (i.e., IE occurred) and subtracting out the nominal IEF is also very approximate to a ∆CDF. All other IEs are set to 0.0 (i.e., they did NOT occur) occur)4) Bayesian updating to derive a new IEF given that an IE occurred is not an appropriate for the SDP (IE and MS cornerstones should be consistent)cornerstones should be consistent).
28

Proposed ResolutionProposed Resolution
• RASP, Vol 1, Section 8 and IMC 0308, Attachment , , ,3, Section be revised to clarify that:– 1) Findings that are the proximate cause of an IE
occurrence are assessed by the SDPoccurrence are assessed by the SDP.– 2) The SDP assessment should model the safety
significance using one of two methods (or both methods for comparison):methods for comparison):• Set IEF to 1/year (perform a “condition” assessment)• Set IEF to 1.0 and subtract out the nominal IEF (perform an
“initiating event” assessment)initiating event assessment)Note: Recovery credit and other detailed modeling assumptions will also be included in the analysis
29
Proposed ResolutionProposed Resolution
• The Draft revisions to IMC 0308 Attachment 3The Draft revisions to IMC 0308, Attachment 3 and RASP Volume 1 will be reviewed internally by NRC staff and management and thenby NRC staff and management and then shared publically with external stakeholders (e g ROP WG public meeting)(e.g., ROP WG public meeting).
• Based on all stakeholders feedback revisions to IMC 0308 Attachment 3 and RASP Volumeto IMC 0308, Attachment 3 and RASP, Volume 1 will be issued.
30

Back-up SlidesBack up Slides
Back-up Slides
31

SDP Basis - OverviewSDP Basis Overview
• The risk-informed SDP tools are designed toThe risk informed SDP tools are designed to estimate the increase in annualized CDF risk due to identified performance deficiencies that led to punavailability of equipment or safety functions or to the increase in initiating event frequencies.
• The increase is measured from the normal annualized (i.e., baseline) CDF that includes ( )random failure probabilities and average test and maintenance (T&M) unavailabilities.
32

SDP Basis - OverviewSDP Basis Overview
• The SDP actually estimates the CCDP given the y gdegraded condition which resulted from the performance deficiency for the time this degradation existedexisted.
• The nominal CDP, which accounts for average T&M during this time, is subtracted from the CCDP to obtain gthe change in CDP due to the degraded condition alone (without consideration of any specific maintenance configuration that might have existed)configuration that might have existed).
• This numerical result is then normalized by dividing it by 1 year to arrive at a delta CDF in units of “per year.”
33

SDP Basis - OverviewSDP Basis Overview
• The objective of using the SDP is to characterize j gthe significance of inspection findings in a manner that is comparable to performance indicators (PIs) for use in the NRC Action Matrixindicators (PIs) for use in the NRC Action Matrix.
• The reactor safety cornerstone performance indicator thresholds were developed based on the increase to annualized CDF.
• Thus, in comparing and “adding” the effects of PIs and inspection findings within the ActionPIs and inspection findings within the Action Matrix, it is necessary to use the same risk metric.
34

RG 1.174 and Mathematical BasisRG 1.174 and Mathematical Basis
• The basis documents for establishing the SDP risk gguidelines were RG 1.174, which bring in the Regulatory Analysis Guidelines, and the Safety Goal Policy StatementPolicy Statement.
• The NRC Accident Sequence Precursor (ASP) process typically includes any additional failures or yp y yunavailability in its assessment of risk significance. Therefore the question has arisen whether when applying the SDP the failed or unavailable SSC that isapplying the SDP, the failed or unavailable SSC that is not related to the finding per se should be treated as a failed or unavailable SSC.
35

RG 1.174 and Mathematical BasisRG 1.174 and Mathematical Basis
• If the finding relates to a specific reason that a particular SSC is, or has the potential to be, unavailable (e.g., failure to follow a particular procedure) then it should, for the purposes of the SDP, be irrelevant p pwhether another SSC is unavailable because it has been taken out of service for routine or scheduled maintenance.
• The chance that the events could have occurred simultaneously is accounted for in the SDP by using unavailability values for the redundant or diverse trainsunavailability values for the redundant or diverse trains or systems that reflect the probability that they are unavailable.
36
RG 1.174 and Mathematical BasisRG 1.174 and Mathematical Basis
• Including the plant configuration as part of the g p g pfinding is equivalent to risk tracking, as captured by a safety monitor for example, and is a record of one sample of all the possible outcomes or aof one sample of all the possible outcomes, or a snapshot of the condition of the plant.
• It is however, not directly related to the estimate of the risk impact in the sense required for calculating ΔCDF. It is more accurately characterized as a measure of the margin to corecharacterized as a measure of the margin to core damage, which could be measured as a CCDP (for plant trip events).
37

RG 1.174 and Mathematical BasisRG 1.174 and Mathematical Basis
• If some of the failures that contribute to aIf some of the failures that contribute to a high CCDP are truly random, then does it make sense to penalize the licensee because they occur?
• What makes much more sense is to track the residual CCDP with respect to the deliberate changes to plant configuration (i.e., those
il bili i hi h h li hunavailabilities over which the licensee has direct control).
38
Technical DiscussionTechnical Discussion
• How does the PRA produce a CDF?How does the PRA produce a CDF?• How is a “condition” CCDP calculation (i.e., a
CCDP – CDP) extremely approximate to aCCDP CDP) extremely approximate to a ∆CDF?
• How can an “initiating event” CCDPHow can an initiating event CCDP calculation be extremely approximate to a “condition” CCDP calculation?
NOTE: The “initiating event” CCDP can also be a “delta” calculationcalculation
39

Theoretical Baseline CDFTheoretical Baseline CDF
• All the initiating events (IEs) that can occur atAll the initiating events (IEs) that can occur at a plant are modeled as the first input in a specific Event Tree (e g SLOCA)specific Event Tree (e.g., SLOCA)
• All of the mitigating systems (MS) that are designed to operate and mitigate the onset ofdesigned to operate and mitigate the onset of a particular IE are modeled as a series of Fault Trees (e g feed & bleed high pressureTrees (e.g., feed & bleed, high pressure injection, secondary cooling)
40

Theoretical Baseline CDFTheoretical Baseline CDF
• With all the IEs and MSs in their nominal state t a t e s a d Ss t e o a state(i.e., IE with nominal frequencies and MS with nominal failure probabilities and average T&M
l b l ) h d dunavailabilities), each event tree and associated fault trees are calculated to get CD sequences.Th lt f h CD i ti l• The results for each CD sequence in a particular event tree is in units of “per year” or “1/year) because the IEF is in units of “per year” and thebecause the IEF is in units of per year and the outputs from all the fault trees are probabilities (i.e., unitless number between 0 and 1)
41
Theoretical ∆CDFTheoretical ∆CDF
• Let’s assume a finding was the proximateLet s assume a finding was the proximate cause of a pump being in a failed state for 1 year.
• For simplicity, we can assume that the failure probability for that pump is 1.0 for the entire year.
• The result would be a new CDF (for the degraded condition). If we subtract out the baseline CDF, the result is a ∆CDF.
42

How does SAPHIRE calculate a CCDP?How does SAPHIRE calculate a CCDP?
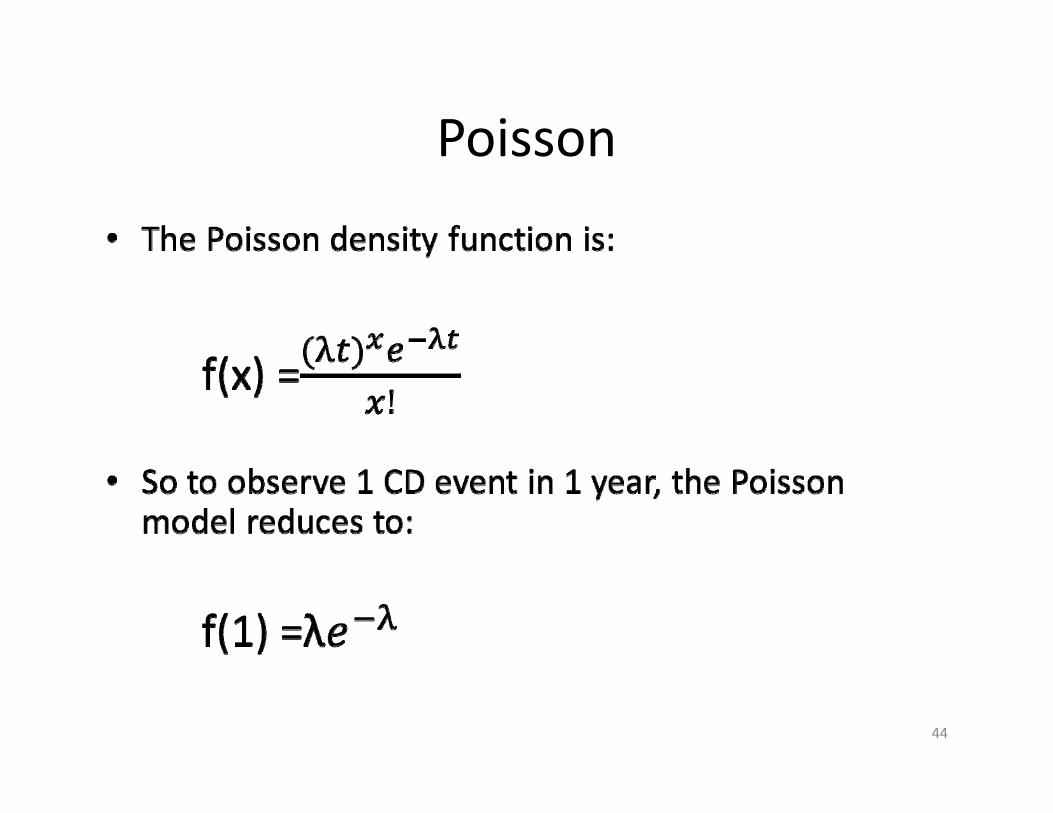
• Poisson distributionPoisson distribution– Typical model for IEFs
Attempts to predict the frequency of a random– Attempts to predict the frequency of a random event over a given period of time
– Parameter of concern is λ (also t for time)– Parameter of concern is λ (also t for time)
– At a high-level the SDP metric is attempting to measure the frequency (which can bemeasure the frequency (which can be approximated/converted to a probability ) of a CD event over the course of a year.
43
PoissonPoisson
44

ExponentialExponential
45
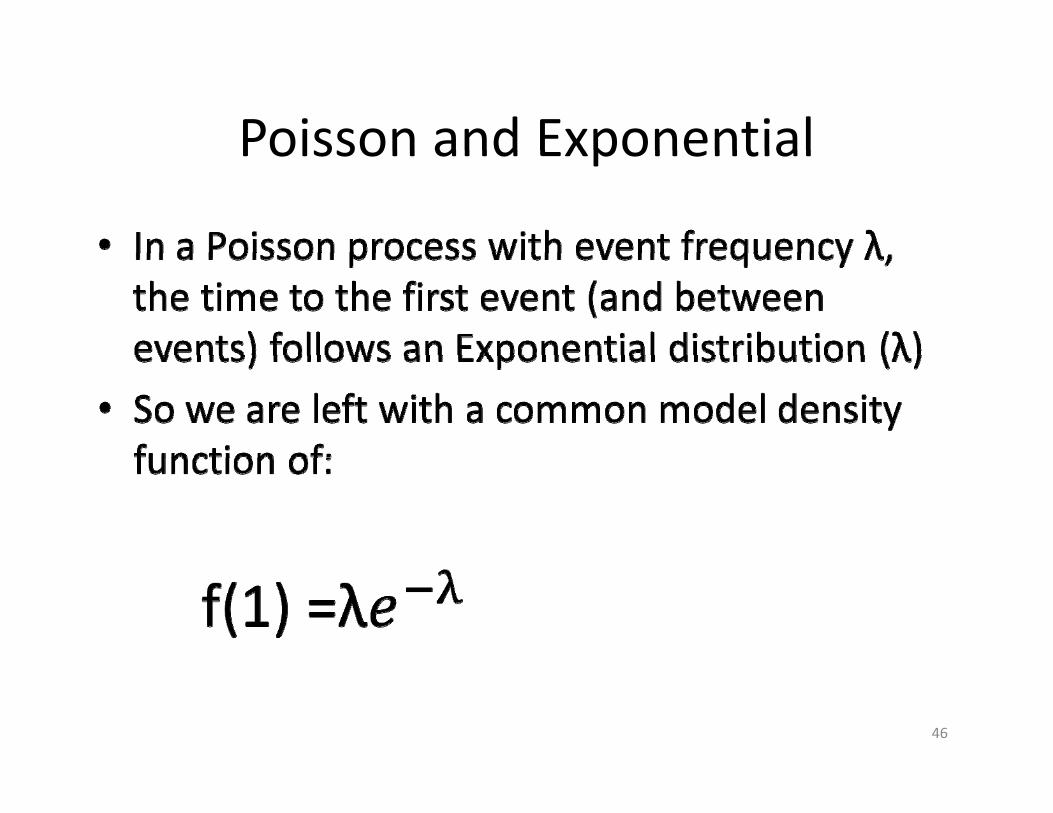
Poisson and ExponentialPoisson and Exponential
46

Bayesian InferenceBayesian Inference
• PRAs typically use Bayesian Inference forPRAs typically use Bayesian Inference for parameter estimation (e.g., IEF, FTR probability).
• The Bayesian process takes Prior Information andThe Bayesian process takes Prior Information and blends in New Information to infer an “Updated” understanding or expectation.understanding or expectation.– Prior = 20 years of generic pump FTS data
– New= 2 years of plant-specific FTS datay p p
– Update= A mathematical blend of the Prior and New data (called the Posterior)
47

Bayesian Update or Not?Bayesian Update or Not?
Question: If a finding causes an IE to occurQuestion: If a finding causes an IE to occur, should we (for the purposes of the SDP):
1 Use that single IE occurrence to update the1. Use that single IE occurrence to update the IEF? (i.e., Bayesian update) or
2 D i h f i ifi f h2. Determine the safety significance of that single IE occurrence? (i.e., do not Bayesian
d )update)
48

Bayesian Update or Not?Bayesian Update or Not?
• Example – Bayesian Update Approach:Example Bayesian Update Approach:• Baseline Loss of Vital DC Bus – Prior info = 1 event in 1282 critical yearsPrior info = 1 event in 1282 critical years– New info = 0 events in the past 44 critical years– Updated IEF – 7.5 E-4/yrUpdated IEF 7.5 E 4/yr
• A finding causes a Loss of Vital DC Bus – Prior info = 1 event in 1282 critical yearsPrior info 1 event in 1282 critical years– New info = 1 event in the past 44 critical years– Updated IEF – 1.5 E-3/yrUpdated IEF 1.5 E 3/yr
49

Bayesian Update or Not?Bayesian Update or Not?
• Example – Bayesian Update ApproachExample Bayesian Update Approach• Using the Bayesian update process the IEF for
a LODCB increased 7.5 E-4.a LODCB increased 7.5 E 4.• Using a typical PWR SPAR model, the
frequency for a LODCB was increased 7.5E-4frequency for a LODCB was increased 7.5E 4 (which calculates a CCDP – CDP and is extremely approximate to a ΔCDF )
• The result is a ΔCDF of 5.83 E-7 (Green or Very Low Safety Significance)
50
Bayesian Update or Not?Bayesian Update or Not?
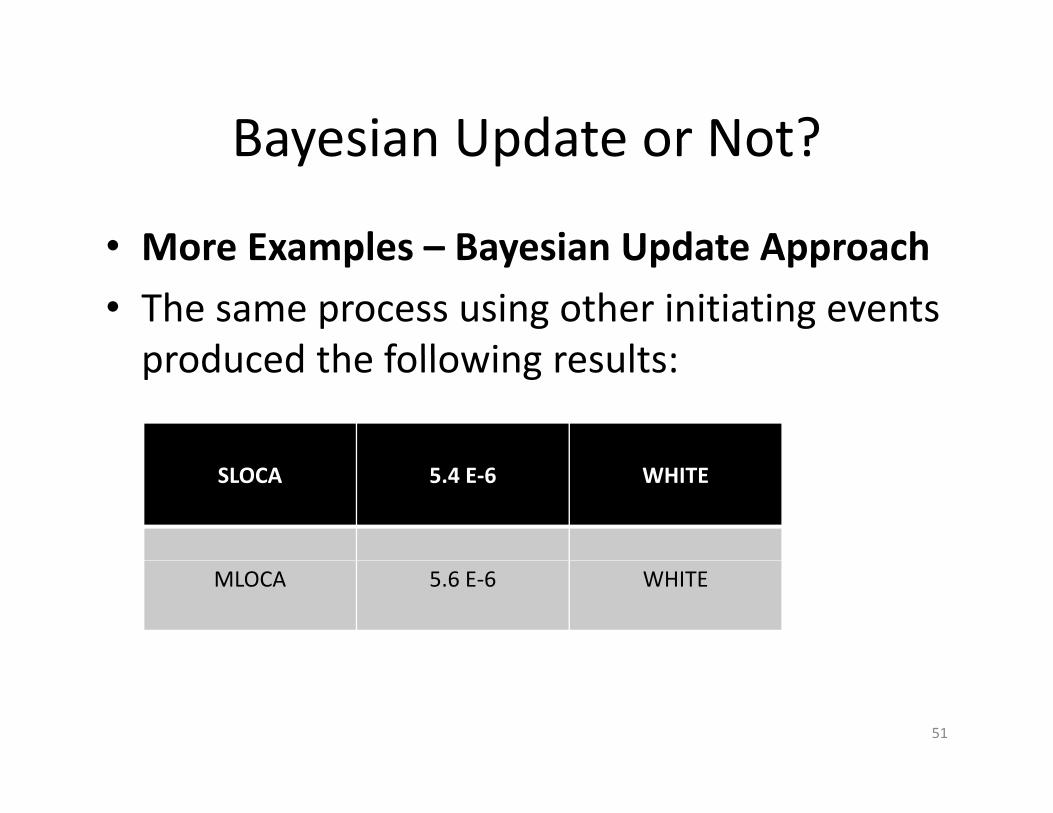
• More Examples – Bayesian Update ApproachMore Examples Bayesian Update Approach
• The same process using other initiating events produced the following results:produced the following results:
SLOCA 5.4 E-6 WHITE
MLOCA 5.6 E-6 WHITE
51

Bayesian Update or Not?Bayesian Update or Not?
• What if Bayesian Updating was used in theWhat if Bayesian Updating was used in the Mitigating Systems (MS) Cornerstone?– Ex: An inadequate maintenance procedure q p
resulted in improper lubrication of a trip throttle valve. After the ineffective maintenance was performed the pump started successfully 9 timesperformed the pump started successfully 9 times and failed to start on the 10th monthly test. During the 30 day exposure period:
– Is the new failure probability 0.1 (or 1/10)? – Or is the new failure probability 1.0 (or failed)?
52

Bayesian Update or Not?Bayesian Update or Not?
• In the MS cornerstone we typically assume thatIn the MS cornerstone we typically assume that the SSC was in a failed state for a defined exposure period (i.e., we do not Bayesian p p ( , yUpdate)
• So why would we do anything different in the IESo why would we do anything different in the IE cornerstone if an IE actually occurred as a result of an inspection finding?p g
• When the die is cast, the probabilistic distribution collapses (i.e., the uncertainty goes away)p ( , y g y)
53

PWROG White PaperPWROG White Paper
• Overall, the technical process that the PWROGOverall, the technical process that the PWROG developed basically results in the same outcome that the NRC staff is suggesting (i.e., different means, same basic end).
• PWROG proposed:– Define a fault exposure time (FET) for the finding – Derive a new IE frequency based on the FET– All other IEs are set to 0.00– Subtract out the baseline CDF
54

PWROG White PaperPWROG White Paper
Example:• If the finding caused an IE occurrence and the FET for
the finding was 3 months, then assume that the IEF is 4/year (i.e., 1/quarter for four quarters).4/year (i.e., 1/quarter for four quarters). – An IEF of 4/year that calculates a CDF (or CCDP) over a 3
months period essentially reduces to an IEF of 1/year.– Conceptually a FET for a finding is not congruent with the– Conceptually, a FET for a finding is not congruent with the
MS paradigm.– In MS the exposure time is the duration of the degraded
condition (i e pump unavailable); not the findingcondition (i.e., pump unavailable); not the finding. – Reason for the confusion? An IE occurrence is considered
instantaneous. To force fit the concept of an exposure time it had to be applied to the finding.time it had to be applied to the finding.
55
PWROG White PaperPWROG White Paper
• A main tenet of the PWROG proposal is based on a p pnote from the ISG issued in late Dec 2013.
• The note states: “This guidance is appropriate only h th f d fi i ld lwhen the performance deficiency would always cause
the initiator (i.e., there were no other performance deficiencies or atypical plant operational states that yp p pcontributed to the initiation of the event).”
• The wording for this note is poor and unfortunately was used as part of the basis for PWROG methodwas used as part of the basis for PWROG method
• The “i.e.” part of the note does not correspond well with the first phrasewith the first phrase
56

PWROG White PaperPWROG White Paper
• What the note is attempting to communicate is p gthat the finding needs to be the “proximate cause” of the degraded condition or IE occurrence (i e the finding cannot just make aoccurrence (i.e., the finding cannot just make a minor contribution (e.g., 15%) in causing the consequence and have the entire safety i ifi f th b tt ib t d tsignificance of the consequence be attributed to
the finding).• Overall the NRC staff does not agree that theOverall, the NRC staff does not agree that the
finding has to “always” cause an IE occurrence to be assessed by the inspection program and SDP.
57