fine china or fragile china?
TRANSCRIPT

ANZ Research Agri Focus | June 2019
FINE CHINA OR FRAGILE CHINA?
ANZ RESEARCH
AGRI FOCUSJUNE 2019

ANZ Research Agri Focus | June 2019
Farmgate returns remain elevated in most sectors as we head into winter. However, global risks are heightened as growth slows and trade tensions threaten China’s outlook in particular. Thus far our export sectors have not been negatively impacted but this is a key risk moving forward.
Milk prices for the season ahead are on track to be stronger than the current season. Fonterra has elected to take a more cautionary approach than the market expected, announcing a milk price in the range of $6.25-$7.25 per kg milksolids for the 2019/20 season. While demand could certainly be impacted by slowing global growth, global milk supply is also expected to be contained, which should support prices in the year ahead.
Meat returns remain strong, which is injecting confidence into the sheep, beef and deer farming sectors. Winter contracts for lambs are strong and schedule prices next season should continue to be supported by underlying market demand and the lower New Zealand dollar.
Beef markets are benefitting from additional volumes being diverted from the US market to China. This has helped keep returns strong through the autumn peak production period. Venison returns have been falling but remain strong. Returns are expected to lift again early in the season when procurement to supply chilled produce for the European Christmas markets occurs.
Horticulture investment continues as returns from key sectors such as kiwifruit and apples outperform. Total export returns from gold kiwifruit are expected to exceed returns from green fruit for the first time this season. Harvesting of the gold varieties is now complete while the green harvest continues.
Prices at farm/orchard level relative to 10yr average
Dairy
Dairy prices have eased slightly recently but are expected to be supported in the season ahead by a reduction in global milk supply, which in turn will boost the 2019/20 farmgate milk price.
SheepLamb and mutton farmgate prices remain strong. Winter contracts and next season’s prices are also expected to be elevated.
Beef
China is providing a strong alternative market to the US, which is supporting returns. Farmgate prices eased slightly during the peak processing period but underlying markets remain strong.
Forestry
Industry confidence is high, bolstered by good in-market prices and supportive government policy. Harvest rates will remain elevated in the years ahead.
This is not personal advice. It does not consider your objectives or circumstances. Please refer to the Important Notice.
INSIDE
Dairy 1
Lamb & wool 3
Beef 5
Deer 7
Grain 9
Forestry 11
Horticulture 13
Rural property market 14
Economic overview 16
Key forecasts 18
CONTRIBUTORS
Susan Kilsby Agriculture EconomistTelephone: +64 4 382 [email protected]
Sharon ZollnerChief Economist NZTelephone: +64 9 [email protected]
Publication date: 10 June 2019
Low High
Milk price
Low High
Prime steer
Low High
19kg lamb
Low High
A-grade log

ANZ Research Agri Focus | June 2019 1
DAIRY UPTURN DUE Global dairy markets have softened a tad as we enter the new dairy season, but markets remain well supported. Farmgate returns for the 2019/20 season are looking promising as global dairy markets deliver solid returns, which are then being bolstered further by the low New Zealand dollar.
Milk price forecasts are naturally uncertain so early in the season. Fonterra appears to be erring on the side of caution with its $6.25-$7.25/kg milk solid (MS) forecast. The top end of Fonterra’s range is a tad below our own forecast for the 2019/20 season of $7.30/kg MS. Other processors are also a little more bullish than Fonterra for next season, with Synlait, Open Country and Tatua all providing an initial forecast of $7/kg MS or higher.
Should the Westland sale to the Yili Group subsidiary be approved, its suppliers will be entitled to a milk price benchmarked against Fonterra. This is also typically how Yili has paid its Oceania suppliers.
Prices in global markets are reasonably stable at present, although a little weakness has crept into recent Global Dairy Trade events. Farmgate returns across much of the globe are not really strong enough to encourage extra milk to be produced, but efficient farms are certainly profitable at current levels. This means that while there is potential for some supply growth, it will only occur in regions such as Ireland, where operating costs are relatively low. Europe is the region with the greatest potential to deliver extra milk. The total quantity of milk produced in Europe is vast, meaning even a small increase in percentage terms has the potential to push a lot more milk into global markets.
Milk production in the United States has eased back a little in recent months when compared to year-ago levels. Tight margins continue to squeeze small and inefficient farms out of business. Larger farms that operate at economies of scale are managing better. Nevertheless margins are not expected to be sufficient to encourage expanded production in the near future. China is a large export market for US low-grade whey, which is primarily used to feed pigs. Demand for whey from China’s pork
4.0
4.5
5.0
5.5
6.0
6.5
7.0
7.5
8.0
8.5
16 17 18 19 20
$/kg
milk
solid
Spot milk price 2016-17 2017-18 2018-19 2019-20
FARMGATE MILK PRICE
Source: ANZ Research, GDT
DAIRY
-1200
-800
-400
0
400
800
1200
1600
10 11 12 13 14 15 16 17 18
Ann
ual c
hang
e (0
00 to
nnes
)
Southern Hemisphere Northern Hemisphere
GLOBAL MILK PRODUCTION
Sources: DCANZ, Dairy Australia, CLAL, Datum, USDA

ANZ Research Agri Focus | June 2019 2
industry has fallen sharply due to the decrease in the number of pigs being farmed as a result of the recent outbreak of African Swine Flu in China, and returns have accordingly dropped.
The significant supply problems in China’s pork industry have resulted in additional demand and high prices for beef. This is encouraging some of China’s small dairy farmers to cull their dairy cows. The expansion of large-scale dairying in China has also slowed due to lack of profits in the sector, meaning China will do well just to maintain its milk output at current levels. This means the gap will widen between production and demand and will need to be filled by even more imported product.
India is also growing its milk supply but any extra milk produced will most likely be absorbed by increasing domestic demand. Only 20% of the milk currently produced in India enters the formal market, although this is projected to rise in the future. The majority of milk produced is simply used by the families who milk a few cows, and sell any excess milk to their neighbours. The average herd size in India is just three cows!
Russia has ambitions to become an exporter of dairy products. It is eyeing up its neighbour China as a potential destination for its dairy products. Exports to neighbouring countries such as the former Soviet states are already occurring and this is expected to grow in the future. Government funding is supporting growth in the industry at both the farming and processing level and the country certainly has plenty of land available to expand its milk production. Therefore it is feasible that Russia’s demand for imported dairy products could fall away in the future but for the time being it will remain reliant on importing a portion of its dairy requirements.
World economic data remains weak and if this feeds into labour markets and consumption it could impact demand for dairy products, particularly in the regions where dairy is classified as a luxury rather than a necessity. New Zealand’s direct dairy exposure is primarily to the Asian markets whose domestic economies for now generally continue to grow rapidly despite the deterioration in the global economic climate and trade.
DAIRY

ANZ Research Agri Focus | June 2019 3
LAMB RETURNS STILL STRONGFarmers have enjoyed yet another year of strong lamb prices. Prices were above $7/kg carcase weight level for most of the season. Livestock agents had to work hard to keep lambs flowing through to the processors this year. The number of lambs processed this season (to mid-May) is 5% lower than last season. Beef & Lamb NZ estimates there will be 19.05 million lambs available for processing in the year ended 30 September 2019. Typically by this point of the season 75% of the available lambs will have been processed. It is debatable whether there are another 4.7 million lambs on the way given likely retention.
The increase in profitability in sheep farming in recent years has pushed ewe prices up and therefore more ewe lambs are likely to be retained for expansion purposes.
Excellent pasture production conditions earlier in the season, combined with slightly lower lamb numbers, meant farmers were reluctant to let go of lambs before they reached optimal weights. The lambs processed this season have killed out 0.6kg heavier on average
than normal. This additional weight has also bumped up returns to farmers by another 3%. It has been a tougher year for lamb finishers as the supply of store lambs has been meagre at times. But short-term pressure on pasture growth at certain times did create some opportunities for buyers who had feed on hand.
The strength of the lamb market continues to be underpinned by the growing demand from China for a range of meat cuts. In recent years strong demand from China for mutton and the poorer-quality lamb cuts has bolstered overall returns. But we are now seeing increased demand for higher value cuts from this market as well.
Brexit had the potential to disrupt our lamb markets this season due to both the UK and continental Europe being large markets for New Zealand lamb. Despite the uncertainty that persists around the Brexit process, and the weak economies of Europe, demand and pricing for New Zealand lamb has been stable in these markets. The stability from this market, combined with the buoyant Chinese market and the lower NZD, has supported farmgate prices
COARSE WOOL DROPS AGAINCoarse wool markets remain weak, but this is of lesser concern given the high returns for meat. Wool prices did pick up in April but have since given up their gains. Shearing costs have risen in recent years, making extracting wool from sheep a cost rather than an additional source of income. Nevertheless sheep must be shorn and therefore the supply of wool keeps coming.
Pre-lamb shearing will add further to the supply of coarse wool coming to market. The market for coarse wool is also being weighed down by wool taken off ewes last season that is yet to be sold.
Higher-quality wools such as the finer Merino and Crossbred wools continue to sell much better than coarse grades. There is also support in the market for
2
3
4
5
6
7
8
9
07 08 09 10 11 12 13 14 15 16 17 18 19
Pric
e pe
r kilo
gram
Lamb NZ 19kg NZ$ Lamb leg UK£/kg
LAMB PRICES (19KG CARCASS WEIGHT)
Source: AgriHQ
LAMB & WOOL

ANZ Research Agri Focus | June 2019 4
lamb wool, although offerings are low at this time of the season. However, at the latest South Island auction, even the higher-quality wools typically favoured by the Chinese buyers were sold at a discount to where the market had previously been. Chinese manufacturers appear to be even less committed to purchases due to the uncertainty of end-market demand. The trade war between the US and China is making factories in China take a more cautious approach as they are less certain they will be able to move finished goods.
As usual the better-quality coarse wool is easier to find a buyer for than poorer-quality wool, but prices are nothing to get excited about. Coarse wool prices in the North Island are nearly 20% weaker than they were a year ago.
At some point demand for wool is likely to be revived as the consumer trend towards natural products continues. However, in the short term the market is expected to remain weak or even fall further due to global economic concerns.
0
1
2
3
4
5
6
7
8
Jul-06 Jul-08 Jul-10 Jul-12 Jul-14 Jul-16 Jul-18
USD
per
kilo
gram
STRONG WOOL (>35 MICRON)
Source: ANZ, NZWSI, PGG Wrightson
LAMB & WOOL
ANZ Research Agri Focus | June 2019 5
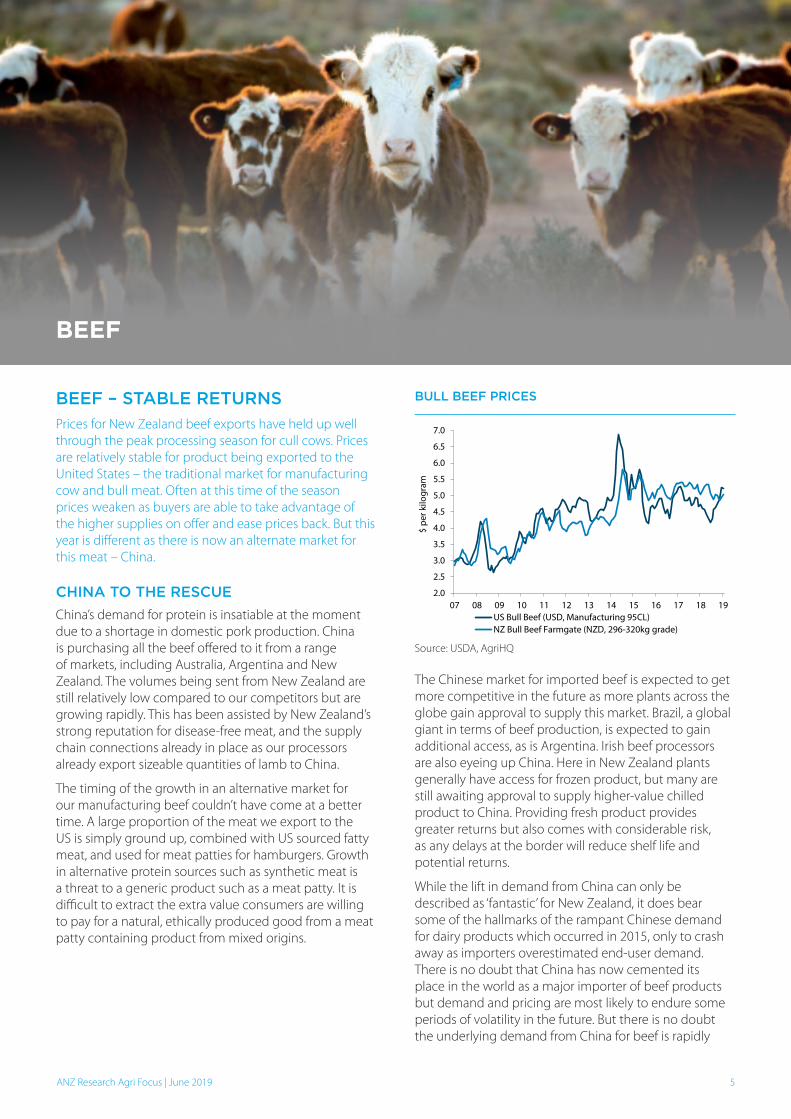
BEEF
BEEF – STABLE RETURNSPrices for New Zealand beef exports have held up well through the peak processing season for cull cows. Prices are relatively stable for product being exported to the United States – the traditional market for manufacturing cow and bull meat. Often at this time of the season prices weaken as buyers are able to take advantage of the higher supplies on offer and ease prices back. But this year is different as there is now an alternate market for this meat – China.
CHINA TO THE RESCUEChina’s demand for protein is insatiable at the moment due to a shortage in domestic pork production. China is purchasing all the beef offered to it from a range of markets, including Australia, Argentina and New Zealand. The volumes being sent from New Zealand are still relatively low compared to our competitors but are growing rapidly. This has been assisted by New Zealand’s strong reputation for disease-free meat, and the supply chain connections already in place as our processors already export sizeable quantities of lamb to China.
The timing of the growth in an alternative market for our manufacturing beef couldn’t have come at a better time. A large proportion of the meat we export to the US is simply ground up, combined with US sourced fatty meat, and used for meat patties for hamburgers. Growth in alternative protein sources such as synthetic meat is a threat to a generic product such as a meat patty. It is difficult to extract the extra value consumers are willing to pay for a natural, ethically produced good from a meat patty containing product from mixed origins.
The Chinese market for imported beef is expected to get more competitive in the future as more plants across the globe gain approval to supply this market. Brazil, a global giant in terms of beef production, is expected to gain additional access, as is Argentina. Irish beef processors are also eyeing up China. Here in New Zealand plants generally have access for frozen product, but many are still awaiting approval to supply higher-value chilled product to China. Providing fresh product provides greater returns but also comes with considerable risk, as any delays at the border will reduce shelf life and potential returns.
While the lift in demand from China can only be described as ‘fantastic’ for New Zealand, it does bear some of the hallmarks of the rampant Chinese demand for dairy products which occurred in 2015, only to crash away as importers overestimated end-user demand. There is no doubt that China has now cemented its place in the world as a major importer of beef products but demand and pricing are most likely to endure some periods of volatility in the future. But there is no doubt the underlying demand from China for beef is rapidly
2.0
2.5
3.0
3.5
4.0
4.5
5.0
5.5
6.0
6.5
7.0
07 08 09 10 11 12 13 14 15 16 17 18 19
$ pe
r kilo
gram
US Bull Beef (USD, Manufacturing 95CL)NZ Bull Beef Farmgate (NZD, 296-320kg grade)
BULL BEEF PRICES
Source: USDA, AgriHQ

ANZ Research Agri Focus | June 2019 6
BEEF
growing. Restaurant chains specialising in beef products are popping up throughout the major cities catering for the growing consumer demand for beef. While steaks may not be on the menu, cuts with plenty of bone such as neck chops and shins are highly desired.
US MARKET HOLDING UPReturns for bull and cow meat exported to the US market are slightly up on year-ago levels and also tracking above the five-year average when measured in USD terms. In local currency terms prices are stronger than year-ago levels. Therefore the international beef markets are best described as solid but not exceptional.
The steady returns have helped farmgate prices to remain relatively stable through the peak processing season. Processors did take the opportunity to ease schedule prices when they had a backlog of stock to process, but that backlog has now largely been cleared, with wait times for processing stock back about a week. Reasonably good autumn pasture growth in many regions means dairy farmers tended to milk cows a little longer which then resulted in a bottleneck of cows to be processed in late April and early May.
STORE MARKET PRICES EASINGThe buoyancy in overseas markets is not being reflected to such a great degree in the store markets. Store cattle prices have generally been high relative to the end-market prices for the past couple of years. But now industry confidence has eroded somewhat. No doubt the ongoing concerns with Mycoplasma Bovis are partially to blame. It is not just the disease itself that is causing farmers concerns but also the way the process is being handled, which has left many farmers very uncertain about their future. Lengthy delays between the time that farmers receive notification of surveillance to the time they receive either a positive or negative result, the time taken to handle claims, and the inconsistency of how the process is being applied, is causing huge levels of anxiety for those involved.
At present market returns in NZD terms are at least 10% higher than they were a year ago, while schedule prices are on par or down slightly on year-ago levels. Store prices are relatively lower with stock generally about 10% cheaper than a year ago, although there is large variation between regions and stock classes (as is typical). Demand for weaners was not quite as strong as seen in recent years and this was reflected in the prices achieved at the autumn fairs. It is now easier to secure virtually all classes of cattle than it was a year ago.

ANZ Research Agri Focus | June 2019 7
LATER PRODUCTION LIFTS FARMGATE RETURNSReturns this year have come off the highs attained the previous year due to some high-value supply contracts ending. Like for lamb, farmgate returns this season have been affected by the timing of slaughter. As schedule prices were expected to be maintained at high levels beyond the Christmas supply period, there was more incentive to grow stock to higher weights prior to slaughter. Heavier weights and additional income from the velvet that is able to be harvested from the spikers boosted incomes, but offsetting this, the proportion of product sold as chilled was lower than the previous season, which has had some negative impact on schedules and returns.
Farmgate prices for velvet this season have averaged about $125-$135/kg. This provides a sizable return from a fully grown stag, which will produce about 5-10kgs of velvet, with production from exceptional stock even higher. Velvet also provides additional income from spikers, which may be carrying about 500gms of velvet at slaughter age.
DEER
DEER RETURNS ROBUSTThe outlook for both venison and velvet markets remains strong despite the recent fall in venison schedule prices. The deer industry is back in rebuilding phase after a decade of decline. Confidence in the industry has been boosted by strong farmgate returns derived from strong industry marketing activity and aligning on-farm practices with consumer values. While standards will always need to continuously evolve, the industry is currently at a level where it is able to consistently deliver sustainable returns back to the farmgate level.
MARKET DIVERSIFICATION A CHALLENGEThe industry remains very reliant on its traditional European markets such as Germany, which still account for more than half of the venison exported from New Zealand. The industry is working hard to diversify into alternative markets. It has been successful in increasing its market presence in the North American markets but last year sold less product into the UK. Considerable effort is going into opening up new markets such as China, but at present less than 5% of the venison exported is destined for Asia.
The high reliance on developed markets – particularly Europe – is a concern, given the weakness evident in some of the major European economies. Germany, for instance, is teetering close to recession due to weakness in the manufacturing sector. With the labour market still very tight the weakness is yet to feed through to households in any meaningful way, but during these uncertain economic times you have to question whether consumers will continue to dine with the same frequency at the high-quality restaurants that tend to feature venison on the menu. But venison does have the advantage of accounting for only a very small proportion of the total market, and it does have the features many discerning customers are now looking for, such as being a healthy, naturally produced food.
3
4
5
6
7
8
9
10
11
12
07 08 09 10 11 12 13 14 15 16 17 18 19
NZD
per
kilo
gram
60kg stag grade
FARMGATE RETURNS 60 KG STAG
Source: AgriHQ

ANZ Research Agri Focus | June 2019 8
DEER
VELVET PRODUCTION INCREASINGVelvet production has steadily increased, with the industry now producing about 725 tonnes per annum. By working closely with end users, the additional volume now being produced is readily being absorbed by the market and returns are also improving. The industry has been successful at growing its direct connections with Korea’s health food segment, whereas traditionally the industry relied on supplying the traditional medicine market in Korea often via Chinese intermediaries. By working more closely with the health food segment, consumers’ needs have been able to be clearly communicated to farmers, and the high standards attained by farmers are able to be used to derive more value from the end product.
Venison schedule prices for next season are expected to trend back towards the normal seasonal pattern rather than the flatter price structure seen this season. Premiums are expected to be paid early in the season for stock slaughtered in time to supply chilled to Europe for consumption through the Christmas festive season.
Farmer confidence in the deer industry was reflected in the strength of the prices attained at the weaner sales held in the autumn. Prices at the later sales tended to be stronger than the earlier sales, with quality weaners selling in excess of $7/kg LW.

ANZ Research Agri Focus | June 2019 9
GRAINGrain and feed prices have eased slightly but pricing is difficult to determine at present given the lack of sales occurring. Contracts for next season are being written at prices above $400/t, which is a sustainable level for growers.
TRADING OF GRAIN SUBDUEDTrading of feed grains is a little subdued at present which is not unusual for this time of the season. Neither buyers nor sellers are in a particular hurry to commit to transactions.
The quantity of grain harvested last season in the Canterbury region wasn’t excessive, particularly for wheat. Detrimental weather during November and December at the critical flowering period resulted in reduced yields. Crop quality was also variable.
The quantity of barley harvested was up, due to extra area planted. However, like wheat, yields were a mixed bag. Demand for barley is typically driven by the dairy
industry, and this season, demand from dairy farmers for barley is subdued. This is partially a short-term response to favourable grass-growing conditions, as the majority of farms are not under pressure to secure extra feed.
The maize harvest is all but complete. Conditions have generally been favourable with good yields and low moisture content. The recent spell of winter weather has impacted some late harvesting, but overall the harvest has been very good.
Those in the market for additional feed can afford to be selective. Pasture production conditions have been generally favourable, up until the recent abrupt drop in temperatures. This means feed on hand is generally quite good. Strong pasture production earlier in the year also resulted in more pasture being preserved as hay and silage, meaning farmers are generally quite well off at present in terms of feed. In some areas, fodder crops destined for wintering on haven’t done as well as expected. This is prompting some demand, but generally spot demand for grain is minimal at present.
There is also a more long-term trend towards self-sufficiency for dairy farmers. This trend is in response to three factors.
1. Market signals from consumers, which are now being passed through by processors. Dairy companies are increasingly paying incentives or applying disincentives in order to align on-farm practices with consumer values. There are premiums for pasture-based production, which on the face of it is bad for grain demand. However, these programmes tend to specifically target the use of palm kernel (PKE), meaning we may see some of the previous demand for PKE re-emerge as demand for feed grains.
2. Cost control is another major concern for many dairy farmers, meaning spending on supplementary feed is now happening only where there is a sustained pasture deficit, and by those farmers who are able to
GRAIN & FORESTRYGRAIN
150
200
250
300
350
400
450
500
11 12 13 14 15 16 17 18
NZD
per
tonn
e
Milling wheat Feed wheat Feed barley PKE
NZ GRAIN PRICES
Source: AgriHQ

ANZ Research Agri Focus | June 2019 10
GRAINS
clearly see the value of additional supplement. During the high milk price years supplementary feeding ballooned as farmers sought to simply maximise production, and there was not a understanding amongst some farmers regarding the net value the additional feed was providing to their system.
3. Biosecurity risks associated with M.Bovis with moving stock has reduced the attractiveness of wintering stock off-farm.
The new drive amongst dairy farmers for self-sufficiency may result in lower stocking rates and therefore reduced demand for grain in general, even though grains are not targeted in the new incentive programs.
Demand for PKE is still relatively strong despite the trend away from imported feeds. The relatively cheap price, the ease of supply, and the ease of feeding make it a valued tool for many farmers.
PKE negotiations for next season supply typically take place at this time of the season, with the National Fieldays being renowned as an opportunity for farmers to hunt out a deal. Ahead of the Fieldays PKE pricing was sitting around the $260-$280/t level, about 5 to 10% weaker than year-ago levels. Fieldays competition is likely to see farmers securing PKE below $250/t. This sort of price will be attractive, particularly if next season’s milk price ends up above $7/kg MS (as we are forecasting), although prudent farmers may be more comfortable budgeting nearer to the lower end of Fonterra’s $6.25-$7.25/kg MS price guidance.

ANZ Research Agri Focus | June 2019 11
FORESTRYThe forestry market remains buoyant. Elevated felling rates have increased the available supply of logs, which our export markets are readily absorbing. Export demand continues to be driven by China, who leads the way in terms of both volume and price. China is buying at least 70% of our export logs, meaning other markets must match, or better, their prices in order to secure any logs.
The Chinese market hit a few judder bars recently, which put a little pressure on prices and had some exporters questioning future demand. This was mainly due to a weakening in China’s purchasing power due to a devaluing yuan. But the underlying demand appears to be robust, which has quelled fears of a significant price drop. The yuan is not expected to depreciate a whole lot further (against the USD) and its lower value is also being offset by the lower NZD.
TRADE WAR THE KEY THREAT TO CHINA DEMANDEscalation of the trade war between US and China remains a key threat to the value of China’s currency and its economy in general. Despite the economic implications of a prolonged trade war China’s leaders appear prepared to dig in and sit it out, rather than ‘lose face’ by being bullied into accepting an unfavourable trade deal, or one where it appears they have yielded to unreasonable demands on the part of the US.
China’s demand for logs is driven primarily by ongoing growth in construction of buildings and infrastructure projects. The timber supplied by New Zealand is mainly used for boxing for pouring concrete, although some of the higher-quality logs are used for furniture. Even if investment by China’s private sector falters, spending by government-backed companies should ensure demand for logs continues.
The lift in felling of New Zealand forests that we have experienced over the past year is expected to continue for many years to come. There is a vast quantity of timber that was planted in the 1990s, predominantly in small wood lots on farms, that has now reached maturity and is ready to fell. For farm foresters it is a real bonus that the felling of their trees coincides with a strong international market. That is not something that can be planned. In fact, when most of those trees were planted there were hardly any shipments of logs to China. At that stage the main markets were Japan, India and South Korea. These Asian markets are still buying reasonable quantities of timber from New Zealand but all of the recent growth has come from China.
The make-up of the timber being exported has also changed. A decade ago export volumes were reasonably equally split between logs, sawn timber, pulp, paper, and panels. But today, exports of logs in their raw format account for over 70% of total timber exports. This move down the value chain was perhaps inevitable to some extent given the sheer volume of maturing wood and strong demand from China for this grade of wood.
50
75
100
125
150
175
09 10 11 12 13 14 15 16 17 18 19
US$
/JA
Sm3
LOG PRICE (UNPRUNED A GRADE)
Source: AgriHQ
GRAIN & FORESTRYFORESTRY

ANZ Research Agri Focus | June 2019 12
FORESTRY
Local mills have to match export prices in order to obtain supply. This has kept margins relatively low and we continue to see a reduction in the number of mills operating. Only a portion of the timber being felled is sufficiently high quality to be used for structural timber. A lot of trees planted in recent years haven’t been thinned or pruned, which has reduced the supply of high-grade logs.
STRONG DOMESTIC DEMANDMills are seeing strong domestic demand for timber at the moment from the construction industry. House consent data generally remains strong but varies from region to region. Despite a softening in Auckland house prices, new builds are still going strong. This trend is also being seen in most regional areas where the housing market is still in catch-up mode and prices are trending up. Christchurch is an exception where house builds are now easing back following a period of intense building to replace earthquake-damaged houses.
The outlook for the residential building sector is clouded. Activity is currently strong and many areas still have housing shortages, but weak sales in Auckland and falling residential construction intentions in the ANZ Business Outlook survey mean a sector operating at full capacity indefinitely is certainly not a slam dunk.
LOCATION CRITICAL TO FUTURE RETURNSForests that are in the vicinity of both a mill and a wharf that uploads logs have the greatest choice and therefore bargaining power when it comes to marketing their logs. Not all of the trees that were planted in the early 1990s are in the right location or easily accessible. Where trees have been planted at the back of farms, the cost of upgrading roading to harvest the logs can be prohibitive, particularly if logs are a long distance from the end market. 150km is about the maximum viable distance to cart logs to a mill or wharf. Even where freight distances are lower it may not be viable if the site is difficult to access, is particularly steep, and/or the logs are of low value.
Depending on when the forest was planted it may make more sense to retain the forest and harvest the carbon credits. Only forests that were planted in 1990 or later are eligible to enter to receive carbon credits through the Emissions Trading Scheme (ETS). All pre-1990 forests are automatically entered into the ETS. Once a forest is in the ETS then it must remain in forestry, unless the carbon credits associated with the forest are repaid. Trees can be harvested, so long as the land is then replanted.
The extra revenue available from carbon credits, combined with government subsidies for planting, is expected to encourage extra land to be planted in trees. Whether or not carbon credits are harvested forestry can provide a higher return from the land than many sheep and beef farms are currently attaining. But anyone looking to convert land to forestry should thoroughly investigate the costs and potential returns that apply to their particular block, and understand the implications of selling carbon credits. In many instances the carbon revenue can provide much needed cash-flow, which can also help with succession planning. But it does have implications for the next generation should they wish to change the land use of the property.

ANZ Research Agri Focus | June 2019 13
HARVEST TIMEA strong start to the kiwifruit season has resulted in record export returns for this sector. This is primarily due to a lift in the volume of fruit being processed, and the switch towards growing more gold varieties. The gold varieties are earlier maturing, yield well, and have a higher price point than green varieties. This is due primarily to consumer tastes in the main Asian markets, which are prepared to pay more for the sweeter varieties of the fruit. China currently accounts for about 25% of kiwifruit returns.
Zespri controls the supply of Sungold (G3) kiwifruit, with growers required to purchase licenses to secure growing rights. Zespri wants to limit growth in supply to a rate that doesn’t exceed demand growth in its international markets. For now, Zespri plans to continue to release 700 canopy hectares of additional G3 licenses for gold fruit each year. This is equivalent to approximately 10 million trays.
Last season Zespri exported 167.2 million trays of kiwifruit in total, across all varieties. It also purchased a further 13
million trays of green kiwifruit from international growers located in Italy, Spain, Japan, and South Korea. This enables Zespri to retain supermarket shelf space in key markets by supplying kiwifruit year round.
Growers tendered for 1600ha of G3 licenses this year, meaning many grower were not successful in obtaining the right to grow the quantity of fruit they would like to. The price range of the tenders submitted was very tight with successful bidders paying above $276,000 per canopy hectare (exclusive of GST). So long as returns from the gold fruit continue to significantly outperform the green varieties then demand for licenses will remain strong.
The excess demand for G3 licenses relative to supply is causing some headaches for growers. Some growers already have root stock in the ground ready to graft G3 onto, while others have paid deposits for G3 plants that they won’t be able to put in the ground. Some growers may wait until next season to try to obtain their G3 licenses, effectively missing out on a year’s production, while others may opt to grow green fruit or some of the newer, unproven varieties.
The rapid growth in converting land for kiwifruit does mean the cost of conversion has risen. These additional set-up costs, combined with the high license fee, do elevate the risks of achieving a favourable return. Zespri are warning growers that the returns gold fruit are currently making may not be sustainable in the long term. Orchard gate returns for gold fruit are in the vicinity of $10/tray. However Zespri warns that $7-$9/tray is a more sustainable long-term price range to budget on.
Last season orchard gate returns on a canopy hectare basis for Sungold lifted 28% to $145,991, while returns for standard green fruit lifted slightly to $63,622. A premium was paid for organic green fruit, while organic gold received the same returns as gold grown under conventional practices.
HORTICULTURE
0
500
1,000
1,500
2,000
2,500
11 12 13 14 15 16 17 18 19
NZD
mn
Gold Green
NZ KIWIFRUIT EXPORTS
Source: Statistics NZ, ANZ Research

ANZ Research Agri Focus | June 2019 14
finishing farms. However, this was offset by a 22% increase in grazing farms trading, as well as 6% more arable farms. Sales were particularly slow in the dairy-dominant regions of Waikato and Canterbury.
DAIRY MARKET EXTREMELY SLOWThe volume of dairy farms sold during the three months to April 2019 was only half the number sold during the same period last year. The median farm sale price contracted by 18% when measured on a per hectare price. But with only a small number of sales occurring, this change in value is not necessarily indicative of the wider market. Prices for dairy land are falling, but not typically by this much.
RURAL PROPERTY MARKET
0
500
1,000
1,500
2,000
2,500
3,000
3,500
96 98 00 02 04 06 08 10 12 14 16 18
DAIRY PRICE INDEX
Source: REINZ
DAIRY DRAGS DOWN RURAL PROPERTY MARKETActivity in the rural property market remains subdued, particularly in the dairy sector. Both prices and the number of sales occurring are lower than usual. Horticulture and forestry land markets are more buoyant, as these sectors are supported by government policy and are favoured by investors.
SALES VOLUMES DOWNIn the three months to April 2019 just 362 of rural properties changed hands. This was 14% less than during the same time period in 2018. In the year leading to April 31% fewer dairy farms changed hands and 9% fewer
FARM SALES BY FARM TYPE
3-Month Seasonally Adjusted Current Period Previous Period Last Year 10 - Year Av. Chg. P/P Chg. Y/Y Chg. P/10yr
DairyNumber of Sales 29 34 61 51 Ü Ü Ü
Median Price ($ per ha) 25,493 28,678 31,381 29,706 Ü Ü Ü
Livestock - Finishing
Number of Sales 85 94 130 74 Ü Ü Û
Median Price ($ per ha) 31,908 30,908 30,300 21,091 Û Û Û
Livestock - Grazing
Number of Sales 112 111 110 153 Û Û Ü
Median Price ($ per ha) 10,553 10,799 10,471 14,042 Ü Û Ü
HorticultureNumber of Sales 48 48 47 44 Û Û Û
Median Price ($ per ha) 250,283 207,041 207,424 166,417 Û Û Û
ArableNumber of Sales 23 21 22 22 Û Û Û
Median Price ($ per ha) 22,616 24,633 24,807 27,306 Ü Ü Ü
ForestryNumber of Sales 8 12 15 12 Ü Ü Ü
Median Price ($ per ha) 10,566 17,820 3,281 2,877 Ü Û Û
All FarmsNumber of Sales 312 334 382 367 Ü Ü Ü
Median Price ($ per ha) 21,289 23,792 25,433 23,252 Ü Ü Ü
0
5,000
10,000
15,000
20,000
25,000
30,000
35,000
96 98 00 02 04 06 08 10 12 14 16 18
NZD
MEDIAN PRICE PER HECTARE
Source: REINZ

ANZ Research Agri Focus | June 2019 15
Farm sales in regions for which there is uncertainty surrounding nutrient emissions rules or regions where rules are particularly harsh are certainly selling at a discount, if they are actually managing to sell at all.
On a per kg milksolid basis the median price of dairy farms sold in the three months to April was just $31.78/kg MS. This was down considerably on the previous month’s rolling data, which was at $37.38/kg MS. Often the better-quality farms change hands earlier in the dairy season, so this may have influenced the sudden drop in the value relative to output measure.
GRAZING DEMAND BOLSTERED BY FORESTRYDemand for grazing properties has been bolstered by strong returns in the past couple of seasons in the sheep, beef and deer farming sectors. This has lifted industry confidence and allowed for more investment in this land type.
Also improving demand for grazing properties is the demand for land to plant trees on. This is being supported by government policy, which provides subsidies for planting costs. That said, the planting subsidies are not the motivating factor for the larger-scale investors, who are purchasing farms that they intend to plant in their entirety in trees. For these investors it is the potential returns from carbon, and/or the returns from harvesting pinus radiata trees, which is motivating the change in land use. This land use change remains very controversial due to the impact it will potentially have on some communities.
HORTICULTURE LAND IN DEMANDThe Bay of Plenty was one of the few regions to record a lift in the number of farms sold during the three months to April. In this region strong demand for properties suitable for planting in kiwifruit has strengthened the rural property market.
In the three months to April 2019 48 horticulture properties changed hands, which was similar to the volume transacted during the same period in 2018. The value of horticulture properties in general has trended up over the past year.
RURAL PROPERTY MARKET
ANZ Research Agri Focus | June 2019 16
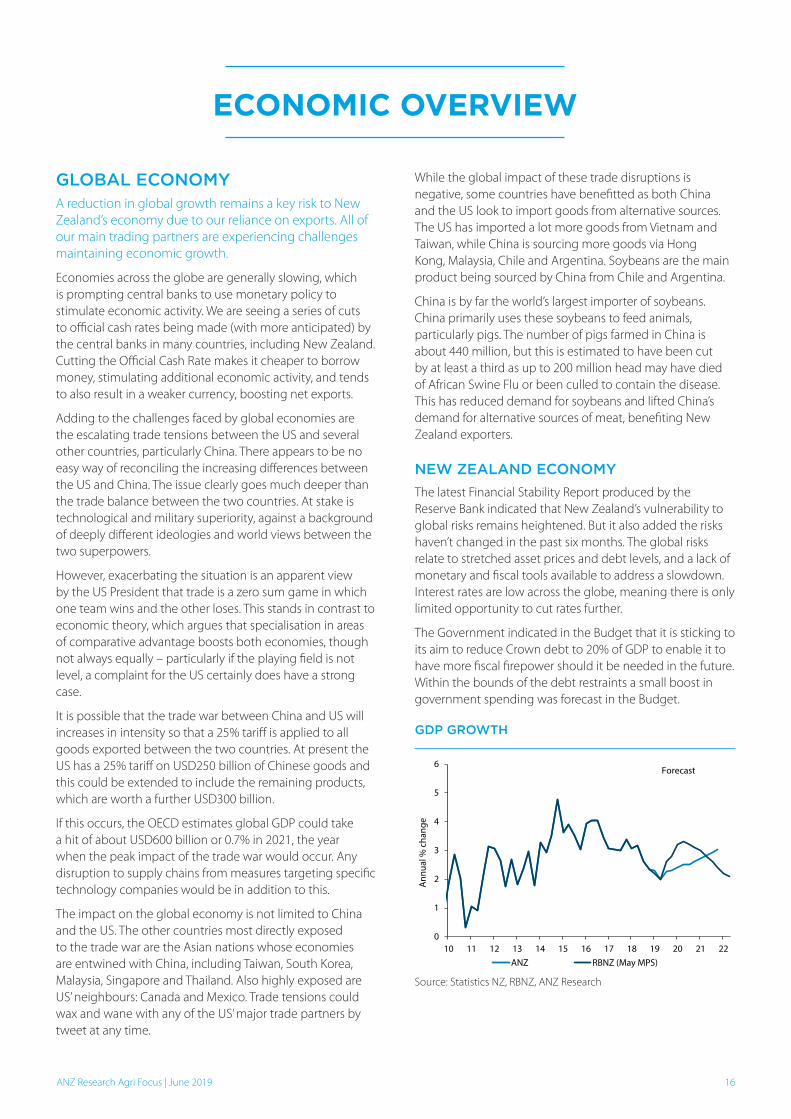
GLOBAL ECONOMYA reduction in global growth remains a key risk to New Zealand’s economy due to our reliance on exports. All of our main trading partners are experiencing challenges maintaining economic growth.
Economies across the globe are generally slowing, which is prompting central banks to use monetary policy to stimulate economic activity. We are seeing a series of cuts to official cash rates being made (with more anticipated) by the central banks in many countries, including New Zealand. Cutting the Official Cash Rate makes it cheaper to borrow money, stimulating additional economic activity, and tends to also result in a weaker currency, boosting net exports.
Adding to the challenges faced by global economies are the escalating trade tensions between the US and several other countries, particularly China. There appears to be no easy way of reconciling the increasing differences between the US and China. The issue clearly goes much deeper than the trade balance between the two countries. At stake is technological and military superiority, against a background of deeply different ideologies and world views between the two superpowers.
However, exacerbating the situation is an apparent view by the US President that trade is a zero sum game in which one team wins and the other loses. This stands in contrast to economic theory, which argues that specialisation in areas of comparative advantage boosts both economies, though not always equally – particularly if the playing field is not level, a complaint for the US certainly does have a strong case.
It is possible that the trade war between China and US will increases in intensity so that a 25% tariff is applied to all goods exported between the two countries. At present the US has a 25% tariff on USD250 billion of Chinese goods and this could be extended to include the remaining products, which are worth a further USD300 billion.
If this occurs, the OECD estimates global GDP could take a hit of about USD600 billion or 0.7% in 2021, the year when the peak impact of the trade war would occur. Any disruption to supply chains from measures targeting specific technology companies would be in addition to this.
The impact on the global economy is not limited to China and the US. The other countries most directly exposed to the trade war are the Asian nations whose economies are entwined with China, including Taiwan, South Korea, Malaysia, Singapore and Thailand. Also highly exposed are US’ neighbours: Canada and Mexico. Trade tensions could wax and wane with any of the US’ major trade partners by tweet at any time.
ECONOMIC OVERVIEW
While the global impact of these trade disruptions is negative, some countries have benefitted as both China and the US look to import goods from alternative sources. The US has imported a lot more goods from Vietnam and Taiwan, while China is sourcing more goods via Hong Kong, Malaysia, Chile and Argentina. Soybeans are the main product being sourced by China from Chile and Argentina.
China is by far the world’s largest importer of soybeans. China primarily uses these soybeans to feed animals, particularly pigs. The number of pigs farmed in China is about 440 million, but this is estimated to have been cut by at least a third as up to 200 million head may have died of African Swine Flu or been culled to contain the disease. This has reduced demand for soybeans and lifted China’s demand for alternative sources of meat, benefiting New Zealand exporters.
NEW ZEALAND ECONOMYThe latest Financial Stability Report produced by the Reserve Bank indicated that New Zealand’s vulnerability to global risks remains heightened. But it also added the risks haven’t changed in the past six months. The global risks relate to stretched asset prices and debt levels, and a lack of monetary and fiscal tools available to address a slowdown. Interest rates are low across the globe, meaning there is only limited opportunity to cut rates further.
The Government indicated in the Budget that it is sticking to its aim to reduce Crown debt to 20% of GDP to enable it to have more fiscal firepower should it be needed in the future. Within the bounds of the debt restraints a small boost in government spending was forecast in the Budget.
0
1
2
3
4
5
6
10 11 12 13 14 15 16 17 18 19 20 21 22
Ann
ual %
cha
nge
ANZ RBNZ (May MPS)
Forecast
GDP GROWTH
Source: Statistics NZ, RBNZ, ANZ Research

ANZ Research Agri Focus | June 2019 17
The RBNZ’s view of how New Zealand’s economy will recover from the current slowdown is more optimistic than our own. They are expecting a sharp acceleration in economic activity from the middle of this year, with annual growth peaking in 2020 at 3.1%. We think the economy won’t reach growth rates above 3% until late 2021. Business activity remains subdued and adding in the softer housing market we see headwinds muting the economy’s responsiveness to easier monetary conditions to some extent.
The RBNZ cut the Official Cash Rate (OCR) last month to a record low of 1.5%. The RBNZ is back in watch, worry, and wait mode for now but we expect more will be needed. We are forecasting two further OCR cuts, one in November this year and one in February 2020, which would reduce the OCR to 1%.
INTEREST RATES The recent cut in the OCR and reductions in longer-term wholesale rates have flowed through to a large extent to mortgage rates, but are not flowing through into all borrowing rates equally. This is particularly the case in the agriculture and commercial sectors, where other constraints are dominating the outlook for retail interest rates.
In particular, requirements for banks to hold higher amounts of capital mean higher costs for banks, which is tending to offset the impact of lower wholesale interest rates. Therefore despite further cuts in OCR rates being forecast the cost of borrowing is unlikely to drop for agriculture-related loans.
ECONOMIC OVERVIEW
Dairy
Sheep & beef
Horticulture
Other
0
5
10
15
20
25
0 10 20 30 40 50 60 70 80
Ann
ual g
row
th ra
te (%
)
Proportion of outstanding agriculture lending (%)
STOCK AND GROWTH OF AGRICULTURAL DEBT, BY SECTOR
Source: RBNZ BBS
As can be seen in the chart above from the Financial Stability Report , the dairy sector holds approximately two thirds of the agriculture debt, but debt levels in this sector are now virtually stable. Assuming milk prices remain high in the current season some inroads into debt levels should be able to be made as principal repayments increase.
The horticulture sector, particularly kiwifruit, has increased its debt the most in the past year as production has expanded.
EXCHANGE RATES The NZD traded down through April and May, dropping briefly below USD0.65 on 23 May. The OCR cut delivered by the Reserve Bank in early May helped to pull the currency back, although this had been largely priced in prior to the announcement being made.
The NZD has since appreciated back above USD0.66 in early June. The US Federal Reserve is also expected to cut interest rates later this year, mitigating much of the impact the reduction in the OCR rate had on the NZD/USD rate last month.
Over the longer term the NZD is still expected to weaken. Our forecast is for the NZD to fall to USD0.64 by the end of 2019, then easing further to USD0.63 by the end of Q1 2020.
0.50
0.55
0.60
0.65
0.70
0.75
0.80
0.85
0.90
08 09 10 11 12 13 14 15 16 17 18 19 20
NZD
/USD
Forecast
NZD BUYS USD
Source: ANZ, Bloomberg
ANZ Research Agri Focus | June 2019 18
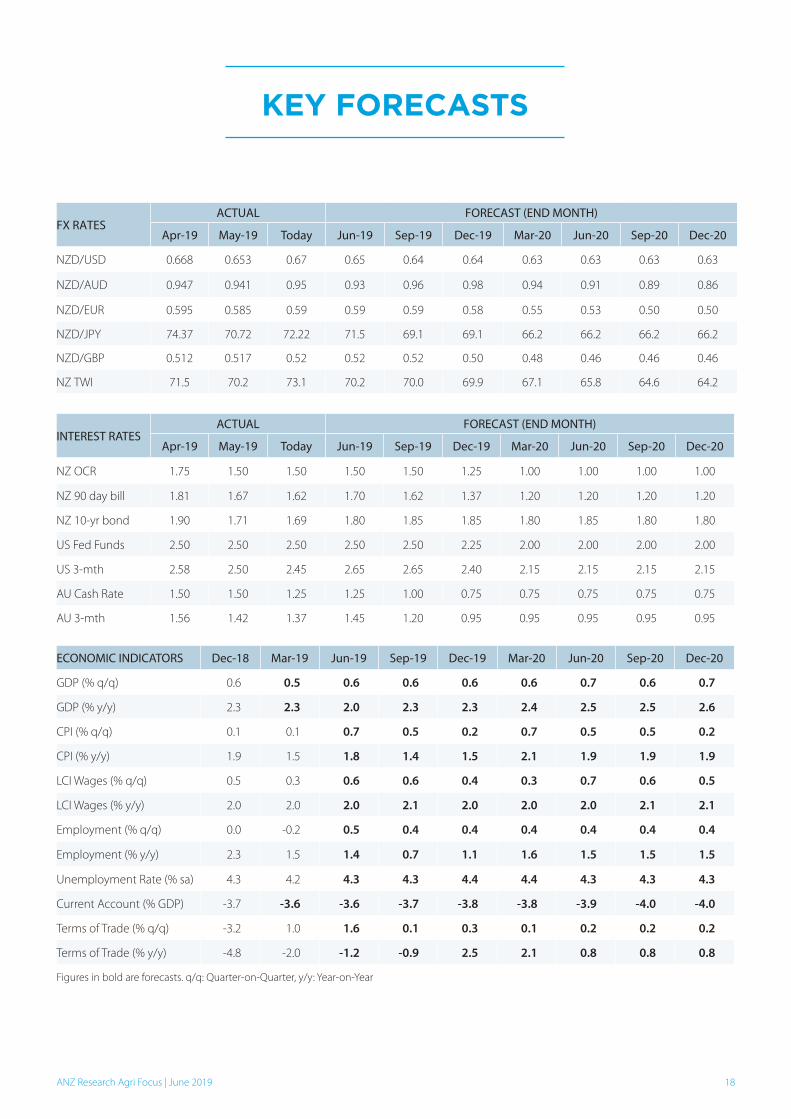
FX RATESACTUAL FORECAST (END MONTH)
Apr-19 May-19 Today Jun-19 Sep-19 Dec-19 Mar-20 Jun-20 Sep-20 Dec-20
NZD/USD 0.668 0.653 0.67 0.65 0.64 0.64 0.63 0.63 0.63 0.63
NZD/AUD 0.947 0.941 0.95 0.93 0.96 0.98 0.94 0.91 0.89 0.86
NZD/EUR 0.595 0.585 0.59 0.59 0.59 0.58 0.55 0.53 0.50 0.50
NZD/JPY 74.37 70.72 72.22 71.5 69.1 69.1 66.2 66.2 66.2 66.2
NZD/GBP 0.512 0.517 0.52 0.52 0.52 0.50 0.48 0.46 0.46 0.46
NZ TWI 71.5 70.2 73.1 70.2 70.0 69.9 67.1 65.8 64.6 64.2
INTEREST RATESACTUAL FORECAST (END MONTH)
Apr-19 May-19 Today Jun-19 Sep-19 Dec-19 Mar-20 Jun-20 Sep-20 Dec-20
NZ OCR 1.75 1.50 1.50 1.50 1.50 1.25 1.00 1.00 1.00 1.00
NZ 90 day bill 1.81 1.67 1.62 1.70 1.62 1.37 1.20 1.20 1.20 1.20
NZ 10-yr bond 1.90 1.71 1.69 1.80 1.85 1.85 1.80 1.85 1.80 1.80
US Fed Funds 2.50 2.50 2.50 2.50 2.50 2.25 2.00 2.00 2.00 2.00
US 3-mth 2.58 2.50 2.45 2.65 2.65 2.40 2.15 2.15 2.15 2.15
AU Cash Rate 1.50 1.50 1.25 1.25 1.00 0.75 0.75 0.75 0.75 0.75
AU 3-mth 1.56 1.42 1.37 1.45 1.20 0.95 0.95 0.95 0.95 0.95
ECONOMIC INDICATORS Dec-18 Mar-19 Jun-19 Sep-19 Dec-19 Mar-20 Jun-20 Sep-20 Dec-20
GDP (% q/q) 0.6 0.5 0.6 0.6 0.6 0.6 0.7 0.6 0.7
GDP (% y/y) 2.3 2.3 2.0 2.3 2.3 2.4 2.5 2.5 2.6
CPI (% q/q) 0.1 0.1 0.7 0.5 0.2 0.7 0.5 0.5 0.2
CPI (% y/y) 1.9 1.5 1.8 1.4 1.5 2.1 1.9 1.9 1.9
LCI Wages (% q/q) 0.5 0.3 0.6 0.6 0.4 0.3 0.7 0.6 0.5
LCI Wages (% y/y) 2.0 2.0 2.0 2.1 2.0 2.0 2.0 2.1 2.1
Employment (% q/q) 0.0 -0.2 0.5 0.4 0.4 0.4 0.4 0.4 0.4
Employment (% y/y) 2.3 1.5 1.4 0.7 1.1 1.6 1.5 1.5 1.5
Unemployment Rate (% sa) 4.3 4.2 4.3 4.3 4.4 4.4 4.3 4.3 4.3
Current Account (% GDP) -3.7 -3.6 -3.6 -3.7 -3.8 -3.8 -3.9 -4.0 -4.0
Terms of Trade (% q/q) -3.2 1.0 1.6 0.1 0.3 0.1 0.2 0.2 0.2
Terms of Trade (% y/y) -4.8 -2.0 -1.2 -0.9 2.5 2.1 0.8 0.8 0.8
Figures in bold are forecasts. q/q: Quarter-on-Quarter, y/y: Year-on-Year
KEY FORECASTS
ANZ Research Agri Focus | June 2019 19
This document is intended for ANZ’s institutional, professional or wholesale clients, and not for individuals or retail persons. It should not be forwarded, copied or distributed. The information in this document is general in nature, and does not constitute personal financial product advice or take into account your objectives, financial situation or needs.
This document may be restricted by law in certain jurisdictions. Persons who receive this document must inform themselves about and observe all relevant restrictions.
Disclaimer for all jurisdictions: This document is prepared and distributed in your country/region by either: Australia and New Zealand Banking Group Limited (ABN11 005 357 522) (ANZ); or its relevant subsidiary or branch (each, an Affiliate), as appropriate or as set out below.
This document is distributed on the basis that it is only for the information of the specified recipient or permitted user of the relevant website (recipients).
This document is solely for informational purposes and nothing contained within is intended to be an invitation, solicitation or offer by ANZ to sell, or buy, receive or provide any product or service, or to participate in a particular trading strategy.
Distribution of this document to you is only as may be permissible by the laws of your jurisdiction, and is not directed to or intended for distribution or use by recipients resident or located in jurisdictions where its use or distribution would be contrary to those laws or regulations, or in jurisdictions where ANZ would be subject to additional licensing or registration requirements. Further, the products and services mentioned in this document may not be available in all countries.
ANZ in no way provides any financial, legal, taxation or investment advice to you in connection with any product or service discussed in this document. Before making any investment decision, recipients should seek independent financial, legal, tax and other relevant advice having regard to their particular circumstances.
Whilst care has been taken in the preparation of this document and the information contained within is believed to be accurate, ANZ does not represent or warrant the accuracy or completeness of the information Further, ANZ does not accept any responsibility to inform you of any matter that subsequently comes to its notice, which may affect the accuracy of the information in this document.
Preparation of this document and the opinions expressed in it may involve material elements of subjective judgement and analysis. Unless specifically stated otherwise: they are current on the date of this document and are subject to change without notice; and, all price information is indicative only. Any opinions expressed in this document are subject to change at any time without notice.
ANZ does not guarantee the performance of any product mentioned in this document. All investments entail a risk and may result in both profits and losses. Past performance is not necessarily an indicator of future performance. The products and services described in this document may not be suitable for all investors, and transacting in these products or services may be considered risky.
ANZ expressly disclaims any responsibility and shall not be liable for any loss, damage, claim, liability, proceedings, cost or expense (Liability) arising directly or indirectly and whether in tort (including negligence), contract, equity or otherwise out of or in connection with this document to the extent permissible under relevant law. Please note, the contents of this document have not been reviewed by any regulatory body or authority in any jurisdiction.
ANZ and its Affiliates may have an interest in the subject matter of this document. They may receive fees from customers for dealing in the products or services described in this document, and their staff and introducers of business may share in such fees or remuneration that may be influenced by total sales, at all times received and/or apportioned in accordance with local regulatory requirements. Further, they or their customers may have or have had interests or long or short positions in the products or services described in this document, and may at any time make purchases and/or sales in them as principal or agent, as well as act (or have acted) as a market maker in such products. This document is published in accordance with ANZ’s policies on conflicts of interest and ANZ maintains appropriate information barriers to control the flow of information between businesses within it and its Affiliates.
Your ANZ point of contact can assist with any questions about this document including for further information on these disclosures of interest.
Country/region specific information: Unless stated otherwise, this document is distributed by Australia and New Zealand Banking Group Limited (ANZ).
Australia. ANZ holds an Australian Financial Services licence no. 234527. For a copy of ANZ’s Financial Services Guide please click here or request from your ANZ point of contact. If trading strategies or recommendations are included in this document, they are solely for the information of ‘wholesale clients’ (as defined in section 761G of the Corporations Act 2001 Cth).
Brazil, Brunei, India, Japan, Kuwait, Malaysia, Switzerland, Taiwan. This document is distributed in each of these jurisdictions by ANZ on a cross-border basis.
Cambodia. This document is distributed in Cambodia by ANZ Royal Bank (Cambodia) Limited (ANZ Royal Bank). The recipient acknowledges that although ANZ Royal Bank is a subsidiary of ANZ, it is a separate entity to ANZ and the obligations of ANZ Royal Bank do not constitute deposits or other liabilities of ANZ and ANZ is not required to meet the obligations of ANZ Royal Bank.
European Economic Area (EEA): United Kingdom. ANZ is authorised in the United Kingdom by the Prudential Regulation Authority (PRA) and is subject to regulation by the Financial Conduct Authority (FCA) and limited regulation by the PRA. Details about the extent of our regulation by the PRA are available from us on request. This document is distributed in the United Kingdom by Australia and New Zealand Banking Group Limited ANZ solely for the information of persons who would come within the FCA definition of “eligible counterparty” or “professional client”. It is not intended for and must not be distributed to any person who would come within the FCA definition of “retail client”. Nothing here excludes or restricts any duty or liability to a customer which ANZ may have under the UK Financial Services and Markets Act 2000 or under the regulatory system as defined in the Rules of the Prudential Regulation Authority (PRA) and the FCA. ANZ is authorised in the United Kingdom by the PRA and is subject to regulation by the FCA and limited regulation by the PRA. Details about the extent of our regulation by the PRA are available from us on request.
Fiji. For Fiji regulatory purposes, this document and any views and recommendations are not to be deemed as investment advice. Fiji investors must seek licensed professional advice should they wish to make any investment in relation to this document.
Hong Kong. This publication is issued or distributed in Hong Kong by the Hong Kong branch of ANZ, which is registered at the Hong Kong Monetary Authority to conduct Type 1 (dealing in securities), Type 4 (advising on securities) and Type 6 (advising on corporate finance) regulated activities. The contents of this publication have not been reviewed by any regulatory authority in Hong Kong.
India. If this document is received in India, only you (the specified recipient) may print it provided that before doing so, you specify on it your name and place of printing.
IMPORTANT NOTICE

ANZ Research Agri Focus | June 2019 20
Myanmar. This publication is intended to be general and part of ANZ’s customer service and marketing activities when implementing its functions as a licensed bank. This publication is not Securities Investment Advice (as that term is defined in the Myanmar Securities Transaction Law 2013).
New Zealand. This document is intended to be of a general nature, does not take into account your financial situation or goals, and is not a personalised adviser service under the Financial Advisers Act 2008 (FAA).
Oman. ANZ neither has a registered business presence nor a representative office in Oman and does not undertake banking business or provide financial services in Oman. Consequently ANZ is not regulated by either the Central Bank of Oman or Oman’s Capital Market Authority. The information contained in this document is for discussion purposes only and neither constitutes an offer of securities in Oman as contemplated by the Commercial Companies Law of Oman (Royal Decree 4/74) or the Capital Market Law of Oman (Royal Decree 80/98), nor does it constitute an offer to sell, or the solicitation of any offer to buy non-Omani securities in Oman as contemplated by Article 139 of the Executive Regulations to the Capital Market Law (issued vide CMA Decision 1/2009). ANZ does not solicit business in Oman and the only circumstances in which ANZ sends information or material describing financial products or financial services to recipients in Oman, is where such information or material has been requested from ANZ and the recipient understands, acknowledges and agrees that this document has not been approved by the CBO, the CMA or any other regulatory body or authority in Oman. ANZ does not market, offer, sell or distribute any financial or investment products or services in Oman and no subscription to any securities, products or financial services may or will be consummated within Oman. Nothing contained in this document is intended to constitute Omani investment, legal, tax, accounting or other professional advice.
People’s Republic of China (PRC). This document may be distributed by either ANZ or Australia and New Zealand Bank (China) Company Limited (ANZ China). Recipients must comply with all applicable laws and regulations of PRC, including any prohibitions on speculative transactions and CNY/CNH arbitrage trading. If this document is distributed by ANZ or an Affiliate (other than ANZ China), the following statement and the text below is applicable: No action has been taken by ANZ or any affiliate which would permit a public offering of any products or services of such an entity or distribution or re-distribution of this document in the PRC. Accordingly, the products and services of such entities are not being offered or sold within the PRC by means of this document or any other document. This document may not be distributed, re-distributed or published in the PRC, except under circumstances that will result in compliance with any applicable laws and regulations. If and when the material accompanying this document relates to the products and/or services of ANZ China, the following statement and the text below is applicable: This document is distributed by ANZ China in the Mainland of the PRC.
Qatar. This document has not been, and will not be:
• lodgedorregisteredwith,orreviewedorapprovedby,theQatarCentralBank(QCB),theQatarFinancialCentre(QFC)Authority,QFCRegulatoryAuthorityoranyotherauthorityintheStateofQatar(Qatar);or
• authorisedorlicensedfordistributioninQatar,
andtheinformationcontainedinthisdocumentdoesnot,andisnotintendedto,constituteapublicofferorotherinvitationinrespectofsecuritiesinQatarortheQFC.Thefinancialproductsorservicesdescribedinthisdocumenthavenotbeen,andwillnotbe:
• registeredwiththeQCB,QFCAuthority,QFCRegulatoryAuthorityoranyothergovernmentalauthorityinQatar;or
• authorisedorlicensedforoffering,marketing,issueorsale,directlyorindirectly,inQatar.
Accordingly,thefinancialproductsorservicesdescribedinthisdocumentarenotbeing,andwillnotbe,offered,issuedorsoldinQatar,andthisdocumentisnotbeing,andwillnotbe,distributedinQatar.Theoffering,marketing,issueandsaleofthefinancialproductsorservicesdescribedinthisdocumentanddistributionofthisdocumentisbeingmadein,andissubjecttothelaws,regulationsandrulesof,jurisdictionsoutsideofQatarandtheQFC.Recipientsofthisdocument must abide by this restriction and not distribute this document in breach of this restriction. This document is being sent/issued to a limited number ofinstitutionaland/orsophisticatedinvestors(i)upontheirrequestandconfirmationthattheyunderstandthestatementsabove;and(ii)ontheconditionthat it will not be provided to any person other than the original recipient, and is not for general circulation and may not be reproduced or used for any other purpose.
Singapore. This document is distributed in Singapore by the Singapore branch of ANZ solely for the information of “accredited investors”, “expert investors” or (as the case may be) “institutional investors” (each term as defined in the Securities and Futures Act Cap. 289 of Singapore). ANZ is licensed in Singapore under the Banking Act Cap. 19 of Singapore and is exempted from holding a financial adviser’s licence under Section 23(1)(a) of the Financial Advisers Act Cap. 100 of Singapore.
United Arab Emirates (UAE). This document is distributed in the UAE or the Dubai International Financial Centre (DIFC) (as applicable) by ANZ. This document doesnot,andisnotintendedtoconstitute:(a)anofferofsecuritiesanywhereintheUAE;(b)thecarryingonorengagementinbanking,financialand/orinvestment consultation business in the UAE under the rules and regulations made by the Central Bank of the UAE, the Emirates Securities and Commodities AuthorityortheUAEMinistryofEconomy;(c)anofferofsecuritieswithinthemeaningoftheDubaiInternationalFinancialCentreMarketsLaw(DIFCML)No.12of2004;and(d)afinancialpromotion,asdefinedundertheDIFCMLNo.1of200.ANZDIFCBranchisregulatedbytheDubaiFinancialServicesAuthority(DFSA) ANZ DIFC Branch is regulated by the Dubai Financial Services Authority (DFSA). The financial products or services described in this document are only available to persons who qualify as “Professional Clients” or “Market Counterparty” in accordance with the provisions of the DFSA rules. In addition, ANZ has a representative office (ANZ Representative Office) in Abu Dhabi regulated by the Central Bank of the UAE. The ANZ Representative Office is not permitted by the Central Bank of the UAE to provide any banking services to clients in the UAE.
United States. Except where this is a FX- related document, this document is distributed in the United States by ANZ Securities, Inc. (ANZ SI) which is a member of the Financial Regulatory Authority (FINRA) (www.finra.org) and registered with the SEC. ANZSI’s address is 277 Park Avenue, 31st Floor, New York, NY 10172, USA (Tel: +1 212 801 9160 Fax: +1 212 801 9163). ANZSI accepts responsibility for its content. Information on any securities referred to in this document may be obtained from ANZSI upon request. This document or material is intended for institutional use only – not retail. If you are an institutional customer wishing to effect transactions in any securities referred to in this document you must contact ANZSI, not its affiliates. ANZSI is authorised as a broker-dealer only for institutional customers, not for US Persons (as “US person” is defined in Regulation S under the US Securities Act of 1933, as amended) who are individuals. If you have registered to use this website or have otherwise received this document and are a US Person who is an individual: to avoid loss, you should cease to use this website by unsubscribing or should notify the sender and you should not act on the contents of this document in any way. Non-U.S. analysts: Non-U.S. analysts may not be associated persons of ANZSI and therefore may not be subject to FINRA Rule 2242 restrictions on communications with the subject company, public appearances and trading securities held by the analysts. Where this is an FX-related document, it is distributed in the United States by ANZ’s New York Branch, which is also located at 277 Park Avenue, 31st Floor, New York, NY 10172, USA (Tel: +1 212 801 916 0 Fax: +1 212 801 9163).
Vietnam. This document is distributed in Vietnam by ANZ or ANZ Bank (Vietnam) Limited, a subsidiary of ANZ.
This document has been prepared by ANZ Bank New Zealand Limited, Level 10, 171 Featherston Street, Wellington 6011, New Zealand, Ph 64-4-382 1992, e-mail [email protected], http://www.anz.co.nz