fine-scale human genetic structure in western...
TRANSCRIPT
ARTICLE
Fine-scale human genetic structure in Western France
Matilde Karakachoff1,2,3,4,15, Nicolas Duforet-Frebourg5,15, Floriane Simonet1,3,4, Solena Le Scouarnec1,3,4,Nadine Pellen6, Simon Lecointe1,3,4, Eric Charpentier1,3,4, Francoise Gros1,3,4, Stephane Cauchi7,8,9,Philippe Froguel7,8,9,10, Nane Copin11, the D.E.S.I.R. Study Group11,16, Thierry Le Tourneau1,3,4,12,Vincent Probst1,3,4,12, Herve Le Marec1,3,4,12, Sabrina Molinaro2, Beverley Balkau13,14, Richard Redon1,3,4,12,Jean-Jacques Schott1,3,4,12, Michael GB Blum5 and Christian Dina*,1,3,4,12
The difficulties arising from association analysis with rare variants underline the importance of suitable reference population
cohorts, which integrate detailed spatial information. We analyzed a sample of 1684 individuals from Western France, who were
genotyped at genome-wide level, from two cohorts D.E.S.I.R and CavsGen. We found that fine-scale population structure occurs
at the scale of Western France, with distinct admixture proportions for individuals originating from the Brittany Region and the
Vendee Department. Genetic differentiation increases with distance at a high rate in these two parts of Northwestern France
and linkage disequilibrium is higher in Brittany suggesting a lower effective population size. When looking for genomic regions
informative about Breton origin, we found two prominent associated regions that include the lactase region and the HLA
complex. For both the lactase and the HLA regions, there is a low differentiation between Bretons and Irish, and this is also
found at the genome-wide level. At a more refined scale, and within the Pays de la Loire Region, we also found evidence of
fine-scale population structure, although principal component analysis showed that individuals from different departments
cannot be confidently discriminated. Because of the evidence for fine-scale genetic structure in Western France, we anticipate
that rare and geographically localized variants will be identified in future full-sequence analyses.
European Journal of Human Genetics advance online publication, 3 September 2014; doi:10.1038/ejhg.2014.175
INTRODUCTION
Advances in genotyping technologies have facilitated genome-wideassociation studies and have contributed to the identification ofthousands of SNPs associated with disease1. However, most of theassociated SNPs explain a modest proportion of heritability for mostcommon diseases,2 and they do not provide variants directlyapplicable for diagnosis, prevention and treatment.3 With theadvent of whole-genome sequencing, there is now the possibility toevaluate the role of genetic variants that were too rare to be picked upby GWAS.4 Because rare and potentially deleterious variants arosemore recently than common variants, they were not yet eliminated byselection and they might provide most of the medically actionablealleles.3,5 These alleles, because of their recent origin, tend to clusterwithin a lineage and therefore, many disease-related traits have beenfound in population isolates.6 Likewise, non-isolated populationsdisplaying fine-scale genetic structure, within a short geographicaldistance, may be appropriate for gene mapping because they likelypresent high frequency of rare alleles.7
Moreover, there are specific difficulties arising from analyses basedon rare variants, as they exhibit stronger stratification than commonvariants, which is not accounted for by existing statistical methods.8
The difficulties arising in rare-variant analyses underscore theimportance of suitable reference population cohorts, whichintegrate detailed spatial information.8 In our study, we contributeto this effort by investigating fine-scale genetic structure in WesternFrance based on 1684 genotyped individuals, for whom we havedetailed geographic information. We provide a descriptive analysis ofthe pattern of population structure and genetic variation in WesternFrance with the objective of building a reference panel useful forfuture association studies.
Since the seminal work of Menozzi et al,9 evidence hasaccumulated to show that allele frequencies vary within Europe,generating population structure at the continental scale.10–12
Evidence of population structure accumulates at the scale ofEuropean countries13–18 and even at a finer scale.19,20 Fine-scalegenetic structure can result from different processes including foundereffect, endogamy, historical migration, cultural barriers to gene flowor selection processes.11,21,22
Our study focuses on genetic variation in Western France asdefined by Historical Geography literature. Before the 19th century,Western France included the ancient regions of Brittany–Anjou–Poitou and of Maine–Basse–Normandie (actually consisting on the
1INSERM UMR 1087, Nantes, France; 2Institute of Clinical Physiology, CNR, Pisa, Italy; 3CNRS, UMR 6291 institut du thorax, Nantes, France; 4Universite de Nantes, Nantes,France; 5Laboratoire TIMC-IMAG UMR 5525, Centre National de la Recherche Scientifique, Universite Joseph Fourier, Grenoble, France; 6Universite de Bretagne Occidentale,Brest, France; 7European Genomic Institute for Diabetes (EGID), Lille, France; 8CNRS UMR8199, Pasteur Institute of Lille, Lille, France; 9Lille Nord de France University, Lille,France; 10Department of Genomics of Common Disease, School of Public Health, Imperial College London, Hammersmith Hospital, London, UK; 11IRSA, Institut inter-Regionalpour la Sante, La Riche, France; 12CHU Nantes, l’institut du thorax, Service de Cardiologie, Nantes, France; 13INSERM, CESP Center for Research in Epidemiology andPopulation Health, U1018, Villejuif, France; 14Epidemiology of diabetes, obesity and chronic kidney disease over the lifecourse, University Paris Sud 11, UMRS 1018, Villejuif,France*Correspondence: Dr C Dina, Inserm UMR 1087/CNRS UMR 6291 institut du thorax, 8 Quai Moncousu, BP, 70721 44007 Nantes cedex 1, France. Tel: +33 2 28 08 01 54;Fax: +33 2 28 08 01 30; E-mail: [email protected] authors contributed equally to this work.16Members of the D.E.S.I.R. Study Group are listed before References.
Received 8 October 2013; revised 21 July 2014; accepted 30 July 2014
European Journal of Human Genetics (2014), 1–6& 2014 Macmillan Publishers Limited All rights reserved 1018-4813/14
www.nature.com/ejhg
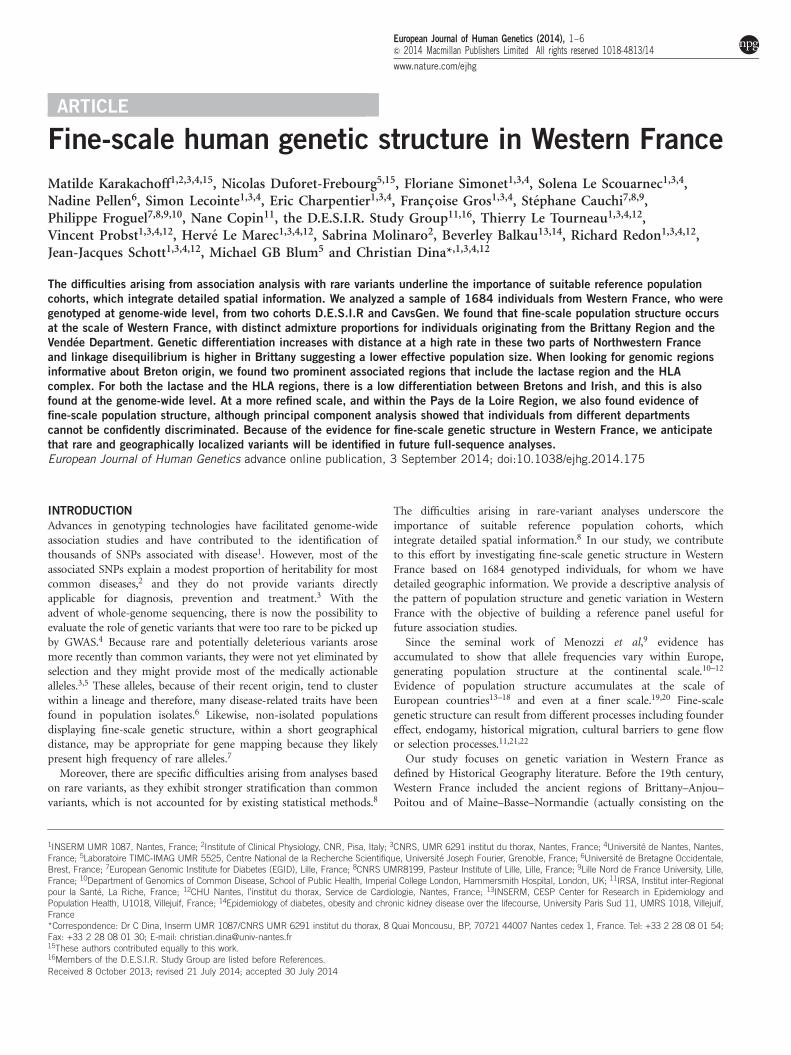
departments of Calvados, Cotes-d’Armor, Finistere, Ille-et-Vilaine,Loire-Atlantique, Maine-et-Loire, Manche, Mayenne, Morbihan,Orne, Sarthe, Deux-Sevres, Vendee, Vienne).23,24 Western France isa large peninsula positioned in the northwest of France and delimitedby the English Channel to the north, the Celtic and Atlantic Sea to thewest and the Bay of Biscay to the south; the whole region coversB90 000 km2 extending B470 km from west to east. This part ofFrance is now subdivided into different administrative regions furthersubdivided into departments (Figure 1 and Supplementary Figure 1).
We ascertained fine-scale population structure in Western France.Using principal component analysis (PCA) and model-based cluster-ing, we investigated the relationship between genetic structure andplace of birth. To better characterize fine-scale population structure,we merged individuals from Western France with the European
Population Reference Sample (POPRES),25 and we computedmeasures of genetic proximity between Western France individualsand individuals from neighboring countries. We also bettercharacterized fine-scale genetic variation by computing linkagedisequilibrium (LD) and a local rate of genetic differentiation.Finally, we performed genome scans to map genomic regionscorrelated with population structure and to evaluate the genomicinflation of test statistics when not accounting for the place of birth.
MATERIALS AND METHODS
SamplesAnalyses were performed with individuals from Western France coming from
two different studies. The first study is the D.E.S.I.R. cohort, used to study the
insulin resistance syndrome;26,27 individuals from this cohort were born
Figure 1 Ancestry coefficients displayed using the RGB color model. To visualize the admixture coefficient, each individual is colored using a RGB
(red–green–blue) coding scheme. The RGB coefficients are proportional to the ancestry coefficients obtained with admixture. Departments of the Pays de la
Loire region (bottom left). Admixture coefficients for the different regions of WF. Following the same RGB coding scheme, this figures shows the variation of
admixture coefficients in WF (bottom right).
Human genetic structure in Western FranceM Karakachoff et al
2
European Journal of Human Genetics
between 1930 and 1965 (median¼ 1950). The second group consists of
patients admitted to Nantes, Angers and Rennes hospitals, between 2004
and 2010, and included in the cohort CavsGen, for the study of calcific
aortic valve stenosis, a common pathology affecting mainly individuals over
65 years old. Individuals from CavsGen were born between 1916 and 1949
(median¼ 1931).
Individuals from both the D.E.S.I.R. and CavsGen cohorts were born in
France and they came mainly from the Region Pays de la Loire (mainly
departments of Loire-Atlantique, Maine-et-Loire and Vendee), but surround-
ing regions are also represented in the data (see Supplementary Table 1). The
geographical locations of individuals were defined according to the place of
birth, declared at the moment of enrollment in the cohorts. After excluding
individuals with missing place of birth, the study population included 1684
unrelated individuals: 897 from D.E.S.I.R. and 787 from CavsGen. A third
subgroup of 807 unrelated individuals, from the D.E.S.I.R. population, was
used to replicate the relationship between genetic and geographical structure.
This data set is called DESIR-REP in the following.
GenotypingSamples were genotyped using the Axiom Genome-Wide CEU-1 Array
(Affymetrix, Santa Clara, CA, USA). After quality control, we identified a set of
377 566 SNPs that were shared between D.E.S.I.R. and CavsGen. We pruned SNPs
to account for LD (r2o0.2), which provided a total of 78 261 SNPs used for all
analyses. In the LD analysis and the association scan, all shared SNPs were used.
The additional sample DESIR-REP was genotyped using the HumanHap300
Genotyping BeadChip (Illumina, San Diego, CA, USA). The quality control
procedure was similar and based on allele frequency and LD.
Model-based clustering and PCATo investigate the population structure in Western France, we performed
model-based clustering as implemented in admixture.28 Admixture analysis
was performed using K¼ 2 and K¼ 3 clusters. Before running admixture, we
removed outlier individuals that would otherwise have formed a single cluster
(four individuals in Maine-et-Loire and two individuals in Orne). Spatial
kriging was used to interpolate ancestry coefficients. We also investigated
population structure using PCA as implemented in the software smartpca
(Cambridge, MA, USA) from the EIGENSOFT package.29
Identity-by-state statistics, LD and local differentiationPairwise identity-by-state (IBS) statistics were computed using Plink.30 LD was
estimated using the r2 statistic. LD was computed based on the 377 566 SNPs
in the data, after removal of the SNPs with minor allele frequencies under 5%.
To compensate for unequal sampling in the different departments of interest,
we used bootstrapping. In each department, 18 individuals were randomly
selected (18 is the minimum sample size that is reached in the Manche
Department) to compute r2 values. The process was repeated five times to
average over several outcomes, and to compensate for sampling effects. Finally,
local genetic differentiation was computed based on the pairwise Fst matrix
between departments. Estimated with a Bayesian Kriging method, local genetic
differentiation provides an estimate of the Fst measure of differentiation
between a population living in the center of a department and a putative
neighboring population living 30 km away.31
Genomic regions informative about Breton originWe analyzed the association between a binary variable indicating Breton origin,
based on the place of birth and the genotype. We used Plink to compute a w2
statistic for each SNP, and we accounted for population stratification with the
genomic inflation factor.30 We then considered 50-SNP windows and for each
window, we performed a test of enrichment of SNPs informative about Breton
origin. The P-values corresponding to the test of enrichment were obtained
with a binomial test by computing the proportion of P-values smaller than
10�4 among each window of 50 SNPs. Because the data included two different
cohorts (D.E.S.I.R. and CavsGen), we also performed an additional analysis to
account for a potential cohort effect. We performed two independent GWAS
on each of the cohorts and we combined the resulting P-values using Stouffer’s
method32 for meta-analysis (also called inverse normal method).
RESULTS
Population structurePerforming a clustering analysis with admixture at both K¼ 2 andK¼ 3, we found that the admixture coefficients were correlated withgeography (Po10�16 when regressing admixture coefficients withlatitude and longitude). With K¼ 2, admixture separated some of theBretons from the rest of the sample (Supplementary Figure 2), andthis cluster was again found with K¼ 3 (green cluster in Figure 1).When averaging the ancestry of individuals within each department,we found that the ancestry component corresponding to the Bretons(green cluster) was larger in the three departments at the western endof Brittany (Finistere, Cotes d’Armor, Morbihan, see SupplementaryFigure 3). With K¼ 3, the ancestry of some individuals, many of themcoming from the Vendee Department and from the south of theMaine-et-Loire department, differed from the rest of the sample (theblue cluster in Figure 1, see also Supplementary Figure 3).
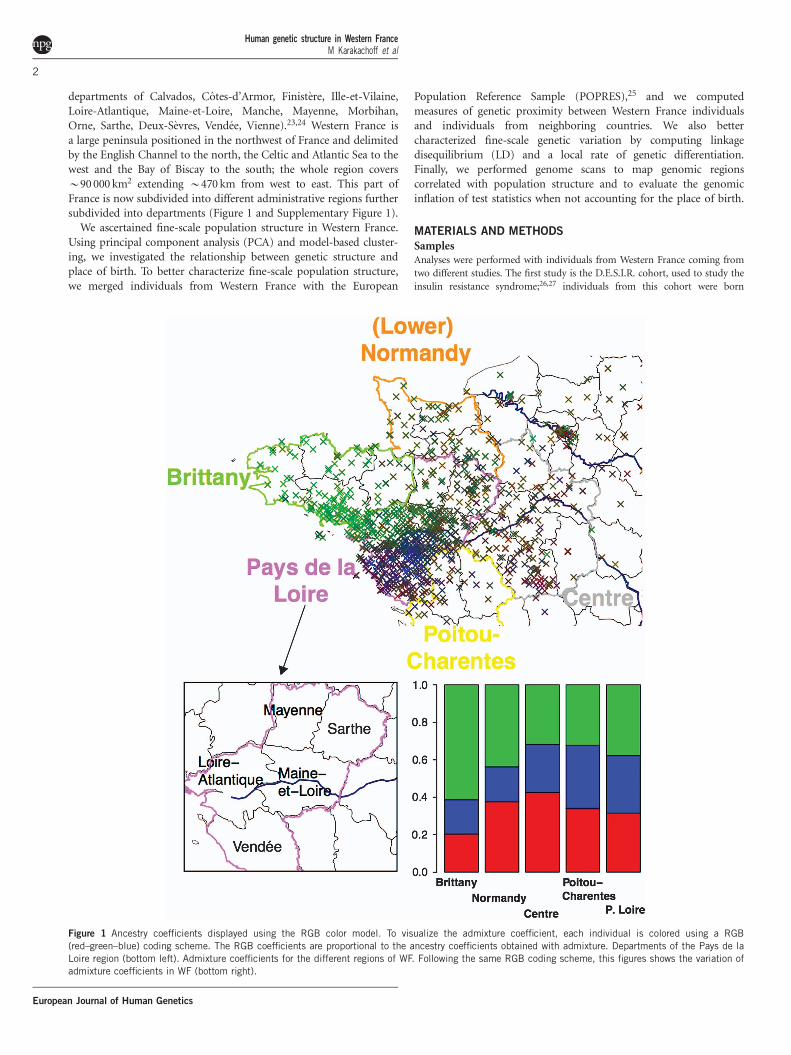
The PCA confirmed the results obtained with admixture. The firstprincipal component separated Bretons from the rest of the subjects(Figure 2 panel A) with individuals from the westernmost depart-ments of Brittany having the lowest scores for PC1 (SupplementaryFigure 4). The second component separated some individuals fromthe Vendee and Maine-et-Loire Departments from the rest of thesample (Figure 2 panel A and Supplementary Figure 4). The first twoPC components were correlated with geography (Po10�16 whenregressing the PC scores with latitude, longitude), also whenaccounting for genotyping plates and when considering the controlDESIR-REP data set (Po10�9) (Supplementary Figure 5).
Then, we explored the PCA pattern for individuals born in the Paysde la Loire Region, because it was the most represented region in thedata (926 out of 1684 sampled individuals). PCA showed geneticstructure within the Pays de la Loire Region: some individualsfrom the western Loire-Atlantique department were located close tothe Breton individuals, individuals from the northern Sartheand Mayenne Departments were grouped with individuals fromNormandy and some individuals from the southern Vendee Departmentand the eastern Maine-et-Loire department had the lowest scores forPC2 (Figure 2 panel B). However, PCA also showed considerableoverlap between individuals from the different departments of theRegion Pays de la Loire indicating that departmental origin could notbe confidently assigned using the first two principal components.
Then, we merged the data with a collection of European individualsgenotyped with the Affymetrix 500 K SNP panel (POPRES). From thefirst 10 PCs, we chose PC1 and PC3, because they were the mostcorrelated with geography. Individuals from the DESIR-CavsGen dataand from the control DESIR-REP data set were located betweenindividuals from the UK, Ireland, Spain, the French-speaking part ofSwitzerland and the French POPRES population, which is consistentwith their French origin (Supplementary Figures 6 and 7). Individualsfrom the DESIR-CavsGen data did not match exactly Frenchindividuals from POPRES, probably because of their westernmostorigin.
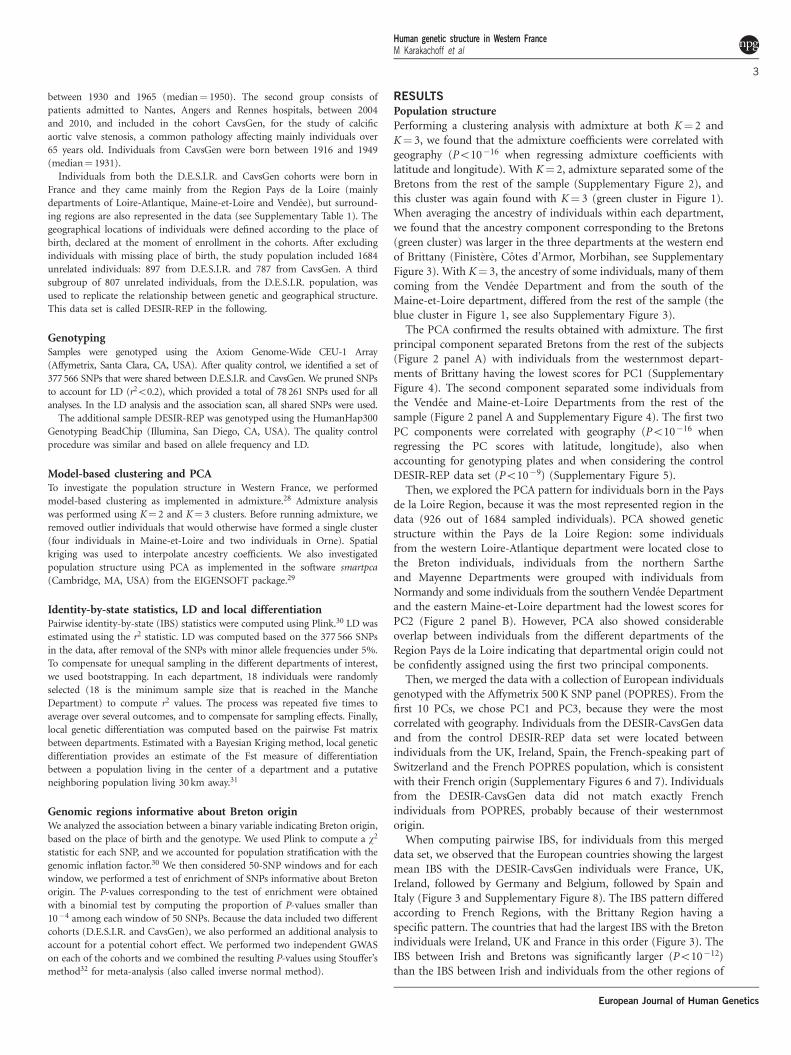
When computing pairwise IBS, for individuals from this mergeddata set, we observed that the European countries showing the largestmean IBS with the DESIR-CavsGen individuals were France, UK,Ireland, followed by Germany and Belgium, followed by Spain andItaly (Figure 3 and Supplementary Figure 8). The IBS pattern differedaccording to French Regions, with the Brittany Region having aspecific pattern. The countries that had the largest IBS with the Bretonindividuals were Ireland, UK and France in this order (Figure 3). TheIBS between Irish and Bretons was significantly larger (Po10�12)than the IBS between Irish and individuals from the other regions of
Human genetic structure in Western FranceM Karakachoff et al
3
European Journal of Human Genetics
Western France (Normandy, Pays de Loire, Poitou-Charente, Centre),and this pattern was also found with the control DESIR-REP data set(Supplementary Figure 9). Conversely, the IBS between Spanish (orItalians) and Bretons was significantly smaller (Po10�12) than theIBS between Spanish (or Italian) and individuals from the otherregions of Western France (Figure 3).
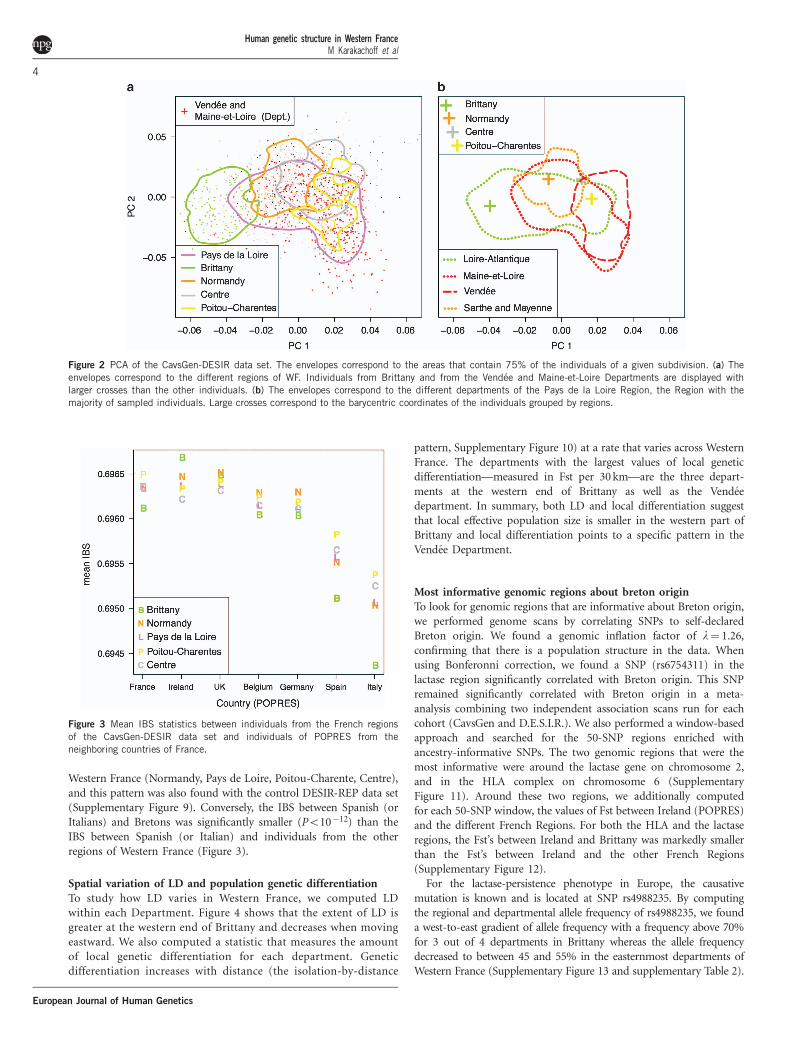
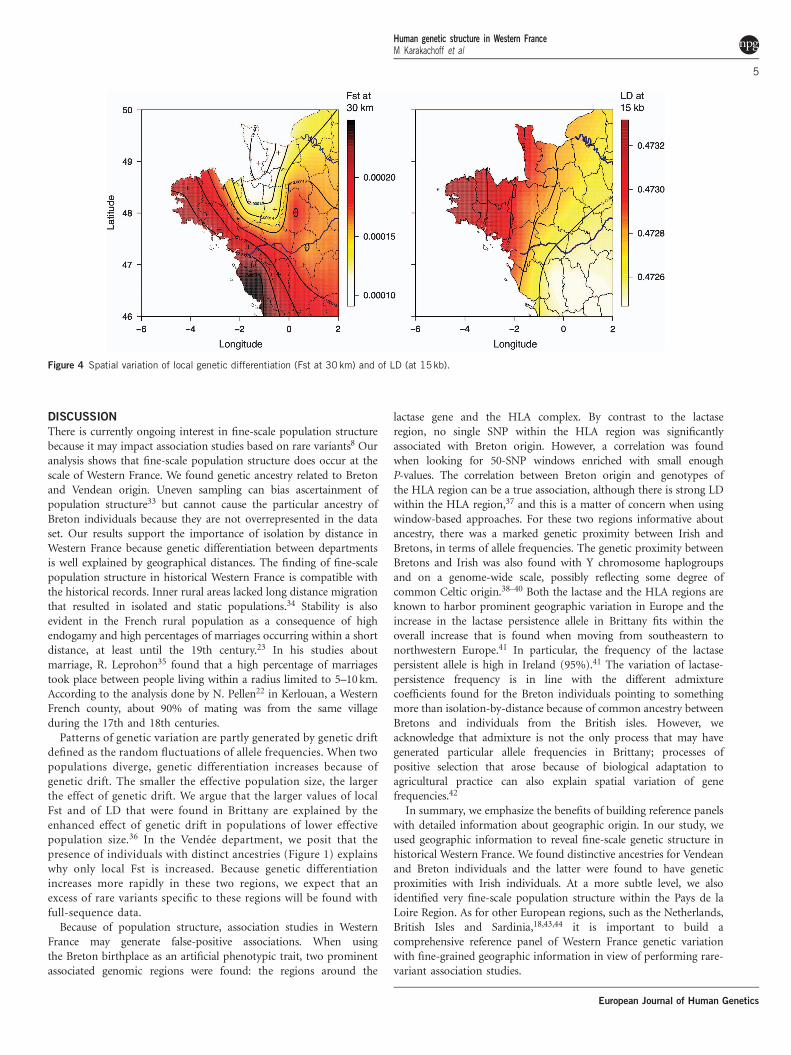
Spatial variation of LD and population genetic differentiationTo study how LD varies in Western France, we computed LDwithin each Department. Figure 4 shows that the extent of LD isgreater at the western end of Brittany and decreases when movingeastward. We also computed a statistic that measures the amountof local genetic differentiation for each department. Geneticdifferentiation increases with distance (the isolation-by-distance
pattern, Supplementary Figure 10) at a rate that varies across WesternFrance. The departments with the largest values of local geneticdifferentiation—measured in Fst per 30 km—are the three depart-ments at the western end of Brittany as well as the Vendeedepartment. In summary, both LD and local differentiation suggestthat local effective population size is smaller in the western part ofBrittany and local differentiation points to a specific pattern in theVendee Department.
Most informative genomic regions about breton originTo look for genomic regions that are informative about Breton origin,we performed genome scans by correlating SNPs to self-declaredBreton origin. We found a genomic inflation factor of l¼ 1.26,confirming that there is a population structure in the data. Whenusing Bonferonni correction, we found a SNP (rs6754311) in thelactase region significantly correlated with Breton origin. This SNPremained significantly correlated with Breton origin in a meta-analysis combining two independent association scans run for eachcohort (CavsGen and D.E.S.I.R.). We also performed a window-basedapproach and searched for the 50-SNP regions enriched withancestry-informative SNPs. The two genomic regions that were themost informative were around the lactase gene on chromosome 2,and in the HLA complex on chromosome 6 (SupplementaryFigure 11). Around these two regions, we additionally computedfor each 50-SNP window, the values of Fst between Ireland (POPRES)and the different French Regions. For both the HLA and the lactaseregions, the Fst’s between Ireland and Brittany was markedly smallerthan the Fst’s between Ireland and the other French Regions(Supplementary Figure 12).
For the lactase-persistence phenotype in Europe, the causativemutation is known and is located at SNP rs4988235. By computingthe regional and departmental allele frequency of rs4988235, we founda west-to-east gradient of allele frequency with a frequency above 70%for 3 out of 4 departments in Brittany whereas the allele frequencydecreased to between 45 and 55% in the easternmost departments ofWestern France (Supplementary Figure 13 and supplementary Table 2).
Figure 3 Mean IBS statistics between individuals from the French regions
of the CavsGen-DESIR data set and individuals of POPRES from the
neighboring countries of France.
Figure 2 PCA of the CavsGen-DESIR data set. The envelopes correspond to the areas that contain 75% of the individuals of a given subdivision. (a) The
envelopes correspond to the different regions of WF. Individuals from Brittany and from the Vendee and Maine-et-Loire Departments are displayed with
larger crosses than the other individuals. (b) The envelopes correspond to the different departments of the Pays de la Loire Region, the Region with the
majority of sampled individuals. Large crosses correspond to the barycentric coordinates of the individuals grouped by regions.
Human genetic structure in Western FranceM Karakachoff et al
4
European Journal of Human Genetics
DISCUSSION
There is currently ongoing interest in fine-scale population structurebecause it may impact association studies based on rare variants8 Ouranalysis shows that fine-scale population structure does occur at thescale of Western France. We found genetic ancestry related to Bretonand Vendean origin. Uneven sampling can bias ascertainment ofpopulation structure33 but cannot cause the particular ancestry ofBreton individuals because they are not overrepresented in the dataset. Our results support the importance of isolation by distance inWestern France because genetic differentiation between departmentsis well explained by geographical distances. The finding of fine-scalepopulation structure in historical Western France is compatible withthe historical records. Inner rural areas lacked long distance migrationthat resulted in isolated and static populations.34 Stability is alsoevident in the French rural population as a consequence of highendogamy and high percentages of marriages occurring within a shortdistance, at least until the 19th century.23 In his studies aboutmarriage, R. Leprohon35 found that a high percentage of marriagestook place between people living within a radius limited to 5–10 km.According to the analysis done by N. Pellen22 in Kerlouan, a WesternFrench county, about 90% of mating was from the same villageduring the 17th and 18th centuries.
Patterns of genetic variation are partly generated by genetic driftdefined as the random fluctuations of allele frequencies. When twopopulations diverge, genetic differentiation increases because ofgenetic drift. The smaller the effective population size, the largerthe effect of genetic drift. We argue that the larger values of localFst and of LD that were found in Brittany are explained by theenhanced effect of genetic drift in populations of lower effectivepopulation size.36 In the Vendee department, we posit that thepresence of individuals with distinct ancestries (Figure 1) explainswhy only local Fst is increased. Because genetic differentiationincreases more rapidly in these two regions, we expect that anexcess of rare variants specific to these regions will be found withfull-sequence data.
Because of population structure, association studies in WesternFrance may generate false-positive associations. When usingthe Breton birthplace as an artificial phenotypic trait, two prominentassociated genomic regions were found: the regions around the
lactase gene and the HLA complex. By contrast to the lactaseregion, no single SNP within the HLA region was significantlyassociated with Breton origin. However, a correlation was foundwhen looking for 50-SNP windows enriched with small enoughP-values. The correlation between Breton origin and genotypes ofthe HLA region can be a true association, although there is strong LDwithin the HLA region,37 and this is a matter of concern when usingwindow-based approaches. For these two regions informative aboutancestry, there was a marked genetic proximity between Irish andBretons, in terms of allele frequencies. The genetic proximity betweenBretons and Irish was also found with Y chromosome haplogroupsand on a genome-wide scale, possibly reflecting some degree ofcommon Celtic origin.38–40 Both the lactase and the HLA regions areknown to harbor prominent geographic variation in Europe and theincrease in the lactase persistence allele in Brittany fits within theoverall increase that is found when moving from southeastern tonorthwestern Europe.41 In particular, the frequency of the lactasepersistent allele is high in Ireland (95%).41 The variation of lactase-persistence frequency is in line with the different admixturecoefficients found for the Breton individuals pointing to somethingmore than isolation-by-distance because of common ancestry betweenBretons and individuals from the British isles. However, weacknowledge that admixture is not the only process that may havegenerated particular allele frequencies in Brittany; processes ofpositive selection that arose because of biological adaptation toagricultural practice can also explain spatial variation of genefrequencies.42
In summary, we emphasize the benefits of building reference panelswith detailed information about geographic origin. In our study, weused geographic information to reveal fine-scale genetic structure inhistorical Western France. We found distinctive ancestries for Vendeanand Breton individuals and the latter were found to have geneticproximities with Irish individuals. At a more subtle level, we alsoidentified very fine-scale population structure within the Pays de laLoire Region. As for other European regions, such as the Netherlands,British Isles and Sardinia,18,43,44 it is important to build acomprehensive reference panel of Western France genetic variationwith fine-grained geographic information in view of performing rare-variant association studies.
Figure 4 Spatial variation of local genetic differentiation (Fst at 30 km) and of LD (at 15kb).
Human genetic structure in Western FranceM Karakachoff et al
5
European Journal of Human Genetics
CONFLICT OF INTEREST
The authors declare no conflict of interest.
ACKNOWLEDGEMENTSWe thank Emmanuelle Bourcereau who was involved in patient recruitment of
the CavsGen cohort. We also thank Professors Le Guerrier and Baufreton from
University Hospitals of Rennes and Angers. We are grateful to the French
Regional Council of Pays-de-la-Loire (Regional grant Biliv, grant VACARME -
www.vacarme-project.org), the French Ministry of Health (PHRC/RNI-PROG/
09/61: Genetique du retrecissement aortique) and the French Ministry of
Research (CavsGen project, ANR-13-BSV6-0011-01). We wish to thank the
Fondation Genavie for its financial support. The POPRES data were obtained
from dbGaP (accession no. phs000145.v3.p2). FS was funded by a Eurostars
E!6490 Cardiomarks grant. MGBB is supported by the French National
Research Agency (DATGEN project, ANR-2010-JCJC-1607-01). The D.E.S.I.R.
study has been supported by INSERM contracts with CNAMTS, Lilly, Novartis
Pharma and Sanofi-Aventis; by INSERM (Reseaux en Sante Publique,
Interactions entre les determinants de la sante), Cohortes Sante TGIR, the
Association Diabete Risque Vasculaire, the Federation Francaise de
Cardiologie, La Fondation de France, ALFEDIAM, Societe francophone du
diabete, ONIVINS, Abbott, Ardix Medical, Bayer Diagnostics, Becton
Dickinson, Cardionics, Merck Sante, Novo Nordisk, Pierre Fabre, Roche,
Topcon.
THE D.E.S.I.R. STUDY GROUPINSERM U1018: B Balkau, P Ducimetiere, E Eschwege; INSERM U367:
F Alhenc-Gelas; CHU D’Angers: A Girault; Bichat Hospital: F Fumeron,
M Marre, R Roussel; CHU de Rennes: F. Bonnet; CNRS UMR8090, Lille:
S Cauchi, P Froguel; Centres d’Examens de Sante: Alencon, Angers, Blois,
Caen, Chateauroux, Chartres, Cholet, Le Mans, Orleans, Tours; Institute de
Recherche Medecine Generale: J Cogneau; General practitioners of the Region;
Institute inter-Regional pour la Sante: C Born, E Caces, M Cailleau, O Lantieri,
JG Moreau, F Rakotozafy, J Tichet, S Vol.
1 Hindorff LA, Sethupathy P, Junkins HA et al: Potential etiologic and functionalimplications of genome-wide association loci for human diseases and traits. Proc NatlAcad Sci 2009; 106: 9362–9367.
2 Manolio TA, Collins FS, Cox NJ et al: Finding the missing heritability of complexdiseases. Nature 2009; 461: 747–753.
3 Lupski JR, Belmont JW, Boerwinkle E, Gibbs RA: Clan genomics and the complexarchitecture of human disease. Cell 2011; 147: 32–43.
4 Cirulli ET, Goldstein DB: Uncovering the roles of rare variants in common diseasethrough whole-genome sequencing. Nat Rev Genet 2010; 11: 415–425.
5 McClellan J, King M-C: Genetic heterogeneity in human disease. Cell 2010; 141:210–217.
6 Kristiansson K, Naukkarinen J, Peltonen L: Isolated populations and complex diseasegene identification. Genome Biol 2008; 9: 109.
7 Henn BM, Gravel S, Moreno-Estrada A, Acevedo-Acevedo S, Bustamante CD: Fine-scale population structure and the era of next-generation sequencing. Hum Mol Genet2010; 19: R221–R226.
8 Mathieson I, McVean G: Differential confounding of rare and common variants inspatially structured populations. Nat Genet 2012; 44: 243–246.
9 Menozzi P, Piazza A, Cavalli-Sforza L: Synthetic maps of human gene frequencies inEuropeans. Science 1978; 201: 786–792.
10 Heath SC, Gut IG, Brennan P et al: Investigation of the fine structure of Europeanpopulations with applications to disease association studies. Eur J Hum Genet 2008;16: 1413–1429.
11 Novembre J, Johnson T, Bryc K et al: Genes mirror geography within Europe. Nature2008; 456: 98–101.
12 Jay F, Sjodin P, Jakobsson M, Blum MGB: Anisotropic isolation by distance: the mainorientations of human genetic differentiation. Mol Biol Evol 2013; 30: 513–525.
13 Humphreys K, Grankvist A, Leu M et al: The genetic structure of the Swedishpopulation. PLoS One 2011; 6: e22547.
14 O’Dushlaine CT, Morris D, Moskvina V et al: Population structure and genome-wide patterns of variation in Ireland and Britain. Eur J Hum Genet 2010; 18:1248–1254.
15 Salmela E, Lappalainen T, Liu J et al: Swedish population substructure revealed bygenome-wide single nucleotide polymorphism data. PLoS One 2011; 6: e16747.
16 Di Gaetano C, Voglino F, Guarrera S et al: An overview of the genetic structure withinthe Italian population from genome-wide data. PLoS One 2012; 7: e43759.
17 Esko T, Mezzavilla M, Nelis M et al: Genetic characterization of northeastern Italianpopulation isolates in the context of broader European genetic diversity. Eur J HumGenet 2012; 21: 659–665.
18 Abdellaoui A, Hottenga J-J, Knijff de P et al: Population structure, migration,and diversifying selection in the Netherlands. Eur J Hum Genet 2013; 21:1277–1285.
19 O’Dushlaine C, McQuillan R, Weale ME et al: Genes predict village of origin in ruralEurope. Eur J Hum Genet 2010; 18: 1269–1270.
20 Colonna V, Nutile T, Ferrucci RR et al: Comparing population structure as inferred fromgenealogical versus genetic information. Eur J Hum Genet 2009; 17: 1635–1641.
21 Biswas S, Scheinfeldt LB, Akey JM: Genome-wide insights into the patterns anddeterminants of fine-scale population structure in humans. Am J Hum Genet 2009;84: 641–650.
22 Pellen N: Hasard, coıncidence, predestination... et s’il fallait plutot regarder du cotede nos aıeux? Analyse demographique et historique des reseaux genealogiques et desstructures familiales des patients atteints de mucoviscidose en Bretagne. These dedoctorat en demographie historique. Versailles, France: Universite de Versailles-Saint-Quentin-en-Yvelines, 2012.
23 Blayo Y, Henry L: Donnees demographiques sur la Bretagne et l’Anjou de 1740 a1829. Ann Demographie Hist 1967; 1967: 91–171.
24 Dupaquier J: La dynamique demographique de la France de l’Ouest au XIXe s. Norois1988; 140: 409–414.
25 Nelson MR, Bryc K, King KS et al: The Population Reference Sample, POPRES: aresource for population, disease, and pharmacological genetics research. Am J HumGenet 2008; 83: 347–358.
26 Balkau B: [An epidemiologic survey from a network of French Health ExaminationCentres, (D.E.S.I.R.): epidemiologic data on the insulin resistance syndrome]. RevDepidemiologie Sante Publique 1996; 44: 373–375.
27 Sladek R, Rocheleau G, Rung J et al: A genome-wide association study identifies novelrisk loci for type 2 diabetes. Nature 2007; 445: 881–885.
28 Alexander DH, Novembre J, Lange K: Fast model-based estimation of ancestry inunrelated individuals. Genome Res 2009; 19: 1655–1664.
29 Patterson N, Price AL, Reich D: Population structure and eigenanalysis. PLoS Genet2006; 2: e190.
30 Purcell S, Neale B, Todd-Brown K et al: PLINK: a tool set for whole-genomeassociation and population-based linkage analyses. Am J Hum Genet 2007; 81:559–575.
31 Duforet-Frebourg N, Blum MGB: Non-stationary patterns of isolation-by-distance:inferring measures of local genetic differentiation with Bayesian kriging. Evolution2013; 68: 1110–1123.
32 Stouffer SA, Suchman EA, Devinney LC, Star SA, Williams RM Jr: The AmericanSoldier: Adjustment During Army Life. (Studies in Social Psychology in World War II,Volume 1). Princeton University Press, NJ, USA, 1949.
33 McVean G: A genealogical interpretation of principal components analysis. PLoS Genet2009; 5: e1000686.
34 Hohenberg P: Migrations et fluctuations demographiques dans la France rurale, 1836-1901. Ann Economies Societes Civilis 1974; 29: 461–497.
35 Leprohon R: Vie et mort des Bretons sous Louis XIV. Brasparts, France: Bibliophiles deBretagne, 1984.
36 Pimenoff VN, Laval G, Comas D et al: Similarity in recombination rate and linkagedisequilibrium at CYP2C and CYP2D cytochrome P450 gene regions amongEuropeans indicates signs of selection and no advantage of using tagSNPs inpopulation isolates. Pharmacogenet Genomics 2012; 22: 846–857.
37 Evseeva I, Nicodemus KK, Bonilla C, Tonks S, Bodmer WF: Linkage disequilibriumand age of HLA region SNPs in relation to classic HLA gene alleles within Europe.Eur J Hum Genet 2010; 18: 924–932.
38 McEvoy B, Richards M, Forster P, Bradley DG: The Longue Duree of genetic ancestry:multiple genetic marker systems and Celtic origins on the Atlantic facade of Europe.Am J Hum Genet 2004; 75: 693–702.
39 Dubut V, Chollet L, Murail P et al: mtDNA polymorphisms in five French groups:importance of regional sampling. Eur J Hum Genet 2004; 12: 293–300.
40 Busby GB, Brisighelli F, Sanchez-Diz P et al: The peopling of Europe andthe cautionary tale of Y chromosome lineage R-M269. Proc Biol Sci 2012; 279:884–892.
41 Itan Y, Jones BL, Ingram CJE, Swallow DM, Thomas MG: A worldwide correlation oflactase persistence phenotype and genotypes. BMC Evol Biol 2010; 10: 36.
42 Fix AG: Gene frequency clines in Europe: demic diffusion or natural selection?J R Anthropol Inst 1996; 2: 625–643.
43 Winney B, Boumertit A, Day T et al: People of the British Isles: preliminary analysis ofgenotypes and surnames in a UK-control population. Eur J Hum Genet 2012; 20:203–210.
44 Chen W, Li B, Zeng Z et al: Genotype calling and haplotyping in parent-offspring trios.Genome Res 2013; 23: 142–151.
Supplementary Information accompanies this paper on European Journal of Human Genetics website (http://www.nature.com/ejhg)
Human genetic structure in Western FranceM Karakachoff et al
6
European Journal of Human Genetics