fine-tuning hvac operation through rfid and user feedback … · fine-tuning hvac operation through...
TRANSCRIPT

Fine-Tuning HVAC Operation Through RFID and UserFeedback
Jorge Miguel Trigo Coelho
Thesis to obtain the Master of Science Degree in
Information Systems and Computer Engineering
Supervisors: Prof. Paulo Jorge Fernandes CarreiraProf. Miguel Filipe Leitao Pardal
Examination Committee
Chairperson: Prof. Joao Emılio Segurado Pavao MartinsSupervisor: Prof. Paulo Jorge Fernandes Carreira
Members of the Committee: Prof. Jose Alberto Rodrigues Pereira Sardinha
October 2015

Abstract
Heating, Ventilating and Air-Conditioning (HVAC) systems account for about 60% of the total energy
spent in buildings. A large share of these spendings regards incorrect adjustment of temperature set-
point, which remains constant independently of user occupancy and thermal comfort. Moreover, con-
stant temperature setpoints might induce over or under cooling which leads to user thermal discomfort.
This thesis describes a collaborative application where HVAC temperature setpoints are adjusted based
on user occupancy providing occupants a platform where they can vote for a different temperature set-
point, while real-time comfort and energy savings values are available for feedback to users. The devel-
oped platform elicits user behaviour transformation leading occupants into an active role of adjusting the
temperature setpoint, accordingly to roughly comfort preferences and prospective feedback, improving
both thermal comfort and energy efficiency.
The results show that it is technically possible to develop collaborative platforms similar to the one
that was implemented, but the subjectivity of this case study leads to substantially different results for the
same experiment, when different users are involved. One can conclude that the use of these platforms
only fit for scenarios where users are able reach a consensus on the subject of the case in analysis.
Keywords
Energy Savings; Gamification; HVAC; Thermal Comfort; User Identification; Virtual User interfaces for
Building Automation Systems.
i


Resumo
Os sistemas de Aquecimento, Ventilacao e Ar Condicionado (AVAC) sao responsaveis por cerca de
60% do consumo energetico dos edifıcios. Grande parte desse consumo deve-se a um incorrecto
ajuste do setpoint de temperatura desses sistemas, que permanece inalterado independentemente da
ocupacao da sala ou do conforto termico dos ocupantes da mesma. Para alem disso, setpoints de
temperatura que se mantem inalterados podem provocar temperaturas demasiado baixas ou altas, o
que provoca uma sensacao de desconforto termico aos ocupantes de uma dada sala. Esta dissertacao
descreve uma aplicacao colaborativa onde o setpoint de temperatura do sistema de AVAC e ajustado de
acordo com a ocupacao do espaco, dando aos utilizadores a oportunidade de utilizar uma ferramenta
onde podem votar a favor de uma nova temperatura no espaco onde se encontram, ao mesmo tempo
que podem receber valores respeitantes ao consumo energetico associado ao sistema de AVAC. A
aplicacao desenvolvida pretende suscitar um comportamento aos utilizadores tal que estes tenham um
papel activo no ajuste fino da temperatura do AVAC, levando a um aumento tanto da sensacao de
conforto termico como da eficiencia energetica.
Os resultados obtidos mostram que e tecnicamente possıvel desenvolver e implementar plataformas
colaborativas que visem os objectivos descritos acima, mas a subjectividade do caso em estudo leva a
resultados substancialmente diferentes para uma mesma experiencia realizada com utilizadores difer-
entes. Conclui-se que o uso de plataformas semelhantes apenas sao adequadas para casos em que
os utilizadores consigam atingir um consenso no assunto em analise.
Palavras Chave
AVAC, Conforto Termico, Gamificacao, Identificacao de utilizadores; Interfaces Virtuais para Sistemas
de Automacao Residencial; Poupanca energetica.
iii


Contents
1 Introduction 1
1.1 Motivation . . . . . . . . . . . . . . . . . . . . . . . . . . . . . . . . . . . . . . . . . . . . . 3
1.2 Problem Statement . . . . . . . . . . . . . . . . . . . . . . . . . . . . . . . . . . . . . . . . 4
1.3 Contributions . . . . . . . . . . . . . . . . . . . . . . . . . . . . . . . . . . . . . . . . . . . 5
1.4 Document Structure . . . . . . . . . . . . . . . . . . . . . . . . . . . . . . . . . . . . . . . 5
2 Related Work 7
2.1 HVAC Systems . . . . . . . . . . . . . . . . . . . . . . . . . . . . . . . . . . . . . . . . . . 9
2.1.1 Setpoints . . . . . . . . . . . . . . . . . . . . . . . . . . . . . . . . . . . . . . . . . 9
2.1.2 Temperature setpoint . . . . . . . . . . . . . . . . . . . . . . . . . . . . . . . . . . 9
2.2 User Identification . . . . . . . . . . . . . . . . . . . . . . . . . . . . . . . . . . . . . . . . 10
2.2.1 RFID . . . . . . . . . . . . . . . . . . . . . . . . . . . . . . . . . . . . . . . . . . . . 10
2.2.2 User identification using Smart Cards . . . . . . . . . . . . . . . . . . . . . . . . . 11
2.2.3 IEEE 802.11 Wireless Fidelity (Wi-Fi) . . . . . . . . . . . . . . . . . . . . . . . . . 12
2.2.4 User identification using MAC Addresses . . . . . . . . . . . . . . . . . . . . . . . 12
2.3 Occupant Comfort . . . . . . . . . . . . . . . . . . . . . . . . . . . . . . . . . . . . . . . . 12
2.3.1 Thermal Comfort . . . . . . . . . . . . . . . . . . . . . . . . . . . . . . . . . . . . . 12
2.3.2 Occupant Comfort Evaluation . . . . . . . . . . . . . . . . . . . . . . . . . . . . . . 13
2.3.3 Predicted Mean Vote (PMV) . . . . . . . . . . . . . . . . . . . . . . . . . . . . . . . 13
2.3.4 Predicted Percentage Dissatisfied (PPD) . . . . . . . . . . . . . . . . . . . . . . . 14
2.4 User Behaviour Transformation . . . . . . . . . . . . . . . . . . . . . . . . . . . . . . . . . 15
2.5 Gamification . . . . . . . . . . . . . . . . . . . . . . . . . . . . . . . . . . . . . . . . . . . 15
2.6 Collaborative Systems . . . . . . . . . . . . . . . . . . . . . . . . . . . . . . . . . . . . . . 16
2.7 Virtual User Interfaces to Control Building Automation Systems . . . . . . . . . . . . . . . 17
2.8 Energy Efficiency Evaluation . . . . . . . . . . . . . . . . . . . . . . . . . . . . . . . . . . 17
2.9 Discussion . . . . . . . . . . . . . . . . . . . . . . . . . . . . . . . . . . . . . . . . . . . . 20
2.9.1 Identifying users . . . . . . . . . . . . . . . . . . . . . . . . . . . . . . . . . . . . . 20
2.9.2 Virtual Interfaces and Interaction . . . . . . . . . . . . . . . . . . . . . . . . . . . . 20
v

2.9.3 Input values and feedback . . . . . . . . . . . . . . . . . . . . . . . . . . . . . . . . 20
2.9.4 Energy efficiency evaluation . . . . . . . . . . . . . . . . . . . . . . . . . . . . . . . 21
3 Solution Proposal 23
3.1 Overview of main features . . . . . . . . . . . . . . . . . . . . . . . . . . . . . . . . . . . . 25
3.2 Use Cases . . . . . . . . . . . . . . . . . . . . . . . . . . . . . . . . . . . . . . . . . . . . 26
3.2.1 Scenario 1: Alice . . . . . . . . . . . . . . . . . . . . . . . . . . . . . . . . . . . . . 27
3.2.2 Scenario 2: Bob . . . . . . . . . . . . . . . . . . . . . . . . . . . . . . . . . . . . . 27
3.2.3 Scenario 3: Carol . . . . . . . . . . . . . . . . . . . . . . . . . . . . . . . . . . . . 27
3.2.4 Scenario 4: Dave . . . . . . . . . . . . . . . . . . . . . . . . . . . . . . . . . . . . . 27
3.2.5 Scenario 5: Eve . . . . . . . . . . . . . . . . . . . . . . . . . . . . . . . . . . . . . 28
3.2.6 Scenario 6: Faith . . . . . . . . . . . . . . . . . . . . . . . . . . . . . . . . . . . . . 28
3.3 Requirements . . . . . . . . . . . . . . . . . . . . . . . . . . . . . . . . . . . . . . . . . . . 28
3.3.1 Functional Requirements . . . . . . . . . . . . . . . . . . . . . . . . . . . . . . . . 28
3.3.2 Non Functional Requirements . . . . . . . . . . . . . . . . . . . . . . . . . . . . . . 29
3.4 Overview . . . . . . . . . . . . . . . . . . . . . . . . . . . . . . . . . . . . . . . . . . . . . 30
3.5 Architecture . . . . . . . . . . . . . . . . . . . . . . . . . . . . . . . . . . . . . . . . . . . . 30
4 Implementation 33
4.1 Web Application Framework . . . . . . . . . . . . . . . . . . . . . . . . . . . . . . . . . . . 35
4.1.1 Model . . . . . . . . . . . . . . . . . . . . . . . . . . . . . . . . . . . . . . . . . . . 35
4.1.2 View . . . . . . . . . . . . . . . . . . . . . . . . . . . . . . . . . . . . . . . . . . . . 36
4.1.3 Controller . . . . . . . . . . . . . . . . . . . . . . . . . . . . . . . . . . . . . . . . . 37
4.2 Development environment . . . . . . . . . . . . . . . . . . . . . . . . . . . . . . . . . . . . 38
4.3 Database Management System . . . . . . . . . . . . . . . . . . . . . . . . . . . . . . . . . 39
4.4 Algorithms . . . . . . . . . . . . . . . . . . . . . . . . . . . . . . . . . . . . . . . . . . . . . 41
4.4.1 User authentication . . . . . . . . . . . . . . . . . . . . . . . . . . . . . . . . . . . 41
4.4.2 User identification using RFID . . . . . . . . . . . . . . . . . . . . . . . . . . . . . . 41
4.4.3 User room leaving routine . . . . . . . . . . . . . . . . . . . . . . . . . . . . . . . . 42
4.4.4 User interaction . . . . . . . . . . . . . . . . . . . . . . . . . . . . . . . . . . . . . . 42
4.4.5 Request interface for HVAC values . . . . . . . . . . . . . . . . . . . . . . . . . . . 42
4.4.6 Setpoint voting . . . . . . . . . . . . . . . . . . . . . . . . . . . . . . . . . . . . . . 42
4.4.7 Setpoint calculation . . . . . . . . . . . . . . . . . . . . . . . . . . . . . . . . . . . 43
4.4.8 Finding user preferences . . . . . . . . . . . . . . . . . . . . . . . . . . . . . . . . 43
4.4.9 Gamification . . . . . . . . . . . . . . . . . . . . . . . . . . . . . . . . . . . . . . . 44
vi

5 Evaluation 45
5.1 Evaluation approach for implementation . . . . . . . . . . . . . . . . . . . . . . . . . . . . 47
5.2 Description of the experiments . . . . . . . . . . . . . . . . . . . . . . . . . . . . . . . . . 48
5.3 Experiment Results . . . . . . . . . . . . . . . . . . . . . . . . . . . . . . . . . . . . . . . 50
5.3.1 First experiment . . . . . . . . . . . . . . . . . . . . . . . . . . . . . . . . . . . . . 50
5.3.2 Second experiment . . . . . . . . . . . . . . . . . . . . . . . . . . . . . . . . . . . 51
5.3.3 Third experiment . . . . . . . . . . . . . . . . . . . . . . . . . . . . . . . . . . . . . 53
5.3.4 Fourth experiment . . . . . . . . . . . . . . . . . . . . . . . . . . . . . . . . . . . . 54
5.4 Discussion . . . . . . . . . . . . . . . . . . . . . . . . . . . . . . . . . . . . . . . . . . . . 55
5.4.1 Scenario 1 . . . . . . . . . . . . . . . . . . . . . . . . . . . . . . . . . . . . . . . . 55
5.4.2 Scenario 2 . . . . . . . . . . . . . . . . . . . . . . . . . . . . . . . . . . . . . . . . 56
5.4.3 Conclusion . . . . . . . . . . . . . . . . . . . . . . . . . . . . . . . . . . . . . . . . 56
6 Conclusions 59
6.1 Limitations and future work . . . . . . . . . . . . . . . . . . . . . . . . . . . . . . . . . . . 61
6.2 Conclusion . . . . . . . . . . . . . . . . . . . . . . . . . . . . . . . . . . . . . . . . . . . . 61
A Web Application layout for computer views 67
B Web Application layout for smart phone and tablet views 73
vii

viii

List of Figures
1.1 Relation between room temperature (Temp), HVAC setpoint (sp) and user comfort. . . . . 4
2.1 RFID System. . . . . . . . . . . . . . . . . . . . . . . . . . . . . . . . . . . . . . . . . . . . 10
2.2 PPD as a function of the PMV. . . . . . . . . . . . . . . . . . . . . . . . . . . . . . . . . . 15
2.3 Energy savings after implementing an energy saving project (adapted from United States
Environmental Protection Agency (EPA) [1]). . . . . . . . . . . . . . . . . . . . . . . . . . 18
3.1 Use Case for ’Authentication’ . . . . . . . . . . . . . . . . . . . . . . . . . . . . . . . . . . 26
3.2 Use Case for ’Participation’ . . . . . . . . . . . . . . . . . . . . . . . . . . . . . . . . . . . 26
3.3 Use Case for ’Gamification’ . . . . . . . . . . . . . . . . . . . . . . . . . . . . . . . . . . . 26
3.4 Use Case for ’Statistics’ . . . . . . . . . . . . . . . . . . . . . . . . . . . . . . . . . . . . . 26
3.5 Architecture of the system. . . . . . . . . . . . . . . . . . . . . . . . . . . . . . . . . . . . 31
4.1 Web application main view . . . . . . . . . . . . . . . . . . . . . . . . . . . . . . . . . . . 37
4.2 Extended Entity–Relationship (EER) Diagram for the Web Application Database. . . . . . 40
5.1 HVAC thermostat for controlling temperature setpoint. . . . . . . . . . . . . . . . . . . . . 49
A.1 Login screen layout for computer views. . . . . . . . . . . . . . . . . . . . . . . . . . . . . 69
A.2 Main screen layout for computer views. . . . . . . . . . . . . . . . . . . . . . . . . . . . . 69
A.3 Main screen (after making a request) layout for computer views. . . . . . . . . . . . . . . 70
A.4 Profile screen layout for computer views. . . . . . . . . . . . . . . . . . . . . . . . . . . . . 70
A.5 Gamification screen layout for computer views. . . . . . . . . . . . . . . . . . . . . . . . . 71
A.6 Stats screen layout for computer views. . . . . . . . . . . . . . . . . . . . . . . . . . . . . 71
A.7 About screen layout for computer views. . . . . . . . . . . . . . . . . . . . . . . . . . . . . 72
B.1 Main screen layout for small views. . . . . . . . . . . . . . . . . . . . . . . . . . . . . . . . 75
B.2 Main menu layout for small views. . . . . . . . . . . . . . . . . . . . . . . . . . . . . . . . 75
B.3 Gamification layout for small views. . . . . . . . . . . . . . . . . . . . . . . . . . . . . . . . 76
ix

B.4 Stats layout for small views. . . . . . . . . . . . . . . . . . . . . . . . . . . . . . . . . . . . 76
x

List of Tables
2.1 Predicted Mean Vote sensation scale . . . . . . . . . . . . . . . . . . . . . . . . . . . . . 14
2.2 Measured Savings Approaches Techniques (adapted from EPA [2]). . . . . . . . . . . . . 19
4.1 Day classification related to day time. . . . . . . . . . . . . . . . . . . . . . . . . . . . . . 43
4.2 Relation between Experience Points and Gamification Level . . . . . . . . . . . . . . . . . 44
5.1 Log file for the first experiment. . . . . . . . . . . . . . . . . . . . . . . . . . . . . . . . . . 50
5.2 Percentage of manual versus automatic votes for the first experiment. . . . . . . . . . . . 51
5.3 Log file for the second experiment. . . . . . . . . . . . . . . . . . . . . . . . . . . . . . . . 52
5.4 Percentage of manual versus automatic votes for the second experiment. . . . . . . . . . 52
5.5 Log file for the third experiment. . . . . . . . . . . . . . . . . . . . . . . . . . . . . . . . . . 53
5.6 Percentage of manual versus automatic votes for the third experiment. . . . . . . . . . . . 53
5.7 Log file for the fourth experiment. . . . . . . . . . . . . . . . . . . . . . . . . . . . . . . . . 54
5.8 Percentage of manual versus automatic votes for the fourth experiment. . . . . . . . . . . 54
xi

xii

Acronyms
3D Three-dimensional
A4 Amphitheatre 4
AP Access Point
ASHRAE American Society of Heating, Refrigeration and Air-Conditioning Engineers
AVAC Aquecimento, Ventilacao e Ar Condicionado
BAP Battery-assisted passive tags
BAU Business-As-Usual
BAS Building Automation Systems
CSS Cascading Style Sheets
DAO Data Access Object
DSA Deemed Saving Approach
EER Extended Entity–Relationship
EPA United States Environmental Protection Agency
EPC Electronic Product Code
FRs Functional Requirements
GUI Graphical User Interface
HCA HVAC Controller Application
HTTP Hypertext Transfer Protocol
HF High frequency
xiii

HTML HyperText Markup Language
HVAC Heating, Ventilating and Air-Conditioning
IDE Integrated Development Environment
IEEE Institute of Electrical and Electronics Engineers
ISO International Organization for Standardization
IST Instituto Superior Tecnico
JSP JavaServer Pages
LAN Local Area Network
LF Low frequency
MAC Media Access Control
MSA Measured Savings Approach
MW Microwave
MVC Model-View-Controller
NFRs Non Functional Requirements
PMV Predicted Mean Vote
POM Project Object Model
PPD Predicted Percentage Dissatisfied
RFID Radio-frequency Identification
SHF Super-high frequency
SNR Signal-to-noise ratio
STS Spring Tool Suite
SQL Structured Query Language
UHF Ultra-high frequency
UDP User Datagram Protocol
UID Unique Identification Number
xiv

URI Uniform Resource Identifier
Wi-Fi Wireless Fidelity
WLAN Wireless Local Area Network
XML Extensible Markup Language
xv

xvi

1Introduction
Contents
1.1 Motivation . . . . . . . . . . . . . . . . . . . . . . . . . . . . . . . . . . . . . . . . . . . 3
1.2 Problem Statement . . . . . . . . . . . . . . . . . . . . . . . . . . . . . . . . . . . . . . 4
1.3 Contributions . . . . . . . . . . . . . . . . . . . . . . . . . . . . . . . . . . . . . . . . . 5
1.4 Document Structure . . . . . . . . . . . . . . . . . . . . . . . . . . . . . . . . . . . . . . 5
1

2

Heating, Ventilating and Air-Conditioning (HVAC) systems represent 5% of the construction cost of a
facility, and it is estimated that these systems consume about 60% of the total energy in buildings, and it
is expected that this number will eventually grow in the next years [3].
HVAC systems’ temperature setpoints remain constant during the whole day, ignoring whether users
feel comfortable with the predefined temperature, or even if a certain room occupancy is low. This
leads to situations of service delivery with over heating or over cooling, resulting in excessive energy
consumption above what would eventually be needed to guarantee users thermal comfort. Conceivably,
giving users the opportunity to participate actively on HVAC systems’ temperature setpoint control it may
be possible, on one hand, to minimize excessive energy consumptions and, on other hand, to maximize
users thermal comfort. Solving such problem requires:
• Determining the occupancy of a room;
• Providing users with a way to collaboratively change the HVAC temperature setpoint;
• Providing energy consumption feedback to users; and
• Validating if the cost of a possible solution does not surpass the savings’ results.
This thesis explores the use of identification technologies such as RFID and Wi-Fi devices in the
subject of user occupancy; gamification and user behaviour transformation in virtual user interfaces for
building automation; user comfort; and energy efficiency evaluation; to describe a solution to the problem
of fine-tuning HVAC systems with user feedback.
1.1 Motivation
Consider a scenario inside a University Campus where a large lecture room is occupied by many dif-
ferent groups of students from 8 AM to 8 PM. Despite the variation of occupancy rate during the day,
HVAC systems must be kept running to maintain air quality inside the room. Therefore, as there is no
control on the room’s occupancy and users preferences regarding temperature at a certain moment in
time, HVAC systems are left providing inadequate levels of cold or hot air into the room.
Figure 1.1 depicts the relation between room temperature (Temp), HVAC set point (sp) and user
comfort. Early morning users are expecting temperatures above those defined in the HVAC temper-
ature set point. This leads to thermal discomfort due to overcooling. By midday, the temperature set
point is defined above what it would be expected, leading to room overheating and again, user thermal
discomfort. Similarly to what happens in the early morning, in the evening the temperature set point
is too low, leading again to thermal discomfort due to overcooling. If users are given the possibility to
collaboratively find and vote for the adequate temperature setpoint, there would be an improvement in
both energy savings and occupants comfort, which could be a good motivation in order to involve users
in acting actively to minimize this problem. This can be achieved by providing users with an application
3

where they could identify themselves and register their presence in the lecture room, before choos-
ing a new temperature setpoint and comfort level values in a collaborative voting user interface where
users could receive real-time feedback about the overall opinion regarding current setpoint, other users’
thermal comfort sensation and energy consumption.
Discomfort
DiscomfortOvercooling
DiscomfortOvercooling
Early morning EveningMidday
Time of day
HVAC sp
Temp
sp
occupantexpectation
Figure 1.1: Relation between room temperature (Temp), HVAC setpoint (sp) and user comfort.
1.2 Problem Statement
The problem of finding the best trade-off between occupant comfort and energy savings can be a difficult
task to solve as each person has its own level of comfort regarding environmental temperature and reacts
differently to the economical and environmental consequences of their choices in relation to energy
consumption.
Consequently, as each person is different, it is difficult to develop a system that can predict exactly the
way the temperature setpoint should be specified in order to minimize HVAC energy consumption while
maximizing occupants’ comfort. It is also not trivial to develop a solution where users’ feedback does
not interfere with their daily routine, as identifying and involving users in temperature setpoint changes
requires effort from them.
This thesis concerns the development of a system that is able to identify the occupants of a room,
in order to involve them in the process of collaboratively fine-tune HVAC operation temperature setpoint
and act automatically after learning from previous interactions by its users, so that a trade-off between
occupant comfort and energy savings can be found. This work is also focused on prototyping a User
Interface that can encourage occupants to collaboratively interact with the HVAC system, by providing
them useful feedback related to energy consumption and the effect of their actions on the system.
4

1.3 Contributions
This thesis explores user occupancy detection in order to fine-tune HVAC systems’ operation. It was
implemented a web application that empower users into collaboratively participate in the calculation of
a new temperature setpoint, by making requests to increase, decrease or keep the HVAC temperature
setpoint. The application provides views for gamification related issues, such as points and experience
levels, and it also provides statistical information where one can acknowledge other users’ participations
and requests in the platform.
The developed application uses modern technologies supporting the Model-View-Controller (MVC)
pattern, multiple devices with responsive views and simultaneous accesses from different clients, and
makes use of Radio-frequency Identification (RFID) technologies to explore user identification. More-
over, its performance was tested appropriate tolls with procedures that load test functional behavior and
measure performance, ensuring that it could handle the simultaneous user load.
Results show that one can use collaborative platforms to fine-tune HVAC operation when users’
thermal comfort sensation is similar among them, meaning that group of users with substantially different
opinions will not be able to obtain considerable benefits in both thermal comfort and energy savings.
Main contributions of this thesis are:
• A digest of user occupancy detection methods track their presence in a certain room or building;
• A summary of occupant comfort evaluation, including methods to quantify and predict the degree
of discomfort;
• A description of enhancing a service with affordances for gameful experiences; and
• The implementation of a collaborative platform using most modern technologies.
1.4 Document Structure
This document is organized in five main chapters. Chapter 2 describes background concepts required
to understand the Related Work and Solution Proposal. It introduces User Identification techniques,
describes User Interfaces for Building Automation, and presents a brief state-of-the-art for both User
Comfort and Energy Efficiency Evaluation. Moreover, Chapter 2 also dismiss our preliminary evaluation
about existing techniques in room occupancy identification, virtual interfaces and user interaction, and
energy efficiency evaluation.
Chapter 3 presents a brief overview of the solution proposal, including an overview for the main
features that the application includes, and describes the architecture on which the solution was based.
This Chapter also presents Use Cases and Use Scenarios that will help defining functional and non
requirements that the final solution should met.
5

Chapter 4 describes the implementation of the web application, considering the solution proposal
that is described in Chapter 3.
Chapter 5 describes the methodology on which system tests was based, along with two scenarios
in which both energy savings and user comfort results will be evaluated. It presents the experiments
description along with the experiments results.
Finally, Chapter 6 concludes this thesis. Limitations and future work are also included in this Chap-
ter.
6

2Related Work
Contents
2.1 HVAC Systems . . . . . . . . . . . . . . . . . . . . . . . . . . . . . . . . . . . . . . . . . 9
2.2 User Identification . . . . . . . . . . . . . . . . . . . . . . . . . . . . . . . . . . . . . . . 10
2.3 Occupant Comfort . . . . . . . . . . . . . . . . . . . . . . . . . . . . . . . . . . . . . . . 12
2.4 User Behaviour Transformation . . . . . . . . . . . . . . . . . . . . . . . . . . . . . . . 15
2.5 Gamification . . . . . . . . . . . . . . . . . . . . . . . . . . . . . . . . . . . . . . . . . . 15
2.6 Collaborative Systems . . . . . . . . . . . . . . . . . . . . . . . . . . . . . . . . . . . . 16
2.7 Virtual User Interfaces to Control Building Automation Systems . . . . . . . . . . . . 17
2.8 Energy Efficiency Evaluation . . . . . . . . . . . . . . . . . . . . . . . . . . . . . . . . 17
2.9 Discussion . . . . . . . . . . . . . . . . . . . . . . . . . . . . . . . . . . . . . . . . . . . 20
7

8

This Chapter summarizes the background concepts related to HVAC systems’ setpoint and occupant
thermal comfort. It also introduces user behaviour transformation, gamification and two user occupation
detection techniques. Moreover, it presents the related work regarding virtual interfaces, gamification,
and energy efficiency evaluation.
2.1 HVAC Systems
HVAC is an acronym for “Heating, Ventilating and Air-Conditioning” and these systems generally include
a variety of active mechanical and electrical systems employed to provide thermal control in buildings [4].
HVAC represents an important part regarding a building’s construction cost, and it is also estimated that
these systems consume about 60% of the total energy spent in buildings, and this number is likely to
grow in the future [3].
HVAC systems are designed to provide interior thermal conditions so that it is possible to maintain a
certain level of comfort for the occupants of a building. For this to be possible, these systems are able to
move the air at an adequate velocity so that both convective cooling and evaporation from the skin can
be enhanced. Nevertheless, it is not always possible to maintain occupants’ comfort just by speeding
up air velocity, requiring HVAC to be able to add or remove heat to and from building spaces. HVAC is
also responsible for providing or removing moisture from a building, and in specific applications these
systems can also have supplemental functions as controlling smoke from fires or providing background
noise for acoustic privacy [4].
2.1.1 Setpoints
Setpoint refers to a target value of a process variable - a variable that one tries to control - such as
temperature, pressure, etc..
2.1.2 Temperature setpoint
Temperature setpoint is defined as the temperature at which an HVAC system aims to keep the internal
temperature of a building at. Typically, temperature setpoints are adjusted between 21oC and 22oC in
the winter and about 23oC to 24oC in summer, but it is also typical for a building to have just one single
setpoint of 22oC [5].
HVAC temperature setpoints may need adjustment depending on prevailing outdoor and indoor load
conditions, as a mild day may require less heating whereas an unseasonably warm day may require
lowering of the thermal setpoint to provide additional cooling.
9

Reader
Antenna
Tag
Server
Figure 2.1: RFID System.
2.2 User Identification
There are various ways of identifying a user in order to track its presence in a certain room or building.
While, on the one hand, systems can make use of readers to collect data from RFID tags, which may
require interaction from user, on the other hand it is possible to collect information regarding users’
presence by collecting information about users’ devices Media Access Control (MAC) addresses.
2.2.1 RFID
RFID technology is being used for electromagnetic transmission for more than 50 years [6]. More re-
cently, it started being used to store and receive data [7]. An RFID system has three basic components:
tags, readers with antennas, and servers [8]. Figure 2.1 depicts an RFID System containing one RFID
tag, one reader with an antenna, and one server that receives and processes captured data.
RFID tags are simple devices containing a microchip and an internal antenna, which stores their ID
and retrieves it when requested. They can be classified by active or passive, according to their power
source [9]. RFID active tags require a power source (such as an integrated battery), while RFID passive
tags do not, as they just backscatter the carrier signal received from a reader [8]. Internal batteries allow
active tags to increase the range of the signal, while adding processing capacities and more available
memory [10]. Passive tags are activated by the electromagnetic energy the reader emits, which leads
to shorter read ranges and storage capacities [10]. As local power source limit tags’ lifetime to 5 to 10
years, there is a third type of tags called Battery-assisted passive tags (BAP) (or Semi-passive tags)
which only resort to an external power supply when there is a reader in the tag’s range [9].
10

Data stored in RFID tags is read from and written to with an RFID reader. This reader has a
transceiver 1 and an antenna, and it transfers tag’s data to and from the RFID server. RFID read-
ers’ antennas establishes the communication between tags and the transceiver. While larger antennas
cover wider areas, they also decrease Signal-to-noise ratio (SNR) - the measure of signal strength rela-
tive to background noise - at the same time. RFID systems work in a wide range of frequencies, such as
Low frequency (LF), High frequency (HF), Ultra-high frequency (UHF), Super-high frequency (SHF) and
Microwave (MW). UHF passive tags are the most used, as they are the most inexpensive ones while
having a significant read range [9].
Readers include two interfaces: the first one is an RF interface which reads the data from the RFID
tag; and the second one is a communication interface, such as IEEE 802.11, which is responsible for
communicating with the servers [9].
Servers are network computers running instances of applications that receive and process data
information transmitted from readers [8].
The Electronic Product Code (EPC) standards are the most relevant RFID standards in use [11]. The
EPC code provides a unique identifier for each tag.
According to literature, RFID systems’ main advantages are low cost and long lifetime of passive
tags; simultaneous and fast reading of multiple tags; fast response time; and ability to work under harsh
environmental conditions (as they face no problems regarding noise or light) [8,10].
2.2.2 User identification using Smart Cards
Building access control systems make use of smart cards to automatically identify which users have
access to a certain facility. Users are given a plastic card containing an RFID tag which may contain
just an unique identifier or more detailed information about its owner. These identifier systems can be
categorized in whether online and offline systems [12].
Online systems [12] are those whose information is stored in a database at a (centralized) server.
Card readers are connected to the centralized server via a network connection, which can be wired or
wireless. Each terminal reader access the smart card storage containing the RFID tag Unique Identifi-
cation Number (UID) and communicate with the server providing or receiving information from them.
Offline systems [12] contain all information about existing smart cards UID, and therefore no cen-
tralized server is needed. All relevant information is stored in the smart card RFID tag, and is validating
comparing the smart card’s UID with those present in the reader.
1TRANSmitter reCEIVER - a device comprising both a transmitter and a receiver
11
2.2.3 IEEE 802.11 Wi-Fi
IEEE2 802.11, often referred to just as Wi-Fi, is a communication protocol standard for Wireless Local
Area Network (WLAN) [13, 14]. IEEE 802.11 supports wireless communications within a short range
(up to 100 meters) with low power consumption (up to 100 milliwatts) [13], enabling fixed and mobile
devices to connect to a Access Point (AP), which provides them wireless access to the Internet.
Each device include its own MAC Address, which is an unique identifier that distinguishes it from all
other devices connected to the AP. A MAC Address can be represented in a 48-bit number in binary or
hexadecimal. Its representation has been defined in International Organization for Standardization (ISO)
IEEE 10039 (Local Area Network (LAN) MAC Service Definition) [15].
One example of a MAC Address is AC-DE-48-00-00-80 (hexadecimal representation) and 0001 0101
0111 1011 0001 0010 0000 0000 0000 0000 0000 0001 (binary representation). Since this address is
unique, and is used for all network communications, it can be used to identify the device.
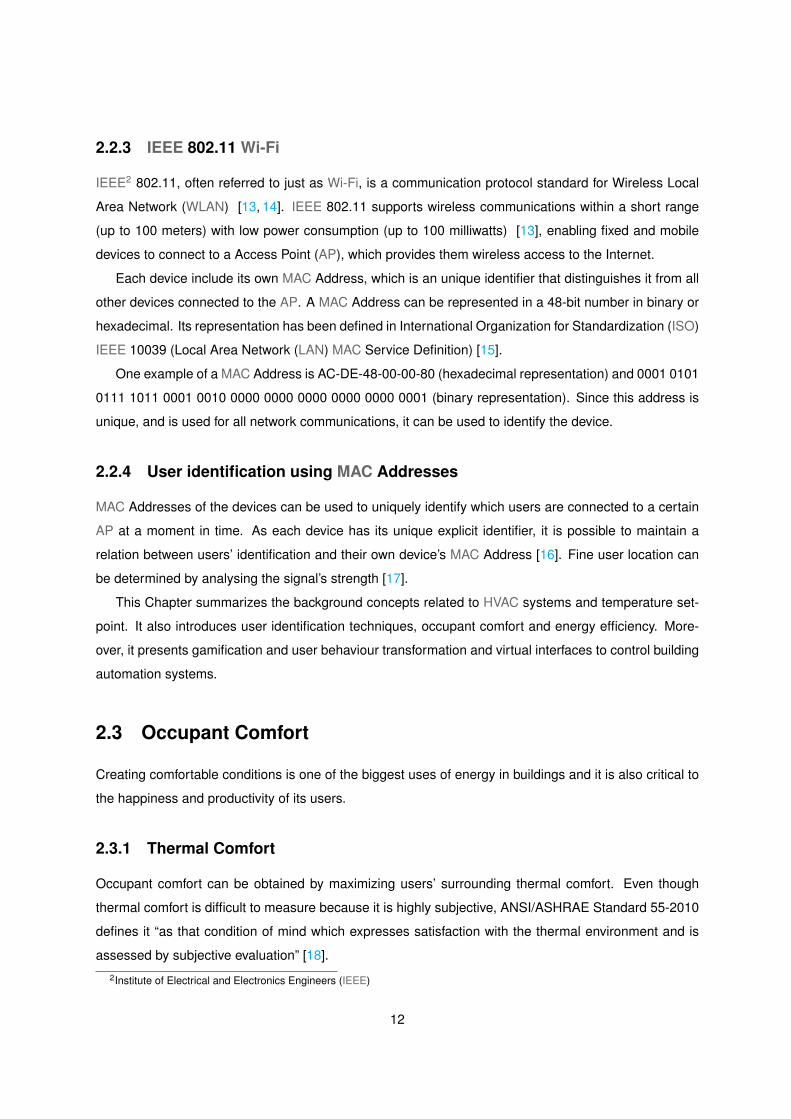
2.2.4 User identification using MAC Addresses
MAC Addresses of the devices can be used to uniquely identify which users are connected to a certain
AP at a moment in time. As each device has its unique explicit identifier, it is possible to maintain a
relation between users’ identification and their own device’s MAC Address [16]. Fine user location can
be determined by analysing the signal’s strength [17].
This Chapter summarizes the background concepts related to HVAC systems and temperature set-
point. It also introduces user identification techniques, occupant comfort and energy efficiency. More-
over, it presents gamification and user behaviour transformation and virtual interfaces to control building
automation systems.
2.3 Occupant Comfort
Creating comfortable conditions is one of the biggest uses of energy in buildings and it is also critical to
the happiness and productivity of its users.
2.3.1 Thermal Comfort
Occupant comfort can be obtained by maximizing users’ surrounding thermal comfort. Even though
thermal comfort is difficult to measure because it is highly subjective, ANSI/ASHRAE Standard 55-2010
defines it “as that condition of mind which expresses satisfaction with the thermal environment and is
assessed by subjective evaluation” [18].
2Institute of Electrical and Electronics Engineers (IEEE)
12

Thermal comfort takes in consideration 1) metabolic rate: the energy generated from the human
body; 2) clothing insulation: the amount of thermal insulation the person is wearing; 3) air temperature:
temperature of the air surrounding the occupant; 4) radiant temperature: the weighted average of all
the temperatures from surfaces surrounding an occupant; 5) air velocity: rate of air movement given
distance over time; and 6) relative humidity: percentage of water vapor in the air [18].
2.3.2 Occupant Comfort Evaluation
The American Society of Heating, Refrigeration and Air-Conditioning Engineers (ASHRAE) defines ther-
mal comfort as “the condition of mind which expresses satisfaction with the thermal environment” [19].
Even though “feeling comfortable is very subjective in nature and cannot be defined objectively” [20],
comfort conditions can be expressed in four controllable physical parameters factors that constitute
the thermal environment: 1) air temperature; 2) mean radiant temperature; 3) relative air velocity; and
4) vapour pressure in ambient air. Research also shows that thermal comfort sensation is also influenced
by 5) activity level (internal heat production of the body); and 6) thermal resistance of clothing [21].
While one may try to control these physical parameters, as each person is different, it might be
difficult to maximize the thermal comfort sensation for all individuals of a group of people exposed to
the same room climate. The optimal condition is then met when the highest possible percentage of the
group is feeling thermally comfortable [21].
2.3.3 Predicted Mean Vote (PMV)
Thermal comfort in buildings is a difficult concept to define properly. Literature states that a large number
of thermal comfort indices have been established for indoor climate analysis [22]. One of these indices,
and probably the most widely used for assessing moderate indoor thermal environment [23] is Predicted
Mean Vote (PMV). It is based on the heat balance of the human body [24], and it considers environ-
mental variables and individuals factors. The human being is in thermal balance when the internal heat
production in the body is equal to the loss of heat to the environment. The person’s body thermoregu-
latory system will automatically try to modify the skin temperature and the sweat secretion to maintain
heat balance [24].
PMV quantifies the degree of discomfort, and predicts the comfort vote on the ASHRAE seven-
point thermal sensation scale [23], where the closer to zero, the better the occupants’ thermal comfort
sensation is [22].
PMV is based on a theoretical model combined with the results from experiments with approximately
1300 subjects [21]. ASHRAE recommends a value between -0.5 and 0.5 for an interior space.
Fanger’s thermal comfort model [21] is used to calculate PMV in the following equation
13
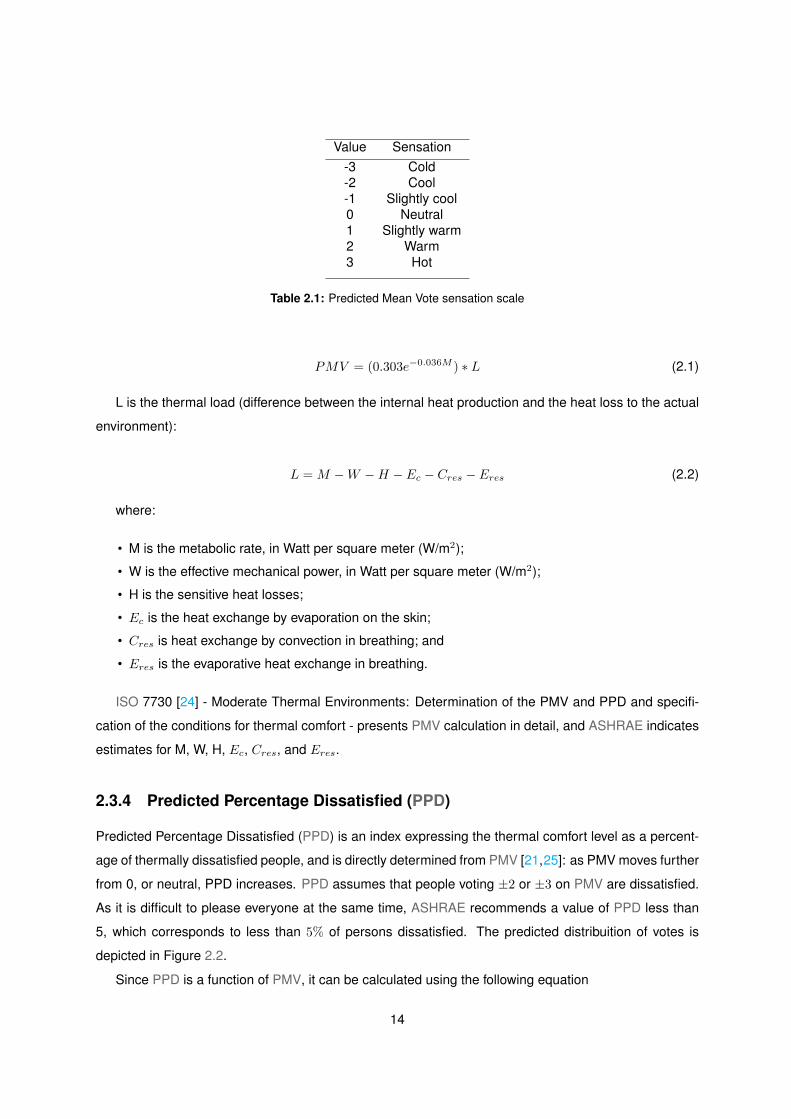
Value Sensation-3 Cold-2 Cool-1 Slightly cool0 Neutral1 Slightly warm2 Warm3 Hot
Table 2.1: Predicted Mean Vote sensation scale
PMV = (0.303e−0.036M ) ∗ L (2.1)
L is the thermal load (difference between the internal heat production and the heat loss to the actual
environment):
L = M −W −H − Ec − Cres − Eres (2.2)
where:
• M is the metabolic rate, in Watt per square meter (W/m2);
• W is the effective mechanical power, in Watt per square meter (W/m2);
• H is the sensitive heat losses;
• Ec is the heat exchange by evaporation on the skin;
• Cres is heat exchange by convection in breathing; and
• Eres is the evaporative heat exchange in breathing.
ISO 7730 [24] - Moderate Thermal Environments: Determination of the PMV and PPD and specifi-
cation of the conditions for thermal comfort - presents PMV calculation in detail, and ASHRAE indicates
estimates for M, W, H, Ec, Cres, and Eres.
2.3.4 Predicted Percentage Dissatisfied (PPD)
Predicted Percentage Dissatisfied (PPD) is an index expressing the thermal comfort level as a percent-
age of thermally dissatisfied people, and is directly determined from PMV [21,25]: as PMV moves further
from 0, or neutral, PPD increases. PPD assumes that people voting ±2 or ±3 on PMV are dissatisfied.
As it is difficult to please everyone at the same time, ASHRAE recommends a value of PPD less than
5, which corresponds to less than 5% of persons dissatisfied. The predicted distribuition of votes is
depicted in Figure 2.2.
Since PPD is a function of PMV, it can be calculated using the following equation
14

0 0,5 1,0 1,5 2,0-0,5-1,0-1,5-2,0
6
8
10
20
30
40
60
80
PPD
PMV4
Figure 2.2: PPD as a function of the PMV.
PPD = 100− 95e−(0.03353PMV 4+0.2179PMV 2) (2.3)
2.4 User Behaviour Transformation
Users can be involved in the process of energy savings. Saving energy through a user behaviour
change, by educating and motivating them, is called “User Behaviour Transformation” [26].
Users may become motivated to participate in the process of energy savings if they are capable of
understanding the impact of this issue on financial and operational sustainability (financial concerns)
and the impact of the energy use in the environment (environmental concerns). The users’ opinion may
be asked to find what they think can be done to solve this energy use issue and if that solution will impact
energy use in a positive manner, motivating them to the importance of their participation. Users may
also reflect on what will their peers think of their behaviour, which will influence their future actions [26].
2.5 Gamification
Gamification refers to “a process of enhancing a service with affordances for gameful experiences in
order to support users’ overall value creation” [27]. It can be also defined as “the use of game design
elements in non-game contexts” [28]. This concept was introduced by Brett Terill in his personal blog
in 2008 [27], but its use only became widespread on the second half of 2010 [28]. The interest on this
subject has been growing year after year, and the number of papers published on Gamification is also
increasing since then, as surveyed by Hamari [29].
A software service based on Gamification typically includes a software service layer of reward and
reputation services with points, badges, levels and leader boards [28], which are referred in the literature
15

as “elements of games”. Accordingly to the “Challenges For Game Designers” [30] book, these game
elements can also include [28]:
• Self-representation with avatars: having a virtual identity, where avatars serve as the usual repre-
sentation of users [31,32];
• Three-dimensional (3D) environments: virtual reality where users move and interact in simulated
3D spaces;
• Narrative context: the descriptions of traits and sequences of events [33];
• Feedback: how well the user is doing in the game [34];
• Reputations: trustworthiness of users [35]; ranks, and levels: overall progress of the user [34];
• Marketplaces and economies: where goods are transacted;
• Competition under rules that are explicit and enforced;
• Teams: players who work together and help each other [36];
• Parallel communication systems that can be easily configured; and
• Time pressure: motivation to achieve a goal in a certain amount of time [34].
One example of a widely used gamified application is Foursquare, which is designed “to turn life
into a game by rewarding people with mayor-ships and badges for going to physical locations” [37].
Foursquare “is designed to influence individuals’ behaviors by adding digital gaming elements to physical
space” [37].
2.6 Collaborative Systems
A collaborative system is one where multiple users or agents engage in a shared activity, usually from
remote locations. Potential users of this kind of platforms interact with each other in order to share
information between them or requesting an action from a service provided to several people at the
same time. Normally collaborative systems are concurrent, but there is no need for users to coordinate
between themselves in order to accomplish their goal [38].
Usually, collaborative platforms involve a single mediator, which is commonly known as the server,
and this entity provides one or more services to multiple collaborators, known as clients [38]. These
collaborative platforms can be classified into centralized or replicated : while on the first ones the shared
application is maintained in a single physical location, on the second ones each and every single user
has an instance of the platform deployed on its own device, and these instances have to be synchronized
between all users’ instances in order to guarantee consistency between all of them [39].
16

2.7 Virtual User Interfaces to Control Building Automation Sys-
tems
The first Building Automation Systems (BAS) was patented back in 1895 by Warren Johnson when the
first temperature system was invented [40]. Johnson invented an electric tele-thermoscopes which has
been installed in university classrooms to help keep students more comfortable [41], and ending hourly
interruptions from the janitor to check for the rooms’ temperature [42].
Home Automation User Interface
“Home Automation Contextual User Interface” is an example of one patented type of Virtual User
Interfaces to Control Building Automation Systems. Accordingly to the patent, it describes a “human
interface to a controlled system that abstracts the human interface organization from the physical inter-
connection to the controlled devices” [43]. These interfaces enable users to control lighting, heating, air
conditioning, pool heating and other appliances in their homes or offices on a single interactive interface,
and are build on top of already existing controlled devices for managing home automation [43].
Mechanisms available to interact with the user interface include both mechanisms for presenting in-
formation and for receiving user input. The former includes visual displays and audio output systems,
while the latter includes touch screen input, mouse and other pointing devices, microphones and cam-
eras [43]. Even though these mechanisms were classified as input or output, screen elements can
simultaneously display information (such as temperature, sound or light level) and be actuators, sending
messages that change the state of some home system (for example, a thermostat or a light subsys-
tem) [43]. This patented interface also refers that output information should be displayed in a graphical
rather than textual form, and it also states that input elements should provide several ways of performing
the same task, as it “increases the usability and often the functionality of the human interface” [43].
2.8 Energy Efficiency Evaluation
It is important to measure and evaluate energy savings to determine if an energy saving project imple-
mentation is producing the expected savings results. It is possible to quantify energy savings measuring
its use before and after the implementation of an energy saving project [44, 45]. Efficiency impacts are
estimated considering the difference between a) what energy consumption would have occurred if the
efficiency measures have not been installed and b) actual energy consumption after efficiency measures
are installed (baseline, also referred as Business-As-Usual (BAU) energy use) [1].
17

Time
EnergytUset(KWh)
JanuaryYeart1
JulyYeart1
JanuaryYeart2
JulyYeart2
JanuaryYeart3
JulyYeart3
JanuaryYeart4
250tK
500tK
750tK
1000tK
Actual
Baseline
Implementation
Figure 2.3: Energy savings after implementing an energy saving project (adapted from EPA [1]).
A formula to calculate energy savings based on the definition presented above is
EnergySavings = BaselineEnergyUse− PostInstallationEnergyUse±BaselineAdjustments (2.4)
Baseline adjustments included in the formula above are defined as unexpected or one-time changes
that occur and may require non-routine adjustments [45]. These adjustments, which may be negative
or positive include 1) changes in the amount of space being heated or air conditioned, 2) changes
in the amount or use of equipment, 3) changes in environmental conditions (lighting levels, set point
temperatures, etc.), and 4) changes in occupancy, schedule or throughput [45].
Figure 2.3 depicts the energy savings after implementing an energy saving project. Implementation
of one energy saving project is started in January Year 3, and energy savings are identified by the gray
area (Baseline - Actual ± Adjustments).
Planning an energy efficiency evaluation approach
The United States Environmental Protection Agency (EPA) defined an energy impact evaluation
which involves the following steps [1]:
1) Defining of the evaluation objectives regarding the energy savings goals;
2) Selecting an evaluation approach;
3) Implementing the evaluation plan; and
4) Reporting the evaluation results.
EPA defines two evaluation approaches for estimating energy and demand savings. These ap-
proaches are 1) Deemed Saving Approach (DSA) and 2) Measured Savings Approach (MSA) [1].
18
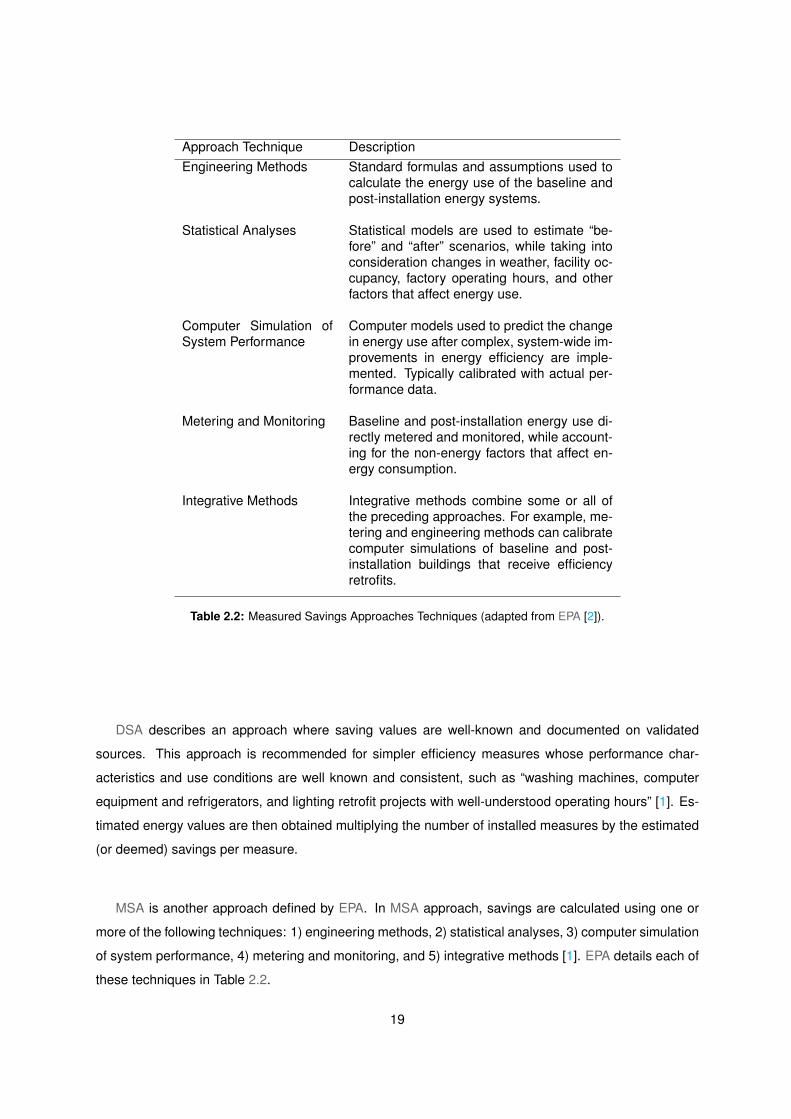
Approach Technique DescriptionEngineering Methods Standard formulas and assumptions used to
calculate the energy use of the baseline andpost-installation energy systems.
Statistical Analyses Statistical models are used to estimate “be-fore” and “after” scenarios, while taking intoconsideration changes in weather, facility oc-cupancy, factory operating hours, and otherfactors that affect energy use.
Computer Simulation ofSystem Performance
Computer models used to predict the changein energy use after complex, system-wide im-provements in energy efficiency are imple-mented. Typically calibrated with actual per-formance data.
Metering and Monitoring Baseline and post-installation energy use di-rectly metered and monitored, while account-ing for the non-energy factors that affect en-ergy consumption.
Integrative Methods Integrative methods combine some or all ofthe preceding approaches. For example, me-tering and engineering methods can calibratecomputer simulations of baseline and post-installation buildings that receive efficiencyretrofits.
Table 2.2: Measured Savings Approaches Techniques (adapted from EPA [2]).
DSA describes an approach where saving values are well-known and documented on validated
sources. This approach is recommended for simpler efficiency measures whose performance char-
acteristics and use conditions are well known and consistent, such as “washing machines, computer
equipment and refrigerators, and lighting retrofit projects with well-understood operating hours” [1]. Es-
timated energy values are then obtained multiplying the number of installed measures by the estimated
(or deemed) savings per measure.
MSA is another approach defined by EPA. In MSA approach, savings are calculated using one or
more of the following techniques: 1) engineering methods, 2) statistical analyses, 3) computer simulation
of system performance, 4) metering and monitoring, and 5) integrative methods [1]. EPA details each of
these techniques in Table 2.2.
19

2.9 Discussion
2.9.1 Identifying users
Literature describes several ways of identifying entities. Using RFID tags on smart cards and listing
connected Wi-Fi devices to AP are two solutions which will enable user identification on the context of
the problem described in this document. While, on the one hand, some users may just want to use RFID
smart cards, others will prefer to be identified with something that they already use in their daily life, such
as their Wi-Fi devices. Nevertheless, users can also be given the possibility to use both RFID and Wi-Fi
identification systems, as these systems can complement each other.
While the first solution based on RFID tags requires effort from the involved users, as it is necessary
that each one of them have a proactive attitude on his own identification by presenting a smart card on an
RFID reader on entering and exiting a room, the second solution can be seen as more user-friendly, as
registered users only have to maintain their Wi-Fi devices connected so that the identification system can
detect their presence and register them as active users. Detecting users absence on Wi-Fi identification
systems is also easier to implement and execute as it is only necessary to verify if the Wi-Fi device is
connected to the access point and/or analysing its signal strength, even without requiring any feedback
from the user.
2.9.2 Virtual Interfaces and Interaction
A virtual user interface to control Building Automation Systems (BAS) enable users to control their home
devices on their own laptop computers, smart phones or tablets. Using a virtual interface on the context
of the problem presented in this document will enable users to interact with the HVAC system collabo-
ratively, as each one of them will have a virtual user interface and can give instructions to the system
independently from all the other users in the room. Having one interface for each user will also make
it possible to gamify this problem. Users can self-representate themselves on a virtual world where the
main goal is to save energy by interacting on real time with the HVAC system, and can be associated in
teams, having access to their score on real time, which can deal to changes on their behaviour.
2.9.3 Input values and feedback
The Virtual User Interface will be the bridge between the system and the user. Nowadays, current Virtual
User Interfaces are used to control BAS, and the one developed on the context of this problem will also
send feedback to the user. As one of our problem requires evaluating user comfort, users can be asked
to vote for their current comfort level and/or changing the current setpoint.
Users will then receive real-time feedback of their actions, which can include the PPD calculated
20

based on PMV or from comfort votes from all users, and energy savings related values. Energy savings
value can be included in the user interface so that users can have feedback about their actions regarding
energy use.
2.9.4 Energy efficiency evaluation
Energy efficiency evaluation approaches proposed by EPA involves four steps, which are defined in
Section 2.8. One can write these steps in the context of the problem described in this document.
1) Even though evaluation objectives regarding the energy savings goals appear to be easy to define,
the context of this problem makes it hard to materialize.
Quantitative goals might be possible to define (e.g.: one can stipulate that the system should spend
less 1/4 of the electrical energy consumption after implemented) but qualitative goals are harder to
get (e.g.: will users still feel comfortable if the HVAC system reduces its setpoint in x values?). Both
quantitative and qualitative goals might be defined, but only after some experiences one can affirm
that both goals are compatible with each other;
2) Deemed Saving Approach (DSA) best fits for “simpler efficiency measures whose performance char-
acteristics and use conditions are well known and consistent” [1]. DSA values are publicly available
for HVAC systems, which makes possible to use DSA to calculate energy savings on the context of
the present problem;
3) Implementing the evaluation plan will, of course, require the implementation of the project described
in this document; and
4) Evaluation results will enable one to analyse if the goals defined in 1) are achievable, and conclude
whether the implemented project have had success or not.
21

22

3Solution Proposal
Contents
3.1 Overview of main features . . . . . . . . . . . . . . . . . . . . . . . . . . . . . . . . . . 25
3.2 Use Cases . . . . . . . . . . . . . . . . . . . . . . . . . . . . . . . . . . . . . . . . . . . 26
3.3 Requirements . . . . . . . . . . . . . . . . . . . . . . . . . . . . . . . . . . . . . . . . . 28
3.4 Overview . . . . . . . . . . . . . . . . . . . . . . . . . . . . . . . . . . . . . . . . . . . . 30
3.5 Architecture . . . . . . . . . . . . . . . . . . . . . . . . . . . . . . . . . . . . . . . . . . 30
23

24
The present Chapter describes the solution proposal that was defined considering both the concepts and
the related work that is presented in Chapter 2. It provides an overview on the main features that the
final application should meet, and it also describes use cases and use scenarios that will help defining
functional and non functional requirements for the application. Lastly, this Chapter includes a description
on the architecture overview.
3.1 Overview of main features
Developing a collaborative Graphical User Interface (GUI) for Building Automation Systems (BAS) re-
quires the definition of a solution that allows users to interact with those systems without interfering
substantially with their daily activities. This issue leads to the necessity of defining the main features
which should be included in the solution, and considering the main use cases for the domain of the
problem. Finally, it is possible to describe formally both Functional Requirements (FRs) and Non Func-
tional Requirements (NFRs) that the final solution should meet. After finding these requirements, one
can define a preliminary high level system architecture for the solution proposal.
As it is intended to develop an application for collaboratively calculate a new temperature setpoint, it
is mandatory that users can access and interact with the application with the least effort as possible and
with the devices they usually carry on their daily life. This requires that the final solution should provide
support for laptop computers, tablets and smart phones. Nevertheless, even though these devices’
interaction methods differ from each other, it is important that the application usage remains similar for
each one of them, minimizing user’s effort in recognizing interaction elements [46].
One way to develop applications that can be run in different platforms is called responsive web.
Responsive web applications provide optimal viewing experience across a wide range of devices, with
a minimum of resizing, panning, and scrolling [47]. Implementing a responsive web application allows
the same view to be rendered correctly in all compatible devices without the need to code different
applications for each platform.
Considering that the application main goal is to provide a BAS interface for controlling the HVAC sys-
tem, the interaction must be simple. Users will make requests for increasing, decreasing, and possibly
keeping the temperature setpoint, whose action must be kept as simple as possible. The web applica-
tion should then provide press and release buttons similar to the ones that can be found in the physical
world. This idea of using the HVAC remote control metaphor to make requests to the application will
ease users’ getting started into the interface [48], as users will easily understand that they can use these
buttons like they use a simple HVAC remote control.
Apart from the main goal of providing a BAS interface, this system will be used as a gamification
portal for users’ participations in the HVAC setpoint definition. Gamification implementations aim at
25

Log in
Log out
Insert username
Insert password
<<include>>
<<include>>
UserUser
Figure 3.1: Use Case for ’Authentication’
User
Make temp request
Inspect feedback
Increase
Decrease
<<include>>
<<include>>
Keep<<include>>
Inspect sp
Inspect temp
<<include>><<include>>
Figure 3.2: Use Case for ’Participation’
User
Inspect own
details
Inspect other users'
details
Inspect position
Inspect points
Inspect level
<<include>>
<<include>>
<<include>>
Figure 3.3: Use Case for ’Gamification’
User
Inspect online users
Inspect interactions
Inspect keep
requests
Inspect decrease requests
<<include>>
<<include>>
Inspect increase requests
<<include>>
Figure 3.4: Use Case for ’Statistics’
engaging users participating at a certain activity [27]. For this to be possible, it is necessary to provide
feedback to users related to their actions, rewarding their effort in using the application, and providing a
view there they can inspect not only their own rating but also compare themselves with other users’ in
the game.
Finally, the application must provide a statistical view where users can inspect other users’ requests
at different moments in time.
3.2 Use Cases
After the analysis of the main features that the system should provide, it is possible to define use cases
to describe the interactions with the application. Four use cases are present in Figures 3.1 to 3.4, and
six use scenarios with several variances are described below. These will help defining both FRs and
NFRs that the web application implementation should follow so that a valid and fully working solution is
obtained.
Figure 3.1 depicts a use case where one user logs in and logs out in the system with a valid pair of
username and password. Figure 3.2 shows a use case where a new temperature setpoint request is
26
made: users can request an increase, a decrease or a maintenance of the HVAC’s temperature setpoint,
or inspect the current temperature and setpoint. Figure 3.3 describes the gamification use case where
users are able to inspect details about the gamified information of the application, such as points, levels
and position in a leaderboard. Finally, Figure 3.4 illustrates how users can inspect statistical information
in the application, such as the number of users currently using the application and requests details.
3.2.1 Scenario 1: Alice
Alice arrives to a room where it is possible to use the application. She identifies herself in the system,
and her entrance in the room is registered.
Alice has three different communication devices with her: laptop, smart phone, or tablet, to interact
with the application. As Alice needs to take some notes on her laptop, she decides that she will use her
computer to interact with the application. Then she logs in the application with her valid username and
password. Even though Alice is comfortable, she recalls that every single participation in the application
is rewarded. She decides to make a participation, requesting that the setpoint remains the same.
At the end of the day, Alice logs out the application and shuts down her laptop.
3.2.2 Scenario 2: Bob
Bob arrives to a room where it is possible to use the application. He identifies himself in the system,
and his entrance in the room is registered.
Bob is not comfortable with the temperature in the room, but he cannot make a new temperature
setpoint request because he does not any of his devices with him. As Bob interacts with the application
regularly, the system had already registered his temperature preferences, and because his entrance
in the room is registered, and Bob had not made a participation in the last moments, the system will
consider Bob’s previous requests when a new temperature calculation will be done.
3.2.3 Scenario 3: Carol
Carol arrives to a room where it is possible to use the application, and she wants to see how many
participations have been done for the last 10 minutes. She logs in the application with her valid username
and password, and inspects the statistics web page.
3.2.4 Scenario 4: Dave
Dave arrives to a room where it is possible to use the application. He identifies himself in the system,
and his entrance in the room is registered.
27

Dave logs in the application with his valid username and password, and makes a participation for
decreasing the temperature. One minute later, Dan makes another request to decrease the temperature,
but the application informs Dave that he has to wait some more minutes before participating again.
3.2.5 Scenario 5: Eve
Eve wants to check her gamification profile: she logs in the application with her valid username
and password. She requests the gamification page, and sees that Alice is 4 places behind her in the
leaderboard. Eve decides to participate in the system.
3.2.6 Scenario 6: Faith
Faith arrives to a room where it is possible to use the application. As Faith is waiting for an important
email, so she logs in the application while waiting for it to arrive. Faith is not comfortable with the
temperature in the room, and decides to request an increase of the temperature setpoint. As she did
not identified herself in the system, her entrance in the room was not registered. The application informs
Faith that she cannot participate.
3.3 Requirements
3.3.1 Functional Requirements
FRs define the intended behaviour of the system. For the HVAC temperature setpoint calculation
application, fourteen FRs can be described as follows:
FRs for User interface module
1) The system must provide a log in page for users to authenticate in the application; and
2) The system must provide a log out option for users to leave the application.
FRs for Identification and Information module
1) The information about users’ details must be stored.
FRs for Information module
1) The information about users’ participation details must be stored;
2) The system must have information about temperature and setpoint variables;
3) The system must calculate a new setpoint accordingly to users’ requests;
4) The system must calculate a new setpoint accordingly to users’ preferences;
5) The system must request a new setpoint accordingly to both users’ requests and preferences;
28

6) The system must identity which users are present in the room;
7) The system must identity which users are authorized to interact with the system;
8) The system must decide when has a user probably left the room;
9) The system must reward users’ participations;
10) The system must assign rewards upon users’ participations; and
11) The system must calculate statistics upon users’ participations.
3.3.2 Non Functional Requirements
NFRs describe not what the system will do, but how it will do it. They address important issues of
quality for software systems. Sixteen NFRs can be found for the HVAC temperature setpoint calculation
application:
NFRs for User interface module
1) The system’s interface must be easily accessible from users’ devices;
2) The system must provide comprehensive feedback;
3) The system’s learning curve must be shallow (faster and easier learning);
4) The system’s interface must be responsive to users’ devices;
5) The system must provide feedback after a user has requested one action;
6) The system must provide information about users’ rewards; and
7) The system must provide information about interactions’ statistics.
NFRs for Information module
1) The system must answer all users’ requests;
2) The system must accept only valid requests;
3) The system must handle log in requests with security;
4) The system must guarantee user data integrity;
5) The system must be available 24 hours/day; and
6) The system must reject interactions from unauthorized users.
NFRs for Identification and Information module
1) The system must not expose user’s private information.
NFRs for all modules
1) The system must handle requests in a timely manner; and
2) The system must not consume more resources than the savings it produces.
29

3.4 Overview
Our solution proposal can be divided in four main modules, where each module will solve part of the
problem described in this document.
• The first module refers to the identification problem and will be used to get information about the
users’ presence in the room. This module will provide information about who and how many users
will interact with the HVAC system at a certain moment in time.
• The second module will be used to store information about users and their preferences. It will store
a log about both previous and present users and their interaction with the HVAC system, regarding
both setpoint definition and temperature comfort level. It will also store temperature and energy
consumption levels, and compute PMV and PPD values.
• The third module relates to user interface and will explore both input and output mechanisms to
get information into and from the HVAC system. It will also explore issues regarding gamification
and user behaviour transform.
• Lastly, a fourth module will be the bridge between the first three modules described and the HVAC
system. It will set the current setpoint at the HVAC system and receive information about temper-
ature and energy consumption.
3.5 Architecture
The architecture of this system will be based on the four modules described in Section 3.4 and depicted
in Figure 3.5: users will interact with both Identification and User Interface modules, while Identification,
Information and User Interface Modules will interact with each other using the Bridge Module. Bridge
module will also be responsible to send requests to and receive information from the HVAC system.
• Identification module will be made of three main submodules: the RFID identification, Wi-Fi
identification, and identification server.
The RFID submodule will have an RFID tag reader, which will contain a wired or wireless interface
to communicate with the identification server, which will be described later in this subsection.
Readers will read information collected from RFID tags that can be incorporated in smart cards
(containing passive tags) or other devices (containing active tags), and can also write information
on tags if necessary. For the sake of simplification and cost savings, only passive RFID tags will be
used, but it would be possible to extend this module to read from and/or write to active RFID tags,
or even both, if necessary. The compliance with EPC standards will ease this future extension.
30

Bridge module
Identificationmodule
Informationmodule
User Interfacemodule
User
HVACsystem
Figure 3.5: Architecture of the system.
The Wi-Fi submodule will be made of APs to which users’ mobile devices will connect to. These
APs will send information regarding connected MAC addresses of the devices to the identification
server module, which will be in charge of mapping MAC addresses to users.
Finally, the identification server submodule will be made of a single computer that will act as a
server. This server will collect information about user identification provided by both RFID and
Wi-Fi submodules, and will contain a database where previous and current users’ identification
information is stored.
• Information module will contain a database where users’ information is stored. It is a different
entity from the user identification database in the identification module presented above, because it
stores user detailed information, such as previous temperature setpoint votes and other information
related to the gamification implementation. It will also be responsible for calculating PMV and PPD
values. Information module must provide an interface for system administration.
• User interface module will explore the GUI where users will interact with the system. Users will
31

provide input information - temperature setpoint, comfort level, etc. - and receive output informa-
tion - current temperature, PMV and PPD, gamification related information, etc. - on the virtual
interface. As it is expected that users will access this interface via different devices, such as laptop
computers, smart phones and tablets, the user interface layout will have to be adaptive, and so it
is predictable that a web application fits best on this module requirement. While gamification data
will be managed and stored by the information module, the user interface module will display all
information regarding the gamification process.
• Bridge module will be made of a single server or process that collects information from all modules
and provides wired and/or wireless interfaces that all modules can use to communicate with each
other. This module will also be responsible to exchange data to and from the HVAC system.
32

4Implementation
Contents
4.1 Web Application Framework . . . . . . . . . . . . . . . . . . . . . . . . . . . . . . . . . 35
4.2 Development environment . . . . . . . . . . . . . . . . . . . . . . . . . . . . . . . . . . 38
4.3 Database Management System . . . . . . . . . . . . . . . . . . . . . . . . . . . . . . . 39
4.4 Algorithms . . . . . . . . . . . . . . . . . . . . . . . . . . . . . . . . . . . . . . . . . . . 41
33

34

The present Chapter describes the implementation of the web application, considering the solution pro-
posal that is described in Chapter 3. Section 4.1 presents the Web application framework that was used.
Section 4.2 introduces the development environment on which the application development was made.
Section 4.3 describes the Database Management System used to save information about the application
entities, and finally Section 4.4 makes a description about all the algorithms that were implemented in
the web application.
As it was intended to develop an application that could be used in different type of devices – such
as computers, smart phones and tablets – and considering that it should take from users the less effort
possible into deploying the application to their own devices, it was establish that best solution that fulfils
these constrains was a web application. Web applications only require a browser and an Internet/Intranet
connection to work, meaning that users will not need to install any software in their devices so that they
can use the application’s resources. Moreover, as it is possible to develop responsive web applications,
the developer only needs to implement one adaptive layout that all views will be able to render in different
devices.
4.1 Web Application Framework
Spring Framework is a Java platform that provides comprehensive infrastructure support for developing
Java applications [49]. It provides a MVC architecture based on Smalltalk-80 [50] MVC architecture. In
the MVC paradigm, user input, business layer and visual feedback are explicitly separated and handled
by three different entities: the model, the view, and the controller [50]. The following subsections describe
the implementation of these three entities in detail.
4.1.1 Model
The application domain defined for the web application includes nine entities. These entities are:
BaseEntity; Gamification; NamedEntity; Participation; ParticipationType; Person; GamificationLevel;
User; and UserDAO.
• The base entity from which all domain entities extend from is the BaseEntity. Its attributes include
an Integer id : a primary key for database entities, and a Boolean value isNew : an attribute for
Hibernate persistence related methods;
• Person represents an entity that contains information commonly related to Human beings. Such
information comprises a String containing the first name, and a String containing last name;
• User entity extends Person. It includes: a String for the username; a String for the email address;
a DateTime for the last participation timestamp; a String online related to the presence of the user
35

in the room; a Gamification profile where game attributes are stored; and a Set of participations
containing all participation entities related to the user. This entity also defines a set method setDAO
for initializing this entity from a related Data Access Object (DAO): UserDAO;
• Just like User entity, UserDAO entity extends Person. UserDAO abstracts the retrieve of User
objects from the database [51]. Its attributes are the same as for the User entity, except for the
Gamification attribute and Participations Set, which do not exist.
• A NamedEntity contains a String with the name of the entity. Entities which are only characterised
by their name extend from this entity;
• Participation entity extends BasedEntity. This entity represents a Participation created by one
user. It includes: the user that created the participation; a DateTime for the participation times-
tamp; a String for the period in time when the participation has been done; an Integer for the
temperature setpoint ; and the participation type.
• ParticipationType entity extends from NamedEntity. It names a participation,
• Gamification entity characterizes users’ gamification profile. It includes information about the user
from to whom the profile belongs to, their respective points and level, and
• GamificationLevel entity extends from NamedEntity. It names a gamification profile after its score.
4.1.2 View
Like it was described in Section 2.7, a GUI for BAS must provide mechanisms to interact with the user
interface, such as presenting information to its end user as well as interfaces for receiving user input.
The Spring Framework allows the development of web applications using JavaServer Pages (JSP).
Using JSP one can develop a web page with both static and dynamic components, as it provides an
expression language for accessing server-side objects [52]. These characteristics make it possible
to develop a web application that meets the requirements of a GUI for BAS. Moreover, as the web
application must be compatible with several types of devices, like laptop computers, tablets and smart
phones, views must be responsive and adapt themselves to the display size of the users’ devices.
This behaviour can be obtained by using Bootstrap Framework, which combines HyperText Markup
Language (HTML), Cascading Style Sheets (CSS) and JavaScript to develop responsive, mobile-first
web pages [53].
Simultaneously with the implementation of the Controllers, whose description is done in Section 4.1.3,
the outlook of the web application was designed and implemented considering its requirements. These
requirements include an authentication page, where users can identify themselves towards the system,
36

an interaction view where users can receive feedback from the system and make requests to the web
application and a statistics page where an overview of the interaction environment can be inspected. An
example of the a web view is depicted in Figure 4.1.
Figure 4.1: Web application main view
4.1.3 Controller
Right alongside with the design and coding of the application web views, it is necessary to implement the
corresponding controllers which will command both model and views accordingly to users’ requests. This
requires the implementation of ten controllers to handle mainly five issues: authorization interception;
log in and log out requests; rendering of web pages; interaction requests; and exception handlers.
The AuthInterceptorController is an interceptor handle that is responsible to verify if the user is au-
thenticated in the system. This controller is invoked each time a request is made to the web application,
intercepting the requested Uniform Resource Identifier (URI) and only allowing controllers to be invoked
if the user is authenticated in the system. This means that requests made from unauthenticated users
invoke the LoginController instead of the control requested. Right after one user is authenticated, all
requested URIs will be handled by the corresponding controller.
The LoginController is responsible for user authentication. It verifies if a certain pair of username
and password is valid, and if so, it starts an Hypertext Transfer Protocol (HTTP) session containing the
information about the authenticated user. Closely related to the LoginController, the LogoutController
is invoked each time an user requests a log out in the web application. This controller invalidates
the HTTP session, and all requests made after this will be handled by the AuthInterceptorController
presented above.
37
As the main view of the web application provides information about HVAC variables such as temper-
ature setpoint, inside temperature and outside temperature, there is the need to create a controller to
provide this information to the web view. The IndexController creates a ModelAndView object where
these information can be saved and afterwards returned to the corresponding web view. Because the
main view also provides interaction facilities, such as a voting interface for participation in the tem-
perature setpoint calculation, a TemperatureController has been implemented to handle participation
requests. TemperatureController validates the request so that only available and valid requests are
solicited to the HVAC system, accordingly to the algorithm described in 4.4.6. It also updates model
entities involved, such as the user requesting the participation and the participation itself.
Gamification information view falls back to the GamificationController in other to render the respec-
tive web page. Similarly to the IndexController, this controller creates a ModelAndView object to store
information that will be made available to the view. It includes not only the experience points and the
actual level of the authenticated user, but also similar information about all registered users, so that a
set of information can be displayed on the view.
All interactions made by users in the web application are stored and maintained in the database.
The StatsController returns a ModelAndView object containing information regarding the number of
different interactions in several periods in time. It provides history values for the last 10, 30 and 60
minutes and since the beginning of the day.
The ProfileController is a simple controller for displaying profile related information about the au-
thenticated user. Similarly, the AboutController renders a view for displaying helping information and
credits about the web application.
Lastly, a CrashController is defined to handle exceptions thrown by the application.
4.2 Development environment
The development of a web application requires making right decisions regarding the most suitable de-
velopment environment to use in order to allow programmers to easily implement the functionalities that
the application must provide to its end users, as well as choosing the programming language that best
fits the implementation of these functionalities.
As for the current application it is strictly necessary to have support for MVC functionalities, it was
decided that the Java Programming Language best fits the requirements of the application. Oracle
states in their website1 that Java is “a high-level language that can be characterized by being a simple,
object oriented, distributed, multithreaded, dynamic, architecture neutral, portable, high performance,
robust, and secure” programming language. Moreover, considering that Spring was chosen as the Web
1https://docs.oracle.com/
38

Application Framework to use, it was decided that the Integrated Development Environment (IDE) should
be Spring’s official Eclipse distribution, named as Spring Tool Suite (STS). Accordingly to its developers,
STS is “a customized all-in-one Eclipse based distribution that makes application development easy. The
tool suites provide ready-to-use combinations of language support, framework support, and runtime
support, and combine them with the existing Java, Web and Java EE tooling from Eclipse”. Spring’s
application details concerting the implemented web application are described in Section 4.1.
Right after choosing STS as the IDE for the development of the web application, it was also necessary
to choose a build tool to automate not only the compilation of the source code but also the deployment
of the web application into the web server. Apache Maven was chosen as the most appropriate build
tool considering the current project requirements. Apache Maven makes use of a Project Object Model
(POM) where all information about a project and configurations of plugins to be used during the build
process are defined in Extensible Markup Language (XML) format. Maven builds are portable to other
systems and provide explicit choices for library versions.
Finally, and considering that the web application should be deployed to a web server, Apache Tomcat
web server has revealed to be a good choice regarding the project requirements, as it can be perfectly
integrated with Apache Maven.
4.3 Database Management System
The web application manages information mainly regarding users details, as well as their voting par-
ticipations. As these entities details must be saved into a database, there is the need to choose an
adequate database management system which can be fully integrated into the web application.
MySQL is an open source database management system which employs Structured Query Lan-
guage (SQL) for accessing and processing data contained in databases. For this web application,
MySQL server defines schemas for users, participations, participation types, gamification, and gamifi-
cation levels. The attributes for each entity stored in the database are depicted in Figure 4.2.
• User entity stores information regarding the application users’ details. Such details include: istID,
username, first name, last name, email, a timestamp related to the user’s last participation, user
presence in the room, and a timestamp related to the moment that the user has entered in the
room;
• Participation entity stores information related to users’ participations for setpoint definition. Its
attributes are: a timestamp which identity when the entity was created - i.e., the timestamp of the
participation, the period in time where the participation has been done (morning, afternoon, or
night), a string stating whether the participation was made manually by the user or automatically
39

Figure 4.2: Extended Entity–Relationship (EER) Diagram for the Web Application Database.
considering their preferences, and the setpoint temperature that was set when the participation
took place;
• Participation types classify participations. Participation type can be named after three classifiers:
increase type, decrease type, and keep type participations;
• Gamification refers to the users’ gamification profile. This entity stores information about ex-
perience points, experience points obtained in the morning, experience points obtained in the
afternoon, experience points obtained at night, and user’s gamer level; and
• Gamification levels classify participations. Currently four levels of gamification are defined, as
shown in table 4.2.
Before the first time the web application is deployed, one must run the initialization script in order to
populate Participation types and Gamification levels tables with their default values. All the other tables
can and will be populated during the execution of the web application.
40

4.4 Algorithms
The development of the HVAC Controller Application (HCA) requires the implementation of several al-
gorithms which are necessary to produce the desired behaviour of the application.
These algorithms include the ones regarding user authentication, user interaction with the web appli-
cation, user room leaving routine, request interface for HVAC values, setpoint voting algorithms, setpoint
calculation algorithms, finding user preferences, and gamification related algorithms.
A detailed description of these algorithms can be found in the next sections.
4.4.1 User authentication
After deploying and starting up the application, the system awaits for user authentication so that a
detailed GUI can be displayed. Users are presented a login form where a valid pair of username and
password must be introduced so that a valid session can be started. If the input values are valid, the
user’s authentication details will be saved as attributes in the HTTP session that has been created. If
any of the input values is not valid, the login process will fail and users will be asked again for a valid
username and password.
After a successful login, users are now able to interact with the application until they signed out or
their HTTP session expires, which has been configured to happen every 90 minutes without any activity
in the application.
4.4.2 User identification using RFID
Even though all authenticated users have access to the GUI of the application, only those who are
present in the room can use the application for making new temperature setpoint requests. Users who
are present in the room identify themselves on a Arduino tag reader with any card or tag that supports
RFID. An Arduino2 is an open-source prototyping platform with easy to use hardware that includes a
programmable circuit board where software can be deployed.
When an RFID tag is detected, the Arduino’s RFID tag reader collects the 24-digit hexadecimal
code read from the tag and sends it to the identification module, using a Datagram Socket on an User
Datagram Protocol (UDP) well known port. The identification module receives such packet and validates
whether it has received a valid 24-digit hexadecimal code. Codes with less or more than 24-digit do not
correspond to a valid RFID tag code and must be discarded.
Immediately after making the hexadecimal code validation, the information module requests the
database for one user containing an equal identification code with the tag’s UID. When such user is
2https://www.arduino.cc
41

found, the user is flagged as present in the room and, from now on, one can make new temperature
setpoint requests for the next 90 minutes.
As it is described in subsection 4.4.3, after 90 minutes users are considered to have left the room,
and they are considered absent until their tag is detected again by the Arduino’s RFID tag reader.
4.4.3 User room leaving routine
The user database includes information about the timestamp related to users’ entrance in the room,
and this information is used to validate participations, as it will be described in Subsection 4.4.6. As
it is necessary to implement a mechanism that limit user participation in time, it is defined that users
leave the room 90 minutes after their entrance has been declared into the system. For each request that
needs to verify if the user is present in the room, this algorithm returns true if the difference between the
actual timestamp and the users’ entrance timestamp is less than 90 minutes (5 400 000 milliseconds).
4.4.4 User interaction
After a valid session is started, users are now able to interact with the system. The HCA is now able
to receive requests from and provide information to the authenticated user. When an HTTP request on
the root page of the application is made, the system provides a welcome page where users can confer
temperature and gamification information and make votes for participation in the set point definition
process. Participation requests will be validated accordingly to the algorithm that will be described in
4.4.6.
4.4.5 Request interface for HVAC values
The main application service stores locally all needed variables used to compute participation related
algorithms, and an interface to update these values is provided by the system. This means that it is
implemented a scheduled routine that fetches HVAC variables each 10 minutes (600 000 milliseconds)
which updates these variables into the system.
4.4.6 Setpoint voting
The algorithm for collecting setpoint votes is invoked after a user requests a participation in the web
application. Each time a user makes a vote, the algorithm verifies whether the request is valid, which
means it must be a request for an increase, a decrease or a keep temperature participation, as well as
classifies the participation accordingly to the period of the day. Division of the day by hour ir depicted in
table 4.1 All participations with invalid requests are not possible, and therefore they are ignored.
42

Day time Part of the day7 – 12 morning
13 – 19 afternoon20 – 6 night
Table 4.1: Day classification related to day time.
This algorithm also validates if a user participation can be considered regarding time constraints
and if the user is present in the room where the participation request is made. If these constraints are
verified, the algorithm registers the user vote; otherwise, as for the request validation, the participation
is ignored and the user is informed of the reason why his participation cannot be considered.
After a participation is validated, the algorithm registers the participation in both user and participation
repositories, so that it can be considered for the setpoint calculation afterwhile, as well as for building a
user preferences profile for situations in the future considering similar environments.
4.4.7 Setpoint calculation
Calculating a new setpoint requires analysing users’ participations that have been made after the last
setpoint calculation request. This means that it is necessary to count how many increase, decrease and
keep participations were made since a well-known period of time defined in the system.
The setpoint calculation algorithm starts by making three different count queries to the participation
database, which will return the number of increase, decrease and keep participations explicitly made by
the users or, as it will be described in 4.4.8, automatically calculated based on users’ preferences. As a
new setpoint calculation must return one and only one request, it is necessary to find out if it is possible
to define a new setpoint just by analysing the users’ participations. This requires that just one type of
setpoint calculation has the greater count number of participation requests. If this requirement is met, a
new setpoint calculation request is done based on the query result. On the other side, if a tie occurs, or
no participations are found in the database for a well-known period of time, no request is done and the
setpoint remains the same.
4.4.8 Finding user preferences
The setpoint calculation algorithm described in Section 4.4.7 considers both participations explicitly
made by the users or automatically calculated based on users’ preferences. This second statement
requires that it is possible to predict users’ participations with an algorithm that inspects and computes
their previous interactions with the system. Such algorithm makes sure that if a certain user has already
voted on a similar environment situation previously in the past, the system can reproduce their behaviour
automatically without the need of an explicit participation from the user.
43

This algorithm starts by querying the database for all users present in the room. After getting a list
of these users, it is necessary for the system to compute which users have already voted since the last
setpoint calculation has been done. As these users’ participations have already been considered for the
next setpoint calculation, there is no need to compute their user preferences, and therefore these users
are ignored for the current step of the algorithm.
As for the other users who have not voted for any participation since then, the algorithm starts by
querying the database for similar environment situations. Similar environment situations include those
whose part of the day (morning, afternoon, or evening) and temperature setpoint are similar to the
ones on which the user preference algorithm is computing a result. Thus, for each user, the algorithm
counts how many similar environment participations can be found in the user’s participation history and,
similarly to the algorithm described in Section 4.4.7, computes a result considering that only a setpoint
calculation result can be requested. An automatic participation for the user is then submitted to the
system and will be considered in the algorithm described in Section 4.4.7. Again, if a tie occurs, or no
similar environmental situations are not found in the user’s participation history, nothing is computed and
an automatic participation is not considered for these users.
4.4.9 Gamification
Gamification related algorithms include routines regarding experience points attribution and level defini-
tion. Each participation made by a user must be reflected in their gamification profile by rewarding their
effort into choosing a new desired temperature set point.
As it is defined that each participation gives different experience points depending on the users’
actual gamification level, the gamification algorithm for experience points attribution must first validate in
which level the participating user is. A relation between the gamification level and point attribution per
participation is described in Table 4.2.
Experience Points Points per Participation Gamification Level0 – 499 20 Level 1
500 – 9999 50 Level 2100000 – 19999 100 Level 3
200000 –∞ 5000 Level 4
Table 4.2: Relation between Experience Points and Gamification Level
After doing such validation, user gamification profile is updated with the respective obtained points,
considering not only that different gamification level provides different participation points, but also that
participations done in different times of the day provide different participation points. An afternoon
participation is more valuable that a morning or a night one, which will reflect on a bonus of 10 experience
points per participation.
44

5Evaluation
Contents
5.1 Evaluation approach for implementation . . . . . . . . . . . . . . . . . . . . . . . . . . 47
5.2 Description of the experiments . . . . . . . . . . . . . . . . . . . . . . . . . . . . . . . 48
5.3 Experiment Results . . . . . . . . . . . . . . . . . . . . . . . . . . . . . . . . . . . . . . 50
5.4 Discussion . . . . . . . . . . . . . . . . . . . . . . . . . . . . . . . . . . . . . . . . . . . 55
45

46

An evaluation of the implemented application requires not only testing whether the implemented modules
work correctly, but also if it is possible to obtain any savings using the final version of the application.
Section 5.1 proposes an approach for testing all four modules which are described in Section 3.5,
and outlines a quantitative and qualitative evaluation approach for energy savings and user comfort in
the context of the use of the application. The experiments results are also present in this Chapter, along
with a discussion on these results.
5.1 Evaluation approach for implementation
An evaluation approach for testing the correctness of all four modules described in Section 3.5 requires
testing these modules independently and validating the system’s functionality as a whole with integration
tests.
• Tests for the identification module must consider users’ identification with RFID smart cards or
Wi-Fi devices. Before taking the test, users’ information is collected manually. Such information
includes their smart card’s UID (e.g., their student identity card) and their devices’ Wi-Fi MAC
Addresses. Then, users are asked to use the identification module to identify themselves both
using their smart card and their Wi-Fi devices. After collecting users’ occupancy information,
information collected manually must match the information present in the system.
• Information module tests considers users’ votes and gamification information. Testing this mod-
ule requires databases with mocked entries for user occupancy and their gamified attributes, tem-
perature setpoint votes, PMV and PPD values, if available. Afterwards, system must retrieve this
information previously provided correctly.
• The user interface module can be tested independently from the information module. Neverthe-
less, the user interface must receive input correctly from users (e.g. temperature setpoint values)
and provide feedback correctly (temperature values, PMV and PPD values, energy consumption
and gamification information).
• Lastly, the bridge module have to correctly interconnect all system modules and also to provide
data to and from the HVAC system.
It is also necessary to evaluate both energy savings and user comfort results. As it is discussed in
subsection 2.9.4, one must evaluate quantitative results against qualitative ones: while, on the one hand,
the main purpose of this project is to implement a way to reduce HVAC systems energy consumption,
on the other hand user comfort may not be discarded and have to be equally considered.
At least two main scenarios can be tested:
• Scenario 1: population with P users, in room A, at a moment M in time. Users are asked to use the
47

application, in which they vote for the desired new temperature setpoint. HVAC system is adjusted
considering users’ votes, and
• Scenario 2: population with P users, in room B, at the same moment M in time. Users are also
asked to use the application and voting for temperature setpoint and comfort values. HVAC system
is not adjusted considering users’ votes, but a new setpoint is adjusted manually or automatically,
considering energy savings.
These two scenarios try to validate whether 1) fine-tuning HVAC systems considering users’ votes
eventually lead to energy savings, and 2) users’ comfort sensation are influenced by the feedback of a
voting system. Moreover, as it is also important to analyse feedback concerning users’ thermal comfort,
users can be asked to state their opinion on this issue with comfort-related questionnaires. These
questionnaires are important to evaluate the qualitative results described above.
5.2 Description of the experiments
Right after implementing and validating the correctness of the algorithms described in Section 4.4, it is
necessary to test the HCA with its end users so that one can validate whether the proposed solution fits
the problem stated in Section 1.2. In order to ensure that the application will not stop working during the
tests with end users, it is necessary to make stress tests to guaranty that the web server can manage
a considerable number of simultaneous accesses and requests. These tests followed Apache JMeter1
procedures that load test functional behavior and measure performance. It was used to validate that the
implemented app could handle the simultaneous user load.
Section 1.1 describes a motivation scenario where a large lecture room inside a University Campus is
occupied by many different students from 8 AM to 8 PM. An example of such lecture room can be found
in Amphitheatre 4 (A4) of Tagus Park Campus in Instituto Superior Tecnico (IST). A4 offers an HVAC
system that allows third-party applications to change and receive feedback about some environmental
variables, such as the current temperature, energy consumption and temperature setpoint values. This
allows HCA and similar applications to automatically request a new temperature setpoint definition after
collecting users’ votes, and collecting real-time feedback to be provided to the web application.
Even though A4 is considered to be the best location where tests for HCA can be executed, at
the time that the experiments could take place the HVAC controllers were not available for use due to
technical problems. This means that one cannot connect any application to A4’s HVAC system and
an alternative location had to be found. Laboratories 1–17 and 1–19 of IST Tagus Park are two 53
squared meter rooms that have an allocatable capacity of 24 students each and are equipped with an
1http://jmeter.apache.org
48

HVAC system which temperature setpoint can be manually defined using a thermostat that is depicted
in Figure 5.1.
Figure 5.1: HVAC thermostat for controlling temperature setpoint.
Laboratories 1–17 and 1–19 are mainly used for practical classes that last for up to 90 minutes,
which means that experiments taking place in these rooms must be the simplest possible so that the
regular flow of the classes is not disturbed. For this to be accomplished, some non fundamental features
of the HCA must not be tested along with our main experiment. For instance, users will not be asked
to register in the application, neither it will be necessary to identity themselves using their student card
in the Identification Module described in Section 3.5. An alternative for simulating these behaviours is
described next.
As users will not be asked to register in the HCA, the Identification Module described in Section 3.5
must be populated before the experiments take place, meaning that one must generate an adequate
number of (username, password) pairs so that users can log in the application with valid credentials.
Section 5.1 describes two main scenarios that can be tested to validate the HCA. Herewith, as it is
expected to make from four to six experiments, and considering that each experiment will comprise a
maximum number of twenty four students (the allocatable capacity of each room) plus one lecturer, the
Identification Module must be populated with at least 6× 25 = 150 (username, password) pairs.
As it was stated above, for the sake of the experiments’ simplification, users will not identify them-
selves with their student card at the entrance of the room. As users can only participate in the setpoint
definition when they are physically present in the room where the experiment is taking place, this re-
quirement can be accomplished by setting the online VARCHAR attribute in the Information Module
Database (see Figure 4.2 for details) for each user who has received a pair of (username, password).
All other pairs populated in the database are set as offline until the respective username is attributed to
one user that is present in the experiments’ room.
Right after preparing the users’ credentials, the HCA is deployed and made available at a public
address so that users can reach the application from their devices on their own Internet connection.
49

5.3 Experiment Results
The experiments for the HCA took place in four different days, starting at the 24th and ending at the
29th of September 2015. It was defined that the application should calculate a new temperature setpoint
request every 10 minutes for all experiments to give enough time for the HVAC system to act effectively.
Each new temperature setpoint request is registered in a log file containing the current timestamp
and the requested action (i.e. increasing, decreasing or keeping the temperature setpoint). When no
action is possible to be performed, the log file also stores information about the number of requests
to increase, decrease or keep the temperature setpoint, in this order. As it is not currently possible to
connect the HCA to the HVAC system due to technical problems, the log file gives useful feedback so
that one can manually change the temperature setpoint in the thermostat depicted in Figure 5.1. These
log files are described in Tables 5.1 to 5.7.
5.3.1 First experiment
The first experiment tried to validate the Scenario 1 described in Section 5.1. In this scenario, users
are asked to use the HCA and a new temperature setpoint is calculated after gathering and computing
users’ votes. This experiment was realized in the morning of the 24th of September, starting at 8:30 AM
at Laboratory 1–19, and finishing at 10:00 AM. Twenty eight users attended this class.
Timestamp Action New setpoint (in oC)
2015-09-24 08:29:40 No participations to consider 152015-09-24 08:39:48 No action (tie) 2 2 0 152015-09-24 08:49:56 No action (tie) 2 2 0 152015-09-24 09:00:03 No action (tie) 5 4 1 152015-09-24 09:10:09 Keep temperature with 3 requests 152015-09-24 09:20:15 Decrease temperature with 4 requests 142015-09-24 09:30:21 Increase temperature with 9 requests 152015-09-24 09:40:26 Increase temperature with 6 requests 162015-09-24 09:50:32 Increase temperature with 9 requests 172015-09-24 10:00:37 Increase temperature with 8 requests 18
Table 5.1: Log file for the first experiment.
The HVAC system was switched on at 8:00 AM. The temperature setpoint was adjusted to about
15oC2, and accordingly to Freemeteo website3, at that time the outside temperature was about 16oC.
No information was available about inside temperature in the room.
Users started using the HCA about 15 minutes after the start of the class. At 10:00 AM, the HCA
registered 82 participations, where 64 participations were explicitly made by the users in the HCA, while
2Laboratory 1–19’s HVAC thermostat is depicted in Figure 5.1. As it is an analog thermostat, no fine-selection of the tempera-ture setpoint could be realized.
3http://freemeteo.com.pt
50

18 participations were automatically obtained considering users’ previous votes, as it is described in
Section 4.4.8.
Table 5.1 shows the log file for the first experiment, and Table 5.2 describes the percentage of users
that expressed their opinion regarding the current temperature in the HCA versus the automatic votes
calculated betaking the algorithm described in Section 4.4.8.
Type of vote Percentage
Requested by user 78%Automatic from preferences 22%
Table 5.2: Percentage of manual versus automatic votes for the first experiment.
Table 5.2 states clearly that the majority of the votes (78%) came from explicit participation of the
users and not from automatic votes (22%).
At the end of the first experiment, the comfort questionnaires results were the following:
• 4 users did not use the HCA;
• 16 users used the HCA 1 to 2 times;
• 2 users used the HCA 3 to 4 times;
• 6 users used the HCA 4 to 8 times;
• 1 user used the HCA more than 8 times;
• 24 users stated that the experiment did not disturb the regular flow of the class;
• 4 users stated that the experiment disturbed the regular flow of the class;
• 5 users did not feel more comfortable nor uncomfortable during the class;
• 19 users felt more comfortable during the class;
• 1 user felt more uncomfortable during the class; and
• 3 users felt both more comfortable and more uncomfortable during the class.
5.3.2 Second experiment
Like the first experiment, the second experiment also tried to validate the Scenario 1. This experiment
was realized in the afternoon of the same day of the first experiment described above in Section 5.3.1. It
started at 01:00 PM at Laboratory 1–19, and finished at 02:30 PM. The outside temperature was about
25oC at 01:00 PM, and the inside temperature was 24oC before any student entered the room.
The HVAC system was switched on at 01:00 PM, and a temperature setpoint of 15oC was selected
in the HVAC system’s temperature thermostat. Twenty one users made 66 participations: 19 participa-
tions were explicitly made by the users in the HCA, and 47 participations were automatically obtained
considering users’ previous votes.
51

Timestamp Action New setpoint (in oC)
2015-09-24 13:07:35 No participations to consider 152015-09-24 13:17:37 Keep temperature with 4 participations 152015-09-24 13:27:38 Keep temperature with 5 participations 152015-09-24 13:37:40 Keep temperature with 6 participations 152015-09-24 13:47:41 Keep temperature with 6 participations 152015-09-24 13:57:42 Keep temperature with 6 participations 152015-09-24 14:07:44 Keep temperature with 6 participations 152015-09-24 14:17:45 Keep temperature with 6 participations 152015-09-24 14:27:46 Keep temperature with 6 participations 15
Table 5.3: Log file for the second experiment.
Type of vote Percentage
Requested by user 28.8%Automatic from preferences 71.2%
Table 5.4: Percentage of manual versus automatic votes for the second experiment.
As it is clear from Table 5.4, most votes were considered from the automatic voting algorithm, as
only 28.8% of the participations were explicitly made by the users. The difference from these results
to the ones obtained in the previous experiment is supported by the results of the questionaires: as
one can see, users of experiment 1 were more participative than users in experiment 2, which reflets
on the automatic voting algoritmn. If a user do not request a new temperature setpoint, the automatic
voting algorithm will consider their previous participations. As users did not participate actively in this
experiment, the new temperature setpoint was calculated mostly regarding their previous votes.
At the end of the second experiment, the comfort questionnaires results were the following:
• 2 users did not use the HCA;
• 7 users used the HCA 1 to 2 times;
• 2 users used the HCA 3 to 4 times;
• 0 users used the HCA 4 to 8 times;
• 0 users used the HCA more than 8 times;
• 10 users stated that the experiment did not disturb the regular flow of the class;
• 1 user stated that the experiment disturbed the regular flow of the class;
• 7 users did not feel more comfortable nor uncomfortable during the class;
• 3 users felt more comfortable during the class;
• 1 user felt more uncomfortable during the class; and
• 0 users felt both more comfortable and more uncomfortable during the class.
As we can see from the results above, 10 users out of 21 did not want to answer the questionnaire.
52

5.3.3 Third experiment
The third experiment was realized in Laboratory 1–17, on the 28th of September, at 10:30 AM, and ended
at 12:00 PM. Outside temperature was about 21oC. As the HVAC system was not working properly at this
time, this experiment aimed at testing Scenario 2 described in Section 5.1. Scenario 2 states that even
though users can use the HCA to request new temperature setpoints, users’ votes are not considered
to the definition of a new temperature setpoint, and a new temperature setpoint is adjusted considering
energy savings.
In this case study, due to technical problems with the HVAC system, even though the HVAC system’s
temperature thermostat was configured to the minimum temperature setpoint, no cooling was being
provided to the room, but as users did not know about this issue, Scenario 2 can be validated.
Timestamp Action New setpoint (in oC)
2015-09-28 10:37:38 No participations to consider Not available2015-09-28 10:47:40 No action (tie) 3 0 3 Not available2015-09-28 10:57:41 Decrease temperature with 6 participations Not available2015-09-28 11:07:43 Decrease temperature with 5 participations Not available2015-09-28 11:17:44 Decrease temperature with 7 participations Not available2015-09-28 11:27:46 Decrease temperature with 6 participations Not available2015-09-28 11:37:47 Decrease temperature with 9 participations Not available2015-09-28 11:47:49 Decrease temperature with 8 participations Not available2015-09-28 11:57:50 Decrease temperature with 8 participations Not available
Table 5.5: Log file for the third experiment.
Type of vote Percentage
Requested by user 50.7%Automatic from preferences 49.3%
Table 5.6: Percentage of manual versus automatic votes for the third experiment.
At the end of the fourth experiment, the comfort questionnaires results were the following:
• 8 users did not use the HCA;
• 11 users used the HCA 1 to 2 times;
• 3 users used the HCA 3 to 4 times;
• 0 users used the HCA 4 to 8 times;
• 0 users used the HCA more than 8 times;
• 18 users stated that the experiment did not disturb the regular flow of the class;
• 4 users stated that the experiment disturbed the regular flow of the class;
• 7 users did not feel more comfortable nor uncomfortable during the class;
• 6 users felt more comfortable during the class;
53

• 9 users felt more uncomfortable during the class; and
• 0 users felt both more comfortable and more uncomfortable during the class.
2 users out of 24 did not want to answer the questionnaire.
5.3.4 Fourth experiment
As it was not possible to control the HVAC system properly at Laboratory 1–17, the last experiment was
realized back again in Laboratory 1–19 where the HVAC system was working properly. This experiment
was made in the afternoon of the 29th of September, at 01:30 AM, at a class where 26 users were
present. The outside temperature was 23oC, and the inside temperature at the beginning of the class
was about 25 oC. Again, a temperature setpoint of 15oC was selected in the HVAC system’s temperature
thermostat at the beginning of the class.
Timestamp Action New setpoint (in oC)
2015-09-29 13:44:42 Keep temperature with 8 participations 152015-09-29 13:54:44 Decrease temperature with 5 participations 142015-09-29 14:04:45 Increase temperature with 5 participations 152015-09-29 14:14:45 No action (tie) 6 3 3 152015-09-29 14:24:47 No action (tie) 8 6 2 152015-09-29 14:34:48 Keep temperature with 6 participations 152015-09-29 14:44:49 Increase temperature with 7 participations 162015-09-29 14:54:50 Decrease temperature with 4 participations 15
Table 5.7: Log file for the fourth experiment.
Type of vote Percentage
Requested by user 90.3%Automatic from preferences 9.7%
Table 5.8: Percentage of manual versus automatic votes for the fourth experiment.
In this experiment, 90.3% of the participations were explicitly made by the users, and only 9.7% of
the votes were calculated with the algorithm described in Section 4.4.8.
At the end of the fourth experiment, the comfort questionnaires results were the following:
• 6 users did not use the HCA;
• 1 user used the HCA 1 to 2 times;
• 3 users used the HCA 3 to 4 times;
• 7 users used the HCA 4 to 8 times;
• 3 users used the HCA more than 8 times;
• 20 users stated that the experiment did not disturb the regular flow of the class;
54

• 0 users stated that the experiment disturbed the regular flow of the class;
• 7 users did not feel more comfortable nor uncomfortable during the class;
• 9 users felt more comfortable during the class;
• 4 users felt more uncomfortable during the class; and
• 0 users felt both more comfortable and more uncomfortable during the class.
Again, as we can see from the results above, 6 users out of 26 did not want to answer the question-
naire.
5.4 Discussion
The four experiments described above aimed at validating the two scenarios that were described in
Section 5.1. Unfortunately, due to the technical problems with the A4’s HVAC controllers that were
enumerated, it was not possible to validate if considering user’s votes actually lead to energy savings,
as no information about current energy consumption was available during the experiments. Moreover,
as no temperature sensors were available at Laboratories 1 – 17 and 1 – 19, it was also not possible to
retain accurate temperature values inside the room where these experiments were taking place. Even
though these constraints made it impossible to qualify and quantify accurate values for energy savings,
one can retain some important results from the analysis of experiments 1 to 4.
5.4.1 Scenario 1
The results of the experiment 1 state that 78% of the new temperature setpoint definition were explicitly
requested by the users, meaning that only 22% of the votes were calculated with users’ previous votes.
This means that the majority of the participations in the definition of the temperature setpoint reflected
users’ opinion on the current thermal comfort, which also reflects in the validation of the results described
below.
Table 5.1 shows that it was not possible to calculate a new temperature setpoint until 09:20 AM, as no
information could be extracted from users’ votes as they were inconclusive until 09:10 AM. From 09:20
AM on, it is clear from the results that the majority of the users who were using the HCA’s participation
feature were uncomfortable with the HVAC’s temperature setpoint: requests from 09:20 AM to 10:00
AM lead to an increase of 3oC in the temperature setpoint, which would not be possible to obtain if no
collaborative platform for managing users’ votes was available. Results also state that 19 out of 28 users
consider that they felt more comfortable during this specific class, while 24 out of 28 users stated that
the experiment did not disturb the regular flow of the class.
In contrast with experiment 1, 71.2% of the new temperature setpoint requests of experiment 2 were
calculated automatically from users’ preferences. As users of experiment 2 were less participative that
55

the ones of experiment 1, the definition of new temperatute setpoints by the HCA was mainly calculated
automatically with users’ previous votes on this experiment. As one can see, the HVAC’s temperature
setpoint remained constant from the beginning to the end of the experiment, as most of the temperature
setpoint calculations were considering the “keep requests” votes that users made somewhere in time
during this experiment and that had a greater number of participations that increasing or decreasing
ones.
Lastly, it is clear from experiment 4 log file in Table 5.7 that the temperature setpoint did not ex-
perienced a considerable number of changes since the beginning of the experiment because users’
participations were substantially different from each other. Considering this, it is expected that users
would not feel any improvement in their thermal comfort sensation, which is supported from the ques-
tionnaire results: 7 out of 20 did not feel more comfortable nor uncomfortable during the class, 4 out of
20 users felt more uncomfortable during the experiment, and only 9 out of 20 users considered that they
felt more comfortable during the class.
5.4.2 Scenario 2
In experiment 3, the temperature setpoint remained constant along the experiment. Users requested a
decrease of the setpoint from 10:57 AM to 11:57 AM but no new temperature setpoint was intentionally
calculated. At the end of the experiment, 7 out of 22 users did not feel more comfortable nor uncomfort-
able, 6 out of 22 users felt more comfortable and 9 out of 22 users felt more uncomfortable during the
class. These values indicate that, even though the log file for experiment 3 states that the temperature
setpoint should be decreased, the same percentage of users felt comfortable and uncomfortable, while
the temperature setpoint remained the same. This clearly indicates the subjectivity of this experiment:
users did not know that the HVAC temperature setpoint remained the same for all the experiment, but
some of them stated that their comfort sensation has increased, just as if the temperature setpoint was
being customized.
5.4.3 Conclusion
The results of these experiments clearly indicates that is is possible to fine-tune HVAC temperature
setpoints when users are provided with a collaborative platform where their opinion is collected. As one
can see, it was possible to calculate new temperature setpoints where an increase of 3oC was registered.
Even though it was not possible to obtain energy related values for any of the experiments, increases of
the temperature setpoint lead to energy savings, whose values can be quantified in the future work when
and if it is possible to connect the HCA to the HVAC system and feedback of these values is available.
One can also conclude from the questionnaires that is it possible to increase users’ comfort sensation
56

by fine-tuning the HVAC temperature setpoint, which could not be achieved if users did not have the
possibility to send real time participations to the application and the temperature setpoint remained the
same. Even though it is possible to obtain the results stated above, it is also important to state that,
because of the subjectivity of comfort sensation, it might also occurs that no fine-tune is possible to
obtain when users do not agree with each other, making significantly equivalent requests for keeping,
increasing and decreasing the temperature setpoint (see experiment 4 for details), obtaining a situation
similar to the one where the HVAC thermostat is public and everyone changes the temperature setpoint
as if no one else was present in the room.
57

58

6Conclusions
Contents
6.1 Limitations and future work . . . . . . . . . . . . . . . . . . . . . . . . . . . . . . . . . 61
6.2 Conclusion . . . . . . . . . . . . . . . . . . . . . . . . . . . . . . . . . . . . . . . . . . . 61
59

60

6.1 Limitations and future work
The HCA implements all the functionalities required so that one can use the collaborative platform to
request a new temperature setpoint, but this platform has some limitations that lead to weak performance
when setting up new temperature setpoints. Due to technical difficulties, the HVAC controllers were not
available for use, meaning that the HCA does not implement any integration with the HVAC system and
all setpoint adjusts must be made manually in the HVAC’s thermostat. Moreover, as no temperature
sensors were available, the HCA cannot receive feedback for temperature and setpoint values unless
someone measures and introduces these values manually in the database. This also implies that some
errors might occur when storing and calculating user preferences, as the temperature values provided
manually to the system might not be accurate due to gross errors in the measurement of these values.
Future work related to the HCA collaborative voting platform should solve the problems stated above.
This includes not only connecting the HCA to the HVAC system, but also extending this application
so that it would be possible to use the same Information Module and its user preferences databases
described in Section 3.5 in more than one room at the same time, so that users’ subjectivity can be
rigorously compared and evaluated.
Even though our preliminary evaluation makes clear that is is possible to use the HCA to fine-tune
the HVAC system’s temperature setpoint, it is a fact that one must perform many more experiments to
achieve statistically valid results. As the experiments described in this thesis were performed in the
Autumn, future work should include validations throughout out the year, during Summer, Spring and
Winter, and users’ age group should also be expanded so that seniors are included in the experiments.
These extensions in the validation method will contribute to the accuracy of the obtained results.
As for the algorithms to calculate new temperature setpoints, one can also study different approaches
for considering users’ participations. Future work regarding this issue can include experiments where
other calculating algorithms are implemented, such as empowering users who contribute the most for
energy savings. Implementing such algorithms implies that the HCA can communicate with the HVAC
system, which is currently not available at the moment that this work has been developed.
6.2 Conclusion
Fine-tuning HVAC temperature setpoints accordingly to user preferences has revealed to be an ex-
tremely important issue, as the over cooling or over heating places might not always correspond to
users’ expectations regarding their thermal comfort preferences, and this behaviour might also result in
high energy expenses that can be avoided.
Even though it is possible to find a way to identify and estimate user occupancy in a place, users
might not be willing to have an active attitude on identifying themselves before an identification system
61

every time they enter a certain room or place. Even if users do not offer reluctance on the identification
issue, they do not understand why they should have a proactive role on controlling an HVAC system
temperature setpoint.
The solution described aims at reducing the amount of energy consumption that HVAC systems rep-
resent in large buildings while, at the same time, raising users’ thermal comfort sensation at a certain
room. This thesis summarizes ways of user occupancy identification, motivating users on user behaviour
transformation using gamification, recognizing their positive actions at a gamified application, and eval-
uating both user thermal comfort and energy efficiency regarding modifications on the HVAC system
temperature setpoint.
These requirements were implemented on a web application that uses modern technologies support-
ing the MVC pattern, multiple devices with responsive views and simultaneous accesses from different
clients. The robustness of this application was validated with Apache JMeter automatic tool for simu-
lation of a heavy load, and actual experiments with users at a production level, which showed that the
implemented application is completely compatible with daily use.
The dynamic adjustments of environmental settings is one of the promises of the Internet of
Things. This work illustrated how these future apps, that will be feed from actual sensor data,
will be.
62

Bibliography
[1] Steven R. Schiller, “Model Energy Efficiency Program Impact Evaluation Guide,” 2007.
[2] EPA, “Calculating energy savings,” December 2014.
[3] W. Z. Huang, M. Zaheeruddin, and S. Cho, “Dynamic simulation of energy management control
functions for HVAC systems in buildings,” Energy Conversion and Management, vol. 47, no. 7-8,
pp. 926–943, May 2006.
[4] W. Grondzik and R. Furst, “HVAC Components and Systems,” p. 72, 2000.
[5] Monash University. (2014) Set Points FAQs - Monash University.
[6] J. Landt, “The history of RFID,” Potentials, IEEE, pp. 8–11, 2005.
[7] C. Floerkemeier, C. Roduner, and M. Lampe, “RFID Application Development With the Accada
Middleware Platform,” IEEE Systems Journal, vol. 1, no. 2, pp. 82–94, Dec. 2007.
[8] A. Papapostolou and H. Chaouchi, “RFID-assisted indoor localization and the impact of interference
on its performance,” Journal of Network and Computer Applications, vol. 34, pp. 902–913, 2011.
[9] N. Li and B. Becerik-gerber, “Performance-based evaluation of RFID-based indoor location sensing
solutions for the built environment,” Advanced Engineering Informatics, vol. 25, pp. 535–546, 2011.
[10] R. Tesoriero, R. Tebar, J. A. Gallud, M. D. Lozano, and V. M. R. Penichet, “Improving location
awareness in indoor spaces using RFID technology,” Expert Systems with Applications, vol. 37, pp.
894–898, 2010.
[11] K. Traub, F. Armenio, H. Barthel, P. Dietrich, J. Duker, C. Floerkemeier, J. Garrett, M. Harrison,
B. Hogan, J. Mitsugi, J. Preishuber, J. Preishuber-Pfluegl, O. Ryaboy, S. Sarma, K. Suen, and
J. Williams, The EPCglobal Architecture Framework 1.4, EPCglobal, GS1 Std., December 2010.
[12] K. Finkenzeller, RFID Handbook. Wiley, 2010.
63
[13] E. Ferro and F. Potorti, “Bluetooth and Wi-Fi Wireless Protocols: A Survey and a Comparison,”
Wireless Communications, IEEE, vol. 12, no. 1, pp. 12–26, 2005.
[14] J.-s. Lee, Y.-w. Su, and C.-c. Shen, “A Comparative Study of Wireless Protocols : Bluetooth, UWB,
ZegBee, and Wi-Fi,” in IECON 2007 - 33rd Annual Conference of the IEEE. Taipei, Taiwan: IEEE,
2007, pp. 46–51.
[15] IEEE, “Standard Group MAC Addresses: A Tutorial Guide,” pp. 1–4.
[16] D. Takahashi, Y. Xiao, Y. Zhang, P. Chatzimisios, and H.-H. Chen, “IEEE 802.11 user fingerprinting
and its applications for intrusion detection,” Computers & Mathematics with Applications, vol. 60,
no. 2, pp. 307–318, Jul. 2010.
[17] S. Nikitaki and P. Tsakalides, “Decentralized indoor wireless localization using compressed sensing
of signal-strength fingerprints,” Proceedings of the 7th ACM workshop on Performance monitoring
and measurement of heterogeneous wireless and wired networks - PM2HW2N ’12, p. 37, 2012.
[18] ASHRAE, Thermal Environmental Conditions for Human Occupancy, 2011.
[19] ——, HVAC Applications, 2011.
[20] M. N. Shaharon and J. Jalaludin, “Thermal Comfort Assessment - A Study Toward Workers ’ Sat-
isfaction in a Low Energy Office Building,” American Journal of Applied Sciences, vol. 9, no. 7, pp.
1037–1045, 2012.
[21] P. O. Fanger, “Assessment of man’s thermal comfort in practice,” British Journal of Indistrial
Medicine, vol. 30, no. 4, pp. 313–324, Oct. 1973.
[22] R. Z. Freire, G. H. Oliveira, and N. Mendes, “Predictive controllers for thermal comfort optimization
and energy savings,” Energy and Buildings, vol. 40, no. 7, pp. 1353–1365, Jan. 2008.
[23] M. a. Humphreys and J. Fergus Nicol, “The validity of ISO-PMV for predicting comfort votes in
every-day thermal environments,” Energy and Buildings, vol. 34, no. 6, pp. 667–684, Jul. 2002.
[24] EESTI, ISO ISO7730:2006 Energy Management Systems Standard – Requirements with guidance
for use, 2011.
[25] B. Olesen and G. Brager, “A Better Way to Predict Comfort,” ASHRAE Journal, 2004.
[26] ICT4SaveEnergy, “SAVE ENERGY green paper,” p. 22, 2012.
[27] K. Huotari and J. Hamari, “Defining Gamification - A Service Marketing Perspective,” in MindTrek.
Tampere, Finland: ACM, 2012, pp. 17–22.
64

[28] S. Deterding, D. Dixon, R. Khaled, and L. Nacke, “From Game Design Elements to Gamefulness :
Defining “ Gamification ”,” in MindTrek. Tampere, Finland: ACM, 2011, pp. 9–15.
[29] J. Hamari, J. Koivisto, and H. Sarsa, “Does Gamification Work? – A Literature Review of Empirical
Studies on Gamification,” in 7th Hawaii International Conference on System Sciences. Waikoloa,
HI: IEEE, Jan. 2014, pp. 3025–3034.
[30] I. Schreiber and B. Brathwaite, Challenges for game designers, C. Technology, Ed., Boston, MA,
2009.
[31] M. Dickey, “Three dimensional virtual worlds and distance learning: two case studies of Active
Worlds as a medium for distance education,” British Journal of Educational Technology, vol. 36,
no. 3, pp. 439–451, 2005.
[32] N. Yee and J. Bailenson, “The Proteus Effect: The Effect of Transformed Self-Representation on
Behavior,” Human Communication Research, vol. 33, no. 3, pp. 271–290, Jul. 2007.
[33] G. Frasca, The Video Game Theory Reader, Routledge, Ed., New York, New York, USA, 2003.
[34] S. Bildl, “Gamification of the Quantified Self,” Advances in Embedded Interactive Systems, vol. 2,
no. 3, 2014.
[35] S. H. Hsu, J.-W. Chang, and C.-C. Lee, “Designing attractive gamification features for collaborative
storytelling websites.” Cyberpsychology, Behavior and Social Networking, vol. 16, no. 6, pp. 428–
35, Jun. 2013.
[36] F. Gottl, “Crowdsourcing with Gamification,” Advances in Embedded Interactive Systems, vol. 2,
no. 3, 2014.
[37] J. Frith, “Turning life into a game: Foursquare, gamification, and personal mobility,” Mobile Media &
Communication, vol. 1, no. 2, pp. 248–262, May 2013.
[38] P. Babington, Java Distributed Computing. O’Reilly Media, Inc., 1998.
[39] F. Bergenti, A. Poggi, and M. Somacher, “Fixed and Mobile Networks,” Communications of the ACM,
vol. 45, no. 11, pp. 39–44, 2002.
[40] CISCO, “Building Automation System over IP ( BAS / IP ) Design and Implementation Guide,” San
Jose, CA, 2008.
[41] ASME, “A Historic Mechanical Engineering Landmarl,” 2008.
[42] W. S. Johnson, “Johnson controls,” December 2014. [Online]. Available: http://www.
johnsoncontrols.com/content/us/en/about/our history/warren s johnson.html
65

[43] William Wimsatt, “Home Automation Contextual User Interface,” 2006.
[44] CEATI, “Energy Savings Measurement Guide - Following the International Performance Measure-
ment and Verification Protocol.”
[45] IPMVP, “International Performance Measurement & Verification Protocol International Performance
Measurement & Verification Protocol,” Tech. Rep. March, 2002.
[46] “Memory Recognition and Recall in User Interfaces.” [Online]. Available: http://www.nngroup.com/
articles/recognition-and-recall/
[47] “Responsive Web Design: A Brief History — Social Media Today.” [Online]. Available:
http://www.socialmediatoday.com/content/responsive-web-design-brief-history
[48] A. Marcus, “Metaphor design in user interfaces,” ACM SIGDOC Asterisk Journal of Computer Doc-
umentation, vol. 22, no. 2, pp. 43–57, 1998.
[49] “Introduction to the Spring Framework.” [Online]. Available: http://docs.spring.io/spring-framework/
docs/current/spring-framework-reference/html/overview.html
[50] S. Burbeck, “Applications Programming in Smalltalk-80 ™ : How to use Model-View-Controller (
MVC ) by,” no. Mvc, 1992.
[51] “Core J2EE Patterns - Data Access Object.” [Online]. Available: http://www.oracle.com/
technetwork/java/dataaccessobject-138824.html
[52] “JavaServer Pages Technology - The Java EE 5 Tutorial.” [Online]. Available: http:
//docs.oracle.com/javaee/5/tutorial/doc/bnagx.html
[53] “Bootstrap · The world’s most popular mobile-first and responsive front-end framework.” [Online].
Available: http://getbootstrap.com/
66

AWeb Application layout for computer
views
67

68

Figure A.1: Login screen layout for computer views.
Figure A.2: Main screen layout for computer views.
69

Figure A.3: Main screen (after making a request) layout for computer views.
Figure A.4: Profile screen layout for computer views.
70

Figure A.5: Gamification screen layout for computer views.
Figure A.6: Stats screen layout for computer views.
71
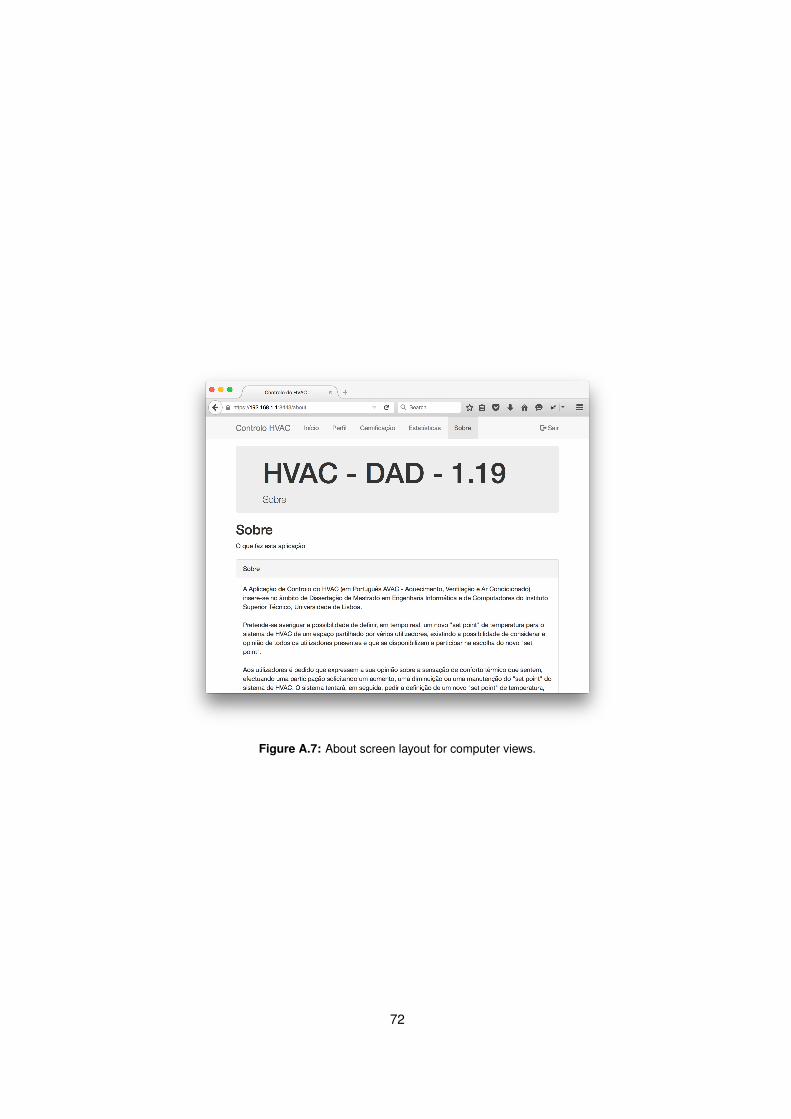
Figure A.7: About screen layout for computer views.
72

BWeb Application layout for smart
phone and tablet views
73

74
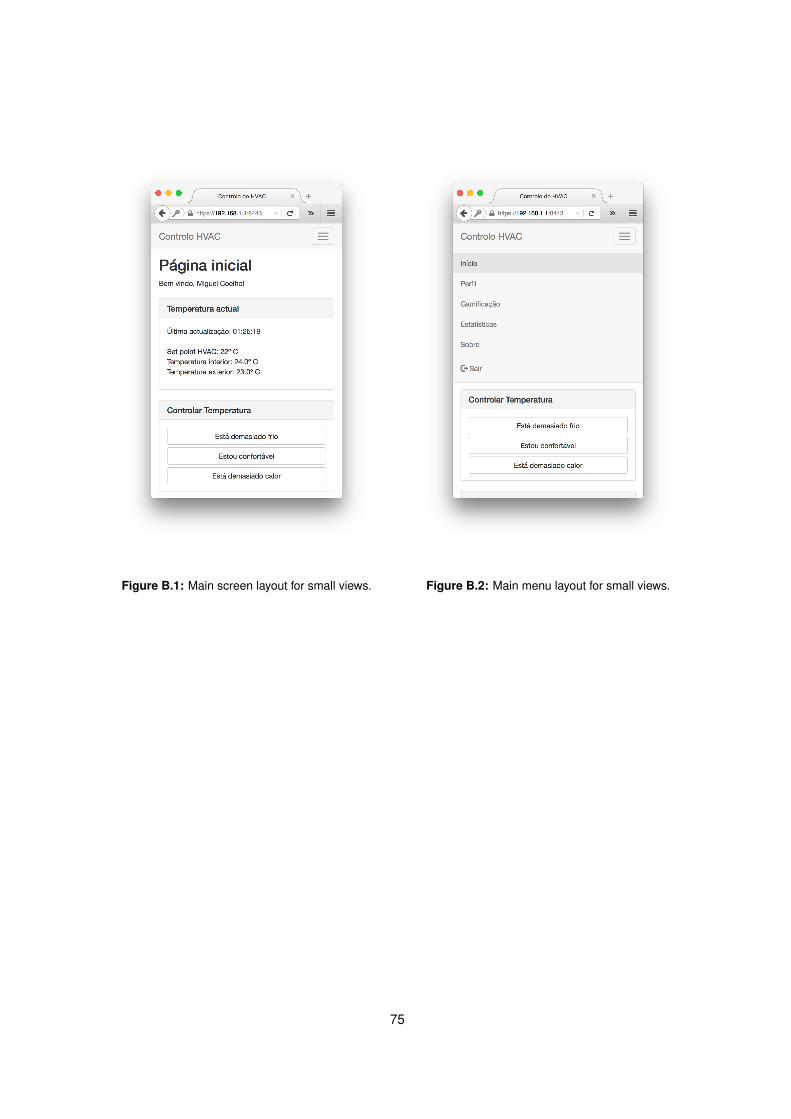
Figure B.1: Main screen layout for small views. Figure B.2: Main menu layout for small views.
75

Figure B.3: Gamification layout for small views. Figure B.4: Stats layout for small views.
76