finishing the last lap: experimental evidence on … the last lap: experimental evidence on...
TRANSCRIPT

Finishing the Last Lap: Experimental Evidence on Strategies to Increase College
Completion for Students At Risk of Late Departure
Zachary Mabel*
Harvard Graduate School of Education
Benjamin L. Castleman
University of Virginia
Eric P. Bettinger
Stanford University School of Education and NBER
September 2017
ABSTRACT
Nearly half of students who enter college do not graduate and completion
disparities by race and income are large. While the majority of efforts to
increase degree attainment have focused on supporting students before or soon
after they enter college, many students drop out after spending significant time
in school. In this paper, we report pilot-year results from an experimental
intervention we conducted across five states and nine broad-access, public
colleges and universities to help students graduate. The intervention provided
students late into college with personalized text messages that prompted them
to identify goals associated with finishing their degree, encouraged them to
connect with campus-based academic and financial resources, and reminded
them of upcoming and important deadlines. We find no evidence of effects on
academic performance or attainment in the full sample, although
implementation challenges at two institutions make results from this sample
difficult to interpret and potentially downward-biased. In our preferred sample
which excludes those institutions, the intervention decreased fall-to-spring
dropout by 14 percent, from 17.5 to 15 percent. Among students in this sample
at greatest risk of dropout based on their background and prior enrollment
experiences, outreach increased degree completion after one year by 6
percentage points, or 38 percent.
The contents of this article were developed under grant R305N160026 from the U.S. Department of
Education, Institute of Education Sciences. We are grateful for the ongoing collaboration of our
postsecondary system and institutional partners in the design and implementation of this intervention. Thank
you also to David Deming, Bridget Terry Long, and seminar participants at the EPPE Colloquium at the
Harvard Graduate School of Education for helpful comments and suggestions on earlier versions of this
paper. All errors, omissions, and conclusions are our own.
*Please address all correspondence to Zachary Mabel at [email protected].

1
1. Introduction
The economic return to completing college is large and increasing (Autor, 2014; Avery &
Turner, 2012; Carnevale, Jayasundera, & Gulish, 2016), but the likelihood of degree attainment
among those who attend is lower than in previous decades: 55 percent of students who currently
start college complete within six years of entry (Bound, Lovenheim, & Turner, 2010; Shapiro et
al., 2016). Particularly concerning is the fact that low-income students and students of color are
significantly less likely to graduate than their high-income and white peers, and these disparities
have widened over time (Bailey & Dynarski, 2011; Chetty, Friedman, Saez, Turner, & Yagan,
2017). For example, the gap in bachelor’s degree attainment between high- and low-SES students
who attend four-year college within two years of completing high school exceeds 25 percentage
points (U.S. Department of Education, 2015). With social mobility in decline in the United States
and the payoff to degree attainment on the rise, increasing college completion rates among
disadvantaged populations is an essential component of broader strategies to create more equitable
opportunities for economic prosperity.
To date, the majority of efforts to address completion inequities have focused on supporting
students before or soon after they enter college. For example, several interventions have focused
on helping students apply to college, complete the cumbersome application for federal student aid,
and overcome procedural obstacles to matriculation that arise before students arrive on campus
(Bettinger, Long, Oreopoulos, & Sanbonmatsu, 2012; Carrell & Sacerdote, 2013; Castleman &
Page, 2015; Hoxby & Turner, 2013; Pallais, 2015). Considerable attention has also been devoted
to improving the effectiveness of remediation policies for students who enter college academically
underprepared (Bettinger & Long, 2009; Martorell & McFarlin, 2011; Scott-Clayton, Crosta, &
Belfield, 2014).

2
Despite these investments, patterns of college dropout suggest that addressing the
completion problem may also require supporting students long after they arrive on campus. For
example, more than 40 percent of college students who do not earn degrees leave after their second
year of college (Bowen, Chingos, & McPherson, 2009; Shapiro et al., 2014). Recent evidence
suggests that one in three dropouts complete at least three-quarters of the credits that are typically
required to graduate before they withdraw (Mabel & Britton, 2017). Across the country this
translates into approximately 2 million individuals who have earned substantial credits but do not
have a degree to show for it, despite per-student public expenditures of almost $32,000 and average
private investments of almost $40,000 by students and their families towards their college
education.1
While the literature on early departure from college has identified significant barriers to
completion, comparatively less is known about the obstacles to completion for upper-division
students. One likely explanation is that the road to completion becomes increasingly self-directed
as structured student supports taper off after the first year of college (Scott-Clayton, 2015).
Students may therefore struggle to make and follow through on complicated decisions, such as
determining which courses to take to fulfill their degree requirements, when academic advising is
limited and difficult to access. The psychic costs to navigating a challenging environment alone
may also be difficult for older students who lead busy lives and have limited networks of academic
support outside of school.
1 These estimates are based on results from Mabel and Britton (2017), who find that 14 percent of all degree-seeking
students attending public colleges in Florida and Ohio completed three-quarters of the credits typically required for
graduation but did not earn an associates or bachelor’s degree. On average those students enrolled in college for 3.2
years and paid $11,500 per year in out-of-pocket expenses (Horn & Paslov, 2014). Nationwide, state appropriations
and grants also subsidize the cost of attending public colleges and universities by $10,000 per year on average
(Schneider, 2010). Of the 15.5 million students enrolled in degree-seeking programs in the United States, this equates
to approximately 2.2 million students who have earned substantial credits but no degree with substantial costs to
individuals and to taxpayers.
3
These potential barriers suggest that providing students with information to simplify
decision-making, guidance on where they can turn for help, and encouragement to persist in school
could meaningfully increase degree completion and lower attainment gaps. However, most efforts
to reduce late dropout to date have not provided students with proactive guidance and support.
Instead, they have attempted to re-engage individuals who have already withdrawn, despite the
fact that reconnecting with individuals who have left is difficult and has limited the efficacy of
those efforts (Adelman, 2013).2
In this paper, we report on a low-cost, randomized intervention to increase completion
among students who have earned substantial credits and are actively enrolled, but remain at risk
of dropout. We conducted the pilot phase of the Nudges to the Finish Line (N2FL) project during
the 2016-17 academic year in partnership with nine broad-access, public higher education
institutions in New York City, Virginia, Texas, Ohio, and Washington State. In collaboration with
Persistence Plus, a Boston-based provider of mobile supports to college students, we designed a
text messaging campaign which: (1) prompted students to identify goals associated with finishing
their degree; (2) encouraged them to connect with campus-based academic and financial resources;
(3) reminded them of upcoming and important deadlines; and (4) addressed feelings of stress,
anxiety, and other psychological hurdles that could impede student progress. In seven of the sites
the messages were fully automated: messages contained closed-ended prompts that students could
respond to and receive additional information based on their responses. However, in these sites
students did not receive any additional access to college advising. In two other sites, students
2 For example, through Project Win-Win, a partnership between the Institute for Higher Education Policy and the State
Higher Education Executive Officers, sixty postsecondary institutions attempted to re-engage former college-goers
requiring 9 or fewer credits to earn an associate degree (IHEP, 2013).

4
received the automated messages and also had access to a dedicated college advisor who could
respond to their text replies and provide more intensive support as needed.
The intervention sample in the pilot year consisted of 3,804 students and is representative
of students attending public, urban institutions in the United States. Students were eligible for the
study if they had completed at least half of the credits typically required for associate or bachelor’s
degree attainment at two- and four-year colleges, respectively. To examine whether the
intervention produced differential effects according to students’ risk of dropout, we developed
dropout prediction models at each institution as a function of student attributes, academic
performance, prior enrollment experiences, and financial aid receipt using data on previous cohorts
of students. We then used the models to predict the probability of dropout for actively enrolled
students and randomly assigned students to treatment arms within schools using a procedure that
grouped individuals with similar predicted risk of dropout into randomization blocks.
Results from the pilot year indicate that outreach to students late into college can increase
attainment. Although we find no evidence of effects on academic performance or attainment in the
full sample, implementation challenges at two institutions make results from this sample difficult
to interpret and potentially downward-biased. These challenges arose in part because we
randomized students in late summer before fall enrollments finalized. Figure 1 illustrates the
timing of randomization relative to the start of the academic year and our intervention. On average,
we relied on preliminary fall 2016 registration lists generated three weeks before the start of term
to randomize students, and we completed randomization 16 days before the start of term on each
campus. This timeline was necessary to allow adequate time for data transfers between the research
team, institutional partners, and text messaging platform in order to begin messaging students
during the first week of classes.
5
Unfortunately, the timing of randomization produced initial enrollment imbalances at two
institutions. At one campus we observe a large fall enrollment difference between treated and
control students. At another campus we observe a large fall enrollment imbalance among students
with high risk of dropout who presumably stand to benefit most from message outreach. These
imbalances are not a function of message outreach, which began after classes started, but they may
bias estimates of downstream intervention impacts. We therefore present estimates from the full
sample as well as for samples in which we exclude these institutions.
Results from our preferred sample, which excludes the two institutions where initial
enrollment imbalance is observed, are indicative of positive impacts on attainment. The
intervention decreased fall-to-spring dropout by 2.5 percentage points, representing a 14 percent
decrease over the control group mean. The findings also suggest a large impact on degree
completion for students at high risk of dropout. Completion rates for students in the top tercile of
dropout risk increased 6.1 percentage points, from 16.2 percent to 22.3 percent, after one year of
intervention. These impacts, while preliminary, were generated from an intervention that cost only
$100 per student, including start-up costs, and compare favorably to cost-effective interventions
that target students at earlier points along the degree pipeline and that are higher touch. Over the
next two years, we will expand the study to include 25,000 students at approximately 20
institutions to examine effects on persistence and completion over a longer time horizon and at
scale for this student population.
The remainder of this paper is structured as follows. In Section 2, we present a simple
economic model of human capital investment to understand what factors may affect the decision
to drop out late into college. In Section 3, we provide a brief discussion of the obstacles to
completion that disadvantaged populations face at broad access institutions and elaborate on which
6
barriers the N2FL intervention is designed to address. In Section 4, we present details on the
research design, including the participating schools, intervention components, study sample,
randomization procedure, and empirical strategy. We present results from the pilot year in Section
5. In Section 6, we summarize the findings and conclude with a brief discussion of our work in
progress.
2. An Economic Model of Dynamic Schooling Decisions
Standard models of human capital assume that individuals choose whether or not to attend
college by evaluating the expected lifetime benefits of the investment against the expected lifetime
costs. We extend this simple framework to a multi-period model, in which individuals can have
time-inconsistent preferences, in order to examine potential determinants of late dropout. Consider
for simplicity the case of bachelor’s degree-seeking students choosing between re-enrolling for a
third year of college or leaving school after two years to enter the labor market. At the end of year
two, students weigh the decision to return to college based on their earnings potential with a degree
versus their earnings potential from having completed two years of college. Assuming that students
would graduate in four years, the net present value of completing college conditional on having
finished two years of school is:
(1) ∑[𝑤(𝐵𝐴)−𝑤1]
𝛽𝛿𝑡𝑇𝑡=2 − [𝑤0 − 𝑐1] −
[𝑤1−𝑐2]
𝛽𝛿.
The first term in equation (1) is the earnings return to students over the (𝑇 − 2) years after
completing college, discounted by 𝛽𝛿𝑡, where 𝛿 is the standard discount factor and 𝛽 captures the
fact that individuals tend to over-value immediate payoffs at the expense of their long-term
intentions (i.e., they exhibit present-biased preferences). The next two terms are the continuation
costs incurred from re-enrolling in school. At the end of year two, the cost to attending year three
is forgone wages from immediate entry to the labor market (𝑤0) net of the tuition, effort, and
7
psychic costs to attending year three (𝑐1). Likewise, the perceived cost of persisting to year four at
the end of year two is the present discounted difference between one’s earnings potential after
three years of college (𝑤1) and the cost of attendance in year four (𝑐2). It follows that students will
decide to dropout before graduation if:
(2) ∑[𝑤(𝐵𝐴)−𝑤1]
𝛽𝛿𝑡𝑇𝑡=2 < [𝑤0 − 𝑐1] +
[𝑤1−𝑐2]
𝛽𝛿
This simple model highlights two factors that can induce students to drop out after making
substantial investments in college. First, the real or perceived costs of continuation may increase
over time (i.e., 𝑐2 > 𝑐1 > 𝑐0) and exceed future benefits to completion. While this could affect the
schooling decisions of students with and without strong present-biased preferences, individuals
who discount future benefits more (i.e., 𝛽 < 1) will be more likely to drop out if costs rise. Second,
even if costs remain constant and the benefits to completion large, individuals with strong present-
biased preferences may decide to withdraw if costs are sufficiently high. The theoretical insights
from this model therefore predict that interventions which lower continuation costs and encourage
students to place more weight on the future benefits of completion could have significant impacts
on attainment for students at risk of late dropout.
3. Literature Review: Obstacles to College Completion
A large body of evidence suggests that the costs to completing college are steep and may
increase as students progress through school. Many students experience high time and effort costs
to completion because they enter college academically unprepared (Bettinger, Boatman, & Long,
2013). Resource constraints at broad-access public institutions where the majority of
postsecondary students in the United States attend have escalated those costs by creating a shortage
of student supports at many institutions (Bound et al., 2010; Deming & Walters, 2017).

8
Resource deficiencies are an especially large impediment to student progress because the
college environment at most broad-access institutions is complicated and difficult to navigate. For
example, the volume of courses offered at open-enrollment institutions and the array of program
requirements make it hard for students to know which courses to take in a given term to make
efficient academic progress (Nodine, Jaeger, Venezia, & Bracco, 2012; Schneider & Yin, 2011).
With student-to-counselor ratios frequently exceeding 1,000:1, advising is also extremely limited,
and institutional bureaucracies make it hard for students to access individualized assistance
(Grubb, 2006; Scott-Clayton, 2015). According to survey research, one-third of community
college students never use academic advising as a result, even though nearly half of students do
not understand their graduation requirements or what courses count towards their degree (Center
for Community College Student Engagement, 2015; Rosenbaum, Deil-Amen, & Person, 2006).
Within this isolated and confusing landscape, several studies find large effects from
interventions that provide students entering college with enhanced mentoring, tutoring, and other
supports (Angrist et al., 2009; Bettinger & Baker, 2014; Castleman & Page, 2016; Clotfelter,
Hemelt, & Ladd, 2016; Scrivener et al., 2015). However, because these supports are costly,
institutions typically target resources to first-year students and the impacts of early interventions
fade out over time (Rutschow, Cullinan, & Welbeck, 2012; Visher, Weiss, Weissman, Rudd, &
Wathington, 2012). Completing complex tasks may therefore remain a formidable barrier for
students as they continue to progress in school. Furthermore, as students age and take on more
responsibilities outside of school (Erisman & Steele, 2015; U.S. Department of Education, 2017),
the attention to devote to difficult tasks may become increasingly limited and lead to more frequent
oversight of important deadlines and higher psychic costs (e.g., mounting stress, anxiety, and
impatience) when obstacles arise. All of these factors may contribute to short-sighted perceptions
9
that the immediate costs to continuation exceed the unrealized future benefits of earning a degree
(Cadena & Keys, 2015; Gurantz, 2015).3
Despite indications that these obstacles are particularly salient to students late into college,
the causes of late dropout and strategies to reduce its incidence are not well known. This is largely
because most studies have examined the effects of intervening with students early in college and
it is unclear if the factors that prevent students from finishing, or the importance of those factors,
evolve over time. If the obstacles to completion for late dropouts are predominantly the product of
limited information, complex decisions, and psychological factors such as cognitive overload and
impatience, then low-cost interventions like N2FL may offer as effective a treatment to the late
dropout issue as they have to earlier bottlenecks in college, such as summer melt or students failing
to renew their financial aid (see Castleman, Schwartz, & Baum, 2015 and Lavecchia, Liu, &
Oreopoulos, 2014 for comprehensive reviews of this literature). On the other hand, if the costs to
completion for late-stage students are primarily due to other factors, such as academic skill
deficiencies that make it difficult for students to pass specific course requirements in their major,
then informational and behavioral interventions may have little impact on academic progress and
motivate the need for more resource-intensive strategies to lower rates of late departure.4 In this
study, we shed light on the potential causes of late dropout by examining the impacts of offering
students ongoing guidance and support designed to lower continuation costs and emphasize the
future benefits to completion.
3 To inform our intervention design, Persistence Plus also conducted focus groups at each institution participating in
the pilot year during spring and summer 2016. The most common challenges students identified in those sessions were
not knowing what steps to take to graduate and where to turn when challenges arose. 4 There is some empirical evidence that students experience these types of barriers as well. In their study of the late
dropout phenomenon, Mabel and Britton (2017) find that late dropouts have a harder time passing coursework as they
progress in school compared to graduates and may only need to pass 3-4 additional courses in their major to graduate.
10
4. Research Design
We partnered with a diverse array of non-selective, public two- and four-year institutions
across the country to implement N2Fl during the 2016-17 school year. All of our partner
institutions accept 75 percent or more of the applicants that apply. Of the nine institutions, three
are community colleges in the City University of New York and Virginia Community College
Systems. The remaining six are four-year public institutions in New York City, Texas, Ohio, and
the State of Washington.
4.1. Eligibility Criteria and Sample
Degree-seeking students were eligible to participate in the study if they had: 1) registered
to enroll in fall 2016 before the start of term, and 2) completed at least 50 percent of the credits
typically required for degree completion through summer 2016.5 Although the goal of the
intervention was to provide enhanced support to students at risk of late dropout, we established
broad eligibility criteria during the pilot year for two reasons. First, it was unclear ex ante which
profile(s) of student would be most responsive to the intervention. Second, we anticipated needing
to exclude many potentially-eligible students because having an active cell phone number and
providing consent to receive text messages were prerequisites to participation in the study. The
broad criteria therefore ensured we were able to recruit an adequate sample from each institution
to detect reasonably-sized impacts of the intervention.
Based on the eligibility criteria above and the size of enrollments at our partner institutions,
we recruited 3,804 students to participate in the pilot year intervention. In columns 2-4 of Table 1,
we present summary statistics by treatment status for the students in the analytic sample. To
5 At two-year institutions, students in pursuit of associate degrees who had completed 30 or more college-level
credits were eligible to participate. At four-year institutions, bachelor’s degree-seeking students who had completed
60 or more college-level credits were eligible for the study.
11
examine the extent to which the sample reflects the population of undergraduates attending public
colleges and universities nationally, in column 1 we show analogous statistics for a nationally
representative sample using data from the National Postsecondary Student Aid Study of 2012
(NPSAS:12). Across both treatment and control groups, approximately 40 percent of students in
the study sample are male, 55 percent are students of color, and the average age of students at the
start of the intervention was 24.8 years. Students in the study sample on average had a 29 percent
chance of dropout according to the prediction models we developed using historical data from
partner institutions (see section 4.3 for more details on these models), but students at community
colleges had a 17.5 percentage point higher risk of dropout on average compared to four-year
students in the study sample (40.4 percent versus 22.9 percent).
Our experimental sample resembles the national student population at public colleges with
respect to sex (40 percent male versus 43 percent, respectively) and academic achievement
(average GPAs are 2.96 and 2.88 among students in the study and nationwide, respectively).
However, students in our sample are slightly younger than the typical college enrollee on average
(24.8 years versus 25.9 years nationally). Students of color are also overrepresented in our sample
(55 percent versus 42 percent) because seven of the nine institutions that participated in the pilot
year intervention operate in urban areas. Our results generalize most to students attending public,
urban institutions in the United States for this reason.
In order to begin messaging students at the start of fall 2016, we randomized students in
late summer before fall enrollments finalized. This timeline was necessary to allow for adequate
time for data transfers between the research team, institutional partners, and text messaging
platform. Unfortunately, the timing of randomization produced unintended design effects at two
institutions. As shown in panel A of Figure 2, at one site (college 1) treated students were 8
12
percentage points more likely to enroll in fall 2016. This initial enrollment imbalance is not a
function of message outreach, which did not begin until after classes started, but it may contribute
to the downstream effects on fall completion (+5 percentage points) and spring re-enrollment (-5
percentage points) we observe at this site. In our preferred sample we exclude this site to avoid
upwardly (downwardly) biasing our treatment estimates on degree completion (re-enrollment).
At a second site (college 2 in Figure 2), treated students were 12 percentage points less
likely to graduate in fall 2016 for reasons that are also plausibly unrelated to the effectiveness of
the intervention. First, high-risk students at this institution were substantially less likely to enroll
in the fall (a similar issue as with college 1, though in the opposite direction). In Table A1, we
show that students in the top tercile of dropout risk were 7 percentage points less likely to enroll
initially and the fall degree effect (-16 percentage points) is largest for this group.6 Second, we
find no supporting evidence of a negative impact of the intervention for students at college 2. As
shown in Figure 2 and Appendix Figure A1, we find no evidence of negative impacts on other
outcomes we would expect to be associated with degree completion at college 2, such as credits
completed or GPA. Similarly, we show that at all other sites where treated and control students
enrolled at similar rates in fall 2016, there is no evidence of negative impacts on academic
outcomes. Later this fall we expect to receive student-level interaction data from the messaging
campaign. This data will us to further examine whether students responded negatively to message
outreach, thus providing an additional means of exploring the origins of the negative fall degree
effect at college 2.
The implementation challenges at these two sites influence the estimated treatment effects.
For example, across all nine sites, the effect on fall-to-spring re-enrollment is only negative at
6 The overall effect on fall completion declines by 25 percent when we exclude the top tercile of students.
13
college 1. As a result, if message outreach truly increased the likelihood of persistence, including
college 1 in the sample will attenuate the estimated treatment effect. Likewise, because: 1) college
2 is a two-year institution, 2) community college students in the study sample were at greater risk
of late dropout than four-year students on average, and 3) the negative effect on fall completion at
college 2 is more than twice as large as the degree impacts across all other sites in absolute
magnitude, college 2 will have an outsize influence on the estimates of degree impacts by dropout
risk. We therefore present estimates from the full sample as well as for samples in which we
exclude college 1, or college 2, or both institutions. Excluding either one of these sites yields
evaluation samples of 3,304 students; restricting both yields a sample of 2,804 students. Our
preferred estimates are from the latter sample that is free of all unintended implementation
challenges.
4.2. Intervention Design
Students randomly assigned to treatment received automated text messages during the
2016-17 academic year. From our review of existing literature and the student focus groups
Persistence Plus conducted, we hypothesized that students at risk of late dropout would be more
likely to misunderstand (or have little knowledge of) their academic requirements to graduate and
benefit considerably from academic advising and supports, such as tutoring services. We also
posited that late dropouts live busy lives which: 1) makes searching for support on campus
difficult, 2) increases the likelihood of forgetting important deadlines, such as re-applying for
financial aid and registering for courses, and 3) incites feelings of stress, anxiety, and frustration
which can make students concentrate on immediate continuation costs over the future benefits to
earning a degree.
14
We designed the message campaign to address each of these potential barriers to
completion. To simplify the process of accessing on-campus resources, one set of messages
encouraged students to connect with campus-based academic and financial resources and provided
them with specific contact and location information where assistance was available. For example,
the following message encouraged students to use tutoring resources: “Many students benefit from
the excellent tutors in the [CAMPUS LOCATION]. Make an appt. using [CAMPUS RESOURCE]
to make the best use of your time”. A second set of messages reminded students of upcoming
deadlines and encouraged them to make implementation plans that increase the likelihood of task
completion (Milkman, Beshears, Choi, Laibson, & Madrian, 2011; Nickerson & Rogers, 2010).
For example: “Priority filing for the FAFSA is Fri Mar 31. Filing on time guarantees you get the
max $ possible. When & where do you plan to complete the FAFSA?”. A third set of messages,
like the following example, leveraged psychological principles to help students set task-related
goals, manage their time during the school year, and reduce their stress levels: “Many studies show
that writing about what stresses you out can help you handle those feelings. Want to try it out?”.
Lastly, a fourth set of messages prompted students to identify their reasons for pursuing a degree
and reminded students at stressful times during the semester of the responses they provided to
sustain their commitment to graduation (Clark, Gill, Prowse, & Rush, 2017). A representative
sample of the messages treated students received is provided in Appendix B.7
Students received automated messages approximately three times per week for the duration
of the academic year. Approximately half of the messages were interactive, prompting students to
respond. Interactive messages were designed to encourage student engagement and to personalize
follow-up messages to students. If students responded with one of the keywords the message
7 We provide a representative sample because the complete list is almost 200 messages long, but the full list is
available upon request.
15
prompted, they would receive additional, more customized content. For example, during the spring
term students who reported uncertainty about their remaining math requirements received the
following message: “Last semester you were unsure whether you had any math requirements left
to graduate. Were you able to get that sorted out?”. Students who replied “Yes” then received the
following response: “Fantastic! If you're currently taking any math courses remember that you can
always visit the Math Lab in [ON CAMPUS LOCATION] for free tutoring”. Students who replied
“No” or “Unsure” received this response: “We don't want to see any missed courses derail your
plans for graduation. Talk to your advisor or the [NAME OF ADVISING CENTER] in [ON
CAMUPS LOCATION] soon about this issue”.
Non-interactive messages were also customized to each institution and according to
students’ background characteristics and prior academic record.8 In addition to receiving
automated outreach, half of students assigned to treatment at two institutions had the ability to
engage in two-way text interactions with advisors on campus. The intervention at these colleges
offered students more opportunity to receive real-time guidance and support from an advisor at
their institution. Across all campuses we observed a relatively high level of student engagement.
Sixty-nine percent of treated students responded to an interactive message, 35 percent replied 5 or
more times, and on average students responded to messages on 7 occasions during the school year.9
At all participating institutions, students assigned to the control condition did not receive
any text messages as part of the intervention but maintained access to the support structures
typically available on their campus. However, as discussed above, outreach to students, especially
8 For example, messages that reminded students to refile their FAFSA were customized to the deadlines and financial
aid resources available at each institution, and messages about receiving credit for courses taken at other institutions
were delivered to transfer students only. 9 The student-level interaction data we will receive later this fall will also allow us to examine the types of messages
students responded to and examine variation in effects by level of engagement. We will update the paper with those
results once the interaction data becomes available.

16
upper-division students, is scant at most public colleges and universities. Therefore, the relevant
counterfactual is that control group students did not receive personalized support unless they had
the time, motivation, and awareness to seek it out.
4.3. Data and Measures
The data for this study consists of student-level administrative records maintained and
provided by our institutional partners for both study participants and previous cohorts of students.
The specific data elements vary across schools due to availability, but in general we observe
baseline demographic and academic measures (e.g., gender, race, high school GPA and college
entrance exams, etc.) and term-by-term records of students’ financial aid receipt, enrollment
intensity (e.g., credits attempted), academic performance (e.g., credits completed, term and
cumulative GPA, etc.), and degree receipt.10
We use this data in three ways. First, we used the historical data provided by each
institution to develop school-specific logistic regression dropout prediction models. We modeled
the probability of dropout after students completed 30 or 60 college-level credits at two- and four-
year colleges, respectively, as a function of time-invariant student characteristics such as gender
and race/ethnicity, measures of students’ enrollment experiences and performance in college,
including whether they had previously stopped out, transferred schools, switched majors, and their
cumulative GPA through spring 2016, and measures of students’ financial need and aid receipt.
We then assigned risk ratings to students in the experimental sample using the dropout prediction
models.11 Students at greatest risk of dropout exhibited increasing rates of course failure and erratic
10 Degree receipt at this time is determined by the records our institutional/system partners maintain. In the future, we
will also be able to observe enrollment at non-partner institutions from National Student Clearinghouse records which
our partners routinely collect. 11 Due to cost constraints, recruitment was limited to 500 students per campus during the pilot year. At institutions
where the sample of eligible students exceeded this number, we also used the dropout predictions to exclude the most
inframarginal students from the study sample. Restrictions were employed at 7 of the 9 participating schools. Excluded

17
credit loads as they progressed in school and were more likely to have transferred into their current
institution. They were also more likely to be older, male, and students of color. Descriptive
statistics of the sample by dropout risk are presented in Table A2. Additional details pertaining to
model construction are provided in Appendix C.
Second, we use the data to assess whether students randomly assigned to the treatment and
control conditions appear to be equivalent in expectation on observable and unobservable
dimensions. Third, we rely on it to evaluate the impact of the intervention on students’ academic
progress and performance during the 2016-17 school year. We report on five outcome measures:
whether students re-enrolled to spring 2017, the number of credits attempted in spring 2017, the
number of credits completed in 2016-17, students’ GPA in 2016-17, and whether students
graduated in 2016-17.12
In addition to institutional academic and financial data, at one college we also observe
records of the on-campus resources students utilized in fall 2016 (e.g., whether students met with
a financial aid advisor, accessed tutoring services, etc.). This data is available because students at
the college are required to swipe their ID cards when they access support services. We use this
data to evaluate whether message outreach increased the likelihood and frequency with which
students sought out campus supports, and if so, whether this appears to be a mechanism through
which message outreach affected academic progress and performance.
4.4. Randomization Procedure and Baseline Equivalence
To investigate whether impacts of message outreach varied with risk of dropout, we
randomly assigned students to receive message outreach using a block randomization procedure
students had dropout probabilities below 10 percent or above 75 percent on average. The maximum lower-bound for
exclusion was set to 15 percent (at two institutions), and the minimum upper-bound was set to 60 percent (also at two
institutions). 12 We expect to receive fall 2017 registration records this fall to also report impacts on spring-to-fall re-enrollment.
18
that afforded greater statistical power to examine evidence for heterogeneity of treatment effects.
We implemented this procedure by predicting the probability of dropout for currently enrolled
students using the dropout models we developed. Within each institution, we then ranked students
by dropout risk and randomly assigned students with similar probabilities of dropout to either the
treatment or control conditions.
During the pilot year we also tested out different message variants to inform our
intervention design in future years. As a result, at most institutions students were randomly
assigned to one of three treatment arms: a control condition and two variants of the treatment group
which received slightly different messages.13 We grouped students into triads for this reason and
then randomly assigned students within risk groups to one of the three treatment arms. Of the 3,804
students in the full experimental sample, 2,526 students were randomly assigned to a treatment
arm and 1,278 were assigned to the control condition. In all analyses we aggregate treated students
into a pooled treatment group, as we do not observe evidence of differential effects by variant of
message outreach.
In column 5 of Table 1, we show that random assignment appears to have created
equivalent groups of students in the treatment and control conditions. Analogous results for the
conditioned samples are similar and reported in Table A3. Although treated students were 2.5
percentage points (6 percent) more likely to transfer into their current institution than the control
group, this is the only significant difference we detect among the thirteen covariate balance tests
reported. We conclude that randomization achieved baseline equivalence, although we
13 For example, at three campuses we randomly assigned one treatment group to receive only messages intended to
address informational and procedural obstacles to completion. The other treatment group received only messages
intended to address psychosocial barriers to completion.

19
additionally examine the stability of effect estimates by presenting models that do and do not
include pre-treatment covariates.
4.5. Empirical Strategy
To evaluate the effects of message outreach on academic progress and performance, we
estimate intent-to-treat (ITT) models of the following form using ordinary least squares or linear
probability models:
(3) 𝑌𝑖𝑏 = 𝛼 + 𝛽𝑇𝑖𝑏 + 𝛿𝑏 + 휁𝑋𝑖𝑏 + 휀𝑖𝑏,
where 𝑌𝑖𝑏 is one of the five academic outcomes (i.e., term credits completed, degree completion,
etc.) for student 𝑖 in randomization block 𝑏. 𝑇𝑖𝑏 is the treatment indicator set to one for students
assigned to receive text-message support and zero otherwise. 𝛿𝑏 denotes randomization block fixed
effects. The coefficient of interest in this model is 𝛽, which represents the causal estimate of being
assigned to receive text-based outreach during the 2016-17 school year. As discussed above, we
estimate models with and without the inclusion of student-level covariates (𝑋𝑖𝑏). This set of
covariates is comprised of indicators for sex, race/ethnicity (Black, Hispanic, Other, and Missing
Race), and transfer status at the start fall 2016, as well as continuous measures of age, cumulative
credits completed, cumulative GPA, and the fraction of total credits attempted that students earned
at the start of fall 2016. We do not include campus fixed effects in the model, as time-invariant
differences across campuses are already controlled for through the block dummies. 휀𝑖𝑏 is a student-
specific random error term, and in all results we report robust standard errors that allow for
heteroskedasticity in the error term.

20
We examine heterogeneity of treatment effects by dropout risk by estimating models of the
following form:14
(4) 𝑌𝑖𝑏 = 𝛼′ + 𝛽′𝑇𝑖𝑏 + 𝛾(𝑇𝑖𝑏 ∗ 𝐷𝑖𝑏) + 𝜏𝐷𝑖𝑏 + 𝛿𝑏′ + 휁′𝑋𝑖𝑗𝑏 + 휀′𝑖𝑗𝑏,
where, as before, 𝑖 and 𝑏 respectively index students and blocks, and 𝐷𝑖𝑏 denotes the mean-
centered risk rating assigned to each student from the dropout prediction models we developed.
To facilitate interpretation of the estimates, we scale the risk rating by a factor of 10 when
estimating equation (2). 𝛽′ therefore captures the estimated effect of being assigned to receive
message outreach for students with average risk of dropout and 𝛾 represents the marginal treatment
effect per 10-point increment in risk above the mean.
5. Results
5.1 Overall Impacts on Academic Achievement and Attainment
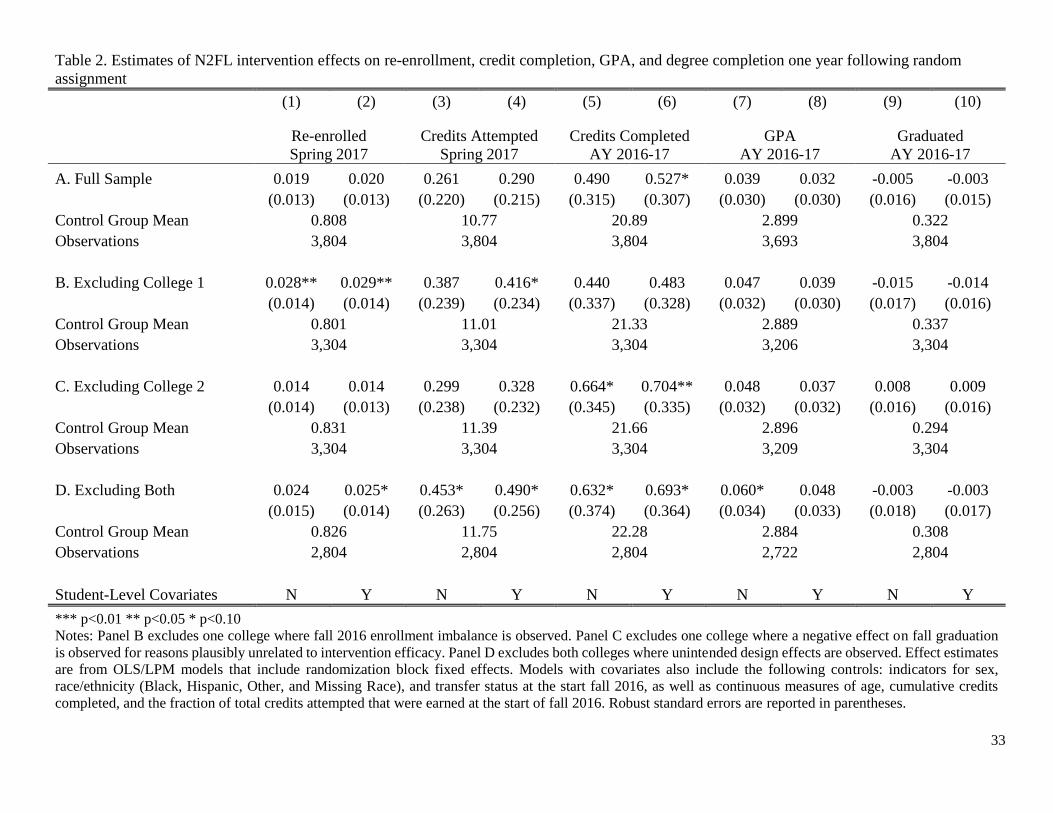
We present impacts of the intervention on academic outcomes for the full sample in Table
2. In odd-numbered columns, we report results from models of equation (3) that include only the
treatment indicator and randomization block fixed effects. In even-numbered columns, we show
results from models that also include pre-treatment covariates. The point estimates and standard
errors are nearly identical from the two models across all samples and outcomes, which reinforce
that randomization created balanced treatment and control groups. For parsimony, we only report
estimates from models that include baseline controls in the remainder of the paper.
In panel A of Table 2, we find little evidence of intervention impacts in the full sample.
With the exception of the point estimates on graduation, the coefficients are generally positive but
not significant at conventional levels. We find suggestive evidence of a positive impact on credit
14 We also investigated whether the intervention produced variation in effects by race, sex, credit attainment at the
start of the intervention, and institutional level and setting (i.e., urban versus non-urban). We find no evidence of
differential effects on these dimensions. These results are available upon request.

21
completion, although the magnitude of the estimate (0.53 credits) is substantively small and it is
only marginally significant at the 10 percent level. However, when we exclude college 1 from the
sample (panel B), the results indicate that message outreach increased the likelihood of re-
enrollment from fall to spring by 3 percentage points (4 percent over the control group mean). In
panel C we report estimates from the sample that includes college 1 but excludes college 2. The
magnitude of the coefficient on re-enrollment attenuates and is again not significant due to the
negative impact on spring re-enrollment at college 1, but the impact on credit completion (0.7
credits) re-emerges and is precisely estimated.
Panel D of Table 2 presents the results from our preferred sample that excludes both
institutions where we faced implementation challenges, as described above. Although the point
estimates are estimated less precisely in this smaller sample, we find suggestive evidence of
positive impacts on re-enrollment to spring 2017 (2.5 percentage points), credits attempted in
spring 2017 (0.5 credits), and credits completed throughout the 2016-17 academic year (0.7
credits). All of those estimates are marginally significant at the 10 percent level.15 The point
estimates on GPA are also positive (0.05-0.06 points) but only marginally significant in the model
without baseline controls. It is particularly noteworthy that the estimate on re-enrollment in Panel
D is similar to the one in Panel B. Because the impact on re-enrollment is robust to the exclusion
of college 2, the impact on fall-to-spring enrollment in Panel B appears to capture real gains in
academic progress and not a mechanical effect arising from higher rates of non-completion among
treated students in fall 2016. Despite indications that message outreach decreased fall-to-spring
15 The restricted sample is underpowered to detect effects of the magnitude we estimate. For example, the minimum
detectable effect on fall-to-spring re-enrollment is 0.039 percentage points in this sample. The marginally significant
estimates may thus reflect true impacts of message outreach on academic outcomes that will become more precisely
estimated when we recruit additional cohorts to the study in future years.

22
dropout by 14 percent, we find no evidence of impacts on overall degree attainment across all four
samples.
5.2 Impacts by Predicted Risk of Dropout
The null effects on completion may be due to the fact that the risk of dropout was low for
many students in the study sample. These inframarginal students would be expected to make steady
progress towards graduation regardless of whether or not they received low-touch nudges to set
goals, connect to resources, and remember deadlines. In Table 3, we therefore report results from
models of equation (4) which examine whether the intervention produced differential effects by
predicted risk of dropout. In our preferred results in panel D, we find evidence of positive impacts
on degree completion for students at higher risk of dropout. The estimate in column 5 of panel D
indicates that degree attainment in 2016-17 for students who received messages increased by 2.2
points for every 10-point increment in dropout risk. In Appendix Table A4, we report estimates of
degree effects by risk tercile to simplify interpretation of the variation in effects. Completion rates
for students in the top tercile of dropout risk – i.e., students predicted to have at least a 33 percent
chance of dropping out – increased 6.1 percentage points, from 16.2 percent to 22.3 percent, after
one year of intervention. The represents a 38 percent increase in completion relative to the control
group. We find no evidence that dropout risk moderated the impacts of message outreach on other
outcomes. The coefficients on the interaction term in columns 1-4 of panel D are substantively
small and not significant.
To further investigate whether the fall degree effect at college 2 conceals positive impacts
on degree completion broadly experienced among high-risk students across all sites, we examined
effects by dropout risk separately by term. These results are presented in Table 4. In column 2, we
find consistent evidence that higher risk students were more likely to graduate in spring 2017
23
across all samples. The coefficients on the interaction term imply that for every 10-point increase
in dropout risk above the mean, the probability of graduation in spring 2017 increased by 1.1-1.4
percentage points.16 The results in Table 4 therefore provide additional evidence that high-risk
students who received message outreach were more likely to graduate after one year of
intervention.
5.3 Did Message Outreach Lower Barriers to Accessing On-Campus Resources?
The text message campaign was designed to make it easier for students to engage with staff
and access supports on campus. We now turn to investigating whether message outreach achieved
this goal. As a reminder, these results are limited to a single institution that systematically collects
student-level data on campus resource usage, and as a result, they may not reflect how treated
students responded to the text message campaign at other campuses. It is also unfortunate that this
campus happens to be college 2, where the unintended implementation challenges make it difficult
to interpret impacts on academic outcomes.17 We therefore focus on the less ambiguous first-stage
effects of message outreach on resource take-up, but we report results of whether removing barriers
to resource use appears to be a channel through which attainment gains were realized in Appendix
A.
In Table 5, we present effects on whether students utilized various types of campus
resources in fall 2016 and how much support they received. The evidence suggests that treated
16 In column 1 of Table 4, which reports impacts on completion in fall 2016, the coefficients on the interaction term
are also positive when college 2 is excluded from the sample (panels C and D). Furthermore, all of the estimates in
panels A-C of column 2 are marginally significant at the 10 percent level, while in our preferred sample (panel D),
they are significant in both the fall and spring terms (0.009 and 0.014, respectively). 17 Because 2SLS estimates are proportional to reduced-form regressions of academic outcomes on treatment
assignment, the design effects at college 2 may lead to spurious results because the reduced-form estimates are
negative for some outcomes. Therefore, even if message outreach increased resource use and resource use is positively
correlated with academic performance and attainment, 2SLS estimates of resource effects on academic outcomes may
be negative and potentially misleading. The exclusion restriction imposed by 2SLS models – namely that all of the
treatment effect operates through resource use – is also likely to be violated and another reason for focusing primarily
on the first-stage results.
24
students made greater use of on-campus supports than their control group peers. In column 1, we
present effects on whether students made any use of on-campus resources. None of the point
estimates are significant and three of the four coefficients are negative, indicating that message
outreach did not influence whether or not students made use of on-campus supports. However,
estimates of effects on the amount of supports students received in column 3 are consistently
positive and the coefficients are large and significant on total resource usage and the amount of
tutoring support received. On average, students who received text messages accessed 1.2
additional hours of support in fall 2016 off a baseline of 2.5 hours for control group students.
Approximately half of this increase is attributed to more intensive use of tutoring services. Treated
students received 35 minutes of tutoring support on average during the semester, which represents
a fourfold increase over the control group mean.
In Appendix Table A5, we examine whether accessing additional campus resources
mediates the effects on academic progress by estimating two-stage least squares (2SLS)
specifications of resource usage on achievement and attainment. In addition to the fact that the
implementation issues make inference difficult, the F-statistics on all of the first-stage regressions
are below 6. Treatment assignment is therefore a weak instrument for resource use and may lead
to biased estimation. In summary, we do not find evidence that message outreach produced
impacts on attainment by connecting students to more on-campus supports, but the results are
inconclusive due to the implementation and weak instrument limitations.
6. Discussion
Pilot year results of the N2FL intervention indicate that many students who are within reach
of college graduation stand to benefit from more outreach. Although we find little evidence of
impacts on academic performance or degree attainment in the overall sample, in our preferred

25
sample that excludes two sites where we find evidence of unintended design effects, interactive
text messages designed to alleviate informational, procedural, and psychosocial barriers to
completion decreased fall-to-spring dropout by 14 percent, from 17.5 to 15 percent. This result is
noteworthy for two reasons. First, message outreach was not targeted exclusively to students at
risk of dropping out late into college, and our risk models predicted that many students in the study
faced minimal risk of non-completion. Furthermore, it is plausible that impacts on spring-to-fall
dropout will be larger given that dropout from college occurs more frequently between rather than
within school years (Long & Mabel, 2012). We expect to be able to examine effects on spring-to-
fall dropout soon after the fall 2018 term begins at each participating institution.
We also find suggestive evidence that message outreach increased degree attainment for
students at high-risk of dropout. Across all samples, the probability of graduation in spring 2017
increased by 1.1-1.4 percentage points per 10-point increase in dropout risk above the mean. In
our preferred sample, we find effects on degree completion for high-risk students in both the fall
and spring terms that translate into large impacts on degree completion one year following
intervention. For students in the top-tercile risk group with at least a 33 percent chance of dropout
according to our prediction models, the intervention increased degree completion after one year
by 6.1 percentage points, or 38 percent over the control group mean.
These findings compare favorably to interventions that target students at earlier points in
the college process and that are higher touch. For example, Castleman and Page (2015) find that
providing college-intending high school graduates with similar types of text-based support to
reduce “summer melt” between high school completion and college matriculation increased rates
of enrollment at two-year colleges by 3 percentage points. The degree effects for high-risk students
are also similar to impacts found from a randomized evaluation of InsideTrack, a more intensive
26
student coaching program that serves mostly non-traditional students (Bettinger & Baker, 2014).
Furthermore, N2FL cost only $100 per student including development and technology start-up
costs, and $20 per student when start-up costs are excluded. N2FL therefore produced one-year
degree effects for high-risk students roughly one-fifth the size and at less than 5 percent of the cost
of impacts from ASAP, a comprehensive multi-year student support initiative at CUNY’s
community colleges (Scrivener et al., 2015).18 Given evidence of the positive return on investment
to ASAP (Levin & Garcia, 2017), our preliminary findings suggest the return on investment to
providing high-risk students within a few semesters of graduating with low-cost support may also
be large, although it remains unclear whether the impacts on attainment we find after one year
represent brief or lasting gains. We will examine this question in the future by tracking students
over multiple years.
A second question that emerges is what components of the intervention increased student
attainment. Our findings indicate that message outreach substantially increased the use of campus
resources, but it remains unclear whether this was a channel through which the impacts on
academic progress were realized. Although the data currently in our disposal do not allow us to
test alternative mechanisms, the messages alone may have increased attainment for a number of
reasons. By reminding students to think about their future and what their degree can accomplish
for themselves and others, the messages may have helped to refocus students’ attention on the
long-term benefits of finishing school instead of the incremental time, effort, and financial costs
to attendance. Some messages were also designed to help students make specific plans about when
and where to study and complete important tasks, and prior research finds that students with poor
18 The per-student cost estimate for N2FL is an upper bound, as it includes content development and technology start-
up costs Persistence Plus incurred. When start-up costs are excluded, the per-student cost is approximately $20 per
student.

27
time management and procrastination tendencies are more likely to dropout from college (Beattie,
Laliberte, Michaud-Leclerc, & Oreopoulos, 2017). Evidence also suggests that prompting at-risk
students to identify concrete steps to achieving long-term goals can improve academic progress
and performance in college (Morisano, Hirsh, Peterson, Pihl, & Shore, 2010). Finally, some of the
messages were intended to build and reinforce students’ perceptions of themselves as successful
college students, which has also been shown to increase academic performance and early
persistence among undergraduates (Alter, Aronson, Darley, Rodriguez, & Ruble, 2010; Dee, 2014;
Ramirez & Beilock, 2011; Yeager et al., 2016).
We will continue to investigate possible mechanisms as new cohorts enter the study. Over
the next two years we will expand the study to include 25,000 students at approximately 20
institutions. This will allow us to examine effects on persistence and completion over a longer time
horizon and at scale for this student population. We also plan to examine the barriers to completion
for late dropouts in greater detail by refining the intervention design. In the next research phase,
one group of treated students on each campus will receive messages specifically designed to
address academic planning barriers to completion (e.g., by providing students with course
recommendations to complete their remaining requirements). Another group of students will
receive messages intended to address financial barriers to completion (e.g., by notifying students
that are at-risk of exhausting eligibility for financial aid). Through this work we hope to provide
valuable insights into the barriers that are most obstructive to students approaching completion
and offer policymakers and higher education leaders scalable solutions to address those obstacles.
28
REFERENCES
Alter, A. L., Aronson, J., Darley, J. M., Rodriguez, C., & Ruble, D. N. (2010). Rising to the
threat: Reducing stereotype threat by reframing the threat as a challenge. Journal of
Experimental Social Psychology, 46(1), 166–171.
Angrist, J., Lang, D., & Oreopoulos, P. (2009). Incentives and Services for College
Achievement: Evidence from a Randomized Trial. American Economic Journal: Applied
Economics, 1(1), 136–163.
Autor, D. H. (2014). Skills, education, and the rise of earnings inequality among the “other 99
percent.” Science, 344(6186), 843–51.
Avery, C., & Turner, S. (2012). Student loans: Do college students borrow too much—or not
enough? Journal of Economic Perspectives, 26(1), 165–192.
Bailey, M. J., & Dynarski, S. M. (2011). Inequality in postsecondary education. In G. J. Duncan
& R. J. Murnane (Eds.), Whither Opportunity (pp. 117–132). New York: Russell Sage
Foundation.
Beattie, G., Laliberte, J.-W. P., Michaud-Leclerc, C., & Oreopoulos, P. (2017). What sets college
thrivers and divers apart? A contrast in study habits, attitudes, and mental health (NBER
Working Paper No. 23588). Cambridge: National Bureau of Economic Research.
Bettinger, E. P., & Baker, R. B. (2014). The Effects of Student Coaching: An Evaluation of a
Randomized Experiment in Student Advising. Educational Evaluation and Policy Analysis,
36(1), 3–19.
Bettinger, E. P., Boatman, A., & Long, B. T. (2013). Student Supports: Developmental
Education and Other Academic Programs. The Future of Children, 23(1), 93–115.
Bettinger, E. P., & Long, B. T. (2009). Addressing the needs of underprepared students in higher
education: Does college remediation work? Journal of Human Resources, 44(3), 736–771.
Bound, J., Lovenheim, M. F., & Turner, S. (2010). Why Have College Completion Rates
Declined? An Analysis of Changing Student Preparation and Collegiate Resources.
American Economic Journal: Applied Economics, 2(3), 129–157.
Bowen, W. G., Chingos, M. M., & McPherson, M. S. (2009). Crossing the finish line:
Completing college at America’s public universities. Princeton, NJ: Princeton University
Press.
Cadena, B. C., & Keys, B. J. (2015). Human Capital and the Lifetime Costs of Impatience.
American Economic Journal: Economic Policy, 7(3), 126–53.
Carnevale, A. P., Jayasundera, T., & Gulish, A. (2016). America’s divided recovery: College
have and have-nots. Washington, DC: Georgetown University, Center on Education and the
Workforce.
Castleman, B. L., & Page, L. C. (2015). Summer nudging: Can personalized text messages and
peer mentor outreach increase college going among low-income high school graduates?
Journal of Economic Behavior and Organization, 115(9), 144–160.
Castleman, B. L., & Page, L. C. (2016). Freshman year financial aid nudges: An experiment to
29
increase FAFSA renewal and college persistence. Journal of Human Resources, 51(2), 389–
415.
Castleman, B. L., Schwartz, S., & Baum, S. (Eds.). (2015). Decision making for student success:
Behavioral insights to improve college access and persistence. New York: Routledge.
Center for Community College Student Engagement. (2015). Community college survey of
student engagement. Austin: University of Texas at Austin, Center for Community College
Student Engagement.
Chetty, R., Friedman, J. N., Saez, E., Turner, N., & Yagan, D. (2017). Mobility report cards: The
role of colleges in intergenerational mobility. Unpublished manuscript.
Clark, D., Gill, D., Prowse, V., & Rush, M. (2017). Using goals to motivate college students:
Theory and evidence from field experiments (NBER Working Paper No. 23638).
Cambridge: National Bureau of Economic Research.
Clotfelter, C. T., Hemelt, S. W., & Ladd, H. F. (2016). Multifaceted aid for low-income students
and college outcomes: Evidence from North Carolina (NBER Working Paper No. 22217).
Cambridge: National Bureau of Economic Research.
Dee, T. S. (2014). Stereotype threat and the student athlete. Economic Inquiry, 52(1), 173–182.
Deming, D. J., & Walters, C. R. (2017). The impact of price caps and spending cuts on U.S.
postsecondary attainment (NBER No. 23736). Cambridge: National Bureau of Economic
Research.
Erisman, W., & Steele, P. (2015). Adult college completion in the 21st century: What we know
and what we don’t. Washington, DC: Higher Ed Insight.
Grubb, W. N. (2006). Like, what do I do now? In T. Bailey & V. S. Morset (Eds.), Defending the
community college equity agenda (pp. 195–222). Baltimore: Johns Hopkins University
Press.
Gurantz, O. (2015). Who loses out? Registration order, course availability, and student behaviors
in community college. The Journal of Higher Education, 86(4), 524–563.
Horn, L., & Paslov, J. (2014). Data point: Out-of-pocket net price for college (NCES 2014-902).
Washington, DC: U.S. Department of Education, National Center for Education Statistics,
Institute of Education Sciences.
Lavecchia, A. M., Liu, H., & Oreopoulos, P. (2014). Behavioral Economics of Education:
Progress and Possibilities (NBER Working Paper No. 20609). Cambridge: National Bureau
of Economic Research.
Levin, H. M., & Garcia, E. (2017). Accelerating community college graduation rates: A benefit-
cost analysis. The Journal of Higher Education, 1–27.
Long, B. T., & Mabel, Z. (2012). Barriers to college success: Pipeline progress to degree
completion. Cambridge: Harvard Graduate School of Education. Unpublished manuscript.
Mabel, Z., & Britton, T. (2017). Leaving late: Understanding the extent and predictors of college
late departure. Cambridge: Harvard Graduate School of Education. Unpublished
manuscript.
.
30
Martorell, P., & McFarlin, I. (2011). Help or Hindrance? The Effects of College Remediation on
Academic and Labor Market Outcomes. Review of Economics and Statistics, 93(2), 436–
454.
Milkman, K. L., Beshears, J., Choi, J. J., Laibson, D., & Madrian, B. C. (2011). Using
implementation intentions prompts to enhance influenza vaccination rates. Proceedings of
the National Academy of Sciences of the United States of America, 108(26), 10415–20.
Morisano, D., Hirsh, J. B., Peterson, J. B., Pihl, R. O., & Shore, B. M. (2010). Setting,
elaborating, and reflecting on personal goals improves academic performance. Journal of
Applied Psychoogy, 95(2), 255–264.
Nickerson, D. W., & Rogers, T. (2010). Do You Have a Voting Plan? Implementation Intentions,
Voter Turnout, and Organic Plan Making. Psychological Science, 21(2), 194–199.
Nodine, T., Jaeger, L., Venezia, A., & Bracco, K. R. (2012). Connection by design: Students’
perceptions of their community college experience. San Francisco: WestEd.
Ramirez, G., & Beilock, S. L. (2011). Writing about testing worries boosts exam performance in
the classroom. Science, 331(6014), 211–213.
Rosenbaum, J. E., Deil-Amen, R., & Person, A. E. (2006). After admission: From college access
to college success. New York: Russell Sage Foundation.
Rutschow, E. Z., Cullinan, D., & Welbeck, R. (2012). Keeping students on course: An impact
study of a student success course at Guilford Technical Community College. New York:
MDRC.
Schneider, M. (2010). Finishing the first lap: The cost of first-year student attrition in America’s
four-year colleges and universities. Washington, DC: American Institutes for Research.
Schneider, M., & Yin, L. (2011). The hidden costs of community colleges. Washington, DC:
American Institutes for Research.
Scott-Clayton, J. (2015). The shapeless river: Does a lack of structure inhibit students’ progress
at community college? In B. L. Castleman, S. Schwartz, & S. Baum (Eds.), Decision
making for student success: Behavioral insights to improve college access and persistence.
New York: Routledge.
Scott-Clayton, J., Crosta, P. M., & Belfield, C. R. (2014). Improving the targeting of treatment:
Evidence from college remediation. Educational Evaluation and Policy Analysis, 36(3),
371–393.
Scrivener, S., Weiss, M. J., Ratledge, A., Rudd, T., Sommo, C., & Fresques, H. (2015). Doubling
graduation rates: Three-year effects of CUNY’s Accelerated Study in Associate Programs
(ASAP) for Developmental Education Students. New York: MDRC.
Shapiro, D., Dundar, A., Wakhungu, P. K., Yuan, X., Nathan, A., & Hwang, Y. (2016).
Completing College: A National View of Student Attainment Rates - Fall 2010 Cohort
(Signature Report No. 12). Herndon: National Student Clearinghouse Research Center.
Shapiro, D., Dundar, A., Yuan, X., Harrell, A., Wild, J., & Ziskin, M. (2014). Some College, No
Degree: A National View of Students with Some College Enrollment, but No Completion.
Herndon: National Student Clearinghouse Research Center.
31
U.S. Department of Education. (2015). Digest of Education Statistics 2014, Table 104.92.
Retrieved July 28, 2017, from
https://nces.ed.gov/programs/digest/d14/tables/dt14_104.92.asp
U.S. Department of Education. (2017). Digest of Education Statistics 2016, Table 503.40.
Retrieved from https://nces.ed.gov/programs/digest/d16/tables/dt16_503.40.asp
Visher, M. G., Weiss, M. J., Weissman, E., Rudd, T., & Wathington, H. D. (2012). The Effects of
Learning Communities for Students in Developmental Education: A Synthesis of Findings
from Six Community Colleges. New York: MDRC.
Yeager, D. S., Walton, G. M., Brady, S. T., Akcinar, E. N., Paunesku, D., Keane, L., … Dweck,
C. S. (2016). Teaching a lay theory before college narrows achievement gaps at scale.
Proceedings of the National Academy of Sciences of the United States, 113(24), E3341–
E3348.

32
Table 1. Pre-treatment characteristics of the experimental sample by treatment condition and summary statistics of a nationally
representative sample of undergraduates attending public institutions
(1) (2) (3) (4) (5)
Experimental Sample
NPSAS:12
Sample
All
Students
Treated
Students
Control
Students
T-C
Difference
Male 0.430 0.396 0.390 0.408 -0.013
Black 0.161 0.185 0.194 0.167 -0.003
Hispanic 0.160 0.244 0.257 0.219 0.002
White 0.579 0.389 0.369 0.429 0.015
Race other 0.100 0.121 0.117 0.128 -0.013
Race missing 0.062 0.065 0.058 -0.002
Age 25.9 24.8 25.2 24.1 0.218
Cumulative GPA 2.88 2.96 2.97 2.93 0.023
Attended urban institution 0.543 0.788
Enrolled in public 2-year institution 0.427 0.343
Enrolled in public 4-year institution 0.573 0.657
Transferred into current school 0.473 0.498 0.423 0.025**
Share of total attempted credits earned through spring 2016 0.937 0.938 0.936 0.004
Cumulative credits earned through spring 2016 80.2 79.9 80.9 -0.433
Predicted risk of dropout 0.289 0.290 0.288 -0.000
Enrolled in fall 2016 0.963 0.964 0.962 0.006
Number of students 58,410 3,804 2,526 1,278 3,804
*** p<0.01 ** p<0.05 * p<0.10
Notes: The data in column 1 is from the National Postsecondary Student Aid Study of 2012 (NPSAS:12). The NPSAS:12 sample is restricted to
students attending public two- or four-year institutions and summary statistics are calculated using survey sampling weights. The data in columns
2-5 are from N2FL partner institution administrative records. Means are reported in columns 1-4. Estimates of post-randomization balance are
reported in column 5 from OLS/LPM models that include randomization block fixed effects.
33
Table 2. Estimates of N2FL intervention effects on re-enrollment, credit completion, GPA, and degree completion one year following random
assignment
(1) (2) (3) (4) (5) (6) (7) (8) (9) (10)
Re-enrolled
Spring 2017
Credits Attempted
Spring 2017
Credits Completed
AY 2016-17
GPA
AY 2016-17
Graduated
AY 2016-17
A. Full Sample 0.019 0.020 0.261 0.290 0.490 0.527* 0.039 0.032 -0.005 -0.003
(0.013) (0.013) (0.220) (0.215) (0.315) (0.307) (0.030) (0.030) (0.016) (0.015)
Control Group Mean 0.808 10.77 20.89 2.899 0.322
Observations 3,804 3,804 3,804 3,693 3,804
B. Excluding College 1 0.028** 0.029** 0.387 0.416* 0.440 0.483 0.047 0.039 -0.015 -0.014
(0.014) (0.014) (0.239) (0.234) (0.337) (0.328) (0.032) (0.030) (0.017) (0.016)
Control Group Mean 0.801 11.01 21.33 2.889 0.337
Observations 3,304 3,304 3,304 3,206 3,304
C. Excluding College 2 0.014 0.014 0.299 0.328 0.664* 0.704** 0.048 0.037 0.008 0.009
(0.014) (0.013) (0.238) (0.232) (0.345) (0.335) (0.032) (0.032) (0.016) (0.016)
Control Group Mean 0.831 11.39 21.66 2.896 0.294
Observations 3,304 3,304 3,304 3,209 3,304
D. Excluding Both 0.024 0.025* 0.453* 0.490* 0.632* 0.693* 0.060* 0.048 -0.003 -0.003
(0.015) (0.014) (0.263) (0.256) (0.374) (0.364) (0.034) (0.033) (0.018) (0.017)
Control Group Mean 0.826 11.75 22.28 2.884 0.308
Observations 2,804 2,804 2,804 2,722 2,804
Student-Level Covariates N Y N Y N Y N Y N Y
*** p<0.01 ** p<0.05 * p<0.10
Notes: Panel B excludes one college where fall 2016 enrollment imbalance is observed. Panel C excludes one college where a negative effect on fall graduation
is observed for reasons plausibly unrelated to intervention efficacy. Panel D excludes both colleges where unintended design effects are observed. Effect estimates
are from OLS/LPM models that include randomization block fixed effects. Models with covariates also include the following controls: indicators for sex,
race/ethnicity (Black, Hispanic, Other, and Missing Race), and transfer status at the start fall 2016, as well as continuous measures of age, cumulative credits
completed, and the fraction of total credits attempted that were earned at the start of fall 2016. Robust standard errors are reported in parentheses.

34
Table 3. Estimates of N2FL intervention effects on re-enrollment, credit completion, GPA, and degree completion one year
following random assignment by predicted risk of dropout
(1) (2) (3) (4) (5)
Re-enrolled
Spring 2017
Credits
Attempted
Spring 2017
Credits
Completed
AY
2016-17
GPA
AY
2016-17
Graduated
AY
2016-17
A. Full Sample
Treatment x Predicted Dropout Risk -0.002 -0.181* -0.258 0.002 0.005
(0.007) (0.107) (0.160) (0.018) (0.007)
Treatment 0.020 0.293 0.531* 0.032 -0.003
(0.013) (0.216) (0.307) (0.030) (0.015)
Control Group Mean (at average risk = 0.288) 0.808 10.77 20.89 2.90 0.322
Observations 3,804 3,804 3,804 3,693 3,804
B. Excluding College 1
Treatment x Predicted Dropout Risk -0.004 -0.215* -0.295* -0.005 0.007
(0.008) (0.111) (0.164) (0.018) (0.008)
Treatment 0.029** 0.418* 0.486 0.039 -0.015
(0.014) (0.234) (0.328) (0.030) (0.016)
Control Group Mean (at average risk = 0.293) 0.801 11.01 21.33 2.89 0.337
Observations 3,304 3,304 3,304 3,206 3,304
C. Excluding College 2
Treatment x Predicted Dropout Risk -0.000 -0.125 -0.073 0.019 0.019***
(0.008) (0.117) (0.176) (0.020) (0.007)
Treatment 0.014 0.314 0.695** 0.039 0.011
(0.014) (0.230) (0.334) (0.033) (0.016)
Control Group Mean (at average risk = 0.276) 0.831 11.39 21.66 2.896 0.294
Observations 3,304 3,304 3,304 3,209 3,304

35
Table 3. Estimates of N2FL intervention effects on re-enrollment, credit completion, GPA, and degree completion one year
following random assignment by predicted risk of dropout
D. Excluding Both
Treatment x Predicted Dropout Risk -0.001 -0.150 -0.100 0.015 0.022***
(0.008) (0.122) (0.182) (0.021) (0.008)
Treatment 0.025* 0.482* 0.686* 0.050 -0.002
(0.015) (0.255) (0.363) (0.033) (0.017)
Control Group Mean (at average risk = 0.280) 0.826 11.75 22.28 2.88 0.308
Observations 2,804 2,804 2,804 2,722 2,804
*** p<0.01 ** p<0.05 * p<0.10
Notes: Panel B excludes one college where fall 2016 enrollment imbalance is observed. Panel C excludes one college where a negative effect on
fall graduation is observed for reasons plausibly unrelated to intervention efficacy. Panel D excludes both colleges where unintended design effects
are observed. Estimates are from OLS/LPM models that include randomization block fixed effects and pre-treatment covariates. See table 2 for
details. Risk ratings are centered on the mean and multiplied by 10 so that the coefficient on the main treatment term reports the average treatment
effect and the coefficient on the interaction term reports the marginal effect per 10-point increase in predicted dropout risk. Robust standard errors
are reported in parentheses.
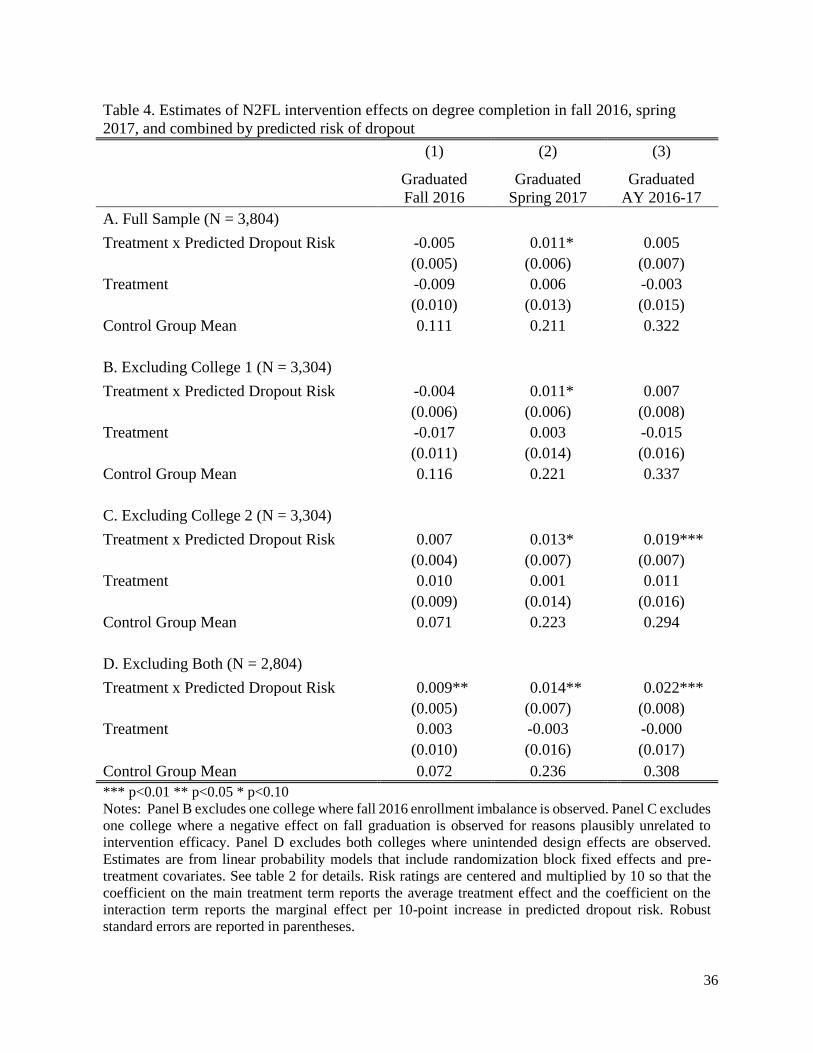
36
Table 4. Estimates of N2FL intervention effects on degree completion in fall 2016, spring
2017, and combined by predicted risk of dropout
(1) (2) (3)
Graduated
Fall 2016
Graduated
Spring 2017
Graduated
AY 2016-17
A. Full Sample (N = 3,804)
Treatment x Predicted Dropout Risk -0.005 0.011* 0.005
(0.005) (0.006) (0.007)
Treatment -0.009 0.006 -0.003
(0.010) (0.013) (0.015)
Control Group Mean 0.111 0.211 0.322
B. Excluding College 1 (N = 3,304)
Treatment x Predicted Dropout Risk -0.004 0.011* 0.007
(0.006) (0.006) (0.008)
Treatment -0.017 0.003 -0.015
(0.011) (0.014) (0.016)
Control Group Mean 0.116 0.221 0.337
C. Excluding College 2 (N = 3,304)
Treatment x Predicted Dropout Risk 0.007 0.013* 0.019***
(0.004) (0.007) (0.007)
Treatment 0.010 0.001 0.011
(0.009) (0.014) (0.016)
Control Group Mean 0.071 0.223 0.294
D. Excluding Both (N = 2,804)
Treatment x Predicted Dropout Risk 0.009** 0.014** 0.022***
(0.005) (0.007) (0.008)
Treatment 0.003 -0.003 -0.000
(0.010) (0.016) (0.017)
Control Group Mean 0.072 0.236 0.308
*** p<0.01 ** p<0.05 * p<0.10
Notes: Panel B excludes one college where fall 2016 enrollment imbalance is observed. Panel C excludes
one college where a negative effect on fall graduation is observed for reasons plausibly unrelated to
intervention efficacy. Panel D excludes both colleges where unintended design effects are observed.
Estimates are from linear probability models that include randomization block fixed effects and pre-
treatment covariates. See table 2 for details. Risk ratings are centered and multiplied by 10 so that the
coefficient on the main treatment term reports the average treatment effect and the coefficient on the
interaction term reports the marginal effect per 10-point increase in predicted dropout risk. Robust
standard errors are reported in parentheses.
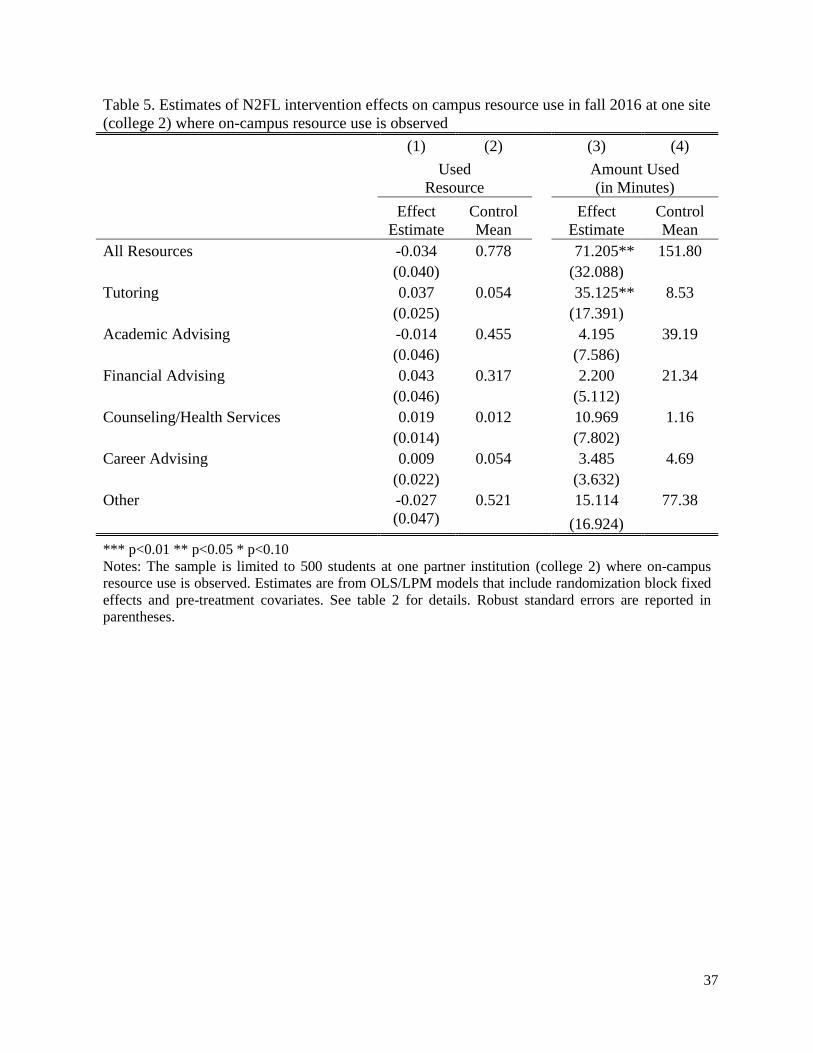
37
Table 5. Estimates of N2FL intervention effects on campus resource use in fall 2016 at one site
(college 2) where on-campus resource use is observed
(1) (2) (3) (4)
Used
Resource
Amount Used
(in Minutes)
Effect
Estimate
Control
Mean
Effect
Estimate
Control
Mean
All Resources -0.034 0.778 71.205** 151.80
(0.040) (32.088)
Tutoring 0.037 0.054 35.125** 8.53
(0.025) (17.391)
Academic Advising -0.014 0.455 4.195 39.19
(0.046) (7.586)
Financial Advising 0.043 0.317 2.200 21.34
(0.046) (5.112)
Counseling/Health Services 0.019 0.012 10.969 1.16
(0.014) (7.802)
Career Advising 0.009 0.054 3.485 4.69
(0.022) (3.632)
Other -0.027 0.521 15.114 77.38
(0.047) (16.924)
*** p<0.01 ** p<0.05 * p<0.10
Notes: The sample is limited to 500 students at one partner institution (college 2) where on-campus
resource use is observed. Estimates are from OLS/LPM models that include randomization block fixed
effects and pre-treatment covariates. See table 2 for details. Robust standard errors are reported in
parentheses.
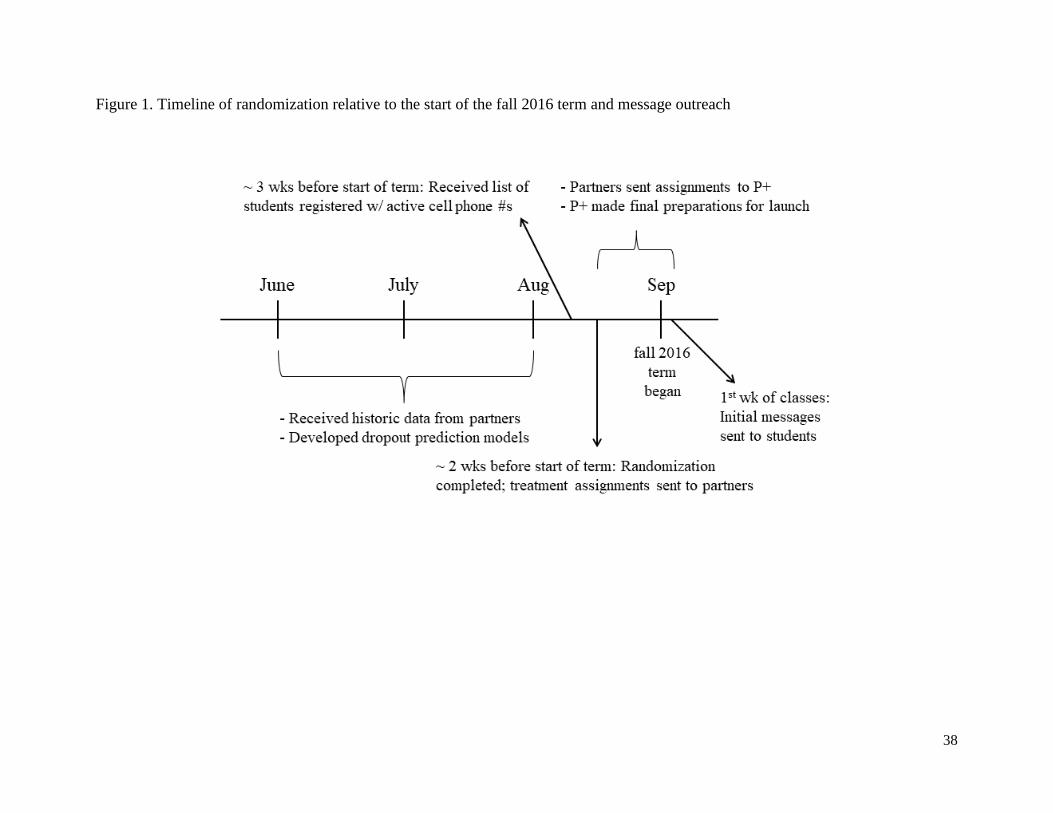
38
Figure 1. Timeline of randomization relative to the start of the fall 2016 term and message outreach
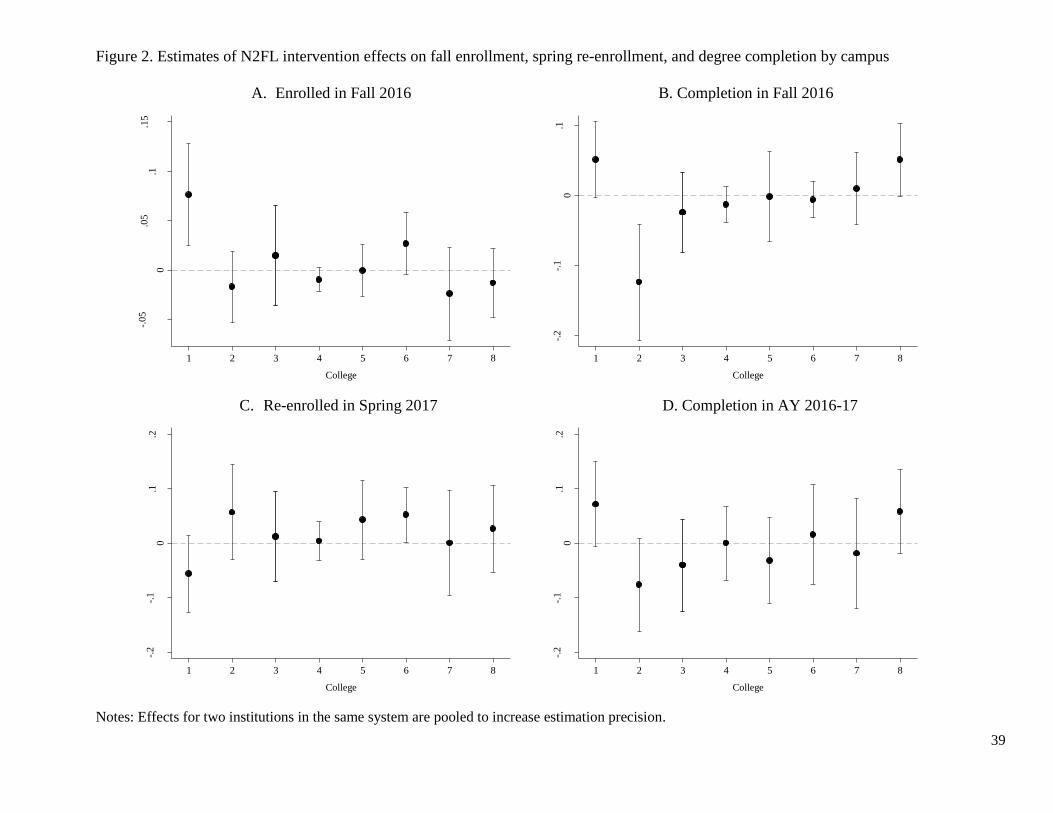
39
Figure 2. Estimates of N2FL intervention effects on fall enrollment, spring re-enrollment, and degree completion by campus
A. Enrolled in Fall 2016 B. Completion in Fall 2016
C. Re-enrolled in Spring 2017 D. Completion in AY 2016-17
Notes: Effects for two institutions in the same system are pooled to increase estimation precision.
-.05
0
.05
.1.1
5
Eff
ect
Est
imat
e
1 2 3 4 5 6 7 8
College
-.2
-.1
0.1
Eff
ect
Est
imat
e
1 2 3 4 5 6 7 8
College
-.2
-.1
0.1
.2
Eff
ect
Est
imat
e
1 2 3 4 5 6 7 8
College
-.2
-.1
0.1
.2
Eff
ect
Est
imat
e
1 2 3 4 5 6 7 8
College
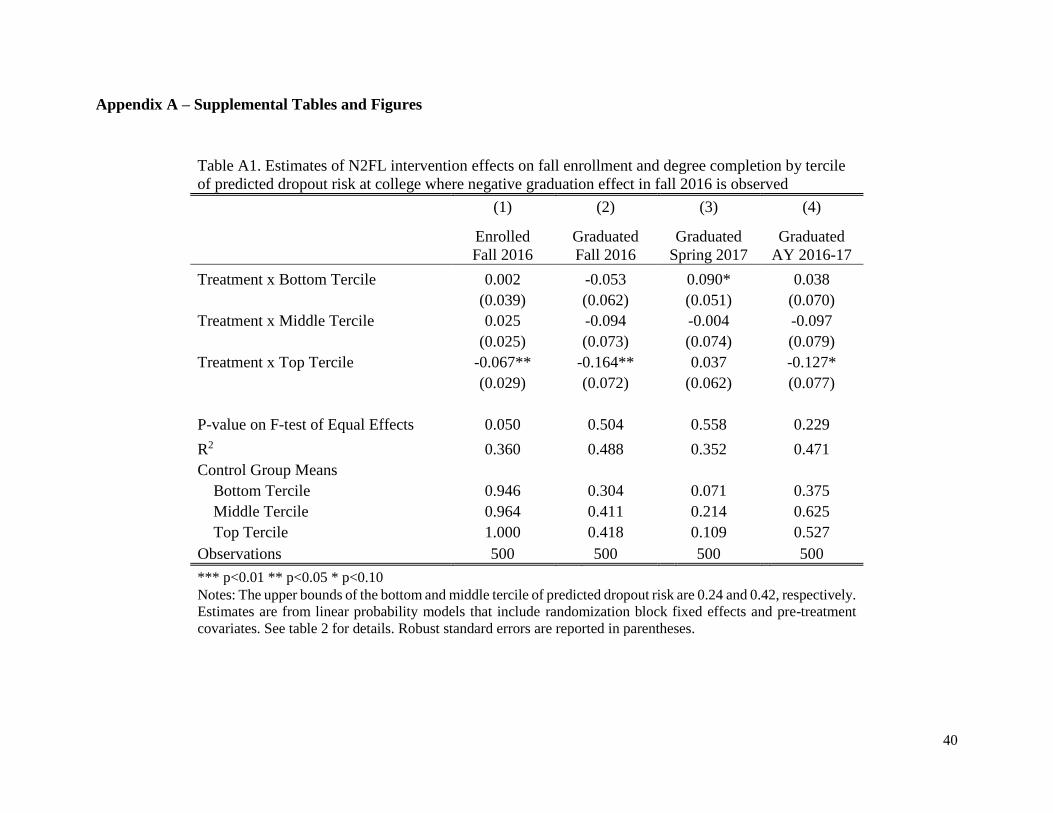
40
Appendix A – Supplemental Tables and Figures
Table A1. Estimates of N2FL intervention effects on fall enrollment and degree completion by tercile
of predicted dropout risk at college where negative graduation effect in fall 2016 is observed
(1) (2) (3) (4)
Enrolled
Fall 2016
Graduated
Fall 2016
Graduated
Spring 2017
Graduated
AY 2016-17
Treatment x Bottom Tercile 0.002 -0.053 0.090* 0.038
(0.039) (0.062) (0.051) (0.070)
Treatment x Middle Tercile 0.025 -0.094 -0.004 -0.097
(0.025) (0.073) (0.074) (0.079)
Treatment x Top Tercile -0.067** -0.164** 0.037 -0.127*
(0.029) (0.072) (0.062) (0.077)
P-value on F-test of Equal Effects 0.050 0.504 0.558 0.229
R2 0.360 0.488 0.352 0.471
Control Group Means
Bottom Tercile 0.946 0.304 0.071 0.375
Middle Tercile 0.964 0.411 0.214 0.625
Top Tercile 1.000 0.418 0.109 0.527
Observations 500 500 500 500
*** p<0.01 ** p<0.05 * p<0.10
Notes: The upper bounds of the bottom and middle tercile of predicted dropout risk are 0.24 and 0.42, respectively.
Estimates are from linear probability models that include randomization block fixed effects and pre-treatment
covariates. See table 2 for details. Robust standard errors are reported in parentheses.

41
Table A2. Pre-treatment characteristics of experimental sample by tercile of predicted dropout risk
(1) (2) (3)
Bottom
Tercile
Middle
Tercile
Top
Tercile
Male 0.378 0.045** 0.052**
Black 0.145 -0.014 0.031*
Hispanic 0.248 0.022 0.020
White 0.433 -0.009 -0.039**
Race other 0.123 0.002 0.000
Age 23.43 1.670*** 3.041***
Cumulative GPA 3.113 -0.103*** -0.497***
Transferred into current school 0.509 0.036** 0.066***
Share of total attempted credits earned through spring 2016 0.953 -0.011** -0.060***
Cumulative credits earned through spring 2016 93.61 -5.654*** -5.940***
Number of students 1,268 1,268 1,268
*** p<0.01 ** p<0.05 * p<0.10
Notes: Means are reported in columns 1. Differences relative to bottom-tercile students are reported in columns 2
and 3 from OLS/LPM models that include school fixed effects. The range of risk ratings in the bottom, middle, and
top terciles are: 0-0.18; 0.18-0.32; and 0.32-0.97, respective. The respective means by tercile are 0.13, 0.24, and
0.50.
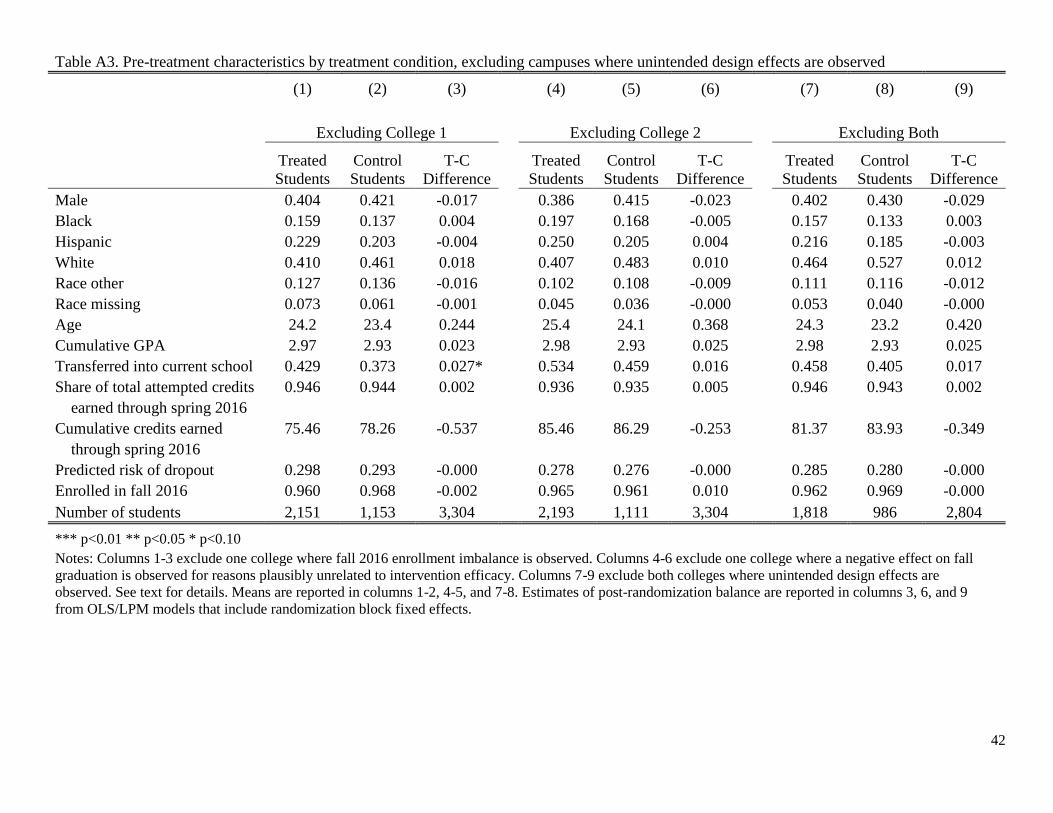
42
Table A3. Pre-treatment characteristics by treatment condition, excluding campuses where unintended design effects are observed
(1) (2) (3) (4) (5) (6) (7) (8) (9)
Excluding College 1 Excluding College 2 Excluding Both
Treated
Students
Control
Students
T-C
Difference
Treated
Students
Control
Students
T-C
Difference
Treated
Students
Control
Students
T-C
Difference
Male 0.404 0.421 -0.017 0.386 0.415 -0.023 0.402 0.430 -0.029
Black 0.159 0.137 0.004 0.197 0.168 -0.005 0.157 0.133 0.003
Hispanic 0.229 0.203 -0.004 0.250 0.205 0.004 0.216 0.185 -0.003
White 0.410 0.461 0.018 0.407 0.483 0.010 0.464 0.527 0.012
Race other 0.127 0.136 -0.016 0.102 0.108 -0.009 0.111 0.116 -0.012
Race missing 0.073 0.061 -0.001 0.045 0.036 -0.000 0.053 0.040 -0.000
Age 24.2 23.4 0.244 25.4 24.1 0.368 24.3 23.2 0.420
Cumulative GPA 2.97 2.93 0.023 2.98 2.93 0.025 2.98 2.93 0.025
Transferred into current school 0.429 0.373 0.027* 0.534 0.459 0.016 0.458 0.405 0.017
Share of total attempted credits 0.946 0.944 0.002 0.936 0.935 0.005 0.946 0.943 0.002
earned through spring 2016
Cumulative credits earned 75.46 78.26 -0.537 85.46 86.29 -0.253 81.37 83.93 -0.349
through spring 2016
Predicted risk of dropout 0.298 0.293 -0.000 0.278 0.276 -0.000 0.285 0.280 -0.000
Enrolled in fall 2016 0.960 0.968 -0.002 0.965 0.961 0.010 0.962 0.969 -0.000
Number of students 2,151 1,153 3,304 2,193 1,111 3,304 1,818 986 2,804
*** p<0.01 ** p<0.05 * p<0.10
Notes: Columns 1-3 exclude one college where fall 2016 enrollment imbalance is observed. Columns 4-6 exclude one college where a negative effect on fall
graduation is observed for reasons plausibly unrelated to intervention efficacy. Columns 7-9 exclude both colleges where unintended design effects are
observed. See text for details. Means are reported in columns 1-2, 4-5, and 7-8. Estimates of post-randomization balance are reported in columns 3, 6, and 9
from OLS/LPM models that include randomization block fixed effects.
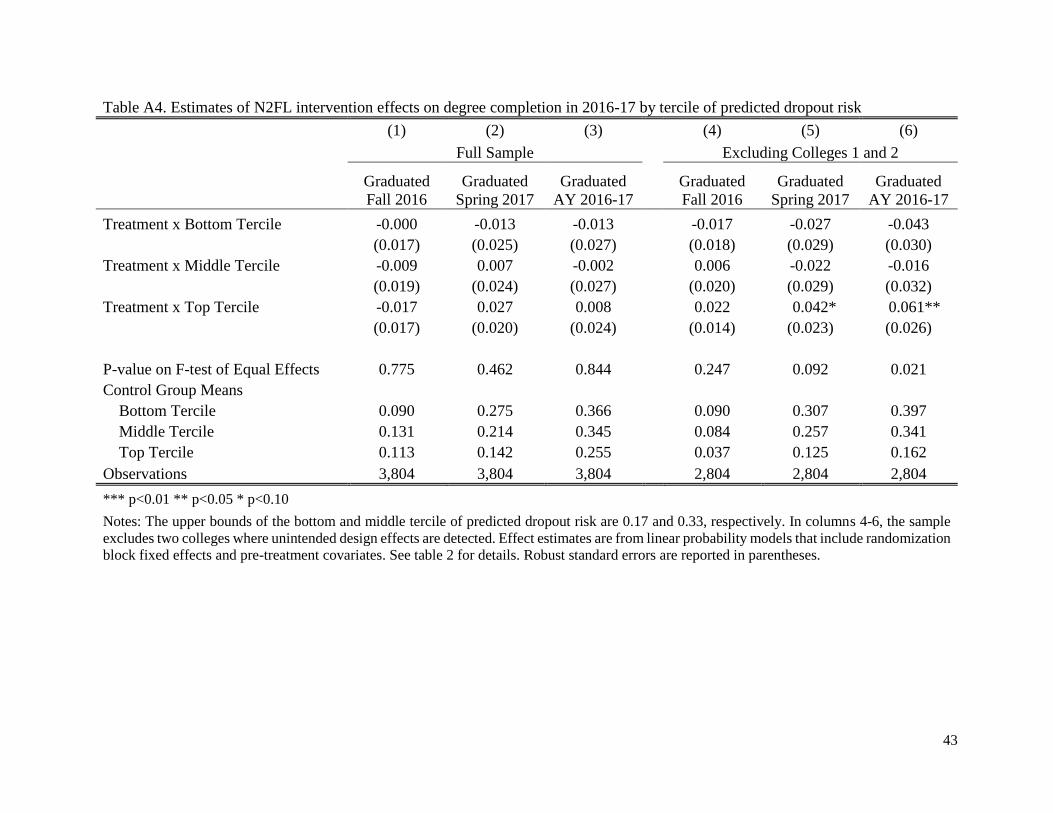
43
Table A4. Estimates of N2FL intervention effects on degree completion in 2016-17 by tercile of predicted dropout risk
(1) (2) (3) (4) (5) (6)
Full Sample Excluding Colleges 1 and 2
Graduated
Fall 2016
Graduated
Spring 2017
Graduated
AY 2016-17
Graduated
Fall 2016
Graduated
Spring 2017
Graduated
AY 2016-17
Treatment x Bottom Tercile -0.000 -0.013 -0.013 -0.017 -0.027 -0.043
(0.017) (0.025) (0.027) (0.018) (0.029) (0.030)
Treatment x Middle Tercile -0.009 0.007 -0.002 0.006 -0.022 -0.016
(0.019) (0.024) (0.027) (0.020) (0.029) (0.032)
Treatment x Top Tercile -0.017 0.027 0.008 0.022 0.042* 0.061**
(0.017) (0.020) (0.024) (0.014) (0.023) (0.026)
P-value on F-test of Equal Effects 0.775 0.462 0.844 0.247 0.092 0.021
Control Group Means
Bottom Tercile 0.090 0.275 0.366 0.090 0.307 0.397
Middle Tercile 0.131 0.214 0.345 0.084 0.257 0.341
Top Tercile 0.113 0.142 0.255 0.037 0.125 0.162
Observations 3,804 3,804 3,804 2,804 2,804 2,804
*** p<0.01 ** p<0.05 * p<0.10
Notes: The upper bounds of the bottom and middle tercile of predicted dropout risk are 0.17 and 0.33, respectively. In columns 4-6, the sample
excludes two colleges where unintended design effects are detected. Effect estimates are from linear probability models that include randomization
block fixed effects and pre-treatment covariates. See table 2 for details. Robust standard errors are reported in parentheses.
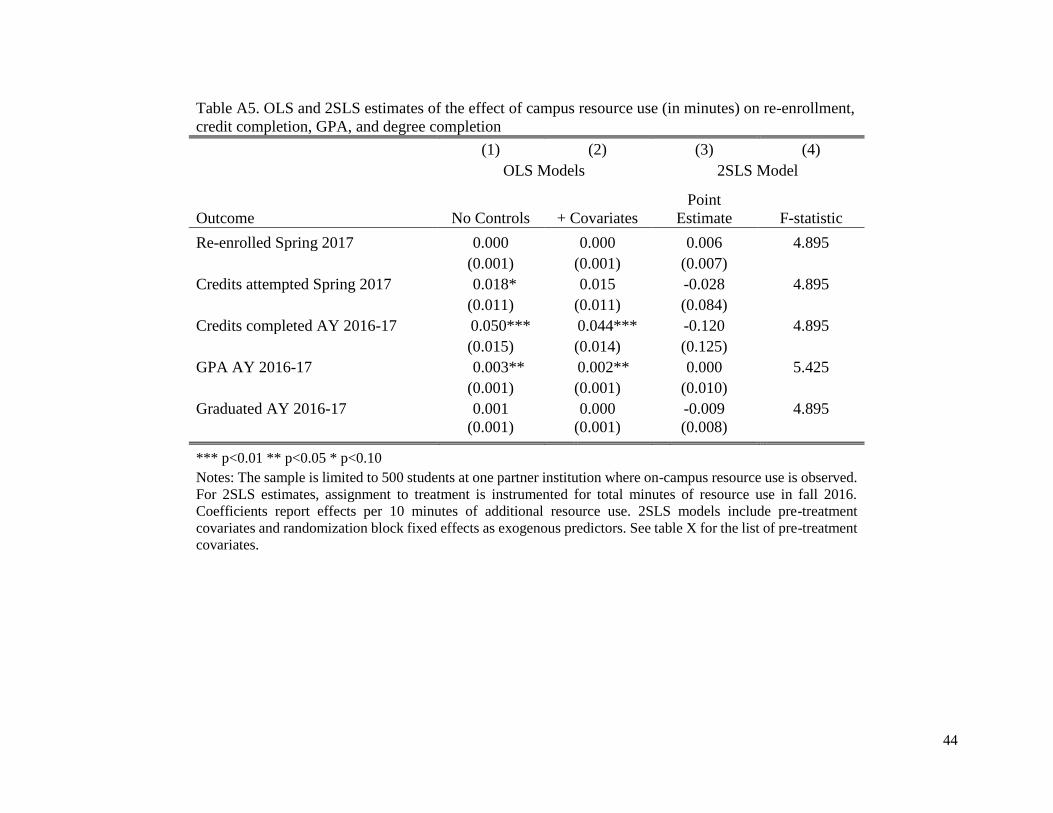
44
Table A5. OLS and 2SLS estimates of the effect of campus resource use (in minutes) on re-enrollment,
credit completion, GPA, and degree completion
(1) (2) (3) (4)
OLS Models 2SLS Model
Outcome No Controls
+ Covariates
Point
Estimate F-statistic
Re-enrolled Spring 2017 0.000 0.000 0.006 4.895
(0.001) (0.001) (0.007)
Credits attempted Spring 2017 0.018* 0.015 -0.028 4.895
(0.011) (0.011) (0.084)
Credits completed AY 2016-17 0.050*** 0.044*** -0.120 4.895
(0.015) (0.014) (0.125)
GPA AY 2016-17 0.003** 0.002** 0.000 5.425
(0.001) (0.001) (0.010)
Graduated AY 2016-17 0.001 0.000 -0.009 4.895
(0.001) (0.001) (0.008)
*** p<0.01 ** p<0.05 * p<0.10
Notes: The sample is limited to 500 students at one partner institution where on-campus resource use is observed.
For 2SLS estimates, assignment to treatment is instrumented for total minutes of resource use in fall 2016.
Coefficients report effects per 10 minutes of additional resource use. 2SLS models include pre-treatment
covariates and randomization block fixed effects as exogenous predictors. See table X for the list of pre-treatment
covariates.

45
Figure A1. Additional estimates of N2FL intervention effects on academic outcomes by campus
A. Credits Attempted in Spring 2017 B. Credits Earned in AY 2016-17
D. GPA in AY 2016-17 D. Completion in Spring 2017
Notes: Effects for two institutions in the same system are pooled to increase estimation precision.
-2-1
01
23
Eff
ect
Est
imat
e
1 2 3 4 5 6 7 8
College
-20
24
6
Eff
ect
Est
imat
e
1 2 3 4 5 6 7 8
College
-.2
0.2
.4.6
Eff
ect
Est
imat
e
1 2 3 4 5 6 7 8
College
-.15
-.1
-.05
0
.05
.1
Eff
ect
Est
imat
e
1 2 3 4 5 6 7 8
College

46
Appendix B – Example Messages Delivered to Students
Purpose: Introductory Message
Content: Welcome to [INSTITUTION NAME]’s graduation support! We'll send free texts to
help you complete your degree. Std msg & data rates may apply, STOP to end. More info?
Purpose: Course Enrollment Guidance
Content: If you're thinking about withdrawing from a class, ask an advisor first. Withdrawals
may affect your financial aid & increase the time it takes to graduate.
Purpose: Encouraging Use of Tutoring Resources
Content: Many [INSTITUTION NAME] students seek out tutoring to enhance their learning.
Do you need help with any of these [MATH, SCIENCE, WRITING, OTHER]?
Interactive Response to Students Who Replied “MATH”: Many students benefit from the
excellent tutors in the [CAMPUS LOCATION]. Make an appt. using [CAMPUS RESOURCE]
to make the best use of your time.
Purpose: Encouraging Reverse Degree Conferral
Content: Students who transfer here from community college w/o an associate's degree can earn
one while at [INSTITUTION NAME]. Interested?
Interactive Response to Transfer Students Who Replied “YES”: Earning an associate's
degree while working for your bachelor's can be very beneficial. Email [E-MAIL ADDRESS] or
call [PHONE NUMBER] to discuss your eligibility.
Purpose: FAFSA Renewal Reminder
Content: Thanksgiving break is a great time to finish the FAFSA. Do you want us to send you a
reminder?
Interactive Response to Students Who Replied “YES”: No problem! Remember you can
complete it online at fafsa.gov using your 2015 tax info. For free live help go to
www.bit.ly/FAFSA_chat.
Interactive Response to Students Who Replied “NO”: That's ok but think about when you can
carve out some time to finish it soon. Remember you can complete it online at fafsa.gov using
your 2015 tax info.
Interactive Response to Students Who Replied “DONE”: Great job! We know the FAFSA is
a lot of work and getting it done early will help maximize the $ you get for college next year.
Purpose: Goal-setting in Spring Term
Content: Setting goals is important for keeping yourself on track to graduation. What's your
biggest academic goal for the Spring semester?
Interactive Response to Students Who Replied: We'll send you a reminder later in the
semester about your goal and see how you're doing. Good luck!
Purpose: Clarify Remaining Academic Requirements
Content: Last semester you were unsure whether you had any math requirements left to
graduate. Were you able to get that sorted out?

47
Interactive Response to Students Who Replied “YES”: Fantastic! If you're currently taking
any math courses remember that you can always visit the Math Lab in MB44 for free tutoring.
Interactive Response to Students Who Replied “NO” or “STILL UNSURE”: We don't want
to see any missed courses derail your plans for graduation. Talk to your advisor or the [NAME
OF ADVISING CENTER] in [ON CAMUPS LOCATION] soon about this issue.
Purpose: Overcoming Procrastination
Content: Many [NAME OF INSTITUTION] students struggle with time mgmt because they
procrastinate on important tasks. How much do you struggle with this?
Interactive Response to Students Who Replied “1” or “2” on 0-5 Scale: Mastering time
mgmt will serve you well after you've graduated from [NAME OF INSTITUTION]. Keep up the
good work.
Interactive Response to Students Who Replied “2”, “3”, “4” or “5”: Planning your days
hour-by-hour can help. Even scheduling breaks & leisure time helps you make the most of your
working hours.
Purpose: Norming Students Towards a Growth Mindset
Content: [X]% of 70% of students we asked at [NAME OF INSTITUTION] believe that
intelligence can be improved through practice & hard work. And you know what? They're right.
Purpose: Transportation Harship Follow-up
Content: We know that last semester you sometimes had trouble making it to [NAME OF
INSTITUTION]. Have you been able to find resources to make commuting easier?
Interactive Response to Students Who Replied “YES”: We're really glad to hear that. We
know what a long way you've come to be this close to a degree and we want to make sure you
reach graduation day.
Interactive Response to Students Who Replied “NO”: If you need additional help talk to [ON-
CAMUS RESOURCE] at [PHONE NUMBER]. They're ready to help connect with you with the
resources you need.
Purpose: Apply to Graduate Reminder
Content: The last day to apply to graduate for this semester is [DATE]. Do you plan to graduate
this semester?
Interactive Response to Students Who Replied “YES”: The finish is in sight! Go to your
[NAME OF ONLINE RESOURCE] to apply. If you get stuck call the [NAME OF
INSTITUTION] Registrar: [PHONE NUMBER].
Interactive Response to Students Who Replied “NO” or “UNSURE”: [NAME OF
INSTITUTION] offers many resources to help keep you on track to graduate. Check out
[ONLINE DEGREE AUDIT TOOL], talk to your advisor, or call Enrollment Services at
[PHONE NUMBER].
48
Appendix C – Construction of school-specific predictive dropout models
At each institution, we evaluated the performance of candidate prediction models to
identify one that best distinguished between students who dropped out late and students who
graduated or were still enrolled in the historical data. The specific models we developed differed
slightly across institutions based on data availability. However, in general we compared the
performance of models that only included students’ fixed attributes, baseline achievement
measures, enrollment experiences, and financial aid receipt up to the term they completed one-half
of the credits typically required for graduation to models that also included measures of their
enrollment history and aid receipt after surpassing this credit threshold.
The models that consistently performed best captured information on students before and
after they completed one-half of the credits typically required to graduate. These models take the
following general form:
Pr(𝑌𝑖 | 𝑋𝑖) = 𝑃(𝛼 + 𝛾 ∗ 𝑃𝑟𝑒50𝑖 + 𝜔 ∗ 𝐴𝑡50𝑖 + 𝛿 ∗ 𝑃𝑜𝑠𝑡50𝑖), where (𝑗) =1
1+𝑒−(𝑗) .
In this model, 𝑃𝑟𝑒50𝑖 is a vector of fixed student attributes and time-variant measures prior
to attaining the one-half credit completion threshold. Where available, the vector includes the
following measures: age, gender, race/ethnicity, assignment to remediation status, whether the
student transferred into their current institution and whether the student temporarily stopped out
before completing one-half of their required credits to graduate. To capture changes in student
circumstances over time that influence risk of dropout, 𝑃𝑟𝑒50𝑖 also includes an indicator of
whether students changed majors between when they first entered the institution (or system) and
when they completed one-half of their credits, as well as within-student standard deviations of the
following measures over the same period: Expected Family Contribution (EFC), the amount of
financial aid received (entered separately by aid type), and the number of credits attempted per
term. 𝐴𝑡50𝑖 is a vector of characteristics in the term students completed one-half of their credit
requirements. Where available, the vector includes the following measures: number of attempted
credits, cumulative GPA, the cumulative proportion of attempted credits that were earned, and the
amount of financial aid received. 𝑃𝑜𝑠𝑡50𝑖 contains measures of students’ enrollment experiences
and financial aid receipt analogous to those captured in the vector of 𝑃𝑟𝑒50𝑖 predictors.
Our preferred models clearly differentiated between late dropouts and non-late dropouts in
the historical samples. For example, the probability that a randomly chosen late dropout was
assigned a higher risk rating than a randomly chosen student who did not dropout ranged from
0.75-0.875 across the models. Across all institutions we observed similar model performance in
both the development and validation samples.