finite element analysis and optimisation of … · · 2017-02-20element simulations using ansys®...
TRANSCRIPT

ANGLIA RUSKIN UNIVERSITY
FINITE ELEMENT ANALYSIS AND
OPTIMISATION OF EGG–BOX
ENERGY ABSORBING STRUCTURES
MARYAM SANAEI
A Thesis in partial fulfilment of the requirements of Anglia Ruskin University for the
degree of Doctor of Philosophy
Submitted: December 2013

i
AKNOWLEDGMENT
On top of all, I thank God for giving me the opportunity to discover, study and grow.
I would like to present my gratitude to my supervisory team, Prof. Shirvani, Dr.
Nwaubani and Dr. Shirvani at the Faculty of Science and Technology at Anglia
Ruskin University, and Dr. Miraj at the Department of Civil and Environmental
Engineering at UCI, for their invaluable advice and support along the journey of this
research. My appreciation also goes to Cellbond Composites Ltd. for offering their
time and information to assist the initiation of this project.
I am also grateful to Prof. Mosallam at UCI for his kind consideration and guidance
and Mr. Cartillieri, Mr. Metzner, Mr. Rutz and Mr. Kim for offering their facilities
and advice as well as Mr. Becerra for his novel ideas.
I also take this opportunity to thank my family (my parents, parents in law, husband,
sister, brother and son), without whose continuous moral encouragement and
financial support, starting and completing this research would not have been
possible.

ii

iii
DEDICATIONS
To my Parents;
for their infinite love, unconditional support and invaluable advice.
To my Husband;
for understanding, caring and standing by me along the way.
And last but certainly not least,
To my Sister and Brother;
for always being there and completing my life.

iv
ABSTRACT
FACULTY OF SCIENCE AND TECHNOLOGY
Doctor of Philosophy
MARYAM SANAEI
December 2013
This study investigates the mechanical and geometrical attributes of egg–box
energy absorbing structures as crash safety barriers in the automotive industry. The
research herein was originated from the earlier work of Prof. Shirvani, patented and
further investigated by Cellbond Composites Ltd. who has invested in further
research, for developing an analytical tool for geometric optimisation as an enhanced
resolution to various shapes and materials. Energy absorption in egg-box occurs
through plastic deformation of cell walls, examined through non–linear finite
element simulations using ANSYS® and ANSYS/LS–DYNA® FE packages.
Experimental dynamic crash tests have been designed to verify the validity of the FE
simulations. Geometrical models are defined as 3D graphical representations,
outlined in detail. Further, the impact behaviour of commercially pure aluminium
egg-box energy absorbers is studied to identify the optimum design parameters
describing the geometry of the structure. A simulation-based multi-objective
optimisation strategy is employed to find a set of Pareto-optimal solutions where
each solution represents a trade-off point with respect to the two conflicting
objectives: the maximum impact force and the energy absorption capacity of the
structure. The aim is to simultaneously minimise the former and maximise the latter,
in the attempt to find purpose–specific optimal egg–box geometries. In light of the
associated outcomes, it is shown that egg–box geometries with
< ω
), thin walls (t < 1mm), short inter–peak distances and small peak diameters.
M –
< ω ), thin walls (t < 1mm), lengthy inter–peak distances and
smaller peak diameters. It is concluded that, egg–box structures combined in the
form of sandwich panels can be designed per application to act as optimised energy
absorbers. Results of the proposed optimised sandwich structure are verified using
analytical techniques.
ANGLIA RUSKIN UNIVERITY

v
CONTENTS
AKNOWLEDGMENT ................................................................................................. i
DEDICATIONS .......................................................................................................... iii
ABSTRACT ................................................................................................................ iv
CONTENTS ................................................................................................................. v
NOMENCLATURE ................................................................................................. viii
LIST OF FIGURES .................................................................................................... xi
LIST OF TABLES ................................................................................................... xvii
1. INTRODUCTION AND THEORETICAL BACKGROUND .............................. 1
1.1. Characteristics of Cellular Egg–box Energy Absorbing Structures................. 4
1.1.1. Geometrical Configuration of Egg–box ............................................. 5
1.2. Why Egg–box as an Energy Absorbing Module? ............................................ 6
1.3. Evaluation of the Performance of Egg–box Structure ..................................... 8
1.4. ANSYS® and ANSYS/LS–DYNA® as Tools for Numerical Analysis ....... 10
1.5. Aims and Objectives of the Research ............................................................ 11
1.6. Scope of the Thesis ........................................................................................ 12
1.7. Research Methodology .................................................................................. 13
1.8. Research Questions and Contribution to Knowledge .................................... 14
1.9. Thesis Outline ................................................................................................ 15
2. LITERATURE REVIEW .................................................................................... 18
2.1. Energy Absorption and Crashworthiness ....................................................... 18
2.1.1. Energy Absorbing Structures ........................................................... 19
2.1.2. Deformation Modes .......................................................................... 28
2.1.3. Experimental Testing........................................................................ 29
2.1.4. Analytical Modelling ........................................................................ 31
2.1.5. Numerical Simulation and Analysis ................................................. 33
2.2. Optimised Energy Absorption ....................................................................... 35
2.3. Optimisation of Egg–box Structures .............................................................. 38
3. EXPERIMENTAL STUDIES ............................................................................. 40
3.1. Introduction .................................................................................................... 40
3.2. Material Details and Sample Preparation....................................................... 40
3.3. Impacting System and Data Recording Devices ............................................ 43
3.4. Dynamic Impact Experiments on Egg-box Specimens.................................. 47
3.5. Results of Flat and Oblique Impact Experiments .......................................... 48
4. THEORETICAL CONSIDERATION ................................................................. 56
4.1. Introduction .................................................................................................... 56
4.2. Analytical Modelling ..................................................................................... 57
4.3. Finite Element Modelling .............................................................................. 62
4.3.1. Geometrical Model ........................................................................... 62
4.3.2. Material Properties ........................................................................... 64
4.3.3. Mesh Generation .............................................................................. 65
4.3.4. Boundary Conditions ........................................................................ 65
4.4. Verification and Critical Analysis of the Results........................................... 67

vi
5. ANALYSIS AND OPTIMISATION OF MODIFIED EGG-BOX ..................... 74
5.1. Introduction .................................................................................................... 74
5.2. Geometrical Alterations ................................................................................. 74
5.3. Simulation Configurations ............................................................................. 76
5.4. Systemised Assessment ................................................................................. 77
5.4.1. Geometrical Variations at ω ....................................................... 78
5.4.2. Geometrical Variations at ω ....................................................... 83
5.4.3. Geometrical Variations at ω ....................................................... 88
5.4.4. Geometrical Variations at ω ....................................................... 93
5.4.5. Geometrical Variations at ω ....................................................... 98
5.5. Observation and Discussion of Results ........................................................ 103
5.6. Evaluation of the Effects of Geometrical Variations ................................... 106
5.7. Optimised Egg–box Structure ...................................................................... 107
5.8. Optimum Sandwich Structures .................................................................... 109
5.9. Critical Analysis of Optimised Sandwich Panel .......................................... 115
5.9.1. Case Study 1 ................................................................................... 115
5.9.2. Case Study 2 ................................................................................... 117
5.9.3. Evaluation against Optimised Sandwich Structure ........................ 118
5.10. Analytical Validation of Sandwich Panel................................................... 120
6. DISCUSSION .................................................................................................... 124
7. CONCLUSIONS ................................................................................................ 128
7.1. Recommendations for further Investigation ................................................ 132
REFERENCES ........................................................................................................ 134
BIBLIOGRAPHY .................................................................................................... 147
APPENDIX A .......................................................................................................... 162
A.1. Introduction .................................................................................................. 162
A.2. Safety Evaluation in the Automotive Industry ............................................. 162
A.3. Structural Crashworthiness and Impact Mechanics ..................................... 163
A.3.1 Quasi–static and Dynamic Loads ................................................... 165
A.3.2 Strain Rate Sensitivity .................................................................... 167
A.3.3 Inertia Effect Characteristics .......................................................... 168
A.4. Energy Absorption by Structural Collapse .................................................. 170
A.4.1. Energy Absorbed Per Unit Volume ................................................ 171
A.4.2. Energy Absorbed Per Unit Mass .................................................... 171
A.4.3. Energy Absorbed Per Unit Length ................................................. 172
A.5. Energy Absorbing Structures ....................................................................... 173
A.5.1. Egg–box Structure .......................................................................... 174
A.6. Analysis of Energy Absorbing Structures .................................................... 176
A.6.1. Experimental Methods.................................................................... 176
A.6.1.1. Static Loading of Egg–box Structures ......................................... 177
A.6.1.2. Egg–box Structures under Dynamic Impact................................ 178
A.6.2. Mathematical Approach ................................................................. 180
A.6.3. Finite Element Numerical Analysis................................................ 183

vii
A.7. Finite Element Software and Commercial Packages ................................... 185
A.7.1. ANSYS® and LS–DYNA® Numerical Analysis Packages .......... 186
A.7.2. ANSYS/LS–DYNA® Numerical Analysis Package ..................... 187
A.8. Finite Element Modelling of Energy Absorbers .......................................... 188
A.8.1. Material Models.............................................................................. 190
A.9. Structural Optimisation ................................................................................ 191
A.9.1. Optimising Energy Absorbing Structures ...................................... 192
A.9.2. Crashworthiness Optimisation of Application–specific Egg–box
Models ....................................................................................................... 194
A.9.3. Application of FEA in Structural Optimisation.............................. 195

viii
NOMENCLATURE
Abbreviation Description Units
Al Aluminium
CP Commercially Pure (99% Al Alloy)
EA Energy Absorber
FE Finite Element
KE Kinetic Energy
LCS Local Coordinate System
PE Potential Energy
ɛ Nominal Axial Strain
Strain Rate s-1
ɛD Densification Strain
Ө Cone Angle with Horizontal degree
ρ Density of Crushed Structure ton/mm3
ρa Density of Commercially Pure Aluminium Sheet ton/mm3
Ratio of Egg–box Mass to Mass of Solid Block
σ Nominal Axial Stress MPa
σi Stress due to Impact MPa
σY Material Yield Strength MPa
ω Epical Angle (Cell Wall Angle to the Vertical) degree
A Cross Sectional Area of Impacted Structure mm2

ix
a Acceleration mm/s2
acrush Crush Acceleration mm/s2
d Diameter at Top of Cell mm
D Base Diameter of Frusta mm
EL Energy Absorber per Unite Length N.mm/mm
Etotal Total Crush Energy Absorbed N.mm
Favg Average Value of Total Load Applied N
Fi Applied Impact Load N
g Gravitational Acceleration mm/s2
h Egg–box Cell Cone Height mm
H Egg-box Total Cell Height = 2h mm
k Geometrical Constant
m Impacting Mass kg
P Applied Load N
p Inter–peak Distance in between Egg–box Cells mm
r Fillet Radius at Wall to Peak Transition Egg–box mm
R Radius of Peak/Base Curvature mm
SEA Specific Energy Absorption N.mm/ton
t Cell Wall Thickness mm
tcrush Total Time of Deformation s
V Velocity mm/s

x
Vi Velocity of Impact mm/s
W Cross–sectional Cell Width mm
WBending Work due to Structural Bending J
WCompression Work due to Structural Compression J
WFlattening Work due to Flattening of Structure Curves J
WFriction Work due to Surface Friction J
WHinge Work due to Emergence of Plastic Hinges J
Wm Energy Absorbed per Unit Mass N.mm/ton
WStretch Work due to Material Stretching J
WTotal Total Work Done J
WTwist Work due to Structure Twisting J
Wv Energy Absorption Capacity per Unit Volume N.mm/mm3
x Deformation Distance mm
xi Distance of Densification Point mm
Y Yield Strength MPa

xi
LIST OF FIGURES
Figure 1.1 – Plastic Buckling Deformation
Figure 1.2 – Travelling Hinge Deformation
Figure 1.3 – Egg–box Absorber Structure
Figure 1.4 – Typical Force vs. Displacement Curve
Figure 1.5 – Egg–box Deformation Procedure
Figure 2.1 – Energy Absorbing Structures
Figure 2.2 – Typical Stress vs. Strain Curve
Figure 3.1 – Stress vs. Strain Curves of CP Aluminium Sheets: (a) Measured
Tensile behaviour of 0.8mm Thick Sheets of Al 1050 H111, (b)
Dynamic Stress vs. Strain of CP Al at Selected Strain Rates
Figure 3.2 – Geometrical Dimensions of Egg-box Cells
Figure 3.3 – Dimensions of Impactors Used in Dynamic Tests
Figure 3.4 – Drop Tower and Boundary Fixtures
Figure 3.5 – Wedges Placed Below Impact Surface for Oblique Loading
Figure 3.6 – Initial Design of Device for Boxing Egg-box Cell
Figure 3.7 – Boxing Technique
Figure 3.8 – -
Figure 3.9 – Result Curves f -
Figure 3.10 –
Figure 3.11 –
Figure 3.12 – Result Curves for Impacting Single Cone of Sample 1
Figure 3.13 –
Figure 3.14 –
Figure 3.15 –
Figure 3.16 – Post-impact Deformed Samples
Figure 4.1 – FE Model of Egg-box Cells a) Sample Type 1 and b) Sample Type 2

xii
Figure 4.2 – Egg–box Cell Impact Simulation
Figure 4.3 – -
Figure 4.4 – Result Curves for Impacting Fr -
Figure 4.5 –
Figure 4.6 –
Figure 4.7 –
Figure 4.8 –
Figure 4.9 –
Figure 4.10 –
Figure 4.11 – Progression of the Deformation Procedure for Flat Impact
Figure 5.1 – FE Models of ω , p=20mm, t=0.8, 1, 1.2mm for d=5, 10, 15mm
Figure 5.2 – Force vs. Displacement Curves of FE Simulations for ω ,
t=0.8mm, p=20mm and d=5, 10, 15mm
Figure 5.3 – Force vs. Displacement Curves of FE Simulation for ω , t=1mm,
p=20mm and d=5, 10, 15mm
Figure 5.4 – Force vs. Displacement Curves of FE Simulation for ω , t=1.2mm,
p=20mm and d=5, 10, 15mm
Figure 5.5 – FE Models of ω , p=45mm, t=0.8, 1, 1.2mm for d=5, 10, 15, 20,
30, 40mm
Figure 5.6 – Force vs. Displacement Curves of FE Simulations for ω ,
t=0.8mm, p=45mm and d=5, 10, 15, 20, 30, 40mm
Figure 5.7 – Force vs. Displacement Curves of FE Simulations for ω , t=1mm,
p=45mm and d=5, 10, 15, 20, 30, 40mm
Figure 5.8 – Force vs. Displacement Curves of FE Simulations for ω ,
t=1.2mm, p=45mm and d=5, 10, 15, 20, 30,40 mm
Figure 5.9 – FE Models of ω , p=60mm, t=0.8, 1, 1.2 mm for d=5, 10, 15, 20,
30, 40, 50mm
Figure 5.10 – Force vs. Displacement Curves of FE Simulations for ω ,
t=0.8mm, p=60mm and d=5, 10, 15, 20, 30, 40, 50mm
Figure 5.11 – Force vs. Displacement Curves of FE Simulations for ω , t=1mm,
p=60mm and d=5, 10, 15, 20, 30, 40, 50mm

xiii
Figure 5.12 – Force vs. Displacement Curves of FE Simulations for ω ,
t=1.2mm, p=60mm and d=5, 10, 15, 20, 30, 40, 50mm
Figure 5.13 – FE Models of ω , p=20mm, t=0.8, 1, 1.2mm for d=5, 10, 15mm
Figure 5.14 – Force vs. Displacement Curves of FE Simulations for ω ,
t=0.8mm, p=20mm and d=5, 10, 15mm
Figure 5.15 – Force vs. Displacement Curves of FE Simulation for ω , t=1mm,
p=20mm and d=5, 10, 15mm
Figure 5.16 – Force vs. Displacement Curves of FE Simulation for ω , t=1.2mm,
p=20mm and d=5, 10, 15mm
Figure 5.17 – FE Models of ω , p=45mm, t=0.8, 1, 1.2mm for d=5, 10, 15, 20,
30, 40mm
Figure 5.18 – Force vs. Displacement Curves of FE Simulations for ω ,
t=0.8mm, p=45mm and d=5, 10, 15, 20, 30, 40mm
Figure 5.19 – Force vs. Displacement Curves of FE Simulations for ω , t=1mm,
p=45mm and d=5, 10, 15, 20, 30, 40mm
Figure 5.20 – Force vs. Displacement Curves of FE Simulations for ω ,
t=1.2mm, p=45mm and d=5, 10, 15, 20, 30, 40mm
Figure 5.21 – FE Models of ω , p=20mm, t=0.8, 1, 1.2mm for d=5, 10, 15, 20,
30, 40, 50mm
Figure 5.22 – Force vs. Displacement Curves of FE Simulations for ω ,
t=0.8mm, p=60mm and d=5, 10, 15, 20, 30, 40, 50mm
Figure 5.23 – Force vs. Displacement Curves of FE Simulations for ω , t=1mm,
p=60mm and d=5, 10, 15, 20, 30, 40, 50mm
Figure 5.24 – Force vs. Displacement Curves of FE Simulations for ω ,
t=1.2mm, p=60mm and d=5, 10, 15, 20, 30, 40, 50mm
Figure 5.25 – FE Models of ω , p=20mm, t=0.8, 1, 1.2mm for d=5, 10, 15mm
Figure 5.26 – Force vs. Displacement Curves of FE Simulations for ω ,
t=0.8mm, p=20mm and d=5, 10, 15 mm
Figure 5.27 – Force vs. Displacement Curves of FE Simulation for ω , t=1mm,
p=20mm and d=5, 10, 15 mm
Figure 5.28 – Force vs. Displacement Curves of FE Simulation for ω , t=1.2mm,
p=20mm and d=5, 10, 15 mm

xiv
Figure 5.29 – FE Models of ω , p=20mm, t=0.8, 1, 1.2mm for d=5, 10, 15, 20,
30, 40mm
Figure 5.30 – Force vs. Displacement Curves of FE Simulations for ω ,
t=0.8mm, p=45mm and d=5, 10, 15, 20, 30, 40mm
Figure 5.31 – Force vs. Displacement Curves of FE Simulations for ω , t=1mm,
p=45mm and d=5, 10, 15, 20, 30, 40mm
Figure 5.32 – Force vs. Displacement Curves of FE Simulations for ω , t=1mm,
p=45mm and d=5, 10, 15, 20, 30, 40mm
Figure 5.33 – FE Models of ω , p=20mm, t=0.8, 1, 1.2mm for d=5, 10, 15, 20,
30, 40, 50mm
Figure 5.34 – Force vs. Displacement Curves of FE Simulations for ω ,
t=0.8mm, p=60mm and d=5, 10, 15, 20, 30, 40, 50mm
Figure 5.35 – Force vs. Displacement Curves of FE Simulations for ω , t=1mm,
p=60mm and d=5, 10, 15, 20, 30, 40, 50mm
Figure 5.36 – Force vs. Displacement Curves of FE Simulations for ω ,
t=1.2mm, p=60mm and d=5, 10, 15, 20, 30, 40, 50mm
Figure 5.37 – FE Models of ω , p=20mm, t=0.8, 1, 1.2mm for d=5, 10, 15mm
Figure 5.38 – Force vs. Displacement Curves of FE Simulations for ω ,
t=0.8mm, p=20mm and d=5, 10, 15mm
Figure 5.39 – Force vs. Displacement Curves of FE Simulation for ω t=1mm,
p=20mm and d=5, 10, 15mm
Figure 5.40 – Force vs. Displacement Curves of FE Simulation for ω , t=1.2mm,
p=20mm and d=5, 10, 15mm
Figure 5.41 – FE Models of ω , p=45mm, t=0.8, 1, 1.2mm for d=5, 10, 15, 20,
30, 40mm
Figure 5.42 – Force vs. Displacement Curves of FE Simulations for ω ,
t=0.8mm, p=45mm and d=5, 10, 15, 20, 30, 40mm
Figure 5.43 – Force vs. Displacement Curves of FE Simulations for ω , t=1mm,
p=45mm and d=5, 10, 15, 20, 30, 40mm
Figure 5.44 – Force vs. Displacement Curves of FE Simulations for ω ,
t=1.2mm, p=45mm and d=5, 10, 15, 20, 30, 40mm
Figure 5.45 – FE Models of ω , p=60mm, t=0.8, 1, 1.2mm for d=5, 10, 15, 20,
30, 40, 50mm

xv
Figure 5.46 – Force vs. Displacement Curves of FE Simulations for ω ,
t=0.8mm, p=60mm and d=5, 10, 15, 20, 30, 40, 50mm
Figure 5.47 – Force vs. Displacement Curves of FE Simulations for ω , t=1mm,
p=45mm and d=5, 10, 15, 20, 30, 40mm
Figure 5.48 – Force vs. Displacement Curves of FE Simulations for ω ,
t=1.2mm, p=60mm and d=5, 10, 15, 20, 30, 40, 50mm
Figure 5.49 – FE Models of ω , p=20mm, t=0.8, 1, 1.2mm for d=5, 10mm
Figure 5.50 – Force vs. Displacement Curves of FE Simulations for ω ,
t=0.8mm, p=20mm and d=5, 10mm
Figure 5.51 – Force vs. Displacement Curves of FE Simulation for ω , t=1mm,
p=20mm and d=5, 10mm
Figure 5.52 – Force vs. Displacement Curves of FE Simulation for ω , t=1.2mm,
p=20mm and d=5, 10mm
Figure 5.53 – FE Models of ω , p=45mm, t=0.8, 1, 1.2mm for d=5, 10, 15, 20,
30mm
Figure 5.54 – Force vs. Displacement Curves of FE Simulations for ω ,
t=0.8mm, p=45mm and d=5, 10, 15, 20, 30mm
Figure 5.55 – Force vs. Displacement Curves of FE Simulations for ω , t=1mm,
p=45mm and d=5, 10, 15, 20, 30mm
Figure 5.56 – Force vs. Displacement Curves of FE Simulations for ω ,
t=1.2mm, p=45mm and d=5, 10, 15, 20, 30mm
Figure 5.57 – FE Models of ω , p=20mm, t=0.8, 1, 1.2mm for d=5, 10, 15, 20,
30, 40mm
Figure 5.58 – Force vs. Displacement Curves of FE Simulations for ω ,
t=0.8mm, p=60mm and d=5, 10, 15, 20, 30, 40mm
Figure 5.59 – Force vs. Displacement Curves of FE Simulations for ω , t=1mm,
p=60mm and d=5, 10, 15, 20, 30, 40mm
Figure 5.60 – Force vs. Displacement Curves of FE Simulations for ω ,
t=1.2mm, p=60mm and d=5, 10, 15, 20, 30, 40mm
Figure 5.61 – Force–Displacement Curve of ω , t=0.8mm, p=45mm and d=5mm
Figure 5.62 – Aluminium Egg–box Sandwich Panel Sample
Figure 5.63 – FE Simulation Model of Proposed Sandwich Panel: (a) Single Cell
Cross Section, (b) 3D Expanded Sandwich Panel

xvi
Figure 5.64 – Comparison of FE Analysis for Optimised Sandwich Panel and
Individual Egg–box Components
Figure 5.65 – 3D FE Simulation Model of Sandwich Panel Case Study 1
Figure 5.66 – FE Analysis for First Sandwich Panel Case Study
Figure 5.67 – 3D FE Simulation Model of Sandwich Panel Case Study 2
Figure 5.68 – FE Analysis for Second Sandwich Panel Case Study
Figure 5.69 – Comparison between FE Outcomes of Sandwich Panels
Figure 5.70 – Analytical Assessment vs. FE Analysis of Proposed Optimised
Sandwich Structure
Figure 5.71 – Analytical Calculations vs. FE Analysis of Sandwich Case Study 1
Figure 5.72 – Analytical Calculations vs. FE Analysis of Sandwich Case Study 2

xvii
LIST OF TABLES
Table 3.1 – Egg–box Cell Dimensions
Table 3.2 – Total Energy Absorbed by Structures under Experimental Impact
Table 4.1 – Total Energy Calculations
Table 5.1 – Egg–box Cell Dimension Data for Geometrical Optimisation
Table 5.2 – Estimated Area under the Curve Representing ETotal for Geometrically
Varied Egg–box Structures
Table 5.3 – Effects of Geometrical Changes on Egg–box Performance
Table 5.4 – Egg–box Geometries with Distinctive Performance

1. Introduction
1
1. INTRODUCTION AND
THEORETICAL BACKGROUND
The ability to absorb and reduce the effect of kinetic energy has led to the
production of specific structures called energy absorbers (EA). Use of such parts
imbedded in the design of dynamically sensitive structures such as motor vehicles
will increase their safety characteristics. A shock or crash enduring structure is one
that handles the impact forces and the safe transfer of kinetic energy by collapsing
through a predictable behaviour (Du Bois et al., 2004). As a result of this controlled
collapse, the possibility of the vehicle occupants being injured can be reduced.
Factors such as structural stiffness, maximum strength and the ability to absorb
energy beyond the elastic limit, directly determine the level of the crashworthiness of
a system*.
In addition to the front and rear bumpers, energy absorbing structures can be
multi–functionally implanted in doors, bonnet, dashboard, heat exchanger, air filter,
liquid storage components and other parts of a vehicle body (Ashmead et al., 2000).
The presence of such systems could also play a key role in making roads safer for
both pedestrians and passengers, by cushioning them against the impact of an
accident.
* Readers are referred to Appendix A for further review and detailed information on
subjects studied here forth.

1. Introduction
2
In order for a structure to absorb the energy of an impact and reduce its effect,
it would have to consist of builds such as lattice (periodic truss) structures (Evans,
2001, Fleck, 2001, Chiras et al., 2002, Wadely et al., 2003 and Kooistra et al., 2004),
tubes (Abramowicz et al., 1984, Kim et al., 1998-1999, Markiewicz et al., 1998,
Reid, 2003, Jensen et al., 2004, Morris et al., 2006-2007, Mahdi et al., 2006, Olabi et
al., 2007-2008, Melo et al., 2007, Yuen et al., 2007, Zhang et al., 2009), repetitive
cells (Wu et al., 1996, Kim et al., 2002, Yu et al., 2005, Avalle et al., 2006, Hou et
al., 2007), or porous/perforated foam (Chen et al., 1999, Deshpande et al., 1999,
Hanssen et al., 1999(1,2), Zhou et al., 2003, Fleck, 2001, Jeon et al., 2008-2010, Said
et al., 2008, Yoo et al., 2010, Zarei et al., 2010), geometrical features. Such
structures collapse through desirable patterns that can be studied and predicted to fit
the needs of specific applications.
The absorption of energy by deformation in cellular absorbers can be through
collapse processes such as plastic buckling (Figure 1.1), plastic yield or folding
through stationary plastic hinges and travelling plastic hinges (Figure 1.2), depending
on the type of the geometry (Alexander, 1960, Meng, 1983, Abramowicz et al.
1984). Alexander was the first researcher to provide a theoretical model for axial
. T A ’
balance of internal and external work. This simple theoretical model was later
adopted and modified by Abramowicz and Jones into a more precise model. In some
geometrical cases EA structures can fail due to material tearing (Qiao, 2008).
For applications such as cushioning of passengers in vehicles, low density
energy absorbing structures are preferable, to reduce the total weight of the vehicle
as associated with its performance. Lattice materials have greater density values in
comparison to their cellular and foam counterparts (Jacobsen et al., 2010). Structures
such as hexagonal honeycomb blocks of various depths, metal and plastic foams and
egg–box panels are candidates falling in this desirable category.
The manufacturing methods of these structures include fabrication through
powder metallurgical techniques, injection moulding and cold or hot pressing of
metal sheets. This leads to the next signifying factor i.e. the production costs.
Experience shows that egg–box structures can be manufactured through less

1. Introduction
3
expensive methods compared to lattice material, honeycombs or foams since they
can be produced through a single action by cold or hot pressing of metal sheets
(Deshpande et al., 2003 and Nowpada and Chirwa et al., 2009).
Figure 1.1 – Plastic Buckling Deformation
Figure 1.2 – Travelling Hinge Deformation
From the mechanics point of view, the purpose behind using an energy
absorbing structure is the ability to absorb energy at a stress level which would be
lower than a prescribed value for specific circumstances.
P
Plastic Hinges

1. Introduction
4
1.1. Characteristics of Cellular Egg–box Energy Absorbing Structures
Automotive designers are always looking for efficient and cost effective
absorbers in vehicle interiors to cushion the occupants. One solution is to use cellular
solids or structures made up of an interconnected network of cells, which
characterise the advantages of deforming with a comparatively regular force during a
compressive impact event. The Egg–box structure is one such energy absorber.
Figure 1.3 – Egg–box Absorber Structure (W is the distance between a
consecutive peak and trench, p is the inter-peak distance, h is the cell height, d is
the peak/base diameter, ω is the apical angle and t is the thickness)
The egg–box, as suggested by its name, is a structure consisting of a series of
conical cells, forming the shape illustrated in Figure 1.3 with (p) showing the
diagonal inter-peak distance and (W) being the distance between two consecutive
peaks/trenches in lateral directions. This geometrical arrangement of regular flat–top
cones is designed to provide axial strength against external forces. In addition, this

1. Introduction
5
structure is renowned for its ability to deform in a predictable manner and produce
consistent results under various impact angles (Ashmead et al., 2000). Based on the
material involved in its production, the egg–box structure can come in relatively low
weights and be manufactured to desired geometrical features for specific
applications.
The quality and the relative length of the plateau for ’ .
displacement curve, provided in Chapters 3, 4 and 5, is a characterising criteria of a
good energy absorber with the potential of being used as a design component for
pedestrian and passenger protection. Figure 1.4 is a typical force-displacement curve
as related to the performance of an egg-box structure.
Figure 1.4 – Typical Force vs. Displacement Curve
1.1.1. Geometrical Configuration of Egg–box
The geometry of the egg–box structure contributes towards its suitability as an
energy absorber.
Specific geometrical angles and distances in the structure of an egg–box cell
can be adjusted to result in desired levels of energy absorption. Varying the peak to
peak length (p), angle (ω), cell diameter (d) or wall thickness (t), in addition to the
material type used and the level of constraints applied to the structure can result in
0 1 2 3 4 5 6 7 8 9
10
0 50 100 150 200 250
Forc
e K
N
Displacement mm

1. Introduction
6
diverse energy absorption characteristics for this structure. For Example, research
has shown that reducing the inter–peak distance, gives a higher density of cones
throughout the structure which in turn results in an increased stiffness, hence, a
higher stress level, i.e. greater amount of energy will be absorbed (Deshpande et al.,
2003).
1.2. Why Egg–box as an Energy Absorbing Module?
In comparison to the classical energy absorbers, the egg–box structure has
many advantages. Despite their satisfactory performance as energy absorbers,
structures such as honeycomb blocks and metal foams are bulky and difficult to
transfer from the manufacturer to the automotive companies. Egg–box absorbers, on
the other hand, use minimum packaging space and are easy and safe to handle during
installation. Moreover, similar to other energy absorbers, the egg–box structure has
the benefit of being easily stackable and recyclable (Ashmead, 2000).
Due to its low manufacturing costs, and since it can be made from a range of
metallic sheets by a single stage hot or cold pressing, or from plastic materials by
injection moulding, the egg–box absorber is particularly suitable for high volume
productions (Ashmead, 2000). As a result of this straightforward fabrication
approach, it becomes possible to mould up the egg–box structure into complex
shapes and tailor local crush strengths for specific applications. Its ability to be
composed into sandwich structures can also offer many benefits to the designers with
its exceptional flexural properties in sandwich systems (Ashmead, 2000). These
features are all desirable to automotive and aviation companies.
An additional benefit that comes with the outline of the egg-box absorber is
having an open structure along its length, which can be structurally useful in
allowing for wirings to pass along the length of the panel, bending amongst the peaks
and trenches.
A specific feature displayed in the deformation process of the egg–box
structure, greatly contributes towards its aptness as an energy absorber; with the
collapse of the egg–box geometry under impact loads, two main deformation

1. Introduction
7
mechanisms can be observed, Travelling Hinge deformation and Plastic Buckling
deformation (Figure 1.5, explained further in Appendix A). These two phases need to
be investigated more thoroughly for the energy absorption of the egg–box structure
to become more predictable and noticeably improved.
Figure 1.5 – Egg–box Deformation Procedure
It is common practice for the egg–box structures currently used in the industry
to be fabricated from materials such as aluminium, steel, gun–metal and a variety of
plastics by cold pressing and injection moulding, respectively.
An ideal absorber is one that, while performing adequately in reducing the
effect of impact energy, would be light, mouldable and stackable. It is obvious that
using tougher metals such as steel or gun–metal will result in stronger energy
absorbers. Nevertheless, these metals are heavier in nature and much harder to mould
into the desired shape. Aluminium alloys are comparatively light weighted, very
mouldable, inexpensive and ultimately they can be recycled.
Currently aluminium parts are employed in the automotive industry, most
importantly due to their significant weight saving features. Steel has a density value
three times that of aluminium which leads to over 25% more weight when used in

1. Introduction
8
vehicle body parts (Kim, 1998). Such amount of weight cutback can have a strongly
positive effect on reducing the fuel consumption and emission of the vehicle. All
these benefits as well as its high corrosion resistance, indicate that aluminium is the
ideal material for the automotive industry.
To maintain the characteristics of an ideal absorber and as a most commonly
used material in this industry, aluminium alloys are considered as optimum materials
for the production of egg–box structures. Nevertheless, it should be noted that, an
important determining factor remains to be the specific application for which the
absorber is being manufactured.
1.3. Evaluation of the Performance of Egg–box Structure
The mechanism of deformation for a uniaxial compression is complex.
Different variables are taken into account and controlled by the design engineer to
evaluate the mode of deformation of the egg–box absorber for a specific application.
Refinement of these factors can lead to improved performance, efficiency and design
optimisation that would accommodate the specifications required by individual
customers.
In addition, external factors such as the angle and magnitude of the loadings
applied and the presence of other adjacent bodies will also determine the
characteristics of the deformation pattern of an EA structure (Alexander, 1960).
Examples are illustrated in Appendix A.
Traditionally, the main practical method to evaluate the effect of variations of
geometric characteristics in the performance of a structure and its EA capacity was
experimental testing (Alexander, 1960, Mamalis, 1986, Alghamdi, 1992). In more
recent research this method is used to verify the results of numerical or theoretical
techniques (Alghamdi, 2001, Deshpande, 2003, Zupan, 2003, Naik, 2004, Nowpada,
2009, 2010 a, b). Various methods of practical testing of energy absorber structures
exist which can be divided into two main categories of static loading and dynamic
impact testing. Past and current researches have been critically reviewed in the
second chapter.

1. Introduction
9
Another method of exploring the behaviour of energy absorbers is analysing
the structures mathematically. However, despite its repeatability features, this
analytical approach can become exceedingly time consuming with complicated
situations such as the deformation of energy absorbing structures. To simplify,
analysers tend to take advantage of geometrical symmetries to create less
complicated two–dimensional illustrations of physical structures (Alexander, 1960,
Mamalis, 1986, Alghamdi, 1992, 2001, Deshpande, 2003, Zupan, 2003, Naik, 2004).
Although Alexander concludes that his theoretical model does not account for the
effect of the superimposed axial stresses on the yield criterion or the detailed
consideration of the deformation mode and equilibrium conditions, Calladine (1986)
A ’
approximation of the collapse behaviour of structures.
Numerical approaches, on the other hand, are beginning to take off as a key
part of the design process of energy absorbers in general and specifically in egg–box
structure as an innovative energy absorber. One of the best methods for designing,
visualising, refining and calculating the performance of geometrically assorted
structures produced from different materials is by using the finite element (FE)
method.
As an advantage, commercially available advanced finite element computation
packages, such as ANSYS®, ABAQUS®, LUSAS® and LS–DYNA®, allow for the
creation of graphical representations of required components, in the form of
numerical models, which can be tested through a number of different methods, both
inexpensively and repeatedly under a variety of different conditions, via powerful
processors. The accurate results of these simulations in comparison with
experimental tests, has encouraged researchers all over the world to use this approach
with firm validity and without using expensive experimental techniques. The works
of such researchers, as related to the subject of this project, are critically reviewed in
the next chapter.
For highly complex problems, highly professional finite element solver
packages have been commercially designed, which substantially reduce the time and
cost of experimental and mathematical analysis. The ANSYS® software is one of the

1. Introduction
10
well established, widely distributed and popular commercial finite element analysis
packages, which has continuously been in use and refined since 1970. Its historical
background of development has resulted in a code with a vast range of capabilities.
In current researches on the analyses of mechanical behaviour of energy
absorbing structures, the procedures mentioned above, including static and dynamic
experimental methods, mathematical approaches and numerical techniques are being
extensively used. Using numerical calculations and predictions, the FE method can in
fact be used to determine the energy absorption characteristics of an EA structure
prior to the geometrical design and manufacture. Additionally, FE analysis can be
employed for structural optimisation.
1.4. ANSYS® and ANSYS/LS–DYNA® as Tools for Numerical Analysis
As a powerful numerical solver using finite element method, the ANSYS®
package can be used to analyse a wide range of mechanical problems such as static
and transient structural analysis. In fact, ANSYS® is most commonly used in this
particular area of mechanical physics, since it can facilitate the analysis of structures
as large as bridges or as small as vehicle parts.
In order to simulate dynamic loading conditions, the powerful processors of
ANSYS® have been combined with the equally powerful solver of another finite
element package known as LS–DYNA®. This software is designed to be used for
analysing static and dynamic problems with large deformation. LS–DYNA® uses
explicit time integration as its base solution approach (LSTC, 2007).
The combination of ANSYS® and LS–DYNA® gave existence to a powerful
finite element package referred to as ANSYS/LS–DYNA®. Researchers and
designers use this product, to model a structure or system in ANSYS®, then
obtaining the explicit dynamic solution using the powerful LS–DYNA® solver, and
eventually reviewing the results in the ANSYS® post–processing Graphical User
Interface (GUI). The geometry and results information can also be transferred
between ANSYS® and ANSYS/LS–DYNA® to help perform chronological

1. Introduction
11
implicit–explicit and explicit–implicit analyses, such as those required for drop–test,
spring–back and other applications (ANSYS/LS– YNA® U ’ M , ).
1.5. Aims and Objectives of the Research
Recognising the energy absorption characteristics of structures is functional in
analysing the damage caused by accidental or sudden controlled impacts.
Identification of such properties is therefore necessary in order to improve the
performance of an energy absorbing structures.
The main objective of this research is to develop a numerical simulation tool
for geometric optimisation of egg–box energy absorbing structures as an enhanced
resolution to various shapes and materials. The study focuses on the way in which
egg–box structures can be best designed to absorb kinetic energy in a controllable
and predictable manner. The aim of the project is to establish and define geometrical
characteristics of egg–box structures which display optimum energy absorption
performances.
To define limitations for the research hypothesis, commercially pure aluminium
(commonly used in the industry for egg-box absorbers) has been employed as the
base material for the egg–box structures. In these cellular structures energy
absorption occurs through plastic deformation of the cell walls, which are to be
modelled and examined using non–linear finite element simulation packages. The
accuracy of the modelling approach has been evaluated and authenticated in
comparison to the outcomes of experimental tests. Following the experimental work,
the analytical technique has been used in deriving equations of total energy for the
deformation procedure of the tested specimens. This method is used alongside the
experimental results for the verification of the finite element simulations.
The geometrical modelling of the structures is defined as 3D graphical
representations, outlined in detail. Further, deformation mechanisms of the
geometrical variations are comparatively modelled and ultimate optimised structures
within given boundary conditions are represented.

1. Introduction
12
The effect of variations in the geometrical features of the egg-box is broadly
examined based on the associated force–displacement curves, in the attempt to find
purpose–specific optimal egg–box geometries.
By performing a comparative study of the force-displacement curves generated,
optimised egg–box structures can be selected for specific functions. In addition, these
curves can be used as a set of reference deformation pattern curves for various egg–
box geometries.
Through modelling and optimisation, it will be the aim of this project to
demonstrate the optimum cellular structural energy absorbing characteristics that will
display a higher energy absorption capacity, while, simultaneously diminishing the
destructive effect of a sudden impact at the initiation of its deformation process. The
validity of these simulations will be verified against results of experimental tests as
well as a developed mathematical model.
1.6. Scope of the Thesis
Road and automotive statistics around the world reveal that, despite taking an
increasing number of safety measures on board to reduce the life threatening effect of
road accidents, they still remain a main cause of human fatalities and severe injuries.
Practical methods, such as making vehicle parts that would protect occupants
through absorbing impact energy, should be developed to serve towards safer roads
for both vehicle users and pedestrians.
Amongst available options, cellular EA structures perform efficiently by
displaying predictable deformation patterns and desirable levels of energy absorption
capacity in addition to having advantageous physical and geometrical attributes.
Examples of cellular EA structures include conical frusta, circular and non–circular
tubes and egg–box panels which consist of a directionally reversed arrangement of
flat–top cones. This research concentrates on the behaviour of egg–box energy
absorbers, due to their benefits over the other commercially available counterparts.
The panel under investigation is of pure aluminium alloy, which is one of the main
materials currently being used in the industry to fabricate egg–box structure.

1. Introduction
13
Experimental impact tests have been conducted on both panel and cell
specimens to provide principal bases for the assessment of the numerical method
employed herein.
The ideal egg–box geometries that will display high levels of energy absorption
capacities in specific applications and reduce the effect of an impact to a satisfactory
level while maintaining a reasonably low structural weight and material consumption
are identified and assessed. Finding such a supreme structure calls for a practical
optimisation method. A follow through procedure is provided in this work that
allows for modelling and testing egg–box structures of altered geometries, the
comparison of which gives rise to optimal egg–box energy absorbing structures.
1.7. Research Methodology
Using tools such as ANSYS® and ANSYS/LS–DYNA®, the dynamic crash
tests of egg–box structures of various geometrical characteristics and material
conditions have been simulated. Such authentic simulation works can help observe
the detailed behaviour of impact absorbers; studying their modes of deformation,
benefits and drawbacks.
To create accurate FE simulation specifications for dynamic loading,
comparison is made with the results of experimental dynamic crash tests of egg-box
structures with known geometrical details. Two geometrically varied aluminium egg-
box samples are selected based on size and commercial availability. The tests can be
categorised into three groups based on the participating specimen; free-edged single
cone, single cone within a panel and axial impact of the entire panel. In addition, the
first two test groups are divided into two areas; to the horizonta )
), to investigate the performance of the egg-box under
different loading angels. The outcome of the experimental work validates the
proposed numerical model.
Evaluation of the performance of these geometries is made through a
comparative study of their load vs. deformation curves for dynamic buckling tests. A
series of alterations have been made to the geometry of the egg–box, based on a

1. Introduction
14
tabular arrangement of geometrical factors including base diameter (d), apical angle
(ω), inter-peak distance (p) and wall thickness (t), which play significant roles in the
deformation pattern of this structure. Modifying these factors has a direct effect on
the performance and hence the optimisation of the egg–box while the structure can
be improved in order to comply with the requirements of various end–users.
For the purpose of this project, sets of values are defined for each variable
factor, in accordance to the geometrical measurements of the egg–box structures
currently in commercial use.
The values given to each geometrical factor are chosen in a manner to allow a
group of geometries to be covered within each range. An averaging technique can be
used to estimate the energy absorption characteristics of the structures whose
geometrical features fall between two or more parameter ranges. A comprehensive
simulation procedure and an optimisation cycle are proposed in this thesis which can
be used to model egg–box geometries with specifically defined measurements and
fabricated of various materials to determine their precise behaviour as energy
absorbers.
The final outcomes of the optimisation process conducted in the current
research are validated using a developed analytical model.
1.8. Research Questions and Contribution to Knowledge
With the growing importance of the egg–box structure as functional energy
absorbers in the automotive industry, it becomes necessary to have a validated
system through which performance of the structure can be evaluated and improved.
This calls for a repeatable and inexpensive technique such as finite element
simulation.
In addition, whilst a great deal of recent research has taken place on the energy
absorption behaviour of structures and materials and significant progress has been
made in this area, the knowledge is widely scattered when it comes to geometrical
modelling of the cellular structures. Methods of evaluating the performance of an

1. Introduction
15
egg–box structure when subjected to dynamic loading, modelling its geometry and
recognising its material properties are diffused amongst analysts, researchers and
experts.
The modelling procedure presented and experimentally validated in the thesis
can be used as a unified system which will facilitate information comparison for
individuals who are associated with the structural design of the egg–box. Although
the modelling procedure is based on the ANSYS® Graphical User Interface for the
purpose of this study, it can be implemented in any similar 3D simulation software
for different purposes.
It has been observed that in the multi–objective optimisation task of the
deformation pattern of the egg-box energy absorber, one contributing factor cannot
be changed without affecting others. A series of follow–through procedures have
been developed in the course of this study, which allow for modelling and evaluation
of the performance of aluminium egg–box structures with altered geometries. The
effect of variations in the geometrical features of egg–box structures is broadly
examined based on their associated force–displacement curves, in the attempt to find
purpose–specific optimal egg–box geometries.
As the main contribution to knowledge, deformation patterns of egg–box
structures of altered geometrical features have been comparatively examined to allow
for the selection of appropriate geometries for certain applications. A series of
optimum curves have been presented in Chapter 5 of the thesis. An analytical review
of the curves, results in the introduction of an optimised combination of the egg–box
absorbers, which satisfactorily displays the requirements of an improved structure.
1.9. Thesis Outline
A brief description of chapter contents of this thesis is presented below.
Chapter 1 provides introductory information on primary concepts and boundary
conditions including materials used in this investigation. It further aims to define the
hypothesis of the thesis and the rational for the investigation. These include details

1. Introduction
16
on energy absorption and energy absorbing structures, egg–box energy absorber
geometrical features, finite element analysis and its application towards the
optimisation of egg–box energy absorbing structures. The objectives, research
contributions and design methodology of the research are provided in this chapter.
The 2nd
Chapter aims to explore and exhaust the subject area from other
researchers prospective and to make sure this investigation has fulfilled the process
of consolidating the various strands of past research into a single narrative structure,
describing the evolution of the research domain. It follows by the work of previously
performed researches on the subject of energy absorption and optimisation, by
critically reviewing a series of past and recently published literature.
Chapter 3 covers the experimental work conducted as a part of this project.
Information on the sample preparation, geometrical details of the sample, test
equipment and scope, experiment procedure and result derivation are provided in this
chapter. The results of the experimental works have been presented and
comparatively discussed in the concluding section of Chapter 3.
The 4th
chapter consists of two sections, exploring the deformation pattern of
the egg-box both analytically and numerically. In the former part, the total energy
equation has been developed per experimental test conducted as a part of satisfying
the objectives of the project and preliminary calculations are made which comply
with the experimental test results. The latter part of this chapter uses finite element
technique and packages to model, simulate and analyse the energy absorbing
characteristics of egg-box structures when subjected to an impact load. This section
includes information on geometrical modelling details, material model definition,
element selection, application of boundary conditions and loadings and result
derivation using the pre and post processor and solver of ANSYS/LS-DYNA® FE
package. The outcomes of the simulations are compared to that of the experimental
work, achieving excellent correlation between results and hence, verifying the
authenticity and accuracy of the finite element model and settings for the egg-box
cell simulations.
In Chapter 5 the established finite element model of the previous chapter has
been employed to model a series of geometrically altered egg–box structures, created

1. Introduction
17
in accordance to the values provided in a tabular arrangement of various geometrical
factors. These structures are then impacted in a simulated dynamic test, and their
results, produced by finite element methods, are reviewed to find application–
specific optimised geometries. Subsequently, an improved sandwich structure,
formed by a combination of optimum egg–box geometries is introduced. The
concluding outcome of this section is authenticated using an analytical method,
developed to predict the performance of egg–box structures.
Chapter 6 includes a summary of the research, discussing the outcomes of each
chapter and relating them and reviewing them with regards to the rest of the work.
The final chapter brings the current project to a close, providing concluding
remarks on the achievements of this work presented herein. Possibilities of further
works relevant to the subject area of this study have also been discussed in Chapter
7, introducing design recommendations of research for future investigation.

2. Literature Review
18
2. LITERATURE REVIEW
As related to the subject of this thesis, the published literature can be
categorised into two main sections: energy absorption and optimisation. The former
category reviews the researches and experiments focusing on the nature of structural
energy absorption and techniques associated with this matter. In the second part of
this chapter, studies exploring the optimisation methods of energy absorbing
structures are studied. The objectives and outcome of these researches and their
connection to the subject matter of this work are critically discussed following their
citing. This review will elucidate the rationales of this research.
2.1. Energy Absorption and Crashworthiness
Energy absorption and structural crashworthiness are two main areas of
concern in mechanical crash analysis. The Transportation Industry is the main sector
where energy absorbing structures become applicable; not only in cars and small
vehicles, but in fact in the fabrication of heavy vehicles, railway components,
aerospace and ship manufacturing. Thus, this section looks at the works of
researchers on the basics of these two concepts.
The term crashworthiness in definition was originally described by Johnson as
“the quality of response of a vehicle when it is involved in or undergoes an impact.
The less damaged the vehicle and/or its occupants and contents after the given event,
the higher the crash quality of the vehicle or the better its crashworthy properties”
(Johnson, 1978). Later, Wierzbicki (1983) defined structural crashworthiness as the

2. Literature Review
19
impact performance of a structure when it collides with another object. For many
decades, crashworthiness has been a necessity in the structural design of vehicles.
In theory a crashworthy design transfers part of an impact load to the body of
the vehicle. It is essential for the amount of this load to be less than the limit that
would result in damage to the body that is being protected. The structure that can
reduce the effect of this load to below its destructive limit can be called an energy
absorbing structure. The peak of this load should also remain within a reasonable
limit (Deb et al., 2004). Researchers have introduced various techniques for reducing
this peak load (Hamada, 1997 and Yamazaki, 2000).
For a more practical application, energy absorbing crash boxes in the form of
thin–walled tubular structures have been suggested (Hanssen et al., 2001). These
crashworthy structures would be replaceable after damage or deformation, making it
less costly for a vehicle to be repaired after an accident. It is preferable for the energy
absorbing structures positioned in these crash boxes to deform in a manageable and
predictable manner. This will ensure compliance between the applied load and the
tolerable limit of the energy absorbing structure, and in return ensuring a reduction in
the kinetic energy and thus the severity of possible injuries on the occupants (Zini,
2005). This is where the study of the deformational characteristics of energy
absorbing structures becomes essential.
2.1.1. Energy Absorbing Structures
Many different energy absorbing structures, with individual properties and
applications, are in existence for commercial use. These structures are currently
employed in a number of applications as barriers, interior/exterior components of
vehicles, wall/floor panels, etc. with many more potential applications still in
development.
Most energy absorbing structures can be categorised in one of the following
groups: Thin–walled Circular Tubes, Thin–walled Rectangular Tubes, Thin–walled
Hat–Section Tubes (the cross section of this structure has the shape of a top hat),
Thin–walled Tapered Rectangular Tubes, Thin–walled Conical Shells and frusta,

2. Literature Review
20
Metallic Foams, Polymeric (Non–Metallic) Foams (Ahmad, 2009) and Cellular
Solids (Avalle, 2006). Images of energy absorbing structures are shown in Fig. 2.1.
Investigations have been made on each group over the years, looking at the
characteristics of the EA structures.
Figure 2.1 – Energy Absorbing Structures: (a) Thin–walled Rectangular Tubes
(Langseth, 1998), (b) Thin–walled Circular Tubes (Olabi, 2007), (c) Thin–walled
Hat–Section Tubes (Schneider, 2008), (d) Thin–walled Tapered Rectangular
Tubes (Shariatpanahi, 2008), (e, f) Thin–walled Conical Shells and frusta
(Gupta, 2006), (g) Metallic Foams (Deshpande, 1999), (h) Polymeric Foams
(Subhash, 2006), (i, j) Cellular Solids (Deshpande, 2003, Gibson, 1997)
A wide range of collapsible energy absorbing structures can be categorised
under the group of thin–walled tubes. Such structures, with various types of
geometrical shapes and material properties, are being extensively used in different
structural applications. The characteristics of these structures have been studied by
many researchers. The works of Johnson et al. (1978), Reid (1993), Hanssen et al.
(2000a–b), Alghamdi (2001), Jones (2003) and Abramowicz (2003) provide broad

2. Literature Review
21
descriptions of the attributes of these structures and their deformational behaviour.
Each type of structure is reviewed below.
Zhang et al. (2009) found the energy absorption capacity of thin–walled tubes
to be notably subjective to their material properties and geometrical features. A thin–
walled tube could have various cross sectional shapes, including but not limited to
circular, square, rectangular, tapered and hat–sections (Ahmad, 2009).
According to research done by Zarei et al. (2008), thin–walled circular tubes
are light and, due to their geometry perform efficiently as energy absorbing
structures. Another reason for their vast usage as EA structures is explained by
Gameiro et al. (2007) to be due to their display of a reasonably constant operating
load. A down point of this structure is its limited length, since as concluded by Zarei
et al. (2006), the circular tube has a length limit above which it will buckle; hence a
substantial reduction in its energy absorption capacity. As noted by Mamalis et al.
(1983) and agreed by Yuen et al. (2008), a circular tube shows higher levels of
energy absorption capacity compared to its square counterpart.
Square or rectangular based thin–walled tubes were originally looked into by
Abramowicz et al. (1984). The response of these structures to static and dynamic
loading was investigated more thoroughly over the years by researchers such as Reid
et al. (1986), Otubushin (1998), Hanssen et al. (1999) and Meguid et al. (2007).
Despite similarities in their load vs. deformation curves, rectangle based tubes
deform in a different pattern, compared to circular tubes. Reid et al. (1986) found the
collapse mode of these structures to be through global bending. This unstable
deformation manner can cause major reduction in the energy absorption capacity of
rectangular tubes. Such an unstable collapse can be avoided by the use of a tapering
technique, as suggested by El–Hage et al. (2005). This method will help the structure
to initiate into a folding pattern which leads to a more manageable crush mechanism.
Published literature on the characteristics of hat–section tubes, as energy absorbing
structures, include White et al. (1999), Tarigopula et al. (2006), Fyllingen et al.
(2009), and Peroni et al. (2009). The studies state that when subjected to axial
loading, a thin–walled hat–section tube displays behaviour similar to that of a square
tube. It can be understood that the energy absorption characteristics of a tube with a
quadrilateral cross section is not greatly affected by the ratio of length to width

2. Literature Review
22
dimensions. Hence, structures with appropriate geometrical dimensions can be used
based on the limitations of the area of application.
An innovative form of rectangular tubes is the thin–walled tapered structures,
which have been developed in recent studies as energy absorbing structures. In fact,
the collapse mechanism of these structures was briefly looked into as early as 1986
by Reid et al. It was based on this study that Nagel (2005) began a thorough
investigation on the deformation behaviour of tapered rectangular tubes under
various loading conditions. Their work was followed by researchers such as
Mirfendereski et al. (2008) and Shariatpanahi et al. (2008). The latter researchers
came to a conclusion that tapered rectangular tubes not only increase the energy
absorption capacity through their deformation pattern, they also decrease the initial
peak load due to their geometrical tapered shape. This in return reduces the damage
caused by the impact load on the protected bodies (Shariatpanahi et al. 2008). In fact,
Reid et al. (1986) proposed that to react efficiently against diagonal loadings, it is
preferable to use tapered structures as energy absorbing components. Hence, conical
shells can also be categorised under this group, due to their tapered geometry with a
circular cross section.
Thin–walled conical shells and frusta have been utilised in various types of
energy absorption applications such as marine and aviation structures, due to their
predictable crush pattern and high energy absorption attributes (Gupta et al. 2006).
Researchers have studied the crush and energy absorption response of these
structures, as subjected to axial compressive loading, axial inversion, axial splitting,
lateral bending, lateral indentation, lateral flattening and dynamic loading (Jones,
1989; Singace et al., 2001; Lu et al., 2003; Prasad et al., 2005; Gupta et al., 2007;
Sheriff et al., 2008 and Ahmad, 2009). The chance of buckling or global bending in a
conical shell is much less than in a circular tube, which makes this structure a better
substitute (Gupta et al., 1999). In comparison, it also shows a more stable
deformation pattern and high levels of specific energy absorption (Mamalis et al.
2005). In 2003 Deshpande et al. studied the characteristics of closed top conical
frusta in an effort to find a deformation pattern for egg–box cellular structures. They
found that the behaviour of these structures displays a pattern that can be expanded
into more complex structures consisting of arrangements of conical frusta. As an

2. Literature Review
23
enhancement factor, Reid et al. (1986) stated that all shell and tube–like structures
can be reinforced using the method known as foam filling.
Foam filling can significantly enhance the energy absorption characteristics of
a structure at very low additional weights. Foams can be open or closed–cell based
on the connections between their pores (Lu et al., 2003). Gibson (1997) and his
research team declared that foam material can deform extensively under low levels
of stress prior to reaching the densification strain point. Advantage is being taken of
these structures in the automotive industry where high energy absorbers of low
weight are considered ideal (Cheon et al., 2004). Gibson et al. (1997) proposed a
mathematical relationship between the stress–strain plateau of the foam material and
its relative density. The equation directly relates the stress over strain ratio of the
foam to the square of its relative density, multiplied by a constant which, from test
data, is determined to be approximately equal to 1. From this equation it is deduced
that foams with higher relative density display higher strength, while their
deformation length shortens. It is therefore necessary to design foam material per
application (Gibson et al., 1997).
Deshpande et al. (2000) and Reyes et al. (2003) have studied the behaviour of
foam structures fabricated from different materials. These can be categorised into
two main groups of metallic or non–metallic (polymeric) foam material.
Metallic foams are a relatively new class of energy absorbing structures, with
the ability to absorb substantial amounts of impact energy as a positive result of their
light weight (Banhart, 2001). Currently, metals such as magnesium, iron, copper,
zinc, titanium and aluminium are used in the production of metal foams (Ahmad,
2009). However, according to a research performed by Lu et al. in 2003, aluminium
has received the greatest attention in this area and aluminium metal foams count as
superior foam structures. Zarei et al. (2006) reported a 25% weight reduction in
vehicles containing energy absorbing aluminium foam parts in their design.
Aluminium is also used in foam filling of hollow structures. An alternative is the use
of low–density polymeric (non–metallic) foams. This energy absorbing structure
offers a number of advantages such as the capability of undergoing large
deformations and absorbing high amounts of energy, without displaying any large
permanent distortions (Triantafillou et al., 1989).

2. Literature Review
24
In 2010, Jeon et al. performed a number of finite element analyses on the
plastic collapse of closed–cell aluminium foams with X–ray computed tomography,
claiming that an increase in the 0.2% offset yield stress of the foam material will
increase the magnitude of the plateau stress, while a decrease in the power–law
hardening exponent not only increases the magnitude of the plateau stress but also
modifies the shape of the plateau stage. It has also been stated that an increase in the
0.2% offset yield stress with a decrease in the power–law hardening exponent, causes
an extreme increase in the magnitude of the plateau stress (Jeon et al, 2010). Despite
the favourable magnification of the plateau stress, the research group ignore its
simultaneous effect on raising the initial load peak. Such a high load peak would
mean a greater amount of the shock load transferred to the supported body in the
initial stage of an impact.
The attributes of polymeric foams are widely recognised, as the new provisions
in the Federal Motor Vehicle Safety Standards make the use of polymeric foam
materials inside motor vehicles a compulsion in order to protect the occupants during
accidents (FMVSS, Standard No. 302). Other characteristics of this structure include
its rate–independent behaviour during loadings as well as its consistent performance
in different loading directions (Sherwood et al., 1992).
As mentioned before, reinforcing the thin–walled structures with foams can
increase their energy absorption to considerably higher levels. Many researchers
have studied the performance of different foam–filled tube–like structures such as the
studies made on foam–filled square tubes by Aktay et al. (2006), Hanssen et al.
(2000b), Santosa et al. (2000); Seitzberger et al. (2000) and Zarei et al. (2008),
Zhang et al. (2009) with the general conclusion that longitudinal compression load
and energy absorption value of foam-filled square tubes is higher than the sum of
that of aluminium foam and empty tube due to friction and interactions between the
tube and foam. In transverse direction, the compression load and energy absorption
ability of foam-filled square tubes are significantly lower than those in longitudinal
direction.
In addition, investigations made on the characteristics of foam–filled circular
tubes by researchers such as Borvik et al. (2003), Kavi et al. (2006), Toksoy et al.
(2005) and Yan et al. (2007), also concluding that the combination of tube and foam

2. Literature Review
25
has stronger energy absorption characteristics compared to empty circular tubes or
foams alone.
Foam–filled hat sections have also been looked into by researchers such as
Chen (2001) and Song et al. (2005). The works of Mirfendereski et al. (2008) and
Reid et al. (1986) provide information on the behaviour of foam–filled tapered
rectangular tubes under various loadings while the effects of foam–filling conical
shells have been investigated by Gupta et al. (1999). Contradictory comments have
been made on the weight saving benefits of the foam filling technique. Lampinen et
al. (1982) commented that below a certain wall thickness in the tubes and shells, the
filling tends to become heavier than the original structure; hence the weight–saving
benefits would no longer exist. On the other hand, researchers such as Santosa et al.
(2000), Banhart (2001) and Reyes et al. (2004) claimed that aluminium foam filled
metal tubes are weight effective with the increase in energy absorption capacity.
Studies find foam–filling to be superior to thick tube walls, referring to the
deformation pattern of the structure which can be influenced by the changes of the
geometrical factors (Asavavisithchai et al. 2004).
Cellular solids are structures consisting of an arrangement of thin–walled tubes
or shells, attached to each other at sides or corners. Cellbond Composites Ltd., a
specialist in the production of energy absorber structures, currently utilises materials
such as aluminium, polycarbonate, ABS (Acrylonitrile Butadiene Styrene) and
combinations of them, to create purpose–specific impact absorbing structures. The
Company expertises in the production of cellular solid EA structures including
Honeycomb absorbers and egg–box structures. The latter is patented by the
Company under the name of PressLoad (Ashmead, 2000). The structural details and
geometrical properties of this structure were introduced in a conference paper
released by the Company (Ashmead et al., 2000); this information will be provided
later in the text. A great deal of emphasis has been put on improving the performance
of Honeycomb energy absorbers within Cellbond as well as their simulation and
numerical analysis (Asadi and Shirvani, 2006). A number of Honeycomb based
energy absorbers have been introduced by the Company, varying in their structural
design and material types, which are used as side and frontal impact barriers in the
automotive industry. The characteristics of Honeycomb barriers have been

2. Literature Review
26
investigated by Cellbond engineers both experimentally and numerically. Studies
include the evaluation of the accuracy of a finite element model representing the
IIHS side impact barriers (Asadi et al., 2007a), generating an advanced FE model for
the AE–MDB side impact barriers (Asadi et al., 2007b), development of a numerical
model for NHTSA impact barriers (Asadi et al., 2008b), modelling and analysing the
ODB impact barriers in LS–DYNA® using solid elements (Asadi et al., 2008a) and
comparing the latter model with a shell–based simulation of the same barrier (Asadi
et al., 2009). These Honeycomb barriers are designed to present the bumper of
specific vehicles according to the regulations associated with their application.
A recent study was made on the crashworthiness of a new type of honeycomb
sandwich, known as kagome honeycomb, under axial crushing loads (Zhang et al.,
2010). The intention was to expand the plastic deformation zones of this structure
and improve its energy absorption efficiency. It has been found that the kagome
sandwich column has higher mean crash force and better energy absorption
characteristics than a foam–filled column with the same foam density. Another group
of researchers performed compressive tests on foam–filled composite egg–box
panels, through collaboration between Chung–Ang University of Korea and UK’
Cambridge University. It was found that the foam–filled composite egg–box
sandwich panels offer a satisfactory energy absorption capacity with a stable collapse
response resembling an ideal energy absorber (Yoo et al, 2010).
Research has also looked into the behaviour of cellular structures such as
honeycombs and egg–box energy absorbers. Deshpande et al. (2003) look at the
static loading of these structures, claiming that their mathematical and analytical
model for predicting the behaviour of closed–top cones (frusta) can be expanded to
study the characteristics of egg–box structures. The outcome has been validated
against finite element simulations and experimental tests. The second group of
researchers investigate the dynamic crushing of aluminium egg–box structures. The
effect of variances of material properties and physical boundaries on the deformation
response of these structures has been studied. With the aid of FE simulations and
experimental testing they observe that velocity dependence present in the level of
structural strength of the egg–box structure is mainly due to the strain–rate sensitivity
of the aluminium material from which it has been manufactured Zupan et al. (2003).

2. Literature Review
27
It is concluded in both studies that the energy absorption capacity of aluminium egg–
box structures is comparable to that of metallic foams (Deshpande, 2003 and Zupan,
2003).
More recently, Nowpada et al. (2009) have studied various stages of the
collapse and crashworthiness of aluminium egg-box structure under quasi-static
compressive loading. A comparison with the deformation behaviour of concertina
tubes reveals that the drop in strength displayed with these structures is diminished in
the egg-box structures. Thus they conclude that egg-box energy absorbers can play a
significant role in improving the crashworthiness of vehicles. In 2010 Nowpada et al.
looked at the use of egg-box panel for pedestrian safety and found it to be an
adequate cushion to be utilized in HGV truck front as an additional energy absorbing
layer (Nowpada et al., 2010a). Later the research group extended their work to
investigate the deformation pattern of the egg-box geometry under quasi-static
loading using numerical methods. They employed the FE packages HYPERMESH®
and LS-DYNA® as their numerical simulation tools and successfully validated the
FE models against experimental results. Comparing the energy absorption capacity
of a number of different boundary condition situations, Nowpada et al. (2010b)
concluded that the natural occurring restraint within the egg-box panel due to its
repetitive geometry amplifies its energy absorption characteristics.
Among other studies, an investigation was made on the deformation and energy
absorption capacity of composite silicon rubber egg–box panels by Chung et al.
(2007). Their conclusion stated that the compressive behaviour of this composite
structure is affected by the local stacking sequence of the layers of silicon as well as
shear deformation during initial lay–up and draping (Chung, 2007).
Further investigations on the characteristics of the egg–box structures as an
innovative and ideal group of energy absorbers can increase knowledge towards their
optimisation and development. Previous scientists, such as Deshpande et al. (2003)
and Nowpada and Chirva et al. (2010) have instigated the performance of the egg-
box under static and quasi-static loading while this project intends to expand this
investigation into reviewing the dynamic response of these structures.
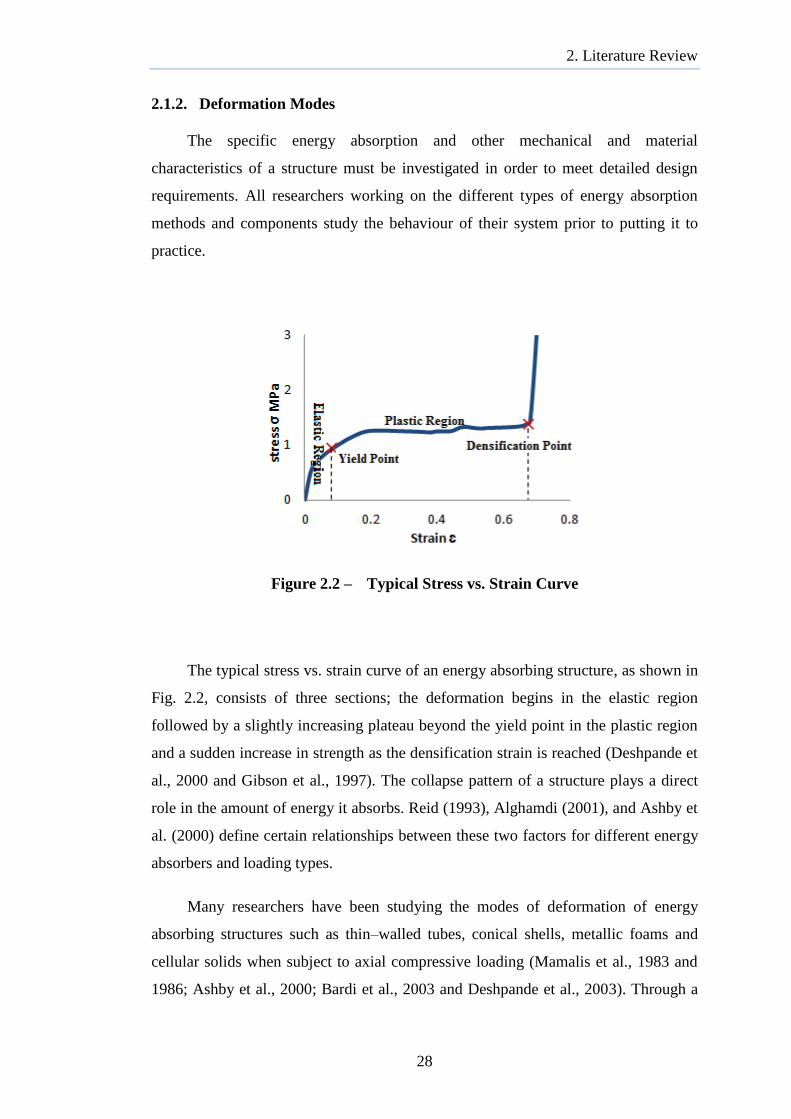
2. Literature Review
28
2.1.2. Deformation Modes
The specific energy absorption and other mechanical and material
characteristics of a structure must be investigated in order to meet detailed design
requirements. All researchers working on the different types of energy absorption
methods and components study the behaviour of their system prior to putting it to
practice.
Figure 2.2 – Typical Stress vs. Strain Curve
The typical stress vs. strain curve of an energy absorbing structure, as shown in
Fig. 2.2, consists of three sections; the deformation begins in the elastic region
followed by a slightly increasing plateau beyond the yield point in the plastic region
and a sudden increase in strength as the densification strain is reached (Deshpande et
al., 2000 and Gibson et al., 1997). The collapse pattern of a structure plays a direct
role in the amount of energy it absorbs. Reid (1993), Alghamdi (2001), and Ashby et
al. (2000) define certain relationships between these two factors for different energy
absorbers and loading types.
Many researchers have been studying the modes of deformation of energy
absorbing structures such as thin–walled tubes, conical shells, metallic foams and
cellular solids when subject to axial compressive loading (Mamalis et al., 1983 and
1986; Ashby et al., 2000; Bardi et al., 2003 and Deshpande et al., 2003). Through a
2. Literature Review
29
series of experimental, analytical and numerical analyses, these studies concluded
that the energy absorption in thin–walled tubes and shells as well as both open–cell
and closed–cell metal foams is mainly by the initiation of plastic hinges and the
bending of cell edges. Other investigations agree that the collapse pattern of conical
shells is the diamond mode with the exception of geometries that consist of a
(Mamalis et al., 1984; Gupta et al., 1997; El–Sobky et al.,
2001 and Prasad et al., 2005).
According to Deshpande (2003) cellular honeycomb structures deform through
the formation of a series of folds occurring on each cell of a panel and hoop
stretching of the cell walls among individual folds.
As one of the objectives of their study, this group of researchers demonstrates
that, similar to that of conical frusta, the initiation of deformation in egg–box cellular
structures is also due to the formation of travelling plastic hinges within every
individual cell of this structure. The latter research group as well as Zupan et al.
(2003) define three different collapse modes for the egg–box structure, based on its
boundary conditions: 1) a simply constrained egg–box panel deforms through a
travelling hinge mechanism, 2) an entirely unconstrained egg–box structure collapses
through an inversion of the truncated cone followed by axisymmetric plastic
buckling, and 3) an egg–box panel with bonded face sheets becomes deformed via an
axisymmetric plastic buckling. Reference has been made to the works of these
researchers in this thesis.
2.1.3. Experimental Testing
Repetitive compressive deformation tests and crash experiments are
conventional methods of studying the behaviour of energy absorbing structures.
Researchers such as Mamalis et al. (1986) based their investigations on experimental
methods primarily, certifying their outcomes by comparison against approximate
theoretical estimations. This method, as employed in this study, remains to be used
as a tool for numerical and analytical data verification. Despite their accuracy
benefits, such tests are not always desirable due to the expenses associated with their
conductance and the complexities involved with repeating tests to exact measures.
2. Literature Review
30
Researchers have experimentally examined the collapse mechanism and energy
absorption characteristics of tube–like structures. Abramowicz et al. (1989)
successfully validated the theoretical results of their proposed analytical method for
predicting the crush behaviour of multi–corner prismatic columns, against their
experimental results. The energy absorption of aluminium rectangular and circular
tubes under axial impacts have been experimentally investigated by Kim et al. (1999)
to find that symmetric folds were formed in the circular tube specimens while
asymmetric folds were formed mainly in the rectangular tube specimens. This results
in a comparatively better energy absorption by the circular tubes.
During impact, the kinetic energy of the impactor is transferred into strain
energy of the material; kinetic energy of the structure; and the energy created to form
deformation (Finn et al., 1991). Studies show that a sharp impactor has a greater
potential to induce impact damage than a blunter impactor does. A sharp impactor
with smaller impact energy is able to generate the same damage as a blunt impactor
of higher incident energy (Mosallam et al., 2008).
As relevant to the subject of this study, researchers such as Deshpande et al.
(2003), Zupan et al. (2003), Akisanya et al. (2006), Chung et al. (2007) and,
Nowpada et al. (2008, 2009, 2010) use quasi-static and dynamic experimental testing
to investigate the deformation behaviour of the egg-box structure as an energy
absorbing element. From these experimental works some researchers proceed to
developing analytical and numerical models.
In practice, during an impact event, especially in road accidents, the load
applied to the impacted body is not purely of axial or bending nature. In fact the
collapse follows a complex manner under a combination of axial and off-axis or
oblique loads. Such loadings cause energy absorbing structures installed in the
vehicle body to deform through both axial and global bending collapse modes. The
structure tends to deform through a global bending when subjected to an oblique load
which reduces the energy absorption capacity of the structure. It is therefore
important to study the behaviour of energy absorbing structures under oblique
impacts in addition to axial loadings.

2. Literature Review
31
Some studies have investigated the oblique loading response of aluminium
square and circular tubes both experimentally and numerically (Han and Park 1999;
Reyes et al. 2002; Borvik et al. 2003; Reyes et al. 2003). These studies show that the
initial peak load, the mean load and the energy absorption capacity drop drastically
with increasing load angle away from the vertical. Reyes et al. (2004) and Borvik et
al. (2003) examined the crush response of foam-filled square and circular tubes
respectively, under axial and oblique quasi static loading with a load orientation
range of 0- ˚ with the vertical. Numerical results showed that a global collapse
, resulting in a
reduction of the energy absorption capacity and the experimental results supported
the outcome.
Karbh . )
-
- . This study also showed that the angle of
load orientation can significantly influence the energy absorption performance of
conical tubes, in terms of the reduction in the energy absorption capacity. Ahmad
(2009) also looked at the impact and energy absorption of empty and foam-filled
conical tubes to facilitate their application in energy absorbing systems under axial
and oblique loading conditions by designing quasi-static and dynamic experimental
tests.
However, research information on the crush and energy absorption response of
egg-box structures under axial or oblique impact loading is limited. As a validation
method for the FE models simulated in this study, dynamic tests are conducted on
egg-box structures. The experiments include impacting an entire panel axially as well
as observing the behaviour of a single c angle
both within an egg-box panel and as a free-edge part.
2.1.4. Analytical Modelling
For decades, the development of mathematical models has been a common
means of exploring the energy absorption characteristics of a variety of energy
absorbers under different loading conditions. Such theoretical methods are based on

2. Literature Review
32
simplified models of the problem alongside a number of assumptions. This can be a
very approximate measure, since, due to its simplicity, it ignores many geometrical
and physical factors that could potentially affect the outcome. However, along with
an experimental or numerical model, analytical modelling can be a valuable source
of result validation.
Prior to the introduction of commercial finite element codes, empirical
modelling was widely used to study the energy absorption response. An analytical
method was originally formulated by Alexander (1960) as a solution to analysing the
axisymmetric crush of thin-walled cylindrical shells under static axial loads.
Alexander uses simplified kinematic mechanisms by assuming a kinematically
admissible deformation field on the basis of experimental observations or theoretical
assumptions.
Many researchers work on developing more accurate theoretical models for
solving the behaviour of complex deformation patterns and structures. Alexander
(1960), Abramowicz et al. (1986), Grzebeita (1990), Gupta et al. (1997) and
Deshpande et al. (2003) have made attempts on proposing and developing new and
existing analytical models for measuring the collapse mechanism of energy
absorbing structures. The derivation of such theoretical models involves
comprehensive mathematical approaches. These models are generally based on the
results of experimental tests. Theoretical approaches can be counted as suitable tools
for initial measurements of the behaviour of a structure especially in less complex
systems.
The less complicated theoretical model can be used in predicting the collapse
response of structures. Sheh et al. (1992) developed a simple theoretical model, to
provide approximations on a frontal vehicle crash. To increase the calculation speed
and accuracy of the theoretical models of the complex system, methods such as finite
element analysis were utilised.

2. Literature Review
33
2.1.5. Numerical Simulation and Analysis
The introduction of Finite Element (FE) packages to the world of structural and
mechanical calculations has been an invaluable tool in studying the characteristics of
energy absorbers. In general, these structures tend to display complex deformation
behaviours which, in practice, cannot be accurately modelled using the traditional
analytical methods. With the use of the correct FE software, designers can simulate
accurate models representing the static or dynamic crushing of certain energy
absorbers under different loads (Farley, 1986). This technique becomes extremely
valuable in the initial design of energy absorbing structures such as vehicles body
parts. Finite element analysis can be accurate, time–saving and inexpensively
repeatable.
Many structures of various geometries and materials have been modelled by
researchers as parts of their investigation on the energy absorption characteristic of
the structures. The outcomes of the models can help validate the analytical or
experimental results.
Researchers use different packages for the purpose of the structural analysis of
the deformation of energy absorbers. Abramowicz (2003) used CRASH CAD® to
study the bending and axial collapse of thin–walled energy absorbing tubes in
vehicles. Through definition of the desired cross–section for the tube, their detailed
analysis of the dynamic crash behaviour of the vehicle produced satisfactory
outcomes which were in agreement with the experimental results. In their study of
1999, Langseth et al. modelled the axial impact of square aluminium tubes using the
explicit finite element code LS–DYNA®. They studied the effect of impact mass and
velocity on the deformation mechanism of the tube. In line with the time–saving
benefits of using FE packages, Langseth et al. (1999) took advantage of the
symmetrical geometry of a square tube and by applying the appropriate boundary
conditions, modelled one quarter of the entire aluminium tube, thus reducing the time
of analysis. The results obtained in their experimental programme were agreeably
comparable to the predictions of their dynamic simulations. Their FE simulation
gave good evaluation of the final profile shape in addition to a force-displacement
curve with a ratio of 0.87–1.0 between FE and experiment.

2. Literature Review
34
The selection of the FE package is based on the material and geometrical
attributes of the structure as well as the details required from the output data.
Researchers such as Karagiozova et al., (2000 and 2004) used the explicit code of
ABAQUS® for their simulation purposes. More simplified models can be solved
using the implicit package such as ABAQUS/Standard V.5.8 used by Karagiozova et
al. (2001).
Depending on the complexity of a structure and the conditions for which it is
being tested, an FE replica can be produced by 2D axisymmetric modelling or 3D
, ’ . A j
(2000) employed the 2D axisymmetric modelling technique to simulate the inversion
of plastic tubes using ABAQUS® 5.7-3. Good agreement was obtained between the
experimental results and their FE predictions. This 2D method can help save
computation time by reducing the number of components.
Other studies on this subject area include the research of Santosa et al. (1998,
2000) on foam material and foam filling of EA structures. Chen et al. (2001) and
Reyes et al. (2004) also studied the bending collapse and torsion deformation of
these structures. Mamalis et al. (2001) carried out an FE simulation of the axial
compression of metallic thin–walled square frusta. The FE code LS–DYNA® has
largely been used by designers and engineers. Many researchers in the energy
absorption area have used LS–DYNA® to simulate models and verify results against
experimental and theoretical approaches. The investigation on the vehicular impact
on a portable concrete barrier done by Ulker et al. in 2008 is one such example where
LS–DYNA® pre and post–processor are used to model in details an available crash
test in order to develop a set of charts for assessing the barrier displacement and
related variables prior to entering the design phase (Ulker et al, 2008).
Researches performed on the characteristics of energy absorber structures using
AN Y ® O .’ ed oblong
tube energy absorbers. The implicit version of ANSYS® was used to simulate the
quasi–static lateral compression of nested systems (Olabi et al., 2008). Morris et al.
also used the implicit ANSYS® in 2006 in the analysis of nested tube type energy
absorbers with different indenters and exterior constraints. In a more recent study at
Dalian University of Technology in China, ANSYS® was used to investigate the

2. Literature Review
35
crashworthiness of kagome honeycomb sandwich cylindrical energy absorber
columns under axial crushing loads (Zhang et al, 2010).
A group of researchers used the nonlinear ANSYS/LS–DYNA® code to
analyse and simulate the inversion processes of a specific type of tube under axial
compression (Zhang 2009). Another group used ANSYS/LS–DYNA® to investigate
the relations between configuration parameters of double–walled hexagonal
honeycomb cores and their out–of–plane dynamic plateau stresses at various impact
velocities (Deqiang, 2010), all achieving satisfactory predictions of the experiments.
Within the Cellbond Composites Company, preliminary work has already been
carried out looking at the finite element modelling of some egg–box geometries.
Depending on the area of application, based on the maximum temperature, the level
and angle of impact, and the boundary conditions that the structure will be subjected
to, egg-boxes can be produced from metallic or non-metallic (polymeric) material
(Ashmead et al, 2000).
Furthermore, Zupan et al. (2003) proposed a 3D finite element shell model of
the egg-box since, despite the correct collapse modes, the calculations that had been
made using their original axisymmetric finite element model gave less accurate
’ . In this study, 3D FE models
were developed and validated against the results of experiments in order to further
analyse the geometrical features of egg-box structures and their effect on the
deformation pattern of the absorber. Although their predictions were improved with
the 3D simulation, the material model they defined to model the aluminium alloy,
lacked adequacy in taking into account the rate sensitivity and failure of the material.
This issue is addressed in the study in hand.
2.2. Optimised Energy Absorption
Modifications made to the vehicle safety standards and requirements call for
constant improvements in the crashworthiness and performance of energy absorbing
structures. In their research on the design optimisation of vehicle components, Avalle

2. Literature Review
36
et al. (2002) stated that vehicle parts should be redesigned regularly, in order to
enhance the global performance of all means of transportation.
In order to find the optimal structures, many individuals and industries have
endeavoured to improve the quality of their designs and processes. With the
availability of advanced and powerful computing methods, a greater number of
options can be examined and the objectives can be rapidly achieved (Choi, 2002).
Prior to designing an optimal energy absorber, it is necessary to study its
deformational behaviour. As described by Harte et al. (2000) the force–displacement
curve of an ideal energy absorber displays a long flat plateau at its plastic region.
Tubes, shells and cellular solids satisfy this deformation pattern to different extents.
Mamalis et al. (2003) described three individual stages for the deformation
pattern of an optimised energy absorbing structure:
Stage 1: Initially the specimen behaves elastically and the load rises to a
peak value followed by a sudden fall.
Stage 2: The load increases with increasing deflection associated with
the formation of lamina bundles bending inwards and outwards. The
wedge formation is complete when the load starts oscillating.
Stage 3: Stable crush with the formation of inward and outward fronds
which spread radially in the form of a mushrooming failure. The
external fronds develop axial splits due to the developed tension. Axial
fibres bend inwards or outwards without fracturing, whilst fibres
aligned in the hoop direction can only expand outwards by fracturing
and inwards by fracturing or buckling.
These three stages can be individualised per structure type and function.
A research group from the University of Guilan explored the energy absorption
of square aluminium tubes using multi–objective genetic algorithms for Pareto–
approach optimisation of the energy absorption of square aluminium columns both
with and without aluminium foam filler. Their findings suggested that non–filled
columns were preferred over foam–filled ones for desired energy absorption levels of
2. Literature Review
37
no more than 4.8 kJ, however, where higher levels of energy absorption is of interest,
foam-filled columns will perform more favourably (Nariman–zadeh et al. 2006).
Gupta et al. (2006) also looked at the deformation pattern and energy
absorption attributes of circular tubes under quasi static and dynamic impact loading,
both numerically and experimentally. They varied geometrical parameters such as
the wall thickness and diameter to find that the energy absorption capacity of circular
tubes in dynamic tests is around 1.56 – 12.3% higher than in quasi–static tests, while
the initial peak load amplifies by about 14.33 – 40.25%. In addition, they came to the
significant conclusion that both the crush load and energy absorption capacity
increase with greater thickness and diameter values.
According to Nagel et al. (2006), a tapered rectangular tube can perform as an
ideal EA structure in dynamic applications where combinations of both axial and
oblique loads are present. The study concludes that, below a defined limit of critical
load angle, the energy absorption capacity of a tapered rectangular tube decreases
with the increase in the load angle. This claim was verified by Liu (2008) in a later
research.
In 2007, Hou et al. investigated on the single and multi-objective optimisation
of energy absorbers in general and thin-walled rectangular tubes specifically. The
research group looked into optimising the cross-sectional dimensions of multi-cell
tubes to enhance their energy absorption characteristics. Their study indicated that
improvements implied to each objective will only enhance the overall behaviour of
the system to a certain extent, while it simultaneously affects the other objectives
negatively. In their research an optimisation algorithm was defined to seek optimal
parameters for both criteria of maximising the energy absorption and reducing the
peak crushing force. The group concluded that the former objective is achieved with
more cross-sectional cells while the crush force does not follow a pattern in the cases
of optimising either objective (Hou et al., 2007).
In the deformational performance of conical shells and frusta, geometrical
features, such as wall thickness, diameter, angle, height, etc., and material properties,
’ , , , ’ , .,
play a significant role. The relationship between geometrical and material features
2. Literature Review
38
and the critical buckling load of conical shells is expressed by Spagnoli et al. (1999)
in the form of an equation, making evident the effect of these features on the
behaviour of the structure. A set of experimental and numerical tests, performed by
various researchers, helped describe the characteristics of an ideal conical shell
(Gupta et al., 2006, 2007, 2008; Mamalis et al., 2005 and Sheriff et al., 2008). Gupta
(2007) explained that the rate at which a load is applied also affects the energy
absorption capacity of the structure. In dynamic loading, the increase is at
approximately 8.93 – 49.6% while in quasi–static load cases, it is for angles varying
between . . and at mean diameter to thickness (D/t) ratios of between
22.32 and 79.29 that the load increases.
A comprehensive parametric study will reveal the effect of various geometrical
and material parameters on the deformation mode, mean load and absorbed energy of
the conical shell energy absorbing structures. The current study evaluates the effects
of changing various geometrical parameters on the deformation pattern of egg–box
energy absorbing structures under dynamic impact loads.
2.3. Optimisation of Egg–box Structures
Despite the significance of egg–box cellular solids as enhanced energy
absorbing structures, not a great deal of research has been dedicated to investigating
their performance and development.
In a 2010 study, Yoo et al. performed a series of compressive tests, at different
loading and material conditions, on foam–filled composite egg–box panels. They
came to the conclusion that foam–filled composite egg–box sandwich panels offer a
good energy absorption capacity with a stable collapse pattern resembling the ideal
energy absorber.
Works of researchers such as Nowpada et al. (2009, 2010a,b), Yoo et al.
(2010), Chung et al. (2007), Akisania et al. (2006), Deshpande et al. (2003), Zupan et
al. (2003) and Ashmead et al. (2000), focus on the effects of factors such as material
alterations, loading conditions and some geometrical modifications, on the
deformational pattern and energy absorption characteristic of the egg–box structure.

2. Literature Review
39
However, no comprehensive sets of data are available on the effects of geometrical
alterations on the performance of egg–box energy absorbers.
According to Akisania et al. (2006), an egg–box is effectively a square array of
conical frusta. Based on Gupta’ (2007) comments, in conical frusta, modifications
of geometrical factors directly affect the behaviour of the structure; hence, it can be
concluded that an egg–box structure can be geometrically designed to perform in an
optimum manner. Based on this conclusion, this project attempts to geometrically
optimise the structure of the egg-box.

3. Experimental Testing
40
3. EXPERIMENTAL STUDIES
3.1. Introduction
For the purpose of validating the computer aided simulations proposed in this
study as the optimisation tool for enhancing the energy absorption capacity of the
egg-box structure, a series of experiments have been designed and conducted herein.
The tests include axial and oblique impacts of free-edged single cells separated from
egg-box panels, axial and oblique impacts of single cells situated within panels and
axial impacts of entire egg-box panels. This chapter includes details on the
specimens used, their material properties, preparation procedure, the test equipment
as well as the techniques employed and the results of the experiments.
3.2. Material Details and Sample Preparation
In this study two geometrically different egg-box samples are impacted. The
samples were fabricated from aluminium sheet metals. Commercially Pure (CP)
annealed 1050 H111 aluminium sheets, consisting of 99% aluminium, with
thicknesses of 0.8mm and 1.0mm were used in the production of specimens.
The 1XXX series aluminium alloys consist of 99.0% or higher levels of pure
aluminium. The letter H applies to alloys which have their strength increased by
strain-hardening, with or without supplementary thermal treatments, to produce
partial softening. The H is always followed by two or more digits. The first digit
indicates the specific combination of basic operations. H1 applies to aluminium
alloys which are strain-hardened to obtain the desired mechanical properties without
supplementary thermal treatment. The number following the designation indicates

3. Experimental Testing
41
the degree of strain-hardening with 0 being the softest and 9 designating an extra
hard alloy. So the hardness of this alloy is of the first degree, i.e. it is a soft alloy.
The third digit indicates that the degree of control of temper or the mechanical
properties are different from, but within the range of, those for the two-digit H
temper designation to which it is added. H111 applies to alloys which are strain-
hardened less than the amount required for a controlled H11 temper (USA Dep of
Defence, 1966).
(a)
(b)
Figure 3.1 – Stress vs. Strain Curves of CP Aluminium Sheets (Zupan, 2003)
(a) Measured Tensile Behaviour of Al 1050 H111 Sheets
(b) Dynamic Stress vs. Strain of CP Al at Selected Strain Rates
0
20
40
60
80
0 0.1 0.2 0.3 0.4 0.5
No
min
al S
tre
ss (
MP
a)
Nominal Strain
0
40
80
120
160
0 0.05 0.1 0.15
Un
iaxi
al S
tre
ss M
Pa
Strain
9240 S-1 5770 S-1 115 S-1 5.7E-2 S-1 5.7E-4 S-1

3. Experimental Testing
42
Al1050 is a grade of aluminium used for general sheet metal work where
moderate strength is required. The material properties of the alloy are provided in
Figure 3.1(a). Figure 3.1(b) also shows the stress-strain curves of this material for a
range of strain rates.
The sheets were cold–pressed between lubricated closed dies into egg–box
shaped sheets, then cut to panels with overall cross dimensions of 300 × 300 mm2, at
Cellbond Composites Ltd. The dimensions and geometrical details of the two sample
sets are presented in Table 3.1 in accordance to the factors shown in Fig. 3.2. Factors
(R) and (r) are approximate measures. From a comparison between the dimensions of
the samples it is evident that they were selected to vary in size in order to consider
structures of different relative densities and strengths.
Figure 3.2 – Geometrical Dimensions of Egg-box Cells
Geometrical
Factors
W
(mm)
d
(mm)
p
(mm)
h
(mm)
t
(mm)
R
(mm)
r
(mm)
ω
(deg)
Sample 1 75 24 103 12 0.8 50 2 48
Sample 2 36 10 52 6 1.0 50 2 53
Table 3.1 – Egg–box Cell Dimensions

3. Experimental Testing
43
3.3. Impacting System and Data Recording Devices
The egg-box panel specimens are impacted by drop masses of 5500g and 225g,
for the entire panel and the single cells respectively, as shown in Fig. 3.3. The
weights are directed to free fall at a contact speed of 6ms-1
. The loading mass and
velocity of the impactor can be increased or decreased as appropriate. Zupan et al.
(2003) suggest impacting egg–box panels of below 1m2 cross sectional area with an
impactor mass of 5.5kg moving at a velocity of 6m/s.
A cubic mass of 225g with cross-sectional dimensions of 72mm × 72mm which
is approximately 70% of the plan view area of a cell is used for impacting free-edge
single cells. Cylindrical weights are made per sample with dimensions relative to the
peak diameter of the sample. These impactors are used for impacting single cones
within a panel. A flat impactor is used for drop tests on the entire egg-box panels
with a surface area of approximately 70% of that of the panel. The edges of the
impactors are given a 1mm, chamfer to reduce the damage from a sharp corner as
described in Mosallam et al. (2008).
Figure 3.3 – Dimensions of Impactors Used in Dynamic Tests
A drop tower (Fig. 3.4), designed and built within the laboratory for
experimental work of similar nature, . T
, and placed on rigid
metal wedges for stability as shown in Figure 3.5.

3. Experimental Testing
44
Figure 3.4 – Drop Tower and Boundary Fixtures
In the flat tests involving single free-edge cones cut from the panel the body
will be resting freely on the solid and rigid surface below with no constraints. For the
oblique tests of the same specimen, the structure is freely placed at the bottom of the
tilted support where it is resting on the end bracket to prevent it from sliding.
Figure 3.5 – Wedges Placed Below Impact Surface for Oblique Loading
Where the entire panel is taking part in the test, the samples are required to be
simply supported by the base of the tower and boxed in from four sides to prevent
any lateral movements.
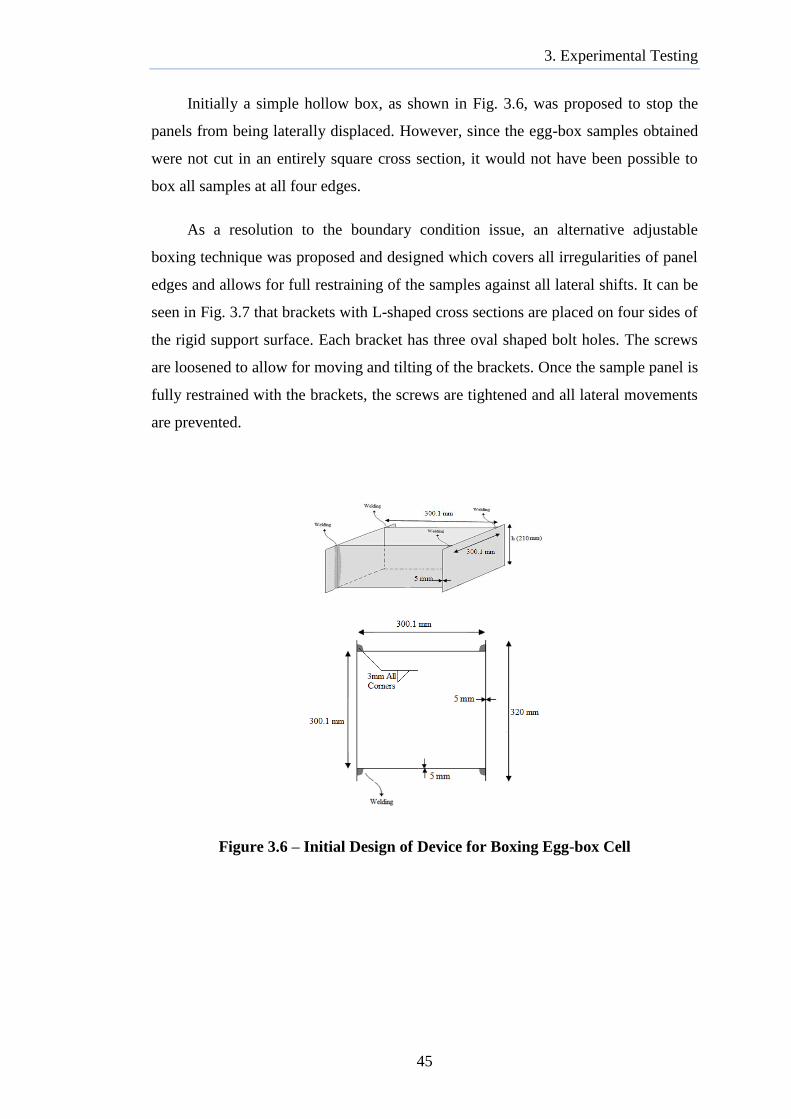
3. Experimental Testing
45
Initially a simple hollow box, as shown in Fig. 3.6, was proposed to stop the
panels from being laterally displaced. However, since the egg-box samples obtained
were not cut in an entirely square cross section, it would not have been possible to
box all samples at all four edges.
As a resolution to the boundary condition issue, an alternative adjustable
boxing technique was proposed and designed which covers all irregularities of panel
edges and allows for full restraining of the samples against all lateral shifts. It can be
seen in Fig. 3.7 that brackets with L-shaped cross sections are placed on four sides of
the rigid support surface. Each bracket has three oval shaped bolt holes. The screws
are loosened to allow for moving and tilting of the brackets. Once the sample panel is
fully restrained with the brackets, the screws are tightened and all lateral movements
are prevented.
Figure 3.6 – Initial Design of Device for Boxing Egg-box Cell

3. Experimental Testing
46
Figure 3.7 – Boxing Technique
The applied force is measured using a Loadstar® universal low profile pancake
load cell with ±0.05% accuracy class and the data is recorded through a 1000kg
capacity Loadstar® digital interface with 5000Hz data update rate.
To measure the acceleration over time from which the relative displacement is
derived, an accelerometer is needed to be installed on the system. A simple
calculation can be made in order to select the appropriate accelerometer. Assuming
an approximate total time of t=0.003s for a typical impact at a contact speed of
v=6m/s, acceleration (a) could be measured as:
then to find the required G-levels for an accelerometer:
3. Experimental Testing
47
Therefore, the accelerometer to be used must be sensitive for G-levels of more than
200G. A high frequency industrial accelerometer with ±500G is placed on the
impactor for this purpose. The high frequency output rate will allow for enough data
to be recorded in a small fraction of time. With the short duration associated with an
impact, the high frequency sensor would be able to trace adequate data per
microsecond.
The outputs of the sensors are transferred to a computer equipped with
appropriate software which can save the data for future calculations and graphing.
3.4. Dynamic Impact Experiments on Egg-box Specimens
Three sets of tests are performed per sample type including flat impact of the
entire panel, flat impact of a single cell within the panel and oblique impact of a
single cell within a panel. For sample type 1 two extra set of tests are conducted
including flat impact of a free edge single cell and oblique impact of a free edge
single cell. Due to the small geometrical features of sample type 2 and the velocity of
the impact, the latter test has been omitted for this sample type. The samples are
simply supported in all cases, with no lateral movements in the first three test types.
To reduce experimental errors and ensure data accuracy, each experiment is
repeated for 5 specimens from each sample, giving a total of 40 tests.
In the flat impact experiment, the 5500g drop mass is designed and directed to
freely fall on the egg-box panels. The samples are aligned within the drop tower and
the load is released. The measured data are accumulated and saved through the
system. The results of 5 flat impact tests on sample type 1 and 5 flat tests on sample
type 2 are provided in the upcoming section and discussed later in the text.

3. Experimental Testing
48
A tube-like structure is used to guide the cylindrical drop weights towards
single cells within the egg-box panels. The drop masses although different in
diameter, weigh the same 225grams. The guiding tube is designed to have a groove
along its length to reduce the effect of air pressure below the falling weight as well as
avoiding turbulence.
The drop masses are centred with the cell as well as the load cell prior to the
impact taking place. Out of axis loads applied on the load cell can reduce its
accuracy and functionality. For both flat and oblique tests of single cones data are
recorded to be further analysed.
3.5. Results of Flat and Oblique Impact Experiments
Provided in this section are the results of the experimental work explained
above. The outcomes are briefly discussed in this chapter. The main objective is to
use this information towards the validation study of the finite element models
presented in the following chapters. Upon achieving reasonable precision, it can be
shown that the response of test specimens could be predicted using numerical models
with sufficient accuracy.
Free-edged single cells of sample 1 are initially impacted with a 225g
(load direction shown in
Fig. 3.5). As explained previously, for the oblique loading, the rigid support surface
is tilted and the cell is aligned with the bottom bracket to avoid sliding. The results of
these tests are provided in Figure 3.8 and 3.9 for the 5 specimens.
In quasi-static deformation of free-edged single egg-box cones, as reported by
Nowpada et al. (2010), the deformation procedure initiates with the flattening of the
peak curvature. However, in the dynamic impact, due to the speed of the loading,
following the initial contact, the material begins to stretch. The signs of low strength
displayed by the structure at this stage are due to the friction present between the cell
and the supporting surface. With no constraints present at the edges, the trench
corners at the edge of the cell begin to curl upwards, slightly increasing the strength
level in return. The force level is continuously elevated as the deformation

3. Experimental Testing
49
progresses. In a respective order the deformation continues by plastic hinges forming
at the peak to trench transition lines, peak curvature flattens and then goes through
inversion, the top cone of the cell is plastically deformed and eventually, the force
level rises at a steep slope as full compaction occurs.
Figure 3.8 – Result Curves for Impacting Free-edge Single Cell
Figure 3.9 – Result Curves for Impacting Free-edge Single Cell at
0
1
2
3
0 5 10 15 20 25
Forc
e k
N
Displacement mm
Sample 1 - Free-edged Cone - 90 deg Experimental test 1
Experimental test 2
Experimental test 3
Experimental test 4
Experimental test 5
0
0.1
0.2
0.3
0 0.5 1 1.5 2 2.5 3 3.5 4
Forc
e k
N
Displacement mm
Sample 1 - Free-edged Cone - 45 deg Experimental test 1
Experimental test 2
Experimental test 3
Experimental test 4
Experimental test 5
3. Experimental Testing
50
When a similar free-edged single cone specimen is subjected to an oblique
load, the side of the cell which is initially touched by the edge of the impactor starts
bending at the contact line. The thin shell structure shows very little resistance to this
preliminary load. Due to the presence of the support surface extension acting as a
stop at the bottom of the cell, as the deformation progresses, this end begins to curl
upwards, causing a slight rise in the force-displacement curve. The impacting surface
eventually reaches the peak cone and the entire structure begins to fold, hence the
force level begins to increase further. Finally the impactor hits the tilted support
surface resulting in a steep rise in the curve. T . .
. As a consequence of the freedom present at the cell edges in the first
two test types, the force-displacement curves enter the plastic region at very early
stages of deformation.
Illustrated in figures 3.10 – 3.13 are the resultant curves of the impacts on
single cones within the egg-box panel stru . A brief review of the
force-displacement curves resulted from these tests reveals the effect of the
continuity of the egg-box panel. With the adjacent cells partially restricting the
lateral stretch of the impacted cell, the strength level of the cell rises to almost 1.6
times the free-edged specimen as shown in Table 3.2. Additionally, the entire
deformation behaviour of the cone would be different.
Once the cell is impacted by the cylindrical weight, an inversion process of the
peak cone begins with travelling hinges forming at the peak circle circumference.
The translation of this occurrence in the curve is the initial steep rise.
Simultaneously, the neighbouring trench cones show minor signs of deformation in
the base curvature region. The procedure will continue until the travelling hinges are
no longer present and the inversion of the cone will cease.

3. Experimental Testing
51
Figure 3.10 – Result Curves for Impacting Single Cone of Sample 1
Figure 3.11 – Result Curves for Impacting Single Cone of Sample 2
In the oblique impact of a single cone situated within an entire egg-box panel,
the cylindrical mass, centred with the peak diameter, initially comes into contact with
a corner of the peak curvature. Meanwhile, the cone is bent over a diameter of the
peak circle inline with the impactor edge. The four neighbouring cones in this
situation will be acting contradictorily; the two cells positioned above the impacted
0
0.2
0.4
0.6
0.8
0 5 10 15 20 25
Forc
e k
N
Displacement mm
Sample 1 - Single Cone - 90 deg Experimental test 1 Experimental test 2 Experimental test 3 Experimental test 4 Experimental test 5
0
0.2
0.4
0.6
0.8
1
1.2
0 2 4 6 8 10 12
Forc
e k
N
Displacement mm
Sample 2 - Single Cone - 90 deg
Experimental test 1
Experimental test 2
Experimental test 3
Experimental test 4
Experimental test 5

3. Experimental Testing
52
cell, in terms of the impact location, will be stretched in tension while the lower two
cells will be slightly compressed as part of the impacted cone tilts in their direction.
Figure 3.12 – Result Curves for Impacting Single Cone of Sample 1
Figure 3.13 – Result Curves for Impacting Single Cone of Sample 2
0
0.1
0.2
0.3
0.4
0.5
0.6
0.7
0 5 10 15 20
Forc
e k
N
Displacement mm
Sample 1 - Single Cone - 45 deg
Experimental test 1
Experimental test 2
Experimental test 3
Experimental test 4
Experimental test 5
0
0.1
0.2
0.3
0.4
0.5
0.6
0 2 4 6 8 10
Forc
e k
N
Displacement mm
Sample 2 - Single Cone - 45 deg
Experimental test 1 Experimental test 2 Experimental test 3 Experimental test 4 Experimental test 5

3. Experimental Testing
53
From a comparison between curves of Figures 3.10 and 3.11 with Figures 3.12
and 3.13, respectively, it can be seen in Table 3.2 that a single cone loaded obliquely
has an average load which is approximately half of that of the same cone loaded
vertically. This proves the fact that with more acute angles between the impact
direction and the horizon, the strength of the egg-box energy absorbing structure
decreases.
On another note, despite different geometrical measurements, both samples are
showing similar average force levels. This is due to the larger concentration of cells
in sample type 2 in comparison to sample type 1. As mentioned in the Introduction
chapter, shorter inter-peak lengths mean higher cell density within constant panel
cross-sectional dimensions.
. . impact test for sample type 1
and 2, respectively. It can be seen that both cases follow the same pattern. The crush
response curve shows a primary rise in load in the elastic region with the initiation of
deformation corresponding to the bending/flattening of the peak curvature about its
circumference. This is followed by a kink and change in the slope of the curve as it
enters the plastic region with the appearance of travelling plastic hinges at the top
and bottom, and eventually at the mid-point of the cell walls.
The presence of neighbouring cells and the assumption of the panel being
continuous, minimises the effect of material stretching in the deformation process
due to flat impact. The crush load remains moderately constant with the progression
of deformation up to the point where the peak and base of the cells reach the same
point. The steep rise in the curve emerging past the point of densification illustrates
the bottoming phase where no more plastic hinges will appear. It can be seen that the
densification is occurring at around 75% of the entire height of the panel.
As expected, comparison between the graphs of single cone and entire panel for
each sample shows that the average load level of a single cone is less than 10%
(Table 3.2) of that of the entire panel in cases with restricted boundaries.
Fig. 3.16 shows the samples as impacted with regard to each test type. The
disfiguration patterns can be linked to the deformation procedures described earlier
in this section.

3. Experimental Testing
54
Figure 3.14 –
Figure 3.15 – Result Curves for Dynamic Impact of Sample 2
The experimental work reported in this chapter will be used in conjunction with
analytical equations presented in the following chapter to validate finite element
simulations associated with each test procedure. Upon agreement in results of the
three methods, the numerical technique can be developed to be employed in the
0
2
4
6
8
10
12
0 5 10 15 20
Forc
e K
N
Displacement mm
Sample 1 - Flat Impact on Panel
Experimental test 1
Experimental test 2
Experimental test 3
Experimental test 4
Experimental test 5
0
2
4
6
8
10
12
14
0 2 4 6 8 10
Forc
e k
N
Displacement mm
Sample 2 - Flat Impact on Panel
Experimental test 1 Experimental test 2 Experimental test 3 Experimental test 4 Experimental test 5

3. Experimental Testing
55
study of the effect of geometrical alterations in the behaviour of egg-box structures,
diminishing the need for performing destructive and expensive experimental tests.
Figure # Sample # Body Tested DOF Angle of Impact ETotal
(kN.mm)
3.8 1 Single Cone No Constraint Flat 4.55
3.9 1 Single Cone No Constraint Oblique 0.12
3.10 1 Single Cone Within Panel Flat 7.40
3.11 2 Single Cone Within Panel Flat 3.60
3.12 1 Single Cone Within Panel Oblique 3.45
3.13 2 Single Cone Within Panel Oblique 2.36
3.14 1 Full Panel Laterally Fixed Flat 77.89
3.15 2 Full Panel Laterally Fixed Flat 67.76
Table 3.2 – Total Energy Absorbed by Structures under Experimental Impact
Figure 3.16 – Post-impact -
-
, (e) Sample 2 Single Cone within Panel Imp
, (g) Sample 1 Full Panel
Vertical Impact, (h) Sample 2 Full Panel Vertical Impact

4. Theoretical Consideration
56
4. THEORETICAL CONSIDERATION
4.1. Introduction
In order to enhance the performance of egg-box energy absorber structures
under impacts, it is necessary to understand their behaviour in detail. It would, hence,
be beneficial to have the means to study the progresses of the deformation procedure
at various stages. However, with the very short duration of an experiment between
the moment of impact and full compaction, it would not be possible to perform such
in depth analysis. Such exploration becomes possible using methods such as
analytical and numerical techniques to model an impact scenario. This allows for a
thorough evaluation of the deformation process at any stage as it progresses. Such
theoretical tools can also be used in predicting the behaviour of a structure prior to
the application of physical loading.
Analytical models of the experimental impact tests conducted on various egg-
box cell samples, as reported in the last chapter, are generated in the first section of
this chapter. The developed equations are then used to review the outcomes of
Chapter 3. Additionally, in the subsequent section of the current chapter, finite
element technique has been used to simulate the aforementioned experiments. As
well as presenting the modelling details, this section explores the requirements of a
finite element simulation to ensure maximum result precision. The FE output
curvatures have been successfully validated in conjunction to the experimental
resultant curves. The high level of data precision verifies the competence of the FE
models.

4. Theoretical Consideration
57
4.2. Analytical Modelling
The analytical approach can be used to approximately measure and evaluate the
energy absorption characteristics of the egg–box structures. By developing an energy
equation for the impact scenario of the egg-box, the total amount of energy absorbed
through structural deformation can be approximately calculated. The result would be
valuable in the preliminary assessments of the outcomes of experimental impact
tests.
As described in the work of Nowpada and Chirwa et al. (2010), the total energy
absorbed by structures such as egg-box is equal to the total work done during the
deformation procedure. Equations 4.1 to 4.5 are adaptations of the formula generated
in the aforementioned research for quasi-static loading of egg-box cells, modified in
accordance to the dynamic response of the identified specimen.
Equation 4.1 shows the works done in the vertical impact of the free-edged
cells. The work quantities have been derived based on the developing deformation
stages of the cell following an impact. Complete description of the procedures can be
applied as explained in Chapter 3.
The deformation procedure initiates by the outward stretching of the cell edges
with a work value of . relates to the work done to gradually coil
the unconstrained base corners as the deformation proceeds. The first is the
work due to the formation of plastic hinges at the peak to trench transition lines
which is followed by the flattening of the peak curvature, causing to
take place. Due to the appearance of an additional travelling hinge at the peak
circumference, causing the inversion of the cone, the second is done
bringing the deformation process to an end. As the walls of the cell slide over the
impactor and support surfaces, friction occurs between each two faces. Hence it is
also important to take , the work due to friction into account. The above
works add up to be equal to the energy absorbed through the deformation of the cell.
4.1

4. Theoretical Consideration
58
For the oblique impact of the free-edged cell, the total works done is derived as
given in equation 4.2, where the deformation begins with the impacted side of the
peak cone bending at line of contact with a work value equal to . The
structure begins to slide along the horizontal component of the applied load, causing
the end corners of the cell to roll upwards against the supporting surface and creating
. The peak cone then starts to fold on the side left intact. The work due to the
folding phenomenon is shown in the equation as . also is work
done due to the friction present between contacting surfaces.
4.2
T -
. When vertically impacted, the peak curvature initially
flattens, at a work value of . This is followed by the formation of two
sets of travelling hinges. First group of hinges appear over the circumference of the
peak cone, resulting in the inversion of the cone. This is followed by travelling
hinges appearing at the trench circumference, causing their inversion. With the
presence of the neighbouring cells, the effect of stretching and twisting of the ends
disappears. The sum of the works done due to each of these deformation patterns is
shown in equation 4.3 as:
. 4.3
The oblique impact of the single cell within the panel, for both sample sizes,
causes the peak cone to bend in the load direction, stretching the material behind it
and compressing them beneath, at works of , and
, respectively. The friction present between the impactor surface and
the egg-box shell will result in the work value , shown in equation 4.4.

4. Theoretical Consideration
59
4.4
As for the most momentous experiment, equation 4.5 can be used to evaluate
the total energy absorbed in the flat impact test by adding the works involved in the
deformation process. Subsequent to the impact, the deformation initiates by
flattening of the peak curvature, done by . This is followed by the
development of plastic hinges at top, bottom and middle of the cell walls with a work
shown as . is the load due to bending of the cell walls with the
progression of the deformation. Friction present both above and below the sample is
dealt with via at all stages of the deformation.
4.5
Considering the rule of the conservation of energy, it can be assumed that the
kinetic energy (KE) of the free falling impactor mass would be equal to the potential
energy (PE) of deformation (eq. 4.6).
4.6
Expanding this equation gives:
, 4.7

4. Theoretical Consideration
60
where (m) is the impacting mass, is the speed of the impactor, (g) is the
gravitational acceleration, (H) is the total height of a cell and is the force of the
impact. The impact force can be defined as;
4.8
Hence, based on equations 4.7 and 4.8, the impact stress can be derived as:
, 4.9
with (A) being the area of the impacted structure which is in contact with the drop
mass. The total energy absorbed in the impact event can, ultimately, be
calculated from equation 4.9 as:
. 4.10
The densification point of the panel , for egg-box panel structures starts at strain
values of around 0.6-0.8 (Deshpande, 2003, Akisanya, 2006, Cheng, 2007) and can
be mathematically defined as:
, 4.11
which indicates the depth where the sample approaches the point of densification.

4. Theoretical Consideration
61
The total energy for the egg-box panel samples tested as reported in Chapter 3
is calculated in Table 4.1, from equation 4.10 to be approximately equal to
74kN.mm, at densification depths of 18mm and 9mm based on equation 4.11, for
sample types 1 and 2, respectively.
As associated with the force-displacement curve of an impact, the total energy
absorbed by an egg–box cell during crush can be defined as the area roofed by this
curve up to the point of densification.
Equation
.
Sam
ple
1
Sam
ple
2
Table 4.1 – Total Energy Calculations
A review of the force-displacement curves of the two aforementioned
experiments approves the analytical estimation. For sample 1, the area under the
curve (Fig. 3.14) is approximately equal to 78kN.mm and the same value for the
second sample type (Fig. 3.15) is 68kN.mm. The conformity of calculations from the
analytical method and the test data force-displacement curves is used as a supporting
initiative in conducting further experimental work.
The mathematical method considered here is based on the mechanics of a two
dimensional profile of the samples. It is obvious that the analytical results are
approximate. In the next section, the samples are modelled as 3D replica to analyse
the performance of the structures under impact.
4. Theoretical Consideration
62
4.3. Finite Element Modelling
To be able to observe and analyse the behaviour of a structure under the
influence of various physical stresses, it is initially necessary to accurately model its
geometry. Depending on the type of the structure, severity of the need for outcome
precision, the level of symmetry of its geometry and the loads it is subject to, this
finite element model can be made in a 2D or 3D environment.
Finite element software such as ANSYS® can be used to produce two and three
dimensional geometries. As an advantage ANSYS® offers modelling tools in its pre–
processor division, while it supports both solid modelling techniques, referring to
them as modelling via interface software, and modelling through ANSYS®
Graphical User Interface (GUI).
4.3.1. Geometrical Model
T “ ” AN Y ®
opposed to a techniq , “ ,”
the model of a structure is generated directly through the definition of nodes and
elements without the presence of any geometrical shapes pre–defining the perimeters
and corners of that structure. This method is very time consuming and complicated
unless when used for geometrically simple systems where design optimisation is not
of any interest. Solid modelling technique has been used in this study as the means to
simulate impact of the egg-box structure. ANSYS® 13.0 documentations provide a
list of the cons and pros of this technique (ANSYS® 13.0, 2010).
An evaluation of the structure in hand reveals that the egg–box geometry, being
a three–dimensional complex volume which consists of curvatures and arches,
requires the use of Boolean operations and mesh refinement. Hence solid modelling
technique is selected to generate the cell geometry. In fact, when it comes to the
optimisation of this structure, it would be greatly advantageous to have a parametric
model which allows for further modifications of the geometry. It would be beneficial
and time saving, to generate a model directly through ANSYS® pre–processor,
whether this is by command definition or using ANSYS® GUI.

4. Theoretical Consideration
63
The finite element model, made to represent the egg–box geometry, can be
generated by translating simple cones. However, to reduce the size of the model and,
as its direct effect, the time of the analysis, advantage can be taken of the geometrical
symmetry of cones ergo the egg–box structure.
The three dimensional egg–box cell models for each of the two sample sizes are
presented in Figure 4.1. The cells are modelled in ANSYS® pre–processor to the
most accurate dimensional approximations. It should be noted that the thickness of
the aluminium surface of the egg–box is introduced in the pre–processor as the
virtual thickness of a thin shell element. In other words, the geometrical model
generated herein does not have a physical thickness. Instead, this value is designated
in the form of a real constant to the elements, by which every part of the cell would
be covered.
a) Sample 1
b) Sample 2
Figure 4.1 – FE Model of Egg-box Cells a) Sample Type 1 and b) Sample Type 2
Subsequent to the generation of the geometry of the specimen, the finite
element model has to go through a preparation phase, where every physical aspect of
the practical experiment, including boundary conditions and loadings, would be
simulated and applied to the model.

4. Theoretical Consideration
64
The principal outcome of this section would be to generate and validate a finite
element model with regards to the specifications of the dynamic impact experiments
and explore the finite element results in comparison to the data obtained from the
experimental works.
4.3.2. Material Properties
As stated in the previous chapter the egg–box samples were fabricated out of
Commercially Pure (CP) Al1050 H111 aluminium alloy metal sheets which consist
of 99% aluminium. The sheets were cold–pressed into egg–box shaped panels with
overall dimensions of 300mm × 300mm lubricated closed dies.
The selection of a material model is extremely important in a simulation. To
model materials in ANSYS® or ANSYS/LS–DYNA®, it is necessary to initially
understand the characteristics of the material. In dynamic analysis, the strain rate
dependency of a material plays a rather significant role in the behaviour of the
structure. Therefore, to achieve result accuracy, a material model has to be defined
which would account for this aspect of material physics.
ANSYS/LS–DYNA® offers a number of pre–defined rate dependent material
models that are more or less similar in their physical behaviour, while their major
differences is the solution methods and the input options of the model. Since its 1998
edition, LS–DYNA® offers a strain rate dependent multi–linear elastic–plastic
material model called MAT_MODIFIED_PIECEWISE_LINEAR_PLASTICITY,
which was specifically added for modelling the failure of aluminium material. This
model takes multi–linear elastic–plastic material properties such as stress–strain
curves in addition to taking the strain rate dependency of a material into
consideration.
As opposed to that of its unmodified counterpart, this model offers enhanced
failure criteria (ANSYS/LS– YNA® U ’ G . , ). T
such improved failure criteria in the formulation of the material model allows for the
structural elements to collapse beyond their point of ultimate plastic strength. With

4. Theoretical Consideration
65
this option, the entire structure should demonstrate a more realistic behaviour. In this
case, failure is based on effective plastic strain.
The Modified Piecewise Linear Plastic material was found to be most
appropriate to represent the CP aluminium for the purpose of the test simulations.
The material properties provided in Chapter 3 were implemented in the material
model to represent the true characteristics of the aluminium alloys utilised.
4.3.3. Mesh Generation
The egg–box structure was modelled using the ANSYS/LS–DYNA® shell
elements Shell163. This element is designed for dynamic simulations, therefore it has
12 degrees of freedom, translations, accelerations, and velocities in x, y and z
directions and rotations about the nodal x, y and z axes, at each node. More thorough
description of the properties of Shell163 can be accessed in ANSYS/LS–DYNA®
Us ’ G ).
The default Belytschko–Tsay method, which is recommended for most
applications, was chosen as the element formulation. This method is known to be of
high–speed in solving for elements since it uses reduced integration. However, in this
study, three integration points were selected at all times for further accuracy of the
results. The element was checked and approved for compatibility with the material
model used.
Selective, yet continuous, mesh densities were used in different parts of the cell
in order to take into consideration the miniature curves of the peak and base surfaces
as well as the surface of transition from peak/base to walls, while maintaining a
sensibly short solution time. The egg–box cell was divided into approximately 3900
shell elements and around 4000 nodes.
4.3.4. Boundary Conditions
In order to accurately model the symmetrical continuity of the cell in the egg–
box panel, it is necessary to define appropriate boundary conditions. To prevent the

4. Theoretical Consideration
66
in–plane lateral expansion of the egg–box finite element model, as done in the
experimental tests where the entire panel was involved, all the edge nodes of the
single cell had to be restrained from translational movement in the horizontal
directions as well as all rotational movements about the nodal axes. Also based on
the practical test environment, it was assumed in all simulations that the egg–box
panel was resting on a solid surface, with negligible horizontal movement. Hence, a
solid surface was defined, positioned directly beneath the egg–box cell. The surface
was limited to having no lateral or rotational movement, i.e. fully fixed in all
directions.
The impactor surface was modelled in the form of another solid surface with the
weight and physical properties of the drop mass. The only load set to be directly
applied on the egg–box cell was its own gravitational weight.
To introduce the concept of structural solidity between objects represented, it
was set for the entire model to have structural contact properties applied on all the
outer surfaces both within one body and when in contact with other parts. The
ANSYS/LS–DYNA® Surface to Surface and Automatic Single Surface contacts
were used for this purpose. Properties such as static and dynamic friction coefficients
and birth and death time of the contact were also introduced to the software based on
the experimental test conditions, to ensure further accuracy.
The impact test simulations were categorised into three groups based on the
level of lateral constraints applied to the system; a single cell with no lateral
restrictions on its edges, a single cell situated amongst neighbouring cells and a cell
representing any cell in-situ in the panel. The first model was simulated to
characterise the flat and oblique impacts of the free-edged single cell. The second
model corresponded to flat and oblique impact experiments conducted on one cone
within the panel, while the flat impacts of the entire egg-box panel was simulated
with the last cell model.
In the flat impact experiments of the entire egg–box panels, the samples were
enclosed in a box, with a cross sectional area 1.4 times the surface of the drop mass
to ensure enough number of cells are subjected to impact to replicate the continuous
structure of an egg-box panel. This positioning restricted the egg–box panel from all

4. Theoretical Consideration
67
lateral movements. Hence, in order to reproduce the boundary conditions applied to
the egg–box panel and to allow for the continuity of its cells, all the edge nodes of
the simulated model were restrained from any lateral movement in the horizontal
direction. Similar to the previous models, the cell was modelled to be resting on a
solid and rigid surface, to be crushed from above by the impacting surface
representing the drop weight.
The drop masses were modelled with identical cross-sectional dimensions and
physical properties as those used in the experimental work. The weight of the flat
panel impactor was adjusted to represent the share of a single cell from this mass. In
all cases the surface was limited to travel in the vertical direction only. The effect of
gravity was introduced to the impacting surfaces as an acceleration of 9810mm/s2
applied on the nodes.
Once all the influential factors are taken into consideration, the egg–box cell
model can undergo the dynamic analysis. Figure 4.2 shows a geometrical sketch of
the egg–box cell resting on a solid surface with the impactor positioned above it.
Figure 4.2 – Egg–box Cell Impact Simulation
4.4. Verification and Critical Analysis of the Results
Figure 4.3 to 4.10 show the force-displacement curves of the LS–DYNA® finite
element analysis for the dynamic impact of egg–box cells. The resultant curves are
compared to the outcomes of the experimental tests.
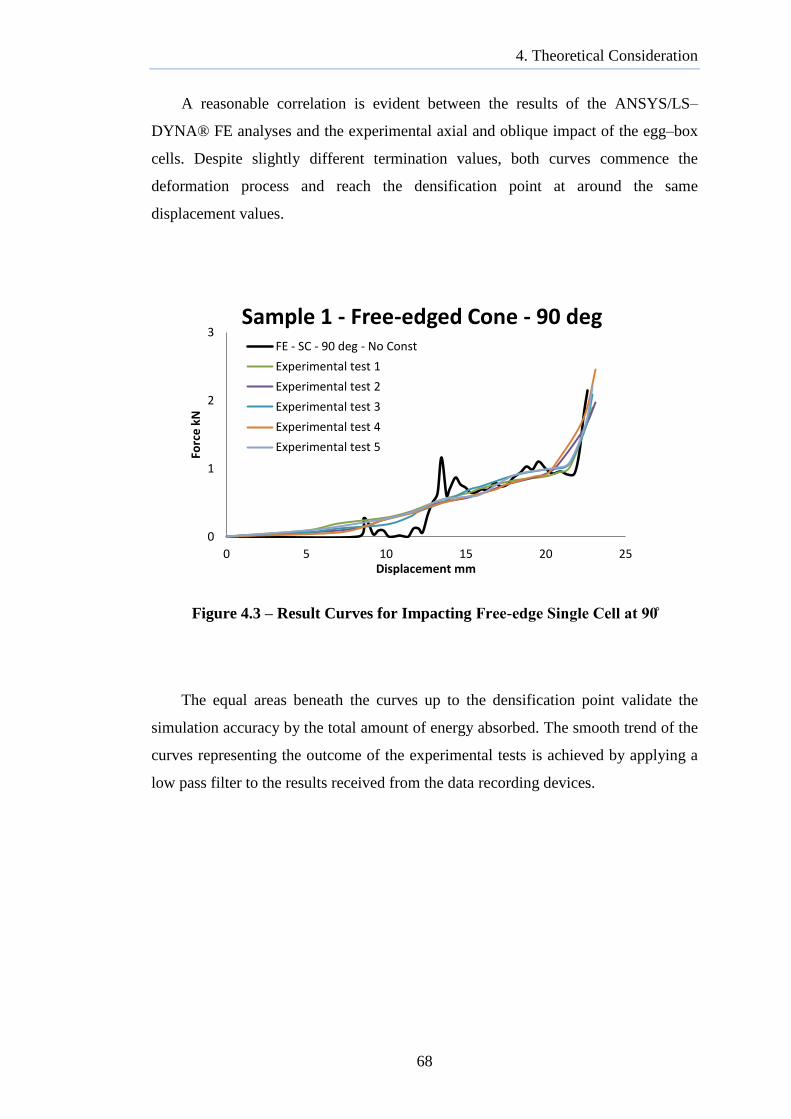
4. Theoretical Consideration
68
A reasonable correlation is evident between the results of the ANSYS/LS–
DYNA® FE analyses and the experimental axial and oblique impact of the egg–box
cells. Despite slightly different termination values, both curves commence the
deformation process and reach the densification point at around the same
displacement values.
Figure 4.3 – Result Curves for Impacting -
The equal areas beneath the curves up to the densification point validate the
simulation accuracy by the total amount of energy absorbed. The smooth trend of the
curves representing the outcome of the experimental tests is achieved by applying a
low pass filter to the results received from the data recording devices.
0
1
2
3
0 5 10 15 20 25
Forc
e k
N
Displacement mm
Sample 1 - Free-edged Cone - 90 deg FE - SC - 90 deg - No Const
Experimental test 1
Experimental test 2
Experimental test 3
Experimental test 4
Experimental test 5

4. Theoretical Consideration
69
– -
–
0
0.1
0.2
0.3
0 1 2 3 4
Forc
e k
N
Displacement mm
Sample 1 - Free-edged Cone - 45 deg FE - SC - 45 deg - No Const
Experimental test 1
Experimental test 2
Experimental test 3
Experimental test 4
Experimental test 5
0
0.4
0.8
1.2
0 5 10 15 20 25
Forc
e k
N
Displacement mm
Sample 1 - Single Cone - 90 deg FE - Sample 1 - SC - 90 Experimental test 1 Experimental test 2 Experimental test 3 Experimental test 4 Experimental test 5

4. Theoretical Consideration
70
Figure 4.6 – Result Curves for Impacting Single Cone of Sample 2
Figure 4.7 –
0
0.5
1
1.5
2
0 2 4 6 8 10 12 14
Forc
e k
N
Displacement mm
Sample 2 - Single Cone - 90 deg
FE - Sample 2 - SC - 90 Experimental test 1 Experimental test 2 Experimental test 3 Experimental test 4 Experimental test 5
0
0.2
0.4
0.6
0 5 10 15 20
Forc
e k
N
Displacement mm
Sample 1 - Single Cone - 45 deg FE - Sample 1 - SC - 45 deg
Experimental test 1
Experimental test 2
Experimental test 3
Experimental test 4
Experimental test 5

4. Theoretical Consideration
71
–
Figure 4.9 – Result Curves for Dynamic Im
0
0.2
0.4
0.6
0.8
0 2 4 6 8 10
Forc
e k
N
Displacement mm
Sample 2 - Single Cone - 45 deg FE - Sample 2 - SC - 45 deg Experimental test 1 Experimental test 2 Experimental test 3 Experimental test 4 Experimental test 5
0
4
8
12
16
0 5 10 15 20
Forc
e K
N
Displacement mm
Sample 1 - Flat Impact on Panel FE - Sample 1 - 90 deg Experimental test 1 Experimental test 2 Experimental test 3 Experimental test 4 Experimental test 5

4. Theoretical Consideration
72
–
Fig. 4.11 shows the different stages of deformation for the axial impact of the
entire panel, in association with the load-deformation curve. The structure has been
circled in the image where a major transformation is in occurrence.
It can be deduced from the finite element curves of Figures 4.3 to 4.10 that the
simulation specifications implemented in ANSYS/LS–DYNA® are rationally
accurate. In the upcoming chapter the validated settings and constructed models will
be used to perform dynamic impact analyses on egg–box structures of various
geometries towards achieving the main research objective of developing purpose–
specific optimised egg–box structures.
0
4
8
12
16
20
0 2 4 6 8 10
Forc
e k
N
Displacement mm
Sample 2 - Flat Impact on Panel FE - Sample 2 - 45 deg
Experimental test 1
Experimental test 2
Experimental test 3
Experimental test 4
Experimental test 5

4. Theoretical Consideration
73
Figure 4.11 – Progression of the Deformation Procedure for Flat Impact

5. Analysis of Modified Egg–box
74
5. ANALYSIS AND OPTIMISATION
OF MODIFIED EGG-BOX
5.1. Introduction
In this chapter, the constraints in the path towards the optimisation of egg–box
structures have been discussed and the finite element model developed and validated
in Chapter 4 has been employed en route for finding egg–box geometries that
respond satisfactorily to the requirements of an optimal structure. The effects of
geometrical variations on the performance of this energy absorber are explored based
on the outcomes of the finite element analysis of the axial impact of the structure.
Subsequently, a sandwich structure with optimum characteristics has been proposed
in accordance to the analyses data which displays structurally desirable
characteristics in comparison with its single panel counterparts. The enhanced
performance of the proposed sandwich structure has been confirmed by the use of
analytical approaches.
5.2. Geometrical Alterations
Various parameters, as detailed in the Introduction Chapter, can participate in
the optimisation of structures such as egg–box energy absorbers. Systematic
alteration of these factors will result in a set of design combinations which can
consequently be compared in correspondence to one or more objectives, to establish
an optimised model.

5. Analysis of Modified Egg–box
75
Table 5.1 – Egg–box Cell Dimension Data for Geometrical Optimisation
This table is in correspondence to the dimensional parameters of Figure 1.3.
The main blocks of the table represent the value of cone height, (h) in mm for each combination. The actual height of each cell (H) would
be twice this number.
All combinations are designed to R = 50mm and r = 2mm.
Cross hatched blocks indicate designs that are geometrically invalid or practically flat.
The cell height decreases with an increase in the apical angle as well as an increase in the diameter.
In each angle division, the height is greater with greater inter–peak distances.
The cell height remains unchanged with the changes in the thickness.

5. Analysis of Modified Egg–box
76
The approach, used in this study, to achieve optimised outcomes is mainly
based on Table 5.1. This table is categorised in terms of five geometrical variables,
angle (ω) in degrees, thickness (t) in mm, inter–peak distance (p) and top diameter
(d) both also in mm, and, as the result of their combination, cone height (h) in mm. It
is assumed here, as a complexity reduction factor, that parameters (R in mm), base
and peak curvature radius, and (r in mm), wall to top transition radius, remain
constant for all combinations, since, in practice, their range of variance is relatively
insignificant.
The series of values assigned to each parameter cover a reasonably wide range
of possible inputs in consistence with the geometrical measurements currently in use
in the industry. Various other inputs can be positioned among these arrays, which can
go through a systemised procedure as required, for modelling and optimisation.
5.3. Simulation Configurations
All geometries of Table 5.1 have been modelled and simulated to be impacted
by a loading mass of 5500g at a speed of 6m/s similar to the experimental tests
conducted as a part of this project. As with the finite element model developed in
Chapter 4, in the simulations presented in this section, cells are restrained to have no
lateral movements to resemble a complete egg–box panel. A solid surface placed
below the cells acts as the base of the test machine where the egg–box would be
resting in a practical experiment.
The average value of the total force , applied by the impactor on the
egg–box panels in the following impact tests can be calculated as,
5.1
where, ( is he mass of the impactor and ( is the crush acceleration which
can be expanded in definition by which is the impact velocity, divided by the
5. Analysis of Modified Egg–box
77
time of the crush . The latter value is taken as an average between all the
models tested. Hence, implementing the relevant numbers in equation 5.1, the force
value also becomes an average quantity and is equal to,
.
As a measure of accuracy of a simulation, it can be checked that the average
value of the impact load absorbed by the structure is reasonably less than and in
agreement to the value of . Therefore, in the following impact simulations, the
average value of the load–deformation curve on the load axis should be more or less
around 3.3kN.
In order for the comparative analysis to be pragmatic, it was ensured for all FE
tests to be based on identical factors in every area with the only discrepancy being
the geometrical features of the egg–box cell model. After the solution phase, the
Force vs. Displacement curve for each FE run is derived and used as the measure of
behaviour assessment.
5.4. Systemised Assessment
To organise the large number of combinations of Table 5.1, an initial
assessment is made amongst models sharing similar angles, thicknesses and inter–
peak distances. This was achieved through evaluating models of different top/base
diameters, which otherwise belong to the same category, against one another to
generate the best diameter selection.
As explained previously, the evaluations presented herein seek two qualities in
an improved model; maximised impact energy absorption and minimised impact
peak load. The outcome curves of the combinations given in Table 5.1 are presented
in the following sections along with the explanation of their characteristics.

5. Analysis of Modified Egg–box
78
5.4.1. Geometrical Variations at ω
The force–displacement curves of egg–box geometries with vertical angles of
at peak to peak distances of 20, 45 and 60mm and 0.8, 1.0 and 1.2mm wall
thicknesses are comparatively reviewed in the upcoming figures. Finite element
models of the egg-box cells belonging to this group of geometries are shown in
Figures 5.1, 5.5 and 5.9 for different diameter, (d) values. The shell elements can
take the three thicknesses as per relevant case. Figures 5.1, 5.5 and 5.9 are
individually associated with the curves following them. The cells illustrated in the
same image vary in peak/base diameter. Each cell represents three models with
different thicknesses while the apical angle and the inter-peak distance remain
constant in all cells shown in the same figure. It is important to note that, with
appropriate boundary conditions introduced to the models, each cell shown here
represents an entire egg-box cell with a cross-sectional dimension of 300×300 mm2.
Figure 5.1 – FE Models of ω= , p=20mm, t=0.8, 1, 1.2mm
for d=5, 10, 15mm
Evaluation is based on the increase or decrease in the peak/trench diameter in
different geometries. The value of the diameter varies between 5mm to 50mm
depending on the inter–peak distance of a particular model. It would not be
geometrically practical for the (d) value to be larger than the (p) defined per model.
Hence, as can be observed in the figures presented below, where curves are
associated with a geometrical group of p=20mm, the value of (d) only rises up to
15mm, while with larger (p) values, such as 60mm, the top/base diameter can be
increased to as large as 50mm.

5. Analysis of Modified Egg–box
79
Figure 5.2 – Force vs. Displacement Curves of FE Simulations
for ω , t=0.8mm, p=20mm and d=5, 10, 15mm
Figure 5.3 – Force vs. Displacement Curves of FE Simulation
for ω , t=1mm, p=20mm and d=5, 10, 15mm
Figure 5.4 – Force vs. Displacement Curves of FE Simulation
for ω , t=1.2mm, p=20mm and d=5, 10, 15mm
0
1
2
3
4
5
6
0 10 20 30 40 50
Forc
e K
N
Displacement mm
Diameter Comparison @ 15deg - t0.8 - p20
15deg-t8-d5-p20 15deg-t8-d10-p20 15deg-t8-d15-p20
0
2
4
6
8
10
12
0 10 20 30 40 50
Forc
e K
N
Displacement mm
Diameter Comparison @ 15deg - t1 - p20
15deg-t1-d5-p20 15deg-t1-d10-p20 15deg-t1-d15-p20
0
5
10
15
0 10 20 30 40 50
Forc
e K
N
Displacement mm
Diameter Comparison @ 15deg - t1.2 - p20
15deg-t12-d5-p20 15deg-t12-d10-p20 15deg-t12-d15-p20

5. Analysis of Modified Egg–box
80
Figure 5.5 – FE Models of ω , p=45mm, t=0.8, 1, 1.2mm
for d=5, 10, 15, 20, 30, 40mm
Figure 5.6 – Force vs. Displacement Curves of FE Simulations
for ω , t=0.8mm, p=45mm and d=5, 10, 15, 20, 30, 40mm
Figure 5.7 – Force vs. Displacement Curves of FE Simulations
for ω , t=1mm, p=45mm and d=5, 10, 15, 20, 30, 40mm
0
1
2
3
4
5
0 20 40 60 80 100
Forc
e K
N
Displacement mm
Diameter Comparison @ 15deg - t0.8 - p45
15deg-t8-d5-p45 15deg-t8-d10-p45 15deg-t8-d15-p45 15deg-t8-d20-p45 15deg-t8-d30-p45 15deg-t8-d40-p45
0
1
2
3
4
5
6
0 20 40 60 80 100
Forc
e K
N
Displacement mm
Diameter Comparison @ 15deg - t1 - p45
15deg-t1-d5-p45 15deg-t1-d10-p45 15deg-t1-d15-p45 15deg-t1-d20-p45 15deg-t1-d30-p45 15deg-t1-d40-p45

5. Analysis of Modified Egg–box
81
Figure 5.8 – Force vs. Displacement Curves of FE Simulations
for ω , t=1.2mm, p=45mm and d=5, 10, 15, 20, 30,40mm
Figure 5.9 – FE Models of ω , p=60mm, t=0.8, 1, 1.2mm
for d=5, 10, 15, 20, 30, 40, 50mm
Figure 5.10 – Force vs. Displacement Curves of FE Simulations
for ω , t=0.8mm, p=60mm and d=5, 10, 15, 20, 30, 40, 50mm
0 1 2 3 4 5 6 7 8
0 20 40 60 80 100
Forc
e K
N
Displacement mm
Diameter Comparison @ 15deg - t1.2 - p45
15deg-t12-d5-p45
15deg-t12-d10-p45
15deg-t12-d15-p45
15deg-t12-d20-p45
15deg-t12-d30-p45
15deg-t12-d40-p45
0
1
2
3
4
5
0 20 40 60 80 100 120
Forc
e K
N
Displacement mm
Diameter Comparison @ 15deg - t0.8 - p60 15deg-t8-d5-p60
15deg-t8-d10-p60 15deg-t8-d15-p60 15deg-t8-d20-p60 15deg-t8-d30-p60 15deg-t8-d40-p60 15deg-t8-d50-p60

5. Analysis of Modified Egg–box
82
Figure 5.11 – Force vs. Displacement Curves of FE Simulations
for ω , t=1mm, p=60mm and d=5, 10, 15, 20, 30, 40, 50mm
Figure 5.12 – Force vs. Displacement Curves of FE Simulations
for ω , t=1.2mm, p=60mm and d=5, 10, 15, 20, 30, 40, 50mm
Figures 5.2, 5.3, 5.4, 5.6, 5.7, 5.8, 5.10, 5.11 and 5.12 represent the force–
displacement curves associated with the geometrical combinations of Table 5.1 that
are categorised under (ω) of 15°. The increase in the peak to peak distance indicates
wider cells hence egg–box panels with smaller cell densities. This means that in the
same cross sectional area, a panel of p=20mm has more egg–box cells than a panel of
p=60mm.
In accordance to the general characteristics mentioned in the previous section,
it is evident from the curves of Figures 5.2 to 5.6 that with the increase of the inter–
peak distance (p), the peak strength of the panel rises. This is a direct result of the
greater cell density in the specimens with smaller (p) values. At the presence of more
cells to initiate the deformation process, a larger amount of the impact shock is
absorbed and vice versa.
0
1
2
3
4
5
6
0 20 40 60 80 100 120
Forc
e K
N
Displacement mm
Diameter Comparison @ 15deg - t1 - p60
15deg-t1-d5-p60 15deg-t1-d10-p60 15deg-t1-d15-p60 15deg-t1-d20-p60 15deg-t1-d30-p60 15deg-t1-d40-p60 15deg-t1-d50-p60
0 1 2 3 4 5 6 7 8
0 20 40 60 80 100 120
Forc
e K
N
Displacement mm
Diameter Comparison @ 15deg - t1.2 - p60 15deg-t12-d5-p60
15deg-t12-d10-p60 15deg-t12-d15-p60 15deg-t12-d20-p60 15deg-t12-d30-p60 15deg-t12-d40-p60 15deg-t12-d50-p60
5. Analysis of Modified Egg–box
83
From the effect of changes in the thickness factor and the inter–peak distance, it
can be concluded that the egg–box panels of ω=15° with high cell densities and thin
structure walls offer minimised initial load peak; hence, perform as efficient primary
cushions against sudden impact to the bodies that are being protected.
It can also be deduced from the curves of Figures 5.2–5.4, 5.6–5.8 and 5.10–
5.12 that the mean strength in geometries of similar diameter and thickness which
disagree in (p), remains, reasonably, constant. Consequent to this consistency, it can
be seen in the ω=15° curves that longer falls occur, following the sudden load peaks,
in specimen of increased peak to peak distances.
The difference in load level becomes more evident in Figures 5.4, 5.8 and 5.12
as the walls of the egg–box cell become thicker, while, for all thicknesses, higher
diameter models go through shorter falls. The exceptions to this pattern are
specimens of d=5mm, which, due to their small top/base diameter, deform similar to
cones. This effect is more evident in thicker models, since they show proximity to
solid top conical structures, with their small diameter and large thickness.
By taking the aforementioned comparison into account for egg–box panels of
ω=15°, it may be proposed that structures with relatively thinner walls and larger
top/base diameters, show more satisfactory performance and are better energy
absorbers in the primary stages of an impact.
5.4.2. Geometrical Variations at ω
The FE simulation images and force–displacement curves associated with egg–
box geometries of vertical angle ω= have been presented in Figures 5.13 to 5.24
and the curves have been compared among various diameters at 20, 45 and 60mm
inter–peak distances and wall thicknesses of 0.8, 1.0 and 1.2mm.
In general, the characteristics observed with the previous category of egg–box
structures also apply to this group. However, attributes specific to the models with
(ω) will be discussed following the presentation of the force–displacement
curves.

5. Analysis of Modified Egg–box
84
Similar rules regarding changes in top/base diameter, and their relationship
with the inter–peak value, as explained in the previous section apply here and
henceforth.
Figure 5.13 – FE Models of ω , p=20mm, t=0.8, 1, 1.2mm
for d=5, 10, 15mm
Figure 5.14 – Force vs. Displacement Curves of FE Simulations
for ω , t=0.8mm, p=20mm and d=5, 10, 15mm
Figure 5.15 – Force vs. Displacement Curves of FE Simulation
for ω= , t=1mm, p=20mm and d=5, 10, 15mm
0
2
4
6
0 5 10 15 20 25 30
Forc
e K
N
Displacement mm
Diameter Comparison @ 30deg - t0.8 - p20
30deg-t8-d5-p20 30deg-t8-d10-p20 30deg-t8-d15-p20
0
2
4
6
0 5 10 15 20 25
Forc
e K
N
Displacement mm
Diameter Comparison @ 30deg - t1 - p20
30deg-t1-d5-p20
30deg-t1-d10-p20
30deg-t1-d15-p20
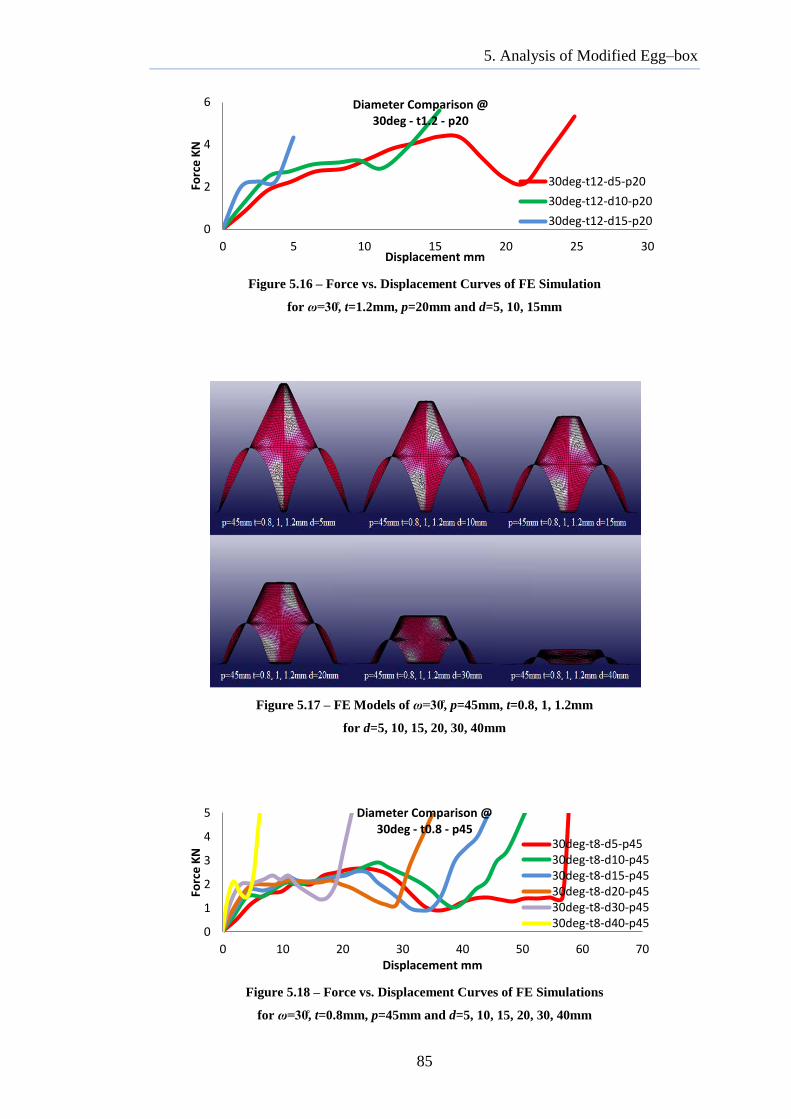
5. Analysis of Modified Egg–box
85
Figure 5.16 – Force vs. Displacement Curves of FE Simulation
for ω , t=1.2mm, p=20mm and d=5, 10, 15mm
Figure 5.17 – FE Models of ω , p=45mm, t=0.8, 1, 1.2mm
for d=5, 10, 15, 20, 30, 40mm
Figure 5.18 – Force vs. Displacement Curves of FE Simulations
for ω , t=0.8mm, p=45mm and d=5, 10, 15, 20, 30, 40mm
0
2
4
6
0 5 10 15 20 25 30
Forc
e K
N
Displacement mm
Diameter Comparison @ 30deg - t1.2 - p20
30deg-t12-d5-p20
30deg-t12-d10-p20
30deg-t12-d15-p20
0
1
2
3
4
5
0 10 20 30 40 50 60 70
Forc
e K
N
Displacement mm
Diameter Comparison @ 30deg - t0.8 - p45
30deg-t8-d5-p45 30deg-t8-d10-p45 30deg-t8-d15-p45 30deg-t8-d20-p45 30deg-t8-d30-p45 30deg-t8-d40-p45
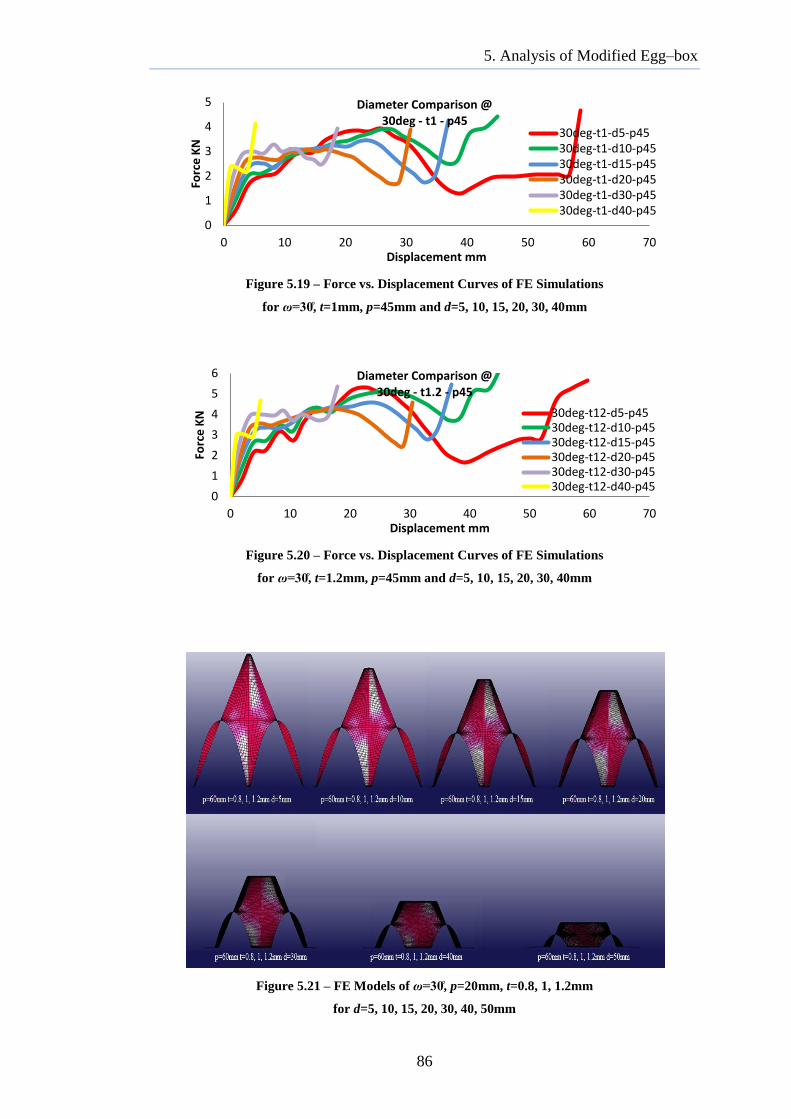
5. Analysis of Modified Egg–box
86
Figure 5.19 – Force vs. Displacement Curves of FE Simulations
for ω , t=1mm, p=45mm and d=5, 10, 15, 20, 30, 40mm
Figure 5.20 – Force vs. Displacement Curves of FE Simulations
for ω , t=1.2mm, p=45mm and d=5, 10, 15, 20, 30, 40mm
Figure 5.21 – FE Models of ω , p=20mm, t=0.8, 1, 1.2mm
for d=5, 10, 15, 20, 30, 40, 50mm
0
1
2
3
4
5
0 10 20 30 40 50 60 70
Forc
e K
N
Displacement mm
Diameter Comparison @ 30deg - t1 - p45
30deg-t1-d5-p45 30deg-t1-d10-p45 30deg-t1-d15-p45 30deg-t1-d20-p45 30deg-t1-d30-p45 30deg-t1-d40-p45
0
1
2
3
4
5
6
0 10 20 30 40 50 60 70
Forc
e K
N
Displacement mm
Diameter Comparison @ 30deg - t1.2 - p45
30deg-t12-d5-p45 30deg-t12-d10-p45 30deg-t12-d15-p45 30deg-t12-d20-p45 30deg-t12-d30-p45 30deg-t12-d40-p45

5. Analysis of Modified Egg–box
87
Figure 5.22 – Force vs. Displacement Curves of FE Simulations
for ω , t=0.8mm, p=60mm and d=5, 10, 15, 20, 30, 40, 50mm
Figure 5.23 – Force vs. Displacement Curves of FE Simulations
for ω , t=1mm, p=60mm and d=5, 10, 15, 20, 30, 40, 50mm
Figure 5.24 – Force vs. Displacement Curves of FE Simulations
for ω , t=1.2mm, p=60mm and d=5, 10, 15, 20, 30, 40, 50mm
As expected from the previous observations, progressing from Figures 5.14–
5.16 to Figures 5.18–5.20 and finally to Figures 5.22–5.24, it can be seen that an
increase in (p) results in a lengthier load–displacement plateau while it
0
1
2
3
4
5
0 20 40 60 80 100
Forc
e K
N
Displacement mm
Diameter Comparison @ 30deg - t0.8 - p60 30deg-t8-d5-p60
30deg-t8-d10-p60 30deg-t8-d15-p60 30deg-t8-d20-p60 30deg-t8-d30-p60 30deg-t8-d40-p60 30deg-t8-d50-p60
0
1
2
3
4
5
6
0 20 40 60 80 100
Forc
e K
N
Displacement mm
Diameter Comparison @ 30deg - t1 - p60 30deg-t1-d5-p60
30deg-t1-d10-p60 30deg-t1-d15-p60 30deg-t1-d20-p60 30deg-t1-d30-p60 30deg-t1-d40-p60 30deg-t1-d50-p60
0
1
2
3
4
5
6
7
0 10 20 30 40 50 60 70 80 90
Forc
e K
N
Displacement mm
Diameter Comparison @ 30deg - t1.2 - p60 30deg-t12-d5-p60
30deg-t12-d10-p60 30deg-t12-d15-p60 30deg-t12-d20-p60 30deg-t12-d30-p60 30deg-t12-d40-p60 30deg-t12-d50-p60
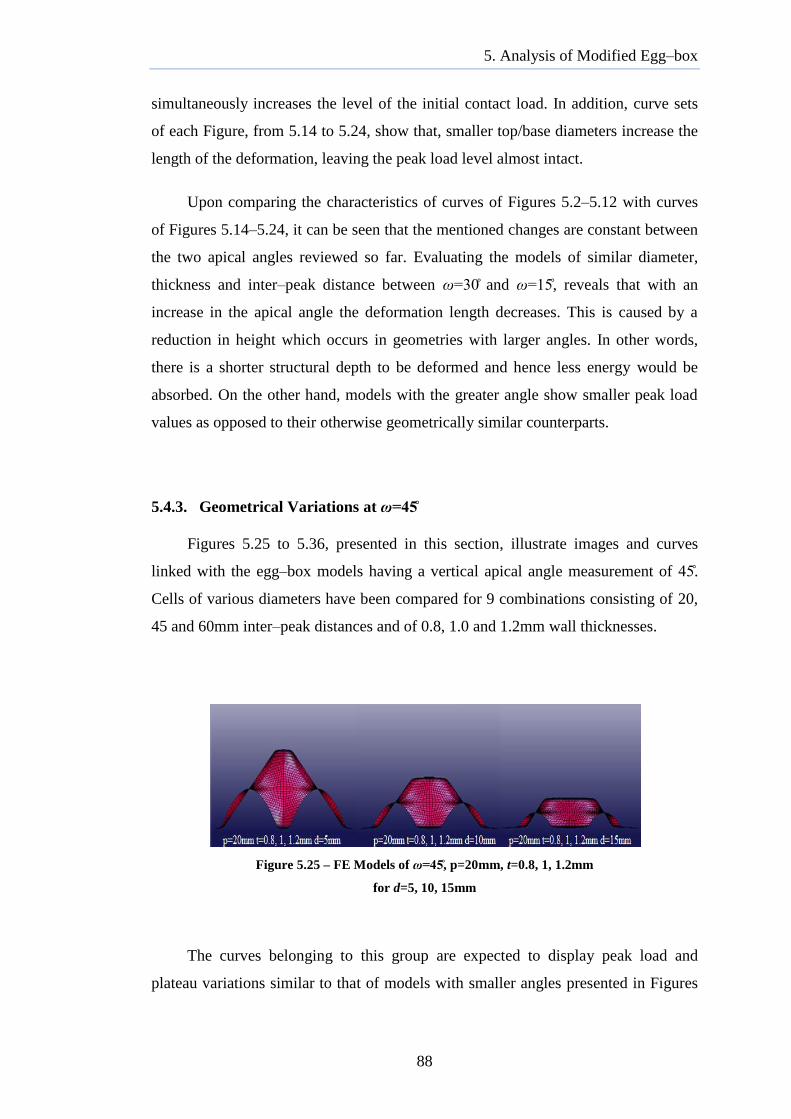
5. Analysis of Modified Egg–box
88
simultaneously increases the level of the initial contact load. In addition, curve sets
of each Figure, from 5.14 to 5.24, show that, smaller top/base diameters increase the
length of the deformation, leaving the peak load level almost intact.
Upon comparing the characteristics of curves of Figures 5.2–5.12 with curves
of Figures 5.14–5.24, it can be seen that the mentioned changes are constant between
the two apical angles reviewed so far. Evaluating the models of similar diameter,
thickness and inter–peak distance between ω and ω , reveals that with an
increase in the apical angle the deformation length decreases. This is caused by a
reduction in height which occurs in geometries with larger angles. In other words,
there is a shorter structural depth to be deformed and hence less energy would be
absorbed. On the other hand, models with the greater angle show smaller peak load
values as opposed to their otherwise geometrically similar counterparts.
5.4.3. Geometrical Variations at ω
Figures 5.25 to 5.36, presented in this section, illustrate images and curves
linked with the egg–box models having a vertical apical angle measurement of .
Cells of various diameters have been compared for 9 combinations consisting of 20,
45 and 60mm inter–peak distances and of 0.8, 1.0 and 1.2mm wall thicknesses.
Figure 5.25 – FE Models of ω , p=20mm, t=0.8, 1, 1.2mm
for d=5, 10, 15mm
The curves belonging to this group are expected to display peak load and
plateau variations similar to that of models with smaller angles presented in Figures

5. Analysis of Modified Egg–box
89
5.2 to 5.24. The performance of these models will be compared to the previous
combinations following Figure 5.36.
Figure 5.26 – Force vs. Displacement Curves of FE Simulations
for ω , t=0.8mm, p=20mm and d=5, 10, 15mm
Figure 5.27 – Force vs. Displacement Curves of FE Simulation
for ω , t=1mm, p=20mm and d=5, 10, 15mm
Figure 5.28 – Force vs. Displacement Curves of FE Simulation
for ω , t=1.2mm, p=20mm and d=5, 10, 15mm
0
1
2
3
0 2 4 6 8 10 12 14 16
Forc
e K
N
Displacement mm
Diameter Comparison @ 45deg - t0.8 - p20
45deg-t8-d5-p20 45deg-t8-d10-p20 45deg-t8-d15-p20
0
1
2
3
0 2 4 6 8 10 12 14 16
Forc
e K
N
Displacement mm
Diameter Comparison @ 45deg - t1 - p20
45deg-t1-d5-p20 45deg-t1-d10-p20 45deg-t1-d15-p20
0
1
2
3
4
0 2 4 6 8 10 12 14
Forc
e K
N
Displacement mm
Diameter Comparison @ 45deg - t1.2 - p20
45deg-t12-d5-p20
45deg-t12-d10-p20
45deg-t12-d15-p60
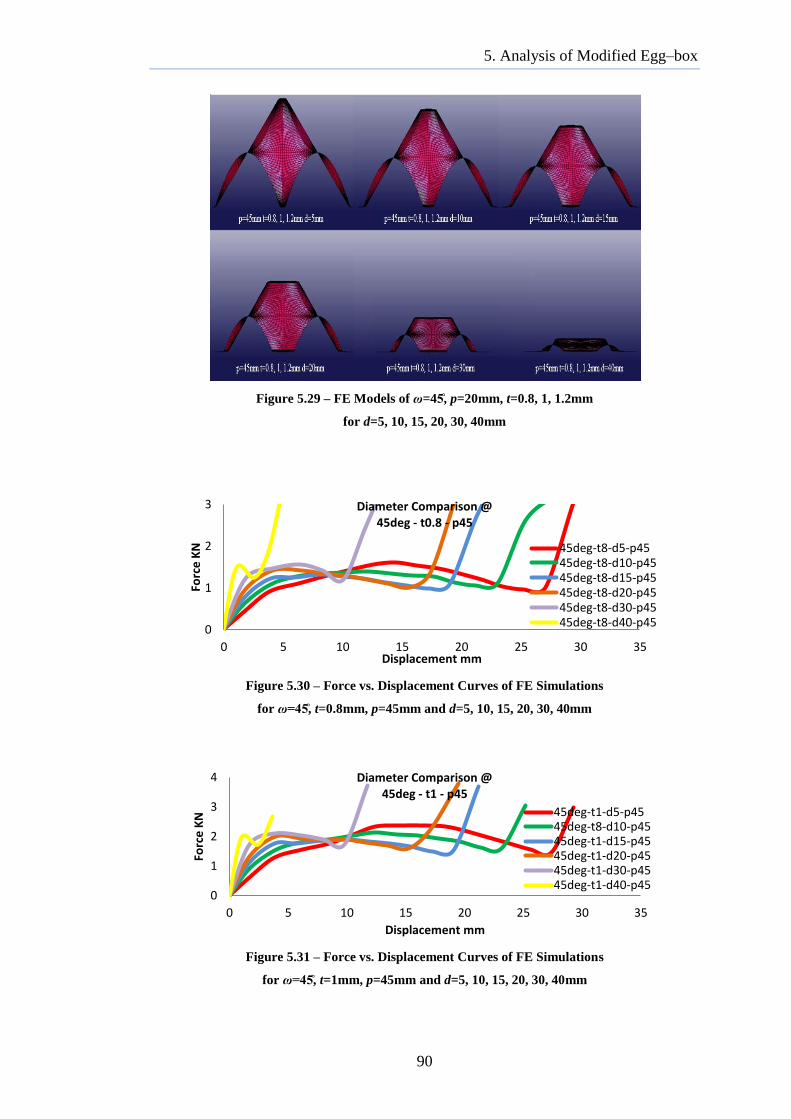
5. Analysis of Modified Egg–box
90
Figure 5.29 – FE Models of ω=4 , p=20mm, t=0.8, 1, 1.2mm
for d=5, 10, 15, 20, 30, 40mm
Figure 5.30 – Force vs. Displacement Curves of FE Simulations
for ω , t=0.8mm, p=45mm and d=5, 10, 15, 20, 30, 40mm
Figure 5.31 – Force vs. Displacement Curves of FE Simulations
for ω , t=1mm, p=45mm and d=5, 10, 15, 20, 30, 40mm
0
1
2
3
0 5 10 15 20 25 30 35
Forc
e K
N
Displacement mm
Diameter Comparison @ 45deg - t0.8 - p45
45deg-t8-d5-p45 45deg-t8-d10-p45 45deg-t8-d15-p45 45deg-t8-d20-p45 45deg-t8-d30-p45 45deg-t8-d40-p45
0
1
2
3
4
0 5 10 15 20 25 30 35
Forc
e K
N
Displacement mm
Diameter Comparison @ 45deg - t1 - p45
45deg-t1-d5-p45 45deg-t8-d10-p45 45deg-t1-d15-p45 45deg-t1-d20-p45 45deg-t1-d30-p45 45deg-t1-d40-p45

5. Analysis of Modified Egg–box
91
Figure 5.32 – Force vs. Displacement Curves of FE Simulations
for ω , t=1mm, p=45mm and d=5, 10, 15, 20, 30, 40mm
Figure 5.33 – FE Models of ω , p=20mm, t=0.8, 1, 1.2mm
for d=5, 10, 15, 20, 30, 40, 50mm
Figure 5.34 – Force vs. Displacement Curves of FE Simulations
for ω , t=0.8mm, p=60mm and d=5, 10, 15, 20, 30, 40, 50mm
0
1
2
3
4
5
0 5 10 15 20 25 30 35
Forc
e K
N
Displacement mm
Diameter Comparison @ 45deg - t1.2 - p45
45deg-t12-d5-p45 45deg-t12-d10-p45 45deg-t12-d15-p45 45deg-t12-d20-p45 45deg-t12-d30-p45 45deg-t12-d40-p45
0
1
2
3
0 10 20 30 40 50
Forc
e K
N
Displacement mm
Diameter Comparison @ 45deg - t0.8 - p60 45deg-t8-d5-p60
45deg-t8-d10-p60 45deg-t8-d15-p60 45deg-t8-d20-p60 45deg-t8-d30-p60 45deg-t8-d40-p60 45deg-t8-d50-p60

5. Analysis of Modified Egg–box
92
Figure 5.35 – Force vs. Displacement Curves of FE Simulations
for ω , t=1mm, p=60mm and d=5, 10, 15, 20, 30, 40, 50mm
Figure 5.36 – Force vs. Displacement Curves of FE Simulations
for ω=4 , t=1.2mm, p=60mm and d=5, 10, 15, 20, 30, 40, 50mm
It can be noted from the curves presented in Figures 5.26 to 5.36 that increasing
the peak to peak distance enhances the energy absorption capacity of the egg–box,
displayed by an increase in the length of the force–displacement plateau. As an
adverse effect, however, the peak load becomes elevated with this change in the peak
distance, practically increasing the initial damage to the protected body. Both effects
can be sensed from a review of Figures 5.28, 5.32 and 5.36 as an example.
The changes in the measurement of the diameter are diversely related to the
length of the plateau. An individual review of Figures 5.26 to 5.36 shows that with
larger diameters, shorter deformation lengths occur at approximately the same load
level. This is due to the reduction in the height of the cell.
A comparison between Figures 5.26–5.36 and models of ω (Figures 5.14–
5.24) and ω= (Figures 5.2–5.12) indicates that amongst models of similar
0
1
2
3
4
0 10 20 30 40 50
Forc
e K
N
Displacement mm
Diameter Comparison @ 45deg - t1 - p60 45deg-t1-d5-p60
45deg-t1-d10-p60 45deg-t1-d15-p60 45deg-t1-d20-p60 45deg-t1-d30-p60 45deg-t1-d40-p60 45deg-t1-d50-p60
0
1
2
3
4
0 10 20 30 40 50
Forc
e K
N
Displacement mm
Diameter Comparison @ 45deg - t1.2 - p60
45deg-t12-d5-p60 45deg-t12-d10-p60 45deg-t12-d15-p60 45deg-t12-d20-p60 45deg-t12-d30-p60 45deg-t12-d40-p60 45deg-t12-d50-p60

5. Analysis of Modified Egg–box
93
thickness, inter–peak distance and diameter, those with smaller angles, i.e. more
elevated height, show greater strength. The load–displacement curves of the stronger
models bend at higher load levels and reach their densification point at longer
displacement measures.
5.4.4. Geometrical Variations at ω
The next geometrical alteration according to Table 5.
. With the definition of the apical angle being the angle
between the walls of the structure and the vertical axis, an (ω) indicates a
flatter build as opposed to the previous models. It is, therefore, expected from this
group to have shorter deformation lengths due to their decreased heights.
Based on the force–displacement curves presented in Figures 5.38 to 5.48, an
assessment can be
apical angle. The curves are associated with
models having inter–peak measurements of 20, 45 and 60mm and ranging between
0.8, 1.0 and 1.2mm wall thicknesses. Figures 5.37, 5.53 and 5.57 show the finite
element models for the geometries under investigation.
Evaluating the curves of Figures 5.38 to 5.48 against the curves previously
introduced (Figures 5.2 to 5.36) gives an indication of the difference in behaviour of
ω models and models with smaller apical angles.
Figure 5.37 – FE Models of ω , p=20mm, t=0.8, 1, 1.2mm
for d=5, 10, 15mm

5. Analysis of Modified Egg–box
94
Figure 5.38 – Force vs. Displacement Curves of FE Simulations
for ω , t=0.8mm, p=20mm and d=5, 10, 15mm
Figure 5.39 – Force vs. Displacement Curves of FE Simulation
for ω t=1mm, p=20mm and d=5, 10, 15mm
Figure 5.40 – Force vs. Displacement Curves of FE Simulation
for ω , t=1.2mm, p=20mm and d=5, 10, 15mm
0
0.2
0.4
0.6
0.8
1
0 1 2 3 4 5 6 7
Forc
e K
N
Displacement mm
Diameter Comparison @ 60deg - t0.8 - p20
60deg-t8-d5-p20
60deg-t8-d10-p20
60deg-t8-d15-p20
0
0.2
0.4
0.6
0.8
1
0 1 2 3 4 5 6 7
Forc
e K
N
Displacement mm
Diameter Comparison @ 60deg - t1 - p20
60deg-t1-d5-p20 60deg-t1-d10-p20 60deg-t1-d15-p20
0
0.2
0.4
0.6
0.8
1
1.2
0 1 2 3 4 5 6 7
Forc
e K
N
Displacement mm
Diameter Comparison @ 60deg - t1.2 - p20
60deg-t12-d5-p20 60deg-t12-d10-p20 60deg-t12-d15-p20

5. Analysis of Modified Egg–box
95
Figure 5.41 – FE Models of ω , p=45mm, t=0.8, 1, 1.2mm
for d=5, 10, 15, 20, 30, 40mm
Figure 5.42 – Force vs. Displacement Curves of FE Simulations
for ω , t=0.8mm, p=45mm and d=5, 10, 15, 20, 30, 40mm
Figure 5.43 – Force vs. Displacement Curves of FE Simulations
for ω , t=1mm, p=45mm and d=5, 10, 15, 20, 30, 40mm
0
0.2
0.4
0.6
0.8
1
1.2
1.4
0 5 10 15 20
Forc
e K
N
Displacement mm
Diameter Comparison @ 60deg - t0.8 - p45
60deg-t8-d5-p45 60deg-t8-d10-p45 60deg-t8-d15-p45 60deg-t8-d20-p45 60deg-t8-d30-p45 60deg-t8-d40-p45
0
0.5
1
1.5
2
0 5 10 15 20
Forc
e K
N
Displacement mm
Diameter Comparison @ 60deg - t1 - p45
60degg-t1-d5-p45 60deg-t1-d10-p45 60deg-t1-d15-p60 60deg-t1-d20-p45 60deg-t1-d30-p45 60deg-t1-d40-p45

5. Analysis of Modified Egg–box
96
Figure 5.44 – Force vs. Displacement Curves of FE Simulations
for ω , t=1.2mm, p=45mm and d=5, 10, 15, 20, 30, 40mm
Figure 5.45 – FE Models of ω , p=60mm, t=0.8, 1, 1.2mm
for d=5, 10, 15, 20, 30, 40, 50mm
Figure 5.46 – Force vs. Displacement Curves of FE Simulations
for ω , t=0.8mm, p=60mm and d=5, 10, 15, 20, 30, 40, 50mm
0
1
2
3
0 5 10 15 20
Forc
e K
N
Displacement mm
Diameter Comparison @ 60deg - t1.2 - p45
60deg-t12-d5-p45 60deg-t12-d10-p45 60deg-t12-d15-p45 60deg-t12-d20-p45 60deg-t12-d30-p45 60deg-t12-d40-p45
0
0.5
1
1.5
0 5 10 15 20 25 30
Forc
e K
N
Displacement mm
Diameter Comparison @ 60deg - t0.8 - p60 60deg-t8-d5-p60
60deg-t8-d10-p60 60deg-t8-d15-p60 60deg-t8-d20-p60 60deg-t8-d30-p60 60deg-t8-d40-p60 60deg-t8-d50-p60

5. Analysis of Modified Egg–box
97
Figure 5.47 – Force vs. Displacement Curves of FE Simulations
for ω , t=1mm, p=45mm and d=5, 10, 15, 20, 30, 40, 50mm
Figure 5.48 – Force vs. Displacement Curves of FE Simulations
for ω , t=1.2mm, p=60mm and d=5, 10, 15, 20, 30, 40, 50mm
It can be seen from the curves of Figures 5.38 to 5.48 that the energy
absorption capacity of the cells becomes elevated in cells with more distant peaks
according to the curves above. However, the same alteration increases the damaging
effect of the initial impact. For example, in Figures 5.44 and 5.48 which give the
force–displacement response of cells with identical apical angle and wall thicknesses,
it can be viewed that the 5mm diameter geometry with 45mm inter–peak distance has
a shorter deformation length, almost 18mm, while the cell with the same diameter at
inter–peak distances of 60mm has a deformation length of around 23mm. The cell
with shorter inter–peak distance, Figure 5.44, has an initial peak load value of 1.3kN
in comparison to the geometry with longer peak to peak distance, Figure 5.48, which
shows an initial load value of more than 1.5kN.
An assessment of the diametrical alterations amongst models presented in
Figures 5.38 to 5.48 shows that as the top of a cell expands, its energy absorption
0
0.5
1
1.5
2
0 5 10 15 20 25 30
Forc
e K
N
Displacement mm
Diameter Comparison @ 60deg - t1 - p45
60deg-t1-d5-p60 60deg-t1-d10-p60 60deg-t1-d15-p60 60deg-t1-d20-p60 60deg-t1-d30-p60 60deg-t1-d40-p60 60deg-t1-d50-p60
0
1
2
3
0 5 10 15 20 25 30
Forc
e K
N
Displacement mm
Diameter Comparison @ 60deg - t1.2 - p60
60deg-t12-d5-p60 60deg-t12-d10-p60 60deg-t12-d15-p60 60deg-t12-d20-p60 60deg-t12-d30-p60 60deg-t12-d40-p60 60deg-t12-d50-p60

5. Analysis of Modified Egg–box
98
capacity decreases. In curve of Figure 5.39, for example, it can be seen that cells with
greater (d) values have shorter force–displacement lengths. The reason behind this
characteristic is the shorter cell height of the geometries with larger diameters in cells
of equal (ω), (p) and (t). In additions, it can be observed from Figure 5.39, that
changing the diameter has very minimal effect on the peak load value of the cells,
since the apical angle and the inter–peak distance remain constant between these
models.
A lower level of structural strength is exhibited in models of Figures 5.38 to
5.48 which have larger angles between the cell wall and the vertical line. Such
behaviour is resulted from the decrease in the height of models with larger (ω)
values. From the geometrical point of view, this can be justified by explaining that in
egg–box cells of equal inter–peak distances and peak/trench diameters, larger apical
angles mean shorter distances from centre to peak. Hence, models with ω abso
, apical angles presented in Figures 5.2–5.12,
5.14–5.24 and 5.26–5.36, respectively.
The peak load value also drops with larger angles which on the contrary to the
decrease in energy absorption, is a positive effect in the performance of an egg–box
structure. Therefore, geometries with larger apical angles are more desirable in the
initial stage of an impact.
5.4.5. Geometrical Variations at ω=7
In the process of evaluating the effect of the alterations of geometrical factors
on the performance of egg–box energy absorbers, the value of apical angle (ω) is
gradually increased to take a final . Further increasing this component
will result in cell models with practically flat geometrical shapes, considering the
wall thickness of the egg–box cell. The (h) values of Table 5.1 support this theory.
The curves included in Figures 5.50 to 5.60 are linked with models categorised
under ω . Cells of 20, 45 and 60mm inter–peak distances and 0.8, 1.0 and 1.2mm
wall thicknesses have been modelled for 5, 10, 15, 20, 30, 40 and 50mm top/base
diameters. The curves produced here are results of finite element simulations solved

5. Analysis of Modified Egg–box
99
for the axial impacting of all the defined geometrical combinations. Images
associated with the finite element models of this section are provided in Figures 5.49,
5.53 and 5.57 for p=20, 45 and 60mm, respectively.
The resultant curves of ω group, Figures 5.50 to 5.60, are compared with
the outcomes of the previous groups, Figures 5.2 to 5.48, to give an indication of the
difference in behaviour of egg–box cells with altered geometrical features.
Figure 5.49 – FE Models of ω=5 , p=20mm, t=0.8, 1, 1.2mm
for d=5, 10mm
Figure 5.50 – Force vs. Displacement Curves of FE Simulations
for ω=7 , t=0.8mm, p=20mm and d=5, 10mm
Figure 5.51 – Force vs. Displacement Curves of FE Simulation
0
0.04
0.08
0.12
0.16
0.2
0 1 2 3 4
Forc
e K
N
Displacement mm
Diameter Comparison @ 75deg - t0.8 - p20
75deg-t8-d5-p20
75deg-t8-d10-p20
0
0.04
0.08
0.12
0.16
0.2
0 1 2 3 4
Forc
e K
N
Displacement mm
Diameter Comparison @ 75deg - t1 - p20
75deg-t1-d5-p20
75deg-t1-d10-p20

5. Analysis of Modified Egg–box
100
for ω=7 , t=1mm, p=20mm and d=5, 10mm
Figure 5.52 – Force vs. Displacement Curves of FE Simulation
for ω , t=1.2mm, p=20mm and d=5, 10mm
Figure 5.53 – FE Models of ω , p=45mm, t=0.8, 1, 1.2mm
for d=5, 10, 15, 20, 30mm
Figure 5.54 – Force vs. Displacement Curves of FE Simulations
for ω , t=0.8mm, p=45mm and d=5, 10, 15, 20, 30mm
0
0.04
0.08
0.12
0.16
0.2
0 1 2 3 4
Forc
e K
N
Displacement mm
Diameter Comparison @ 75deg - t1.2 - p20
75deg-t12-d5-p20
75deg-t12-d10-p20
0
0.2
0.4
0.6
0.8
1
0 2 4 6 8 10
Forc
e K
N
Displacement mm
Diameter Comparison @ 75deg - t0.8 - p45
75deg-t8-d5-p45 75deg-t8-d10-p45 75deg-t8-d15-p45 75deg-t8-d20-p45 75deg-t8-d30-p45
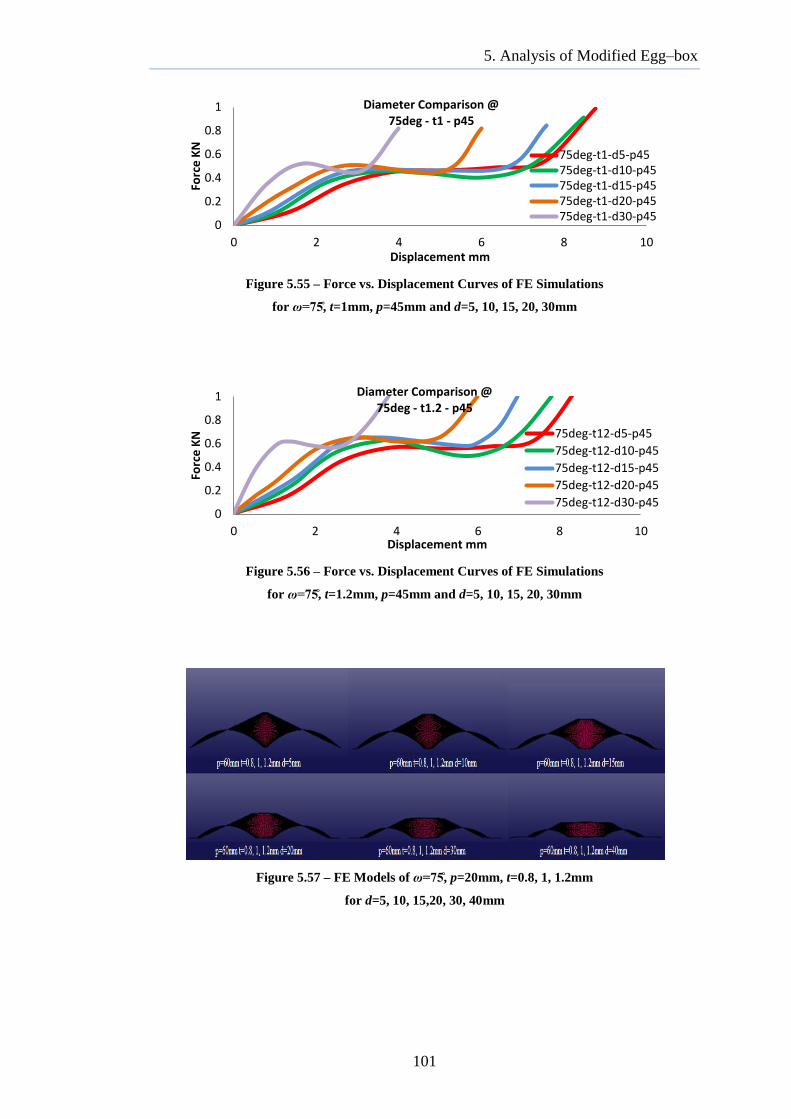
5. Analysis of Modified Egg–box
101
Figure 5.55 – Force vs. Displacement Curves of FE Simulations
for ω , t=1mm, p=45mm and d=5, 10, 15, 20, 30mm
Figure 5.56 – Force vs. Displacement Curves of FE Simulations
for ω , t=1.2mm, p=45mm and d=5, 10, 15, 20, 30mm
Figure 5.57 – FE Models of ω , p=20mm, t=0.8, 1, 1.2mm
for d=5, 10, 15,20, 30, 40mm
0
0.2
0.4
0.6
0.8
1
0 2 4 6 8 10
Forc
e K
N
Displacement mm
Diameter Comparison @ 75deg - t1 - p45
75deg-t1-d5-p45 75deg-t1-d10-p45 75deg-t1-d15-p45 75deg-t1-d20-p45 75deg-t1-d30-p45
0
0.2
0.4
0.6
0.8
1
0 2 4 6 8 10
Forc
e K
N
Displacement mm
Diameter Comparison @ 75deg - t1.2 - p45
75deg-t12-d5-p45
75deg-t12-d10-p45
75deg-t12-d15-p45
75deg-t12-d20-p45
75deg-t12-d30-p45

5. Analysis of Modified Egg–box
102
Figure 5.58 – Force vs. Displacement Curves of FE Simulations
for ω , t=0.8mm, p=60mm and d=5, 10, 15, 20, 30, 40mm
Figure 5.59 – Force vs. Displacement Curves of FE Simulations
for ω , t=1mm, p=60mm and d=5, 10, 15, 20, 30, 40mm
Figure 5.60 – Force vs. Displacement Curves of FE Simulations
for ω , t=1.2mm, p=60mm and d=5, 10, 15, 20, 30, 40mm
As previously explained, the large apical angle of this group of egg–box cells
results in shorter cell heights, hence, for each set of geometries categorised under the
0
0.2
0.4
0.6
0.8
1
0 2 4 6 8 10 12
Forc
e K
N
Displacement mm
Diameter Comparison @ 75deg - t0.8 - p60
75deg-t8-d5-p60
75deg-t8-d10-p60
75deg-t8-d15-p60
75deg-t8-d20-p60
75deg-t8-d30-p60
75deg-t8-d40-p60
0
0.2
0.4
0.6
0.8
1
0 2 4 6 8 10 12
Forc
e K
N
Displacement mm
Diameter Comparison @ 75deg - t1 - p60
75deg-t1-d5-p60 75deg-t1-d10-p60 75deg-t1-d15-p60 75deg-t1-d20-p60 75deg-t1-d30-p60 75deg-t1-d40-p60
0
0.2
0.4
0.6
0.8
1
1.2
0 2 4 6 8 10 12
Forc
e K
N
Displacement mm
Diameter Comparison @ 75deg - t1.2 - p60
75deg-t12-d5-p60 75deg-t12-d10-p60 75deg-t12-d15-p60 75deg-t12-d20-p60 75deg-t12-d30-p60 75deg-t12-d40-p60

5. Analysis of Modified Egg–box
103
same (p) value, the top/base diameter factor is reduced to one less than the groups
with smaller apical angles. Cell heights shorter than 1mm are invalid since with the
largest thickness value of the egg–box walls being 1.2mm, a maximum of 0.6mm
thickness will be below the central line of the cell wall. For smaller heights, the panel
will act as a solid flat aluminium sheet with no significant energy absorption
characteristics.
According to curves of Figures 5.50 to 5.60, the change in the peak load value
for different thicknesses is very small in the current group due to their miniature
structural dimensions. For example the comparison of Figures 5.54, 5.55 and 5.56
shows that the initial peak value is changing between 0.4 to 0.6kN while the
deformation length remains the same.
A review of Figures 5.54 and 5.58 shows the direct effect of increasing the
inter–peak value on the deformation length and the direct but negative effect of this
increase on the initial peak load. It can also be seen in all figures that, as expected,
larger peak/trench diameters result in shorter deformation lengths, hence lower
energy absorption capacity.
An assessment of the final series of curves, presented in Figures 5.50 to 5.60,
indicates that all the characteristics displayed by the previous geometrical models are
being reflected in this group. It can, therefore, be proven that, regardless of the cell
dimensions, a unique path of geometrical alterations results in energy absorption
characteristics that can be predicted and evaluated.
5.5. Observation and Discussion of Results
Through a review of the curves presented in Figures 5.2 to 5.60, a series of
general attributes can be deduced. The values given in Table 5.2 represent the area
under the curves of the above figures which is equal to ETotal, the total amount of
energy absorbed by each structure during the impact. Through a comparative study
of the curves and their associated ETotal values, the effect of geometrical dimensions
on the energy absorption of the egg-box structure can be evaluated.

5. Analysis of Modified Egg–box
104
Table 5.2 – Estimated Area under the Curve Representing ETotal for Geometrically Varied Egg–box Structures

5. Analysis of Modified Egg–box
105
By translating a curve pattern into practical deformation behaviour, it can be
seen that a great peak load shows the presence of a high magnitude reaction force.
The effect of this load can primarily cause severe damage to the protected body,
followed by which the structure slides through a relatively smooth deformation
procedure, lengthier with greater (p) values. As mentioned previously, the length of
the deformation procedure of a structure has a direct relationship with its energy
absorption capacity.
The opposite relationship between the minimised peak load and maximised
deformation length can more clearly be seen through the curves of Figures 5.2 to
5.60. Hence, based on the specific requirements of a structure, a panel must be
selected with an appropriate level of each of these characteristics, bearing in mind
the level of required energy absorption capacity. This situation can be addressed
through a simple mathematical explanation.
It has so far been established that the total energy absorbed by a structure is
equal to the area below its force–displacement curve. If this area is approximated
with a rectangle, it becomes clear that, the longer each length of the shape, the
greater the area and hence the more energy absorbed. For example, in Figure 5.59,
the area beneath the curve of ω , t=1mm, d=10mm and p=60mm can be
approximated by a rectangle of 10mm length by 0.5kN width.
The height of the rectangle represents the initial load peak, which is meant to
be kept minimised for practical cushioning. Thus, based on their application,
structures with longer deformation curves of lower load magnitudes can be
preferable. Based on this theory, geometries with greater (p) values perform more
ideally. The curve of ω , t=1mm, d=10mm and p=45mm of Figure 5.55, absorbs
an approximate total energy equal to 3.1kN.mm, as calculated in Table 3.2,
compared to the 5kN.mm of the above example with a larger (p) value.
Per vertical angle (ω), the same characteristics apply amongst models of
different geometrical features. A further step toward optimisation would be the
comparison of desirable specimens amongst structures of different angles to clarify
the effect of the increase in the vertical angle (ω) of an egg–box cell.

5. Analysis of Modified Egg–box
106
In the light of a comprehensive examination of the result curves comes proof
that with more narrow apical angles, higher load peaks are displayed. The length of
the deformation grows in an opposite manner to this rule; shorter deformations
occurring with wider angles. This is in a sense expected, since as the heights of the
egg–box cells decrease and the epical angles become wider, the cell density of the
panels reduces.
From a review of the curves given in the figures above, a list of general
attributes applicable to all of the modelled egg–box geometries can be deduced;
In egg–boxes of small vertical angles, with the expansion of the
top/base diameters and, as its result, the reduction of cell height, the
deformation process of the egg–box becomes shorter.
The mean level of strength, for diametrically variant models, remains
constant.
With reference to equation 4.10, it can be seen that the total energy
absorbed by the structure increases with the increase in thickness.
Egg–box structures with thicker walls show greater strength, hence,
they initiate the deformation process at higher load peaks, which, as
previously discussed, can lead to more disastrous bio mechanical
injuries when used as human cushions.
5.6. Evaluation of the Effects of Geometrical Variations
From a critical observation of the curves of Figures 5.2 to 5.60, Table 5.3
presented below is derived, giving the effects of geometrical alterations on the
performance of the egg–box structure.
Where the arrows are pointing up in the modification row, an increase in the
value of the variable is indicated and vice versa. The next two rows show the effect
of such increase or decrease, on both parts of the force–displacement response of the

5. Analysis of Modified Egg–box
107
egg–box structure. For instance, with an increase in thickness the level of the peak
load rises while the length of the deformation curve remains unchanged.
Geometrical Factor t ω p D
Modification ↑ ↓ ↑ ↓ ↑ ↓ ↑ ↓
Deformation Length – – ↓ ↑ ↑ ↓ ↓ ↑
Peak Load ↑ ↓ ↓ ↑ ↑ ↓ – –
Table 5.3 – Effects of Geometrical Changes on Egg–box Performance
The material properties and physical boundaries are assumed to remain
constant in this comparison. Therefore, Table 5.3 can be used as a reference source
for predicting the general change in behaviour caused by dimensional modifications
of the egg–box structures subject to dynamic axial loading.
5.7. Optimised Egg–box Structure
An optimum egg–box structure is required to absorb maximum amount of
energy while its initial impact load remains at a reasonably low value. It is evident
from the result curves given in graphs of Figures 5.2 to 5.60 that these two
requirements have an inverse relationship. Therefore, to find the best egg–box
, ’ .
It has been established that geometries with smaller apical angles display
higher plateau lengths and egg–box structures with flat builds, i.e. larger (ω) values,
react less aggressively at the initiation of the impact.
Theoretically, it can be said that an egg–box cell which would satisfy both
conditions of a crashworthy structure has to have an apical angle of average value.
For example, the geometrical combination with ω , t=1.0mm, p=45mm and
d=5mm, displays a peak load of 2kN and a deformation length of 25mm. Compared

5. Analysis of Modified Egg–box
108
to the maximum peak load of 6kN in ω , t=1.2mm and p=60mm, the value of 2kN
is reasonably low, although it is still much higher than the 0.1kN initial impact load
of ω , t=0.8mm and p=20mm. The plateau length of 25mm, however, is rather
short in the example model in contrast to the 120mm of ω , t=0.8mm and
p=60mm, although it is greater than the 2.5mm deformation length of ω ,
t=1.2mm and p=20mm.
At a slightly higher peak value of 2.2kN, geometry of ω , t=0.8mm and
p=45mm shows a longer plateau length of 58mm. Hence, it could be a better choice
towards compromising for optimisation. The geometry has approximately a medium
sized apical angle, a thin structure and the expanded panel will have a reasonable cell
density. Since the peak load does not practically change with the variations in the
top/base diameter, and also because larger deformation lengths are displayed with
smaller diameter, the model with d=5mm is assumed to be the most rational option
among the available diameters.
Figure 5.61 – Force–Displacement Curve of
ω , t=0.8mm, p=45mm and d=5mm
Densification Point
0
1
2
3
4
5
0 10 20 30 40 50 60
Forc
e K
N
Displacement mm
30deg-t8-d5-p45
Horizontal Trendline

5. Analysis of Modified Egg–box
109
Despite the fact that the optimisation of energy absorbing structures is mainly
linked to the function for which they are designed, for the purpose of this study, it is
concluded that the egg–box cell of ω , t=0.8mm, p=45mm and d=5mm performs
in a comparatively enhanced manner as opposed to the other geometrical models
examined here. The associated curve of this cell model is shown in Figure 5.61.
It can be seen in Fig. 5.61 that the average value of force in the force–
displacement curve is approximately 1.5kN which complies with the outcome of
equation 5.1, where is required to be less than 3.3kN.
The maximum amount of energy absorbed by the optimised egg–box structure
is equal to the area beneath its force–displacement curve up to the densification
point, as explained mathematically in equation 4.10 of the thesis. To facilitate such
measurements, it would be practical to approximate the enclosed area by a rectangle
whose length would be equal to the deformation length in meters and its width would
be equal to the average force in kN.
The total energy absorbed by the egg–box panel of ω , t=0.8mm, p=45mm
and d=5mm, as shown in Table 5.2, would approximately be equal to
Etotal=105kN.mm. This figure will be proportionately compared against the total
energy absorption values of further geometries later in the current chapter following
the path of finding optimum structures.
5.8. Optimum Sandwich Structures
An option towards finding the egg–box structure with the highest energy
absorption capacity is the combination of two or more geometries in the form of
sandwich structures. A sandwich panel can have many forms; from as simple as the
addition of thin sheets on the top and base of an egg–box, to an arrangement of
several egg–box structures of similar or different geometries, positioned on top of
one another along the vertical axis. An egg–box sandwich panel sample is shown in
Figure 5.62.
It is obvious that more than one egg–box in a structure would mean more
energy absorption. However, as mentioned before, the strongest option is not always

5. Analysis of Modified Egg–box
110
the best and most practical. The rational requirements are for the force–displacement
curve to have a low load peak and a lengthy plateau. Therefore, any sandwich
combination should be studied to fit the needs of its specific application.
Figure 5.62 – Typical Aluminium Egg–box Sandwich Panel
As a result of a comparative review of Figures 5.2 to 5.60 provided in the
previous section, a list of most and least appropriate geometries in terms of both peak
load and plateau length is derived and presented in Table 5.4. This can be used to
create optimised sandwich panels, by the combination of the aluminium egg–boxes
simulated for the purpose of this study.
Aspect Level Force kN Length mm Geometry
Peak Load
Min 0.1 3 75deg – t0.8 – p20
Avg–low 1.5 35 45deg – t0.8 – p60 @ d5
Mean 2 25 45deg – t1.0 – p45
Avg–high 2.2 58 30deg – t0.8 – p45
Max 6 110 15deg – t1.2 – p60
Plateau Length
Min 0.14 2.5 75deg – t1.2 – p20
Mean 2 25 45deg – t1.0 – p45
Max 2.5 120 15deg – t0.8 – p60 @ d5
Table 5.4 – Egg–box Geometries with Distinctive Performance

5. Analysis of Modified Egg–box
111
The sandwich arrangement can consist of more than two geometries. However,
bearing in mind the foremost use of egg–box structures as vehicle parts,
combinations of more than two geometries can increase the height (depth) of the
sandwich panel to impractically large values. It is important in the optimisation of
the egg–box structure for its dimensions and shape to suit its function.
The egg–box sandwich panel can be made by combining the maximum plateau
length and the minimum peak load. The setback is the opposite effect of these two
factors. For a maximum plateau length, the peak load too rises to an undesired high
value and vice versa. Hence, some compromise should be made to find geometries
that attain both qualities. The geometries with the mean and average values provided
in Table 5.4 satisfy the requirement to a reasonable extent.
In order for the sandwich panel produced to have maximum efficiency, the
structures of ω , t=0.8mm, p=60mm, d=5mm and ω , t=0.8mm, p=60mm,
d=5mm are selected to provide minimum peak load and maximum plateau length,
respectively. The selected cell models have been highlighted in Table 5.4. It can be
seen that both structures have the same thickness value; this counts as a facilitating
factor in the fabrication of the geometries, serving towards the optimisation target.
When positioned at the top of the sandwich structure, the geometrical features
of the model with the low peak load will act towards effectively reducing the damage
by absorbing the sudden shock of the impactor. The sandwich structure then follows
through an extended deformation procedure as the loads are transferred to the
geometry, placed in the lower part of the sandwich.
A finite element model of the above combination is produced in ANSYS/LS–
DYNA®. The model goes through the same impact exercise as the rest of the egg–
box geometries in order to compare the outcome of this improved model with the
result curves previously presented. Figure 5.63 (a) shows a cross section of the finite
element model for the proposed sandwich panel. In Figure 5.63 (b) the model has
been expanded to enable enhanced visualisation of the simulation. The aluminium
sheet, the impactor and the supporting surface have also been scaled accordingly.
The actual FE model consists of the single cells of part (a) of Figure 5.63.

5. Analysis of Modified Egg–box
112
(a) Single Cell Cross Section
(b) 3D Expanded Sandwich Panel (Total Height of 265mm)
Figure 5.63 – FE Simulation Model of Proposed Sandwich Panel

5. Analysis of Modified Egg–box
113
To avoid unexpected deformations, a thin flat sheet of aluminium is placed
between the two geometries as shown in Figure 5.63(a). The boundary conditions
remain similar to those applied in the simulation of individual egg–box structures to
allow for a true comparison of the outcomes.
Use of resins or welding in the production of the sandwich panel affects its
performance and the accuracy of the comparative study of the results. It is therefore
assumed that the two geometries and the middle sheet are restricted from movement
in all lateral directions and contact conditions are applied to all outer surfaces as in
the previous simulations. Hence, a condition in which the panels are boxed in by
solid vertical surfaces is simulated.
The aluminium sheet placed between the two geometries has a thickness of
0.8mm, which will immediately deform when subject to forces, due to its flat, thin
geometry. Thus, while keeping the geometries in their correct position, it does not
significantly add to the strength of the sandwich structure, also allowing for a fair
comparison of results.
Summing the height of the two geometries and the aluminium sheet, the entire
structure has a total height of approximately 265mm, which in comparison, with the
maximum height of the individual egg–boxes of this study being over 200mm, is a
reasonably low height.
Figure 5.64 shows the force–displacement curves for the proposed sandwich
structure (solid curve), the trend–line of this curve (dashed line) and the curves of
each individual cell participating in the construction of the sandwich panel. It is
evident that this structure displays a comparatively low peak load of less than 2kN,
as expected and an exceptionally extended deformation length of 229mm which
agrees with the entire height of the sandwich panel.
In addition, compared to the curves of each individual cell, it can be observed
from Figure 5.64 that the ideal initial peak load of the 45deg–t0.8–d5–p60 model
(obtained from Figure 5.34) is reflected in the sandwich panel while the length of the
plateau in the proposed panel consists of the sum of the energy absorption length of
45deg–t0.8–d5–p60 and 15deg–t0.8–d5–p60 (from Figure 5.10) cells. The plateau

5. Analysis of Modified Egg–box
114
has in fact a desirable smooth consistency. This indicates that the proposed model is
a comparatively optimised option.
Figure 5.64 – Comparison of FE Analysis for Optimised Sandwich Panel and
Individual Optimum Egg–box Components
It is expected from an optimised structure to have a reasonably low weight
relevant to its energy absorption capacity. The entire sandwich structure, including
the middle sheet, has a mass of 0.1kg per cell which results in a 2.5kg mass for a 5×5
cell unit panel.
From a review of the structural weight and the total energy absorbed by each of
the individual egg–box cells used in the proposed sandwich panel against the same
measures of the optimised sandwich structure, it is shown that: while the sandwich
panel has an average weight gain of 3.5% in comparison to the two individual cells,
its total amount of energy absorbed is increased by roughly 33%. Such level of
increase in energy absorption capacity, in proportion to the amount of weight gain is
commendable.
0
1
2
3
4
5
6
7
8
9
10
0 50 100 150 200 250
Forc
e K
N
Displacement mm
Optimised Sandwich Panel
45deg-t8-d5-p60
15deg-t8-d5-p60
Trendline

5. Analysis of Modified Egg–box
115
Additionally, the sandwich structure shows a 490% increase in the amount of
energy absorbed, in comparison to the optimum egg–box structure with ω ,
t=0.8mm, p=45mm, d=5mm, while there exists a 10% increase in structural weight
between the two. Despite the large percentage of weight gain, the enhancement in the
energy absorption, in addition to the comparatively similar initial peak load, makes
the proposed sandwich structure an ideal candidate.
An experimental dynamic impact test of the sandwich structure can further
confirm its suitability for use as an optimum aluminium energy absorber. However,
the expensive and time consuming series of practical tests which lead to this structure
have been prevented with the use of the less costly, repeatable finite element
simulation method.
5.9. Critical Analysis of Optimised Sandwich Panel
In order to further evaluate the enhanced characteristics of the above sandwich
panel, two counterexample case studies have been developed by the combination of
different egg–box cells. To enable more efficient choices amongst the large number
of possible cells, selection is made from the geometries of Table 5.4 which are
already derived to be cases of worst or best performance. In all models, varieties are
limited to a top/base diameter of 5mm, since it is evident in every curve of Section
5.4 that this dimension displays the most desirable force–displacement plateau.
5.9.1. Case Study 1
Initially a sandwich panel is made from the average high candidate of the peak
load category and the mean level candidate of the plateau length category of Table
5.4. The geometrical measurements of the two models are ω , t=0.8mm, p=45mm,
d=5mm and ω , t=1mm, p=45mm, d=5mm, respectively, as shown in figure 5.65.
The former geometry displays a high level of load peak and a rather lengthy
plateau while the latter model has a comparatively average energy absorption
capacity. The combination of the two allows for the evaluation of the role of a

5. Analysis of Modified Egg–box
116
geometry with a low peak load, as selected in the original sandwich panel, as well as
the effect of its lengthier plateau on the total energy absorption of the system.
Figure 5.65 – 3D FE Simulation Model of Sandwich Panel Case Study 1
Figure 5.66 – FE Analysis for First Sandwich Panel Case Study
Densification Point
0
1
2
3
4
5
6
7
0 20 40 60 80 100
Forc
e K
N
Displacement mm
Case Study 1 Trendline
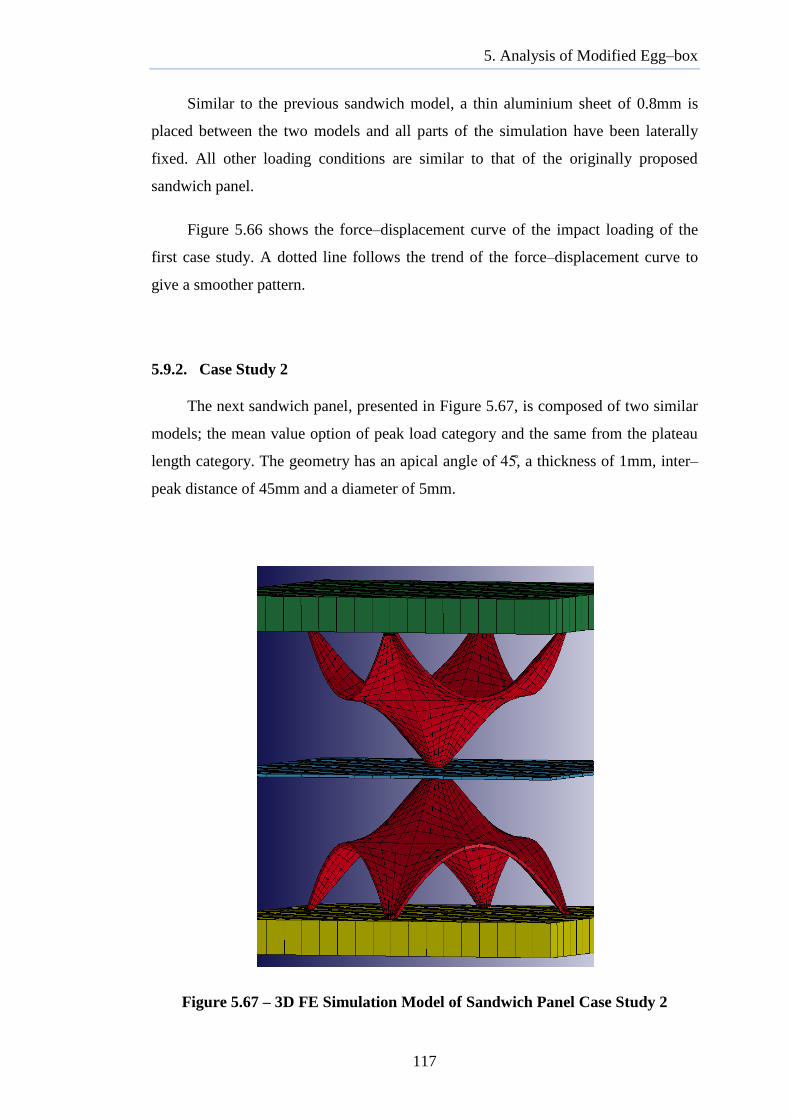
5. Analysis of Modified Egg–box
117
Similar to the previous sandwich model, a thin aluminium sheet of 0.8mm is
placed between the two models and all parts of the simulation have been laterally
fixed. All other loading conditions are similar to that of the originally proposed
sandwich panel.
Figure 5.66 shows the force–displacement curve of the impact loading of the
first case study. A dotted line follows the trend of the force–displacement curve to
give a smoother pattern.
5.9.2. Case Study 2
The next sandwich panel, presented in Figure 5.67, is composed of two similar
models; the mean value option of peak load category and the same from the plateau
length category. The geometry has an apical angl , a thickness of 1mm, inter–
peak distance of 45mm and a diameter of 5mm.
Figure 5.67 – 3D FE Simulation Model of Sandwich Panel Case Study 2

5. Analysis of Modified Egg–box
118
The upper model is rot to allow for the peak to be located on top of the
peak of the lower egg–box. A 0.8mm thick aluminium sheet is placed between the
two cells while the bottom cell rests on a supporting surface. All lateral movements
have been restricted and an impactor surface is located above the entire sandwich
model, similar to that of the originally proposed case.
A sandwich panel with such selection of egg–box cells can give information on
the importance of using low peak load and high energy absorption models in the
construction of a sandwich structure. The twice employed geometry has a
comparatively high peak load value and a rather short plateau length.
Exploring the performance of the second sandwich panel example can help
justify the improved characteristics of the proposed optimised sandwich panel. The
force–displacement curve of case study number two alongside a trend line showing a
smoothed out version of its path are illustrated in Figure 5.68.
Figure 5.68 – FE Analysis for Second Sandwich Panel Case Study
5.9.3. Evaluation against Optimised Sandwich Structure
The curves of Figures 5.66 and 5.68 are compared to that of the proposed
enhanced sandwich structure, in Figure 5.69. It can be seen that both case studies
Densification Point
0
1
2
3
4
5
0 10 20 30 40 50 60 70 80
Forc
e K
N
Displacment mm
Case Study 2 Trendline
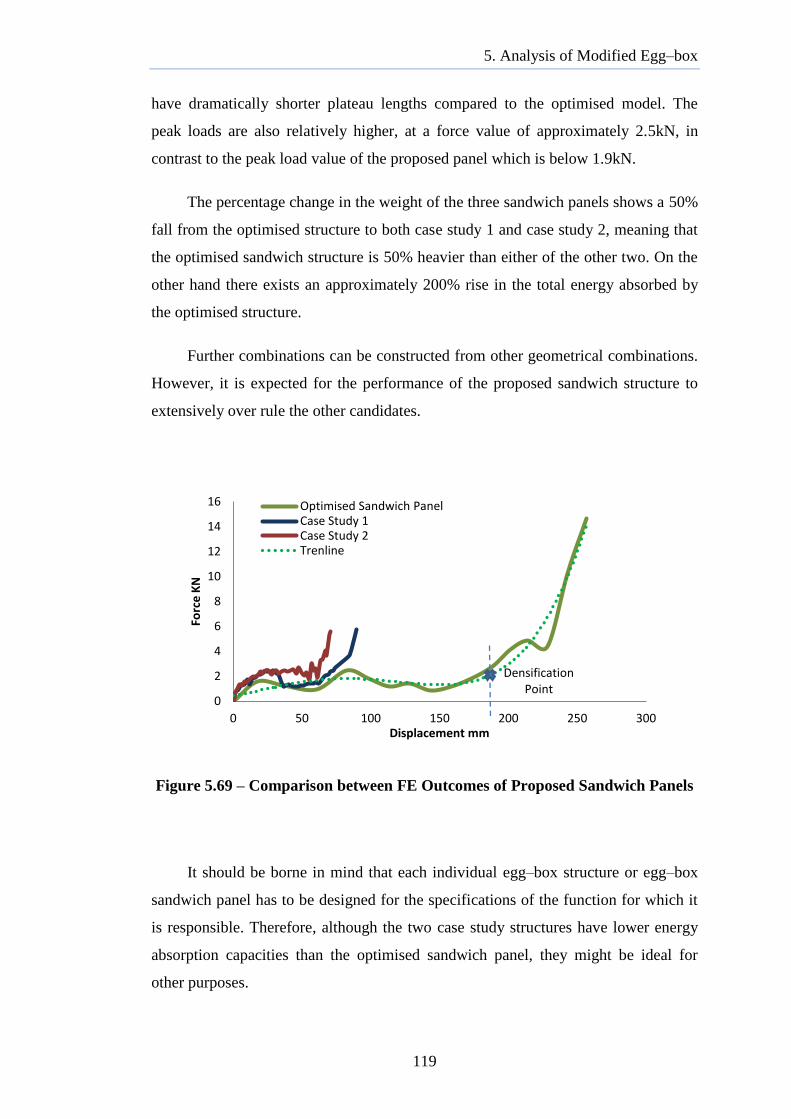
5. Analysis of Modified Egg–box
119
have dramatically shorter plateau lengths compared to the optimised model. The
peak loads are also relatively higher, at a force value of approximately 2.5kN, in
contrast to the peak load value of the proposed panel which is below 1.9kN.
The percentage change in the weight of the three sandwich panels shows a 50%
fall from the optimised structure to both case study 1 and case study 2, meaning that
the optimised sandwich structure is 50% heavier than either of the other two. On the
other hand there exists an approximately 200% rise in the total energy absorbed by
the optimised structure.
Further combinations can be constructed from other geometrical combinations.
However, it is expected for the performance of the proposed sandwich structure to
extensively over rule the other candidates.
Figure 5.69 – Comparison between FE Outcomes of Proposed Sandwich Panels
It should be borne in mind that each individual egg–box structure or egg–box
sandwich panel has to be designed for the specifications of the function for which it
is responsible. Therefore, although the two case study structures have lower energy
absorption capacities than the optimised sandwich panel, they might be ideal for
other purposes.
Densification Point
0
2
4
6
8
10
12
14
16
0 50 100 150 200 250 300
Forc
e K
N
Displacement mm
Optimised Sandwich Panel Case Study 1 Case Study 2 Trenline
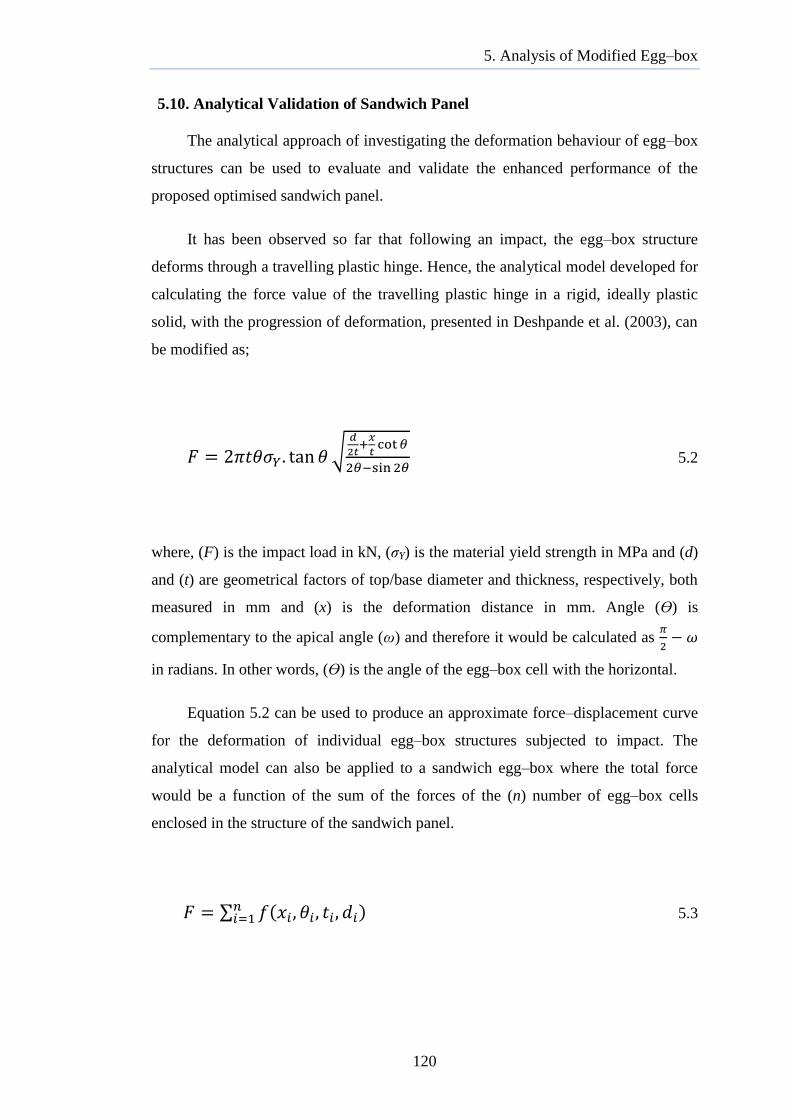
5. Analysis of Modified Egg–box
120
5.10. Analytical Validation of Sandwich Panel
The analytical approach of investigating the deformation behaviour of egg–box
structures can be used to evaluate and validate the enhanced performance of the
proposed optimised sandwich panel.
It has been observed so far that following an impact, the egg–box structure
deforms through a travelling plastic hinge. Hence, the analytical model developed for
calculating the force value of the travelling plastic hinge in a rigid, ideally plastic
solid, with the progression of deformation, presented in Deshpande et al. (2003), can
be modified as;
5.2
where, (F) is the impact load in kN, (σY) is the material yield strength in MPa and (d)
and (t) are geometrical factors of top/base diameter and thickness, respectively, both
measured in mm and (x) is the deformation distance in mm. Angle (Ө) is
complementary to the apical angle (ω) and therefore it would be calculated as
in radians. In other words, (Ө) is the angle of the egg–box cell with the horizontal.
Equation 5.2 can be used to produce an approximate force–displacement curve
for the deformation of individual egg–box structures subjected to impact. The
analytical model can also be applied to a sandwich egg–box where the total force
would be a function of the sum of the forces of the (n) number of egg–box cells
enclosed in the structure of the sandwich panel.
5.3

5. Analysis of Modified Egg–box
121
Impact experiments show that in an energy absorbing structure, densification
occurs roughly at 75% deformation of the height of the structure. In mathematical
terms:
5.4
Equation 5.4 is used to estimate the termination point of the force–displacement
plateau, where the curve transfers into a sudden steep rise. The behaviour of the
structure past the point of densification is not of concern in the study of energy
absorbers. Therefore, it will be assumed that the force value rises infinitively at the
same point, while in practice the increase in force value happens gradually yet at a
high rate.
Figure 5.70 – Analytical Assessment (eq. 5.2 and 5.3) vs. FE Analysis of
Proposed Optimised Sandwich Structure
Figures 5.70, 5.71 and 5.72 show the curves resulted from the application of
equation 5.3 in conjunction with equation 5.2, to the proposed sandwich structure
Densification Point
0
1
2
3
4
5
6
7
8
9
10
0 50 100 150 200 250 300
Forc
e K
N
Displacement mm
Optimised Sandwich Panel
Analytical Approach
Trendline

5. Analysis of Modified Egg–box
122
and the subsequent case studies, respectively. The curves terminate at densification
points estimated from the expression of equation 5.4. Evaluation is made against the
finite element curve of each structure.
The resultant curve of the analytical approach in Figure 5.70 estimates force
values in the vicinity of the outcome data of FE analysis of the proposed egg–box
structure. The densification point is also in exact agreement among the two curves at
a deformation value of x =175mm.
Due to the geometrical approximations made in the formation of the analytical
model, the force value at termination is overestimated by the mathematical equation.
In addition, the only material property detail implemented in the equation is the yield
strength of the material, while the aluminium alloy used in the fabrication of egg–
box structures under investigation has stress values sensitive to the strain rate.
Bearing in mind the assumptions, it is argued that the current predictions of the
analytical model are satisfactory and confirm the results of the finite element
simulation performed.
Figure 5.71 – Analytical Calculations vs. FE Analysis of Sandwich Case Study 1
Densification Point
0
1
2
3
4
5
6
7
0 20 40 60 80 100
Forc
e K
N
Displacement mm
Case Study 1
Analytical Approach
Trendline

5. Analysis of Modified Egg–box
123
To further examine the validity of the FE simulation results, the behaviour of
the case study sandwich structures, which were formed to evaluate the performance
of the proposed optimised structure, were also modelled with the analytical equation.
Curves of these calculations are provided in Figures 5.71 and 5.72 for case study 1
and case study 2, respectively.
Figure 5.72 – Analytical Calculations vs. FE Analysis of Sandwich Case Study 2
Correlations are evident in both figures between the analytical curves and the
FE outcomes. In each case the predicted densification point matches that of the
simulated deformation curve. Sandwich panel of case study 1 reaches the
densification point at almost 75mm and the second case study at x=55mm.
By estimating the area of the rectangle underneath the curves of Figures 5.70,
5.71 and 5.72, it can be seen that the total amount of energy absorbed as predicted by
the analytical method agrees to the same calculations for FE analysis.
Implementation of equations 5.2, 5.3 and 5.4 in the above figures shows that
the predictions of the finite element simulation are accurate and reliable.
0
1
2
3
4
5
6
7
0 10 20 30 40 50 60 70 80
Forc
e K
N
Displacment mm
Case Study 2
Analytical Approach
Trendline
Densification
Point

6. Discussion
124
6. DISCUSSION
In the present research an advanced finite element technique is developed for
the modelling and simulation of aluminium egg–box structures in complex
mechanical systems with specific boundary conditions. Following the establishment
of accurate modelling and simulation specifications through a series of experimental
tests and analytical models, a set of geometrically altered egg–box cells have been
numerically modelled, tested and their results evaluated to propose optimised
geometrical values which enhance the performance of an egg–box structure.
Following the presentation of introductory information on energy absorbing
structures and the energy absorption concept, methods of improving occupant safety
in vehicles were discussed in Chapter 1. Aluminium egg–box structures were
presented to act as crush test barriers to assess car crashworthiness in impact test
arrangements. It was established that varying the geometrical factors of the structure
has a direct effect on its performance quality; hence, the energy absorption capacity
of an egg–box structure can be improved by refining its geometrical features. The
use of finite element numerical packages in evaluating the performance of complex
structures such as the impact test of energy absorbers was introduced, providing a list
of most common commercial FE packages used in static and dynamic structural
analysis. In this chapter is was shown that the optimisation of egg–box energy
absorbing structures is a multi–objective task where both the level of the peak impact
load and the length of the deformation process are of importance.

6. Discussion
125
In the second Chapter the works and studies previously performed in the
subject area of the research in hand were reviewed. The evaluation of energy
absorption characteristics and crashworthiness of various systems under diverse
loading conditions were explored through investigating the past and recent literature.
This was followed by a thorough investigation into the properties of currently
available energy absorbing structures and their distinctive characteristics and
performances. Reference was made to researchers who have employed experimental,
analytical and numerical techniques in their projects. A review was also made of the
work of researchers who have aimed to optimise the performance of energy
absorbing structures and the techniques they utilised for this purpose. It became
evident that, due to its recent development, the egg–box structure has not been
studied as extensively as other energy absorbers. It was noticed in the literature
review section that, inadequate knowledge exists on using innovative techniques to
analyse highly complex energy absorbing structures and systems with pre–defined
boundary conditions within an reasonable solution time and costs.
As a preliminary step in finding suitable tools to analyse the complex scenario
of the dynamic impact of egg-box structure, experimental impact tests were
conducted on various egg-box specimens as reported in Chapter 3. The samples
included free-edged single cells cut from an egg-box panel, single cells in-situ within
a panel and entire egg-box panels. The direction of the loading was altered in some
test cases, to investigate the behaviour of the structures under oblique loadings in
addition to flat impacts. The tests were conducted with drop masses free falling at a
contact speed of 6ms-1
. The applied load and the relative vertical movement of the
egg-box specimens were recorded and presented in Chapter 3 as force-displacement
curves. It became evident that with the oblique loading of egg-box cells, the strength
displayed by the structure will greatly decrease. From conducting impact tests on
samples with diverse boundary conditions, the important role of the continuous
structure of egg-box was realised, since the amount of impact energy absorbed, was

6. Discussion
126
noticeably higher in the impact of the panel in comparison to the single free-edged
cell.
In Chapter 4 the deformation behaviour of the egg-box samples tested in
Chapter 3 was examined and analytical total energy equations were derived per
specimen. The total energy absorbed by the structures were also mathematically
deduced and compared to the force-displacement curves presented in the previous
chapter. In the subsequent section of Chapter 4, a finite element model was generated
for the aluminium egg–box structure and the impact experiments performed in the
previous chapter were simulated. The models were meshed using SHELL163 which
is a thin shell element of ANSYS/LS-DYNA®. Using LS- YNA®’ MAT_
MODIFIED_PIECEWISE_LINEAR_PLASTIC material model, the aluminium
material was simulated with precise mechanical properties, taking into account the
strain rate sensitivity of CP aluminium alloy. In addition appropriate boundary and
loading conditions were introduced to the model. The outcome data of the FE
simulations were then validated against numerical and experimental outputs. The
precision of the results authenticated the simulation specifications, in terms of the
accuracy of material models and boundary conditions, for further modelling of egg–
box structures towards optimisation.
The validated FE modelling set up of Chapter 4 was used to simulate the
dynamic impact tests of the egg-boxes with various dimensions to evaluate the effect
of altering geometrical factors on their energy absorption characteristics. A table
containing series of varying egg–box cell geometrical dimensions was presented in
this chapter. The resultant force–displacement curves were analysed in cross
comparison, to establish relationships between geometrical changes and the ultimate
performance of a cell. The outcome of the analytical review was subsequently used
to define best and worst geometries in terms of peak impact load level and length of
deformation. It was determined that the two characteristics work in opposite manners
and improvement in one results in the decline of another. Therefore, an optimum

6. Discussion
127
egg–box structure was proposed which partially compromised to satisfy both
specifications of an ideal energy absorber to a reasonable extent. Based on the
findings, an improved sandwich structure, formed by a combination of two egg–box
geometries with best performance in each area, was created which performed ideally
as opposed to the individual egg–box structures. The exceptional energy absorption
characteristics of the sandwich model were verified against the results of other
sandwich panel combinations. In addition, an analytical method was developed to
authenticate the outcomes of all sandwich panels. It was stated in Chapter 5 that the
optimisation of egg–box structures is purpose–specific; meaning that for certain
functions the structure may be required to perform in certain manners, hence it would
be irrational for a single geometry to be called optimum for all purposes. This
chapter was indeed a benchmark within the contributions of the present research,
providing detailed load–deformation curves for a vast range of egg–box geometries,
variations of which are currently in industrial applications. The vast number of
simulations and their resultant graphs may be used as reference curves in the study of
the performance of egg–box energy absorbers.

7. Conclusions
128
7. CONCLUSIONS
The present research has successfully achieved its aims and objectives as
proposed in the introductory section of the thesis. The main objective of this project
was to employ an advanced nonlinear finite element simulation tool to develop the
best geometric design of commercially pure aluminium egg–box structure to absorb
kinetic energy in a controllable and predictable manner.
In addition to meeting its initially proposed objectives, this research also
presented broad techniques and arrangements to design and simulate tests, use
material property data to produce practical material models and define realistic
boundary condition and interface assumptions for finite element simulations. The
main achievements in this investigation were to deliver FE simulations for the impact
test of egg–box structures, validated against experimental impact tests, and to find
cell geometries which would prove optimum in terms of their energy absorption
characteristics under impact.
The study has successfully led into a time and cost efficient technique to
simulate aluminium egg–box cells irrespective of their physical specifications such
as cell measurements and wall thickness. Use of shell elements in the modelling of
these structures has decreased the analysis time and associated costs due to the
reduction in the number of nodes. Validated finite element models of such, greatly
reduce the need for expensive, time consuming and irreversible practical tests.
7. Conclusions
129
The extensive variations of geometrical factors of the egg–box lead to different
deformation responses and thus distinctive levels of energy absorption. Ideal egg–
box geometries are expected to display high levels of energy absorption capacities in
specific applications and reduce the initial effect of the impact to a satisfactorily low
level while maintaining a reasonably low structural weight and material
consumption. Experimental test outcomes showed that the strengths of the egg-box
panels decrease substantially in oblique loading of the cells.
Modelling and testing egg–box structures of altered geometries and comparison
of the output data gave rise to the development of optimal egg–box energy absorbing
structures. From the combination of the most efficient geometries, an optimised
sandwich structure was developed which showed ideal energy absorption
characteristics in all anticipated areas.
The development of the FE modelling and simulations was on the basis of the
assertion that accurate outcomes are results of accurately simulated models in terms
of material models, boundary and loading conditions, geometrical symmetries and
time values. It was shown in the modelling of the experimental dynamic tests that in
finite element simulation, accounting for the strain rate sensitivity of materials leads
to correct display of strength by the structure. Evaluation of the simulation results
against the experimental tests data revealed that the simulations acquired from
ANSYS/LS–DYNA® were valid and reliable for further repetitive modelling. In the
process of the modelling thin shell elements were shown to be suitable for meshing
the walls of thin–walled structures such as an egg–box.
In the path of optimising the structural performance of egg–box energy
absorbers, it was concluded that as opposed to other materials used in the production
of energy absorbers, the structural weight, recyclability, suppleness, price and
industrial availability of aluminium alloys makes them ideal materials for use in the
fabrication of egg–box absorbers.

7. Conclusions
130
Finite element simulations of one system, when based on different assumptions,
produce results that are not in full agreement. The parametric modelling procedure
enables outcome comparison between different users. The same procedure was used
in the current project to produce an assortment of egg–box geometries which could
be evaluated against one another for optimisation purposes.
The optimisation of energy absorbing structures is a multi–objective task where
the variables create a Pareto set. An optimised egg–box has a force–displacement
curve which displays a low initial peak (fatal injuries become less likely) and a
lengthy plateau (greater energy absorption).
From the comparative analysis of the various egg–box geometries, it was
concluded that structures with thicker walls have higher peak loads, while the change
in thickness does not significantly affect the length of the plateau. The increment of
the vertical angle of an egg–box, on the other hand, appeared to lessen the depth of
the panel. Deeper egg–box panels produced longer deformation processes (plateau),
but higher peak loads.
Comparison with regards to the inter–peak distance (p) revealed that with
shorter (p) values, the initial response of the egg–box structure to an impact becomes
more satisfactory; however, the length of the force–displacement curve plateau
becomes shorter and hence less energy would be absorbed. The effect of changes in
top/base diameter on the initial reaction of the egg–box was found to be negligible
while it displayed a reverse relationship with the length of the deformation.
Amongst the simulated models, the egg–box geometry that would perform
most satisfactorily in the initial stage of an impact consisted of a large angle ω=
< ω ), thin walls t=0.8mm (t < 1mm), a short inter–peak length p=20mm,
while the measurement of the top/base diameter (d) was not of major importance. It
was, hence, concluded that egg–box panels with large apical angles (a flat build),
thin walls and greater cell densities perform better in reducing the sudden initial

7. Conclusions
131
effect of an impact and protect the enclosed bodies against harmful injuries more
effectively.
The length of the deformation process was maximised in an egg–box geometry
with a small angle ω= < ω ), a lengthy inter–peak distance p=60mm and a
small top/base diameter d=5mm while the thickness of the cell walls did not
particularly influence this behaviour. The conclusions obtained from this geometry
indicated that egg–box panels with smaller apical angles, less cell densities and
smaller peak/trench diameters offer longer deformation lengths, thus, absorb more
energy during a crush situation. In other words, a more efficiently reduced amount of
the impact energy is transferred to the protected bodies.
It was noted that the optimised egg–box structure would be one that performs
ideally in both of the above areas. From an analytical review of the geometries
simulated, it was concluded that, at a fair level of compromise in either of the energy
absorption characteristics, the geometry with ω , t=0.8mm, p=45mm and d=5mm
is the most optimum egg–box cell with a peak load of 2.2kN and a plateau length of
approximately 58mm. The total amount of energy absorbed by this structure is equal
to 105kN.mm.
Egg–box structures can be combined in the form of sandwich panels designed
per application to act as optimised energy absorbers. In the current project, an
innovative sandwich structure was proposed which displayed exceptional energy
absorption characteristics in comparison to the individual egg–box geometries.
The sandwich panel consisted of two egg–box panels connected via a thin
aluminium sheet. The participating egg–box cells were ω= , t=0.8mm, p=20mm
and d=5mm on the top, to reduce the effect of the initial peak load, and ω ,
t=0.8mm, p=60mm and d=5mm on the bottom, to provide maximum deformation
length. The actual length of the deformation in this model was increased to 229mm
by taking into account the sum of the heights of two geometries, while the initial

7. Conclusions
132
peak load remained at minimal level of less than 2kN, as expected from the top egg–
box cell.
The total amount of energy absorbed by the sandwich panel is increased by
roughly 33% in comparison to the two individual egg–box cells of which it is made.
At such level of increase in energy absorption capacity, the average weight gain of
3.5% is acceptable. The optimised structure also shows a 200% rise in the total
energy absorbed compared to either of the two counterexample case studies proposed
in Chapter 5 of the thesis. A 50% weight gain comes with this enhancement in
performance. It is concluded that the enhanced energy absorption capacity in the
proposed structure over-performs the increase in its weight.
Authentication of the results of finite element analysis with analytical
approaches verifies that the enhanced performance of the proposed sandwich model
is valid and reliable.
7.1. Recommendations for further Investigation
The optimised structure proposed using the economical and repetitive finite
element simulations and analyses, is required to be fabricated and experimentally
investigated prior to being put into use in the industry. The experimental and FE tests
studied and performed in this research assume loads or drop towers that impact the
egg–box structure either at a right angle to the top of the panel angle. In
practice, many impacts are made obliquely to the surface of a vehicle body where
energy absorbing structures may be implemented. Further loading angles can be
investigated per structure.
The analytical model which was proposed in this research to predict a pattern
for the force–displacement curve of the impact of egg–box structure may be further
developed to produce more accurate results in estimation.

7. Conclusions
133
Using the modelling and simulation procedures, the behaviour of the egg–box
geometry can be investigated and analysed when subjected to any loading type or
condition. The effect of using innovative metal alloys and other materials in the
deformation mechanism of egg–box absorbers can be looked into to uncover more
efficient materials for the production of ideal egg–box panels. Various geometrical
modifications such as the addition of ribs amongst egg–box cells and corrugated or
wavy structural shapes can be developed in the future which may perform more
satisfactorily as energy absorbers. The follow–through procedures proposed in this
study can be used for modelling other types of energy absorbing structures in the
commercially available finite element analysis packages. Optimisation is purpose–
specific; therefore, geometries not considered as ideal in this research may satisfy the
requirements of certain applications.

134
REFERENCES
Abramowicz, W. (2003), Thin–walled structures as impact energy absorbers, Thin–
Walled Structures, vol. 41(2–3), p. 91–107
Abramowicz, W. and Jones, N. (1984), Dynamic axial crushing of square tubes, Int.
J. of Impact Engineering, vol. 2(2), p. 179–208.
Abramowicz, W. and Jones, N. (1986), Dynamic progressive buckling of circular
and square tubes, Int. J. of Impact Engineering, vol. 4(4), p. 243–270
Abramowicz, W. and Wierzbicki, T. (1989), Axial Crushing of Multicorner Sheet
Metal Columns, J. of Applied Mechanics, Transactions ASME, vol. 56, p. 113–120
Ahmad, Z. (2009), Impact and energy absorption of empty and foam–filled conical
tubes, PhD thesis, Queensland University of Technology
Akisanya, A. R. and Fleck, N. A. (2006), Plastic collapse of thin–walled frusta and
egg–box material under shear and normal loading, Int. J. of Mechanical Sciences,
vol. 48(7), p. 799–808
Aktay, L., Toksoy, A. K. and Guden, M. (2006), Quasi–static axial crushing of
extruded polystyrene foam–filled thin–walled aluminium tubes: Experimental and
numerical analysis, Materials & Design, vol. 27(7), p. 556–565
Alexander, J. M. (1960), An approximate analysis of the collapse of thin cylindrical
shells under axial loading, Quart. J. Mechanics. and Applied Mathematics, vol. 13,
p. 10–15
Alghamdi, A. A. A. (2001), Collapsible impact energy absorbers: an overview,
Thin–Walled Structures, vol. 29, p. 189–213
Aljawi, A. A. N. (2000), Finite element and experimental analysis of axially
compressed plastic tubes, European J. of Mechanical and Environmental
Engineering, vol. 45 (1), p. 3–10
ANSYS® 13.0 Help System (2010), Mechanical Analysis User Guide, ANSYS Inc
ANSYS/LS–DYNA® (2011), ANSYS/LS–DYNA User’s Guide, ANSYS Inc
ANSYS/LS–DYNA® Introduction, ANSYS Website, accessed March 2011:
http://www.ansys.com/products/%20lsdyna.asp
Asadi, M., Walker, B. and Shirvani, H. (2009), An Investigation to Compare the
Application of Shell and Solid Element Honeycomb Model in ODB, 7th European
LS–DYNA Conf.

135
Asadi, M., Walker, B. and Shirvani, H. (2008a), Development of the Advanced Finite
Element Model for ODB Impact Barrier, LS–DYNA User Conf.: Japan
Asadi, M., Walker, B. and Shirvani, H. (2008b), New Finite Element Model for
NHTSA Impact Barrier, 10th Int. LS–DYNA Users Conf.
Asadi, M., Walker, B. and Shirvani, H. (2007a), Evaluation of New Finite Element
Model for IIHS Side Impact Barrier, LS–DYNA User Conf.: Japan
Asadi, M., Tattersall, P., Walker, B. and Shirvani, H. (2007b), Advanced Finite
Element Model for AE–MDB Side Impact Barrier, 6th European LS–DYNA User
Conf.
Asadi, M., Shirvani, H., Sanaei, E. and Ashmead, M. (2006), A Simplified Model to
Simulate Crash Behaviour of Honeycomb, Proceedings of the Int. conf. on Advanced
Design and Manufacture: China
Asavavisithchai, S., Slater, D. and Kennedy, A. R. (2004), Effect of tube length on
the bucking mode and energy absorption of Al foam–filled tubes, J. of Materials
Science, vol. 39(24), p. 7395–7396
Ashby, M. F., Evans, A. G., Fleck, N. A., Gibson, L. J., Hutchinson, J. W. and
Wadley, H. G. (2000), Metal foams: a design guide, Butterworth–Heinemann:
Boston, MA, USA
Ashmead, M. (2000), Energy–absorbing structures Int. Patent, Serial No. WO
00/31434
Ashmead, M., Bedus, S. and Bradley, S. (2000), Advanced Materials for Enhanced
Automotive Safety, Automotive Composites and Plastics Conf.
Avalle, M., Belingardi, G., Ibba, A. (2007), Mechanical models of cellular solids:
Parametres identification from experimental tests, Int. J. of Impact Engineering, vol.
34(1), p. 3–27
Avalle, M., Chiandussi, G., and Belingardi, G. (2002), Design optimisation by
response surface methodology: Application to crashworthiness design of vehicle
structures, Structural and Multidisciplinary Optimisation, vol. 24, p. 325–332
Banhart, J. (2001), Manufacture, characterisation and application of cellular metals
and metal foams, Progress in Materials Science, vol. 46(6), p. 559–632
Bardi, F. C., Yun, H. D. and Kyriakides, S. (2003), On the axisymmetric progressive
crushing of circular tubes under axial compression, Int. J. of Solids and Structures,
vol. 40, p. 3137–3155

136
Birch, R. S. and Jones, N. (1990), Dynamic and static axial crushing of axially
stiffened cylindrical shells, Thin–Walled Structures, vol. 9, p. 29–60
Belytschko, T. B. and Tsay, T. S. (1983), A stabilization procedure for the
quadrilateral plate element with one–point quadrature, Int. J. of Numerical Methods
in Engineering, vol. 19, p. 405–419
Belytschko, T. B., Lin, J. I. and Tsay, C. S. (1984), Explicit algorithms for the
nonlinear dynamics of shells, Computer Methods in Applied Mechanics and
Engineering, vol. 42, p. 225–251
Borvik, T., Hopperstad, O. S., Reyes, A., Langseth, M., Solomos, G. and Dyngeland,
T. (2003), Empty and foam–filled circular aluminium tubes subjected to axial and
oblique quasi–static loading, Int. J. of Crashworthiness, vol. 8 (5), p. 481– 494
Box, G. E. P. and Wilson, K.B. (1951), On the Experimental Attainment of Optimum
Conditions (with discussion), J. of the Royal Statistical Society, Series B, vol. 13(1),
p. 1–45
Brown, J., C. (2002), Introduction to the Basic Principles of Crashworthiness,
Cranfield University: Bedfordshire
Calladine, C. R. (1986), Analysis of large plastic deformations in shell structures, In:
Inelastic Behaviour of Plates and Shells (IUTAM Symposium, Rio de Janeiro, 1985),
ed. L. Bevilacqua et al., Springer, Berlin, p. 69–101
Calladine, C., R. and English, R., W. (1984), Strain–rate and Inertia Effects in the
Collapse of Two Types of Energy–absorbing Structure, Int. J. of Mechanical Science,
vol. 26(11–12), p. 689–701
CARE (EU road accidents database) or national publications (2011), Road safety
evolution in EU, European Commission Road Safety, Directorate General Energy
and Transport
Chen, C., Harte, A. M. and Fleck, N. A. (2001), The plastic collapse of sandwich
beams with a metallic foam core, Int. J. of Mechanical Sciences, vol. 43, p. 1483–
1506
Cheon, S. S. and Meguid, S. A. (2004), Crush behaviour of metallic foams for
passenger car design, Int. J. of Automotive Technology, vol. 5(1), p. 47–53
Chiras, S., Mumm, D. R., Evans, A. G., Wicks, N., Hutchinson, J. W., Dharmasena,
K., Wadley, H. N. G. and Fichter, S. (2002), The Structural Performance of Near-
Optimised Truss-Core Panels, Int. J. Solids Struct., vol. 39, p. 4093–4115

137
Choi, K. K. and Youn, B. D. (2002), An investigation of nonlinearity of reliability–
based design optimisation approaches, In: 28th Design Automation Conf., Sep 29–
Oct 2 2002, Montreal, Que., Canada
Chung, J. G., Chang, S. H., Sutcliffe, M. P. F. (2007), Deformation and energy
absorption of composite egg–box panels, J. of Composites Science and Technology,
vol. 67, p. 2342–2349
Commission of the European Communities (2001), European transport policy for
2010: time to decide, White Paper: Brussels
Deb, A., Mahendrakumar, M. S., Chavan, C., Karve, J., Blankenburg, D. and Storen,
S. (2004), Design of an aluminium–based vehicle platform for front impact safety,
Int. J. of Impact Engineering, vol. 30(8–9), p. 1055–1079
Department for Transport (DfT) (2011), Heavy Goods Vehicle Inspection Manual,
Consolidated Edition
Deqiang, S., Weihong, Zh., Yanbin, W. (2010), Mean out–of–plane dynamic plateau
stresses of hexagonal honeycomb cores under impact loadings, Composite
Structures, vol. 92(11), p. 2609–2621
Deshpande, V. S. and Fleck, N. A. (2000), Isotropic constitutive models for metallic
foams, J. of the Mechanics and Physics of Solids, vol. 48(6–7), p. 1253–1283
Deshpande, V. S., Fleck, N. A., (2001), Collapse of truss core sandwich beams in 3–
point bending, Int. J. Solids Structures, vol. 38(36–37), p. 6275–6305
Deshpande, V. S. and Fleck, N. A. (2003), Energy absorption of an egg–box
material, J. of the Mechanics and Physics of Solids, vol. 51(1), p. 187–208
Du Bois, P., Chou, C. C., Fileta, B. B., Khalil, T. B., King, A. I., Mahmood, H. F.,
Mertz, H. J. and Wismans, J. (2004), Vehicle Crashworthiness and Occupant
Protection, Sponsored by Automotive Applications Committee, American Iron and
Steel Institute: Southfield, Michigan
El–Hage, H., Mallick, P. K. and Zamani, N. (2005), A numerical study on the quasi–
static axial crush characteristics of square aluminium tubes with chamfering and
other triggering mechanisms, Int. J. of Crashworthiness, vol. 10(2), p. 183– 195
El–Sobky, H., Singace, A. A. and Petsios, M. (2001), Mode of collapse and energy
absorption characteristics of constrained frusta under axial impact loading, Int. J. of
Mechanical Sciences, vol. 43(3), p. 743–757
Ellert, G. (1998–2008), The Physics Hypertextbook, Physics.info 2010: New York
138
European Commissions (EC) (2003), Saving 20000 Lives on Our Roads, Office for
Official Publications of the European Communities: Luxembourg
Evans, A. G. (2001), Lightweight Materials and Structures, MRS Bull vol. 790
Farley, G. L. (1986), Effect of Specimen Geometry on the Energy Absorption
Capability of Composite Materials, J. of Composite Materials, vol. 20, p. 390–400
Finn, S. R., Springer, G. S. (1991), Composite Plates Impact Damage: An Atlas,
Research supported by NASA, Technomic Publishing Co: Lancaster: PA
Fleck, N. A. (2001), Multi-Axial Strength of Metallic Foams and Lattice Materials, J.
of JSMS: Materials Science for the 21st Century, vol. A, p. 336-340
Fyllingen, O., Hopperstad, O. S. and Langseth, M. (2009), Robustness study on the
behaviour of top–hat thin–walled high–strength steel sections subjected to axial
crushing, Int. J. of Impact Engineering, vol. 36(1), p. 12–24
Gameiro, C. P. and Cirne, J. (2007), Dynamic axial crushing of short to long circular
aluminium tubes with agglomerate cork filler, Int. J. of Mechanical Sciences, vol.
49(9), p. 1029–1037
Gibson, L. J. and Ashby, M. F. (1997), Cellular Solids, Structure and Properties,
2nd ed., Cambridge University Press: Cambridge, UK
Grzebeita, R. H. (1990), An alternate method for determining the behaviour of round
stocky tubes subjected to an axial crush load, Thin–Walled Structures, vol. 9, p. 61–
69
Gupta, N. K., Easwara Prasad, G. L. and Gupta, S. K. (1997), Plastic collapse of
metallic conical frusta of large semi–apical angles, Int. J. of Crashworthiness, vol. 2,
p. 349–366
Gupta, N. K., Mohamed Sheriff, N. and Velmurugan, R. (2008), Experimental and
theoretical studies on buckling of thin spherical shells under axial loads, Int. J. of
Mechanical Sciences, vol. 50(3), p.: 422–432
Gupta, N. K. and Velmurugan, R. (1999), Axial compression of empty and foam
filled composite conical shells, J. of Composite Materials, vol. 33(6), p. 567–591
Gupta, N. K. and Venkatesh (2006), A study of the influence of diameter and wall
thickness of cylindrical tubes on their axial collapse, Thin–Walled Structures, vol.
44(3), p. 290–300
Gupta, N. K. and Venkatesh (2007), Experimental and numerical studies of impact
axial compression of thin–walled conical shells, Int. J. of Impact Engineering, vol.
34(4), p. 708–720

139
Hamada, H. and Ramakrishna, S. (1997) Fem method for prediction of energy
absorption capability of crashworthy polymer composite materials, J. of Reinforced
Plastics and Composites, vol. 16, p. 226–242
Hanssen, A. G.; Langseth, M. and Hopperstad, O. S. (1999), Static crushing of
square aluminium extrusions with aluminium foam filler, Int. J. Mechanical
Engineering, vol. 41(8), p. 967–993
Hanssen, A. G., Langseth, M. and Hopperstad, O. S. (2000a), Static and dynamic
crushing of circular aluminium extrusions with aluminium foam filler, Int. J. of
Impact Engineering, vol. 24(5), p. 475–507
Hanssen, A. G., Langseth, M. and Hopperstad, O. S. (2000b), Static and dynamic
crushing of square aluminium extrusions with aluminium foam filler, Int. J. of Impact
Engineering, vol. 24(4), p. 347–383
Hanssen, A. G., Langseth, M. and Hopperstad, O. S. (2001), Optimum design for
energy absorption of square aluminium columns with aluminium foam filler, Int. J. of
Mechanical Sciences, vol. 43(1), p. 153–176
Harte, A. M., Fleck, N. A. and Ashby, M. F. (2000), Energy absorption of foam–
filled circular tubes with braided composite walls, Eur. J. Mechanics – A/Solids,
vol.19, p. 31–50
Hartmann, F. and Katz, C. (2007), Structural analysis with finite elements, Springer:
Berlin
Hibbeler, R. C. (2002), Structural Analysis, Fifth Edition, Prentice Hall, Upper
Saddle River: New Jersey
Hibbitt, Karlsson and Sorensen Inc. (HKS) (2002), Getting Started with
ABAQUS/Standard Version 6.3, Pawtucket, USA: HKS
Jacobsen, A. J., Kolodziejska, J. A., Doty, R., Fink, K. D., Zhou, C., Roper, C. S. and
Carter, W. B. (2010), Interconnected Self-Propagating Photopolymer Waveguides:
An Alternative to Stereolithography for Rapid Formation of Lattice-Based Open-
Cellular Materials, Twenty First Annual International Solid Freeform Fabrication
Symposium - An Additive Manufacturing Conference: University of Texas, Austin
Jeon, I., Asahina, T., Kang, K. J., Im, S. and Lu, T. J. (2010), Finite element
simulation of the plastic collapse of closed–cell aluminium foams with X–ray
computed tomography, J. of Mechanics of Materials, vol. 42, p. 227–236
Johnson, W. and Mamalis, A. G. (1978), Crashworthiness of vehicles, Mechanical
Engineering Publications Ltd: London
Jones, N. (1989), Structural Impact, Cambridge University Press: Cambridge, UK
140
Jones, N. (2003), Several phenomena in structural impact and structural
crashworthiness, Euro. J. of Mechanics – A/Solids General and plenary lectures from
the 5th EUROMECH Solid Mechanics Conference, vol. 22(5), p. 693–707
Karagiozova, D., Alves, M. and Jones, N. (2000), Inertia effects in axisymmetrically
deformed cylindrical shells under axial impact, Int. J. of Impact Engineering, vol.
24(10), p. 1083–1115
Karagiozova, D. and Jones, N. (2004), Dynamic buckling of elastic–plastic square
tubes under axial impact–II: structural response, Int. J. of Impact Engineering, vol.
30(2), p. 167–192
Kavi, H., Tasoy, A. K. and Guden, M. (2006), Predicting energy absorption in a
foam–filled thin–walled aluminium tube based on experimentally determined
strengthening coefficient, Materials & Design, vol. 27(4), p. 263–269
Kim, D. K., Lee, S. (1999), Impact energy absorption of 6061 aluminium extruded
tubes with different cross–sectional shapes, Materials & Design, vol. 20(1–5), p. 41–
49
Kooistra, G. W., Deshpande, V. S. and Wadley, H. N. G. (2004), Compressive
Behavior of Age Hardenable Tetrahedral Lattice Truss Structures Made from
Aluminium, Acta Mater, vol. 52, p. 4229–4237
Lampinen, B. E. and Jeryan, R. A. (1982), Effectiveness of polyurethane foam in
energy absorbing structures, SAE Technical Paper Series 820494
Langseth, M., Hopperstad, O. S. and Berstad, T. (1999), Crashworthiness of
aluminium extrusions: Validation of numerical simulation, effect of mass ratio and
impact velocity, Int. J. of Impact Engineering, vol. 22, p. 829–854
Lanzi, L., Castelletti, M. L. and Anghileri, M. (2004), Multi–objective optimisation
of composite absorber shape under crashworthiness requirements, Composite
Structures, vol. 65(3–4), p. 433–441
Liu, Y. (2008), Design optimisation of tapered thin–walled square tubes, Int. J. of
Crashworthiness, vol. 13(5), p. 543–550
LSTC (2007), LS–DYNA® Keyword Users' Manual V970, Livermore Software
Technology Corporation
Lu, G. and Yu, T. (2003), Energy absorption of structures and materials, Woodhead
Publishing Limited: Cambridge, UK
Mamalis, A.G. and Johnson, W. (1983), The quasi–static crumpling of thin–walled
circular cylinders and frusta under axial compression, Int. J. of Mechanical
Sciences, vol. 25(9–10), p. 713–732

141
Mamalis, A. G., Johnson, W. and Viegelahn, G. L. (1984), The crumpling of steel
thin–walled tubes and frusta under axial compression at elevated strain rates: some
experimental results, Int. J. of Mechanical Sciences, vol. 26, p. 537–548
Mamalis, A. G., Manolakos, D. E., Ioannidis, N. B. and Kostazos, P. K. (2005),
Numerical simulation of thin–walled metallic circular frusta subjected to axial
loading, Int. J. of Crashworthiness, vol. 10(5), p. 505–513
Mamalis, A. G., Manolakos, D. E., Ioannidis, M. B., Kostazos, P. K. and Dimitriou,
C. (2003), Finite element simulation of the axial collapse of metallic thin–walled
tubes with octagonal cross–section, Thin–Walled Structures, vol. 41(10), p. 891–900
Mamalis, A. G., Manolakos, D. E., Ioannidis, M. B., Kostazos, P. K. and Hassiotis,
G. (2001), Finite element simulation of the axial collapse of thin–wall square frusta.
Int. J. of Crashworthiness, vol. 6(2), p.155–164
Mamalis, A. G., Manolakos, D. E., Saigal, S., Viegelahn, G. and Johnson, W. (1986),
Extensible plastic collapse of thin–wall frusta as energy absorbers, Int. J. of
Mechanical Sciences, vol. 28(4), p. 219–229
Meguid, S. A., Attia, M. S., Stranart, J. C. and Wang, W. (2007), Solution stability in
the dynamic collapse of square aluminium columns, Int. J. of Impact Engineering,
vol. 34(2), p. 348–359
Meng, Q., Al–Hassani, S.T.S. and Soden, P.D. (1983), Axial crushing of square
tubes, Int. J. of Mechanical Sciences, vol. 25(9–10), p. 747–773
Mirfendereski, L., Salimi, M. and Ziaei–Rad, S. (2008), Parametric study and
numerical analysis of empty and foam–filled thin–walled tubes under static and
dynamic loadings, Int. J. of Mechanical Sciences, vol. 50(6), p. 1042–1057
Morris, E., Olabi, A. G. and Hashmi, M. S. J. (2006), Analysis of nested tube type
energy absorbers with different indenters and exterior constraints, J. of Thin–Walled
Structures, vol. 44, p. 872–885
Mosallam, A., Slenk, J., Kreiner, J. (2008), Assessment of Residual Tensile Strength
of Carbon/Epoxy Composites Subjected to Low-Energy Impact, J. of Aerospace
Eng., vol. 21, p. 249-258
Nagel, G. M. and Thambiratnam, D. P. (2005), Computer simulation and energy
absorption of tapered thin–walled rectangular tubes, Thin–Walled Structures, vol.
43(8), p. 1225–1242
Nagel, G. M. and Thambiratnam, D. P. (2006), Dynamic simulation and energy
absorption of tapered thin–walled tubes under oblique impact loading, Int. J. of
Impact Engineering, vol. 32(10), p. 1595–1620

142
Nariman–zadeh, N., Darvizeh, A. and Jamali, A. (2006), Pareto Optimisation of
Energy Absorption of Square Aluminium Columns Using Multi–Objective Genetic
Algorithms, Proceedings of the Institution of Mechanical Engineers, Part B: J. of
Engineering Manufacture, vol. 220(2), p. 213–224
Nettles, A. T., Douglas, M. J. (2000), A Comparison of Quasi-Static Indentation to
Low-Velocity Impact, NASA, Marshall Space Flight Center: Hanover, MD
Nowpada, S., Chirwa, E. C., Myler, P. and Matsika, E. (2010), Aluminium Egg-box
panel as an energy absorber for pedestrian protection, Advanced Engineering
Materials, vol. 12(7), p. 591–595
Nowpada, S., Yang, Y., Chirwa, E. C., Myler, P., Matsika, E. and Qian, P. (2010),
Aluminium egg-box energy absorber in a commercial vehicle front for pedestrian
protection: Energy absorption capability, Proc. of The Int. Crashworthiness
Conference, ICRASH2010 Washington, Edited by E C Chirwa, C-D (Steve) Kan,
The National Conference Center: Leesburg, VA, USA
Nowpada, S., Chirwa, E. C., Myler, P., Chinnaswamy, G. K. and Matsika, E. (2009),
Egg-box panel for commercial vehicle front – compressive loading tests, Int. J.
Crashworthiness, vol. 15(1), p. 59–70
Nowpada, S., Chirwa, E. C., Myler, P., Chinnaswamy, G. K. and Matsika, E. (2008),
Egg-box panel for commercial vehicle front, Proc. of The Int. Crashworthiness
Conference, ICRASH2008 Edited by E C Chirwa, H Hamada and K Mizuno, Kyoto
Institute of Technology: Kyoto, Japan
Olabi, A. G., Morris, E., Hashmi, M. S. J. and Gilchrist M. D. (2008), Optimised
design of nested oblong tube energy absorbers under lateral impact loading, Int. J.
of Impact Engineering, vol. 35, p. 10–26
Otubushin, A. (1998), Detailed validation of a non–linear finite element code using
dynamic axial crushing of a square tube, Int. J. of Impact Engineering, vol. 21(5), p.
349–368
Peroni, L., Avalle, M. and Belingardi, G. (2009), Comparison of the energy
absorption capability of crash boxes assembled by spot–weld and continuous joining
techniques, Int. J. of Impact Engineering, vol. 36(3), p. 498–511
Prasad, G. L. E. and Gupta, N. K. (2005), An experimental study of deformation
modes of domes and large–angled frusta at different rates of compression, Int. J. of
Impact Engineering, vol. 32(1–4), p. 400–415
Preece, B. W. (1911), Sand for Brass Molding, The Foundry; University of
Michigan, Cleveland, Ohio, vol. 38(2), p. 83–87

143
Qiao, P., Yang, M. and Bobaru, F. (2008), Impact Mechanics and High–Energy
Absorbing Materials: Review, J. of Aerospace Engineering, vol. 21(4), p. 235–24
Reid, S. R. (1993), Plastic deformation mechanisms in axially compressed metal
tubes used as impact energy absorbers, Int. J. of Mechanical Sciences, vol. 35(12), p.
1035–1052
Reid, S. R. and Reddy, T. Y. (1986), Static and dynamic crushing of tapered sheet
metal tubes of rectangular cross–section, Int. J. of Mechanical Sciences, vol. 28(9),
p. 623–637
Reyes, A., Hopperstad, O. S., Berstad, T., Hanssen, A. G. and Langseth, M. (2003),
Constitutive modelling of aluminium foam including fracture and statistical variation
of density, European J. of Mechanics – A/Solids, vol. 22(6), p. 815–835
Reyes, A., Hopperstad, O. S. and Langseth, M. (2004), Aluminium foam–filled
extrusions subjected to oblique loading: experimental and numerical study, Int. J. of
Solids and Structures, vol. 41(5–6), p. 1645–1675
Santosa, S. P. and Wierzbicki, T. (1998), Crash behaviour of box columns filled with
aluminium honeycomb or foam, Computers & Structures, vol. 68(4), p. 343–367
Santosa, S. P., Wierzbicki, T., Hanssen, A. G. and Langseth, M. (2000),
Experimental and numerical studies of foam–filled sections, Int. J. of Impact
Engineering, vol. 24(5), p. 509–534
Schneider, F. and Jones, N. (2008), Observations on the design and modelling of
some joined thin-walled structural sections, Thin-Walled Structures, vol. 46(7–9), p.
887–897
Seitzberger, M., Rammerstorfer, F. G., Gradinger, R., Degischer, H. P., Blaimschein,
M. and Walch, C. (2000), Experimental studies on the quasi–static axial crushing of
steel columns filled with aluminium foam. Int. J. of Solids and Structures, vol. 37(30),
p. 4125–4147
Shariatpanahi, M., Masoumi, A. and Ataei, A. (2008), Optimum design of partially
tapered rectangular thin–walled tubes in axial crushing, Proceeding of the
Institution of Mechanical Engineers Part B–J. of Engineering Manufacture, vol.
222(2), p. 285– 291
Sheh, M. Y., Reid, J. D., Lesh, S. M. and Cheva, M. (1992), Vehicle crashworthiness
analysis using numerical and experimental method, Int. Conference on Vehicle
Structural Mechanics and CAE, Warrendale, Society of Automotive Engineering Inc

144
Sheriff, N. M., Gupta, N. K., Velmurugan, R. and Shanmugapriyan, N. (2008),
Optimisation of thin conical frusta for impact energy absorption, Thin–Walled
Structures, vol. 46(6), p. 653–666
Sherwood, J. A. and Frost, C. C. (1992), Constitutive Modelling and Simulation of
Energy Absorbing Polyurethane Foam under Impact Loading, Polymer Engineering
and Science, vol. 32(16), p. 1138–1146
Shetty, S. K. (2001), Finite Element Modelling of Energy Absorption Characteristics
of Hybrid Structures – Composite Wrapped on a Square Metal Tube, B.Eng Thesis,
Mysore University: India
Singace, A. A., El–Sobky, H. and Petsios, M. (2001), Influence of end constraints on
the collapse of axially impacted frusta, Thin–Walled Structures, vol. 39(5), p. 415–
428
Song, H. W., Fan, Z. H., Yu, G., Wang, Q. C. and Tobota, A. (2005), Partition
energy absorption of axially crushed aluminium foam–filled hat sections, Int. J. of
Solids and Structures, vol. 42(9–10), p. 2575–260
Spagnoli, A. and Chryssanthopoulos, M. K. (1999), Elastic buckling and
postbuckling behaviour of widely–stiffened conical shells under axial compression,
Engineering Structures, vol. 21(9), p. 845–855
Subhash, G., Liu, Q., Gao, X. (2006), Quasistatic and high strain rate uniaxial
compressive response of polymeric structural foams, Int. J. of Impact Eng., vol.
32(7), p. 1113–1126
Tan, H. and Qu, S. (2009), Impact of Cellular Materials, Lecture note, International
Centre for Mechanical Sciences, Udine, Italy, 28 Sept – 2 Oct
Tarigopula, V., Langseth, M., Hopperstad, O. S. and Clausen, A. H. (2006), Axial
crushing of thin–walled high–strength steel sections, Int. J. of Impact Engineering,
Int. Symposium on the Crashworthiness of Light–weight Automotive Structures, vol.
32(5), p. 847–882
Toksoy, A. K. and Guden, M. (2005), The strengthening effect of polystyrene foam
filling in aluminium thin–walled cylindrical tubes, Thin–Walled Structures, vol.
43(2), p. 333–350
Triantafillou, T. C. and Gibson, L. J. (1989), Debonding in Foam Core Sandwich
Panels, Material Structures, vol. 22, p. 64–89
Ulker, M. B. C. and Rahman, M. S. (2008), Traffic Barriers under Vehicular Impact:
From Computer Simulation to Design Guidelines, J. of Computer–Aided Civil and
Infrastructure Engineering, vol. 23, p. 465–480

145
USA Department of Defence (1966), Aluminum and Aluminum Alloys, Military
Standardization Handbook: Washington, DC
Vanderplaats, G. N. (2007), Multidiscipline Design Optimisation, Vanderplaatz
R&D, Inc.
Wadley, H. N. G., Fleck, N. A. and Evans, A. G. (2003), Fabrication and Structural
Performance of Periodic Cellular Metal Sandwich Structures, Compos Sci Tech, vol.
63, p. 2331–2343
Walter, P. L. (2007), Selecting Accelerometers for Mechanical Shock Measurements,
Sound and Vibration, vol. 41(12), p. 14–18
White, M. and Jones, N. (1999), Experimental quasi–static axial crushing of top–hat
and double–hat thin–walled sections, Int. J. of Mechanical Sciences, vol. 41, p. 179–
208
WHO (2004), World Report on Road Traffic Injury Protection, World Health
Organisation Library Cataloguing–in–Publication Data
Wierzbicki, T. and Abramowicz, W. (1983), On the crushing mechanics of thin–
walled structures, J. of Applied Mechanics, vol. 50, p. 727–734
Witteman, W. J., Kriens, R. F. C. (1998), Modelling of an Innovative Frontal Car
Structure: Similar Deceleration Curves at Full Overlap, 40 per cent Offset and 30
Degrees Collisions, Proceedings of the Sixteenth Int. Technical Conference on the
Enhanced Safety of Vehicles (ESV), Paper 98–S1–O–04, p. 194–212: Windsor,
Canada
Wu, E. and Jiang, W. (1996), Axial crush of Metallic Honeycombs, Pergamon, Int. J.
of Impact Engineering, vol. 19(5–6), p. 439–456
Yamazaki, K. and Han, J. (2000) Maximization of the crushing energy absorption of
cylindrical shells, Advances in Engineering Software, vol. 31, p. 425–434
Yan, W. Y., Durif, E., Yamada, Y. and Wen, C. (2007), Crushing simulation of
foam– filled aluminium tubes, Materials Transactions, vol. 48(7), p. 1901–1906
Yoo, S. H., Chang, S. H. and Sutcliffe, M. P. F. (2010), Compressive characteristics
of foam–filled composite egg–box sandwich panels as energy absorbing structures, J.
of Composites, Part A, vol. 41, p. 427–434
Yuen, S. C. K., Nurick, G. N. and Starke, R. A. (2008), The energy absorption
characteristics of double–cell tubular profiles, Latin American J. of Solids and
Structures, vol. 5(4), p. 289–317

146
Zarei, H. R. and Kroger, M. (2006), Multiobjective crashworthiness optimisation of
circular aluminium tubes, Thin–Walled Structures, vol. 44(3), p. 301–308
Zarei, H. R. and Kroger, M. (2008), Optimisation of the foam–filled aluminium tubes
for crush box application, Thin–Walled Structures, vol. 46(2), p. 214–221
Zhang, X., Cheng, G. and Zhang, H. (2009), Numerical investigations on a new type
of energy–absorbing structure based on free inversion of tubes, Int. J. of Mechanical
Sciences, vol. 51, p. 64–76
Zhang, Z., Liu, Sh. and Tang, Z. (2010), Crashworthiness investigation of kagome
honeycomb sandwich cylindrical column under axial crushing loads, J. of Thin–
Walled Structures, vol. 48, p. 9–18
Zini, G. (2005), Reduction of crash severity through in–vehicle systems (IVS) speed
Control, In: 19th
Int. Technical Conference on The Enhanced Safety of Vehicles,
June 2005, Washington DC
Zupan, M., Chen, C. and Fleck, N. A. (2003), The plastic collapse and energy
absorption capacity of egg–box panels, Int. J. of Mechanical Sciences, vol. 45(5), p.
851–871

147
BIBLIOGRAPHY
Abramowicz, W. (2003), Thin–walled structures as impact energy absorbers, Thin–
Walled Structures, vol. 41(2–3), p. 91–107
Abramowicz, W. and Jones, N. (1984), Dynamic axial crushing of square tubes, Int.
J. of Impact Engineering, vol. 2(2), p. 179–208.
Abramowicz, W. and Jones, N. (1986), Dynamic progressive buckling of circular
and square tubes, Int. J. of Impact Engineering, vol. 4(4), p. 243–270
Abramowicz, W. and Wierzbicki, T. (1989), Axial Crushing of Multicorner Sheet
Metal Columns, J. of Applied Mechanics, Transactions ASME, vol. 56, p. 113–120
Ahmad, Z. (2009), Impact and energy absorption of empty and foam–filled conical
tubes, PhD thesis, Queensland University of Technology
Akisanya, A. R. and Fleck, N. A. (2006), Plastic collapse of thin–walled frusta and
egg–box material under shear and normal loading, Int. J. of Mechanical Sciences,
vol. 48(7), p. 799–808
Aktay, L., Toksoy, A. K. and Guden, M. (2006), Quasi–static axial crushing of
extruded polystyrene foam–filled thin–walled aluminium tubes: Experimental and
numerical analysis, Materials & Design, vol. 27(7), p. 556–565
Al–asady, N. A., Abdullah, S., Ariffin, A. K., Bedan, S. M. and Rahman, M. M.
(2009), Comparison between experimental road data and finite element analysis data
for automotive lower suspension arm, European J. of Scientific Research, vol. 29(4),
p. 557–571
Alexander, J. M. (1960), An approximate analysis of the collapse of thin cylindrical
shells under axial loading, Quart. J. Mechanics. and Applied Mathematics, vol. 13,
p. 1–9
Alghamdi, A. A. A. (2001), Collapsible impact energy absorbers: an overview,
Thin–Walled Structures, vol. 29, p. 189–213
Alghamdi, A. A., EL–Kalay, A. K., Mansour T. M. and Akyurt, M. (1992),
Absorption of energy by frusta, J. Islamic Acad Sci, pp. 14–20
Aljawi, A. A. N. (2000), Finite element and experimental analysis of axially
compressed plastic tubes, European J. of Mechanical and Environmental
Engineering, vol. 45 (1), p. 3–10
ANSYS® 13.0 Help System (2010), Mechanical Analysis User Guide, ANSYS Inc
ANSYS/LS–DYNA® (2011), ANSYS/LS–DYNA User’s Guide, ANSYS Inc

148
ANSYS/LS–DYNA® Introduction, ANSYS Website, accessed March 2011:
http://www.ansys.com/products/%20lsdyna.asp
Arriaga, A., Pagaldai, R., Zaldua, A. M., Chrysostomou, A. and O'Brien, M. (2010),
Impact testing and simulation of a polypropylene component. Correlation with strain
rate sensitive constitutive models in ANSYS and LS–DYNA, Polymer Testing, vol.
29(2), p. 170–180
Asadi, M., Walker, B. and Shirvani, H. (2009), An Investigation to Compare the
Application of Shell and Solid Element Honeycomb Model in ODB, 7th European
LS–DYNA Conf.
Asadi, M., Walker, B. and Shirvani, H. (2008a), Development of the Advanced Finite
Element Model for ODB Impact Barrier, LS–DYNA User Conf.: Japan
Asadi, M., Walker, B. and Shirvani, H. (2008b), New Finite Element Model for
NHTSA Impact Barrier, 10th Int. LS–DYNA Users Conf.
Asadi, M., Walker, B. and Shirvani, H. (2007a), Evaluation of New Finite Element
Model for IIHS Side Impact Barrier, LS–DYNA User Conf.: Japan
Asadi, M., Tattersall, P., Walker, B. and Shirvani, H. (2007b), Advanced Finite
Element Model for AE–MDB Side Impact Barrier, 6th European LS–DYNA User
Conf.
Asadi, M., Shirvani, H., Sanaei, E. and Ashmead, M. (2006), A Simplified Model to
Simulate Crash Behaviour of Honeycomb, Proceedings of the Int. conf. on Advanced
Design and Manufacture: China
Asavavisithchai, S., Slater, D. and Kennedy, A. R. (2004), Effect of tube length on
the bucking mode and energy absorption of Al foam–filled tubes, J. of Materials
Science, vol. 39(24), p. 7395–7396
Ashby, M. F., Evans, A. G., Fleck, N. A., Gibson, L. J., Hutchinson, J. W. and
Wadley, H. G. (2000), Metal foams: a design guide, Butterworth–Heinemann:
Boston, MA, USA
Ashmead, M. (2000), Energy–absorbing structures Int. Patent, Serial No. WO
00/31434
Ashmead, M., Bedus, S. and Bradley, S. (2000), Advanced Materials for Enhanced
Automotive Safety, Automotive Composites and Plastics Conf.
Avalle, M., Belingardi, G., Ibba, A. (2007), Mechanical models of cellular solids:
Parametres identification from experimental tests, Int. J. of Impact Engineering, vol.
34(1), p. 3–27
149
Avalle, M., Chiandussi, G., and Belingardi, G. (2002), Design optimisation by
response surface methodology: Application to crashworthiness design of vehicle
structures, Structural and Multidisciplinary Optimisation, vol. 24, p. 325–332
Banhart, J. (2001), Manufacture, characterisation and application of cellular metals
and metal foams, Progress in Materials Science, vol. 46(6), p. 559–632
Bardi, F. C., Yun, H. D. and Kyriakides, S. (2003), On the axisymmetric progressive
crushing of circular tubes under axial compression, Int. J. of Solids and Structures,
vol. 40, p. 3137–3155
Birch, R. S. and Jones, N. (1990), Dynamic and static axial crushing of axially
stiffened cylindrical shells, Thin–Walled Structures, vol. 9, p. 29–60
Belytschko, T. B. and Tsay, T. S. (1983), A stabilization procedure for the
quadrilateral plate element with one–point quadrature, Int. J. of Numerical Methods
in Engineering, vol. 19, p. 405–419
Belytschko, T. B., Lin, J. I. and Tsay, C. S. (1984), Explicit algorithms for the
nonlinear dynamics of shells, Computer Methods in Applied Mechanics and
Engineering, vol. 42, p. 225–251
Borvik, T., Hopperstad, O. S., Reyes, A., Langseth, M., Solomos, G. and Dyngeland,
T. (2003), Empty and foam–filled circular aluminium tubes subjected to axial and
oblique quasi–static loading, Int. J. of Crashworthiness, vol. 8 (5), p. 481– 494
Box, G. E. P. and Wilson, K.B. (1951), On the Experimental Attainment of Optimum
Conditions (with discussion), J. of the Royal Statistical Society, Series B, vol. 13(1),
p. 1–45
Brown, J., C. (2002), Introduction to the Basic Principles of Crashworthiness,
Cranfield University: Bedfordshire
Calladine, C. R. (1986), Analysis of large plastic deformations in shell structures,
Inelastic Behaviour of Plates and Shells (IUTAM Symposium, Rio de Janeiro, 1985),
ed. L. Bevilacqua et al., Springer, Berlin, p. 69–101
Calladine, C. R. and English, R. W. (1984), Strain–rate and Inertia Effects in the
Collapse of Two Types of Energy–absorbing Structure, Int. J. of Mechanical Science,
vol. 26(11–12), p. 689–701
CARE (EU road accidents database) or national publications (2011), Road safety
evolution in EU, European Commission Road Safety, Directorate General Energy
and Transport

150
Chen, C., Harte, A. M. and Fleck, N. A. (2001), The plastic collapse of sandwich
beams with a metallic foam core, Int. J. of Mechanical Sciences, vol. 43, p. 1483–
1506
Chen, C., Lu, T. J. and Fleck, N. A. (1999), Effect of imperfections on the yielding of
two–dimensional foams, J. of the Mechanics and Physics of Solids, vol. 47(11), p.
2235–2272
Cheon, S. S. and Meguid, S. A. (2004), Crush behaviour of metallic foams for
passenger car design, Int. J. of Automotive Technology, vol. 5(1), p. 47–53
Choi, K. K. and Youn, B. D. (2002), An investigation of nonlinearity of reliability–
based design optimisation approaches, In: 28th Design Automation Conf., Sep 29–
Oct 2 2002, Montreal, Que., Canada
Chung, J. G., Chang, S. H., Sutcliffe, M. P. F. (2007), Deformation and energy
absorption of composite egg–box panels, J. of Composites Science and Technology,
vol. 67, p. 2342–2349
Commission of the European Communities (2001), European transport policy for
2010: time to decide, White Paper: Brussels
Deb, A., Mahendrakumar, M.S., Chavan, C., Karve, J., Blankenburg, D. and Storen,
S. (2004), Design of an aluminium–based vehicle platform for front impact safety,
Int. J. of Impact Engineering, vol. 30(8–9), p. 1055–1079
Department for Transport (DfT) (2011), Heavy Goods Vehicle Inspection Manual,
Consolidated Edition
Deqiang, S., Weihong, Zh., Yanbin, W. (2010), Mean out–of–plane dynamic plateau
stresses of hexagonal honeycomb cores under impact loadings, Composite
Structures, vol. 92(11), p. 2609–2621
Deshpande, V. S. and Fleck, N. A. (2000), High strain rate compressive behaviour of
aluminium alloy foams, Int. J. Impact Eng, vol. 24, p. 277–298
Deshpande, V. S. and Fleck, N. A. (2000), Isotropic constitutive models for metallic
foams, J. of the Mechanics and Physics of Solids, vol. 48(6–7), p. 1253–1283
Deshpande, V. S., Fleck, N. A., (2001), Collapse of truss core sandwich beams in 3–
point bending, Int. J. Solids Structures, vol. 38(36–37), p. 6275–6305
Deshpande, V. S. and Fleck, N. A. (2003), Energy absorption of an egg–box
material, J. of the Mechanics and Physics of Solids, vol. 51(1), p. 187–208
Du Bois, P., Chou, C. C., Fileta, B. B., Khalil, T. B., King, A. I., Mahmood, H. F.,
Mertz, H. J. and Wismans, J. (2004), Vehicle Crashworthiness and Occupant

151
Protection, Sponsored by Automotive Applications Committee, American Iron and
Steel Institute: Southfield, Michigan
El–Hage, H., Mallick, P. K. and Zamani, N. (2005), A numerical study on the quasi–
static axial crush characteristics of square aluminium tubes with chamfering and
other triggering mechanisms, Int. J. of Crashworthiness, vol. 10(2), p. 183– 195
El–Sobky, H., Singace, A. A. and Petsios, M. (2001), Mode of collapse and energy
absorption characteristics of constrained frusta under axial impact loading, Int. J. of
Mechanical Sciences, vol. 43(3), p. 743–757
Ellert, G. (1998–2008), The Physics Hypertextbook, Physics.info 2010: New York
European Commissions (EC) (2003), Saving 20000 Lives on Our Roads, Office for
Official Publications of the European Communities: Luxembourg
Evans, A. G. (2001), Lightweight Materials and Structures, MRS Bull vol. 790
Farley, G. L. (1986), Effect of Specimen Geometry on the Energy Absorption
Capability of Composite Materials, J. of Composite Materials, vol. 20, p. 390–400
Finn, S. R., Springer, G. S. (1991), Composite Plates Impact Damage: An Atlas,
Research supported by NASA, Technomic Publishing Co: Lancaster: PA
Fleck, N. A. (2001), Multi-Axial Strength of Metallic Foams and Lattice Materials, J.
of JSMS: Materials Science for the 21st Century, vol. A, p. 336-340
Fyllingen, Ø., Hopperstad, O. S. and Langseth, M. (2009), Robustness study on the
behaviour of top–hat thin–walled high–strength steel sections subjected to axial
crushing, Int. J. of Impact Engineering, vol. 36(1), p. 12–24
Gameiro, C. P. and Cirne, J. (2007), Dynamic axial crushing of short to long circular
aluminium tubes with agglomerate cork filler, Int. J. of Mechanical Sciences, vol.
49(9), p. 1029–1037
Garg, M., Abdi, F., Zammit, A., Bayandor, J., Suh, Y., Song, S. (2011), Impact
Damage Resistance and Compression–After–Impact Strength of Sandwich
Composites with Graphite–Epoxy Facesheets and Nomex Honeycomb Core,
Technical Paper (ONLINE): http://www.sampe.org/store/paper.aspx?pid=5681
(Accessed 06 September 2010)
Gibson, L. J. and Ashby, M. F. (1997), Cellular Solids, Structure and Properties,
2nd ed., Cambridge University Press: Cambridge, UK
Grzebeita, R. H. (1990), An alternate method for determining the behaviour of round
stocky tubes subjected to an axial crush load, Thin–Walled Structures, vol. 9, p. 61–
69

152
Gupta, N. K., Easwara Prasad, G. L. and Gupta, S. K. (1997), Plastic collapse of
metallic conical frusta of large semi–apical angles, Int. J. of Crashworthiness, vol. 2,
p. 349–366
Gupta, N. K., Mohamed Sheriff, N. and Velmurugan, R. (2008), Experimental and
theoretical studies on buckling of thin spherical shells under axial loads, Int. J. of
Mechanical Sciences, vol. 50(3, p.: 422–432
Gupta, N. K. and Velmurugan, R. (1999), Axial compression of empty and foam
filled composite conical shells, J. of Composite Materials, vol.33(6), p. 567–591
Gupta, N. K. and Venkatesh (2006), A study of the influence of diametre and wall
thickness of cylindrical tubes on their axial collapse, Thin–Walled Structures, vol.
44(3), p. 290–300
Gupta, N. K. and Venkatesh (2007), Experimental and numerical studies of impact
axial compression of thin–walled conical shells, Int. J. of Impact Engineering, vol.
34(4), p. 708–720
Hallquist, J. O. (2006), LS–DYNA® Theory Manual, Livermore Software
Technology Corporation
Hamada, H. and Ramakrishna, S. (1997) Fem method for prediction of energy
absorption capability of crashworthy polymer composite materials, J. of Reinforced
Plastics and Composites, vol. 16, p. 226–242
Hanssen, A. G.; Langseth, M. and Hopperstad, O. S. (1999), Static crushing of
square aluminium extrusions with aluminium foam filler, Int. J. Mechanical
Engineering, vol. 41(8), p. 967–993
Hanssen, A. G., Langseth, M. and Hopperstad, O. S. (2000a), Static and dynamic
crushing of circular aluminium extrusions with aluminium foam filler, Int. J. of
Impact Engineering, vol. 24(5), p. 475–507
Hanssen, A. G., Langseth, M. and Hopperstad, O. S. (2000b), Static and dynamic
crushing of square aluminium extrusions with aluminium foam filler, Int. J. of Impact
Engineering, vol. 24(4), p. 347–383
Hanssen, A. G., Langseth, M. and Hopperstad, O. S. (2001), Optimum design for
energy absorption of square aluminium columns with aluminium foam filler, Int. J. of
Mechanical Sciences, vol. 43(1), p. 153–176
Harte, A. M., Fleck, N. A. and Ashby, M. F. (2000), Energy absorption of foam–
filled circular tubes with braided composite walls, Eur. J. Mechanics – A/Solids,
vol.19, p. 31–50

153
Hartmann, F. and Katz, C. (2007), Structural analysis with finite elements, Springer:
Berlin
Hibbeler, R. C. (2002), Structural Analysis, Fifth Edition, Prentice Hall, Upper
Saddle River: New Jersey
Hibbitt, Karlsson and Sorensen Inc. (HKS) (2002), Getting Started with
ABAQUS/Standard Version 6.3, Pawtucket, USA: HKS
Higashi, K., Mukai, T., Kaizu, K., Tsuchida S. and Tanimura, S. (1991), Strain rate
dependence on mechanical properties is some commercial aluminium alloys, J Phys
III, vol. 1
Housner, G. W. and Vreeland, T. Jr. (1965), The Analysis of Stress and Deformation,
California Institute of Technology: Pasadena, CA
Iyengar, N.G.R. and Gupta, S. K. (1980), Structural Design Optimisation, East West
Press: New Delhi
Jacobsen, A. J., Kolodziejska, J. A., Doty, R., Fink, K. D., Zhou, C., Roper, C. S. and
Carter, W. B. (2010), Interconnected Self-Propagating Photopolymer Waveguides:
An Alternative to Stereolithography for Rapid Formation of Lattice-Based Open-
Cellular Materials, Twenty First Annual International Solid Freeform Fabrication
Symposium - An Additive Manufacturing Conference: University of Texas, Austin
Jeon, I., Asahina, T., Kang, K. J., Im, S. and Lu, T. J. (2010), Finite element
simulation of the plastic collapse of closed–cell aluminium foams with X–ray
computed tomography, J. of Mechanics of Materials, vol. 42, p. 227–236
Johnson, W. and Mamalis, A. G. (1978), Crashworthiness of vehicles, Mechanical
Engineering Publications Ltd: London
Jones, N. (1989), Structural Impact, Cambridge University Press: Cambridge, UK
Jones, N. (2003), Several phenomena in structural impact and structural
crashworthiness, Euro. J. of Mechanics – A/Solids General and plenary lectures from
the 5th EUROMECH Solid Mechanics Conference, vol. 22(5), p. 693–707
Jones, D. L. and Miraj, R. (1995), Analytical and Numerical Evaluations of the
Biaxial Strength of Composite Laminated Circular Sandwich Panels, Second
International Conference on Composites Engineering, ICCE/2: New Orleans
Karagiozova, D., Alves, M. and Jones, N. (2000), Inertia effects in axisymmetrically
deformed cylindrical shells under axial impact, Int. J. of Impact Engineering, vol.
24(10), p. 1083–1115

154
Karagiozova, D. and Jones, N. (2004), Dynamic buckling of elastic–plastic square
tubes under axial impact–II: structural response, Int. J. of Impact Engineering, vol.
30(2), p. 167–192
Kavi, H., Tasoy, A. K. and Guden, M. (2006), Predicting energy absorption in a
foam–filled thin–walled aluminium tube based on experimentally determined
strengthening coefficient, Materials & Design, vol. 27(4), p. 263–269
Kim, D. K., Lee, S. (1999), Impact energy absorption of 6061 aluminium extruded
tubes with different cross–sectional shapes, Materials & Design, vol. 20(1–5), p. 41–
49
Kooistra, G. W., Deshpande, V. S. and Wadley, H. N. G. (2004), Compressive
Behavior of Age Hardenable Tetrahedral Lattice Truss Structures Made from
Aluminium, Acta Mater, vol. 52, p. 4229–4237
Lampinen, B. E. and Jeryan, R. A. (1982), Effectiveness of polyurethane foam in
energy absorbing structures, SAE Technical Paper Series 820494
Langseth, M., Hopperstad, O. S. and Berstad, T. (1999), Crashworthiness of
aluminium extrusions: Validation of numerical simulation, effect of mass ratio and
impact velocity, Int. J. of Impact Engineering, vol. 22, p. 829–854
Lanzi, L., Castelletti, M. L. and Anghileri, M. (2004), Multi–objective optimisation
of composite absorber shape under crashworthiness requirements, Composite
Structures, vol. 65(3–4), p. 433–441
Liu, Y. (2008), Design optimisation of tapered thin–walled square tubes, Int. J. of
Crashworthiness, vol. 13(5), p. 543–550
LSTC (2007), LS–DYNA® Keyword Users' Manual V970, Livermore Software
Technology Corporation
Lu, G. and Yu, T. (2003), Energy absorption of structures and materials, Woodhead
Publishing Limited: Cambridge,UK
Mahdi, E., Hamouda, A. S. A. and Sen, A. C. (2004), Quasi–Static Crushing
Behaviour of Hybrid and Non–Hybrid Natural Fiber Composite Solid Cones,
Composite Structures, vol. 66(1–4), p. 647–663
Mamalis, A. G. and Johnson, W. (1983), The quasi–static crumpling of thin–walled
circular cylinders and frusta under axial compression, Int. J. of Mechanical
Sciences, vol. 25(9–10), p. 713–732
Mamalis, A. G., Johnson, W. and Viegelahn, G. L. (1984), The crumpling of steel
thin–walled tubes and frusta under axial compression at elevated strain rates: some
experimental results, Int. J. of Mechanical Sciences, vol. 26, p. 537–548
155
Mamalis, A. G., Manolakos, D. E., Ioannidis, N. B. and Kostazos, P. K. (2005),
Numerical simulation of thin–walled metallic circular frusta subjected to axial
loading, Int. J. of Crashworthiness, vol. 10(5), p. 505–513
Mamalis, A. G., Manolakos, D. E., Ioannidis, M. B., Kostazos, P. K. and Dimitriou,
C. (2003), Finite element simulation of the axial collapse of metallic thin–walled
tubes with octagonal cross–section, Thin–Walled Structures, vol. 41(10), p. 891–900
Mamalis, A. G., Manolakos, D. E., Ioannidis, M. B., Kostazos, P. K. and Hassiotis,
G. (2001), Finite element simulation of the axial collapse of thin–wall square frusta.
Int. J. of Crashworthiness, vol. 6(2), p.155–164
Mamalis, A. G., Manolakos, D. E., Saigal, S., Viegelahn, G. and Johnson, W. (1986),
Extensible plastic collapse of thin–wall frusta as energy absorbers, Int. J. of
Mechanical Sciences, vol. 28(4), p. 219–229
Meguid, S. A., Attia, M. S., Stranart, J. C. and Wang, W. (2007), Solution stability in
the dynamic collapse of square aluminium columns, Int. J. of Impact Engineering,
vol. 34(2), p. 348–359
Meng, Q., Al–Hassani, S.T.S. and Soden, P.D. (1983), Axial crushing of square
tubes, Int. J. of Mechanical Sciences, vol. 25(9–10), p. 747–773
Miraj, R. (2005), An Investigation of The Nonlinear Bending Of Unsymmetrical,
Dissimilar Orthotropic Circular & Rectangular Sandwich Plates, Composites Part B
Mirfendereski, L., Salimi, M. and Ziaei–Rad, S. (2008), Parametric study and
numerical analysis of empty and foam–filled thin–walled tubes under static and
dynamic loadings, Int. J. of Mechanical Sciences, vol. 50(6), p. 1042–1057
Moaveni, S. (1999), Finite Element Analysis: Theory and Application with ANSYS,
1st Edition, Prentice Hall, Upper Saddle River: New Jersey
Morris, E., Olabi, A. G. and Hashmi, M. S. J. (2006), Analysis of nested tube type
energy absorbers with different indenters and exterior constraints, J. of Thin–Walled
Structures, vol. 44, p. 872–885
Mosallam, A., Slenk, J., Kreiner, J. (2008), Assessment of Residual Tensile Strength
of Carbon/Epoxy Composites Subjected to Low-Energy Impact, J. of Aerospace
Eng., vol. 21, p. 249-258
Nagel, G. M. and Thambiratnam, D. P. (2005), Computer simulation and energy
absorption of tapered thin–walled rectangular tubes, Thin–Walled Structures, vol.
43(8), p. 1225–1242

156
Nagel, G. M. and Thambiratnam, D. P. (2006), Dynamic simulation and energy
absorption of tapered thin–walled tubes under oblique impact loading, Int. J. of
Impact Engineering, vol. 32(10), p. 1595–1620
Nariman–zadeh, N., Darvizeh, A. and Jamali, A. (2006), Pareto Optimisation of
Energy Absorption of Square Aluminium Columns Using Multi–Objective Genetic
Algorithms, Proceedings of the Institution of Mechanical Engineers, Part B: J. of
Engineering Manufacture, vol. 220(2), p. 213–224
Nettles, A. T., Douglas, M. J. (2000), A Comparison of Quasi-Static Indentation to
Low-Velocity Impact, NASA, Marshall Space Flight Center: Hanover, MD
Nowpada, S., Chirwa, E. C., Myler, P. and Matsika, E. (2010), Aluminium Egg-box
panel as an energy absorber for pedestrian protection, Advanced Engineering
Materials, vol. 12(7), p. 591–595
Nowpada, S., Yang, Y., Chirwa, E. C., Myler, P., Matsika, E. and Qian, P. (2010),
Aluminium egg-box energy absorber in a commercial vehicle front for pedestrian
protection: Energy absorption capability, Proc. of The Int. Crashworthiness
Conference, ICRASH2010 Washington, Edited by E C Chirwa, C-D (Steve) Kan,
The National Conference Center: Leesburg, VA, USA
Nowpada, S., Chirwa, E. C., Myler, P., Chinnaswamy, G. K. and Matsika, E. (2009),
Egg-box panel for commercial vehicle front – compressive loading tests, Int. J.
Crashworthiness, vol. 15(1), p. 59–70
Nowpada, S., Chirwa, E. C., Myler, P., Chinnaswamy, G. K. and Matsika, E. (2008),
Egg-box panel for commercial vehicle front, Proc. of The Int. Crashworthiness
Conference, ICRASH2008 Edited by E C Chirwa, H Hamada and K Mizuno, Kyoto
Institute of Technology: Kyoto, Japan
Olabi, A. G., Morris, E., Hashmi, M. S. J. and Gilchrist M.D. (2008), Optimised
design of nested oblong tube energy absorbers under lateral impact loading, Int. J.
of Impact Engineering, vol. 35, p. 10–26
Otubushin, A. (1998), Detailed validation of a non–linear finite element code using
dynamic axial crushing of a square tube, Int. J. of Impact Engineering, vol. 21(5), p.
349–368
Peroni, L., Avalle, M. and Belingardi, G. (2009), Comparison of the energy
absorption capability of crash boxes assembled by spot–weld and continuous joining
techniques, Int. J. of Impact Engineering, vol. 36(3), p. 498–511
Prasad, G. L. E. and Gupta, N. K. (2005), An experimental study of deformation
modes of domes and large–angled frusta at different rates of compression, Int. J. of
Impact Engineering, vol. 32(1–4), p. 400–415
157
Preece, B. W. (1911), Sand for Brass Molding, The Foundry; University of
Michigan, Cleveland, Ohio, vol. 38(2), p. 83–87
Qiao, P., Yang, M. and Bobaru, F. (2008), Impact Mechanics and High–Energy
Absorbing Materials: Review, J. of Aerospace Engineering, vol. 21(4), p. 235–24
Qiao, P., Yang, M. and Mosallam, A. (2004), Impact analysis of I-Lam sandwich
system for over-height collision protection of highway bridges, J. of Engineering
Structures, vol.26(7), p.1003–1012
Reid, S. R. (1993), Plastic deformation mechanisms in axially compressed metal
tubes used as impact energy absorbers, Int. J. of Mechanical Sciences, vol. 35(12), p.
1035–1052
Reid, S. R. and Reddy, T. Y. (1986), Static and dynamic crushing of tapered sheet
metal tubes of rectangular cross–section, Int. J. of Mechanical Sciences, vol. 28(9),
p. 623–637
Reyes, A., Hopperstad, O. S., Berstad, T., Hanssen, A. G. and Langseth, M. (2003),
Constitutive modelling of aluminium foam including fracture and statistical variation
of density, European J. of Mechanics – A/Solids, vol. 22(6), p. 815–835
Reyes, A., Hopperstad, O. S. and Langseth, M. (2004), Aluminium foam–filled
extrusions subjected to oblique loading: experimental and numerical study, Int. J. of
Solids and Structures, vol. 41(5–6), p. 1645–1675
Santosa, S. P. and Wierzbicki, T. (1998), Crash behaviour of box columns filled with
aluminium honeycomb or foam, Computers & Structures, vol. 68(4), p. 343–367
Santosa, S. P., Wierzbicki, T., Hanssen, A. G. and Langseth, M. (2000),
Experimental and numerical studies of foam–filled sections, Int. J. of Impact
Engineering, vol. 24(5), p. 509–534
Schneider, F. and Jones, N. (2008), Observations on the design and modelling of
some joined thin-walled structural sections, Thin-Walled Structures, vol. 46(7–9), p.
887–897
Seide, P. (1956), Axisymmetrical buckling of circular cones under axial
compression, J. of Applied Mechanics, Transaction ASME, vol. 23, p. 625–628
Seitzberger, M., Rammerstorfer, F. G., Gradinger, R., Degischer, H. P., Blaimschein,
M. and Walch, C. (2000), Experimental studies on the quasi–static axial crushing of
steel columns filled with aluminium foam. Int. J. of Solids and Structures, vol. 37(30),
p. 4125–4147
Shariatpanahi, M., Masoumi, A. and Ataei, A. (2008), Optimum design of partially
tapered rectangular thin–walled tubes in axial crushing, Proceeding of the
158
Institution of Mechanical Engineers Part B–J. of Engineering Manufacture, vol.
222(2), p. 285– 291
Sheh, M. Y., Reid, J. D., Lesh, S. M. and Cheva, M. (1992), Vehicle crashworthiness
analysis using numerical and experimental method, Int. Conference on Vehicle
Structural Mechanics and CAE, Warrendale, Society of Automotive Engineering Inc
Sheldon Imaoka, http://ansys.net/, Accessed frequently since 2006
Sheriff, N. M., Gupta, N. K., Velmurugan, R. and Shanmugapriyan, N. (2008),
Optimisation of thin conical frusta for impact energy absorption, Thin–Walled
Structures, vol. 46(6), p. 653–666
Sherwood, J. A. and Frost, C. C. (1992), Constitutive Modelling and Simulation of
Energy Absorbing Polyurethane Foam under Impact Loading, Polymer Engineering
and Science, vol. 32(16), p. 1138–1146
Shetty, S. K. (2001), Finite Element Modelling of Energy Absorption Characteristics
of Hybrid Structures – Composite Wrapped on a Square Metal Tube, B.Eng Thesis,
Mysore University: India
Singace, A. A., El–Sobky, H. and Petsios, M. (2001), Influence of end constraints on
the collapse of axially impacted frusta, Thin–Walled Structures, vol. 39(5), p. 415–
428
Song, H. W., Fan, Z. H., Yu, G., Wang, Q. C. and Tobota, A. (2005), Partition
energy absorption of axially crushed aluminium foam–filled hat sections, Int. J. of
Solids and Structures, vol. 42(9–10), p. 2575–260
Spagnoli, A. and Chryssanthopoulos, M. K. (1999), Elastic buckling and
postbuckling behaviour of widely–stiffened conical shells under axial compression,
Engineering Structures, vol. 21(9), p. 845–855
Subhash, G., Liu, Q., Gao, X. (2006), Quasistatic and high strain rate uniaxial
compressive response of polymeric structural foams, Int. J. of Impact Eng., vol.
32(7), p. 1113–1126
Tan, H. and Qu, S. (2009), Impact of Cellular Materials, Lecture note, International
Centre for Mechanical Sciences, Udine, Italy, 28 Sept – 2 Oct
Tarigopula, V., Langseth, M., Hopperstad, O. S. and Clausen, A. H. (2006), Axial
crushing of thin–walled high–strength steel sections, Int. J. of Impact Engineering,
Int. Symposium on the Crashworthiness of Light–weight Automotive Structures, vol.
32(5), p. 847–882

159
Toksoy, A. K. and Guden, M. (2005), The strengthening effect of polystyrene foam
filling in aluminium thin–walled cylindrical tubes, Thin–Walled Structures, vol.
43(2), p. 333–350
Triantafillou, T. C. and Gibson, L. J. (1989), Debonding in Foam Core Sandwich
Panels, Material Structures, vol. 22, p. 64–89
Ulker, M. B. C. and Rahman, M. S. (2008), Traffic Barriers under Vehicular Impact:
From Computer Simulation to Design Guidelines, J. of Computer–Aided Civil and
Infrastructure Engineering, vol. 23, p. 465–480
USA Department of Defence (1966), Aluminum and Aluminum Alloys, Military
Standardization Handbook: Washington, DC
Vanderplaats, G. N. (2007), Multidiscipline Design Optimisation, Vanderplaatz
R&D, Inc.
Wadley, H. N. G., Fleck, N. A. and Evans, A. G. (2003), Fabrication and Structural
Performance of Periodic Cellular Metal Sandwich Structures, Compos Sci Tech, vol.
63, p. 2331–2343
Walter, P. L. (2007), Selecting Accelerometers for Mechanical Shock Measurements,
Sound and Vibration, vol. 41(12), p. 14–18
White, M. and Jones, N. (1999), Experimental quasi–static axial crushing of top–hat
and double–hat thin–walled sections, Int. J. of Mechanical Sciences, vol. 41, p. 179–
208
WHO (2004), World Report on Road Traffic Injury Protection, World Health
Organisation Library Cataloguing–in–Publication Data
Wierzbicki, T. and Abramowicz, W. (1983), On the crushing mechanics of thin–
walled structures, J. of Applied Mechanics, vol. 50, p. 727–734
Witteman, W. J., Kriens, R. F. C. (1998), Modelling of an Innovative Frontal Car
Structure: Similar Deceleration Curves at Full Overlap, 40 per cent Offset and 30
Degrees Collisions, Proceedings of the Sixteenth Int. Technical Conference on the
Enhanced Safety of Vehicles (ESV), Paper 98–S1–O–04, p. 194–212: Windsor,
Canada
Wu, E. and Jiang, W. (1996), Axial crush of Metallic Honeycombs, Pergamon, Int. J.
of Impact Engineering, vol. 19(5–6), p. 439–456
Yamazaki, K. and Han, J. (2000) Maximization of the crushing energy absorption of
cylindrical shells, Advances in Engineering Software, vol. 31, p. 425–434

160
Yan, W. Y., Durif, E., Yamada, Y. and Wen, C. (2007), Crushing simulation of
foam– filled aluminium tubes, Materials Transactions, vol. 48(7), p. 1901–1906
Yoo, S. H., Chang, S. H. and Sutcliffe, M. P. F. (2010), Compressive characteristics
of foam–filled composite egg–box sandwich panels as energy absorbing structures, J.
of Composites, Part A, vol. 41, p. 427–434
Yuen, S. C. K., Nurick, G. N. and Starke, R. A. (2008), The energy absorption
characteristics of double–cell tubular profiles, Latin American J. of Solids and
Structures, vol. 5(4), p. 289–317
Yuen, S. W. and Van Erp., G. M. (1999) Transient analysis of thin–walled structures
using macro spline finite elements, Engineering Structures, vol. 21(3), p. 255–266
Zarei, H. R. and Kroger, M. (2006), Multiobjective crashworthiness optimisation of
circular aluminium tubes, Thin–Walled Structures, vol. 44(3), p. 301–308
Zarei, H. R. and Kroger, M. (2008), Optimisation of the foam–filled aluminium tubes
for crush box application, Thin–Walled Structures, vol. 46(2), p. 214–221
Zhang, X., Cheng, G. and Zhang, H. (2009), Numerical investigations on a new type
of energy–absorbing structure based on free inversion of tubes, Int. J. of Mechanical
Sciences, vol. 51, p. 64–76
Zhang, Z., Liu, Sh. and Tang, Z. (2010), Crashworthiness investigation of kagome
honeycomb sandwich cylindrical column under axial crushing loads, J. of Thin–
Walled Structures, vol. 48, p. 9–18
Zini, G. (2005), Reduction of crash severity through in–vehicle systems (IVS) speed
Control, In: 19th
Int. Technical Conference on The Enhanced Safety of Vehicles,
June 2005, Washington DC
Zupan, M., Chen, C. and Fleck, N. A. (2003), The plastic collapse and energy
absorption capacity of egg–box panels, Int. J. of Mechanical Sciences, vol. 45(5), p.
851–871

161
APPENDECIES

162
APPENDIX A
A.1. Introduction
In order to recognise the importance of optimum crashworthiness in a structure,
it is initially necessary to study the theoretical background of the subjects related to
this criteria. The aim here is to give a basic foundation on the work presented in the
thesis and, where applicable, reference has been made to the works reviewed in the
Literature Review Chapter. The information provided herein includes subjects such
as structural crashworthiness, energy absorption, EA structures and methods of
analysis of energy absorbers.
A.2. Safety Evaluation in the Automotive Industry
Severe or fatal traffic accidents are considered to be one of the most threatening
dangers in daily life. In a 2001 White Paper on European Transport Policy, the
European Commission proposed that the European Union should set itself the target
of halving the number of road deaths by 2010 (EC, 2003). In 2003, the European
Union published a brochure reflecting this proposal, indicating that:
“ E
Union and all its inhabitants: in the 15 member European Union, 375
million road users, 200 million of them driving license holders, use 200
million vehicles on 4 million km of roads. Ever greater mobility comes at a
: ’ ’ ’ ’ ’
injuries on the roads. The direct and indirect cost of this carnage has been
EU ” E , 003).
In May 2011 the European Commission released a series of statistical data,
suggesting that the total number of deaths in road accidents over Europe fell by 28%
to 34,800 in 2009 from 54,302 in 2001. According to the European Road Safety
Observatory, in Great Britain 2,645 people were killed in road accidents in 2008,
1,312 (almost 50%) of which were passenger car occupants alone (CARE, 2011). In
light of these statistical data, it can be said that despite a decrease in the number of
fatalities over the past 10 years, the current situation is still socially unacceptable.

163
In order for a vehicle to be released to consumers, it has to undergo a set of
crash tests to determine its crashworthiness and safety levels. There are a number of
vehicle rating systems under the New Car Assessment Program (NCAP) such as
Australasian NCAP (ANCAP), European NCAP (EURO NCAP), Safer Car (US),
Japan JNCAP and Korean KNCAP. These programs test vehicles and rate their
safety with one to five stars; the safer the vehicle, the more the number of stars.
To make the evaluation, NCAP investigates the effects of a number of crash
tests on the vehicle occupant dummies. The tests are conducted at various speeds and
include a front–on crash, side impact crash and hitting a pole with the side of the car.
The tests also investigate how a crash can influence the pedestrians and how they can
be protected against injurious accidents. The test procedures consist of velocity,
ground clearance height and percentage overlap tests (WHO, 2004). According to the
report published by WHO, the test specifications vary between the NCAP rating
systems mentioned above.
A.3. Structural Crashworthiness and Impact Mechanics
T ’
and its mechanical properties when impacted. Therefore, in order to design an energy
absorbing system, it is necessary to explore the basic concepts of structural
crashworthiness and impact mechanics. Energy absorbing systems are commonly in
use in the vehicle industry by car manufacturers as well as the producers of heavy
vehicle, railway, aerospace and ship.
As a result of the complex behaviour of an impacted structure, the detailed
mechanical response of the structure can be investigated by studying an individual
structural component such as an energy absorber.
In general, crashworthiness can be defined as the capability of a structure to
resist the load of an impact from another body, in a manner that it will protect a
survival space. In the automotive industry, an increased emphasis has been placed on
this criterion as a vehicle design requirement for the safety of its occupants.

164
The essential concepts of the crashworthiness requirement for the survival
space of a vehicle are illustrated in Figure A.1 (Brown, 2002). It can be seen that the
kinetic impact energy during a crash event is initially absorbed by the frontal energy
absorbing system of the vehicle, thus the survival space, where the vehicle occupants
are located has remained intact.
Figure A.1 – Crash Energy Management in Vehicles (Brown, 2002)
Theoretically, a crashworthy vehicle should be designed so the load that would
be transferred to the vehicle body following an impact, (P1) will be lower than the
load which will damage the survival space (P2). Brown (2002) provides the
illustration of Figure A.2 to further explain this basic crashworthiness requirement.
In other words, the deformation of the survival space must be kept to a minimum
level. In addition, the peak deceleration should also be within a reasonable limit (Deb
et al. 2004).
Figure A.2 – Crush Characteristics of Crashworthy Structures (Brown, 2002)

165
Alongside the collapse behaviour of a vehicle, its crashworthiness is also
determined by aspects such as the ability of a vehicle to avoid accidents, the
dynamics of the vehicle during and after an impact and the occupant motions.
However, the focus of this study is on the components that improve the impact
behaviour of a vehicle.
The performance of an energy absorbing structure depends on its collapse
mode, the strain rate sensitivity of its material and the inertia effects. When a system
is subjected to quasi–static loads, the loading rate is considered to remain constant
and the inertia effects are relatively small. In a dynamic loading, however, due to the
presence of inertia and strain rate effects, the collapse response varies.
A.3.1 Quasi–static and Dynamic Loads
Mechanics is concerned with the state of rest or motion of bodies subjected to
the action of forces. The mechanics of physical rigid bodies is divided into two areas:
statics and dynamics. To give a basic definition, static state is when a body is either
at rest or moves with a constant velocity. When the velocity loses its consistency, the
body becomes dynamic meaning that it has an accelerated motion. Hibbeler (2002)
divides the dynamics into two branches itself; kinematics, which he explains as the
branch dealing with the geometric aspects of the motion only, and kinetics, which is
the analysis of the forces causing the motion.
Another classification of the branches of mechanics, done by Elert (1998,
2008) in his online textbook (The Physics Hypertextbook) is to categorise mechanics
into three subdivisions. Here, the study of motion without regard to the forces or
energies that may be involved is called kinematics. He believes that this is known as
the simplest branch of mechanics. In contrast, the study of forces in the absence of
changes in motion or energy is called statics. And finally, the branch of mechanics
that deals with both motion and forces together is called dynamics.
In the current work, since the concentration is on finite element method and FE
software, the below classification, used by many of such software, is preferred;
Static (Linear)

166
Quasi–static (Nonlinear Statics)
Dynamics (Nonlinear)
In static analysis the effects of steady loading conditions on a system are
calculated, ignoring effects such as those caused by time–varying loads. This type of
analysis can, however, include loads with a steady inertia such as gravity and
rotational velocity, and also time–varying loads that can be an equivalent of static
loads such as the static equivalent wind and seismic loads commonly defined in
many building codes. Static analyses determine the displacements, stresses, strains,
and forces in systems and bodies caused by time varying loads. The loads and
disturbances and the response of the system are assumed to vary slowly with respect
to time. The types of loading that can be applied in a static analysis include (ANSYS
13.0 Help System, 2010):
Externally applied forces and pressures
Steady–state inertial forces (such as gravity or rotational velocity)
Imposed (nonzero) displacements
Temperatures (for thermal strain)
Fluences (for nuclear swelling)
The dynamic response of a structure when subjected to time–dependent loads
can be determined using a technique known as transient analysis. This method, also
known as time–history analysis, can establish the displacements, strains, stresses, and
forces in a structure as they vary with time. The inertial effects, mentioned in the
previous sections becomes of importance in this area of analysis.
In comparison with static and transient analysis, dynamics is considered to be a
technique more often used, since it accounts for both the forces applied to a body and
its motion.
Energy Absorbing structures tend to collapse in an even mode when subjected
to quasi–static loads. Sequential development of lobes on one end of the structure is
known as progressive buckling. Progressive buckling can be divided into quasi–static
progressive buckling and, when strain rate effects are taken into account for quasi
static loading conditions, dynamic progressive buckling.

167
According to Karagiozova et al. (2000), in low velocity impacts the progressive
buckling is quasi–static while dynamic progressive buckling develops in high
velocity impacts. In dynamic progressive buckling the entire length of a structure is
involved in the deformation process and the deformation pattern varies from quasi–
static progressive buckling shapes (Jones, 1989).
A number of collapse modes can be developed in a progressive buckling
process, including axisymmetric, non–axisymmetric and mixed. Collapse can also
happen through global bending. The amount of energy absorbed in the progressive
buckling mode is significantly greater than in global bending mode since the former
occurs in a more controlled manner (White et al., 1999) and on the other hand a
greater amount of material is involved in plastic deformation.
The current project looks at the dynamic deformation of egg–box structures as
energy absorbers. The collapse procedure in these structures can be categorised as an
axisymmetric plastic deformation, initiating with the formation of travelling plastic
hinges in the walls of the structure.
The properties of the materials used in the fabrication of egg–box structures,
such as material rate dependency, can also affect their performance as energy
absorbers, especially in dynamic loading. It is, therefore, necessary to take the effects
of such characteristics into account when studying and predicting the behaviour of an
energy absorbing structure.
A.3.2 Strain Rate Sensitivity
The stress–strain pattern can change with the rate of loading in structures that
are fabricated from rate–dependent material (Reid and Harrigan 1998; Su et al.
1995). Materials such as certain aluminium alloys are sensitive to strain rate which
can also be called visco–plastic material. Lu and Yu (2003), suggest that in visco–
plastic material, the yield stress can also increase with strain rate.
In engineering equations, the effect of material strain rate should be taken into
consideration for realistic calculations. A number of constitutive models exist for
material strain rate sensitivity which can be utilised to reduce the number of

168
experimental tests. One well–known equation in material engineering, which
accounts for material strain rate sensitivity, is the Cowper–Symonds relation which is
commonly employed in structural impact problems (Reid et al., 1986). Automotive
engineers use the Cowper–Symonds uniaxial equation to assess the strain rate effects
on the structural response of energy absorbing structures under dynamic loading. The
equation can also be implemented in material models for finite element analysis. The
Cowper–Symonds constitutive equation can be shown in the following two forms;
A.1
A.2
where ( ) is the effective strain rate, is the dynamic yield stress, is the initial
or static yield stress and (C) measured in s–1
and (p) are Cowper–Symonds material
constants which represent, a characteristic at which , and a measure of the
rate sensitivity of the material, respectively. The latter two constants can be obtained
from dynamic uniaxial or pure shear tests on the material (Jones, 1989) and are
different even for different alloys of the same base material. Hence, it is vital to
know the exact material specifications in order to find these components.
Finite element packages, such as those employed for the purpose of this study,
use the above formulae, in conjunction with the specific material properties provided
by the user, to assess the true behaviour of the materials forming the body being
analysed.
A.3.3 Inertia Effect Characteristics
In severe impact loadings, structures can show signs of the presence of inertia
effects. The collapse mode, initial peak load and load–deflection curve of a structure
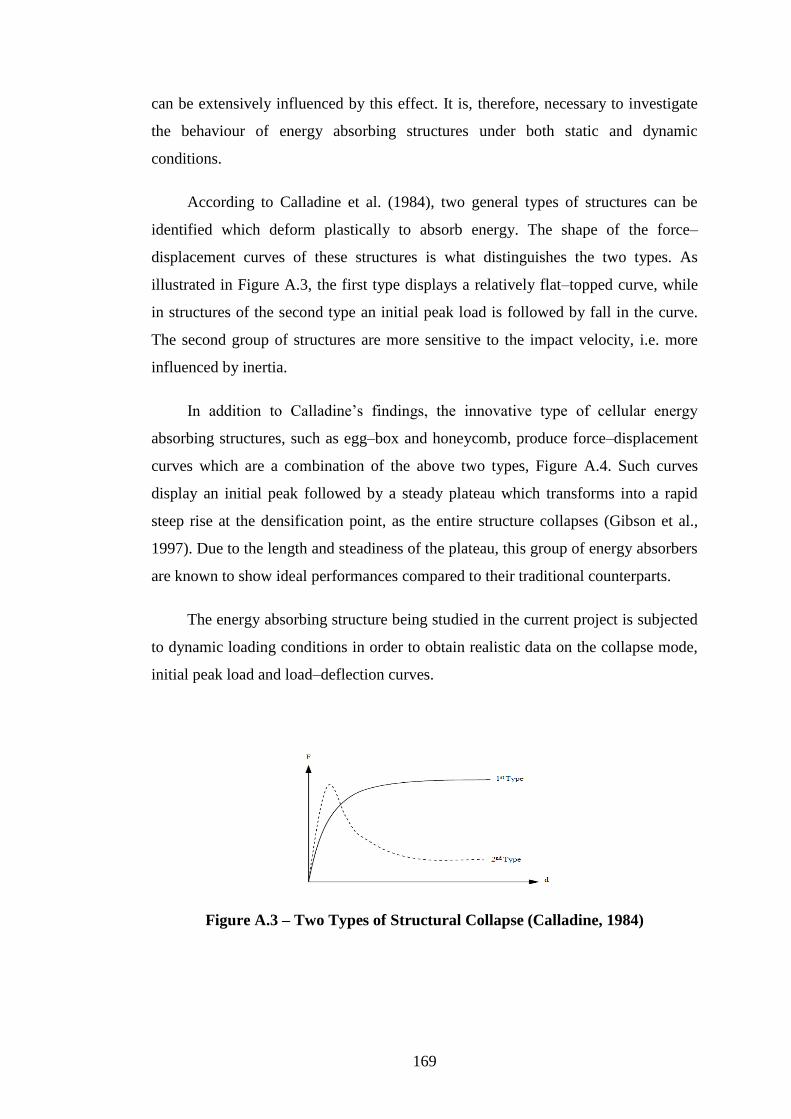
169
can be extensively influenced by this effect. It is, therefore, necessary to investigate
the behaviour of energy absorbing structures under both static and dynamic
conditions.
According to Calladine et al. (1984), two general types of structures can be
identified which deform plastically to absorb energy. The shape of the force–
displacement curves of these structures is what distinguishes the two types. As
illustrated in Figure A.3, the first type displays a relatively flat–topped curve, while
in structures of the second type an initial peak load is followed by fall in the curve.
The second group of structures are more sensitive to the impact velocity, i.e. more
influenced by inertia.
’ ,
absorbing structures, such as egg–box and honeycomb, produce force–displacement
curves which are a combination of the above two types, Figure A.4. Such curves
display an initial peak followed by a steady plateau which transforms into a rapid
steep rise at the densification point, as the entire structure collapses (Gibson et al.,
1997). Due to the length and steadiness of the plateau, this group of energy absorbers
are known to show ideal performances compared to their traditional counterparts.
The energy absorbing structure being studied in the current project is subjected
to dynamic loading conditions in order to obtain realistic data on the collapse mode,
initial peak load and load–deflection curves.
Figure A.3 – Two Types of Structural Collapse (Calladine, 1984)

170
Figure A.4 – Structural Collapse Type Three
The effect of inertia on the energy absorption behaviour of a structure is
strongly dependent on its physical and geometrical composition as well as the rate of
the loading. For more substantial investigation on the effect of inertia on the
characteristics of energy absorbers, the reader is referred to Karagiozova et al.
(2000).
A.4. Energy Absorption by Structural Collapse
In order for energy absorbing structures to be used in practice, they should
collapse in a predictable and manageable manner with a controlled force level. The
energy absorption characteristics of a structure must be known in order to match the
detailed design requirements. It would also be beneficial if such structures can be
modified to accommodate specific ranges of applications.
Researchers studying this subject provide mathematical formulations
expressing the relationship between the deformation behaviour of structures under
applied forces and their energy absorption features. Studies such as Deshpande (2001
and 2003) and Shetty (2001) provide detailed information on the attributes of energy
absorption per different units of measurement and the approaches towards formula
derivation.
The force–deformation response of energy absorbing structures can measure
their energy absorption performance. Collapse load can be defined as the amount of
load required to cause a permanent deflection to a system. The deflection increases

171
as the crush progresses. An ideal energy absorber can be represented with a constant
crushing load, from the initiation of the deformation process up to the maximum
deflection. Energy absorption capacity can then simply be calculated as the
rectangular area below the force–displacement curve up to the densification point.
The characteristics of EA structures and their energy absorption capacity are
evaluated by a series of qualitative criteria. It is required to determine and meet these
criteria at the design stage of an energy absorbing system. Details of such criteria are
presented in this section.
A.4.1. Energy Absorbed Per Unit Volume
The energy absorption capability of a structure is primarily based on its plastic
behaviour. For any given structure with a specific geometry, the area under the stress
vs. strain curve associated with its deformation, up to a point of densification, gives
its energy absorption capacity per unit volume.
Energy absorbed per unit volume becomes of significance when the structure
being deformed is in some way restricted in the space, as well as situations where the
ultimate energy absorption rate is achieved by mechanisms other than mere
geometrical deformation of the structure.
A.4.2. Energy Absorbed Per Unit Mass
The specific energy absorption (SEA) also known as the energy absorbed per
unit mass, (Wm,) is defined as the energy absorbed by a deformed structure when
crushed with the energy of (E) per unit mass. This can be written as:
A.3

172
with (ETotal) representing the total energy absorbed in the crushing of the structure
under a crush load of (F). The value ϰ is the displacement of the highest point of the
structure after the impact, known as the crush distance. A represents the cross
sectional area of the crushed portion of the structure which has a density of (ρ).
The crashworthiness of a structure is determined by its SEA value. The total
energy absorbed by a structure, (ETotal,) is equal to the area beneath its corresponding
force vs. displacement curve. This value can be used as a comparison factor when
studying the capabilities of different structures in terms of their level of energy
absorption.
A.4.3. Energy Absorbed Per Unit Length
Here, length is defined as the distance of deformation and thus, the energy
absorbed per unit length, (WL) is defined as the energy absorbed per unit of
deformation distance, (ϰ). This can be shown as;
A.4
The energy absorbed per unit length provides a simple method for calculating
the crashworthiness of structures where collapse is restricted to a well–defined crush
zone. Such crashworthiness specifications allow for the structures to be verified by
using appropriate test procedures or finite element simulation.
It is therefore evident that the selection of a suitable energy absorbing structure
for a specific application will depend upon the geometry and material of the crushed
structure, as well as the nature of the application under consideration.
From the definition of SEA it can be construed that the lighter the weight of a
structure, the more crashworthy it would be. Hence, a practical energy absorber must
have an acceptable and minimised weight.

173
A.5. Energy Absorbing Structures
Structures of certain geometries and materials have a considerable potential for
absorbing the kinetic energy of an impact. Their energy absorption capability offers a
unique combination of reduced structural weight and improved safety especially in
the automotive and aircraft industry. Crash resistance of these structural parts
provides a protective shell around the occupants of a vehicle.
In the past decade studies have demonstrated the ability of specific structures to
absorb energy under dynamic crash conditions. Many energy absorbing structures
have been studied experimentally.
Structures currently in use include thin–walled tubes such as: circular tubes,
square/rectangular tubes, hat–section tubes, tapered rectangular tubes and conical
tubes and cellular solids such as: metallic foams and polymeric (non–metallic)
foams, honeycomb panels and egg–box components (Figure A.5). Analysing the
characteristics of the latter type of energy absorbing structure is the concentration of
the present study.
Figure A.5 – Commercially Used Energy Absorbing Structures

174
Energy absorbing structures are expected to perform in a predictable and
controllable manner in order for load limitations to be specified per system.
Investigations are made on the geometrical and material attributes of these structures
to improve their performance and increase their crashworthiness per application.
A.5.1. Egg–box Structure
Amongst energy absorbing structures currently in employment, the repetitive
cells of an egg–box structure, originated from the earlier work of Professor Shirvani
and later patented under the name of PressLoad by Cellbond Composites Ltd.
(Ashmead, 2000), offers high levels of energy absorption capacity and SEA. Egg–
box structures are a group of energy absorbing cellular structures which, as suggested
by the name, consist of panels shaped like egg–boxes (Figure A.6(a)).
In a regular egg–box arrangement, the unit cell is made up of alternated
axisymmetric conical shells with flat tops geometrically classified by four
parameters: cell height (h), apical angle of cell (ω), top diameter (d) and wall
thickness (t), shown in Figure A.6(b).
The distance between two diagonal cells is defined by (p) where;
A.5
Another effective parameter in the deformation process is the radius of the
fillet, (r), at the top of the peaks. This curvature is produced during the
manufacturing process and is inevitable. It is practically impossible to create a
specimen with r = 0. Although measuring and modelling this curvature is fairly
complex, however, taking this factor into consideration results in a better valuation
of the energy absorption characteristics of the specimen. A change of this parameter,
when modelling the geometry, has been found to induce a significant effect on the
initiation of the deformation where a sharp transition of r = 0 displays a stiff elastic
response (Deshpande, 2003).

175
(a) Panel Concept Drawings
(b) Geometrical Characteristics
Figure A.6 – Egg–box Structure
In addition the peaks and trenches of the egg–box structure can be produced to
different, usually small curvatures. The factor (R) is the radius of these arcs. For very
large values of R, the peaks and trenches can practically be considered as being flat.
These geometrical factors in the egg–box structure can be adjusted to result in
desired levels of energy absorption. Varying the peak to peak length, (p), angle, (ω),
cell diameter, (d), or wall thickness, (t), in addition to the material type used and the
level of constraints applied to the structure can result in diverse energy absorption
characteristics for this structure. For example reducing the inter–peak distance, (p),
gives a higher density of cones throughout the structure which in turn results in an
increased stiffness and a higher stress level, i.e. greater amount of energy will be
absorbed (Deshpande, 2003).

176
The geometrical appearance of the egg–box structure contributes towards its
suitability as an energy absorber.
A.6. Analysis of Energy Absorbing Structures
In order to remain competitive in the highly dynamic market of safety material
production, it is important for energy absorber developers to thoroughly understand
the crashworthiness and impact mitigation of their products. Researchers use one or
more of the following tools to carry out such comprehensive analysis; analytical,
numerical and experimental techniques.
These three techniques can be used in conjunction for validation and
verification of the outcomes of testing a certain structure. While structures currently
in use can be improved and optimised, using these techniques, new design
opportunities can also be discovered.
A.6.1. Experimental Methods
One commonly and traditionally used approach is controlling and manipulating
the attributes of energy absorbing structures by the use of practical test machines,
which can deliberately load specimens both statically and through dynamic impacts.
Experimental methods are valuable in terms of demonstrating the role of
individual geometrical alterations in the behaviour of an energy absorber. They can
however be extremely costly and time consuming, considering the need for repetition
of single tests as well as tests performed on the great number of altered geometries.
In addition, once a specimen undergoes loading and becomes deformed, there is no
easy reverse approach; the material has to be recycled and formed into new
structures, which means further expenses and in some cases impossible. Using these
testing methods can be beneficial and even essential as validation tools when it
comes to verifying results of numerical analysis.
Various methods of practical testing of energy absorber structures exist, which
can be divided into two main categories of static loading and dynamic impact testing.

177
A.6.1.1. Static Loading of Egg–box Structures
Static loads, by definition, are, as explained earlier, constant mechanical forces
that do not change with time. It is evident that in practice this would be impossible
due to the presence of gravitational accelerations. Therefore, in mechanical physics,
static loads are referred to the group of forces that are applied on a body, steadily and
at very low rates. Testing structures under static loadings can be helpful in
determining their maximum allowable load bearing capacities, as well as the
mechanical properties of the materials forming them.
This particular mode of experimental testing becomes most valuable in the
design of structures that are used towards human health and safety. In order to set
safety margins on a structure, it is vital for a designer engineer to be aware of the
maximum force a structure can support prior to collapsing. Energy absorbers are
structures that directly deal with the safety of passengers in the transportation
industry. It is therefore necessary for them to be statically loaded in order to study
their attributes and limitations.
Figure A.7 – Plate Compression of Egg–box Energy Absorbing Structure
(Experimental tests performed at Cellbond Composites Ltd)
In the static testing of egg–box energy absorbers, Figure A.7, the specimens are
compressed using screw–driven plates at very minimal nominal strain rates, 10–6 –
10–3
s–1
, or at low constant velocities such as 1mm/s. The compressive response of the
specimen is then measured based on the level of constraint. The applied load is
measured by placing a load cell on the test machine and is used to define the nominal
compressive stress on the specimen; the nominal axial strain is measured via a clip
gauge fixed between the loading platens, recording the distance travelled from the

178
initial location. The measured compressive stress vs. strain curves for every
geometry can thus be produced and used to explore the deformation procedure of the
egg–box.
A.6.1.2. Egg–box Structures under Dynamic Impact
Dynamic or impact loads are forces applied to physical bodies with a motion
and can change with time. Dynamic loads can be categorised into three groups; low
pace impact, high velocity impact and hyper velocity impact. This classification is
based on the fact that, as the pace of impact increases, extreme changes become
evident in the deformation mechanism of the target object and the energy transfer
between this structure and the impactor.
A low pace impact is the situation where the impactor contacts the target for
long periods of time. Such low velocity events can be considered as quasi-static
loadings. The velocity limit which defines a quasi-static impact depends on the size
ratio of the impactor to target. Cases where the impactor is significantly larger than
the impacted structure could be counted as quasi-static (Nettels, 2000).
In contrast, in high pace impacts, the contact periods between the impactor and
the target are much shorter in time. This type of impact occurs every day in road
accidents as well as impacts in the ballistic range. The effects of high pace impacts
are severe but, under certain circumstances, controllable. It is in the presence of this
class of dynamic force when energy absorbing structures prove to be constructive.
Hyper pace impact refers to events where an exceedingly high velocity
impactor crushes the target structure at such an elevated stress that the compound
materials of the target act like fluids and exhibit minimal physical strength. It is
unlikely for an impact with such magnitude to appear in the automotive and aviation
disasters. Therefore, when examining the response of egg–box structures to dynamic
impacts, this study concentrates on situations of high–pace impact.
The common testing method for energy absorbers subject to dynamic loads
involves impacting the specimens in the vertical axial direction, under the effect of a
drop–weight tower as shown in Figure A.8.

179
Figure A.8 – Dynamic Impact of Egg–box Structure
The loading mass and velocity of the impactor can be increased or decreased as
appropriate. Zupan et al. (2003) suggest impacting egg–box panels of below 1m2
cross sectional area with an impactor mass of 5.5kg moving at a velocity of 6m/s.
Similar to the static mode, the load is measured with a load cell placed on the
impactor mass. The relative displacement of loading mass is measured by laser
extensometer against time to prove the test acceleration. The measured compressive
stress versus strain response of the specimen is resultantly produced to evaluate the
behaviour and efficiency of a given egg–box absorber.
As mentioned previously, such techniques can be extremely costly in terms of
both expenses and time. Moreover, in cases of irreversible material destruction, a
good amount of metal or plastic can be wasted. This waste material is considered as
contributing to global damage. Therefore it would be ideal to take advantage of non–
experimental, repeatable methods which avert the need for structural production,
destruction and recycling costs.
To generate a principle for measuring the energy absorption capacity of conical
frusta, a mathematical approach is proposed. This formulation has been expanded to
predict the characteristics of the egg–box structure, which is in fact made of a series
of conical frusta (Deshpande, 2003). The next section provides a brief review of
these calculations.

180
A.6.2. Mathematical Approach
An approach towards the determination of the energy absorption characteristics
of EA structures is the development of mathematical models. To use these theory–
based methods a series of assumptions and approximations need to be made. In other
words, to allow for the application of mathematical formulations, the body being
analysed needs to be simplified to a controllable model. The absence of physical and
geometrical details in such modified assumptions leads to lack of accuracy in the
calculations.
Despite the simplified outcome of mathematical modelling, this approach can
be used as a valuable means of validation of the results of experimental or numerical
analysis.
In most cases, mathematical calculations are based on two dimensional
approximations of three dimensional systems. It would therefore be ideal to have a
means of analysing the characteristics of the energy absorbers, using a method that
would take into consideration the geometrical details of the structure in all three
dimensions. Researchers are working on developing more accurate theoretical
models for solving the behaviour of complex deformation patterns and structures.
In a recent study, a simple model is used to derive a general mathematical
formulation for the travelling hinge deformation and the plastic buckling displayed in
the crushing of a conical frustum (Deshpande et al., 2003).
The initial calculations are based on the approximate analyses done by
Calladine (1986) on the inversion of a spherical shell when subjected to a central
point load. It was assumed that the conical frustum being studied was being
compressed between two solid platens, disregarding the friction. Two travelling
plastic hinges were considered to form on each cross sectional side of the frustum,
forming a knuckle. Equal and opposite longitudinal bending moments, resulting from
the applied force, were identified on the inner and outer hinges, causing the knuckle
to rotate instantaneously (Deshpande et al., 2003).
Through the combination of a series of equilibrium equations, a mathematical
relation is derived representing the energy absorption rate by relating applied load of

181
(P) to the displacement of the top of the conical shell, u, for the travelling plastic
hinge, expressed as:
A.6
where (Y) is the yield strength of the material, (t) is the wall thickness of the cone, a
is the top radius and ω is the angle of the cone walls to the horizontal.
Once the above expression is verified against practical results, it is developed
into equations, giving approximate numerical solutions for the energy absorption
capacity and collapse strength of the egg–box absorber. To achieve this, it has been
assumed that an egg–box comprises a two dimensional array of conical frusta of the
same geometrical measurements and thus work out the stress vs. strain relationship
of the egg–box to be equal to:
A.7
A.8
where (σ) and (ɛ) are the nominal axial stress and strain, respectively, (h) is the depth
of the egg–box cell and (k) is a geometrical constant defined in equation A.8.
In practice, force–displacement curves associated with the deformation of
energy absorbers transit into a steep rise, starting at the densification point until the
deformation process terminates and the structure collapses. According to Ashby et al.
(2000), the densification process for cellular solids can begin at strain levels as low
as 0.4 to as high as 0.94 depending on the material and the structural shape. This

182
process for egg-box structures starts at strain values of around 0.6-0.8 (Deshpande,
2003, Akisanya, 2006, Cheng, 2007). With (H) being the height of the egg-box panel
and (x) the travelled distance of deformation, in mathematical terms, the value of the
densification strain can be expressed as:
A.9
Through comparison against practical experiments, it can be concluded that
equations A.7 and A.9 are rational mathematical approximation of the deformation
behaviour of egg–box.
Despite their near agreement with the experimental data, these mathematical
equations are all based on two dimensional approximations of the actual geometry. It
can become too complicated, inaccurate and to some extent impossible, to use such
formulations for energy absorbers with more complex geometrical features. For
example, the small curvature present at the transition point of walls into peaks and
trenches is ignored in the above calculations, while, as mentioned before, this small
arc plays a significant role in the initial deformation of the egg–box structure. It
would, therefore, be ideal to have a means of analysing the characteristics of the
egg–box absorbers using a method that would take into consideration the geometrical
details of the structure in all three dimensions.
Finite element analysis is a useful tool to solve just such a problem. Using
numerical calculations and predictions, the FE method can in fact be used to
determine the energy absorption characteristics of an EA structure prior to the
geometrical design and manufacture. Further information on the background and
application of the finite element method is provided in the next section.

183
A.6.3. Finite Element Numerical Analysis
For many engineering problems either due to the complexity of the nature of a
system, or its boundary and initial conditions, it is not possible to obtain exact
solutions. For such problems, approximate methods are used known as numerical
solutions. These methods obtain exact solutions at approximated points called nodes
whereas with exact methods, such as experimental tests, a single result applies to
every point of the system or body through which, it would not be feasible to evaluate
the role of each portion of the structure, hence the inability of modifying a single
parameter towards optimisation of the structure.
This matrix–based method is mainly used for problems with complex geometry
or boundary conditions. In finite element modelling the respective appearance of the
information of a system in different matrices is important. Finite element analysis is
a useful tool to solve three dimensional systems at more realistic approximations.
It is also important to note that the structure can only assume those shapes that
can be represented by shape functions and, according to Hartmann et al. (2007), the
accuracy of an FE solution depends fundamentally on how accurately a program can
approximate the influence functions for stresses or displacements. Influence
functions are the response of a structure to certain point loads. The more flexible a
structure is modelled, the better it can react to such point loads, and hence the better
the accuracy of the FE solution.
The FE numerical processing tools, allow for the study of the fundamental
features of different energy absorbing structures. In addition, application–specific
requirements can be met in terms of energy absorption capacity, appearance,
material, etc. by designing individual optimised geometries prior to production.
Modern FE analysis packages are capable of simulating dynamic crash impacts
by utilising explicit solvers. This technique allows for faster analysis of such
problems, giving detailed information on material response and behaviour. In
addition, these packages offer visual feedback on deformation modes and measured
levels of stress, strain and energy absorption, by use of frame animation and graph
processors (Figure A.9).

184
Figure A.9 – Typical Visual Feedback of Finite Element Packages
The finite element method is a numerical procedure based on the idea of
building a complicated object, using simple blocks, plates or beams, or alternatively,
dividing a complicated object into similar, easily manageable pieces, connected to
each other at previously identified points known as nodes, to allow for detailed
analysis of its attributes. The behaviour of each individual element can be described
by a set of equations, which when combined with the other elements in a structure,
form huge lists of simultaneous equations. Integral formulations are used to derive a
solution for each element, which is then connected or assembled with the other
individual solutions to form the complete solution for a system.
The accuracy of the final solution is based on the number, shape, location and
accumulation of the elements and nodes defined as well as a realistic assumption of
the boundary conditions. An important point to take into account is the behaviour of
each individual element. A few good shaped elements can produce better results than
many elements with poor geometries. There are many different shapes and types of
elements including triangular and quadrilateral elements, which can be selected
based on the geometrical outline and shape of the part being modelled.
To solve an engineering problem two sets of information are required; one is
the details of the natural behaviour of a system, such as elastic modulus, thermal
conductivity and viscosity and the other is information referring to the conditions of
185
a system under the effect of outer parameters, such as external forces, moments,
temperature differences, pressure in fluids, etc. The first set of information can be
generalised for systems of similar characteristics, while the mechanical properties
applied to a system are particular to each system or body.
In dynamic analysis, to derive the result equations of a system, the work of the
external forces absorbed by the work of the internal forces, inertial, and viscous
forces for any small kinematical motion, which satisfies both compatibility and
boundary conditions have to be taken into account. Displacement, velocity and
acceleration change with time. It is also possible for the mass of the system to vary
with time. Since the stiffness of the system is a function of both displacement and
internal forces, the external disturbance will be a function of displacement as well as
time, meaning the ultimate condition of the system will depend on the location of its
points and the times in which these displacements have taken place.
It is evident that a demand for more accurate outcomes calls for a greater
number of matrices and algebraic equations, increasing with higher complexities in
structures. Solving all these equations and connecting them to form a final solution
can be an extremely time consuming task when done in long hand. A much quicker
technique of designing, visualising, refining and calculating the performance of a
structure in different geometrical and mechanical conditions, is the use of,
commercially available, solver packages.
Computers can be utilised to solve the astronomical number of equations and
provide solutions to engineering problems. The availability of increasingly powerful,
low cost processors has made finite element analysis accessible for many engineering
disciplines. This ease of access has led to a substantial increase in manufacturing
efficiency and competitiveness over the years.
A.7. Finite Element Software and Commercial Packages
For highly complex problems, highly professional finite element solver
packages have been commercially designed, which substantially reduce the time and
cost of experimental and mathematical analysis. Preliminary finite element software

186
with very basic abilities initially appeared in 1964. Today powerful commercial
finite element packages exist, which offer highly interactive graphics and strong
processors and are compatible with personal computers. Popular software currently
in use for structural and mechanical analysis include ABAQUS®, ANSYS®, LS–
DYNA®, NASTRAN®, RADIOSS®, PAMCRASH®, ADINA®, CRASH CAD®
and LUSAS®, some of which are specifically designed to be used in crash analysis.
A.7.1. ANSYS® and LS–DYNA® Numerical Analysis Packages
The ANSYS® software is one of the highly established, widely distributed and
popular commercial finite element analysis packages, which has continuously been
in use and refined since 1970. Its historical background of development has resulted
in a code with a vast range of capabilities.
As a powerful numerical finite element solver, ANSYS® package can be used
to analyse a wide range of mechanical problems such as static and transient structural
analysis. In fact, ANSYS® is most commonly used in this particular area of
mechanical physics, since it can facilitate the analysis of structures as large as
bridges or as small as vehicle parts.
ANSYS® allows for the simulation of problems in static and transient modes
of mechanical loading. For both loading conditions ANSYS® can determine
displacements and stresses of a simulated structure as well as nonlinear plasticity,
stress stiffening, deflection, strain, hyper–elasticity, contact surfaces, etc., taking into
consideration the time–varying loads in the transient mode.
A number of purpose–specific features are available in ANSYS® in addition to
the above loading modes. Examples include fracture mechanics, composite material
analysis, fatigue, and both p–Method and beam analyses (ANSYS® 13.0, 2010).
In ANSYS® the finite element analysis is performed in three stages, taking
place in a GUI or graphical user interface. In the pre–processing phase a geometrical
model is created and meshed. It is at this stage that all the physical requirements and
limitation are simulated in the GUI. Next is the solution phase where all the quadratic
equations are formed and then solved for each node of the model to give unanimous

187
final results on the performance of a modelled structure. These results can be viewed
through the third phase, post–processing. Here graphs and time based animations can
be produced to evaluate the outcomes of the simulated test.
In order to simulate dynamic loading conditions, the powerful pre–processors
of ANSYS® have been combined with the equally powerful solver of another finite
element package known as LS–DYNA®. This software is designed to be used for
analysing static and dynamic problems with large deformation. LS–DYNA® uses
explicit time integration as its base solution approach (LSTC, 2007).
LS–DYNA® was originally developed in the mid–seventies, starting under the
name DYNA3D. This preliminary version had very basic capabilities and a number
of issues were revealed with the different algorithms it used at that time. At this point
the software was completely rewritten. After several attempts on introducing more
complete and more comprehensive versions, by 1988 the package, now renamed to
LS–DYNA®, was presented with a particular focus on the applications of the
automotive industry. Throughout the past decade, progress has been made in the
development of this software and with the emergence of newer versions, more
options get added to the capabilities of LS–DYNA®, detailed in the LS–DYNA®
U ’ M ual (LSTC, 2007).
A.7.2. ANSYS/LS–DYNA® Numerical Analysis Package
The combination of ANSYS® and LS–DYNA® gave existence to a powerful
finite element package referred to as ANSYS/LS–DYNA®. This package is detailed
further in this section.
ANSYS/LS–DYNA® was first introduced in 1996 to overcome challenges
such as limited–duration events and large, permanent deformations which created
great simulation challenges for the engineers. Researchers and designers used this
product, to model a structure or system in ANSYS®, then obtaining the explicit
dynamic solution using the powerful LS–DYNA® solver, and eventually reviewing
the results in the ANSYS® post–processing GUI.

188
Through the years, this influential pairing has helped engineers understand the
complicated combinations of nonlinearity they come across in crash tests and
catastrophic failures.
The geometry and results information can also be transferred between
ANSYS® and ANSYS/LS–DYNA® to help perform chronological implicit–explicit
and explicit–implicit analyses, such as those required for drop–test, spring–back and
other applications (ANSYS/LS– YNA® U ’ M , ).
Since the solver in ANSYS/LS–DYNA® is an LS–DYNA® solver, the results
can also be reviewed and modified in the LS–DYNA® post–processor environment.
As a feature mentioned in the ANSYS/LS–DYNA® product details, this package
supports both 2D and 3D explicit elements, and features an extensive set of single–
surface, surface–to–surface and node–to–surface contacts as well as a unique contact
analysis option that automatically creates contact surfaces for all simulated bodies in
a system. In addition, ANSYS/LS–DYNA® provides options that allow for fast
solution processing. Simulation results are delivered in a short period of time using
solution techniques called symmetric multiprocessing (SMP) and massively parallel
processing (MPP). This is achieved by optimising the power of multiple CPUs
(ANSYS online, March 2011).
The availability of such computation powers increases model accuracies and
details, since more exact and consistent simulations can be performed in shorter
durations. However, in order for the finite element analysis tools to contribute
efficiently in the design process of a structure, a practical compromise should be
made between the preciseness requirements of a model and the time involved with its
computation, a technique known as element sensitivity analysis.
A.8. Finite Element Modelling of Energy Absorbers
The finite element method (FEM) is an important tool in mechanical
computation and structural engineering problems. Nonlinear FEM can be used to
analyse large deformation plasticity problems to provide more accurate and detailed
outcomes, as compared to the traditional methods.

189
Designing energy absorbing structures is a highly complicated process that may
require several design iterations. Finite element analysis (FEA) is being used in the
automotive industry to perform efficient, parametric studies of these structures.
Using this method helps reduce or prevent the great number of costly and time–
consuming practical testing.
Energy absorbing structures generally collapse in a complex manner under
axial or multi–axial loading conditions. Due to this mode of deformation, the impact
behaviour of an energy absorber could not be evaluated accurately using
conventional analyses such as theoretical models.
The FE numerical processing tools, allow for the study of the fundamental
features of different energy absorbing structures. These techniques have recently
become one of the most important tools for simulating and analysing the behaviour
of EA structures (Figure A.10).
An interactive model of a structure subjected to an impact load is simulated and
analysed using the nonlinear FE–based package. This method makes it possible to
obtain the entire history of the structural deformation process. The results of an FE
model must be validated to ensure accurately reliable results have been achieved.
The outcomes can be validated against results of experimental techniques or
numerical and theoretical models.
Modern FE analysis packages are capable of simulating dynamic crash impacts
by utilising explicit solvers. This technique allows for faster analysis of such
problems, giving detailed information on material response and behaviour. In
addition, these packages offer visual feedback on deformation modes and measured
levels of stress, strain and energy absorption, by use of frame animation and graph
processors.
The modelling of egg–box structures for dynamic loading conditions has been
described extensively in the thesis.

190
Figure A.10 – An Example of FE Analysis of Impacting an Energy Absorbing
Structure (LS-DYNA®, personal interest research on egg-box sandwich
structure, vertically impacted by an ellipsoid)
In addition, application–specific requirements can be met in terms of energy
absorption capacity, appearance, material, etc. by designing individual optimised
geometries prior to production.
A.8.1. Material Models
Modelling the base material of a structure is of importance in the FE simulation
of the impact response of energy absorbers. The material model should represent the
true properties of the physical material. Characteristics such as elasticity, plasticity,
strain rate dependency, fracture and tearing response of materials at specific
temperatures should be accurately modelled in order for the FE simulation to validly
represent the physical structure.
As a powerful finite element code, one of the benefits of LS–DYNA® is its
material modelling capabilities. More than 100 different material models are
available to represent various types of highly nonlinear material behaviour including
foam material and honeycomb structures.

191
A.9. Structural Optimisation
In the world of mathematical sciences and engineering, optimisation refers to
the selection of the element or value, with the best available features, from a group of
possible alternatives, given a defined domain of objectives. This means solving
problems in which the aim is to minimise or maximise a characteristic of the design
by analytically allocating values from a specified source, to a set of variables.
Optimisation problems of more than one objective increase complexity. For
example, in the simplest double–objective problem there will be a design that
amplifies objective No.1, while objective No.2 is in its lowest value and another
design where objective No.2 is maximised and No.1 is ignored. There can also be
countless designs that are a compromise of both criteria. An increase in the number
of interest areas can add to the complexity of a problem, especially in cases where
one criterion cannot change without affecting the other.
In structural engineering, for example, an optimised design can be defined as
one that is adequately strong while it maintains a light weight. A simple judgment
would reveal that these two objectives conflict. There can be a light weight design
option, which is not necessarily strong, while another very strong design has an
extraordinarily heavy weight. In addition, an infinite number of options could exist,
that would be an assortment of weight and strength. This set of designs that cannot
be optimised according to one criterion without influencing another is called a Pareto
set (Lanzi, 2004).
The solution to such optimisation problems would be to keep changing the
variables one at a time, while the rest are kept constant. This will give rise to a
number of design combinations. This is where the concept of application–specific
optimisation becomes important.
Despite the literal definition of the word optimum – the best – when it comes to
practical optimisation, in a given criterion, a design can be the best fit for one
purpose, but not necessarily for all. In the above example of structural engineering
optimisation, for instance, selected out of the Pareto set, a design offering a
reasonable level of strength at a low weight can be ideal for a structure which is
designed to be transported, while for a similar structure, designed to be stable and

192
fixed, a slightly heavier but stronger option might be preferable. Therefore, a single
design cannot be selected as the one and only optimal. Depending on the purpose and
the location of a service, an application–specific optimisation can take place.
Application of the above techniques in the optimisation of energy absorbing
structures is explained in the subsequent sections.
A.9.1. Optimising Energy Absorbing Structures
For any system to remain continuously successful in an industry, it needs to be
constantly updated and improved. The same theory applies to the energy absorbing
structures.
The regulations demanding safety limits on the vehicles are becoming
increasingly precise and strict. Hence, the impact energy absorbing structures, which
are employed as protective components in the vehicle bodies, need to meet up to the
expectations of regulatory authorities. This necessitates continuous improvement of
the performance of EA structures.
For industrial purposes, an energy absorbing structure is chosen for a particular
function, based on its energy absorption capacity. It is desirable for this value to
remain below a certain limit for a given stress level. Finding the structure that
satisfies this requirement is known as purpose–specific optimisation. However, other
influential factors come into the equation during the process of developing the best
fit. Aspects such as structural size limits, durability, manufacturing costs and
constraints, material recyclability, etc. play as equally important a role as the
structural performance of an energy absorber.
The main purpose of structural optimisation is to improve a component using
limited resources. The factors that are altered towards the improvement of a system
are known as design variables. In energy absorbers, these factors can be associated
with either the geometry or the material of the structure.
While geometrical aspects can be interconnected and changing one can affect
the other, the effects of changing the materials of a structure can be compared

193
individually. The former case would result in a multi–variable optimisation where
some variables have to be changed in accordance to another.
An efficient structural design is required to respond in an acceptable manner for
various specifications. However, the optimisation of an energy absorbing structure is
a comparative process. A structure can only be optimised for the loading and
boundary conditions of the energy absorption system in which it is integrated. In
other words, the structural optimisation of an energy absorber is merely valid for
functioning under specifically identified circumstances and a design that fits
perfectly into the requirements of one system may fail to be as adequate in a system
with different boundary or loading conditions.
An extremely strong structure does not always succeed in becoming the
optimum candidate if it is, for example, overweight or costly to manufacture. The
presence and importance of all these factors increase the complexity of the
optimisation process, especially with characteristics that contradict, such as
durability of the materials and the costs of purchasing them. Therefore, based on its
function, the optimisation of an energy absorbing system may be a multi–objective
task where more than one characteristic identifies the crashworthiness of the system.
In general, it is required from an EA structure to absorb maximum amount of
impact energy while it reduces the effect of the initial load of the impact.
Simultaneously, the material from which the structure is made must be strong, have
adequate elastic and plastic properties and be of a reasonably low density. Fulfilling
all these requirements concurrently gives rise to an optimised energy absorbing
structure.
Among many optimisation techniques (Vanderplaats, 2007), a practical method
which can be used for the optimisation of energy absorbing structures is RSM or
response surface methodology. The idea of this method was introduced by Box and
Wilson (1951) where sequences of designed experiments are used to obtain an
optimal response. Although this method is not exact, it provides a reasonable set of
data which can be relied on as sources of evaluation for an optimisation problem. For
the purpose of this study, hints have been taken from the RSM method.
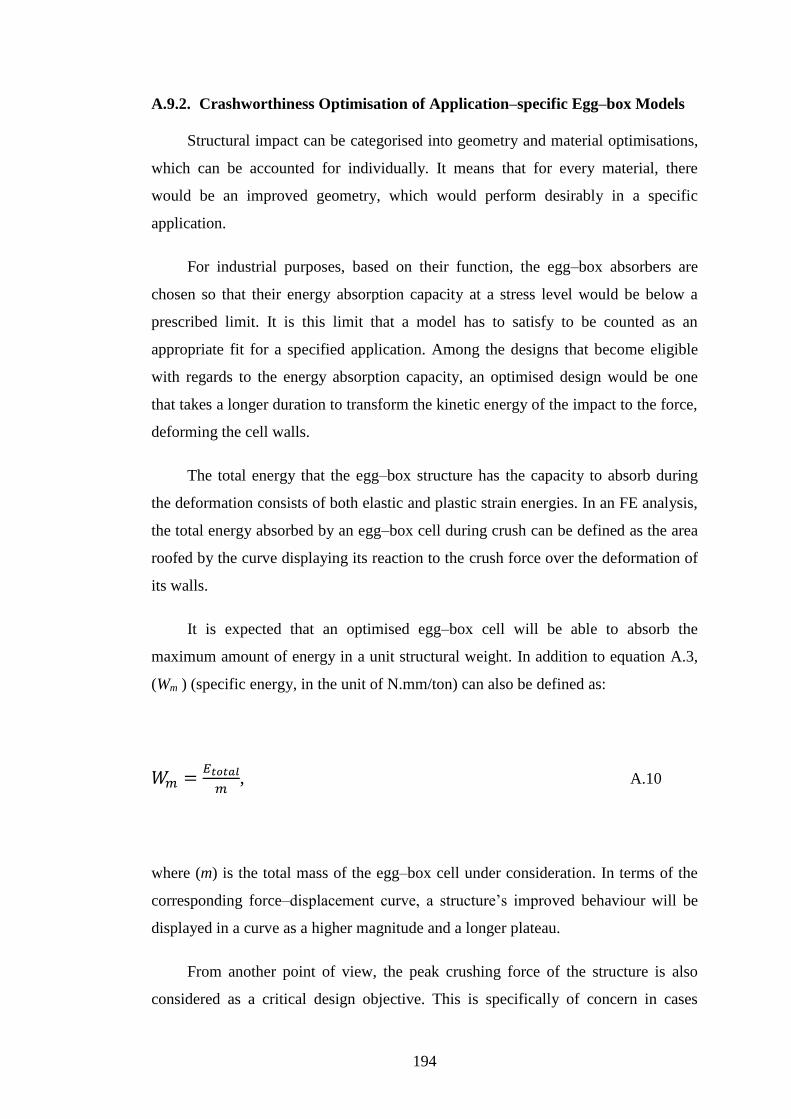
194
A.9.2. Crashworthiness Optimisation of Application–specific Egg–box Models
Structural impact can be categorised into geometry and material optimisations,
which can be accounted for individually. It means that for every material, there
would be an improved geometry, which would perform desirably in a specific
application.
For industrial purposes, based on their function, the egg–box absorbers are
chosen so that their energy absorption capacity at a stress level would be below a
prescribed limit. It is this limit that a model has to satisfy to be counted as an
appropriate fit for a specified application. Among the designs that become eligible
with regards to the energy absorption capacity, an optimised design would be one
that takes a longer duration to transform the kinetic energy of the impact to the force,
deforming the cell walls.
The total energy that the egg–box structure has the capacity to absorb during
the deformation consists of both elastic and plastic strain energies. In an FE analysis,
the total energy absorbed by an egg–box cell during crush can be defined as the area
roofed by the curve displaying its reaction to the crush force over the deformation of
its walls.
It is expected that an optimised egg–box cell will be able to absorb the
maximum amount of energy in a unit structural weight. In addition to equation A.3,
(Wm ) (specific energy, in the unit of N.mm/ton) can also be defined as:
, A.10
where (m) is the total mass of the egg–box cell under consideration. In terms of the
corresponding force– , ’ ved behaviour will be
displayed in a curve as a higher magnitude and a longer plateau.
From another point of view, the peak crushing force of the structure is also
considered as a critical design objective. This is specifically of concern in cases

195
where the energy absorber is acting as a cushioning structure for vehicle occupants,
in car doors and dashboards. In such conditions, preventing severe biomechanical
j ’ j .
The challenge would be for the optimisation problem to account for both of
these design objectives; bearing a major concern for the energy absorption capacity
of the structure while, simultaneously, seeking designs of minimum peak crushing
force.
A.9.3. Application of FEA in Structural Optimisation
As a result of the reliance of structural optimisation on nonlinear and
conditional functions, analytical approaches fail to solve the practical design
problems. On the contrary, numerical methods are ideal candidates for dealing with
such problems.
With the development of nonlinear finite element analysis codes, the
optimisation of energy absorbing structures becomes possible. The nature of
optimisation is a comparative evaluation of variable combination. FE codes can take
over the analysis of various combinations, providing prompt, inexpensive results
which can consequently be assessed based on their contributing variables.
Finite element software prevent the need for costly experimental crash tests in
the optimisation of energy absorbing structures. The highly powerful pre–processors
’ E
and allow for repetitive tests. With a validated FE simulation, the performance of
geometrically altered energy absorbers under various loading and boundary
conditions can be promptly investigated and necessary modifications can be applied
to a structure upon necessity.