finite element analysis of 3d transmission tower
TRANSCRIPT
FINITE ELEMENT ANALYSIS OF 3D
TRANSMISSION TOWER USING ANSYS
LEE JIA WEI
Thesis submitted in fulfilment of the requirements
for the award of the degree of
B.ENG (HONS.) CIVIL ENGINEERING
Faculty of Civil Engineering and Earth Resources
UNIVERSITI MALAYSIA PAHANG
JUNE 2015
vi
ABSTRACT
This thesis presents a probabilistic analysis approach applied in finite element
analysis for modelling of 3D transmission tower with different parameters. The aim of
this study analyse the transmission tower using Probabilistic Design System (PDS) to
obtain a transmission tower that is sustainable and long term life. Furthermore, the
transmission tower is also conducted under Eurocode 3 checking that is steel design. In
probabilistic analysis, the results of probabilistic density function, cumulative
distribution function, sample history plot, histogram plot and sensitivity plot for any
input and output can be obtained. The transmission tower is analysed at 45 and 10000
simulations. The scope for this study is by using ANSYS as a software modelling
process based on Finite Element Analysis and the selection of a 3D transmission tower
structure based on the existing dimensions. From the Eurocode 3 checking, the structure
is examined under tension, compression, bending moment resistance, shear resistance,
compression buckling and lateral buckling. The green colour represents that all the
members in the structure pass the checking while red colour indicates failure in the
particular member. In addition, the results extracted from the simulation of 3D
transmission tower model using ANSYS software are gathered and analysed to form a
conclusion. There are two sources of data which are input and output parameters. There
are eight input parameters which are DEADLOAD1, DEADLOAD2, DENS, ELASTIC,
POISSON, TEMP, WINDLOAD1 and WINDLOAD2. In this thesis, Monte Carlo
Simulation and Response Surface simulation was used to analyse the effect of parameter
on the transmission tower structure. From the corresponding graphs, the values for
mean, standard deviation, skewness, kurtosis, minimum and maximum relative
frequency can be obtained. In conclusion, there are some limitations in this study where
the literature review that is related is difficult to be found. However, it is proved that
ANSYS software is capable to get results for reaction forces, deformation, axial forces,
and maximum deflection by probabilistic analysis for transmission tower structures.
vii
ABSTRAK
Tesis ini membentangkan pendekatan analisis kebarangkalian digunakan dalam
analisis unsur terhingga untuk pemodelan menara penghantaran 3D dengan parameter
yang berbeza. Tujuan kajian ini menganalisis menara penghantaran menggunakan
Sistem reka bentuk kebarangkalian (PDS) untuk mendapatkan sebuah menara
penghantaran yang hidup jangka mampan dan panjang. Tambahan pula, menara
penghantaran juga dijalankan di bawah Eurocode 3 pemeriksaan yang reka bentuk
keluli. Dalam analisis kebarangkalian, keputusan fungsi kebarangkalian ketumpatan,
fungsi taburan kumulatif, sampel sejarah plot, histogram plot dan plot sensitiviti bagi
apa-apa input dan output boleh diperolehi. Menara penghantaran dianalisis pada 45 dan
10000 simulasi. Skop kajian ini adalah dengan menggunakan ANSYS sebagai proses
pemodelan perisian berdasarkan Terhingga Analisis Unsur dan pemilihan struktur
menara penghantaran 3D berdasarkan dimensi yang sedia ada. Dari Eurocode 3
memeriksa, struktur itu diperiksa di bawah ketegangan, mampatan, lenturan rintangan
masa, rintangan ricih, lengkokan mampatan dan lengkokan sisi. Warna hijau
melambangkan bahawa semua ahli-ahli dalam struktur lulus pemeriksaan manakala
warna merah menunjukkan kegagalan ahli tertentu. Di samping itu, keputusan yang
diekstrak daripada simulasi 3D model menara penghantaran menggunakan perisian
ANSYS dikumpulkan dan dianalisis untuk membentuk kesimpulan. Terdapat dua
sumber data iaitu input dan output parameter. Terdapat lapan parameter input yang
DEADLOAD1, DEADLOAD2, liang elastik, POISSON, TEMP, WINDLOAD1 dan
WINDLOAD2. Dalam tesis ini, Monte Carlo Simulasi dan Tindak Balas Permukaan
simulasi digunakan untuk menganalisis kesan parameter kepada struktur menara
penghantaran. Daripada graf sepadan, nilai min, sisihan piawai, kepencongan, kurtosis,
minimum dan kekerapan relatif maksimum boleh diperolehi. Kesimpulannya, terdapat
beberapa batasan dalam kajian ini di mana kajian literatur yang berkaitan adalah sukar
untuk ditemui. Walau bagaimanapun, jika dibuktikan bahawa perisian ANSYS mampu
untuk mendapatkan keputusan untuk daya tindakbalas, ubah bentuk, daya paksi, dan
pesongan maksimum oleh analisis kebarangkalian untuk struktur menara penghantaran.
viii
TABLE OF CONTENTS
Page
SUPERVISOR’S DECLARATION ii
STUDENT’S DECLARATION iii
ACKNOWLEDGEMENTS v
ABSTRACT vi
ABSTRAK vii
TABLE OF CONTENTS viii
LIST OF TABLES xi
LIST OF FIGURES xii
CHAPTER 1 INTRODUCTION
1.1 Introduction 1
1.2 Background of Study 1
1.3 Problem Statement 2
1.4 Research Objective 2
1.5 Scope of Study 3
1.6 Significance of Study 3
CHAPTER 2 LITERATURE REVIEW
2.1 Introduction 4
2.2 Transmission Tower 4
2.3 Steel and Truss 5
2.4 Finite Element Analysis 5
2.5 ANSYS 6
ix
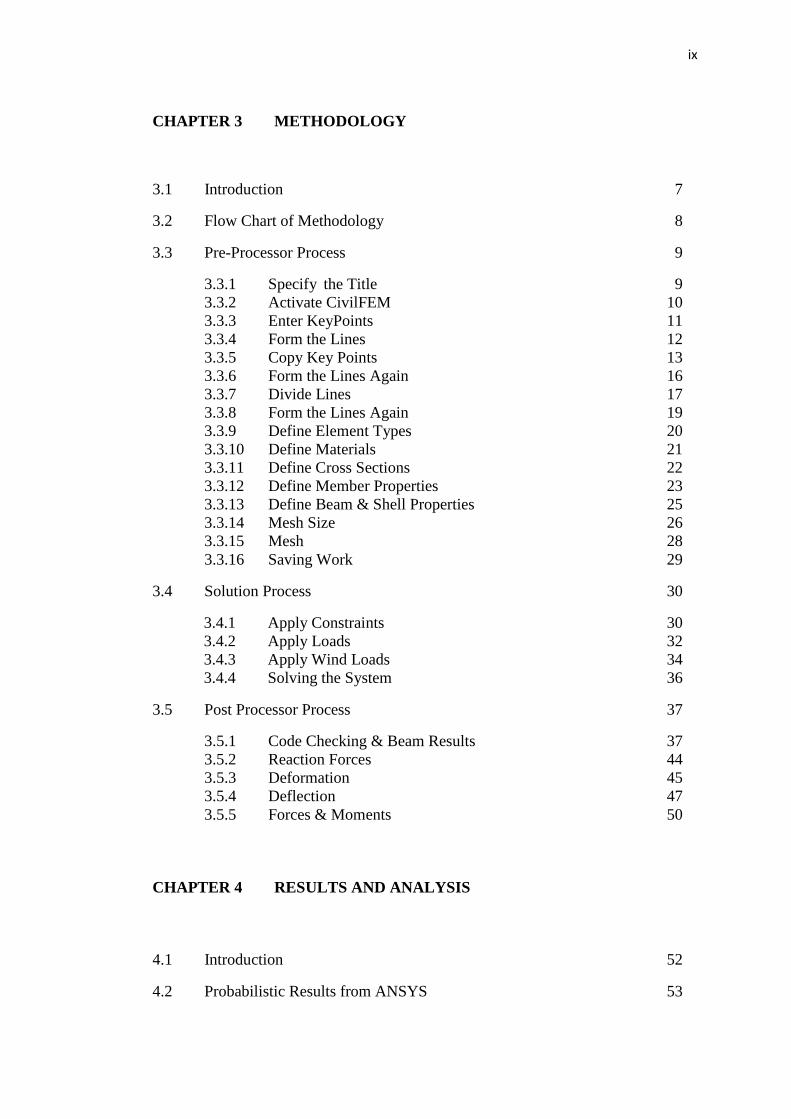
CHAPTER 3 METHODOLOGY
3.1 Introduction 7
3.2 Flow Chart of Methodology 8
3.3 Pre-Processor Process 9
3.3.1 Specify the Title 9
3.3.2 Activate CivilFEM 10
3.3.3 Enter KeyPoints 11
3.3.4 Form the Lines 12
3.3.5 Copy Key Points 13
3.3.6 Form the Lines Again 16
3.3.7 Divide Lines 17
3.3.8 Form the Lines Again 19
3.3.9 Define Element Types 20
3.3.10 Define Materials 21
3.3.11 Define Cross Sections 22
3.3.12 Define Member Properties 23
3.3.13 Define Beam & Shell Properties 25
3.3.14 Mesh Size 26
3.3.15 Mesh 28
3.3.16 Saving Work 29
3.4 Solution Process 30
3.4.1 Apply Constraints 30
3.4.2 Apply Loads 32
3.4.3 Apply Wind Loads 34
3.4.4 Solving the System 36
3.5 Post Processor Process 37
3.5.1 Code Checking & Beam Results 37
3.5.2 Reaction Forces 44
3.5.3 Deformation 45
3.5.4 Deflection 47
3.5.5 Forces & Moments 50
CHAPTER 4 RESULTS AND ANALYSIS
4.1 Introduction 52
4.2 Probabilistic Results from ANSYS 53
x
4.2.1 Random Input Variables 53
4.2.2 Statistics of the Probabilistic Results 58
4.2.3 Sample History Plots 59
4.2.4 Histogram Plots of Input Variables 66
4.2.5 Histogram Plots of Output Variables 72
4.2.6 Cumulative Distribution Function Plots 73
4.2.7 Sensitivity Plots 80
4.2.8 Linear Correlation Coefficients 81
4.2.9 Spearman Rank Order Correlation Coefficients 82
CHAPTER 5 CONCLUSIONS AND RECOMMENDATIONS
5.1 Summary of the Study 84
5.2 Limitations 85
5.3 Suggestions 85
5.4 Conclusion 86
REFERENCES 88
APPENDICES
A Log File of 3D Transmission Tower Analysis 90
B Eurocode 3 Checking of Transmission Tower 100
C Stiffness Matrix of Transmission Tower 105
xi
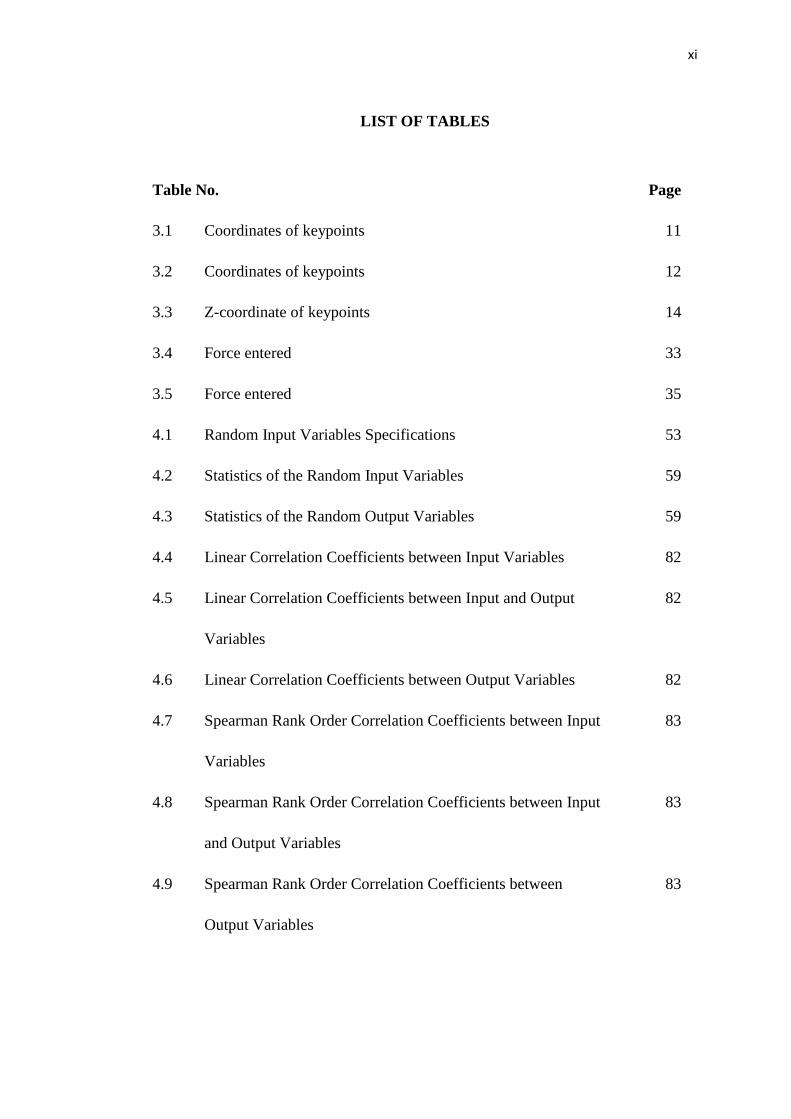
LIST OF TABLES
Table No. Page
3.1 Coordinates of keypoints 11
3.2 Coordinates of keypoints 12
3.3 Z-coordinate of keypoints 14
3.4 Force entered 33
3.5 Force entered 35
4.1 Random Input Variables Specifications 53
4.2 Statistics of the Random Input Variables 59
4.3 Statistics of the Random Output Variables 59
4.4 Linear Correlation Coefficients between Input Variables 82
4.5 Linear Correlation Coefficients between Input and Output
Variables
82
4.6 Linear Correlation Coefficients between Output Variables 82
4.7 Spearman Rank Order Correlation Coefficients between Input
Variables
83
4.8 Spearman Rank Order Correlation Coefficients between Input
and Output Variables
83
4.9 Spearman Rank Order Correlation Coefficients between
Output Variables
83
xii
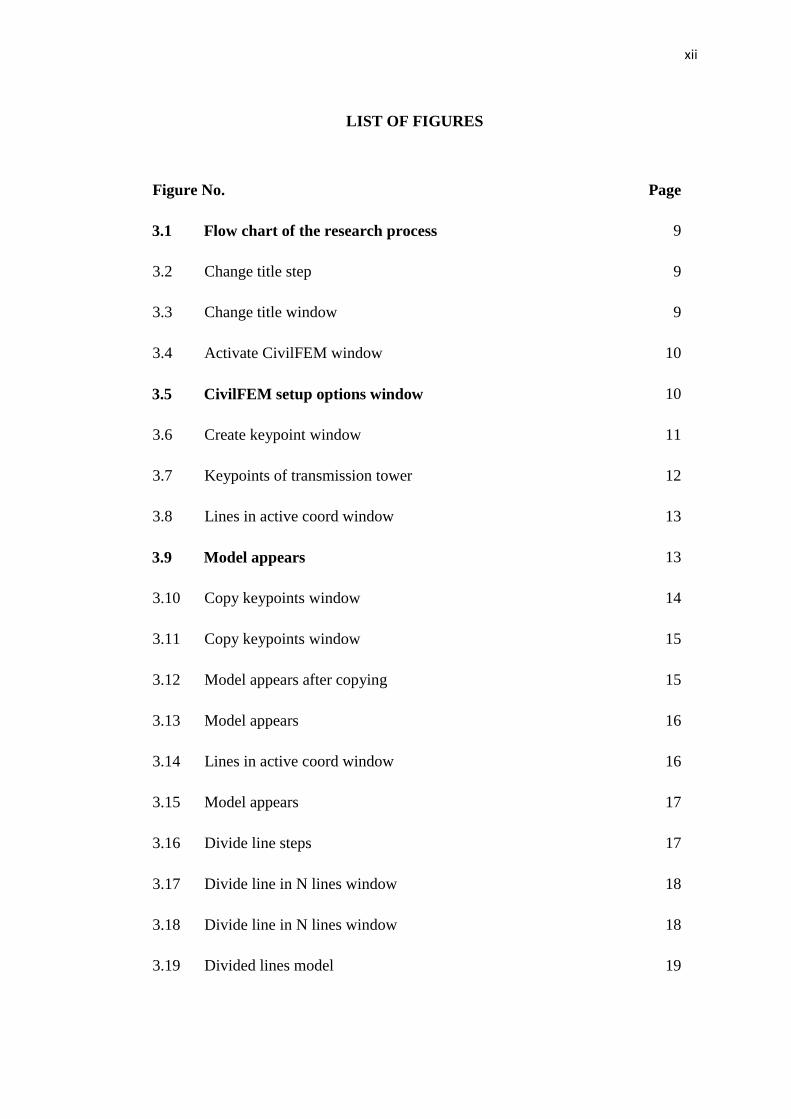
LIST OF FIGURES
Figure No. Page
3.1 Flow chart of the research process 9
3.2 Change title step 9
3.3 Change title window 9
3.4 Activate CivilFEM window 10
3.5 CivilFEM setup options window 10
3.6 Create keypoint window 11
3.7 Keypoints of transmission tower 12
3.8 Lines in active coord window 13
3.9 Model appears 13
3.10 Copy keypoints window 14
3.11 Copy keypoints window 15
3.12 Model appears after copying 15
3.13 Model appears 16
3.14 Lines in active coord window 16
3.15 Model appears 17
3.16 Divide line steps 17
3.17 Divide line in N lines window 18
3.18 Divide line in N lines window 18
3.19 Divided lines model 19
xiii
3.20 Lines in active coor window 19
3.21 Model of transmission tower 20
3.22 Beam element types for code checking window 20
3.23 Material browser window 21
3.24 Material browser window 21
3.25 Cross sections explorer window 22
3.26 Hot rolled shapes library window 22
3.27 Cross sections explorer window 23
3.28 Member properties window 23
3.29 Member property 1 window 24
3.30 Member properties explorer window 24
3.31 Beam and shell properties window 25
3.32 Beam 1 window 25
3.33 Beam and shell properties window 26
3.34 Mesh size steps 26
3.35 Element sizes on all selected lines window 27
3.36 Model appears after mesh size 27
3.37 Mesh line steps 28
3.38 Mesh lines window 28
3.39 Model appears after meshing 29
3.40 Saving work steps 29
3.41 Apply constraint steps 30
xiv
3.42 Apply U,ROT on KPs window 30
3.43 Apply U,ROT on KPs window 31
3.44 Applied constrain model 31
3.45 Apply load steps 32
3.46 Apply F/M on KPs window 32
3.47 Apply F/M on KPs window 33
3.48 Model with load 33
3.49 Apply wind load steps 34
3.50 Apply PRES on beams window 34
3.51 Apply PRES on beams window 35
3.52 Model with wind load 35
3.53 Solving steps 36
3.54 Status command window 36
3.55 Note window 37
3.56 Code checking steps 37
3.57 Code checking 38
3.58 Beam result steps 38
3.59 Graph steel results window 39
3.60 Tension result 39
3.61 Compression result 40
3.62 Bending moment result 40
3.63 Shear result 41
xv
3.64 Bending & shear result 41
3.65 Bending & axial force result 42
3.66 Bending, axial & shear result 42
3.67 Compression buckling result 43
3.68 Bending buckling result 43
3.69 Bending & compression buckling result 44
3.70 Reaction solution steps 44
3.71 List reaction solution window 45
3.72 List of reaction forces 45
3.73 Plot deformed shape steps 46
3.74 Plot deformed shape window 46
3.75 Result of deform shape 47
3.76 Plot result steps 47
3.77 Contour nodal solution data window 48
3.78 Deflection result appears 48
3.79 List result steps 49
3.80 List nodal solution window 49
3.81 List nodal solution window 50
3.82 Forces & moments steps 50
3.83 Graph force and moment results window 51
3.84 Forces and moments result window 51
4.1 PDF & CDF of Input Random Variable DEADLOAD1 54
xvi
4.2 PDF & CDF of Input Random Variable DEADLOAD2 54
4.3 PDF & CDF of Input Random Variable DENS 55
4.4 PDF & CDF of Input Random Variable ELASTIC 55
4.5 PDF & CDF of Input Random Variable POISSON 56
4.6 PDF & CDF of Input Random Variable TEMP 57
4.7 PDF & CDF of Input Random Variable WINDLOAD1 57
4.8 PDF & CDF of Input Random Variable WINDLOAD2 58
4.9 Sampled Values for Output Parameter
MAXIMUMDEFLECTION
60
4.10 Mean Value History for Output Parameter
MAXIMUMDEFLECTION
60
4.11 Standard Deviation History for Output Parameter
MAXIMUMDEFLECTION
61
4.12 Minimum Value History for Output Parameter
MAXIMUMDEFLECTION
62
4.13 Maximum Value History for Output Parameter
MAXIMUMDEFLECTION
62
4.14 Sampled Values for Output Parameter MAX_DEFLECTION 63
4.15 Mean Value History for Output Parameter
MAX_DEFLECTION
63
4.16 Standard Deviation History for Output Parameter
MAX_DEFLECTION
64
xvii
4.17 Minimum Value History for Output Parameter
MAX_DEFLECTION
64
4.18 Maximum Value History for Output Parameter
MAX_DEFLECTION
65
4.19 Sampled Values for Output Parameter
MAXIMMUMDEFLECTION
66
4.20 Sampled Values for Output Parameter MAX_DEFLECTION 66
4.21 Histogram of Input Variable for DEADLOAD1 67
4.22 Histogram of Input Variable for DEADLOAD2 68
4.23 Histogram of Input Variable for DENS 69
4.24 Histogram of Input Variable for ELASTIC 69
4.25 Histogram of Input Variable for POISSON 70
4.26 Histogram of Input Variable for TEMP 70
4.27 Histogram of Input Variable for WINDLOAD1 71
4.28 Histogram of Input Variable for WINDLOAD2 71
4.29 Histogram of Output Variable for MAXIMUMDEFLECTION 72
4.30 Histogram of Output Variable for MAX_DEFLECTION 73
4.31 CDF of Input Variable DEADLOAD1 74
4.32 CDF of Input Variable DEADLOAD2 75
4.33 CDF of Input Variable DENS 75
4.34 CDF of Input Variable ELASTIC 76
4.35 CDF of Input Variable POISSON 76
xviii
4.36 CDF of Input Variable TEMP 77
4.37 CDF of Input Variable WINDLOAD1 78
4.38 CDF of Input Variable WINDLOAD2 78
4.39 CDF of Output Variable MAXIMUMDEFLECTION 79
4.40 CDF of Output Variable MAX_DEFLECTION 79
4.41 Sensitivity Plot for MAXIMUMDEFLECTION 80
4.42 Sensitivity Plot for MAX_DEFLECTION 81
1
CHAPTER 1
INTRODUCTION
1.1 INTRODUCTION
This chapter will introduce readers to this study. Furthermore, readers will
manage to get information on background of study, problem statement as well as
objectives, and scope of the study.
1.2 BACKGROUND OF STUDY
Nowadays, our world is becoming more developed and developing as we know.
Due to this, power consumption has continued to rise and this in turn had led to the
increase in the number of power stations as well as power transmission towers from the
generating stations to the load centres. Electrical power demand has been increasing
around the world and many large-scale transmission towers have been newly
constructed [1].
Generally, transmission tower is a medium to carry power loads from one station
to another station. It is usually composed of steel and is able to run at long distances.
Transmission tower consist of several types and designed in accordance to the tower
height and capacity of tower to support load from the conductor, compression load,
wind load, vertical load, longitudinal load and uplift load. Transmission towers are
usually used where large amount of electrical current is to be distributed often ranging
from 115,000 to 800,000 volts. Transmission towers are a vital component and
management to assess reliability is needed to minimise the risk of power supply
disruption that may result from in-service tower failure [2]. Towers are widely regarded
as one of the most difficult form of lattice structure to analyse [2].
2
1.3 PROBLEM STATEMENT
The use of electrical power has become an increasingly important part of the
economy of industrial countries. Transmission tower supports the phase conductors and
earth wires of transmission line [3]. The importance of the transmission tower on
national economy and people‟s living has been well recognized. Unfortunately, natural
disasters such as earthquakes and floods come without notice. These natural phenomena
caused major damages to the transmission towers. During the attack of the Ji-Ji
earthquake, with a size of 7.3 in Richter magnitude, in Taiwan on Sept. 21, 1999, the
strong vibration of ground motion has caused the collapse of a main transmission tower
located in the central region of the state [4]. Many transmission towers were built in the
mountains or crossing rivers under rugged circumstances to overcome the loss electrical
supply.
Before designing and planning in a construction, analysis of the structure
becomes the main role in the process. Transmission tower structures are generally
analysed by linear static analysis methods but it is also necessary to determine the
deformation of the structure as well so that any failure can be avoided. In addition,
Finite Element Analysis was applied towards the design of the transmission tower.
However, using this manual method is less efficient and less practical. Therefore,
computer software called ANSYS was used to compute calculation in order to create a
safe and optimum design.
1.4 OBJECTIVES
An objective of study is an important aspect to be considered in any research. It
might be useful as a guideline in preparing a research in order to get the expected result.
The main objective of this study is to analyse the transmission tower using
Probabilistic Design System (PDS). The sub-objectives are:
i. To determine the reaction forces, deformation, deflection, forces and moments.
3
ii. To study the purpose of code checking on the structure.
1.5 SCOPE OF STUDY
During this study, several scopes are set to ensure that the objectives of this
study can be achieved and any other variables that are not considered in the scope can
be eliminated. The factors that are considered are:
i. Selection of a transmission tower structure.
ii. Using ANSYS as a software modelling process based on Finite Element
Analysis.
1.6 SIGNIFICANCE OF STUDY
Significance of study is a general outline on the importance of the study which
will be carried out. In terms of a research paper, the significance of study refers to the
expected outcome from the research. Firstly, this study is important to produce a
structure without failures. Failures within a structure can cause incidents such as
collapse or breakdown when dealing with other environmental factors. Besides that, by
doing this research, it is important to develop a structure that is environmentally viable
as well as political acceptable. If these factors are not accounted in the research, it might
bring unwanted occasions such as rebellion from the public.
4
CHAPTER 2
LITERATURE REVIEW
2.1 INTRODUCTION
Literature review contains four topics that discuss specifically and review on
past study. The topics are transmission tower, steel and truss, finite element analysis and
ANSYS. These topics are important when we analyse and design a transmission tower
structure.
2.2 TRANSMISSION TOWER
In general, transmission tower is defined as a set of steel structure that
distributes electrical power through transmission lines. Towers or masts are structures
that are built in order to fulfil the need for placing objects or persons at a certain level
above the ground [3]. Transmission tower can be modelled by truss or frame element
[5]. The result of a field test was compared to those of a finite element analysis. The
comparison indicated that tower member can be modelled adequately by truss element;
it shows that transmission tower also can be concluded as truss structure.
Recent developments in manufacturing of truss structure appear to greatly
extend their application possibilities where that application possibility also involves a
transmission tower [6]. Besides that, in the paper titled “The united design method of a
transmission tower and the foundation” mentioned that transmission tower is designed
as the truss structure [7]. Truss structures are ubiquitous in the industrialized world,
appearing as bridges, tower, as roof support and building exoskeletons [8].

5
2.3 STEEL AND TRUSS
Truss can also act like a beam which involves bending resistance by couple
created by force in the top and bottom member. In accordance to researchers who
present different design philosophy, where tower are modelled with beam elements [9].
Truss structure can consist of rigid beam, pin connected at joint and also exerting axial
force only [8].
Steels are the materials that commonly used for truss structure as well as a
transmission tower. It is contended that the steel as a building material has been used
extensively by various types of structure which concludes high-rise building skeletons,
industrial building, transmission tower, railway bridges, overhead tank, bunkers and
silos [10]. Transmission tower structures are generally constructed using symmetric
thin-walled angle section members which are eccentrically connected [2] while latticed
transmission towers are constructed using eccentrically connected angle section
members [11].
2.4 FINITE ELEMENT ANALYSIS
Based on the appearance of the transmission tower itself, we can imagine the
difficulty in the time constraint of analysing, designing and also constructing this
structure. Consequently, finite element method is used in order to simplify the
processes. Moreover, Finite Element Analysis (FEA) is an engineering software with
the purposed of accepting input data and determined a structure design to meet the
performance criteria. It can be used in analyse and design transmission tower. Finite
Element Analysis (FEA) was first developed in 1943 by R.Courant [12]. He has utilized
the Ritz method of numerical analysis and minimization of variation calculus in order to
obtain approximate solutions to vibration systems. Shortly after that, M. J. Turner, R.W.
Clough, H.C. Martin, and L. J. Topp established a broader definition of numerical
analysis in a paper published in 1956. “Stiffness and deflection of complex structure” is
the aim of this paper.
6
By using finite element, numerical solutions for complicated stress problem can
be solved by using Finite Element Analysis (FEA). Finite element analysis software
available are such as LUCAS, MSC Patran, ANSYS, ABAQUS Algor (FEMPRO),
STAAD PRO, RISA, PROKON, MIKROSTRAN, BRICSCA and many more. Besides
this, AK Tower is also a finite element computer program that used geometric and
material nonlinear analysis to stimulate the ultimate structural behaviour of lattice
transmission tower as stated by [2].
2.5 ANSYS
Despite all software that has been stated, this study only applies the usage of
ANSYS software. ANSYS is a finite element analysis package used widely in industry
to simulate the response of a physical system to structural loading, and also thermal and
electromagnetic effects. It also uses the finite element method to solve the underlying
governing equations and the associated problem-specific boundary conditions like have
been stated by Steve Weidner (2012) and edited by Chia-Hsun Hsieh (2012).
Design Optimizing before the construction begins is the best way to ensure no
time and cost overruns. It also helps in ensuring that the individual structural
components work properly, placement and designing HVAC equipment, to protect
buildings occupants and structures from disaster by devising smoke management
systems, modelling air flow for occupant comfort, and last but not least analysing
environmental-structural effects are all possible through ANSYS engineering simulation
software. With its modular structure, ANSYS software gives the opportunity for taking
up only needed features. By adding CAD and FEA connection modules, ANSYS can
work to integrate with other used engineering software on the desktop. ANSYS have
ability to import CAD data and also able to build geometry with its “pre-processing”
abilities. Thus, the finite element model is generated. Results can be viewed as
numerical and graphical after defining loadings and carrying out analyses. ANSYS too
can carry out advanced engineering Element Method where pioneering mathematical
formalism of the method is being built.
7
CHAPTER 3
RESEARCH METHODOLOGY
3.1 INTRODUCTION
In this chapter, readers will get brief information on the methods that are used to
get information for this study. ANSYS software is used to run this project in order to
achieve the objectives. Generally, ANSYS program is computer program for finite
element analysis and design. The analysis process of transmission tower using ANSYS
will be conducted by using the following steps which are Pre-processing Process,
Solution Process and Post-processing Process.
Pre-processing Process is the step where defining the problem takes part. This
process includes defining project title for this project, modelling process which includes
creating the key points and also forming lines, defining the element being used, its
geometry properties, element material properties, mesh size and meshing process.
Solution Process is the step where load assigned and solving process take part. It
includes defining the analysis type where for this project the analysis type is static.
Apply constraints and also load to model and last but not least solving the problem
Post-processing Process is the step where results can be viewed. The result can
be viewed in two forms which is in a form of figure that can symbolize the result for
example a figure that shows a bend transmission tower due to load or numbering forms
which shows all the data required such as deflection value.
8
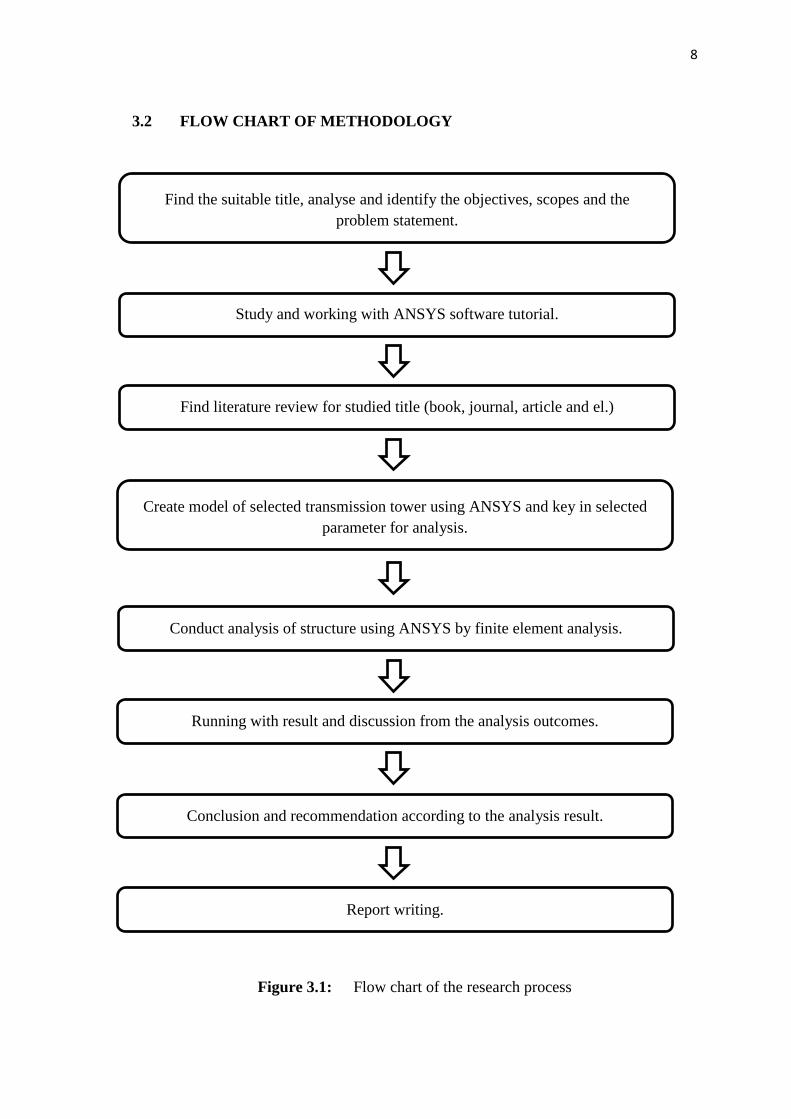
3.2 FLOW CHART OF METHODOLOGY
Figure 3.1: Flow chart of the research process
Find the suitable title, analyse and identify the objectives, scopes and the
problem statement.
Study and working with ANSYS software tutorial.
Find literature review for studied title (book, journal, article and el.)
Create model of selected transmission tower using ANSYS and key in selected
parameter for analysis.
Conduct analysis of structure using ANSYS by finite element analysis.
Running with result and discussion from the analysis outcomes.
Conclusion and recommendation according to the analysis result.
Report writing.
9
3.3 PRE-PROCESSOR PROCESS
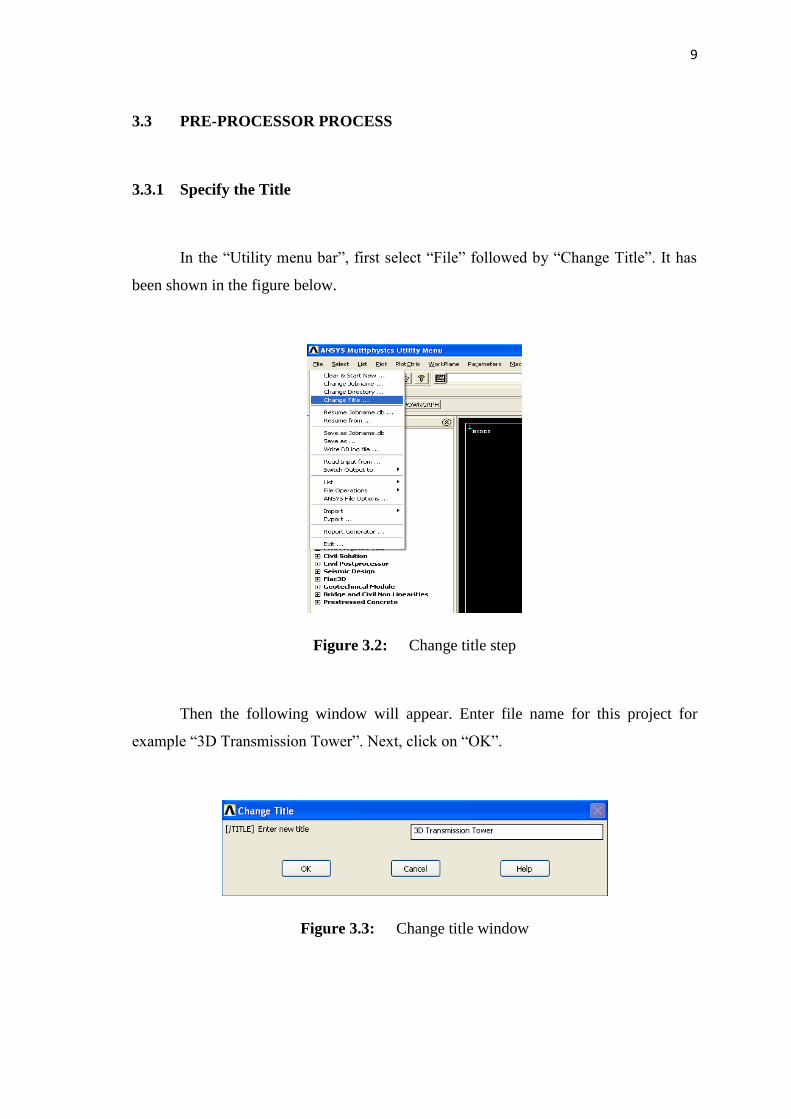
3.3.1 Specify the Title
In the “Utility menu bar”, first select “File” followed by “Change Title”. It has
been shown in the figure below.
Figure 3.2: Change title step
Then the following window will appear. Enter file name for this project for
example “3D Transmission Tower”. Next, click on “OK”.
Figure 3.3: Change title window
10
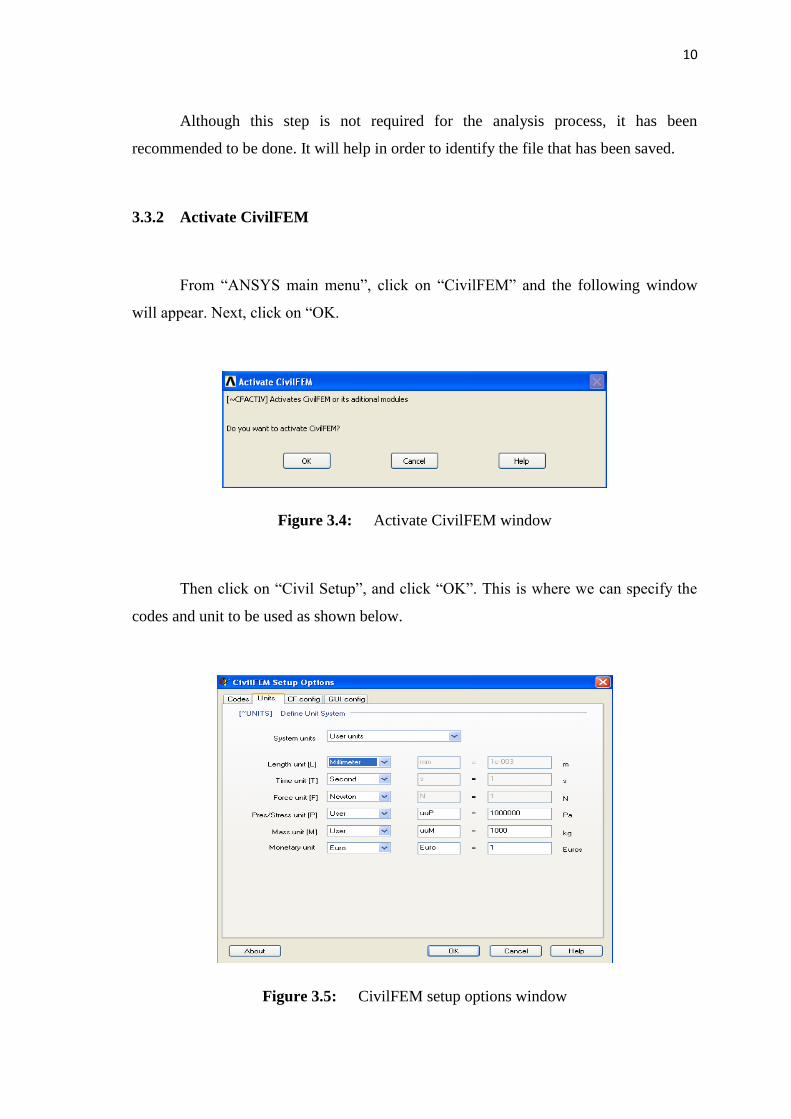
Although this step is not required for the analysis process, it has been
recommended to be done. It will help in order to identify the file that has been saved.
3.3.2 Activate CivilFEM
From “ANSYS main menu”, click on “CivilFEM” and the following window
will appear. Next, click on “OK.
Figure 3.4: Activate CivilFEM window
Then click on “Civil Setup”, and click “OK”. This is where we can specify the
codes and unit to be used as shown below.
Figure 3.5: CivilFEM setup options window