finite element analysis of steel - ku scholarworks
TRANSCRIPT
FINITE ELEMENT ANALYSIS OF STEEL WELDED COVERPLATE INCLUDING COMPOSITE DOUBLERS
By
Brad Petri
Submitted to graduate degree program in Civil Engineering
and the Faculty of the Graduate School of the University of Kansas In partial fulfillment of the requirements for the degree of
Master’s of Science
________________________ Chairperson Committee Members ________________________ ________________________ Date defended:________________________

i
The Thesis Committee for Brad Petri certifies that this is the approved version of the following thesis:
FINITE ELEMENT ANALYSIS OF STEEL WELDED COVERPLATE INCLUDING COMPOSITE DOUBLERS
Committee:
______________________________ Chairperson ______________________________ ______________________________ Date approved: ______________________________

ii
ABSTRACT
With the increasing focus on welded bridge members resulting in crack initiation and
propagation, there is a large demand for creative solutions. One of these solutions
includes the application of composite doublers over the critical weld. In order to
establish an effective finite element analysis, models were created using ABAQUS
(2007). Models were created to properly represent physical testing being done parallel to
this study. These models represented the control specimen, consisting of a welded
coverplate, and several composite doubler arrangements. The first composite doubler
analyzed consisted of the smooth shape which was designed for easy transfer of stresses
between composite and steel material. The next models used a rectilinear composite
shape, which was designed to simplify the construction of these doublers, these models
varied by the bond length on the top plate. Finally an analysis was conducted to evaluate
the effect of the Young’s modulus of the composite material. The results from each
model were then compared and the most effective arrangement was stated.

iii
ACKNOWLEDGMENTS
Completion of this project would not have been possible with out the contribution
of the following:
First, I would like to thank Dr. Matamoros for his guidance and assistance during
this project. His expertise in the area helped greatly along with his willingness and
ability to help with the many problems that surfaced throughout this process. I would
also like to thank my peers, including Brian Vilhauer, Fatih Alemdar, and Benjamin
Kaan. Their assistance in several aspects of this project helped me to successfully grasp
concepts including the specimens, materials and ABAQUS (2007). Lastly I would like to
thanks Drs. Stanley Rolfe and Caroline Bennett for their assistance during the final steps
of this process.
This study was funded through a grant from the Transportation Research Institute
at the University of Kansas. Finally I would like to acknowledge the CEAE Department
at the University of Kansas for their financial support.

iv
TABLE OF CONTENTS
ACCEPTANCE PAGE…………………………………………………………………….i
ABSTRACT………………………………………………………………………………ii
ACKNOWLEDGEMENTS………………………………………………………………iii
TABLE OF CONTENTS…………………………………………………………………iv
LIST OF FIGURES………………………………………………………………………vi
LIST OF TABLES……………………………………………………………………...viii
PROBLEM STATEMENT………………………………………………………………..1
CHAPTER 1 LITERATURE REVIEW
1.1 BOND BETWEEN COMPOSITE AND STEEL IN FATIGUE
DAMAGED STEEL GIRDERS…………………………………………..2
1.2 DESIGN OF TEST SPECIMEN TO MEASURE BOND BETWEEN
COMPOSITE AND STEEL GIRDERS…………………………………..5
1.3 USE OF COMPOSITE MATERIALS TO PREVENT CRACK
PROPOGATION………………………………………………………….9
1.4 CFRP OVERLAY APPLICATION……………………………………..12
1.5 FATIGUE ENHANCEMENT USING CARBON-FIBER
COMPOSITES…………………………………………………………...15
1.6 SUMMARY……………………………………………………………...19
CHAPTER 2 SPECIMEN DESCRIPTION
2.1 SPECIMEN DIMENSIONS……………………………………………..21
2.2 3-D MODEL……………………………………………………………..23
2.3 RESULTS………………………………………………………………..26
CHAPTER 3 PARAMETRIC STUDY
3.1 EFFECT OF DOUBLER SHAPE……………………………………….44

v
3.1.1 EFFECT ON FATIGUE LIFE…………………………………...46
3.2 EFFECT OF YOUNG’S MODULUS…………………………………...49
CHAPTER 4 CONCLUSIONS
CONCLUSIONS………………………………………………………………...54
REFERENCES…………………………………………………………………………..58

vi
LIST OF FIGURES
FIGURE 1.1 CONFIGURATIONS OF SPECIMEN…………………………………...4
FIGURE 1.2 ANALYSIS MODEL……………………………………………………...6
FIGURE 1.3 SINGLE-LAP SPECIMEN………………………………………………..8
FIGURE 1.4 EXPERIMENTAL TEST SETUP………………………………………...9
FIGURE 1.5 TEST SPECIMEN……………………………………………………….10
FIGURE 1.6 SPECIMEN GEOMETRY………………………………………………12
FIGURE 1.7 STEEL TEST SPECIMEN………………………………………………15
FIGURE 1.8 COMPOSITE DOUBLER DESIGNS...………………………………....17
FIGURE 1.9 INITIAL DOUBLER FATIGUE TEST…………………………………18
FIGURE 1.10 REDESIGNED DOUBLER FATIGUE TEST…………………………..19
FIGURE 2.1 CONTROL SPECIMEN ELEVATION VIEW………………………….21
FIGURE 2.2 SMOOTH-SHAPED COMPOSITE DOUBLER………………………..22
FIGURE 2.3 RECTILINEAR COMPOSITE DOUBLER……………………………..23
FIGURE 2.4 CONTROL SPECIMEN ELEVATION…………………………………24
FIGURE 2.5 PLACEMENT OF STRAIN GAGES……………………………………25
FIGURE 2.6 STRESS RANGE COMPARISON OF WELDED SPECIMEN………..26
FIGURE 2.7 ELEVATION VIEW OF SMOOTH-SHAPED COMPOSITE
DOUBLER………………………………………………………………27
FIGURE 2.8 DEFLECTION COMPARISON OF WELDED SPECIMEN…………..28
FIGURE 2.9 DEFELCTION COMPARISON OF COMPOSITE DOUBLER
MODEL………………………………………………………………….28
FIGURE 2.10 ELEVATION VIEW OF DEFLECTED SHAP…………………………30
FIGURE 2.11 ELEVATION VIEW SHOWING LONGITUDINAL STRESS………...33
FIGURE 2.12 SECTION SHOWING LONGITUDINAL STRESS NEAR THE AREA
OF THE WELD………………………………………………………….36
FIGURE 2.13 ELEVATION VIEW SHOWING MAXIMUM PRINCIPAL STRESS...39
FIGURE 2.14 CROSS SECTION SHOWING MAXIMUM PRINCIPAL STRESS IN
THE REGION NEAR THE WELD……………………………………..41

vii
FIGURE 2.15 FATIGUE FAILURE IN PHYSICAL SPECIMEN……………………..42
FIGURE 3.1 ELEVATION VIEW OF COMPUTATIONAL MODEL INCLUDING
THE COMPOSITE DOUBLERS FOR VARIOUS COMPOSITE
DOUBLER CONFIGURATION………………………………………...45
FIGURE 3.2 S MAX STRESS COMPARISON IN MODIFIED COMPOSITE
DOUBLERS……………………………………………………………..46
FIGURE 3.3 AASHTO (2007) FATIGUE LIFE CYCLE……………………………..47
FIGURE 3.4 AASHTO (2007) FATIGUE LIFE CYLCE OF NOMINAL MODIFIED
STRESS RANGE………………………………………………………..48
FIGURE 3.5 CONTOURS SHOWING VON MISES STRESSES ON DEFORMED
SHAPE FOR COMPUTATIONAL MODEL…………………………...51
FIGURE 3.6 EFFECTS OF EC ON MAXIMUM VON MISES STRESS…………….52
FIGURE 3.7 EFFECTS OF EC ON MAXIMUM PRINCIPAL STRESS……………..53

viii
LIST OF TABLES
TABLE 1.1 MATERIAL PROPERTIES OF CFRP STRIPS AND ADHESIVE……...3
TABLE 2.1 STRESS COMPARISON………………………………………………..26
TABLE 2.2 CONTROL SPECIMEN AND MODEL DEFLECTION COMPARISON
AT 5.2 KIP LOAD ………………………………………………………27
TABLE 2.3 COMPARISON IN DEFLECTION……………………………………..31
TABLE 3.1 FATIGUE LIFE COMPARISON………………………………………..47
TABLE 3.2 FATIGUE LIFE COMPARISON OF NOMINAL MODIFIED STRESS
RANGE…………………………………………………………………..48

1
Problem Statement With the use of welded cover plates in the bridge construction process, there is a
common problem of crack initiation and propagation near the weld toe. It is a common
practice in steel bridge construction to use welds that are defined as AASHTO category E
or E’ details. These categories produce the most severe stress demands and therefore
result in early crack formation. Several solutions have been analyzed to remedy this
problem. One of these solutions, which is currently under development at the University
of Kansas (Kaan et al., 2008), includes the application of composite doublers over the
critical weld toe. These composite doublers are intended to prolong the initiation and
propagation of cracks and increase the fatigue life of the welded specimen. In order to
properly analyze the results of the specimens, it was be necessary to conduct a finite
element analysis using ABAQUS (2007). Models were created representing the control
specimen consisting of a welded coverplate. Other models were created to represent the
application of composite doublers. These composite doublers were varied in size in an
attempt to establish the most effective shape and size.

2
Chapter 1 Literature Review
A literature review was carried out to identify previous work on the use of
composite materials to extend the fatigue life of steel structures. There were some
similarities found with previous studies, although the strategy to increase fatigue life
investigated in this study is significantly different from those used in the past.
1.1 BOND BETWEEN COMPOSITE AND STEEL IN FATIGUE DAMAGED
STEEL GIRDERS
Two studies by Nozaka et al. (2005) investigate the effectiveness of carbon-fiber-
reinforced polymer (CFRP) strips for increasing fatigue life of steel girders. Testing was
designed to compare how several types of adhesives and laminates would perform in
different configurations.
Two different CFRP types and a total of five adhesives were evaluated. The two
CFRP were Carbodur and Tyfo UC, which have a Modulus of elasticity of 22,800 ksi and
16,500 ksi, respectively (Nozaka et al., 2005 b). For each CFRP the measured values of
tensile strength, ultimate tensile strain, and dimensions are provided values in Table 1.1.
The adhesives used consisted of Sikadur 330, Sikadur 30, PLUS 25, DP-460 NS and
Tyfo TC. The tensile strength of the adhesives was found to be 5,950 ksi, 3,630 ksi,
2,470 ksi, 5,080 ksi, and 6,820 ksi, respectively.

3
Table 1.1. Material properties of CFRP strips and adhesive (taken from Nozaka et al., 2005 b)
Tensile strength of the CFRPs was measured according to the procedure in ASTM
D 3039 (ASTM 1995). Tensile strength of two of the adhesives was determined using
standard ASTM D 638 (ASTM 1997), while the remaining three were obtained from the
manufacturer. It is to be noted that the CFRP consisted of epoxy resin and the adhesives
were applied to the CFRP and steel without the use of any primers.
The testing rig consisted of a W14x68 girder 14.1 ft long and made of A572
Grade 50 steel. Within the mid span of the girder a large hole and a 0.51 in. wide slit
were machined to represent a crack in the tension flange and focus the tensile force in
that area. The CFRP was then placed on the outer face of the tension flange to ensure the
highest effectiveness. A total of five different configurations were tested, shown in Fig
1.1.

4
Fig. 1.1. Configurations of specimen (taken from Nozaka et al., 2005 b)
Three of the configurations consisted of the same 0.51 in. slit but differed by the
placement of the adhesive. The first configuration applied the adhesive across the slit on
the CFRP while the second configuration also applied the adhesive within the slit;
configuration three applied the adhesive solely on the CFRP strip and did not apply the
adhesive across the slit. The remaining two configurations required the closing of the slit
by placing the plates together. Configuration four used the adhesive the full length of the
CFRP strip while configuration five left a 4.0 in. span across the crack unbonded. Each
specimen included one to three layers of the CFRP (Nozaka et al., 2005 b). The CFRP
was bonded onto individual steel plates which were then bolted to the tension flange of
the girder. This was done to make it possible to reuse the girder by removing the steel
plates. The specimens were then loaded monotonically in four-point bending under
displacement control.

5
It was found that the specimens did not fail due to tensile failure of the CFRP but
rather due to a mixture of tensile failure along with debonding. When comparing the
results from the twenty-seven specimens it was found that the Tyfo UC strip with the DP-
460 NS adhesive and the Tyfo UC strip with the Tyfo UC adhesive produced the highest
strains within the CFRP strips, which was stated by Nozaka et al. (2005). From these
results it was determined that the DP-460 NS adhesive the most advantageous due to
simplicity of application. During testing it was also found that configuration five resulted
in the highest tensile strain in the specimens, and that increasing the CFRP layers
improved the maximum moment at failure but failed to increase the strain at failure.
The Nozaka et al. (2005) model developed in ABAQUS (2007) consisted of half
of the test girder, which was split at the center of the span. The mesh consisted of 20,000
nodes and 20,000 elements. The adhesive was modeled as elastic-perfectly plastic, and
the rest of the model was geometrically nonlinear and materially linear. Each material
was then modeled as isotropic while boundary conditions were applied on the specimen
centerline. An analysis of the model was performed using a two-dimensional model.
1.2 DESIGN OF TEST SPECIMEN TO MEASURE BOND BETWEEN
COMPOSITE AND STEEL GIRDERS
In the continuation of the previous research project (Nozaka et al., 2005 a),
several options were evaluated to properly test the bond strength of CFRP strips. Two
commonly used tests use single-lap and double-lap specimens. These have been
extensively used to test the shear strengths of adhesives to metals. One of the concerns
expressed by Nozaka et al., was that a single-lap test will cause the joint to rotate. This is
due to the misalignment of neutral axis between the separate parts, and it results in a

6
peeling stress along with a shear stress acting on the interface between the resin and the
steel girder. Therefore a single-lap specimen will not result in a failure due to solely
shear stress, but rather a combination of shear and peeling stress. In order to evaluate the
various bond tests Nozaka et al. (2005) started by investigating the stresses on a fatigue-
damaged girder repaired with composite materials. The model consisted of two CFRP
strips bonded to the inner surface of the tension flange of the girder. One CFRP strip was
located on each side of the web.
Fig. 1.2. Analysis model: (a) overview; (b) flange detail (taken from Nozaka et al., 2005 a)
The specimen was modeled using ABAQUS (2007), as shown in Fig. 1.2. Each
section was modeled using isoperimetric eight-node elements. The 0.06 in. thick
adhesive layer was broken into three layers, while the 0.05 in. thick CFRP layer was
modeled using only two layers. A crack was then modeled by a 0.005 in. slit within the
flange of the girder, similar to the previous project. Boundary conditions were then
applied to the edge of the model to represent a simple support. The CFRP was modeled

7
as an elastic element while the steel and adhesive were modeled as elastic-perfectly
plastic materials. Material properties were assumed for the model. The modulus of
elasticity for the steel, CFRP, and adhesive were 29,000 ksi, 23,900 ksi and 653 ksi,
respectively. Poisson’s ratios for the steel, CFRP and adhesive were 0.3, 0.3 and 0.4,
respectively. A Yield strength of 49 ksi was assumed for the steel, while the ultimate
strengths of the CFRP and adhesive were 406 ksi and 6.0 ksi, respectively. A 80 kip
concentrated load was applied to the centerline of the girder.
By modeling the specimen in this fashion it was possible to calculate the shear,
peeling and normal stresses. By comparing the shear stresses near the CFRP, with and
without the CFRP strip, it was possible to determine that the stress was reduced when the
CFRP strip was applied. These effects contributed to the transfer of forces from the
girder flange to the CFRP. It was also shown that shear and peeling stresses increased on
both edges of the strip due to an edge effect, which can cause debonding.
Before physical testing could be performed, it was necessary to explore alternate
specimen types to properly test the bonded CFRP. In an attempt to minimize peeling
stress during testing, three separate test specimens were considered. The chosen specimen
consisted of a 0.5 in. thick plate of 12 in. length, shown if Fig. 1.3. The thickness of the
end of the plate was increased in an attempt to align the neutral axis of each section.
Restraints were then applied to the end of the specimen to limit rotation.

8
Fig. 1.3. Single-lap specimen: (a) modified single-lap: (b) typical single-lap joint (taken from Nozaka et al., 2005 a,b)
The first step of testing was to examine the effect of varying steel thickness.
Three different thicknesses were tested including 0.5, 0.7 and 1.0 in. By examining the
results it was found that changing the steel thickness had no major effect on the shear
stress. With further investigation it was found that the tensile stress in the steel adherent
was beyond the yield strength of the steel (Nozaka et al., 2005 a). This occurred before
the CFRP strip failed; therefore this type of specimen could not be used for testing. For
this reason it was concluded that single-lap specimens were inadequate to measure the
true bond strength of CFRP strips bonded to steel (Nozaka et al., 2005 a).
Nozaka et al. (2005) concluded that the test specimen had to be attached to the
girder by bonding the CFRP strips to steel plates which were then bolted to the tension
flange of the girder. This test arrangement was also used for the testing in their previous
study (Nozaka et al., 2005 a). A large hole and slit was machined at the mid span of the
girder to represent a fatigue crack in the tension flange. By doing this the applied
compression force would be isolated through the crack, optimizing the effect on the

9
crack. The specimen was then tested under four-point loading with supports 5.0 in. from
the edges of the girder, as shown in Fig. 1.4.
Fig. 1.4. Experimental test setup: (a) test setup: (b) specimen dimensions (taken from Nozaka et al., 2005 a,b)
1.3 USE OF COMPOSITE MATERIALS TO PREVENT CRACK
PROPAGATION
A technique used to prevent the propagation of cracks initiated by fatigue is to
bond a prestressed CFRP strip across an existing crack. The CFRP strip introduces a
compression force in an attempt to stop crack growth while also providing a bridge
between the two sides of the crack that can help transfer stresses (Colombi et al., 2003).

10
Used in this manner bonding a prestressed CFRP strip to a steel member can lead to an
increase in the fatigue life of the structural member.
Fig. 1.5. Test specimen (taken from Colombi et al., 2003)
In a study by Colombi et al. (2003) a steel plate was prepared with a drilled hole
and two 0.2 in. fatigue cracks propagating from the sides. The diameter was chosen to
represent that of a riveted hole with a 0.4 in. radius because this application is mainly
intended for riveted steel bridges. The plate was then reinforced by two prestressed
CFRP strips, one on each side of the hole as in Fig. 1.5. A constant amplitude load range
of 54 kip was then used to test with a load ratio of 0.4. During testing it was observed
that when the crack began to propagate to the CFRP strip, the strip began to debond due
to a high stress concentration in that area. This process is referred to as delamination.
A partial analytical model was made taking advantage of the symmetry of the
specimen. For this model a tensile stress of 19 ksi was applied along the length of the
specimen. Boundary conditions were applied to represent symmetrical conditions which

11
existed on the steel plate, CFRP and adhesive layer. The prestress model of the CFRP
was introduced by an initial condition in the ABAQUS model. A modified mesh was
used in the region where debonding was expected to obtain more reliable results. During
initial analysis it was found that the strain energy release rate was not affected by the
debonding effect.
Several parameters were then adjusted to investigate their effect on strain energy
release rate. The first parameter was the stiffness of the CFRP strip. Its effect on strain
energy release rate was investigated by either changing the thickness of the strip or by
modifying Young’s modulus. Experimental results showed that changing the stiffness
had no major effect on the crack strain energy release rate. This effect is obvious when
the stiffness of the large steel plate is compared to the much smaller stiffness of the
smaller CFRP strip. The next parameter that was investigated was the thickness of the
adhesive. When the thickness was increased, it was observed that the adhesive was less
effective due to a shear deformation. Decreasing the thickness of the adhesive resulted in
an increase in the crack energy release rate (Colombi et al., 2003). This resulted in a
larger debonded region. The final parameter that was tested was the initial debonded
area. When the debonded area was increased, the result was a decrease in the ability to
transfer the load from the steel plate to the CFRP strip. Therefore the size of the
debonded area had a direct effect on the effectiveness of the reinforcement.
By using a pretensioned CFRP strip, the effectiveness of the reinforcement
increased due to a decrease the crack size and a reduction in the strain energy release rate
within the debonded crack. The failure of the CFRP reinforcement was also found to be

12
primarily due the debonding of the strip. Delamination occurred when the crack
propagated toward the CFRP strip.
1.4 CFRP OVERLAY APPLICATION
CFRP’s have been used for fatigue crack prevention and for possible extending
the life of a member under fatigue conditions (Jones and Civjan 2003). To test this effect
two types of specimens were tested by Jones and Civjan (2003). Each specimen was
constructed with A36 steel plate with dimension of 0.2 in. by 2.0 in. and 20 in. long. The
first specimen was machined with a center hole with cracks initiated on either side shown
in Fig. 1.6 (a). The second specimen consisted of two notches machined on either side of
the steel plate shown in Fig. 1.6 (b). On both specimens the initial crack length 0.2 in.
Fig. 1.6. Specimen geometry: (a) hole specimen: (b) notch specimen (taken from
Jones and Civjan 2003)
13
Each specimen was loaded in tension with a constant amplitude sine wave with a
maximum load of 8.5 kip and 0.1 lb. minimum load. The average stress on each
specimen was 17 ksi while the stress concentration factors for the center hole and edge
notched samples were 2.76 and 2.60, respectively. For the center hole specimen, two
CFRP configurations were used. The first configuration consisted of a 0.5 in. wide strip
placed on each side of the hole, while the second configuration used a 1.0 in. wide strip
placed over the hole. For the edge notched specimen a 1.0 mm wide strip was placed
centered between the notches. Using these configurations, it was possible to test the
capability of the CFRP to assist in crack prevention along with any fatigue life effects.
Tests showed that failure was a result of the debonding of the CFRP strip (Jones
and Civjan 2003). After this occurred the steel rapidly failed in tension. Fatigue cracks
were observed near the CFRP strip which caused the CFRP to debond, starting at the
corners of the strips. It was also observed that cracks propagated symmetrically until
they reached a size of 0.1 in. After this occurred, all of the propagation was seen in one
of the cracks. The author stated that that by increasing the length of the CFRP by 50% it
was found, the fatigue life was increased by 115% (Jones and Civjan 2003). In
specimens where a crack was formed before a CFRP strip was bonded, it was found that
fatigue life was increased by 26%, from 173,418 cycles to 218,967 cycles (Jones and
Civjan 2003). Testing also found that application and surface preparation was important
to the effectiveness of the reinforcement. When the correct resin ratio and surface
preparation was used, a 74% increase was observed (302,818 cycles) when compared to
the sample specimens (173,418 cycles). Therefore the performance of the adhesive was
an important factor in the effectiveness of the reinforcement. It was also concluded that

14
the effectiveness could be optimized by applying the CFRP strips over the hole and
directly in the path of the notched crack.
Static, linearly elastic models established by Jones et al. were used to create an
ABAQUS (2007) model of each specimen. Each specimen was modeled using 20-noded
solid elements in addition to 10-noded elements. The CFRP strips were modeled using
10-noded elements and had a thickness of 0.04 mm. Assumed Poisson’s ratio of the steel
and CFRP were 0.29 and 0.34, respectively. Boundary conditions were applied on the
edge representing symmetry conditions which consists of displacement constraint in the
x-, y-, and z-direction. A uniform pressure was then applied to the center line of the
model which represented the maximum load of 8.5 kip. A total of four different models
were analyzed. These included a bare notched specimen, a notched specimen with CFRP
strips on either side, a notched specimen with CFRP strips that had a modified Young’s
modulus and ultimate strength increased by a factor of 3.5, and a notched specimen with
the CFRP strip only on one side.
By comparing the models it was found that by bonding the CFRP strip to the
specimen, Jones et al. stated the stress decreased by 12%. It was also found that by
increasing the stiffness of the CFRP, the stress decreased even more (Jones and Civjan
2003). This was in direct contradiction of the results of the physical testing. Increasing
the stiffness of the CFRP resulted in a faster failure of the epoxy since a higher load
transfer occurred. Therefore if a perfect bond is achieved, a higher stiffness would result
in a longer fatigue life.

15
1.5 FATIGUE ENHANCEMENT USING CARBON-FIBER COMPOSITES
At the University of Kansas, research has been conducted in the use of CFRP
materials in order to stiffen critical fatigue locations on steel bridge girders. Composite
doublers were developed to bond over an AASHTO Category E’ detail (AASHTO 2007),
representative of a welded coverplate. This was done in an attempt to increase the
stiffness of the detail while providing an alternate load path, directly having an effect of
reducing the peak stress on the detail (Kaan et al., 2008). Research was also focused on
the bond within the doubler, therefore eliminating inter-laminar debonding between
composite layers.
Fig. 1.7. Steel Test Specimen (taken from Kaan et al., 2008)
The steel specimen used during testing was made of two 1.0 inch thick plates
welded together using a 0.25 inch fillet weld, shown in Fig. 1.7. The top plate, which
represented a bottom flange of a steel girder, had a width of 4.0 inches while the bottom
plate, which represented a welded coverplate, had a width of 3.0 inches. The specimen
was designed to represent an AASHTO Category E’ detail (Kaan et al., 2008). The initial
design focus for the CFRP doubler was to provide sufficient thickness to effect the steel

16
specimen. By doing this it would be capable to increase the bending moment of inertia at
the critical detail. By achieving this it would be possible to decrease deflections and
stress demand in the steel specimen. The first of two CFRP doublers designed was
constructed from bi-directional woven carbon-fiber fabric which was pre-impregnated
with a cyanoacrylite resin. Vacuum pressure and heat consolidated the total of 36 plies of
carbon fiber to create the doubler. The first design experienced a large amount of air
voids within the material, which was deemed acceptable in order to maximize the doubler
thickness (Kaan et al., 2008). The doubler had an average thickess of 1.0 inch at the step
and was initially molded to be 4.0 inches wide but was cut down to 3 inches to match the
coverplate width. Testing revealed that the first doubler design resulted in inter-laminar
debonding within the material. The second doubler design focused on the consolidation
of the layers instead of the thickness while also using a heat press was used during
creation (Kaan et al., 2008). The carbon fiber plies were increased to 40 while boron-
fiber layers and resin film were incorporated within the doubler. “The boron-fiber layers
prevented the carbon-fiber layers from migrating too far out of plane during the heat-
press mold process, and the resin film supplied additional resin in areas where voids
could not be eliminated even with the increased mold pressure” described Kaan et al
(2008). The second doubler resulted in an overall height of 0.50 inch at the steep. The
two doubler designs are shown in Fig. 1.8.

17
(a)
(b)
Fig. 1.8. Composite doubler designs: (a)First design, (b)Second design (taken from Kaan et al., 2008)
The doublers were bonded using commercially-available high-grade resign epoxy while
the steel surfaces were prepared using a standard hand grinder while the composite was
prepared using 100-grit sandpaper. Both the steel and composite surfaces were then
degreases and bonded together and cured at room temperature for a minimum of 48 hours
(Kaan et al., 2008).
Specimens were then tested in fatigue loading by using a three-point bend
arrangement. An initial test was conducted with a theoretical stress of 8.5 ksi at the weld
toe, this represented a 1.5 kip applied load at the centerline of the specimen. It was tested
at 2.0 Hz for 1.1 M cycles when the bond between the composite and steel was found to
be sufficient at that stress range (Kaan et al., 2008). At this time there was no fatigue
crack formation in the steel while the CFRP material and bond experienced no damage.
The load was increased in a step-wise function from 8.5 ksi to 12.5 ksi to 14.5 ksi to 16

18
ksi to 20 ksi. By increasing the load it was possible to find the maximum stress range
allowed by the CFRP doubler. As a reference to further testing, the control specimen was
tested at 16 ksi to find the deflection values across the specimen. The next fatigue testing
was conducted using the second design doublers. The testing was performed at 20 ksi
until both doublers debonded and the steel specimen failed (Kaan et al., 2008). The initial
testing found that the doublers increased the specimen stiffness and resulted in a 22%
decrease in deflection. The control specimen experienced 0.102 inch deflection while the
CFRP-stiffened specimen experience 0.085 inch deflection. During initial testing, due to
poor consolidation of the material, the composite material experienced interlaminar
cracking and delamination prior to bond failure. The results are show in Fig. 1.9.
Fig. 1.9. Initial doubler fatigue test (taken from Kaan et al., 2008)
The redesigned doubler was then tested at a theoretical stress of 20 ksi at the weld toe.
Testing resulted in the degradation and cracking in the bond between the composite and
steel. The first doubler debonded after 250,000 cycles while the second doubler

19
debonded after 895,000 cycles. After the debonding of the first doubler, the specimen
experienced an increase of 0.0082 inch in deflection and a decrease of 7.7% in stiffness.
While after the second doubler debonded, the specimen experienced an increase of 0.010
inch in deflection and a decrease of 8.3% in stiffness. These results can be seen in Fig.
1.10.
Fig. 1.10. Redesigned doubler fatigue test (taken from Kaan et al., 2008)
Based on these results it was found that by attaching CFRP doublers to steel
coverplates, it is possible to reduce the stress demand and extend fatigue life of welded
connections. Kaan et al. concluded that “the tests show that this is a viable technique to
increase the fatigue life of fatigue-vulnerable connections in steel bridges” (Kaan et al.
2008).
1.6 SUMMARY
In summary, the literature review has provided several studies related to
composite testing. Although there have been many studies performed, unfortunately

20
there have been a very limited number of references that have included fatigue testing.
The preceding references focused on the testing of composite materials and resins in
comparison to each other, but very few have been able to use this information to properly
test the effect on fatigue life. But from the limited testing it has been found that
composite doublers can result in an increase in overall stiffness and therefore resulting in
a lower stress demand and an extended fatigue life.

21
Chapter 2 Specimen Description
Version 6.7 of ABAQUS (2007) was used to analyze models of specimens tested
at Kansas by Vilhauer (2007). Two configurations were analyzed. Configuration 1
consisted solely of the steel plates joined by a 5/16 in. weld along the edge of the cover
plate. Configuration 2 added the application of the composite doubler while
configurations 3 through 5 used a modified composite shape.
2.1 SPECIMEN DIMENSIONS
All models had two steel plates welded together along the edge of the smaller
plate (cover plate). The top plate had dimensions of 50 in. by 4.5 in. and was 1.0 in.
thick. The cover plate had dimensions of 26 in. by 3.0 in. and was also an inch in
thickness. The weld was defined as a 5/16 in. wide ran along all sides of the cover plate,
completely welding the cover plate to the larger top plate as shown in Fig. 2.1.
Fig. 2.1. Control specimen elevation view, taken from Vilhauer (2007)
The original composite section was modeled with a total length of 12 in. and a total
height of 1.9 in. It had a width of 3.0 in. to match the width of the cover plate. The
composite doubler consisted of two flat surfaces that were bonded to the top plate and the
cover plate. A 6.0 in. long surface was created to where the composite was bonded to the
top plate while a 6.0 in. long surface was created for the cover plate. The composite had
a curved profile along the exterior surface and a curved gap near the weld region that was

22
placed in the physical specimen to cause the doubler to pop off after failure of the resin
due to fatigue. (Fig. 2.2)
Fig. 2.2. Smooth-shaped composite doubler
Three other configurations of the composite doubler were investigated. All configurations
had a 6.0 in. length for bonding with the cover plate, which was 0.9 in. thick. The region
to bond with to the top plate was 1.9 in. thick. All configurations had a 5/16 in. section
extruded for proper fit over the weld. The three alternate configurations of the composite
doubler had different lengths bonded to the top plate; these lengths were 2.69 in. 5.69 in.
and 8.69 in., as shown in Fig. 2.3.

23
(a)
(b)
(c)
Fig. 2.3. Rectilinear composite doubler: (a) short rectilinear composite doubler; (b) rectilinear composite doubler; (c) long rectilinear composite doubler
The steel had a Young’s modulus of 29,000 ksi and a Poisson’s ratio of 0.3, while the
composite had a Young’s modulus of 3858 ksi and a Poisson’s ratio of 0.1.
2.2 3-D MODEL
Both the steel and composite materials were defined as mechanically elastic
materials in the 3-D model. After each section was modeled and assigned a material
type, the specimen was assembled by joining the parts together. Tie constraints
(ABAQUS 2007) were then used to model the bond between the weld and plates, and to
model the bond between the composite and the plates. A pressure load was applied at the
mid span of the top plate. This load represented the load placed during physical testing.
This value depended on the specimen and stress range during testing. The maximum

24
load applied to the physical model of the welded specimen was 5.2 kips, while the
maximum load applied to the physical model with the composite specimens was 5.4 kips.
Boundary conditions were then placed along the line of support, which was 3.0 in. from
each end of the specimen. Displacements at the support were restrained in the z-
direction, while a third boundary condition was placed on one edge restricting any
displacement in the x-direction.
The mesh of the top and cover plate were formed using C3D8R 8-node linear
brick hex elements. The seed was defined with a global size of 0.5 but the top plate was
partitioned near the supports and welds, which had a seed size of 0.2. The weld was
modeled with C3D4 4-node linear tetrahedron mesh with a global size of 0.02. The
composite was modeled using C3D4 4-node linear tetrahedron mesh with a global size of
0.25, while the modified composites were modeled using C3D8R 8-node linear brick hex
mesh with a global size of 0.2.
Fig. 2.4. Control specimen elevation view
The first model that was analyzed consisted of the top and cover plates welded on
all sides, shown in Fig. 2.4. This model is comparable to the control specimen tested by
Vilhauer (2007). During physical testing, Vilhauer performed testing under a sine wave
with a load range of 4.6 kips, which in turn produced a nominal stress range at the weld
toe of 27 ksi (Vilhauer 2007). For comparing the results of the physical and
computational models an analysis was made under the maximum load applied to the
specimen by Vilhauer (2007) and compared with direct measurements taken by Vilhauer.

25
Comparisons were made with measurements of stress and displacement taken at various
locations along the length of the member.
Vilhauer (2007) gathered data by placing thirteen strain gages along the member,
as shown in Fig. 2.5. For analysis, strain gages one through seven were compared since
emphasis was on the stress along the bottom face of the plates. This comparison is shown
in Table 2 and Fig. 2.6, while Fig. 2.4 also shows the stress path along the member. A
stress increase was found near the weld, while a stress increase was also found towards
the midspan of the member.
Fig. 2.5. Placement of strain gages, taken from Vilhauer (2007)

26
Stress (ksi) X-Direction (in.) Measured Modeled
7.25 12.71 11.44 11.44 26.72 25.59 18.5 15.86 15.23 25 21.83 20.94
31.5 15.79 15.23 38.56 26.04 25.59 42.75 12.71 11.44
Table 2.1. Stress comparison
Fig. 2.6. Stress range comparison of welded specimen
2.3 RESULTS
Near the weld, a 4.23% and 5.65% difference was found between strain gage
readings and model results, while at the midspan a difference of only 4.07% was
observed, as shown in Fig. 2.6. Deflection values along the lower face of the top plate
were compared with the values found from physical testing of a control specimen. It was
Bottom Gage Path Stress Range (4.631 kip range)
11.44
25.59
15.23
20.9412.71
26.72
15.86
21.83
-5
5
15
25
35
45
55
65
0 2 4 6 8 10 12 14 16 18 20 22 24 26
Distance Along Beam (in.)
S11
Stre
ss (k
si)
Bottom Gage PathMeasure Stress

27
found that at midspan of the specimen, under a 5.2 kip load, there was a difference of
9.47% , as shown in Table 2.2.
Deflection (in.)
X-Direction (in.) Measured Modeled 25 0.1855 0.1877
Table 2.2. Control specimen and model deflection comparison at 5.2 kip load
Fig. 2.7. Elevation view of smooth-shaped composite model
A similar comparison was carried out for the model reinforced with composite
doublers. Computed deflection values along the lower surface of the top plate (Fig. 2.8)
were compared with values found by physical testing of composite specimens under
varied loads. Loads applied to the specimens ranged from 1.6 kips to 5.4 kips. When
comparing the centerline deflection of the computational and physical models under a 3.1
kip load, a difference of 0.011 in. was found (Fig. 2.9). Under a 1.6 kip load the
difference was 0.013 in.

28
Fig. 2.8. Deflection comparison of welded specimen
Composite Model Deflection Comparison
0
0.025
0.05
0.075
0.1
0 2 4 6 8 10 12 14 16 18 20 22 24 26Distance Along Beam (in.)
Def
lect
ion
(in.)
Computational Model 3.07kipsComputational Model 2.78kipsComputational Model 2.4 kips
Computational Model 1.63kipsPhysical Model 3.07 kips
Physical Model 2.78 kips
Physical Model 2.4 kips
Fig. 2.9. Deflection comparison of composite doubler model
Deflected shapes from the various computational models are shown in Fig. 2.10.
Weld Model Deflection Comparison
0
0.025
0.05
0.075
0.1
0.125
0 2 4 6 8 10 12 14 16 18 20 22 24 26Distance Along Beam (in.)
Def
lect
ion
(in.)
Computational Model 3.07 kips
Computational Model 1.63 kips
Physical Model 3.07 kips
Physical Model 1.63 kips

29
(a)
(b)
(c)
(d)

30
(e)
Fig. 2.10. Elevation view of deflected shape: (a) control specimen; (b) specimen with smooth-shaped composite doubler; (c) short rectilinear composite doubler; (d)
rectilinear composite doubler; (e) long rectilinear composite doubler
Computed deflections for the control and for the smooth-shaped doubler model are
shown in Table 2.3. This table shows that there is roughly a 18% decrease in deflection
at the midspan of the specimen, when the smooth-shaped composite doubler is attached
to the control specimen. Closer to the support there is a greater effect on deflection
between the two models. Throughout the specimens, computed deflections in the
composite model were found to be lower than those in the control model, indicating that
the doubler had a significant effect on the overall stiffness of the specimen.

31
Deflection Comparison
X-Direction (in.) Control Specimen Model Deflection
(in.)
Smooth-Shaped Composite Doubler Model Deflection
(in.)
% Difference
0 -0.055 -0.040 26.94% 1 -0.037 -0.027 26.90% 2 -0.018 -0.013 32.07% 3 0.000 0.000 0.00% 4 0.018 0.013 30.43% 5 0.037 0.027 26.78% 6 0.054 0.039 27.49% 7 0.071 0.051 28.41% 8 0.087 0.062 29.20% 9 0.102 0.072 29.60%
10 0.115 0.081 29.50% 11 0.126 0.090 28.88% 12 0.136 0.098 27.81% 13 0.144 0.106 26.46% 14 0.151 0.113 25.10% 15 0.158 0.121 23.83% 16 0.165 0.127 22.66% 17 0.171 0.134 21.64% 18 0.176 0.139 20.75% 19 0.181 0.145 19.98% 20 0.185 0.149 19.36% 21 0.188 0.153 18.79% 22 0.191 0.156 18.40% 23 0.193 0.158 18.10% 24 0.194 0.160 17.92% 25 0.195 0.160 17.87%
Table 2.3. Comparison in deflection
Longitudinal and maximum principal stresses are shown in Fig. 2.11 and 2.12.

32
(a)
(b)
(c)

33
(d)
(e)
Fig. 2.11. Elevation view showing longitudinal stress (S11): (a) control specimen; (b) specimen with smooth-shaped composite doubler; (c) short rectilinear composite
doubler; (d) rectilinear composite doubler; (e) long rectilinear composite doubler

34
(a)
(b)
35
(c)
(d)

36
(e)
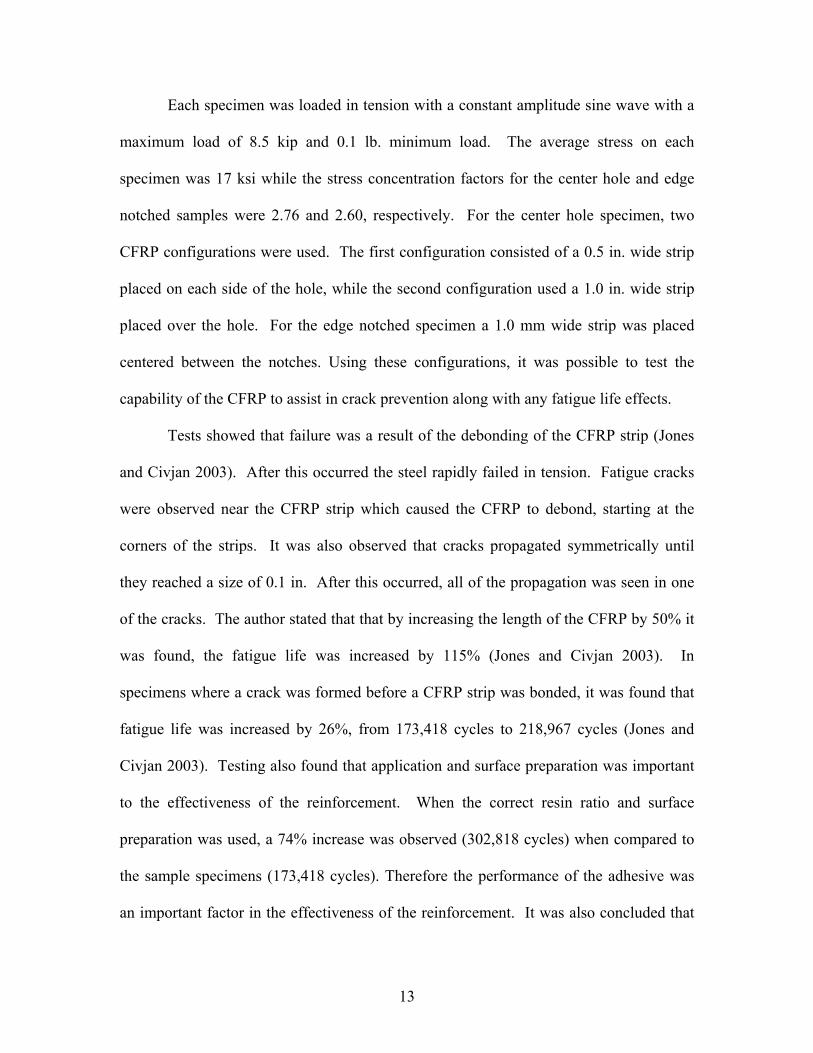
Fig. 2.12. Section showing longitudinal stress near the area of the weld: (a) control specimen; (b) specimen with smooth-shaped composite doubler; (c) short
rectilinear composite doubler; (d) rectilinear composite doubler; (e) long rectilinear composite doubler
The figures show that the stress demand on the steel in the area near the weld was
reduced by adding the composite doublers. When analyzing the figures, it is possible to
see the lower stress demand near the weld. The color-coding clarifies this by separating
the stress values in to categories represented in the figures. In the control specimen, Fig.
2.12 (a), a dramatic increase in stress towards the weld is shown by the color variation
from green to red located at the weld toe. This represents an increase in stress from 4.0
ksi to 40 ksi near the weld. In both the smooth-shaped and rectilinear composite doubler
models, Fig. 2.12 (b) through (e), the 40 ksi peak near the weld is removed. This peak is
replaced by a green to blue color representing a much lower stress demand of 4.8 ksi in
Fig. 2.12 (b) and 3.0 ksi in Fig. 2.12 (c) through (e). This effect was observed for both

37
the longitudinal and maximum principal stresses. Maximum principal stresses are shown
in Fig. 2.13 and 2.14 which show similar results when analyzing the color coded regions.
(a)
(b)
38
(c)
(d)

39
(e)
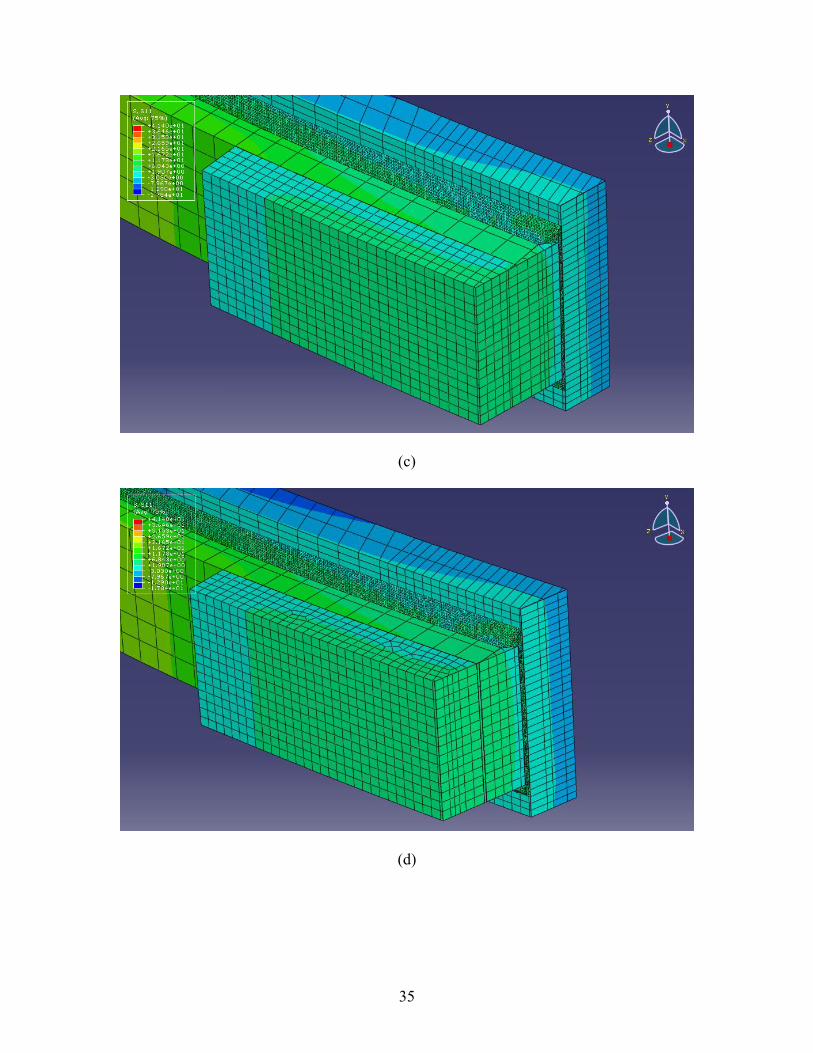
Fig. 2.13. Elevation view showing maximum principal stress: (a) control specimen; (b) specimen with smooth-shaped composite doubler; (c) short rectilinear composite doubler; (d) rectilinear composite doubler; (e) long rectilinear composite
doubler
(a)

40
(b)
(c)

41
(d)
(e)
Fig. 2.14. Cross section showing maximum principal stress in the region near the weld: (a) control specimen; (b) specimen with smooth-shaped composite doubler; (c) short rectilinear composite doubler; (d) rectilinear composite doubler; (e) long rectilinear
composite doubler

42
It was found that the maximum principal stress decreased as the size of the rectilinear
composite doubler was increased. From the analyses it was determined that for the
control specimen there were peaks in the principal maximum stress near the toe of the
weld, while a lower peak was also found near the midspan. This is comparable to the
results found by Vilhauer (2007) during physical testing. Figure 2.15 shows a fatigue
crack failure at the toe of the weld which is consistent with the results from the
computational model.
Fig. 2.15. Fatigue failure in physical specimen, taken from Vilhauer (2007)
Analyses of the smooth-shaped composite doubler showed that maximum tensile stress
demand was not located at the toe of the weld. Instead a lower peak, in comparison with
the control specimen, was found near the throat of the weld. The largest tensile stress
demand was found to be located at the midspan of the member. In both the control and

43
smooth-shaped composite doubler models, there was a peak in the maximum principal
stress at the midspan of the member which is to be expected. The results from the two
computational models (control specimen vs. the smooth shaped composite doubler) were
significantly different in the area near the weld. The control model resulted in a larger
maximum principal stress near the toe of the weld, while the specimen with smooth-
shaped composite doubler resulted in a lower peak at the throat of the weld. This
indicated that if the composite doubler is properly attached to the specimen and does not
fail due to fatigue, it has the potential of significantly increasing fatigue life as a result of
the reduction on the peak tensile stress demand, and consequently a reduction on the
stress range.

44
Chapter 3 Parametric Study
After the models were validated, the next step was to compare results when
several parameters were modified. The objective was to obtain some measure of the
effect of various parameters on fatigue life. Parameters that were studied included the
shape of the composite doubler, Young’s modulus for the composite doubler, and the
bonded length between the composite doubler and the steel plates.
3.1 EFFECT OF DOUBLER SHAPE
The first parameter that was studied was the shape of the composite doubler. The
original doubler was designed to achieve a smooth transition of stress between the steel
plates and the composite doubler. The effect of using simpler geometric configuration
was analyzed. The modified doublers, described in detail in Section one of Chapter two,
were added to the ABAQUS model of the control specimen and analyzed using a load
representative of a 5.37 kip maximum load. Results are shown in Fig. 3.1.
(a)
(b)

45
(c)
Fig. 3.1. Elevation view of computational model including the composite doublers for various composite doubler configurations: (a) short rectilinear composite
doubler; (b) rectilinear composite doubler; (c) long rectilinear composite doubler
All three models with rectilinear doublers were analyzed using a 5.37 kip load,
Maximum calculated principal stresses along the center line of the lower face of the top
steel plate are compared in Fig. 3.2. It was found that the shape of the doubler had a
large effect on the maximum stress along the plate. When the rectilinear composite
doubler was compared with the long rectilinear composite doubler, it was found that a
33.5% decrease in maximum stress took place along the unsupported region of the top
plate. A 96% increase in maximum stress was observed when the rectilinear composite
doubler was compared with the short rectilinear composite doubler. Although this is
interesting, the primary focus was on the stress change near the weld. When comparing
stresses in this region there was only a 1% difference between the modified doubler and
long modified doubler and a 34% difference between the modified doubler and the short
modified doubler. This seems to be significant, but since the values were so small, the
percent difference is misleading. There was less than 0.25 ksi difference between any
two. For this reason it is concluded that although there was a significant effect of doubler
size on the maximum stress along the unsupported region of the top plate, the effect was
minimal on the maximum stress near the weld (Fig. 3.2).

46
Fig. 3.2. S Max stress comparison in modified composite doublers
3.1.1. EFFECT ON FATIGUE LIFE
For a 5.4 kip load, which corresponds to a nominal stress range at the weld toe of
the specimen of 28 ksi, a stress ratio R of 0.1 was used. A stress ratio of 0.1 was also
used by Vilhauer and Kaan in their experimental studies. The stress ratio represents the
ratio between the minimum and maximum stress, R=σmin/σmax. From the previous
equation, R=σmin/σmax, it was possible to calculate the minimum stress associated with the
maximum stress values found by ABAQUS (2007) modeling. Once this was established,
a stress range was found which could then be used to find the fatigue life defined by
AASHTO (2007). It was found that the control specimen resulted in a fatigue life of
9,030 cycles, the smooth composite 5,367,533 cycles, the short rectilinear composite
28,540,177 cycles, modified rectilinear composite 41,583,945 cycles, and the long
rectilinear composite 49,007,057 cycles represented in Table 3.1. Effectively showing a
432% difference between the control specimen and smooth composite specimen while a
675% difference was found between the control specimen and modified rectilinear
composite specimen. The values found for fatigue life are not similar to values of fatigue
S Max Principal Stress Comparison
-1
4
9
14
19
0 2 4 6 8 10 12 14 16 18 20 22 24 26Distance Along Beam (in.)
S M
ax P
rinci
pal (
ksi)
Rectilinear Composite Doubler
Long Rectilinear Composite Doubler
Short Rectilinear Composite Doubler

47
life measured by Vilhauer due to different loads used to calculate the maximum stress
demand.
Fig. 3.3. AASHTO (2007) fatigue life cycle
Specimen Max Stress (ksi) Stress Range (ksi) Fatigue Life (cycles)Control 38.983 35.085 9,030
Smooth Composite 4.636 4.173 5,367,533 Short Rectilinear 2.656 2.391 28,540,177
Modified Rectilinear 2.343 2.109 41,583,945 Long Rectilinear 2.218 1.996 49,007,057
Table 3.1. Fatigue life comparison

48
Fig. 3.4. AASHTO (2007) fatigue life cycle of nominal modified stress range
Specimen Max Stress (ksi) Nominal Modified Stress (ksi) Stress Range (ksi) Fatigue Life (cycles)
Control 38.983 28 25.200 24,370 Smooth Composite 4.636 3.330 2.997 14,485,263
Short Rectilinear 2.656 1.908 1.717 77,020,856 Modified Rectilinear 2.343 1.683 1.515 112,221,834
Long Rectilinear 2.218 1.593 1.434 132,254,452
Table 3.2. Fatigue life comparison of nominal modified stress range Results from the first calculation, shown in Fig. 3.3 and Table 3.1, show two
things. The first is that the fatigue life for the untreated specimen is much greater than
found in the control specimen. Secondly the results indicate that the specimens if treated
would experience infinite fatigue life for category E’ detail, excluding the smooth
composite specimen. Results from the second calculation, shown in Fig. 3.4 and Table
3.2, show the same two results. The untreated specimen still experiences a much higher

49
fatigue life than the control specimen. It also shows that the treated specimens
experience infinite fatigue life for category E’ detail, once again excluding the smooth
composite. The modified rectilinear and the long rectilinear experience a fatigue life of
over 100,000,000 cycles which exceeds the range of the graph.
3.2 EFFECT OF YOUNG’S MODULUS
The next comparison was made by changing Young’s modulus of the doublers,
Ec. The rectilinear composite doubler configuration was used for this comparison. The
model was analyzed using six different values for the Young’s modulus which included
Ec=2,315, 3,086, 3,585, 4,630, 5,401, and 7,716 ksi. These values were established as
percentages of the found value of 3,585 ksi 60%, 80%, 120%, 140% and 200%,
respectively. Results are shown if Fig. 3.3.
(a)

50
(b)
(c)

51
(d)
(e)
(f)
Fig. 3.5. Contours showing Von Mises stresses on deformed shape for computational model with: (a) Ec=2,315 ksi; (b) Ec=3,086 ksi; (c) Ec=3,858 ksi; (d) Ec=4,630 ksi; (e)
Ec=5,401 ksi; (f) Ec=7,716 ksi
It was found that the maximum Von Mises stress along the plate was nearly identical for
all values of Ec. The major difference was observed in stresses near the weld and weld
toe. A difference of 29% was observed between the models with Ec=2,315 ksi and 3,585
ksi in the region near the weld. The difference between any of the other models was

52
marginal. It was also interesting to see that the Ec=7,716 ksi and 3,086 ksi models had
approximately the same maximum Von Mises stress within the weld (Fig. 3.4). It was
concluded that there was a greater effect when changing Young’s modulus of the
composite doubler between lower values, but as larger values were used, the effect on the
Von Mises stress was negligible.
Von Mises Stress Comparison
0
1
2
3
4
5
6
7
0 2 4 6 8 10 12 14 16 18 20 22 24 26Distance Along Beam (in.)
Von
Mis
ses
Str
ess
(ksi
)
)Ec= 2315 (60%)Ec= 3086 (80%)Ec= 3585 (100%)Ec= 4630 (120%)Ec= 5401 (140%)Ec= 7716 (200%
Fig. 3.6. Effects of Ec on maximum Von Mises stress
A similar comparison was performed for the maximum principal stress, shown in
Fig. 3.5. It was found that the difference near the weld was significant in this case. The
largest difference was observed near the toe of the weld. A 76% difference was
calculated between the models with Ec=2,315 ksi and 3,585 ksi, while the difference was
332% between models with Ec=2,315 ksi and 7,716 ksi. A large difference was found
between the support and weld toe which can be seen in Fig. 3.5.

53
S Max Stress Comparison
-1-0.5
00.5
11.5
22.5
33.5
44.5
55.5
66.5
77.5
8
0 2 4 6 8 10 12 14 16 18 20 22 24 26
Distance from edge of specimen (in.)
Max
imum
prin
cipa
l str
ess
(ksi
))Ec= 2315 (60%
)Ec= 3086 (80%
)Ec= 3585 (100%
)Ec= 7716 (200%
)Ec= 5401 (140%
)Ec= 4630 (120%
Fig. 3.7. Effects of Ec on maximum principal stress

54
Chapter 4 Conclusions
The objective of this study was to create a model to properly represent physical
specimens being tested. This model was then used to analyze the effect of composite
doublers on the specimen. Conclusions are:
1) The addition of a smooth composite reduced the stress demand in the weld
2) The length of the specimen has an effect only up to a certain length, then the
effect becomes minimal
3) The rectilinear specimen is the most effective composite shape, resulting in a
675% increase in fatigue life
4) The Young’s modulus effects the maximum stress demand at the weld, the most
effective is 7716 ksi
5) The Young’s modulus has little effect on the Von Mises stress demand at the weld
By using ABAQUS (2007) it was possible to create a finite element analysis model that
replicated the physical specimen in both physical characteristics and performance. Once
this was established it was then possible to create and analyze variables with confidence
that the outputs would be realistic and comparable to future testing. The first comparison
model established was the smooth composite doubler. This model was analyzed and
compared to the control specimen (Vilhauer 2007) by plotting the longitudinal and
maximum principal stresses. It was clear by analyzing both maximum and Von Mises
stresses the composite doubler lowered stresses located at the weld. With further
comparison it was found that the composite doubler not only lowered the peak stress but
also shifted the location of the peak away from the toe of the weld, which was
experimentally found to be the critical stress region for fatigue (Vilhauer 2007). For the

55
composite doubler model, the location of the peak stress was at the throat of the weld.
By doing this the high stress region is in a stronger location and in turn would force
cracks to form in the throat rather than the weaker weld toe. Therefore if the composite
doubler is attached correctly and does not fail due to fatigue, it has the potentially to
decrease the stress peak and therefore increase the fatigue life of the specimen.
The next step in analysis was to create models using the modified rectilinear
composite. The sizes of these sections had three variations, which are shown in Fig. 2.3.
By analysis it was possible to compare the maximum principal stress found in each
configuration. The length of the rectilinear composite had a minimal effect on the
maximum principal stress found at the toe of the weld. There was only a 1% decrease in
maximum principal stress between the modified rectilinear composite and the long
modified rectilinear composite, while a 34% decrease in maximum principal stress was
found between the short modified rectilinear composite and the modified rectilinear
composite. This reinforces the conclusion that the length of the composite doubler does
not have a significant effect on fatigue life. But if the doubler is too short then there will
be an effect on the fatigue life. Therefore it can be concluded that the long modified
rectilinear composite lowers the stress range along the specimen but has a minimal effect
around the critical weld area. The largest effect of the composite size was found along the
specimen between the support and the weld. At this peak there was a 33.5% decrease in
maximum principal stress between the modified rectilinear composite and the long
modified rectilinear composite and a 96% decrease in maximum principal stress was
found between the short modified rectilinear composite and the modified rectilinear
composite.

56
Young’s Modulus of the composite material was the final variable in the analysis.
From testing of the composite material, Young’s Modulus was found to be 3,585 ksi.
Analyses were conducted with Young’s Modulus ranging from 2,315 ksi to 7,716 ksi.
For these analyses the modified rectilinear composite configuration was used. It was
found that the maximum principal stress was not affected at the highest peak between the
support and the weld, but at the weld the stress was highly affected by Young’s Modulus.
The lowest peak stress demand at the weld was for a Young’s Modulus of 7,716 ksi
which produced a 332% decrease in stress from the value found using 3,585 ksi. The
highest peak stress demand corresponded to a Young’s Modulus for the composite of
2,315 ksi, which produced a 76% increase in stress from the value found using 3,585 ksi.
In conclusion the most effective composite configuration was found to be the
modified rectilinear composite, which is shown in Fig. 2.13 and 2.14. Other findings that
are noteworthy include the fact that the longer the composite is, past a 6.0 in bonded
length to the top plate, the more effective it is in minimizing the stress along the
specimen but not directly at the weld. Also the higher values of Young’s Modulus
produced lower stress demands at the weld toe, which indicates that stiffer composite
doublers should be more effective in increasing fatigue life. In conclusion, from the
analysis performed it was found that the modified rectilinear composite with a Young’s
Modulus value of 7,716 ksi would be the most effective configuration to decrease the
stress range and therefore increase fatigue life.
Thus it has been shown by ABAQUS (2007) modeling that by properly attaching
a composite doubler the stress demand near the weld can be reduced. This in turn
increases the fatigue life of the welded region. Therefore it is possible to expand the life

57
of the critical element with the addition of the composite doubler. The best results will
be found with the addition of the rectilinear composite, which was found to provide the
greatest improvement in stress decrease near the weld.

58
References
AASHTO. (2007). LRFD Bridge Design Specifications. 4th Edition, American
Association of State Highway and Transportation Officials, Washington, D.C.
ABAQUS/standard manual, version 6.7. (2007). Hibbitt, Karlsson, and Sorensen, Inc.,
Pawtucket, R.I.
American Society for Testing and Materials (ASTM). (1995). “Standard testing method
for tensile properties of polymer matrix composite materials,” D 3039, Philadelphia.
American Society for Testing and Materials (ASTM). (1997). “Standard testing method
for tensile properties of plastics,” D 638, Philadelphia.
Colombi, P., Bassetti, A., Nussbaumer, A. (2003). “Crack growth induced delamination
on steel members reinforced by prestressed composite patch.” Fatigue and Fracture of
Engineering Materials and Structures, 26(5), 429-437.
Jones, S., Civjan, S. (2003). “Application of Fiber Reinforced Polymer Overlays to
Extend Steel Fatigue Life.” Journal of Composites for Construction, 7(4), 331-338.
Kaan, B., Barrett, R., Bennett, C., Matamoros, A., Rolfe, S. (2008). “Fatigue
Enhancement of Welded Coverplates Using Carbon-Fiber Composites.” ASCE Structures
Congress Proceedings. April 24-26, 2008. Vancouver, Canada.
Nozaka, K., Shield, C., Hajjar, J. (2005). “Design of a test specimen to assess the
effective bond length of carbon fiber-reinforced polymer strips bonded to fatigued steel
bridge girders.” Journal of Composites for Construction, 9(4), 304-312.
Nozaka, K., Shield, C., Hajjar, J. (2005). “Effective bond length of carbon-fiber-
reinforced polymer strips bonded to fatigued steel bridge I-girders.” Journal of Bridge
Engineering, 10(2), 195-205.

59
Vilhauer, B. (2007). “Fatigue Behavior of Welded Connections Enhanced with UIT and
Bolting”