finite element modeling of the vertebra with geometry...
TRANSCRIPT
FACTA UNIVERSITATIS Series: Mechanical Engineering Vol. 8, No 1, 2010, pp. 19 - 26
FINITE ELEMENT MODELING OF THE VERTEBRA WITH GEOMETRY AND MATERIAL PROPERTIES RETREIVED
FROM CT-SCAN DATA
UDC 621.397.3 616.711 519.673
Janko D. Jovanović1, Miomir Lj. Jovanović2 1Faculty of Mechanical Engineering, Džordža Vašingtona, 81000 Podgorica, Montenegro
2Faculty of Mechanical Engineering, Aleksandra Medvedeva 14, 18000 Niš, Serbia E-mail: [email protected]
Abstract. The most challenging application of the finite element modeling is in the field of medicine. The finite element modeling of bones is applied to understanding injury mechanisms and stress and strain distribution patterns within bones as an important part in clinical evaluation of bone injuries and in the prediction of osteoporotic fracture risk. It is also applied to predicting post-operative bone remodeling of surgically implanted bones and to helping implant design. Many of these applications are subject specific which is the reason why bones must be modeled with individually reconstructed geometric and material properties. This paper presents subject specific finite element modeling of vertebra with geometry and material properties retrieved from CT scan data and its application in prediction of stress and strain distributions within vertebra in different phases of osteoporosis.
Key Words: Finite Element Modeling, Computed Tomography (CT), DICOM, Vertebra
1. INTRODUCTION
Assessment of real bone mineral density by dual-energy x-ray absorptiometry (DXA) is widely used to diagnose osteoporosis and assess fracture risk. However, clinical obser-vations have highlighted the limitations of DXA with respect to both sensitivity and speci-ficity in fracture risk prediction [1,2]. From a biomechanical viewpoint, an approach that accurately represents the three-dimensional geometry and heterogeneous distribution of material properties of bone may provide improved estimates of bone strength. In this re-gard, there is an increasing interest in the use of finite element analysis (FEA) to assess bone biomechanical behavior. Bone finite element modeling techniques have been devel-oped that use quantitative computed tomography (QCT) scans to describe bone geometry and density. QCT is the only method giving a true volumetric distribution of bone density (g/cm3) [3]. QCT scans of bone are first used to extract the smooth, 3D geometry of bone surface which is afterwards automatically meshed using commercially availably software.
Received March 30, 2010

20 J.D. JOVANOVIĆ, M.LJ. JOVANOVIĆ
Finally, the material properties, derived from the spatial distribution of QCT density val-ues, are mapped onto the finite element mesh [4,5,6,7]. This paper presents subject spe-cific finite element modeling of vertebra, based on previously explained procedure, in or-der to enable prediction of stress and strain distributions within vertebra in different phases of osteoporosis.
2. CT SCANNINIG
CT scanning was performed on a clinical resolution Philips Aura 1.3 CT Scanner with the following technical characteristics: x-ray energy [keV]: 100, 120, 130, 140; slice thickness [mm]: 1, 2, 3, 5, 7, 10; mA settings [mA]: from 15 to 50 each 5 mA and from 50 to 100 each 10 mA; image resolution: 512x512 pixels array (Fig.1).
Fig. 1 CT scanner Aura 1.3
CT scan of vertebra was taken on a healthy middle-aged female subject. Lumbar ver-
tebra L5 was chosen as an object of the study. This scan was taken with x-ray energy of 130 keV, mA settings of 100 mA, pixel resolution of 1 mm/pixel, image resolution of 512x512 pixels array and slice thickness of 1 mm. CT images of vertebra (Fig.2) are ex-ported in common medical file format DICOM (Digital Imaging and Communication in Medicine).
Fig. 2 CT images of vertebra

Finite Element Modeling of the Vertebra with Geometry and Material Properties Retreived from CT-Scan Data 21
2.1. CT number to density conversion
To produce CT image, x-rays pass through human body along several different paths in several different directions, resulting in an image that displays differences in density at each of several thousands point in two-dimensional slice through the body. Each slice represents certain finite thickness, so by stacking up a series of contiguous equidistant slices, one can construct a continuous three-dimensional map of the density variations in the body that is expressed in terms of CT number. CT number or Hounsfield unit meas-ures x-ray linear attenuation of tissue inside voxel, that represents finite volume with di-mensions defined by pixel resolution and slice thickness. CT number can be determined by the following equation:
⎟⎟⎠
⎞⎜⎜⎝
⎛−
µµ
⋅= 110002OH
HU (1)
in which µ is a linear attenuation coefficient of tissue inside the voxel and µH2O is a linear attenuation coefficient of water. CT image contains geometric data on scanned slice and CT numbers for each image pixel.
Conversion of the CT number to the density of bone tissue was performed by Quanti-tative Computed Tomography (QCT). The validity of this technique is widely accepted, and it is used at over 4000 centers worldwide [8]. When performing QCT it is necessary to scan simultaneously a vertebra and a special CT number calibration phantom. Accord-ing to studies [9,10] a liquid dipotassium hydrogen phosphate (K2HPO4) calibration phantom was used to convert CT numbers to equivalent density of bone �QCT. Phantom had many tubes containing aqueous solution of K2HPO4 with different reference densities. After scanning the phantom in the CT scanner, the average CT number in these tubes was determined and a conversion curve between the CT number and the density of the bone was obtained. In order to read necessary data from CT images and to determine the aver-age CT number of each tube a special program was developed in C++ programming lan-guage.
ρQCT = 0.0026*HU - 0.0829R2 = 0.8985
0.0
0.2
0.4
0.6
0.8
1.0
1.2
0 100 200 300 400 500
CT number [HU]
Den
sity
[g/c
m3]
Fig. 3 CT number to bone density conversion curve

22 J.D. JOVANOVIĆ, M.LJ. JOVANOVIĆ
Conversion curve was assumed to be linear according to studies [9,10]. Obtained re-lationship between the CT number and bone density (Fig.3) was:
QCT 0.0829 0.0026 HUρ = − + ⋅ (2)
where ρQCT [g/cm3] is bone density and HU is CT number.
3. GEOMETRIC MODELING OF THE VERTEBRA
CT images have to be processed to extract necessary geometric data in order to gener-ate a geometric model of the vertebra. The program Mimics (Materialise Software, Ann Arbor, Michigan, USA) was used to process the CT images and derive the geometry for the model.
In order to create an accurate three-dimensional geometric model of lumbar vertebra L5, it is essential to discern regions containing bone tissue. Thus, image segmentation has to be done by setting threshold values of CT number for bone tissue. The pixels having CT numbers in the threshold range were treated as bone tissue and collected in a seg-mentation mask. The L4 vertebra and sacrum was manually separated from the L5 vertebra mask and removed.
As the following image processing steps performed in Mimics, set of contour lines that bordered the specified bone tissue were determined for each slice and 3D surface model of the vertebra was generated (Fig.4).
In the next step of geometric modeling of the vertebra, three-dimensional surface mesh is created on the basis of generated 3D surface model (Fig.5) and exported into the Ansys neutral format file. The surface mesh consists of triangular surface elements that form the outer surface of vertebra, where the triangles share common sides and vertices.
Fig. 4 Generated 3D surface model of ver-tebra in Mimics environment
Fig. 5 3D model of vertebra with triangular surface mesh
4. FINITE ELEMENT MODELING OF THE VERTEBRA
Material properties of heterogeneous bone tissue were retrieved from CT images and assigned on an element-specific base. The most common strategy when creating hetero-geneous properties from CT images, proposed by Taddei at al. [11], has been to assume that material variation within each element is negligible, and calculate an average value
Finite Element Modeling of the Vertebra with Geometry and Material Properties Retreived from CT-Scan Data 23
at each element. First, the CT numbers within the element volume are averaged. Then the value for each element can be converted to elastic modulus of bone tissue using the CT number to density and density to elastic modulus relations. Thus each element is homogeneous, but the material properties vary among the elements. The public domain program Bonemat was used to determine and assign material properties to each element. This program is developed by Taddei et al. [11] and available at http://www.tecno.ior.it/back2net/. Three inputs were required for Bonemat: the CT images, the finite element mesh and the CT number to density and density to elastic modulus relations.
The CT images were originally in the DICOM format, which cannot be read by Bonemat. To allow Bonemat to read the images, they had to be converted to Visual ToolKit format file. First, the CT images of all vertebral slices were converted to Analyze format using the free medical image viewer MRIcro, developed by Chris Rordan and availabale at http://www.mricro.com. Converted CT images were stacked and saved as a single unified 3D Analyze format file. Then, public domain program Convert 3D, devel-oped by Paul Yushkevich and available at http://sourceforge.net/projects/c3d, was used to convert CT images from 3D Analyze format file into Visual ToolKit format file.
The finite element mesh of 10-nodes tetrahedral elements was created using MSC.Patran, (MSC Software, Santa Ana, California, USA) based on 3D surface model of the vertebra imported from the Ansys neutral format file. The finite element mesh was output from MSC.Patran as a Patran neutral file, which is readable by Bonemat.
Material properties of bone tissue were assigned on an element-specific basis. Bone tissue was assumed to be isotropic and linearly elastic with a Poisson’s ratio of 0.3 [6].
Our own, previously established, correlation (2) was used as the conversion curve between the CT number and the bone density. Conversion curve between the density and the elastic modulus of bone was correlation established by Kopperdahl et al. [12]:
QCT34.7 3230E = − + ⋅ρ (3)
where ρQCT [g/cm3] is bone density and E [MPa] is bone elastic modulus. An upper limit for elastic modulus of 1 GPa was used [13].
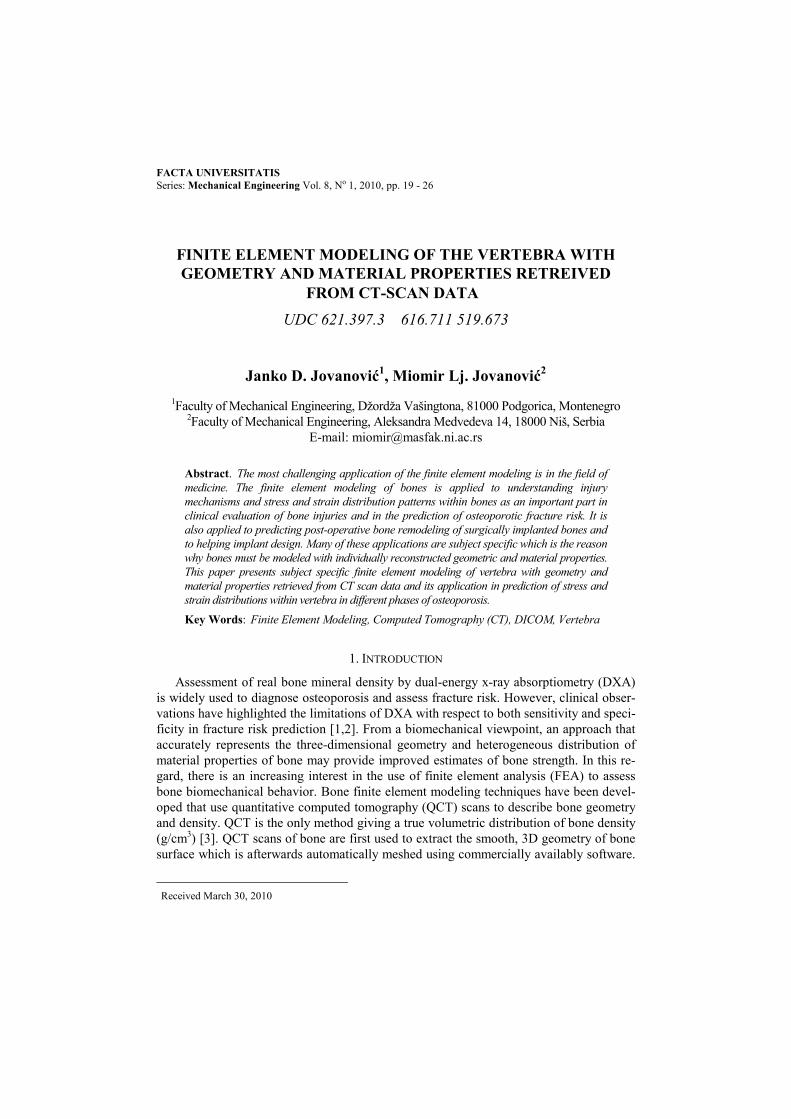
The input and output files, CT number to density and density to elastic modulus relations, and fourth order of numerical integration to be used were defined and Bonemat determined and assigned material properties to each element of the vertebra. Then, output Bonemat file with finite element mesh of the vertebra was imported into Ansys (Ansys, Canonsburg, Pennsylvania, USA). Meshed model of the vertebra was consisted of 412046 finite elements with 582364 nodes (Fig. 6).
Generated finite element model of the vertebra was used in prediction of stress and strain distributions within vertebra in different phases of osteopo-rosis. The finite element model of the vertebra was subjected to axial com-pression, that was applied to upper endplate and upper articular facets. Applied static load of 1000 N simulated standing or walking situation for a person with a mass of 70 kg [14]. All
Fig. 6. Meshed model of the vertebra

24 J.D. JOVANOVIĆ, M.LJ. JOVANOVIĆ
model nodes attached to the lower endplate and lower articular facets of the vertebra were restrained in all directions.
The load acting on the vertebra is shared between the endplate and articular facets and this distribution varies depending on the spinal posture. According to Lai et al. [15] the load sharing of articular facets ranges from 0 to 30%. In this study 85% of the load was applied to the upper endplate and 15% of the load was applied to the upper articular fac-ets (Fig.7).
Fig. 7 Loading conditions of the vertebra
For the given loads and boundary conditions, the model was solved for stresses, strains and displacements at the nodes (Fig.8).
Fig. 8 The von Mises stress and strain distributions
The highest stresses and strains observed for the model were 4.04 MPa and 0.0052 mm/mm at lower endplate and highest displacement observed for the model was 0.092 mm at the upper articular facet.
Gradual reduction of bone density was used to simulate osteoporotic changes within vertebra. The series of finite element models with such a reduced bone density were gen-erated and solved for strains and displacements at the nodes. Obtained results are given as the percentage of bone density reduction versus maximal von Mises strain (Fig. 9) and displacement (Fig. 10) relationships. Bone density reduction causes an increase of maxi-mal von Mises strain, as well as, displacement within vertebra. For example, bone density

Finite Element Modeling of the Vertebra with Geometry and Material Properties Retreived from CT-Scan Data 25
reduction of 15%, compared to bone density obtained by QCT, produces almost equal in-crease of 18.5% of both maximal von Mises strain and displacement.
5.0E-03
5.5E-03
6.0E-03
6.5E-03
7.0E-03
0 4 8 12 16 20
Bone density reduction [%]
Stra
in [m
m/m
m]
Fig. 9 Bone density reduction versus maximal von Mises strain relationship
0.08
0.09
0.10
0.11
0.12
0 4 8 12 16 20
Bone density reduction [%]
Disp
lace
men
t [m
m]
Fig. 10 Bone density reduction versus displacement relationship
5. CONCLUSION
The goal of this study was to develop an accurate model of human vertebra using subject specific finite element modeling based on QCT. The finite element model was subjected to compressive loads to assess the vertebra behavior. In order to predict stress and strain distributions within vertebra in different phases of osteoporosis gradual reduc-tion of bone density was used to simulate osteoporotic changes within vertebra. This case study illustrated the usefulness of the model in investigation of the biomechanical behav-ior of the vertebra with osteoporotic changes. The results showed that the model was ca-pable of giving detailed quantitative information on the biomechanical behavior of the vertebra, and as such could be considered to be a very useful analysis tool in risk evalua-tion of osteoporotic fracture of vertebra in different phases of osteoporosis.
26 J.D. JOVANOVIĆ, M.LJ. JOVANOVIĆ
REFERENCES 1. Cody D., Gross G., Hou F., Spencer H., Goldstein S., Fyhrie D., (1999), Femoral strength is better predicted
by finite element models than QCT and DXA, Journal of Biomechanics, Vol.32, pp.1013-1020. 2. Tabensky A., Williams J., DeLuca V., et al., (1996), Bone mass, areal and volumetric bone density are
equally accurate, sensitive and specific surrogates of the breaking strength of the vertebral body: an in vitro study, Journal of Bone Mineral Research, Vol.11, pp.1981-1988.
3. Wilson C., (2003), Essentials of bone densitometry for the medical physicist, 45th Annual Meeting of American Association of Physicists in Medicine. San Diego, USA.
4. Vicenconti M., Davinelli M., Taddei F., Cappello A., (2004), Automatic generation of accurate subject-specific bone finite element models to be used in clinical studies, Journal of Biomechanics, Vol.37, pp.1597-1605.
5. Templton A., Cody D., Liebschner M., (2004), Updating a 3-D vertebral body finite element model using 2-D images, Medical Engineering & Physics, Vol.26, pp.329-333.
6. Liebschner M., Kopperdahl D., Rosenberg W., Keavany T., (2003), Finite element modeling of the human thoracolumbar spine, Spine, Vol.28, No.6, pp.559-565. Lippincot, Williams & Wilkins.
7. Mootanah R., Ingle P., Dowell J., Cheah K., Shelton J., (2001), An accurate three dimensional finite element model of the pelvic bone with geometry and material properties retrieved for CT-scan data, 7th International Symposium on Computer Simulation in Biomechanics, pp.81-84. Italy.
8. Lang T., Augat P., Majumdar S., Ouyang X., Genant H.K., (1998), Noninvasive assessment of bone density and structure using computed tomography and magnetic resonance, Bone, 22(5), pp.149S-53S.
9. Rho J., Hobatho M., Ashman R., (1995), Relations of mechanical properties to density and CT numbers in human bone, Medical Engineering & Physics, Vol.17, pp.347-355.
10. Couteau B., Hobatho M., Darmana R., Brignola J., Arlaud J., (1998), Finite element modeling of the vibrational behavior of the human femur using CT-based individualized geometrical and material properties, Journal of Biomechanics, Vol.31, pp.383-386.
11. Taddei F., Pancanti A., Viceconti M., (2004), An improved method for the automatic mapping of computed tomography numbers onto finite element models, Medical Engineering & Physics, Vol.26, pp.61-69.
12. Kopperdahl D., Morgan E., Keavany T., (2002), Quantitative computed tomography estimates of the mechanical properties of human vertebral trabecular bone, Journal of Orthopaedic Research, Vol.20, pp.801-805.
13. Kopperdahl D.L., Perlman J.L., Keavany T.M., (2000), Biomechanical consequences of an isolated overload on the human vertebral body, Journal of Orthopaedic Research, 18, pp.685-690.
14. White A.A., Panjabi M., (1990), Clinical biomechanics of the spine, J.B.Lippincott Company. 15. Lai C.C., Wang J.L., Chang G.L., Chung C.H., (2003), The load sharing contribution of spinal facet
joint during impact loading – a porcine biomechanical model, ASME International Mechanical Engineering Congress & Exposition, Washington, USA.
MODELIRANJE PRŠLJENA KONAČNIM ELEMENTIMA SA GEOMETRIJSKIM I MEHANIČKIM KARAKTERISTIKAMA
DOBIJENIM PREMA PODACIMA SA CT SKENERA
Janko D. Jovanović, Miomir Lj. Jovanović
Najizazovnija primjena modeliranja konačnim elementima je u u oblasti medicine. Modeliranje konačnim elementima kosti se koristi kako bi se shvatili mehanizmi povređivanje i oblici raspodjele napona i deformacija u kostima kao značajan faktor u kliničkoj procjeni povreda kosti, kao i u predviđanju rizika od pojava pukotina i loma kosti usled osteoporoze, koristi se takođe i za predviđanje remodeliranja koštanog tkiva nakon hirurški izvršene ugradnje koštanih implantata, kao i pri dizajniranju implantata. Većina navedenih primjena je orijentisana ka konkretnoj osobi, stoga kosti moraju biti modelirane uz individualizovanu rekonstrukciju geometrijskih i mehaničkih karakteristika. Ovaj rad predstavlja individualizovano modeliranje pršljena konačnim elementima sa geometrijskim i mehaničkim karakteristikama modela dobijenim prema podacima sa CT skenera i njegovu primjenu u predviđanju raspodjele napona i deformacija pršljena u različitim fazama osteoporoze.
Ključne reči: Modeliranje konačnim elementima, kompjuterska tomografija (CT), DICOM, pršljen