finite element modelling of squirrel, guinea pig and rat ... · pdf file1 finite element...
TRANSCRIPT
For Peer Review O
nly
Finite element modelling of squirrel, guinea pig and rat skulls: using 1
geometric morphometrics to assess sensitivity 2
3
Cox PG1, Fagan MJ
2, Rayfield EJ
3, Jeffery N
1 4
5
1Department of Musculoskeletal Biology, University of Liverpool, UK 6
2Department of Engineering, University of Hull, UK 7
3Department of Earth Sciences, University of Bristol, UK 8
9
Text pages: 21 10
Supplementary tables: 3 11
Tables: 3 12
Figures: 11 13
14
15
Corresponding author: Philip G. Cox 16
Address: Department of Musculoskeletal Biology, University of Liverpool, 17
Sherrington Buildings, Ashton Street, Liverpool, L69 3GE, UK 18
Tel: +44 (0)151 794 5454 19
Fax: +44 (0)151 794 5517 20
Email: [email protected] 21
22
23
Running Title: Sensitivity analyses of rodent FE models 24
25
Page 1 of 40 Journal of Anatomy

For Peer Review O
nly
ABSTRACT 1
2
Rodents are defined by a uniquely specialised dentition and a highly complex arrangement of 3
jaw-closing muscles. Finite element analysis (FEA) is an ideal technique to investigate the 4
biomechanical implications of these specialisations, but it is essential to understand fully the 5
degree of influence of the different input parameters of the FE model to have confidence in 6
the model's predictions. This study evaluates the sensitivity of FE models of rodent crania to 7
elastic properties of the materials, loading direction, and the location and orientation of the 8
model's constraints. Three FE models were constructed of squirrel, guinea pig and rat skulls. 9
Each was loaded to simulate biting on the incisors, and the first and the third molars, with the 10
angle of the incisal bite varied over a range of 45°. The Young's moduli of the bone and teeth 11
components were varied between limits defined by findings from our own and previously 12
published tests of material properties. Geometric morphometrics (GMM) was used to analyse 13
the resulting skull deformations. Bone stiffness was found to have the strongest influence on 14
the results in all three rodents, followed by bite position, and then bite angle and muscle 15
orientation. Tooth material properties were shown to have little effect on the deformation of 16
the skull. The effect of bite position varied between species, with the mesiodistal position of 17
the biting tooth being most important in squirrels and guinea pigs, whereas bilateral versus 18
unilateral biting had the greatest influence in rats. A GMM analysis of isolated incisor 19
deformations showed that, for all rodents, bite angle is the most important parameter 20
followed by elastic properties of the tooth. The results here elucidate which input parameters 21
are most important when defining the FE models, but also provide interesting glimpses of the 22
biomechanical differences between the three skulls, which will be fully explored in future 23
publications. 24
25
Keywords: Finite element analysis; sensitivity analysis; material properties; geometric 26
morphometrics; rodents. 27
28
29
30
31
32
33
34
Page 2 of 40Journal of Anatomy

For Peer Review O
nly
INTRODUCTION 1
2
Containing well over two thousand species, the Rodentia is by far the most speciose order of 3
mammals (Wilson & Reeder, 2005). It is also particularly interesting from a biomechanical 4
perspective owing to the unique specialisations of the feeding apparatus found in this group. 5
All rodents possess a pair of grossly enlarged continually growing incisors in both the upper 6
and lower jaws, followed by a highly reduced post-incisor dentition – usually just three or 7
four premolars and molars (Nowak, 1999). The incisors and cheek teeth are separated by a 8
large diastema which, combined with a mandible that is foreshortened relative to the skull, 9
has separated incisor gnawing from molar chewing. That is, when the molars are in 10
occlusion, the incisors do not meet, and vice versa, so that the two feeding modes have 11
become mutually exclusive activities (Hiiemae & Ardran, 1968). Indeed, to bring the incisors 12
and molars into and out of occlusion, part of the masticatory musculature has been adapted to 13
effect propalineal movement of the lower jaw (Becht, 1953). 14
15
The highly specialised morphology of the masticatory musculature has, in the past, been used 16
to classify the rodents (Brandt, 1855; Simpson, 1945). Almost all extant rodents exhibit one 17
of three distinct morphologies of the masseter muscle, known as the sciuromorph (squirrel-18
like), hystricomorph (porcupine-like) and myomorph (mouse-like) conditions (Wood, 1965). 19
Each of these morphologies represents an expansion of part of the masseter on to the rostrum, 20
as illustrated in Figure 1 (see Cox & Jeffery, 2011 for anatomical details). Recent molecular 21
phylogenetic work (Adkins et al. 2003; Blanga-Kanfi et al. 2009) has indicated that the 22
sciuromorphs, hystricomorphs and myomorphs are not monophyletic groups and should not 23
be used a basis for classification. Nevertheless, the terms sciuromorph, hystricomorph and 24
myomorph have been retained by many modern researchers as descriptors of skull and 25
masseter morphology, free from the implication of phylogenetic relationship (e.g. Hautier et 26
al. 2010). 27
28
Many previous studies have sought to determine the biomechanical outcomes of the complex 29
muscle morphology in the rodents. This has usually been achieved by studying feeding in 30
vivo with electromyography (e.g. Hiiemae & Ardran, 1968; Weijs & Dantuma, 1975; 31
Gorniak, 1977; Byrd, 1981) or by estimation of muscle forces and lines of action from 32
dissection (e.g. Hiiemae, 1971; Satoh, 1997, 1998, 1999; Vassallo & Verzi, 2001; Olivares, 33
2004; Druzinsky, 2010). A limited number of studies have sought to measure the bite force 34
Page 3 of 40 Journal of Anatomy

For Peer Review O
nly
generated by rodents, although, due to the relative inaccessibility of the molars, this has 1
largely been restricted to investigations of incisal biting (Robins, 1977; Nies & Ro, 2004; 2
Freeman & Lemen, 2008). This current study simulates the biomechanics of rodent feeding 3
using finite element analysis (FEA), a computational technique that predicts deformation, 4
stress and strain in a structure when subjected to external loading conditions. Developed as an 5
engineering tool for simulating the behaviour of man-made objects, FEA has more recently 6
been employed by biologists in order to understand the mechanics of biological structures, in 7
particular the vertebrate skull (e.g. Rayfield, 2004; Moreno et al. 2008; Moazen et al. 2009). 8
Typically, FEA has been used to assess the biomechanical performance of varying skull 9
geometries under controlled loading conditions approximating those experienced in real life 10
(e.g. Dumont et al. 2005, 2010; Rayfield, 2005; McHenry et al. 2007; Wroe et al. 2007). 11
However, there is also a body of work that investigates the effect of varying input parameters 12
(material properties, muscle loadings) on the outcome of an FE analysis primarily as a means 13
to define confidence in their findings, but also as a way to accommodate biological 14
stochasticity and to capture normal ranges of variation induced by processes such as muscle 15
fibre type transformation and osteoclast activity (Fagan et al. 2002; Ross et al. 2005; Kupczik 16
et al. 2007; Reed et al. 2011). 17
18
Previous research has indicated that variation in the elastic properties of the model materials 19
can have a large impact on the result of finite element analyses (Strait et al. 2005; Reed et al. 20
2011). Strait et al (2005) found that, although variations in material property values had little 21
effect on gross deformation patterns, the resulting numerical strain data were substantially 22
affected by changes in bone stiffness. Similarly, the magnitude and orientation of the muscle 23
forces applied to an FE model can also have a large effect on predicted strain values 24
(Marinescu et al. 2005; Ross et al. 2005). 25
26
The aim of this study was to investigate the effect of varying input parameters on the 27
outcomes of finite element analyses of rodent skulls. In particular, the material properties of 28
the biological tissues were varied, along with the position of the bite along the tooth row and 29
the angle at which biting occurs. Three rodents, representing the sciuromorph, hystricomorph 30
and myomorph morphologies, were studied. The results were analysed using geometric 31
morphometrics (GMM), a shape analysis technique that allows comparison of the skull 32
deformations generated by the different loading regimes. The results will help elucidate the 33
Page 4 of 40Journal of Anatomy

For Peer Review O
nly
relative importance of input parameters, identifying those that can be generalised from those 1
that are required to be known more precisely in future studies of the rodent skull. 2
3
4
MATERIALS AND METHODS 5
6
Sample 7
Three rodent species were chosen as representatives of the sciuromorph, hystricomorph and 8
myomorph masseter morphologies. These were, respectively, the Eastern grey squirrel 9
(Sciurus carolinensis), the domesticated guinea pig (Cavia porcellus) and the brown rat 10
(Rattus norvegicus). These species were selected as they were thought to be typical members 11
of each morphological group i.e. none is anomalously specialised for a particularly unusual 12
way of life or mode of feeding. In order to select an average individual of each species to 13
study, formalin-fixed heads of eight rats, eight guinea pigs and seven squirrels were imaged 14
using micro-computed tomography (microCT), carried out in the Department of Engineering, 15
University of Hull. Field of view (FOV) varied from 27 to 50 mm and slice thickness ranged 16
from 0.047 to 0.076 mm. The total number of slices ranged from 990 to 1160. Subsequently, 17
43 three-dimensional landmarks (listed in Table S1) were taken from the skull of each 18
specimen using Amira 5.3.2 (Mercury Systems Inc., Chelmsford, MA, USA). From these 19
data, variation in the shape of the skull within each species was analysed using geometric 20
morphometrics (O'Higgins, 2000; Adams et al. 2004) as implemented within the EVAN 21
toolkit (www.evan-society.org). The landmark co-ordinates were subjected to Procrustes 22
superimposition to remove translation, rotation and size differences, and then a principal 23
components analysis (PCA) was performed for each species. The Procrustes distance between 24
each specimen and the origin was calculated as the square root of the summed squared 25
principal component scores. The specimen with the shortest Procrustes distance to the origin 26
within each species was judged to be the individual closest to the mean shape of the sample 27
(which is located at the origin of the principal axes, O'Higgins, 2000), and this individual was 28
used to construct the finite element model. 29
30
Model creation 31
One finite element model was constructed for the squirrel, guinea pig and rat respectively 32
from the microCT scans using Amira 5.3.2. Each model comprised six separately thresholded 33
volumes: skull, molar teeth, incisor enamel, incisor dentine, incisor pulp cavity and 34
Page 5 of 40 Journal of Anatomy

For Peer Review O
nly
periodontal ligament (PDL); so that separate elastic properties could be applied to each of 1
these materials. The enamel, dentine and pulp could not be adequately distinguished in the 2
molar teeth, so these structures were modelled as a single volume. The models were 3
smoothed and converted to a mesh in Hypermesh 10.0 (Altair Engineering Inc., Troy, MI, 4
USA). Each mesh was entirely composed of linear tetrahedral elements and ranged in size 5
from 800,000 to 1.2 million elements (see Figure 2). 6
7
Material properties 8
Hypermesh 10.0 was also used to assign material properties to the elements and to add loads 9
and constraints to each model. The Young's modulus (E) of each of the skeletal tissues was 10
determined using a nano-hardness tester with a Berkovitch diamond indenter (CSM 11
Instruments S.A., Peseux, Switzerland). The range of values measured was used as the range 12
over which to vary the Young's modulus in the sensitivity analyses: bone, 10-30 GPa; incisor 13
enamel, 60-80 GPa; incisor dentine, 15-25 GPa; molar teeth, 20-40 GPa. As the enamel and 14
dentine could not be adequately distinguished in the molars, the cheek teeth were modelled as 15
a single volume with a single elastic modulus. Values for Young's modulus of the pulp cavity 16
and PDL were gathered from existing literature. Williams & Edmundson (1984) report a 17
Young's modulus of 2 MPa for the pulp cavity. No other information on this material could 18
be found, so it was decided to vary the pulp stiffness tenfold in each direction i.e. 0.2-20 19
MPa. In contrast, there is a wealth of literature on the Young's modulus of periodontal 20
ligament, with values ranging over several orders of magnitude. Rees & Jacobsen (1997) 21
report the range of values used for PDL in finite element studies. Three E values for PDL 22
were used in this study: 0.7 MPa (Tanne et al. 1987), 50 MPa (Wilson, 1991) and 1750 MPa 23
(Goel et al. 1992). Poisson's ratio for each material was gathered from existing literature 24
(Williams & Edmundson, 1984) and ranged between 0.30 and 0.33 except for PDL and the 25
pulp cavity (both 0.45). All materials were assumed to be linear and isotropic. 26
27
Muscle loads 28
In order to add muscle information to the FE models, the squirrel, guinea pig and rat 29
specimens were subjected to the technique of contrast-enhanced microCT (Jeffery et al. 30
2011). The specimens were immersed in iodine solution for a number of weeks and then 31
reimaged to reveal detail of the masticatory muscle architecture. For details of the imaging 32
protocol and descriptions of the rodent masticatory muscles, see Cox & Jeffery (2011). These 33
scans were also used to generate three-dimensional reconstructions of the masticatory 34
Page 6 of 40Journal of Anatomy

For Peer Review O
nly
muscles (Figure 1) to provide information on the origin sites of the muscles on the skull, and 1
from which muscle volumes could be measured. The contrast-enhanced images also allowed 2
measurement of muscle fibre lengths, and thus by dividing muscle volume by mean fibre 3
length, it was possible to calculate the physiological cross-sectional area (PCSA) of each 4
muscle. The superior masseter, deep masseter, zygomatico-mandibularis (anterior and 5
posterior parts), temporalis, internal pterygoid and external pterygoid muscles were applied in 6
each model. In addition, the infraorbital part of the zygomatico-mandibularis was modelled in 7
the rat and guinea pig, and the deep masseter was modelled as separate anterior and posterior 8
parts in the rat and squirrel (reflecting the difference in muscle morphology reported in Cox 9
& Jeffery, 2011). Muscle forces were estimated by multiplying the PCSA by a muscle stress 10
value of 0.3 Nmm-2
(van Spronsen et al. 1989; Strait et al. 2005). Each estimated muscle 11
force was distributed over multiple nodes (between 8 and 30) spread evenly across the 12
corresponding muscle origination site. Muscle force orientations were determined by 13
temporarily adding a reconstruction of the mandible to each model, so that a vector 14
representing fibre direction could be created between the origin and insertion of each muscle. 15
In the case of the temporalis, in which the fibres radiate from the insertion in a fan-shape and 16
thus vary greatly in their orientation, individual vectors were created for each node selected at 17
the origin. 18
19
The muscle force orientations were initially estimated with the mandible in a protracted 20
position, that is, with the incisors in occlusion. To account for the antero-posterior movement 21
of the lower jaw relative to the skull that is so characteristic of rodents, the mandible 22
reconstruction was retracted to bring the molars into occlusion and the muscle force vectors 23
were recalculated. Although not biologically realistic, it was decided to solve the models for 24
both incisor and molar biting with both a protracted and retracted mandible, in order to 25
understand the impact of mandibular position on the results of the FE analysis. 26
27
Constraints 28
In order to constrain the models and prevent free body motion, three or four nodes were 29
constrained in each mesh. A single node was constrained at each temporo-mandibular joint, 30
on the underside of the zygomatic process of the squamosal. This node was constrained in all 31
three axes on the left-hand side, but only two axes were constrained on the right, so that 32
medio-lateral movement of the skull was allowed. Any more than one node constrained at 33
each TMJ was found to over-constrain the skull and to produce very high local stresses 34
Page 7 of 40 Journal of Anatomy

For Peer Review O
nly
around the TMJ. Additionally, a node was constrained at the bite point in the axis of biting. 1
At the molars, this was always in a dorso-ventral direction, perpendicular to the occlusal 2
plane. At the incisors, the axis of constraint was varied between 90° and 45° to the occlusal 3
plane of the molars to simulate different gape angles. A constraint perpendicular to the 4
occlusal plane represents a very narrow gape, whereas a constraint at 45° to the occlusal 5
plane represents a wide gape. The bite point was varied between the incisors, the first molar 6
(M1) and the third molar (M3). Both bilateral and unilateral molar bites are observed in 7
rodents (Byrd, 1981) and so both were modelled in this analysis; incision was assumed 8
always to be bilateral due to the close apposition of the incisors. 9
10
Model solution and analysis 11
The FE models were solved using Abaqus 6.10.2 (Simulia, Providence, RI, USA). Each 12
model was solved for two mandible positions, four incisor bite angles, four molar bites (M1 13
and M3, unilateral and bilateral), three E values for bone, enamel, molar teeth, pulp cavity 14
and periodontal ligament, and two E values for dentine. Young's modulus of the incisor 15
materials was held constant during molar biting and vice versa. To reduce the number of 16
sensitivity analyses to be performed, the Young's moduli of pulp and PDL were fixed at 2 17
MPa and 50 MPa respectively for most analyses and were only changed in particular 18
instances. When pulp cavity stiffness was varied, all other tooth material properties were held 19
constant and only bone stiffness and bite angle were allowed to change. When PDL was 20
varied, all other material properties (including bone) were held constant, and only bite 21
position was changed. Similarly, most analyses were performed with a protracted mandible 22
and only a small number were repeated with the mandible in the retracted position. In total, 23
390 separate analyses were carried out, 130 per model; these are listed in Table S2. 24
25
In order to compare the analyses numerically, the resulting deformed models were subjected 26
to a geometric morphometric (GMM) form space analysis (O'Higgins et al. 2011), again 27
performed using the EVAN toolkit (www.evan-society.org). To undertake this, 36 three-28
dimensional landmark co-ordinates, illustrated in Figure 3, were recorded from each loaded 29
skull as well as from the original unloaded models. The set of landmarks previously used to 30
determine the 'most average' individual was not suitable for re-use here, as they were chosen 31
for their ease of location on a stack of microCT images. The landmarks used to examine skull 32
deformations needed to be easily locatable on a three-dimensional skull reconstruction in 33
which many bone sutures were not visible. The landmarks were recorded from three areas of 34
Page 8 of 40Journal of Anatomy

For Peer Review O
nly
high strain - orbits, zygomatic arches and rostrum - as well as more widely across the skull to 1
provide a general reflection of skull shape and deformation. Landmarks were defined as 2
precisely as possible to allow homologous points to be chosen in all three species. Homology 3
of landmarks between analyses within each species was absolute as each node of the model 4
was numbered by Abaqus 6.10.2 and therefore the same node could be selected in each 5
analysis. As before, the landmarks were subjected to a generalised Procrustes analysis and a 6
principal components analysis, so that each set of deformations could be compared with the 7
others and the original undeformed skull. The natural logarithm of the centroid size was also 8
included in the PC analysis alongside the Procrustes data, so that size as well as shape was 9
represented in the results (although an analysis of shape alone produced the same outcome). 10
A further six landmarks were recorded from the incisors of the gnawing analyses (see Figure 11
4). These were subjected to a separate GMM analysis to investigate the effect of gape angle 12
on the deformation experienced by the teeth. Analysis of variance (ANOVA) and Student's t-13
tests, implemented in PAST v1.93 (Hammer et al. 2001) were used to test for significant 14
differences between mean deformations experienced under different conditions. 15
16
17
RESULTS 18
19
Analysis of variation in skull morphology 20
The results of the GMM analysis on all 23 rodents allowed the 'most average' individual of 21
each rodent species to be determined. The percentage of total variance accounted for by each 22
principal component is given in Table 1, while the plot of the first two principal components 23
of the GMM for all 23 rodents together is shown in Figure 5. It can be seen that the 24
individuals separate clearly into three groups: squirrels, rats and guinea pigs, showing that 25
interspecific morphological variation is much greater than the intraspecific variation in this 26
sample. This is confirmed by ANOVA which demonstrates a statistically significant 27
difference (P < 0.001) between guinea pigs, rats and squirrels in this analysis. Examining the 28
GMM analyses of each species individually, it can be seen that the first two principal 29
components account for over 50% variation in each case (Table 1). In these individual 30
analyses, the specimen closest to the origin of the plot could be determined, using Procrustes 31
distances. This specimen was deemed to be closest to the mean form of the sample and was 32
used in subsequent model construction and analyses. The FE models of these specimens were 33
then loaded and assigned material properties to simulate the analyses outlined in Table S2. 34
Page 9 of 40 Journal of Anatomy
For Peer Review O
nly
1
Analysis of skull deformations 2
Figures 6-8 shows the maximum principal strain distributions across the three models in three 3
example analyses: biting at the incisors, bilateral biting at M1 and unilateral biting at M3, all 4
with a Young's modulus of bone of 10 GPa. Regions of the skull experiencing high strain 5
during these bites are the zygomatic arch, the rostrum and the orbit. It was thus from these 6
areas that the majority of landmarks to be used in the sensitivity analyses were recorded, 7
although a number of midline landmarks were also taken to reflect general skull shape (see 8
Figure 3). Although, these are just three sample analyses from the 130 conducted for each 9
rodent model, some general patterns can be determined. As might be expected, the rostrum 10
experiences high strains (particularly along its ventral margin) during incisor gnawing, but 11
very low strains during molar chewing. The unilateral bite on the third molar generates a 12
region of high strain in the dorsal temporal region immediately posterior to the orbit. This 13
appears to be a product of both the unilateral nature of the bite and its mesiodistal position 14
along the tooth row. The orbit is highly strained in incisor and M3 bites, but less so as a result 15
of the M1 bite. Overall, the rat skull appears to be experiencing the highest strains and the 16
guinea pig the lowest strains. 17
18
A GMM analysis of all FEAs for all three rodent species shows that variations in form due to 19
deformations are miniscule compared to those resulting from underlying, unloaded 20
morphological differences seen amongst the species studied. This is reflected in Table 2 21
where it can be seen that virtually all (> 99.99%) of the variation is accounted for by the first 22
two principal components. 23
24
The form deformations analysed individually for the squirrel, rat and guinea pig models are 25
shown in Figures 6-8, which include results for the variation of material properties, bite 26
position and mandible position. The first two principal components account for over 90% of 27
the variation in all three species (see Table 2), so only these two components have been 28
shown here. It is notable that the vast majority of the variance is accounted for by the first 29
principal component in the rat, whereas there is a much more even split between the first two 30
components in the guinea pig. The second principal component accounts for around 37% of 31
the variation in Cavia, compared to just 3% in Rattus. The squirrel sits between these two 32
extremes with 15% of the variation on the second component. These differences in the 33
distribution of variance across the principal components are clearly illustrated in Figures 6-8. 34
Page 10 of 40Journal of Anatomy

For Peer Review O
nly
In the rat and squirrel, all the analyses plot along lines parallel to the axes, whereas the guinea 1
pig incisor analyses, whilst showing a similar pattern, are plotted along lines obliquely angled 2
to the axes. 3
4
For each species, the variable that has the greatest effect on deformation of the skull is the 5
elastic property of the bone. It can be seen in Figures 6-8 that the analyses group into three 6
bands (mostly along the first principal component), representing bone with a Young’s 7
modulus of 10, 20 and 30 GPa (shown as green, blue and red points respectively). The mean 8
PC1 scores of these three bands representing the three values for bone stiffness were shown 9
to be highly significantly different (P < 0.001) in an ANOVA test. Analyses with the stiffest 10
bone, i.e. E = 30 GPa, deform the least and thus plot closest to the undeformed model. 11
Analyses with the most flexible bone are seen at the greatest distance from the original skull. 12
The distance between each analysis and the undeformed skull is known as the form distance 13
and is a combination of the Procrustes distance and the log centroid size. Form distances and 14
the Young's modulus of bone are inversely related, so that if the Young's modulus is halved, 15
form distance doubles (this can be confirmed from the GMM plots). Analyses that differ only 16
in the Young's modulus of bone show differences in strain magnitudes, not the pattern of 17
strains across the skull, and sit on a linear trajectory that also includes the unloaded model. 18
Hence, the principal components plots (Figures 6-8) all show a spreading, fan-like pattern in 19
which analyses with a Young's modulus of bone of 30 GPa are tightly clustered close to the 20
undeformed skull, and analyses with bone E of 10 GPa are more widely spaced at a greater 21
distance. Because of this, the example maximum principal strain contour plots displayed in 22
Figures 6-8 have been selected from separate trajectories i.e. they differ in the position of the 23
bite rather than the stiffness of the bone. 24
25
The second most important variable in terms of skull deformation is bite position. Within the 26
three bands on each plot, the analyses separate clearly into incisor bite, unilateral M1 bite, 27
bilateral M1 bite, unilateral M3 bite and bilateral M3 bite, with the incisor bite being quite 28
distinct from the four molar bites. The separation between bite positions is not significant 29
along the first principal component, but is highly significant along the second component (P 30
< 0.001). In all three rodents, the bilateral bite at M1 is the most similar to the incisor bites 31
and to the undeformed skull, and the unilateral bite at M3 is the furthest from them. In the 32
squirrel, the molar bites form two clear groups representing M1 bites and M3 bites (circles 33
and diamonds respectively in Figures 6-8), so that the pattern of molar bites in increasing 34
Page 11 of 40 Journal of Anatomy

For Peer Review O
nly
distance from the undeformed skull is bilateral M1, unilateral M1, bilateral M3 and unilateral 1
M3 (Figure 6). This pattern is replicated in the guinea pig, although the clustering of M1 and 2
M3 bites is not seen (Figure 7). In fact, the unilateral M1 and bilateral M3 bites are very 3
similar in this species. In rats, the pattern is altered to bilateral M1, bilateral M3, unilateral 4
M1 and unilateral M3 (Figure 8), so that the analyses are grouped into bilateral (solid shapes) 5
and unilateral bites (open shapes). Within the incisor bites, there is a division into four groups 6
representing the four different angles of bite at the incisor. In all three rodents, gnawing at 7
90° (squares) to the occlusal plane is most similar to molar biting and to the unloaded skull, 8
whilst gnaws at 45° (+ crosses) are the most different from mastication in terms of the skull 9
deformations produced. In squirrels and rats, the four bite angles are separated along the 10
second principal component, whereas in guinea pigs the axis of variation is oblique to both 11
PC1 and PC2. Although the distinction between the incisor bite angles is obvious visually (at 12
least within those analyses in which the Young's modulus of bone is 10 GPa), there is no 13
statistically significant difference between them when subjected to an ANOVA. 14
15
The effect of the mandibular propaliny is shown clearly in Figures 6-8, in which the darker 16
colours represent analyses in which the mandible was protracted and the lighter colours 17
indicate analyses with a retracted mandible. Variation in the position of the mandible is seen 18
along the same axis as variation in the Young's modulus of bone – for the rat and squirrel this 19
is the first principal component, for the guinea pig it is an axis oblique to both the first and 20
second principal components. The difference in deformation between the two mandibular 21
positions is relatively small compared to the difference seen when changing the bone stiffness 22
by 10 GPa, so the three bands representing the three input values for the Young's modulus of 23
bone are still clearly visible. This variable also reveals a difference between the guinea pig 24
model and the squirrel and rat models. Retraction of the mandible in the squirrel and rat 25
decreases the form distance between the loaded and unloaded models i.e. deformation is 26
reduced, whereas retraction of the guinea pig mandible increases the form distance between 27
the loaded and unloaded models, i.e. there is an increase in deformation. The difference 28
between the analyses with a protracted and a retracted mandible was not significant over the 29
whole dataset, but a significant difference in PC1 scores was found in the rat (P < 0.001) and 30
squirrel (P < 0.05) models when the analyses were divided into three groups based on the 31
Young's modulus of bone and subjected to separate t-tests. 32
33
Page 12 of 40Journal of Anatomy
For Peer Review O
nly
The results of varying the Young's modulus of the periodontal ligament are somewhat 1
unusual and have been displayed in purple and with a vertical line through the symbol in 2
Figures 6-8 for ease of visualisation. Very little difference in deformation pattern was found 3
when the Young's modulus was varied from 50 MPa to 1750 MPa. However, in all three 4
rodents, the skull deformations produced by analyses in which the E value of PDL is 0.7 MPa 5
are clearly separated from analyses with greater values for PDL stiffness. This effect is 6
particularly noticeable in the squirrel model loaded to simulate biting at the molars, in which 7
the analyses with low values of PDL stiffness are found at some distance from the 8
corresponding analyses with higher PDL E values (Figure 6). Furthermore, the impact of low 9
Young's modulus on the deformation pattern was not consistent across bite positions or 10
across the three rodents. Low PDL stiffness has most impact on bilateral molar bites in the rat 11
model, M3 bites in the squirrel model, and in the guinea pig model, it is the unilateral M3 bite 12
and the incisor bites that are most affected. However, on further inspection of the squirrel 13
model results with low PDL Young's modulus, it was noticed that the loaded molar was 14
apparently being displaced through the bone, which is clearly an unrealistic outcome. 15
Therefore, it was concluded that the strange results generated for low PDL Young's modulus 16
(in the squirrel at least) were erroneous and possibly due to an inability of the software to 17
cope with such a wide disparity (five orders of magnitude) between the PDL and bone 18
stiffness values. This behaviour was not seen with the higher PDL values, or in any of the 19
guinea pig and rat analyses. 20
21
The other variables studied in this analysis – material properties of the incisor enamel, 22
dentine, pulp cavity, molar teeth and the periodontal ligament – are relatively unimportant 23
factors affecting deformation of the skull compared to bone stiffness, bite position and lower 24
jaw position. The individual analyses representing these variables cannot be distinguished 25
from one another in Figures 6-8, and no statistically significant difference was found between 26
them. 27
28
Analysis of incisor deformations 29
To analyse deformation of the incisors under varying loading conditions, six landmarks were 30
taken from the incisors in each model and subjected to a geometric morphometric analysis. In 31
this study, only the angle of the bite at the incisor and the material properties of the enamel 32
and dentine were varied, giving a total of 24 analyses per species (see Table S3). Again, the 33
landmarks from the undeformed models were also included in the GMM. The results of the 34
Page 13 of 40 Journal of Anatomy

For Peer Review O
nly
analysis of all three rodents are shown in Table 3. As before, variations in form due to species 1
differences completely overwhelm those resulting from variation in input parameters, and 2
almost all the variation is accounted for by the first two principal components. Figures 9-11 3
show the plots of the first two principal components for the analyses of each rodent 4
separately. The maximum principal strain contour plots have also been shown for four 5
example analyses, representing the four bite angles, for each rodent. Table 3 gives the 6
percentage of variance contained within each principal component. In this analysis, the first 7
principal component covers over 80% of the variation in all three rodents. However, in a 8
reversal of the situation seen in the analysis of skull deformations, here it is the guinea pig 9
that is most dominated by the first component – 99.5% of variation is seen here – and it is the 10
rat that has the greatest amount of variance accounted for by the second component (15%). 11
12
It can be seen from Figures 9-11 that bite angle is the most important variable affecting 13
deformation of the incisors. The four bite angles analysed (90°, 75°, 60° and 45° to the 14
occlusal plane) form four distinct groups along the first principal component. The difference 15
between the means of these groups is highly significant (P < 0.001). It is particularly 16
interesting to note that the relationship of the undeformed model to the four groups 17
representing different bite angles varies between the three rodent species. In the guinea pig, 18
biting at 90° and 75° results in distinctly less deformation than biting at smaller angles to the 19
occlusal plane (Figure 10). In comparison, squirrels and rats appear to be able to gnaw at a 20
much greater range of angles (60° to 90° in squirrels, 45° to 75° in rats), without much 21
difference in the amount of deformation (Figures 9, 11). This can be seen from both the form 22
distances and the maximum principal strain contour plots. 23
24
Within each bite angle, the analyses are separated by the Young's modulus of the enamel and 25
the dentine. As might be expected, the more flexible the enamel or dentine, the greater the 26
deformation, and hence the greater the distance of the analysis from the original incisor on 27
the principal components plot. In the rats and squirrels, variation in the dentine stiffness 28
causes separation of the analyses along the second principal component, which is statistically 29
significant (P < 0.001) in an ANOVA test. Enamel stiffness is the least important variable for 30
these two rodents, and does not produce statistically significant separation along either of the 31
first two principal components. In contrast, in the guinea pig it is variation in enamel stiffness 32
that separates the analyses along PC2, and dentine stiffness is the least important variable. 33
34
Page 14 of 40Journal of Anatomy

For Peer Review O
nly
DISCUSSION 1
2
The results of this morphometric analysis show that, of the parameters varied in this analysis, 3
the material properties of the bone are the most important variables when modelling 4
deformation in the skull generated by feeding. It can be seen that a change of 10 GPa in 5
Young’s modulus can produce a greater change in the deformed skull form than a change in 6
bite position. Although this is a relatively large variation in modulus, it does demonstrate the 7
importance of using accurate material properties in finite element models, as relatively small 8
changes can produce significant variations in the results. However, as mentioned above, 9
changes in Young's modulus, only produce changes in the strain magnitudes, not the strain 10
patterns seen across the skull (as also noted by Strait et al. 2005). Therefore, while accurate 11
knowledge of bone material properties is vital for predicting strain values, it is not so 12
important if comparison of strain patterns is the desired outcome of the analysis. It should be 13
noted that the models considered here assumed isotropic material properties, whereas in 14
reality there will almost certainly be some anisotropy in the bone (Peterson & Dechow, 2003; 15
Strait et al. 2005). It is currently not possible to measure these directional variations in skulls 16
of this size, but in any case, it seems unlikely that the overall sensitivity of the results to the 17
material properties will be significantly different. 18
19
It has also been demonstrated that bite position can have a large effect on deformation 20
patterns in the skull, although not nearly as much as bone material properties, given the high 21
percentage of the variance seen on the first principal component. Incisor bites are always 22
well-differentiated from molar bites on the principal component plots. This is unsurprising 23
given the wide diastema between the incisors and cheek teeth. It can be seen from the 24
maximum principal strain plots in Figures 6-8 that the rostrum experiences high strains 25
during incisor gnawing but remains relatively unloaded during molar biting, and this is bound 26
to produce large differences in the pattern of deformation. The four molar bites modelled here 27
are also easily distinguishable on the principal component plots; however, they do not have 28
the same relationship to each other in the three models. In the squirrel and guinea pig, all 29
bites on the same tooth produce similar deformation patterns, whether they are bilateral or 30
unilateral. This is not the case in rats in which bilateral bites on different teeth are more 31
similar than a bilateral and a unilateral bite on the same tooth. This may be attributable to a 32
slightly shorter molar tooth row in the rat, in which the distance between the first and third 33
molars is around 9.5% of the total skull length as opposed to about 13% in the squirrel and 34
Page 15 of 40 Journal of Anatomy

For Peer Review O
nly
the guinea pig. A further influence may be the geometry of the skull and the positioning of 1
the teeth. The rat molars are located such that any vertical force on them, whether it is on the 2
first or third molar, will tend to propagate stress directly upwards into the orbit (Figure 8). In 3
the squirrel and guinea pig, force will also be directed into the orbit from the third molar, but 4
the morphology of the skull means that forces from the first molar remain localised around 5
the root of the zygomatic arch and are not transmitted to the orbit (Figures 6, 7). Thus the 6
deformations generated by an M1 bite are fairly similar to those produced by an M3 bite in 7
the rat, but are quite distinct in the squirrel and guinea pig. 8
9
The effect of varying the direction of pull of the muscle forces is highlighted in this study. 10
Rodents are notable amongst mammals in having two distinct positions of the mandible at 11
which biting can take place: a protracted orientation with the incisors in occlusion and a 12
retracted orientation with the molars in occlusion. Although the absolute distance between the 13
two arrangements is relatively small (2-3 mm displacement), it has been shown here that the 14
corresponding change in the orientation of the masticatory muscles can make a noticeable 15
difference to the results of an FE analysis. The most striking difference in the analyses 16
presented here is seen between the guinea pig, and the squirrel and rat. Retraction of the 17
mandible in the squirrel and rat leads to a reduction in the degree of deformation experienced 18
by the skull, whereas in the guinea pig it is protraction of the mandible that reduces skull 19
deformation. However, it should be noted that this is a hypothetical distinction, as rodents can 20
only accomplish incisor gnawing by protracting the mandible and can only chew at the 21
molars by retracting it. The options of chewing with a protracted lower jaw or gnawing with a 22
retracted lower jaw are not available. On examination of the Procrustes distances between 23
both protracted-mandible gnawing and retracted-mandible chewing and the undeformed 24
skull, it can be seen that the amount of skull deformation is very similar in each case, for any 25
given Young's modulus of bone. Therefore, the results indicate that accurate modelling of 26
muscle orientations is important in FEA, and where changes in the muscle pull directions 27
occur due to movement of the mandible (as in many groups of amniotes; Reilly et al. 2001), 28
these should be incorporated into the model. 29
30
The elastic properties of the periodontal ligament in cranial and mandibular FE models have 31
been studied in previous research with little consensus so far as to the extent of the influence 32
of the PDL on strain distributions (Marinescu et al. 2005; Gröning et al. 2011; 33
Panagiotopoulou et al. 2011; Wood et al. 2011). This study indicates that changing the 34
Page 16 of 40Journal of Anatomy
For Peer Review O
nly
Young's modulus of PDL between 50 MPa and 1750 MPa – the highest E value for PDL in 1
the scientific literature (Goel et al. 1992), as reported by Rees & Jacobsen (1997) – has very 2
little effect on the overall deformation of the rodent skull, although there were of course local 3
effects around the alveoli of the teeth. This is in agreement with previously conducted 4
sensitivity analyses of the properties of PDL in a primate cranium (Wood et al. 2011). 5
However, the results of this analysis are somewhat confounded by the unusual and 6
inconsistent deformations experienced by the models with very low Young's modulus of the 7
PDL (E = 0.7 MPa), and it is hypothesised that these deformations may be erroneous, 8
resulting from the large disparity (several orders of magnitude) between the Young's modulus 9
of the PDL and the surrounding bone. It is clear that the material properties of the PDL is a 10
highly contentious issue and one that requires further investigation, particularly with regard 11
to very low values of Young's modulus. 12
13
The results of the analysis of incisor deformation show that the guinea pig incisors deform 14
least during bites which are perpendicular to the occlusal plane. This is in contrast to rats and 15
squirrels in which incisal deformation is much more consistent over a large range of bite 16
angles. This suggests that gnawing in guinea pigs may be limited to quite narrow gape angles, 17
whereas rats and squirrels are capable of efficient gnawing at both wide and narrow gapes. 18
This would allow them to feed on food items of different sizes, a finding that is consistent 19
with the known diets of the rodents (Nowak, 1999). Rats and squirrels eat a much greater 20
proportion of hard foods (nuts and seeds) that require gnawing at the incisors, whereas guinea 21
pigs rely more on vegetation that tends to be chewed at the molars and does not require a 22
wide gape for ingestion. The varying importance of the material properties of the enamel and 23
dentine in the three rodents reflects the composition of the incisors in these three species. In 24
the rat and squirrel, the dentine forms a large part of the incisor (approximately 70%, as 25
measured in the FE models constructed for this study) compared to the enamel, and so it has a 26
greater influence on the deformation of the incisor during biting. In guinea pigs, the dentine is 27
somewhat reduced (around 50%) and it is the enamel that is the more important variable in 28
determining deformation patterns. 29
30
CONCLUDING REMARKS 31
32
It has been demonstrated that, of the input parameters studied here, the variables with the 33
greatest influence on the overall deformation predicted by a finite element analysis of three 34
Page 17 of 40 Journal of Anatomy

For Peer Review O
nly
representative rodent skulls are bone stiffness, and to a lesser extent, bite position, muscle 1
orientation and bite angle. It is clearly important to model these variables as accurately as 2
possible in FE models, in order to have the highest possible confidence in the results. 3
Significant variations in material properties were considered and yet the properties of the 4
tooth materials, enamel, dentine and pulp appear to be relatively unimportant in these 5
analyses, despite the large size of the incisors in rodents, and can be varied widely with little 6
effect on the overall pattern of deformation across the skull. Nevertheless, these variables can 7
have a substantial influence locally and, of course, are paramount when studying deformation 8
in the teeth themselves. It should be noted that overall deformation of the skull is being 9
represented by a single point in the GMM analyses presented here, and while the relative 10
distortions of the different analyses can be seen, no inferences can be drawn on the differing 11
distributions of the deformations. Furthermore, the loads applied to the models are non-12
physiological i.e., all muscles are contracting fully in each bite. Variation in the relative 13
muscle forces between the sensitivity analyses (for example, to optimise for bite force) could 14
produce different deformation distributions. These caveats notwithstanding, this study, 15
although limited in its scope to three species of rodent, contributes to a wider body of 16
evidence suggesting that the elastic modulus of bone is one of the key variables for 17
determining the outcome of FE analyses (Strait et al. 2005; Reed et al. 2011; Bright & 18
Rayfield, 2011). Using the results of this analysis to inform our choice of input parameters, 19
we now intend to investigate the biological significance of the results of the FE analyses 20
under certain loading regimes in the squirrel, guinea pig and rat. 21
22
ACKNOWLEDGEMENTS 23
24
The authors thank Sue Taft, Department of Engineering, University of Hull for microCT 25
imaging of the rodent heads. Thanks are also due to Jen Bright, University of Bristol and 26
Daniel Nieto, Altair Engineering for assistance with modelling software. We are grateful for 27
many helpful comments on the manuscript from Paul O'Higgins, Hull-York Medical School. 28
This work was supported by the Natural Environmental Research Council (NERC grant 29
NE/G001952/1). 30
31
32
33
34
Page 18 of 40Journal of Anatomy

For Peer Review O
nly
REFERENCES 1
2
Adams DC, Rohlf FJ, Slice DE (2004) Geometric morphometrics: ten years of progress 3
following the 'revolution'. Ital J Zool 71, 5-16. 4
Adkins RM, Walton AH, Honeycutt RL (2003) Higher-level systematics of rodents and 5
divergence time estimates based on two congruent nuclear genes. Mol Phylogenet Evol 6
26, 409-420. 7
Becht G (1953) Comparative biologic-anatomical researches on mastication in some 8
mammals. Proc Kon Ned Akad Wet, Ser C 56, 508-527. 9
Blanga-Kanfi S, Miranda H, Penn O, Pupko T, Debry RW, Huchon D (2009) Rodent 10
phylogeny revised: analysis of six nuclear genes from all major rodent clades. BMC 11
Evol Biol 9, 71. 12
Brandt JF (1855) Untersuchungen über die craniologischen Entwicklungsstufen und 13
Classification der Nager der Jetzwelt. Mém Acad Imp Sci St Pétersbourg, Sér 6 9, 1-14
365. 15
Bright JA, Rayfield EJ (2011) Sensitivity and ex vivo validation of finite element models of 16
the domestic pig cranium. J Anat doi: 10.1111/j.1469-7580.2011.01408.x 17
Byrd KE (1981) Mandibular movement and muscle activity during mastication in the guinea 18
pig (Cavia porcellus). J Morph 170, 147-169. 19
Cox PG, Jeffery N (2011) Reviewing the jaw-closing musculature in squirrels, rats and 20
guinea pigs with contrast-enhanced microCT. Anat Rec Part A 294, 915-928. 21
Druzinsky RE (2010) Functional anatomy of incisal biting in Aplodontia rufa and 22
sciuromorph rodents - Part 2: Sciuromorphy is efficacious for production of force at the 23
incisors. Cells Tissues Organs 192, 50-63. 24
Dumont ER, Piccirillo J, Grosse IR (2005) Finite-element analysis of biting behavior and 25
bone stress in the facial skeletons of bats. Anat Rec Part A 283A, 319-330. 26
Dumont ER, Davis JL, Grosse IR, Burrow AM (2010) Finite element analysis of 27
performance in the skulls of marmosets and tamarins. J Anat 218, 151-162. 28
Fagan MJ, Julian S, Siddall DJ, Mohsen AM (2002) Patient-specific spine models. Part 1: 29
finite element analysis of the lumbar intervertebral disc – a material sensitivity study. 30
Proc Instn Mech Engrs Part H J Eng Med 216, 299-314. 31
Freeman PW, Lemen CA (2008) Measuring bite force in small mammals with a piezo-32
resistive sensor. J Mammal 89, 513-517. 33
Goel VK, Khera SC, Gurusami S, Chen RCS (1992) Effect of cavity depth on stresses in a 34
restored tooth. J Prosthet Dent 67, 174-183. 35
Gorniak GC (1977) Feeding in golden hamsters, Mesocricetus auratus. J Morph 154, 427-36
458. 37
Gröning F, Fagan MJ, O'Higgins P (2011) The effects of the periodontal ligament on 38
mandibular stiffness: a study combining finite element analysis and geometric 39
morphometrics. J Biomech 44, 1304-1312. 40
Hammer Ø, Harper DAT, Ryan PD (2001) PAST: Paleontological Statistics software 41
package for education and data analysis. Palaeontol Elec 4, 9. 42
Hautier L, Clavel J, Lazzari V, Rodrigues HG, Vianey-Liaud M (2010) Biomechanical 43
changes and remodeling of the masticatory apparatus during mammalian evolution: the 44
case of the Issiodoromyinae (Rodentia). Palaios 25, 6-13. 45
Hiiemae K, Ardran, GM (1968) A cinefluorographic study of mandibular movement during 46
feeding in the rat (Rattus norvegicus). J Zool 154, 139-154. 47
Hiiemae K (1971) The structure and function of jaw muscles in rat (Rattus norvegicus L.). 48
III. The mechanics of the muscles. Zool J Linn Soc 50, 111-132. 49
Page 19 of 40 Journal of Anatomy

For Peer Review O
nly
Jeffery NS, Stephenson R, Gallagher JA, Jarvis JC, Cox PG (2011) Micro-computed 1
tomography with iodine staining resolves the arrangement of muscle fibres. J Biomech 2
44, 189-192. 3
Kupczik K, Dobson CA, Fagan MJ, Crompton RH, Oxnard CE, O'Higgins PO (2007) 4
Assessing mechanical function of the zygomatic region in macaques: validation and 5
sensitivity testing of finite element models. J Anat 210, 41-53. 6
Marinescu R, Daegling DJ, Rapoff AJ (2005) Finite-element modeling of the anthropoid 7
mandible: the effects of altered boundary conditions. Anat Rec Part A 283A, 300-309. 8
McHenry CR, Wroe S, Clausen PD, Moreno K, Cunningham E (2007) Supermodeled 9
sabercat, predatory behavior in Smilodon fatalis revealed by high-resolution 3D 10
computer simulation. Proc Natl Acad Sci 140, 16010-16015. 11
Moazen M, Curtis N, Evans SE, O’Higgins P, Fagan MJ (2009) Biomechanical 12
assessment of evolutionary changes in the lepidosaurian skull. Proc Natl Acad Sci USA 13
20, 8273-8277. 14
Moreno K, Wroe S, Clausen P, McHenry et al. (2008) Cranial performance in the Komodo 15
dragon (Varanus komodoensis) as revealed by high-resolution 3-D finite element 16
analysis. J Anat 212, 736-746. 17
Nies M, Ro JY (2004) Bite force measurement in awake rats. Brain Res Protoc 12,180-185. 18
Nowak R (1999) Walker’s Mammals of the World. Baltimore: Johns Hopkins Press. 19
O'Higgins P (2000) The study of morphological variation in the hominid fossil record: 20
biology, landmarks and geometry. J Anat 197, 103-120. 21
O'Higgins P, Cobb SN, Fitton LC, et al. (2011) Combining geometric morphometrics and 22
functional simulation: an emerging toolkit for virtual functional analyses. J Anat 218, 3-23
15. 24
Olivares AI, Verzi DH, Vassallo AI (2004) Masticatory morphological diversity and 25
chewing modes in South American caviomorph rodents (family Octodontidae). J Zool 26
263, 167-177. 27
Panagiotopoulou O, Kupczik K, Cobb SN (2011) The mechanical function of the 28
periodontal ligament in the macaque mandible: a validation and sensitivity study using 29
finite element analysis. J Anat 218, 75-86. 30
Peterson J, Dechow PC (2003) Material properties of the human cranial vault and zygoma. 31
Anat Rec 274A, 785-797. 32
Rayfield EJ (2004) Cranial mechanics and feeding in Tyrannosaurus rex. Proc R Soc Lond B 33
271, 1451-1459. 34
Rayfield EJ (2005) Aspects of comparative cranial mechanics in the theropod dinosaurs 35
Coelophysis, Allosaurus and Tyrannosaurus. Zool J Linn Soc 144, 309-316. 36
Reed DA, Porro LB, Iriarte-Diaz J, et al. (2011) The impact of bone and suture material 37
properties on mandibular function in Alligator mississippiensis: testing theoretical 38
phenotypes with finite element analysis. J Anat 218, 59-74. 39
Rees JS, Jacobsen PH (1997) Elastic modulus of the periodontal ligament. Biomaterials 18, 40
995-999. 41
Reilly SM, McBrayer LD, White TD (2001) Prey processing in amniotes: biomechanical 42
and behavioral patterns of food reduction. Comp Biomech Physiol Part A 128, 397-415. 43
Robins MW (1977) Biting loads generated by the laboratory rat. Arch Oral Biol 22, 43-47. 44
Ross CF, Patel BA, Slice DE, et al. (2005) Modeling masticatory muscle force in finite 45
element analysis: sensitivity analysis using principal coordinates analysis. Anat Rec Part 46
A 283A, 288-299. 47
Satoh K (1997) Comparative functional morphology of mandibular forward movement 48
during mastication of two murid rodents, Apodemus speciosus (Murinae) and 49
Clethrionomys rufocanus (Arvicolinae). J Morphol 231, 131-142. 50
Page 20 of 40Journal of Anatomy

For Peer Review O
nly
Satoh K (1998) Balancing function of the masticatory muscles during incisal biting in two 1
murid rodents, Apodemus speciosus and Clethrionomys rufocanus. J Morphol 236, 49-2
56. 3
Satoh K (1999) Mechanical advantage of area of origin for the external pterygoid in two 4
murid rodents, Apodemus speciosus and Clethrionomys rufocanus. J Morphol 240, 1-14. 5
Simpson GG (1945) The principles of classification and a classification of mammals. Bull 6
Am Mus Nat Hist 85, 1-350. 7
Strait DS, Wang Q, Dechow PC, et al. (2005) Modeling elastic properties in finite element 8
analysis: how much precision is needed to produce an accurate model? Anat Rec Part A 9
283A, 275-287. 10
Tanne K, Sakuda M, Burstone CJ (1987) Three-dimensional finite element analysis for 11
stress in the periodontal tissue by orthodontic forces. Am J Orthod Dentofacial Orthop 12
92, 499-505. 13
van Spronsen PH, Weijs WA, Valk J, Prahl-Andersen B, van Ginkel FC (1989) 14
Comparisons of jaw-muscle bite-force cross-sections obtained by means of magnetic 15
resonance imaging and high-resolution CT scanning. J Dent Res 68, 1765-1770. 16
Vassallo AI, Verzi DH (2001) Patrones craneanos y modalidades de masticacion en roedores 17
caviomorfos (Rodentia, Caviomorpha). Bol Soc Biol Concepcion Chile 72, 145–151. 18
Weijs WA, Dantuma R (1975) Electromyography and mechanics of mastication in the 19
albino rat. J Morph 146, 1-34. 20
Williams KR, Edmundson JT (1984) Orthodontic tooth movement analysed by the finite 21
element method. Biomaterials 5, 347-351. 22
Wilson A (1991) Linear and Non-linear Analysis of Orthodontic Tooth Movement. PhD 23
thesis. Swansea, Wales: University of Wales. 24
Wilson DE, Reeder DM (2005) Mammal species of the world. Baltimore: John Hopkins 25
Press. 26
Wood AE (1965) Grades and clades among rodents. Evol 19, 115-130. 27
Wood SA, Strait DS, Dumont ER, Ross CF, Grosse IR (2011) The effects of modeling 28
simplifications on craniofacial finite element models: the alveoli (tooth sockets) and 29
periodontal ligaments. J Biomech 44, 1831-1838. 30
Wroe S, Clausen P, McHenry C, Moreno K, Cunningham E (2007) Computer simulation 31
of feeding behaviour in the thylacine and dingo as a novel test for convergence and 32
niche overlap. Proc R Soc Lond B 274, 2819-2828. 33
34
35
36
37
SUPPLEMENTARY MATERIAL 38
39
Additional supplementary material may be found in the online version of this article. 40
41
Table S1 Cranial landmarks used to determine 'average' individuals. 42
43
Table S2 FE analyses solved for each rodent model, for analysis of skull deformations. 44
45
Table S3 FE analyses solved for each rodent model, for analysis of incisor deformations. 46
47
48
49
50
Page 21 of 40 Journal of Anatomy

For Peer Review O
nly
SUPPLEMENTARY MATERIAL 1
2
Table S1 3
Cranial landmarks used to determine 'average' individuals. 4
5
Midsagittal plane
1 Ventral extremity of incisors
2 Antero-ventral extremity of premaxilla
3 Ventral margin of nares
4 Dorsal margin of nares
5 Naso-frontal suture
6 Anterior interior margin of the brain-case
7 Fronto-parietal suture
8 Parieto-occipital suture
9 Posterior interior margin of the brain-case
10 Dorsal margin of foramen magnum
11 Ventral margin of foramen magnum
12 Basispheno-basioccipital suture
13 Prespheno-basisphenoid suture
14 Posterior point on palate
15 Posterior extremity of incisive foramen
Dentition
16 Posterior extremity of upper incisor alveolus
17 Anterior extremity of upper molar tooth row
18 Dorsal point on upper M1 alveolus
19 Dorsal point on upper M2 alveolus
20 Dorsal point on upper M3 alveolus
21 Medial point between upper M1 and M2 on surface of palatine
22 Medial point between upper M2 and M3 on surface of palatine
23 Posterior extremity of upper molar tooth row
Rostrum
24 Anterior extremity of naso-premaxilla suture
25 Anterior extremity of masseteric origin on rostrum
26 Anterior extremity of incisive foramen
27 Ventral extremity of premaxillo-maxilla suture
28 Posterior point on margin of infraorbital foramen
Zygomatic arch
29 Anterior point of inner margin of zygomatic arch
30 Ventral point on maxillo-jugal suture
31 Dorsal point on jugo-squamosal suture
32 Posterior point of inner margin of zygomatic arch
Temporal region
33 Dorsal point on margin of optic foramen
34 Dorsal point of ventral surface of articular process of squamosal
35 Antero-ventral point of pterygoid fossa
36 Anterior point on margin of foramen ovale
37 Widest point of the braincase
Otic region
38 Anterior extremity of external auditory meatus
Page 22 of 40Journal of Anatomy

For Peer Review O
nly
39 Posterior extremity of external auditory meatus
40 Anterior extremity of cochlea
41 Anterior extremity of auditory bulla
42 Ventral extremity of auditory bulla
43 Posterior tip of occipital condyle
1
2
3
Table S2 4
FE analyses solved for each rodent model, used for analysis of skull deformations. 5
6
Bite properties Young's modulus (GPa) Mandible
Position Tooth Sided Angle (°) Bone Enamel Dentine Pulp Molar PDL
pro I bi 45 10 70 15 0.002 30 0.05
pro I bi 45 10 70 25 0.0002 30 0.05
pro I bi 45 10 70 25 0.002 30 0.05
pro I bi 45 10 70 25 0.02 30 0.05
pro I bi 45 20 70 15 0.002 30 0.05
pro I bi 45 20 70 25 0.0002 30 0.05
pro I bi 45 20 70 25 0.002 30 0.05
pro I bi 45 20 70 25 0.02 30 0.05
pro I bi 45 30 70 15 0.002 30 0.05
pro I bi 45 30 70 25 0.0002 30 0.05
pro I bi 45 30 70 25 0.002 30 0.05
pro I bi 45 30 70 25 0.02 30 0.05
pro I bi 60 10 70 15 0.002 30 0.05
pro I bi 60 10 70 25 0.0002 30 0.05
pro I bi 60 10 70 25 0.002 30 0.05
pro I bi 60 10 70 25 0.02 30 0.05
pro I bi 60 20 70 15 0.002 30 0.05
pro I bi 60 20 70 25 0.0002 30 0.05
pro I bi 60 20 70 25 0.002 30 0.05
pro I bi 60 20 70 25 0.02 30 0.05
pro I bi 60 30 70 15 0.002 30 0.05
pro I bi 60 30 70 25 0.0002 30 0.05
pro I bi 60 30 70 25 0.002 30 0.05
pro I bi 60 30 70 25 0.02 30 0.05
pro I bi 75 10 60 15 0.002 30 0.05
pro I bi 75 10 60 25 0.002 30 0.05
pro I bi 75 10 70 15 0.002 30 0.05
pro I bi 75 10 70 25 0.0002 30 0.05
pro I bi 75 10 70 25 0.002 30 0.05
pro I bi 75 10 70 25 0.02 30 0.05
pro I bi 75 10 80 15 0.002 30 0.05
pro I bi 75 10 80 25 0.002 30 0.05
pro I bi 75 20 60 15 0.002 30 0.05
pro I bi 75 20 60 25 0.002 30 0.05
pro I bi 75 20 70 15 0.002 30 0.05
pro I bi 75 20 70 25 0.0002 30 0.05
pro I bi 75 20 70 25 0.002 30 0.0007
Page 23 of 40 Journal of Anatomy

For Peer Review O
nly
pro I bi 75 20 70 25 0.002 30 0.05
pro I bi 75 20 70 25 0.002 30 1.75
pro I bi 75 20 70 25 0.02 30 0.05
pro I bi 75 20 80 15 0.002 30 0.05
pro I bi 75 20 80 25 0.002 30 0.05
pro I bi 75 30 60 15 0.002 30 0.05
pro I bi 75 30 60 25 0.002 30 0.05
pro I bi 75 30 70 15 0.002 30 0.05
pro I bi 75 30 70 25 0.0002 30 0.05
pro I bi 75 30 70 25 0.002 30 0.05
pro I bi 75 30 70 25 0.02 30 0.05
pro I bi 75 30 80 15 0.002 30 0.05
pro I bi 75 30 80 25 0.002 30 0.05
pro I bi 90 10 70 15 0.002 30 0.05
pro I bi 90 10 70 25 0.0002 30 0.05
pro I bi 90 10 70 25 0.002 30 0.05
pro I bi 90 10 70 25 0.02 30 0.05
pro I bi 90 20 70 15 0.002 30 0.05
pro I bi 90 20 70 25 0.0002 30 0.05
pro I bi 90 20 70 25 0.002 30 0.05
pro I bi 90 20 70 25 0.02 30 0.05
pro I bi 90 30 70 15 0.002 30 0.05
pro I bi 90 30 70 25 0.0002 30 0.05
pro I bi 90 30 70 25 0.002 30 0.05
pro I bi 90 30 70 25 0.02 30 0.05
pro M1 bi n/a 10 70 25 0.002 20 0.05
pro M1 bi n/a 10 70 25 0.002 30 0.05
pro M1 bi n/a 10 70 25 0.002 40 0.05
pro M1 bi n/a 20 70 25 0.002 20 0.05
pro M1 bi n/a 20 70 25 0.002 30 0.0007
pro M1 bi n/a 20 70 25 0.002 30 0.05
pro M1 bi n/a 20 70 25 0.002 30 1.75
pro M1 bi n/a 20 70 25 0.002 40 0.05
pro M1 bi n/a 30 70 25 0.002 20 0.05
pro M1 bi n/a 30 70 25 0.002 30 0.05
pro M1 bi n/a 30 70 25 0.002 40 0.05
pro M1 uni n/a 10 70 25 0.002 20 0.05
pro M1 uni n/a 10 70 25 0.002 30 0.05
pro M1 uni n/a 10 70 25 0.002 40 0.05
pro M1 uni n/a 20 70 25 0.002 20 0.05
pro M1 uni n/a 20 70 25 0.002 30 0.0007
pro M1 uni n/a 20 70 25 0.002 30 0.05
pro M1 uni n/a 20 70 25 0.002 30 1.75
pro M1 uni n/a 20 70 25 0.002 40 0.05
pro M1 uni n/a 30 70 25 0.002 20 0.05
pro M1 uni n/a 30 70 25 0.002 30 0.05
pro M1 uni n/a 30 70 25 0.002 40 0.05
pro M3 bi n/a 10 70 25 0.002 20 0.05
pro M3 bi n/a 10 70 25 0.002 30 0.05
pro M3 bi n/a 10 70 25 0.002 40 0.05
Page 24 of 40Journal of Anatomy

For Peer Review O
nly
pro M3 bi n/a 20 70 25 0.002 20 0.05
pro M3 bi n/a 20 70 25 0.002 30 0.0007
pro M3 bi n/a 20 70 25 0.002 30 0.05
pro M3 bi n/a 20 70 25 0.002 30 1.75
pro M3 bi n/a 20 70 25 0.002 40 0.05
pro M3 bi n/a 30 70 25 0.002 20 0.05
pro M3 bi n/a 30 70 25 0.002 30 0.05
pro M3 bi n/a 30 70 25 0.002 40 0.05
pro M3 uni n/a 10 70 25 0.002 20 0.05
pro M3 uni n/a 10 70 25 0.002 30 0.05
pro M3 uni n/a 10 70 25 0.002 40 0.05
pro M3 uni n/a 20 70 25 0.002 20 0.05
pro M3 uni n/a 20 70 25 0.002 30 0.0007
pro M3 uni n/a 20 70 25 0.002 30 0.05
pro M3 uni n/a 20 70 25 0.002 30 1.75
pro M3 uni n/a 20 70 25 0.002 40 0.05
pro M3 uni n/a 30 70 25 0.002 20 0.05
pro M3 uni n/a 30 70 25 0.002 30 0.05
pro M3 uni n/a 30 70 25 0.002 40 0.05
ret I bi 45 10 70 25 0.002 30 0.05
ret I bi 45 20 70 25 0.002 30 0.05
ret I bi 45 30 70 25 0.002 30 0.05
ret I bi 60 10 70 25 0.002 30 0.05
ret I bi 60 20 70 25 0.002 30 0.05
ret I bi 60 30 70 25 0.002 30 0.05
ret I bi 75 10 70 25 0.002 30 0.05
ret I bi 75 20 70 25 0.002 30 0.05
ret I bi 75 30 70 25 0.002 30 0.05
ret I bi 90 10 70 25 0.002 30 0.05
ret I bi 90 20 70 25 0.002 30 0.05
ret I bi 90 30 70 25 0.002 30 0.05
ret M1 bi n/a 10 70 25 0.002 30 0.05
ret M1 bi n/a 20 70 25 0.002 30 0.05
ret M1 bi n/a 30 70 25 0.002 30 0.05
ret M1 uni n/a 10 70 25 0.002 30 0.05
ret M1 uni n/a 20 70 25 0.002 30 0.05
ret M1 uni n/a 30 70 25 0.002 30 0.05
ret M3 bi n/a 10 70 25 0.002 30 0.05
ret M3 bi n/a 20 70 25 0.002 30 0.05
ret M3 bi n/a 30 70 25 0.002 30 0.05
ret M3 uni n/a 10 70 25 0.002 30 0.05
ret M3 uni n/a 20 70 25 0.002 30 0.05
ret M3 uni n/a 30 70 25 0.002 30 0.05
1
Abbreviations: bi, bilateral; I, incisor; M1, first molar; M3, third molar; PDL, 2
periodontal ligament; pro, protracted; ret, retracted; uni, unilateral. 3
4
5
6
7
Page 25 of 40 Journal of Anatomy

For Peer Review O
nly
Table S3 1
FE analyses solved for each rodent model, used for analysis of incisor deformations. 2
3
Bite properties Young's modulus (GPa) Mandible
Position Tooth Sided Angle (°) Bone Enamel Dentine Pulp Molar PDL
pro I bi 45 20 60 15 0.002 30 0.05
pro I bi 45 20 60 25 0.002 30 0.05
pro I bi 45 20 70 15 0.002 30 0.05
pro I bi 45 20 70 25 0.002 30 0.05
pro I bi 45 20 80 15 0.002 30 0.05
pro I bi 45 20 80 25 0.002 30 0.05
pro I bi 60 20 60 15 0.002 30 0.05
pro I bi 60 20 60 25 0.002 30 0.05
pro I bi 60 20 70 15 0.002 30 0.05
pro I bi 60 20 70 25 0.002 30 0.05
pro I bi 60 20 80 15 0.002 30 0.05
pro I bi 60 20 80 25 0.002 30 0.05
pro I bi 75 20 60 15 0.002 30 0.05
pro I bi 75 20 60 25 0.002 30 0.05
pro I bi 75 20 70 15 0.002 30 0.05
pro I bi 75 20 70 25 0.002 30 0.05
pro I bi 75 20 80 15 0.002 30 0.05
pro I bi 75 20 80 25 0.002 30 0.05
pro I bi 90 20 60 15 0.002 30 0.05
pro I bi 90 20 60 25 0.002 30 0.05
pro I bi 90 20 70 15 0.002 30 0.05
pro I bi 90 20 70 25 0.002 30 0.05
pro I bi 90 20 80 15 0.002 30 0.05
pro I bi 90 20 80 25 0.002 30 0.05
4
Abbreviations: bi, bilateral; I, incisor; M1, first molar; M3, third molar; PDL, 5
periodontal ligament; pro, protracted; ret, retracted; uni, unilateral. 6
7
8
9
10
11
12
13
14
15
16
17
18
19
20
21
22
23
24
Page 26 of 40Journal of Anatomy

For Peer Review O
nly
TABLES 1
2
3
Table 1 4
5
Percentage of total variance accounted for by each principal component in a GMM analysis of 6
46 cranial landmarks recorded from 23 rodent individuals. 7
8
9
All rodents Squirrels Guinea pigs Rats
PC1 59.67 36.61 30.71 40.52
PC2 30.77 19.57 24.93 17.46
PC3 1.94 16.62 15.29 12.68
PC4 1.28 12.09 12.20 10.51
10
11
Table 2 12
13
Percentage of total variance accounted for by each principal component in a GMM analysis of 14
36 cranial landmarks recorded from 130 analyses per model. 15
16
17
All rodents Squirrel Guinea pig Rat
PC1 64.51 78.22 55.74 95.65
PC2 35.49 15.16 37.29 3.44
PC3 0.00 4.94 5.73 0.74
PC4 0.00 1.17 0.53 0.08
18
19
20
Table 3 21
22
Percentage of total variance accounted for by each principal component in a GMM analysis of 23
6 incisor landmarks recorded from 24 analyses per model. 24
25
26
All rodents Squirrel Guinea pig Rat
PC1 58.13 87.72 99.54 81.99
PC2 41.87 7.51 0.38 15.30
PC3 0.00 1.43 0.04 1.76
PC4 0.00 1.07 0.01 0.41
27
28
29
30
31
32
33
34
Page 27 of 40 Journal of Anatomy

For Peer Review O
nly
FIGURE LEGENDS 1
2
3
Figure 1. Three-dimensional reconstructions of the skull, mandible and masticatory muscles 4
of (A) squirrel (sciuromorph), (B) guinea pig (hystricomorph) and (C) rat (myomorph). 5
adm, anterior deep masseter; iozm, infraorbital part of the zygomatico-mandibularis; lt, 6
lateral temporalis; mt, medial temporalis; pdm, posterior deep masseter; sm, superior 7
masseter; t, temporalis. Scale bars = 5mm. 8
9
Figure 2. Three-dimensional FE models of the skull of a (A) squirrel, (B) guinea pig and (C) 10
rat, constructed in Hypermesh 10.0. Each mesh comprises between 0.8 to 1.2 million 11
linear tetrahedral elements. Green, bone; blue, incisor enamel; red, incisor dentine; 12
yellow, molar teeth. 13
14
Figure 3. Landmarks used in GMM analysis of skull deformations as shown on reconstruction 15
of rat skull in (A) dorsal, (B) ventral and (C) lateral view. 1, anteriormost point on 16
internasal suture; 2, midpoint between anterior roots of zygomatic arch; 3, midpoint 17
between medialmost points on orbital margins; 4, midpoint between temporo-18
mandibular joints; 5 posteriormost point on dorsal midline; 6, midpoint between ventral 19
margins of incisal alveoli; 7, midpoint between anteriormost points of first cheek teeth; 20
8, posteriormost midline point on palatine; 9, midpoint between posterior margin of 21
pterygoid flanges; 10, inferiormost point on margin of foramen magnum; 11, 22
anteriormost point on naso-frontal suture; 12, dorsalmost point on incisal alveolar 23
margin; 13, midpoint between I and M1 on ventral rostral margin; 14, postero-dorsal 24
extremity of rostrum; 15, anteriormost point on orbital margin; 16, midpoint between 15 25
and 17; 17, ventralmost point on zygomatic arch; 18, midpoint between 17 and 19; 19, 26
posteriormost point on orbital margin; 20, midpoint between 19 and 21; 21, 27
posteriormost point on dorsal orbital margin; 22, antero-dorsal point on margin of 28
orbital foramen; 23, midpoint of line running from dorsal apex of orbit to anterior 29
margin of M2. Landmarks 11 to 23 recorded on both sides of skull. 30
31
Figure 4. Landmarks used in GMM analysis of incisor deformation as shown on rat incisors 32
in (A) anterior and (B) posterior view. 1, dorsalmost point of anterior surface; 2, 33
midpoint of anterior surface; 3, midpoint of lateral surface; 4, midpoint of medial 34
surface; 5, midpoint of basal surface; 6, dorsalmost point of basal surface. 35
36
Figure 5. The first two principal components from a GMM analysis of cranial landmarks in 37
all 23 rodents. 38
39
Figure 6. The first two principal components from the GMM analysis of 36 cranial landmarks 40
in the squirrel. Maximum principal strains across the skull shown for three example 41
analyses of incisor, M1 and M3 biting. 42
43
Figure 7. The first two principal components from the GMM analysis of 36 cranial landmarks 44
in the guinea pig. Maximum principal strains across the skull shown for three example 45
analyses of incisor, M1 and M3 biting. 46
47
Figure 8. The first two principal components from the GMM analysis of 36 cranial landmarks 48
in the rat. Maximum principal strains across the skull shown for three example analyses 49
of incisor, M1 and M3 biting. 50
Page 28 of 40Journal of Anatomy

For Peer Review O
nly
1
Figure 9. The first two principal components from the GMM analysis of 6 incisor landmarks 2
in the squirrel. Maximum principal strains across the incisor shown for four example 3
analyses of biting at 45°, 60°, 75° and 90° to the occlusal plane. 4
5
Figure 10. The first two principal components from the GMM analysis of 6 incisor landmarks 6
in the guinea pig. Maximum principal strains across the incisor shown for four example 7
analyses of biting at 45°, 60°, 75° and 90° to the occlusal plane. 8
9
Figure 11. The first two principal components from the GMM analysis of 6 incisor landmarks 10
in the rat. Maximum principal strains across the incisor shown for four example 11
analyses of biting at 45°, 60°, 75° and 90° to the occlusal plane. 12
Page 29 of 40 Journal of Anatomy

For Peer Review O
nly
Figure 1. Three-dimensional reconstructions of the skull, mandible and masticatory muscles of (A) squirrel (sciuromorph), (B) guinea pig (hystricomorph) and (C) rat (myomorph). adm, anterior deep masseter; iozm, infraorbital part of the zygomatico-mandibularis; lt, lateral temporalis; mt, medial temporalis; pdm, posterior deep masseter; sm, superior masseter; t, temporalis. Scale bars =
5mm. 119x240mm (300 x 300 DPI)
Page 30 of 40Journal of Anatomy

For Peer Review O
nly
Figure 2. Three-dimensional FE models of the skull of a (A) squirrel, (B) guinea pig and (C) rat, constructed in Hypermesh 10.0. Each mesh comprises between 0.8 to 1.2 million linear tetrahedral
elements. Green, bone; blue, incisor enamel; red, incisor dentine; yellow, molar teeth. 112x159mm (300 x 300 DPI)
Page 31 of 40 Journal of Anatomy
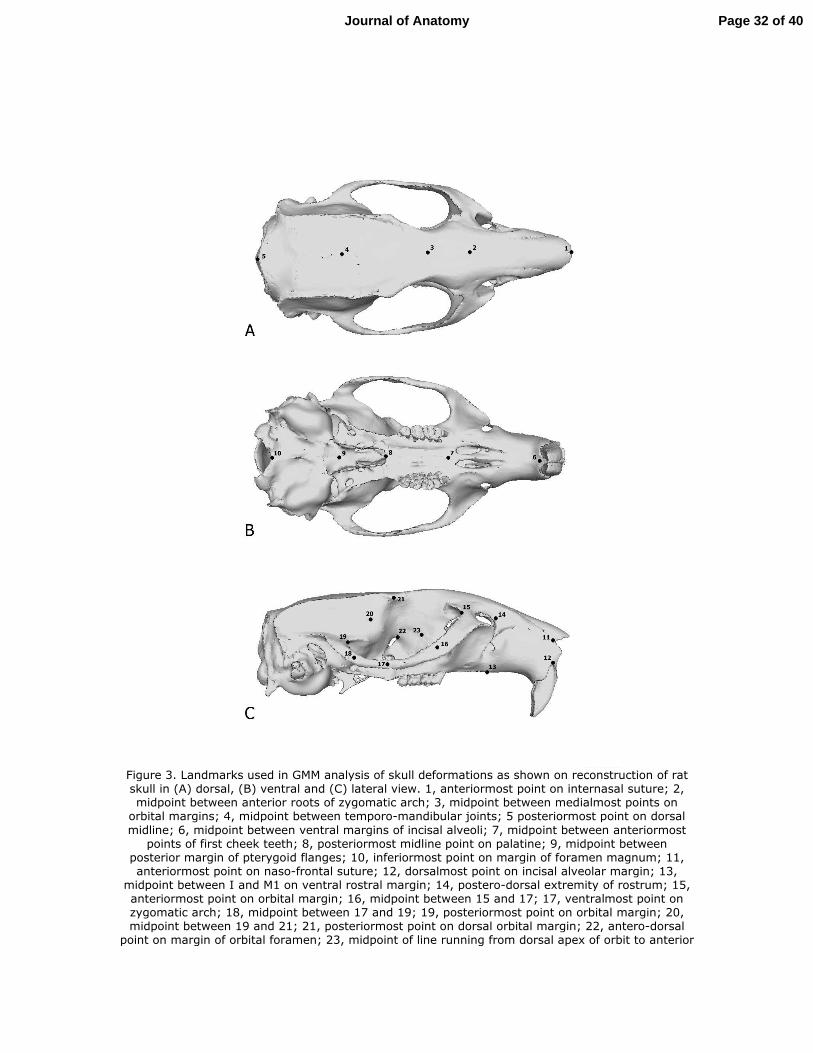
For Peer Review O
nly
Figure 3. Landmarks used in GMM analysis of skull deformations as shown on reconstruction of rat skull in (A) dorsal, (B) ventral and (C) lateral view. 1, anteriormost point on internasal suture; 2, midpoint between anterior roots of zygomatic arch; 3, midpoint between medialmost points on
orbital margins; 4, midpoint between temporo-mandibular joints; 5 posteriormost point on dorsal
midline; 6, midpoint between ventral margins of incisal alveoli; 7, midpoint between anteriormost points of first cheek teeth; 8, posteriormost midline point on palatine; 9, midpoint between
posterior margin of pterygoid flanges; 10, inferiormost point on margin of foramen magnum; 11, anteriormost point on naso-frontal suture; 12, dorsalmost point on incisal alveolar margin; 13,
midpoint between I and M1 on ventral rostral margin; 14, postero-dorsal extremity of rostrum; 15, anteriormost point on orbital margin; 16, midpoint between 15 and 17; 17, ventralmost point on zygomatic arch; 18, midpoint between 17 and 19; 19, posteriormost point on orbital margin; 20, midpoint between 19 and 21; 21, posteriormost point on dorsal orbital margin; 22, antero-dorsal
point on margin of orbital foramen; 23, midpoint of line running from dorsal apex of orbit to anterior
Page 32 of 40Journal of Anatomy

For Peer Review O
nly
margin of M2. Landmarks 11 to 23 recorded on both sides of skull. 80x128mm (300 x 300 DPI)
Page 33 of 40 Journal of Anatomy

For Peer Review O
nly
Figure 4. Landmarks used in GMM analysis of incisor deformation as shown on rat incisors in (A) anterior and (B) posterior view. 1, dorsalmost point of anterior surface; 2, midpoint of anterior
surface; 3, midpoint of lateral surface; 4, midpoint of medial surface; 5, midpoint of basal surface; 6, dorsalmost point of basal surface.
60x67mm (300 x 300 DPI)
Page 34 of 40Journal of Anatomy
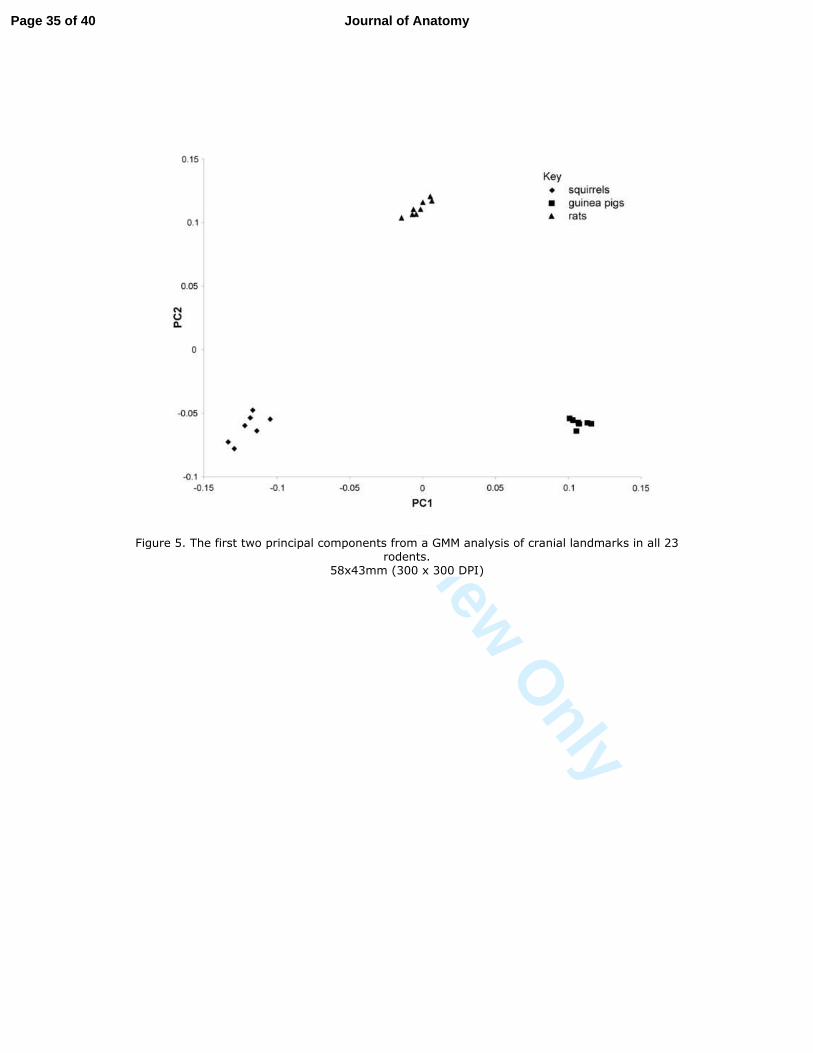
For Peer Review O
nly
Figure 5. The first two principal components from a GMM analysis of cranial landmarks in all 23 rodents.
58x43mm (300 x 300 DPI)
Page 35 of 40 Journal of Anatomy

For Peer Review O
nly
Figure 6. The first two principal components from the GMM analysis of 36 cranial landmarks in the squirrel. Maximum principal strains across the skull shown for three example analyses of incisor, M1
and M3 biting. 75x40mm (300 x 300 DPI)
Page 36 of 40Journal of Anatomy

For Peer Review O
nly
Figure 7. The first two principal components from the GMM analysis of 36 cranial landmarks in the guinea pig. Maximum principal strains across the skull shown for three example analyses of incisor,
M1 and M3 biting. 75x40mm (300 x 300 DPI)
Page 37 of 40 Journal of Anatomy

For Peer Review O
nly
Figure 8. The first two principal components from the GMM analysis of 36 cranial landmarks in the rat. Maximum principal strains across the skull shown for three example analyses of incisor, M1 and
M3 biting. 75x40mm (300 x 300 DPI)
Page 38 of 40Journal of Anatomy

For Peer Review O
nly
Figure 9. The first two principal components from the GMM analysis of 6 incisor landmarks in the squirrel. Maximum principal strains across the incisor shown for four example analyses of biting at
45°, 60°, 75° and 90° to the occlusal plane. 75x54mm (300 x 300 DPI)
Page 39 of 40 Journal of Anatomy

For Peer Review O
nly
Figure 10. The first two principal components from the GMM analysis of 6 incisor landmarks in the guinea pig. Maximum principal strains across the incisor shown for four example analyses of biting
at 45°, 60°, 75° and 90° to the occlusal plane. 75x54mm (300 x 300 DPI)
Page 40 of 40Journal of Anatomy

For Peer Review O
nly
Figure 11. The first two principal components from the GMM analysis of 6 incisor landmarks in the rat. Maximum principal strains across the incisor shown for four example analyses of biting at 45°,
60°, 75° and 90° to the occlusal plane. 75x54mm (300 x 300 DPI)
Page 41 of 40 Journal of Anatomy