finite element study of the effect of substrate properties
TRANSCRIPT

This content has been downloaded from IOPscience. Please scroll down to see the full text.
Download details:
IP Address: 103.53.34.34
This content was downloaded on 27/09/2016 at 04:30
Please note that terms and conditions apply.
You may also be interested in:
Adhesive friction based on finite element study and n-point asperity model
Prasanta Sahoo and Ajay K Waghmare
ZnO Nanorods Grown Electrochemically on Different Metal Oxide Underlays
I Gromyko, T Dedova, M Krunks et al.
Coatings and surface modification technologies
Jaroslav Mackerle
Tailoring the Matrix in Ultra-Nanocrystalline Diamond Films
Volker Buck and Nicolas Woehrl
Application of Smooth-Particle Hydrodynamics in Metal Machining
Abolfazl Zahedi, Simin Li, Anish Roy et al.
A finite element study of a current-carrying pinch in a strong longitudinal magnetic field
Sherif I Zaki
Finite element studies on field-dependent rigidities of sandwich beams with
magnetorheologicalelastomer cores
G Y Zhou, K C Lin and Q Wang
Finite Element Study of the Effect of Substrate Properties in Micro-cutting Thin Workpiece
Materials
View the table of contents for this issue, or go to the journal homepage for more
2016 IOP Conf. Ser.: Mater. Sci. Eng. 114 012005
(http://iopscience.iop.org/1757-899X/114/1/012005)
Home Search Collections Journals About Contact us My IOPscience

Finite Element Study of the Effect of Substrate Properties in
Micro-cutting Thin Workpiece Materials
K Saptaji1 and S Subbiah
2
1Faculty of Manufacturing Engineering, University Malaysia Pahang, 26600 Pekan,
Malaysia 2Department of Mechanical Engineering, Indian Institute of Technology Madras,
600036 Chennai, India
E-mail: [email protected]
Abstract. The cutting mechanism and residual stress profile of the micro-cutting thin
workpiece are affected by the interaction of the thin workpiece and the fixture (substrate)
underneath it similar to that observed in the nano-indentation and nano-scratching of thin film.
The appropriate substrate properties are necessary especially to avoid detachment during
machining and to minimize deformation and warping of the machined thin workpiece. Thus,
the investigations of the influence of substrate properties on micro-cutting thin workpiece are
essentially to be conducted. The finite element study of orthogonal micro-cutting of thin
Al6061-T6 is presented here. The simulations were conducted to study the residual stress
profile across the thickness of the machined thin workpiece at various workpiece thicknesses
and various substrate (adhesive) elastic properties. Simulations results show that as the
machined workpiece become thinner, the stress is more significant not only on the machined
surface but also it can reach the bottom of the workpiece. The stiffer substrate produces less
variation of the stress across the workpiece thickness while more compliant substrate produces
broader stress variation as the workpiece become thinner. The results show the significant
effect of the workpiece thickness and the substrate properties on the stress profiles in the
micro-cutting of thin workpiece.
1. Introduction
Investigations in micro-cutting thin workpieces (i.e. where the depth of cut may be comparable to
workpiece thickness) are rare while those in micro-cutting thick workpieces are widely reported. In the
machining of thick workpiece, the ratio of depth of cut (t0) to the machined workpiece thickness (tw) is
very small, and the depth of deformation beneath the tool in to the workpiece thickness is also usually
insignificant. The deformation induced by machining process may be more significant in the thinner
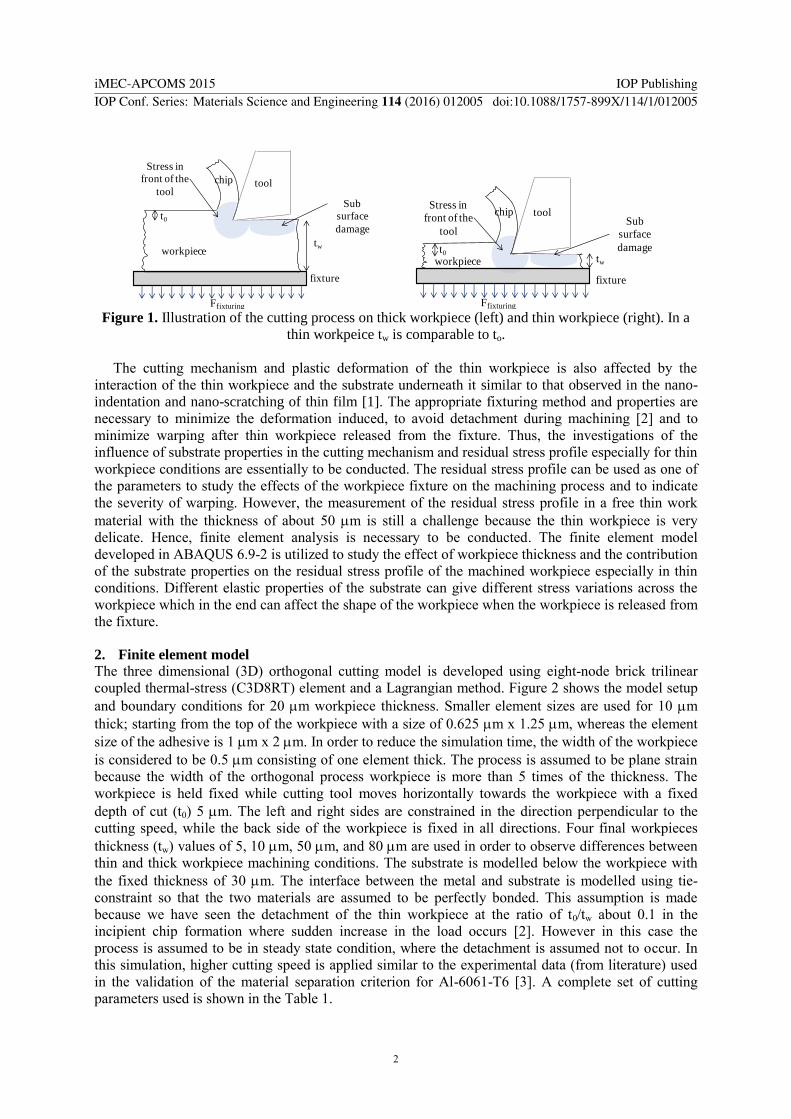
workpiece. In the thin workpiece, the ratio of t0 to tw is larger; hence the plastic deformation in the
form of stress produced by the tool may transmit through the thin workpiece, i.e. reach the bottom of
the workpiece and interacts with the interface of the workpiece and fixture (Figure 1). If the stress is
high enough it can pass through the fixture (substrate) or deflect back and furthermore produce
enhanced stresses or deformation; if the stresses are larger than the strength of the fixture it can lead to
detachment (slip-off) of the workpiece.
1 To whom any correspondence should be addressed.
iMEC-APCOMS 2015 IOP PublishingIOP Conf. Series: Materials Science and Engineering 114 (2016) 012005 doi:10.1088/1757-899X/114/1/012005
Content from this work may be used under the terms of the Creative Commons Attribution 3.0 licence. Any further distributionof this work must maintain attribution to the author(s) and the title of the work, journal citation and DOI.
Published under licence by IOP Publishing Ltd 1
tool
workpiece
fixture
Ffixturing
Sub
surface
damage
tw
t0
Stress in
front of the
toolchip
tool
workpiece
fixture
Ffixturing
t0tw
Sub
surface
damage
Stress in
front of the
tool
chip
Figure 1. Illustration of the cutting process on thick workpiece (left) and thin workpiece (right). In a
thin workpeice tw is comparable to to.
The cutting mechanism and plastic deformation of the thin workpiece is also affected by the
interaction of the thin workpiece and the substrate underneath it similar to that observed in the nano-
indentation and nano-scratching of thin film [1]. The appropriate fixturing method and properties are
necessary to minimize the deformation induced, to avoid detachment during machining [2] and to
minimize warping after thin workpiece released from the fixture. Thus, the investigations of the
influence of substrate properties in the cutting mechanism and residual stress profile especially for thin
workpiece conditions are essentially to be conducted. The residual stress profile can be used as one of
the parameters to study the effects of the workpiece fixture on the machining process and to indicate
the severity of warping. However, the measurement of the residual stress profile in a free thin work
material with the thickness of about 50 m is still a challenge because the thin workpiece is very
delicate. Hence, finite element analysis is necessary to be conducted. The finite element model
developed in ABAQUS 6.9-2 is utilized to study the effect of workpiece thickness and the contribution
of the substrate properties on the residual stress profile of the machined workpiece especially in thin
conditions. Different elastic properties of the substrate can give different stress variations across the
workpiece which in the end can affect the shape of the workpiece when the workpiece is released from
the fixture.
2. Finite element model
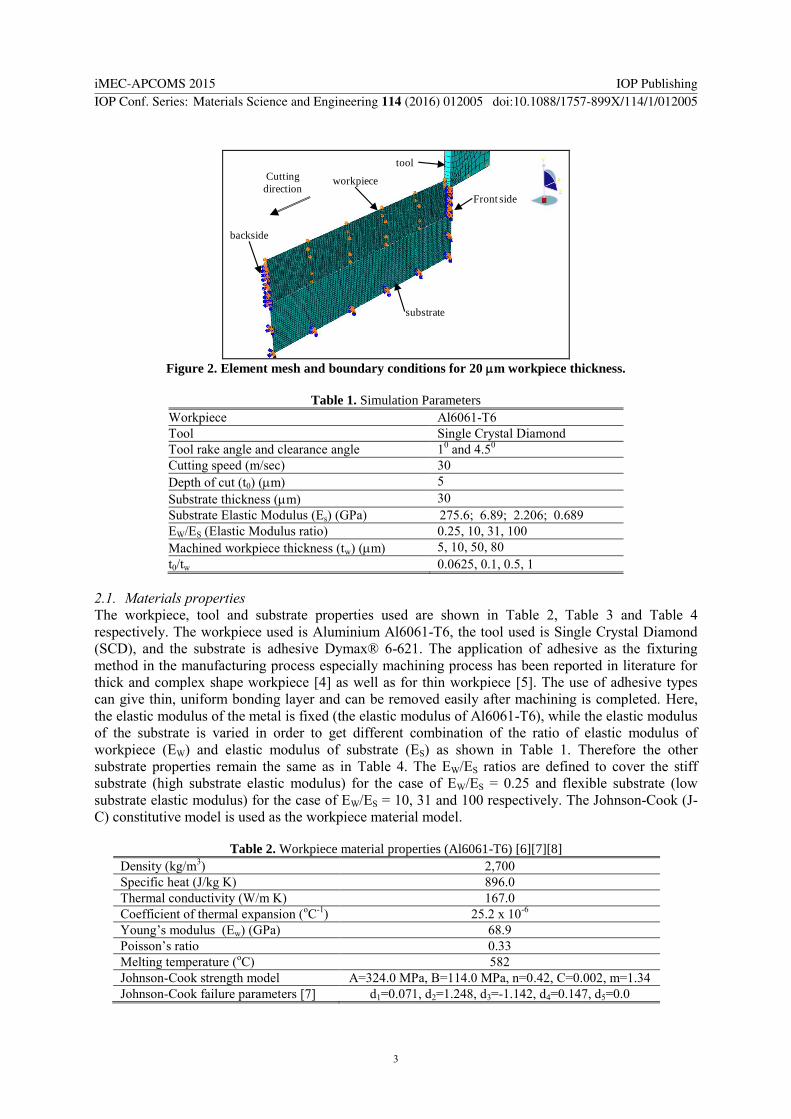
The three dimensional (3D) orthogonal cutting model is developed using eight-node brick trilinear
coupled thermal-stress (C3D8RT) element and a Lagrangian method. Figure 2 shows the model setup
and boundary conditions for 20 m workpiece thickness. Smaller element sizes are used for 10 m
thick; starting from the top of the workpiece with a size of 0.625 m x 1.25 m, whereas the element
size of the adhesive is 1 m x 2 m. In order to reduce the simulation time, the width of the workpiece
is considered to be 0.5 m consisting of one element thick. The process is assumed to be plane strain
because the width of the orthogonal process workpiece is more than 5 times of the thickness. The
workpiece is held fixed while cutting tool moves horizontally towards the workpiece with a fixed
depth of cut (t0) 5 m. The left and right sides are constrained in the direction perpendicular to the
cutting speed, while the back side of the workpiece is fixed in all directions. Four final workpieces
thickness (tw) values of 5, 10 m, 50 m, and 80 m are used in order to observe differences between
thin and thick workpiece machining conditions. The substrate is modelled below the workpiece with
the fixed thickness of 30 m. The interface between the metal and substrate is modelled using tie-
constraint so that the two materials are assumed to be perfectly bonded. This assumption is made
because we have seen the detachment of the thin workpiece at the ratio of t0/tw about 0.1 in the
incipient chip formation where sudden increase in the load occurs [2]. However in this case the
process is assumed to be in steady state condition, where the detachment is assumed not to occur. In
this simulation, higher cutting speed is applied similar to the experimental data (from literature) used
in the validation of the material separation criterion for Al-6061-T6 [3]. A complete set of cutting
parameters used is shown in the Table 1.
iMEC-APCOMS 2015 IOP PublishingIOP Conf. Series: Materials Science and Engineering 114 (2016) 012005 doi:10.1088/1757-899X/114/1/012005
2
tool
workpiece
substrate
Front side
backside
Cutting
direction
Figure 2. Element mesh and boundary conditions for 20 m workpiece thickness.
Table 1. Simulation Parameters
Workpiece Al6061-T6
Tool Single Crystal Diamond
Tool rake angle and clearance angle 10 and 4.5
0
Cutting speed (m/sec) 30
Depth of cut (t0) (m) 5
Substrate thickness (m) 30
Substrate Elastic Modulus (Es) (GPa) 275.6; 6.89; 2.206; 0.689
EW/ES (Elastic Modulus ratio) 0.25, 10, 31, 100
Machined workpiece thickness (tw) (m) 5, 10, 50, 80
t0/tw 0.0625, 0.1, 0.5, 1
2.1. Materials properties
The workpiece, tool and substrate properties used are shown in Table 2, Table 3 and Table 4
respectively. The workpiece used is Aluminium Al6061-T6, the tool used is Single Crystal Diamond
(SCD), and the substrate is adhesive Dymax® 6-621. The application of adhesive as the fixturing
method in the manufacturing process especially machining process has been reported in literature for
thick and complex shape workpiece [4] as well as for thin workpiece [5]. The use of adhesive types
can give thin, uniform bonding layer and can be removed easily after machining is completed. Here,
the elastic modulus of the metal is fixed (the elastic modulus of Al6061-T6), while the elastic modulus
of the substrate is varied in order to get different combination of the ratio of elastic modulus of
workpiece (EW) and elastic modulus of substrate (ES) as shown in Table 1. Therefore the other
substrate properties remain the same as in Table 4. The EW/ES ratios are defined to cover the stiff
substrate (high substrate elastic modulus) for the case of EW/ES = 0.25 and flexible substrate (low
substrate elastic modulus) for the case of EW/ES = 10, 31 and 100 respectively. The Johnson-Cook (J-
C) constitutive model is used as the workpiece material model.
Table 2. Workpiece material properties (Al6061-T6) [6][7][8]
Density (kg/m3) 2,700
Specific heat (J/kg K) 896.0
Thermal conductivity (W/m K) 167.0
Coefficient of thermal expansion (oC
-1) 25.2 x 10
-6
Young’s modulus (Ew) (GPa) 68.9
Poisson’s ratio 0.33
Melting temperature (oC) 582
Johnson-Cook strength model A=324.0 MPa, B=114.0 MPa, n=0.42, C=0.002, m=1.34
Johnson-Cook failure parameters [7] d1=0.071, d2=1.248, d3=-1.142, d4=0.147, d5=0.0
iMEC-APCOMS 2015 IOP PublishingIOP Conf. Series: Materials Science and Engineering 114 (2016) 012005 doi:10.1088/1757-899X/114/1/012005
3

Table 3. Tool material properties (SCD) [8]
Density (kg/m3) 3,500
Specific heat (J/kg K) 0.4715
Thermal conductivity (W/m K) 2,000
Coefficient of thermal expansion (oC
-1) 1.18 x 10
-6
Young’s modulus (GPa) 850
Poisson’s ratio 0.1
Table 4. Adhesive material properties (Dymax® 6-621).
Density (kg/m3) 1,066
Specific heat (J/kg K) 0.263
Coefficient of thermal expansion (oC
-1) 9 x 10
-6
Young’s modulus (GPa) 2.206
Poisson’s ratio 0.25 – 0.35
Tensile Lap Shear strength (steel-steel) (MPa) 24.82
Tensile at Break (MPa) 35.9
Elongation at Break (%) 35
2.2. Material separation criterion and failure model
Johnson-Cook (J-C) shear failure model is used to model chip formation [9] and to overcome the used
of separation criteria and predefined fracture line. The Johnson-Cook failure parameters (d1 to d5) for
Al6061-T6 are taken from literature [7] and given in Table 2. The experimentally measured cutting
force and thrust force values from the literature [3] of high speed cutting for Al6061-T61 are used for
the validation of the J-C failure parameters values. The cutting conditions are shown in Table 5.
Table 5. Cutting conditions for model validation [3]
Tool materials Rake angle Width of cut Depth of cut Cutting speed
D2 tool steel 5.5o 10.1 mm 0.25 mm 30 m/s
The results of the validation using the J-C failure parameters from [7] reveal that the forces
simulated match with the experimental results within an error, in cutting force of about 14.03% and
thrust force of about 8.9%. However, failure is seen to occur at damage parameter (ω) value of 0.6
(and not 1.0). Based on this comparison the model is well validated and the failure parameters are
reasonable to be used in the simulations.
2.3. Chip-tool interaction
The friction conditions proposed by Zorev [10] is used in this model. The parameters for the friction
conditions are determined to be τp=300 MPa and µ=0.25 [11].
2.4. Heat transfer
The thermal properties values of the Al6061-T6 and SCD tool are listed in the Table 2 and Table 3. It
is assumed that 90% of energy dissipated by plastic deformation is converted into heat [12] and heat is
mainly generated in an element by plastic work [13].
iMEC-APCOMS 2015 IOP PublishingIOP Conf. Series: Materials Science and Engineering 114 (2016) 012005 doi:10.1088/1757-899X/114/1/012005
4

3. Simulation results and discussion
SCD tool
Substrate
Al6061-T6
workpiece
chip
Figure 3. ABAQUS simulation for the chip formation process.
Figure 3 shows a steady state situation in one of the 3D orthogonal cutting condition simulated. Once
steady state in the cutting process is achieved, the maximum deformation is seen to occur in the shear
zone extending from the edge of the cutting tool to the junction between the undeformed workpiece
and the deformed chip, known as the primary deformation region. As the tool move towards the
workpiece during the cutting process, stresses in front of the tool and perpendicular with the cutting
direction are also generated. As the tool leaves the machined area, it leaves behind a deformed zone at
the surface and subsurface.
4
4.2
4.4
4.6
4.8
5
0 0.2 0.4 0.6 0.8 1 1.2
Cu
ttin
g F
orc
e (N
/mm
)
t0/tw
0.25
10
31
100
Ew/Es
0.9
0.95
1
1.05
1.1
1.15
1.2
0 0.2 0.4 0.6 0.8 1 1.2
Th
rust
Fo
rce
(N/m
m)
t0/tw
0.25
10
31
100
Ew/Es
Figure 4. Cutting force (left) and thrust force (right) for various ratio of EW/ES.
Force values are extracted from the simulation when the steady state cutting process is achieved
(Figure 4). In general, the cutting force ranges between 4.07 to 4.79 N/mm and the thrust force
between 0.94 to 1.11 N/mm. Both the cutting force and the thrust force values are widely diverged as
the t0/tw increased especially for the t0/tw = 0.5 and 1. These force variations may occur due to the
significant effect of the elastic modulus of the substrate especially when the workpiece becomes
thinner. The cutting force and thrust force values are the lowest for the case of EW/ES = 100 when the
t0/tw are 0.5 and 1. The lower substrate elastic modulus (EW/ES = 100) causing higher displacement due
to the more compliant properties of the substrate which affect the cutting process producing low value
of forces.
iMEC-APCOMS 2015 IOP PublishingIOP Conf. Series: Materials Science and Engineering 114 (2016) 012005 doi:10.1088/1757-899X/114/1/012005
5

3.1. Loading from the tool during steady state machining
tool
workpiece tw
t0
chip
Stress is extracted
across the thickness
from the tool tip
down to the bottom
of the workpiece. Figure 5. Illustration of the location where the stress is extracted from the workpiece. The stress is extracted
across the thickness of the workpiece from below the tool tip down to the bottom of the workpiece.
The stress values parallel to the cutting feed direction (S11) across the workpiece thickness of the
machined thin workpiece may corroborates the warping to be occurred after the thin workpiece
released from the fixture [14]. Hence this stress is extracted from the simulation across the thickness
of the workpiece at each nodal point down to the bottom of the workpiece during steady state cutting
condition and after the tool leaves the workpiece with the boundary conditions remained intact (Figure
5). The stress distributions across the workpiece thickness at steady state condition for different ratio
of depth of cut (t0) to the machined workpiece thickness (tw) are shown in Figure 6. The y axis
representing the loading stress from the cutting tool on the workpiece is plotted using the same axis
scale for the four graphs for ease of observations. The x-axis represents the distance from the
machined surface (tool tip) until the bottom of the workpiece (interface with the substrate).
-400
-300
-200
-100
0
100
200
300
0 1 2 3 4 5
S11 (
MP
a)
Distance from the tool tip (m)
0.25
10
31
100
-400
-300
-200
-100
0
100
200
300
0 2 4 6 8 10
S11 (
MP
a)
Distance from the tool tip (m)
0.25
10
31
100
-400
-300
-200
-100
0
100
200
300
0 10 20 30 40 50
S11 (
MP
a)
Distance from the tool tip (m)
0.25
10
31
100
-400
-300
-200
-100
0
100
200
300
0 10 20 30 40 50 60 70 80
S11 (
MP
a)
Distance from the tool tip (m)
0.25
10
31
100
(b) t0/tw = 0.5(a) t0/tw = 1
(d) t0/tw = 0.0625(c) t0/tw = 0.1
Figure 6. Stress profile parallel with the cutting direction across the workpiece thickness below the tool tip at
steady state condition plotted for different EW/ES ratio at various t0/tw.
iMEC-APCOMS 2015 IOP PublishingIOP Conf. Series: Materials Science and Engineering 114 (2016) 012005 doi:10.1088/1757-899X/114/1/012005
6

In general, the stress profiles are tensile near the tool tip for all the elastic modulus ratios and have
the maximum value at the depth about 1 – 5 m from the tool tip for all values of t0/tw. The stress
profile across the thickness of the workpiece is likely to have an S-shape curve that varies from tensile
near the tool tip and turn gradually to be compressive into the bottom workpiece with the turning point
near the middle section when t0/tw = 1 especially for EW/ES > 1 (compliant substrate) (Figure 6 (a)).
The EW/ES = 100 has the highest tensile stress at the depth of about 1.5 m and has the most
compressive stress at the bottom of the workpiece. The EW/ES = 0.25 has lower stress value and less
stress profile variation across the thickness compared to other EW/ES especially when t0/tw = 0.5 and
t0/tw = 1 (Figure 6 (a) and (b)). The significant different of the stress profile for EW/ES = 0.25
especially in t0/tw = 0.5 and t0/tw = 1 can occur due to the effect of the stiff substrate, in which the stress
is not penetrated deeper into the substrate and eventually is dissipated. The EW/ES = 31 and 100 have
the highest tensile stress near the tool tip but the EW/ES = 31 is the most compressive compared to
other EW/ES especially at the bottom of workpiece (more compressive) when t0/tw = 0.5 (Figure 6 (b)).
In the case of t0/tw = 0.1 and 0.0625, the stress values are relatively the same just below the tool tip and
increased to be more tensile in the vicinity of the tool tip and turn gradually to be smaller toward the
bottom of the workpiece (Figure 6 (c) and (d)). For t0/tw = 0.1 and 0.0625, the high tensile stress
occurs down to the depth about 3 – 5 m resulting in the ratio of the depth of deformation to the
workpiece thickness are about 0.1, and 0.0625 for t0/tw of 0.1, and 0.0625 respectively.
3.2. Substrate effects during steady state cutting conditions
0
0.2
0.4
0.6
0.8
1
1.2
0 5 10 15 20 25 30
Dis
pla
cem
ent
(m
)
Distance from the interface (m)
0.25
10
31
100
0
0.2
0.4
0.6
0.8
1
1.2
0 5 10 15 20 25 30
Dis
pla
cem
ent
(m
)
Distance from the interface (m)
0.25
10
31
100
0
0.2
0.4
0.6
0.8
1
1.2
0 5 10 15 20 25 30
Dis
pla
cem
ent
(m
)
Distance from the interface (m)
0.25
10
31
100
0
0.2
0.4
0.6
0.8
1
1.2
0 5 10 15 20 25 30
Dis
pla
cem
ent
(m
)
Distance from the interface (m)
0.25
10
31
100
(b) t0/tw = 0.5(a) t0/tw = 1
(d) t0/tw = 0.0625(c) t0/tw = 0.1
Figure 7. Displacement profile across the substrate at steady state cutting condition plotted for different EW/ES
ratio at various t0/tw.
The observation of the substrate displacement during steady state cutting conditions just below the tool
tip is important in order to understand the contribution of substrate elastic properties to the cutting
mechanisms (Figure 7). Similar with Figure 6 the four graphs shown in Figure 7 are applied using the
same y-axis scale for the displacement while the x-axis represented the distance from the interface.
In general, the displacement increases as the t0/tw and EW/ES increased. For the case of t0/tw = 1 and
0.5, the displacement increases as the EW/ES increased, and it is the largest at the interface and as
iMEC-APCOMS 2015 IOP PublishingIOP Conf. Series: Materials Science and Engineering 114 (2016) 012005 doi:10.1088/1757-899X/114/1/012005
7

going deeper it reduces to zero (Figure 7 (a) and (b)). In contrast, when t0/tw = 0.1 and 0.0625 the
displacements are very small compared to t0/tw = 1 and 0.5 (Figure 7 (c) and (d)). In addition, it can be
observed that for EW/ES = 0.25 displacement is very low compared to others especially when t0/tw = 1
and 0.5 due to the effect of the stiff substrate. The compliant substrate is seen to produce more
displacement and furthermore influences the forces especially for thinner workpiece conditions (t0/tw =
1 and 0.5). This can be observed especially for the case of EW/ES = 100 where the forces are lower
than for other elastic modulus ratios (Figure 4). While EW/ES = 0.25 (stiffer substrate) has much less
displacement which shows no significant changes of the forces at different t0/tw ratios. The
observations are similar to those observe in the nano-indentation of thin film where the film will sink-
in if the substrate is compliant, whereas stiffer substrates enhance the plastic flow of the film [1]. The
substrate properties are seen to have less significant effect on the cutting mechanism in the case of
thicker workpiece conditions (t0/tw = 0.1 and 0.0625) shown by the low displacement (Figure 7), low
stress values near the interface of the workpiece and substrate (Figure 6) and less varied forces values
(Figure 4). In contrast, the high displacement, more variation of stress across the thickness and more
variation of the forces indicate the substrate properties are affected significantly to the cutting
mechanism in thinner workpiece conditions (t0/tw = 1 and 0.5).
3.3. Residual stress profile after the tool leaves the workpiece
-400
-300
-200
-100
0
100
0 1 2 3 4 5
S11
(M
Pa
)
Distance from the surface (m)
0.25
10
31
100
-400
-300
-200
-100
0
100
0 2 4 6 8 10
S11
(M
Pa
)
Distance from the surface (m)
0.25
10
31
100
-400
-300
-200
-100
0
100
0 10 20 30 40 50
S11
(M
Pa
)
Distance from the surface (m)
0.25
10
31
100-400
-300
-200
-100
0
100
0 10 20 30 40 50 60 70 80
S11
(M
Pa
)
Distance from the surface (m)
0.25
10
31
100
(d) t0/tw = 0.0625(c) t0/tw = 0.1
(b) t0/tw = 0.5(a) t0/tw = 1
Figure 8. Stress profile parallel with the cutting direction across the workpiece thickness after the tool leaves the
workpiece plotted for different EW/ES ratio at various t0/tw.
The analysis of the stress profiles after the tool leaves the workpiece is also conducted. Figure 8 shows
the stress profiles across the workpiece thickness for various EW/ES at different t0/tw after the tool
leaves the workpiece. In general, the compressive stress presents in the machined surface implies that
the mechanical or plastic deformation is more dominant in the process [15]. The residual stress
profiles across the thickness of the workpiece shown in this condition represent the equilibrium
iMEC-APCOMS 2015 IOP PublishingIOP Conf. Series: Materials Science and Engineering 114 (2016) 012005 doi:10.1088/1757-899X/114/1/012005
8

conditions of the workpiece due to the effect of the substrates where the change of the shapes is
accommodated by the substrate.
For the compliant substrate (EW/ES > 1) when t0/tw = 1, the stress profile is appeared to be an S-
shape curve with the turning point around the middle section and the stress values are still in the
compressive state across the thickness with the EW/ES = 100 having the largest stress range from the
top to bottom surfaces (Figure 8 (a)). In contrast, the EW/ES = 0.25 has lowest compressive stress at the
machined surface, turned to become more compressive toward the bottom of the workpiece. The stress
values in the machined surface for all the EW/ES combination when t0/tw = 0.5 are higher compared to
other combination of t0/tw. The stress gradually becomes tensile to the depth of about 2 m and turn to
be compressive again toward to the bottom of the workpiece for EW/ES = 100 when t0/tw = 0.5. For
EW/ES = 0.25 the stress become more compressive as deeper into the subsurface and has less stress
variation values.
The existence of the high compressive stress only occurs down to the depth of about 3 m for t0/tw
= 0.1 and 0.0625 for all EW/ES, and gradually decreases to become constant which is not significant
compared to the thickness (Figure 8 (c) and (d)). Though the stress remains constant, the values do not
reach zero for the case of t0/tw = 0.1 because there may be minor effect from the substrate. This profile
is similar with the typical stress profile observed in the result of machining thick workpiece when
plastic deformation is more dominant than thermal strain [16] and also the ratio of the depth of
deformation to the thickness is not significant. However, the workpiece still possible to experience
shape changes in the form of warping after it is released from the substrate especially for the
compliant substrate. This is due to the pre-stretch conditions of the machined workpiece when it is
held by the compliant substrate.
3.4. Substrate effects after the tool leaves the workpiece
0
0.2
0.4
0.6
0.8
1
0 5 10 15 20 25 30
Dis
pla
cem
ent
(m
)
Distance from the interface (m)
0.25
10
31
100
0
0.2
0.4
0.6
0.8
1
0 5 10 15 20 25 30
Dis
pla
cem
ent
(m
)
Distance from the interface (m)
0.25
10
31
100
0
0.2
0.4
0.6
0.8
1
0 5 10 15 20 25 30
Dis
pla
cem
ent
(m
)
Distance from the interface (m)
0.25
10
31
100
0
0.2
0.4
0.6
0.8
1
0 5 10 15 20 25 30
Dis
pla
cem
ent
(m
)
Distance from the interface (m)
0.25
10
31
100
(b) t0/tw = 0.5(a) t0/tw = 1
(d) t0/tw = 0.0625(c) t0/tw = 0.1
Figure 9. Displacement profile across the substrate thickness after the tool leaves the workpiece plotted for
different EW/ES ratio at various t0/tw.
iMEC-APCOMS 2015 IOP PublishingIOP Conf. Series: Materials Science and Engineering 114 (2016) 012005 doi:10.1088/1757-899X/114/1/012005
9

In general, the displacements trends and values of the substrate after the tool leaves the workpiece are
similar with those in steady state cutting conditions for all variation of t0/tw. Figure 9 shows the
displacement profile across the substrate thickness after the tool leaves the workpiece for various t0/tw.
3.5. Discussion
Machining induced stress can influence the workpiece across the thickness and may reach the interface
of the workpiece and the substrate in the thin workpiece. The high t0/tw and high EW/ES conditions
have greatest effect on the machined workpiece especially in the combination when the t0/tw = 1 and
the compliant substrate with the stress profile generally having wider range of stress values from the
machined surface down to the bottom. Hence, these conditions, due to the large variation of the stress
across the thickness, may produce larger deflection of the workpiece shape. In the case of lower
thickness ratio, the less variation of the stress mainly due to the dissipation of the stress to other parts
of the thicker workpiece condition. These effects are observed in both the stress at steady state cutting
condition and the residual stress after the tool leaves the workpiece. Moreover, it can be seen from the
simulation results that the stress is tensile in the machined surface under steady state cutting condition
but turned to be compressive after the tool leaves the workpiece regardless the ratio of t0/tw and EW/ES.
In the thicker workpiece, the depth of the loading from the tool is highly affected only down to about
3-5 m below the machined surface. This is also seen in the residual stress where the high stress value
only occurs down to the same depth which is insignificant to the thickness. The stiffer substrate (ES >
Ew) produces less variation of the stress values across the thickness due to the stress dissipation by the
stiff substrate. In general, the effect of the different elastic modulus is more obvious when the
thickness ratios are 0.5 and 1. The results show a significant effect of the workpiece thickness and the
influence of the substrate properties on the stress profile in the micro-cutting process.
4. Summary
The main conclusions of this paper are:
a. The cutting force and thrust force values extracted from the simulation are relatively comparable
for the thick and thin workpiece and for different variation of elastic modulus, although as the
t0/tw becoming larger the forces range is broader for different elastic modulus ratio due to the
higher displacement experienced by the substrate.
b. The stress profile is broader when t0/tw = 0.5 and 1 in steady state cutting conditions and after the
tool leaves the workpiece implying that as the machined workpiece become thinner, the stress is
more significant not only on the machined surface but also it reaches the bottom of the workpiece.
c. The stiffer substrate produces less variation of the stress across the workpiece thickness while
more compliant substrate produces broader stress variation.
References
[1] Sakai, M., 2010, “Substrate-affected contact deformation and hardness of an elastoplastic film
coated on purely elastic substrates,” Surface and Coatings Technology, 204(8), pp. 1247–1251.
[2] Saptaji, K., and Subbiah, S., 2013, “Orthogonal Microcutting of Thin Workpieces,” Journal of
Manufacturing Science and Engineering, 135(3), p. 031004.
[3] Kazban, R. V, Vernaza Pena, K. M., and Mason, J. J., 2008, “Measurements of forces and
temperature fields in high-speed machining of 6061-T6 aluminum alloy,” Experimental
Mechanics, 48(3), pp. 307–317.
[4] De Meter, E. C., 2005, “Characterization of the quasi-static deformation of LAAG joints
adhering machined steel surfaces,” Journal of Manufacturing Science and Engineering, 127(2),
pp. 350–357.
[5] Ramesh, K., Huang, H., Yin, L., and Yui, A., 2004, “Surface waviness controlled grinding of
thin mold inserts using chilled air as coolant,” Materials and Manufacturing Processes, 19(2),
pp. 341–354.
iMEC-APCOMS 2015 IOP PublishingIOP Conf. Series: Materials Science and Engineering 114 (2016) 012005 doi:10.1088/1757-899X/114/1/012005
10

[6] Lesuer, D. R., Kay, G. J., and LeBlanc, M. M., 2001, “Modeling large strain, high rate
deformation in metals,” Modelling the Performance of Engineering Structural Materials II.
Proceedings of a Symposium, TMS - Miner. Metals & Mater. Soc, Warrendale, PA, USA, pp.
75–86.
[7] Gupta, N. K., Iqbal, M. A., and Sekhon, G. S., 2006, “Experimental and numerical studies on
the behavior of thin aluminum plates subjected to impact by blunt- and hemispherical-nosed
projectiles,” International Journal of Impact Engineering, 32(12), pp. 1921–1944.
[8] “http://www.matweb.com.”
[9] Johnson, G. R., and Cook, W. H., 1985, “Fracture characteristics of three metals subjected to
various strains, strain rates, temperatures and pressures,” Engineering Fracture Mechanics,
21(1), pp. 31–48.
[10] Zorev, N. N., 1963, “Interrelationship between shear processes occuring along tool face and on
shear plane in metal cutting,” In Proceedings of the International Research in Production
Engineering Conference, ASME, New York, pp. 42–49.
[11] Bourne, K. A., Kapoor, S. G., and DeVor, R. E., 2011, “Study of the mechanics of the micro-
groove cutting process,” Proceedings of the ASME 2011 International Manufacturing Science
and Engineering Conference, MSEC2011.
[12] Shih, A. J., 1996, “Finite element analysis of orthogonal metal cutting mechanics,”
International Journal of Machine Tools and Manufacture, 36(2), pp. 255–273.
[13] ABAQUS, 2009, Abaqus 6.9 documentation.
[14] Ruud, C. O., 1986, “Residual stress measurements,” ASM handbook / prepared under the
direction of the ASM International Handbook Committee, Materials Park, OH : ASM
International, 1986-.
[15] Jawahir, I. S., Brinksmeier, E., M’Saoubi, R., Aspinwall, D. K., Outeiro, J. C., Meyer, D.,
Umbrello, D., and Jayal, A. D., 2011, “Surface integrity in material removal processes: Recent
advances,” CIRP Annals - Manufacturing Technology, 60(2), pp. 603–626.
[16] Jacobus, K., DeVor, R. E., and Kapoor, S. G., 2000, “Machining-induced residual stress:
experimentation & modelling,” Journal of Manufacturing Science and Engineering,
Transactions of the ASME, 122, pp. 20–31.
iMEC-APCOMS 2015 IOP PublishingIOP Conf. Series: Materials Science and Engineering 114 (2016) 012005 doi:10.1088/1757-899X/114/1/012005
11