finland and sweden in cross-country comparison: what are … · finland and sweden in cross-country...
TRANSCRIPT

1
[MASTER OUP version 1 rev 1 AS 19.11.2013]
Finland and Sweden in Cross-Country Comparison: What are the Lessons?
by
Sixten Korkman* and Antti Suvanto**
Third draft
November 2013
Abstract
A comparison of the economic performance of Sweden and Finland supports three conclusions. First, it is tempting to see a causal link from crisis to reform illustrated by the developments and economic policies in Finland and Sweden following the crisis in the early 1990s. That crisis may be seen as somewhat of a blessing in disguise. It created a politi-cal situation that allowed significant structural reforms to be undertaken, and economic policies have since the crisis been more successful and “responsible” than in earlier periods. Policies have been geared towards fostering structural change and maintaining sound public finances. A second conclusion is that the (current version of the) “Nordic model” is relatively successful in combining equity and efficiency. A third conclusion is that the monetary regime may matter less for economic performance than often argued in the heated debate on the pros and cons of a single currency. While not constituting a laboratory experiment, a comparison of the performance of Finland and Sweden supports this contention. Admittedly, the jury is still out in the sense that Finland is now facing a structural weakness of its export base, and it remains to be seen whether domestic wage adjustment will allow this difficulty to be overcome within a reasonable time span.
Earlier versions of the paper were presented at the International Conference on “Reform Capacity and Macroeconomic Performance in the Nordic countries” at Copenhagen Business School, Copenhagen, September 20-21, 2013the 10
th
Euroframe Conference “Towards a better governance in the EU”, Warsaw, May 24, 2013, and at the seminar on “Structural Reforms and Fiscal Policy Governance in Northern Europe”, University of Edinburgh, November 24, 2012. We are grateful for comments by Fredrik Andersson, Seppo Honkapohja, Samu Kurri and David Mayes as well as the participants of the above-mentioned seminars. The views expressed in this paper are those of the authors, and do not necessarily reflect the views of the Bank of Finland.
* Professor, Aalto University School of Business, Helsinki. [email protected]
** Advisor to the Board, Bank of Finland, Helsinki. [email protected]

2

3
1. Introduction
Sweden and Finland are quite similar countries. They have a lot in common in terms of history and
basic institutions of society. They have similar economic structures as well as aspirations for and
ways of implementing economic policies. As will be seen, Finland and Sweden have performed in
very similar ways in the past 20 years (as well as before that). Overall, the economic developments
appear rather favourable in international comparison.
Finland and Sweden experienced a banking crisis and a serious recession (or a depression) in the
early 1990s. That experience had profound effects on economic policies. It triggered a process of
structural reform and contributed to the emphasis given to price stability and sound public financ-
es in subsequent years. While the banking crisis and its effects were traumatic, later developments
suggest that much was learnt from that experience.
Both Finland and Sweden joined the EU in 1995. In 1999 Finland also joined (Stage 3 of) EMU,
while Sweden after a referendum on the matter decided to stay outside. While far from being
identical twins, the economies and economic policies of these two countries are nevertheless ex-
ceptionally similar in most respects, except for the monetary regime. This paper exploits the simi-
larity between Finland and Sweden in order to appreciate the significance of EMU-membership.
However, given the uncertain outcome of the current euro area debt crisis, any appreciation of
the significance of the monetary union is associated with a number of caveats.1
2. Economic performance
Background
Both Finland and Sweden went through a severe recession in the early 1990s.2 GDP fell in Finland
by 13 per cent from peak to trough between 1990 and 1993. The rate of unemployment increased
five-fold from 3 to 16 per cent, and the government debt ratio increased four-fold from 14 to 58
per cent. Stock prices and house prices declined by one-half. Foreign indebtedness doubled, the
1 As far as we are aware there are three other studies comparing the relative performance of Finland and Sweden since the launch
of the EMU: Mayes and Suvanto (2007), Gylfason et al. (2010, Ch.8), and Suni and Vihriälä (2013).
2 For the crisis of the Nordic countries in the early 1990s, see Jonung et al. (2009). Bordes et al. (1993) present an early analysis of
the crisis in Finland. A recent assessment is found in Honkapohja et al. (2009).
4
currency lost one-third of its external value, the foreign exchange reserves of the central bank
were depleted, and the banking sector was faltering.
In Sweden the fall of GDP was 5 per cent between 1990 and 1993. The decline was smaller than in
Finland, but still dramatic in international as well as in historical comparison. The unemployment
rate rose from 2 to 9 per cent, and the government debt ratio rose from below 40 per cent to 75
per cent. Stock prices declined by 25 per cent, as did house prices. The currency weakened by
about 20 per cent soon after the decision to float the currency in November 1992.
The recession was much more severe in Finland largely as a consequence of the fact that a signifi-
cant export market was lost almost overnight following the collapse of the Soviet Union in 1991.
The build-up of the Finnish and Swedish crises in the early 1990s resembles the developments in
Ireland and Spain 20 years later.3 The recession was preceded by a boom associated with rapidly
growing indebtedness and rising property prices. When the bust occurred in 1991-92 the balance
sheets of banks weakened sharply. The very high interest rates resulting from the speculative at-
tacks against the currency and the credit crunch resulting from the weakening balance sheets of
banks depressed the economy even further. Also, competitiveness had been eroded by excessive
wage inflation during a number of years in combination with weak productivity developments.
Finland and Sweden were confronted with a banking crisis as well as a cost and currency crisis.
The export-led recovery started in both countries already in 1993. Exports were boosted by ex-
change rate depreciation and the recovery in the rest of the world. In relation to the ECU the Swe-
dish krona was some 25 per cent and Finnish markka around 20 per cent weaker in 1995-1999 as
compared to the period 1985-1989. In Finland the exchange rate overshot immediately after the
decision to allow the currency to float in September 1992. The depreciation was widely considered
as excessive and inconsistent with the new inflation target of the central bank announced in Feb-
ruary 1992. The expected appreciation as a consequence of the overshooting facilitated the sharp
decline in short-term interest rates in 1993.4
3 Kindleberger and Aliber (2011, 11) include the booms in Sweden, Norway and Finland in 1985-1989 as well as the real estate
bubbles in the US, Britain, Spain, Iceland and Ireland in 2002-2007 among the “big ten financial bubbles” in history.. Reinhard and Rogoff (2008) include the Finnish and Swedish episodes of the early 1990s among the “big five” on the history of banking crises.
4 This is an example of the Dornbusch overshooting mechanism at work, Dornbusch (1976).

5
It took much longer in both countries for domestic demand to return to the pre-crisis level. This is
consistent with the international experience from earlier banking crises (Reinhart and Rogoff
2009). It confirms the fact that it takes many years of painful adjustment for the balance sheets to
adjust to excessive indebtedness.
Economic performance since 1998
By 1998 both Finland and Sweden had more or less fully recovered from the banking crisis and the
recession. By that date both countries had joined the European Union. Finland had also decided to
join the euro area, while Sweden decided to stay outside with a floating exchange rate.
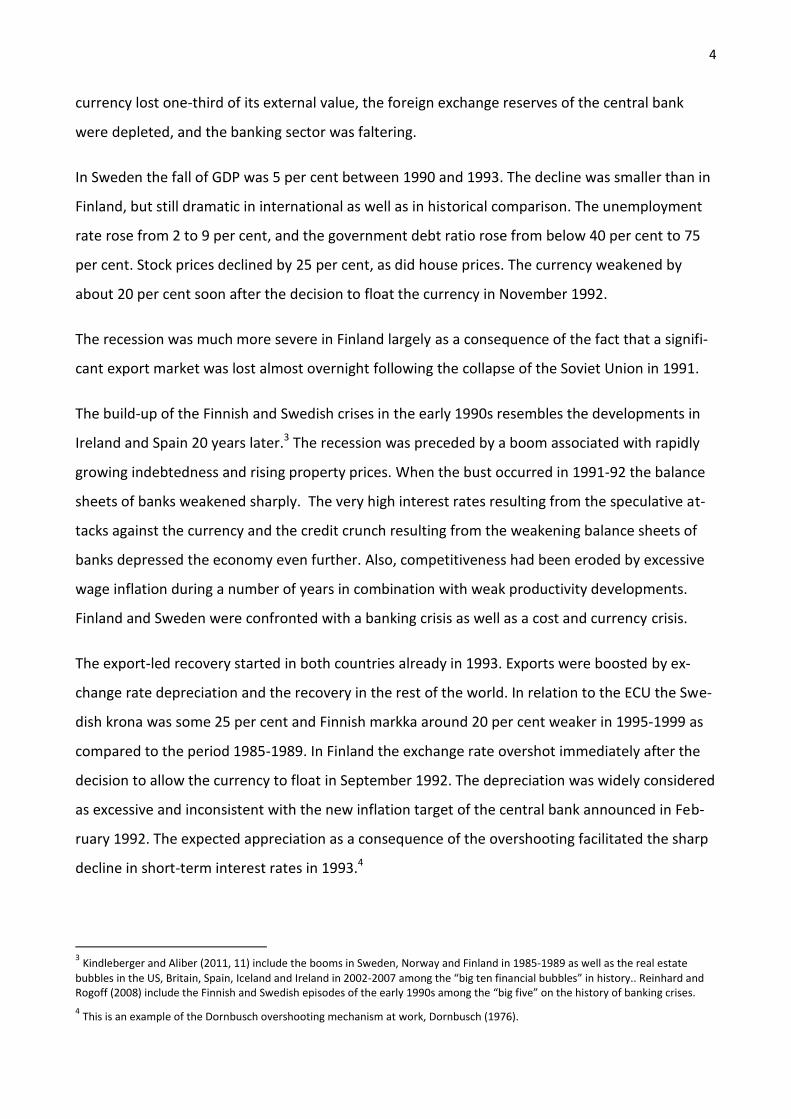
Figure 1 depicts the output performance of Finland and Sweden compared to that of the euro area
average. As is seen, until recently output growth in the two Nordic countries has been almost
identical and it has outperformed the euro area average by a clear margin. The recovery from the
great recession of 2008-2009 was stronger and more sustained in Sweden. We will return to the
recession experience below.
The same is true of inflation. As seen in Figure 2, between 1998 and 2008 the average rate of in-
crease of the consumer price index (HICP) has on average been below 2 per cent (but close to it) in
Sweden and Finland, while in the euro area on average the rate of inflation has been slightly above
2 per cent.
There is practically no difference between the two countries as far as the broad macroeconomic
performance indicators, such as growth and inflation, are concerned. Finland and Sweden have
outperformed the euro area average on both accounts, despite the different choices regarding the
EMU. This implies that membership in the EMU alone can hardly explain the performance or un-
derperformance of countries. As we will argue below, what matters is the quality of institutions
and the flexibility of the economy as well as the economic policies pursued.
6
Figure 1 Economic performance: GDP level, 1998=100
Sweden
Finland
Euro area
Growth, % p.a. Finland Sweden Euro area
1998-2008 3,2 2,9 2,0
1998-2013 1,9 2,4 1,2
Sources: Eurostat, European Commission (2013 Autumn Forecast)
Figure 2 Economic performance: Inflation, % p.a.
Sources: Eurostat, European Commission (2013 Autumn Forecast)
Average, % p.a. Finland Sweden Euro area
1998-2008 1,8 1,7 2,1
1998-2010 2,0 1,6 2,0
Sweden
Finland
Euro area
7
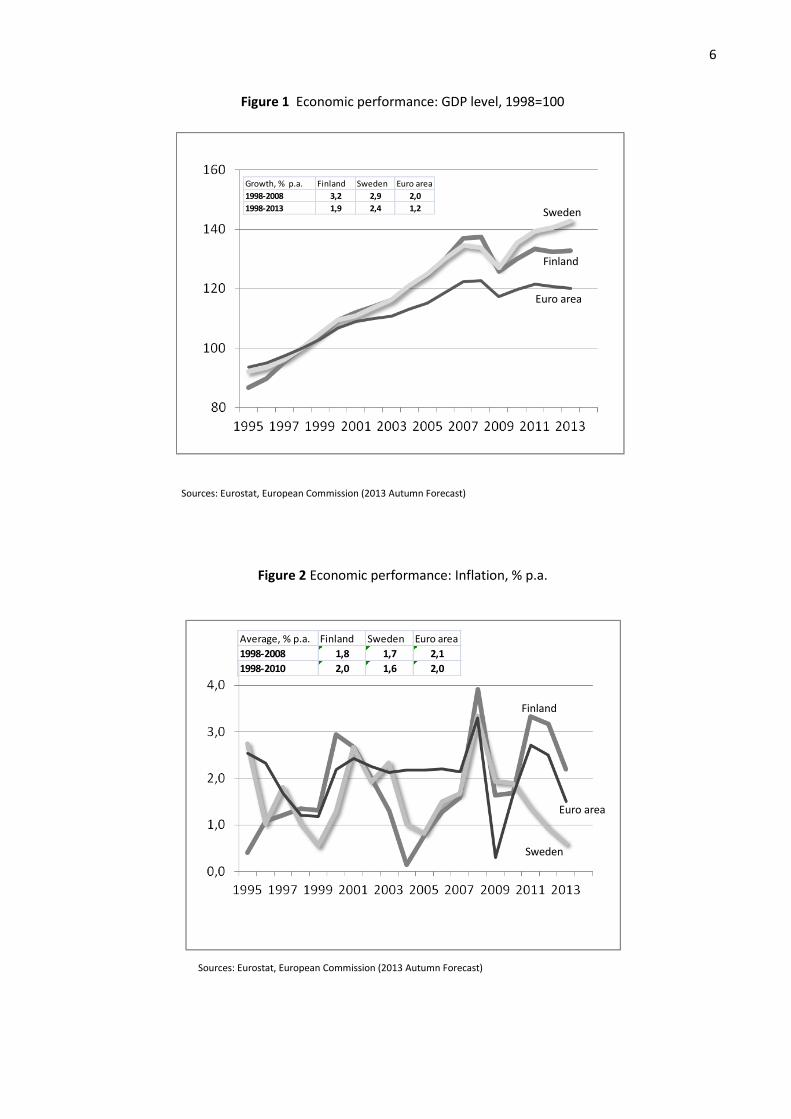
While the overall performance of the two countries has been broadly similar in terms of growth
and inflation, there are some differences regarding unemployment and current account develop-
ments. As depicted in Figure 3, unemployment was high in Finland in the mid 1990s. This was the
legacy of the banking crisis and the deep recession. Unemployment was on a path of steady de-
cline until recently, and it is now at the same level as in Sweden and below the euro area average
by a large margin.
Figure 3 Unemployment rate, % of labour force
Finland
Sweden
Euro area
Source: Eurostat, European Commission (2013 Autumn Forecast).
The current account, which in the past used to be persistently in the deficit, has shown sizable
surpluses since the mid-1990s (Figure 4). In Sweden this has continued to be the case until now
while Finland moved into a deficit in 2011. During the past ten years Finland has lost comparative
advantage in two major sectors, the paper industry and the ICT-industry. Sweden has been affect-
ed by the same developments, but because of its broader industrial base these industries are not
as dominant as they have been in Finland. Also, Finland has lost cost competitiveness in recent
years, not only in relation to Germany but also in relation to Sweden (Figure 5).

8
Figure 5 Unit labour cost (total economy), 2000=100
Finland
Euro area
Sweden
Germany
Source: Eurostat
Figure 4 Current account, % of GDP
Finland
Sweden
Euro area
Source: Eurostat, European Commission (2013 Autumn Forecast)

9
The recession experience
Finland and Sweden were badly hit by the global financial crisis in the fall of 2008. Both countries
witnessed a sharp decline in GDP (Figure 6). In relative terms the fall of output was more pro-
nounced in Finland than in Sweden. A noteworthy difference emerged in the recovery phase. The
Swedish recovery was sharp, and total output reached the pre-recession level already in 2011,
while Finland‘s GDP still lies below the previous peak. In fact, Finland has been in a recession since
early 2012, while in Sweden the slow-down started only recently.
Figure 6 The recession experience: GDP, 2005=100
Sweden
Finland
Euro area
Source: Eurostat, European Commission (2013 Autumn Forecast).
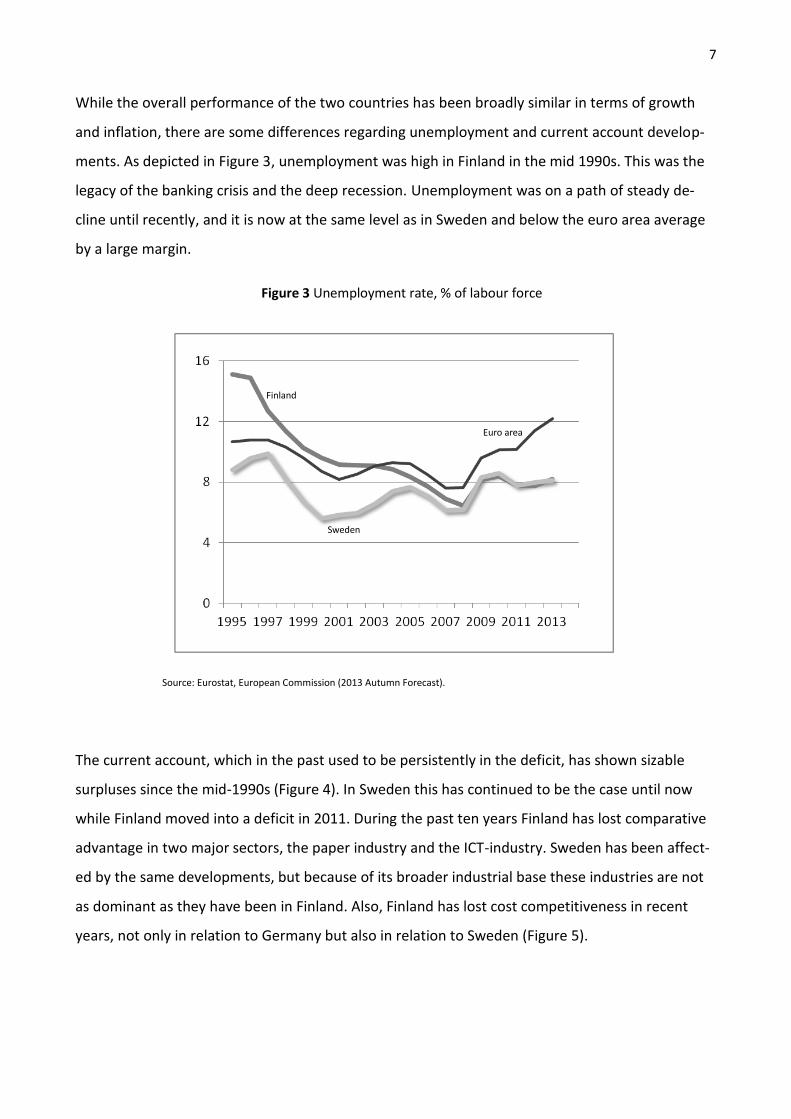
Both countries are highly dependent on international trade, and therefore they were hurt hard by
the sharp drop in world trade. As seen in Figure 7 the fall of Finnish exports was deeper than in
Sweden, partly because the preceding growth had been largely based on the exports of capital
goods. These exports collapsed due to the sudden stop of investment activity globally. However,
adjusted for the differences in the structure of exports (that of Sweden being more broadly-based)
the decline of export volumes was of the same order of magnitude in both countries. The sharp
depreciation of the Swedish currency may have supported profitability of the export industry, but
this weakness of the currency proved to be short-lived and hardly had time to affect the export
10
volumes significantly. The recovery of exports took place at the same time as the currency was
appreciating. In mid-2012 Sweden’s competitiveness started to deteriorate as a result of a sharp
appreciation of the currency.
Figure 7 The recession experience, GDP components, 2005-2013
Source. Eurostat
In both countries the effect of the global recession on private consumption was relatively mild and
temporary. In both countries private consumption exceeds the previous peak by a clear margin,
while in the euro area as a whole it has remained stagnant for more than five years. In Sweden the
recovery was broadly-based with consumption, investment and exports all contributing to the re-
covery. The recovery of exports took place at the same time as the currency was appreciating. The
decline in imports in 2009 was of the same magnitude in Finland and Sweden. In Sweden the im-
ports have recovered above the pre-crisis level, while in Finland imports have stagnated.
Finland’s relative underperformance vis á vis Sweden during the recovery phase can be accounted
for mainly by weak export growth and anemic investment. The weak export performance of Fin-
land reflects mainly the structural factors, such as the loss of comparative advantage in paper and
11
ICT industries, as well as the deteriorated competitiveness since 2007. We have no good explana-
tion to the recent weakness of investment except the excess capacity and weak demand.
The picture emerging from this descriptive analysis is does not contradict the one painted by Suni
and Vihriälä (2013). A novelty in their study is the use of an econometric multi-country model
(NIGEM) to simulate a counterfactual assuming that Sweden would have participated in the EMU
from the beginning. Under this assumption Riksbank would have pursued exactly the same mone-
tary policy as the ECB, and that the krona exchange rate would have been in a stable relation to
the euro. The simulation exercise does not point out any significant effects. The GDP is slightly
lower in 2009-2011 mainly due to lower domestic demand (higher interest rate) and stronger im-
ports. Interestingly, exports in the counterfactual deviate very little from the factual development,
despite a sharp depreciation in 2009 and sharp appreciation thereafter. The overall conclusion of
this study is the same as ours according to which the different choices with regard to the EMU
have not affected macroeconomic performance very much (at least not so far).
3. Macroeconomic policies
This section will compare the macroeconomic or fiscal and monetary policies pursued in Finland
and Sweden with each other as well as with the policies pursued in other EU15-countries. Obvi-
ously, Finland is not running a monetary policy of its own as monetary policy is decided upon by
the European Central Bank (ECB).
3.1 Monetary policy
Repeated speculative attacks against the currency forced the Bank of Finland to abandon the
pegged exchange rate regime in September 1992. The immediate effect of the decision to float
was an effective (trade-weighted) depreciation of the Finnish markka by about 15 per cent. This
came on top of the discrete devaluation by some 10 per cent in November 1991. Sweden followed
suit two months later; the Riksbank abandoned the peg in November 1992. The immediate effect
was a depreciation of the krona by about 10 per cent.5
5 The early experience of floating exchange rates and inflation targeting in Finland and Sweden is described in Pikkarainen et al.
(1997) and Berg and Gröttheim (1997) both published in BIS Policy Papers No. 2 - Monetary policy in the Nordic countries: Experi-ences since 1992.

12
The Finnish currency was in a free fall until February 1993, when the Bank of Finland announced
an inflation target of 2 per cent to be achieved by 1995. In Sweden the central bank had made a
similar move one month earlier. Thereafter the Finnish markka was on an appreciating trend until
1995. The Swedish krona continued to depreciate very gradually until 1995 when the trend
turned.
In both countries the inflation target of 2 per cent was achieved well before the 1995 deadline. In
Finland the rate of inflation was in fact below the target (close to zero) for many years in the mid-
1990s. In both countries low inflation quickly became widely accepted as a societal goal and well
anchored in expectations. Interest rates declined sharply in the course of 1993. In Finland this was
helped by the expectation of an appreciation of the currency as the central bank was restoring its
foreign exchange reserves.
Although the floating exchange rate regime with an inflation targeting proved to be a success, Fin-
land started to orientate itself towards EMU membership already in the mid-1990s. In October
1996 the Finnish markka was linked to the European exchange rate regime ERM. In early 1997
there was some speculation about a realignment (revaluation) of the markka before the final fixing
of the conversion rates expected to take place in May 1998. The Bank of Finland engaged in huge
interventions to prevent appreciation of the currency. As of the beginning of 1999 national mone-
tary policy was history in Finland.
The Swedish central bank has successfully continued to maintain inflation targeting with a numeri-
cal target of 2 per cent and a ±1 per cent tolerance interval. The implementation of the inflation
targeting strategy has been fine-tuned over the years. Based on the ideas of Svensson (1997), the
Riksbank has adopted a version of inflation forecast targeting, where the central bank forecasts
the future interest rate path consistent with the achievement of the inflation target. Since 2007,
the Riksbank has published its interest rate path (with uncertainty bands) together with its infla-
tion forecast.6
The ECB’s primary objective is price stability. The Governing Council has given an operational defi-
nition for price stability. According to this definition the rate of increase of the harmonised index
of consumer prices (HICP) in the euro area should stay below two per cent but close to it in the
6 This kind of approach was first adopted by the central bank of Norway. By its proponents it is called “the best prac-
tice monetary policy” (Svensson 2006).

13
medium term. This is an asymmetric inflation target compared to the Riksbank’s two per cent tar-
get with a ±1 per cent tolerance interval.
While the Riksbank publishes the interest rate path consistent with the inflation forecast, the ECB
has so far been much more restrictive regarding the details of its inflation outlook, not to speak
about the likely interest rate path in the future. Quantitatively the difference between the price
stability objective of the ECB and the Riksbank is not large. It follows that if the cyclical develop-
ment in Sweden are closely correlated with that in the euro area the interest rate policies are like-
ly to exhibit a rather synchronous pattern.
This is what we see in the data (Figure 7). The interest rate cycle in Sweden has been broadly simi-
lar to that in the euro area. In 2000 the ECB’s monetary policy was slightly more aggressive than in
Sweden, which is consistent with the inflation outlook at the time. The ECB started the easing cy-
cle in 2001 with the Riksbank following one year later. More recently Riksbank’s monetary policy
has been slightly more aggressive. During the tightening cycle in 2006 to 2008, the Riksbank fol-
lowed the ECB with a lag of one to two months. Both central banks quickly reversed the stance
once the global financial crisis erupted in October 2008. The Riksbank went all the way close to the
zero lower bound, while ECB stopped at the one per cent level. In practice the shortest money
market rates in the euro area were equally low as in Sweden due to the unconventional monetary
policy of the ECB (longer maturities and fixed rate full allocation provision of liquidity). The recent
relative tightening in Sweden is consistent with differences in the cyclical situation. Sweden is re-
covering from the recession while the euro area is suffering from recessionary tendencies fed by
the sovereign debt crisis.
Figure 8 Central bank policy rates

14
Riksbank
ECB
Source: Bloomberg
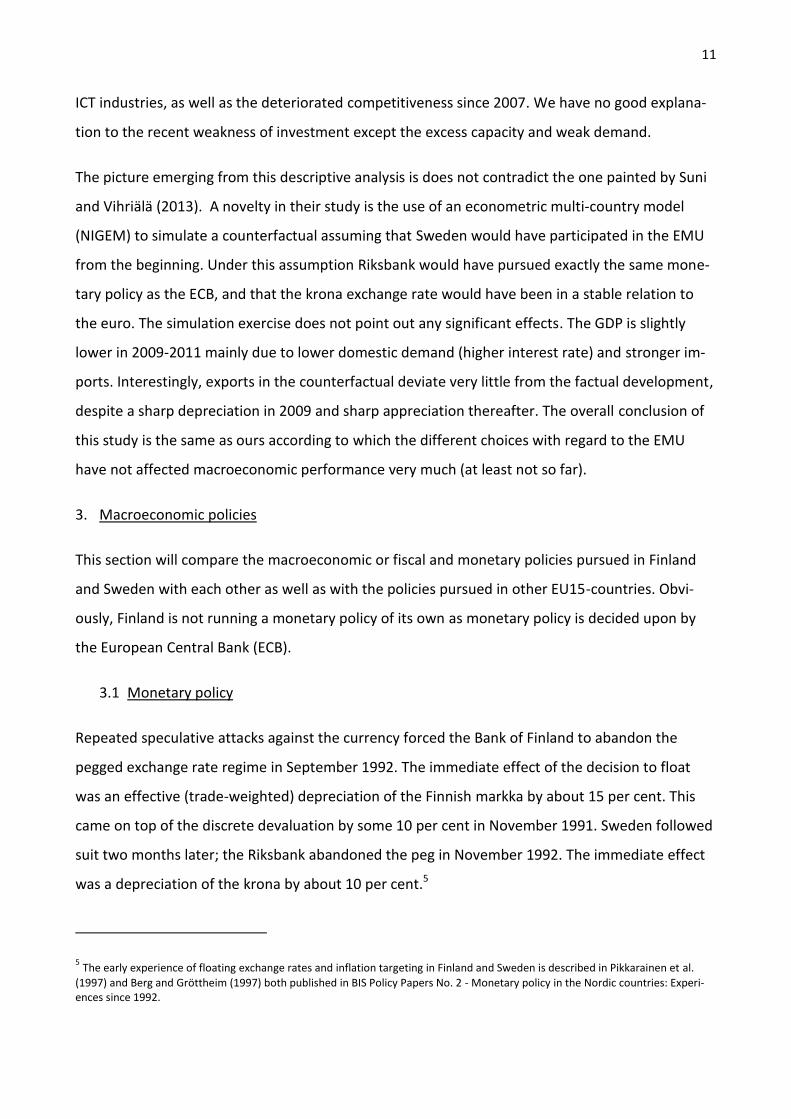
Despite the fact that the euro and the krona are both floating currencies, the exchange rate be-
tween them has remained fairly stable since the introduction of the euro in 1999 (Figure 8). Be-
tween 2001 and early 2008 the EUR traded in the SEK 9 to 9.50 range. At the same time both cur-
rencies appreciated trend-wise vis á vis the USD.
There are, however, three interesting episodes in the EUR/SEK exchange rate path since 1999. The
first is in 1999 and 2000 when the krona appreciated rather strongly against the euro. This reflects
the unexpected weakness of the euro in the beginning of its life as a currency. At the same time
growth of the Swedish economy was buoyant due to the global boom in the ICT sector. If Finland
had maintained its own currency it is likely that the markka would have appreciated strongly in
1999-2000, that is in the period when foreigners started to buy the stocks of the Finnish compa-
nies, especially Nokia.
The second interesting period is late 2008 when the krona depreciated sharply against the euro.
This hurt some Finnish industries (e.g. paper and wood industry) for a while. Depreciation did not
prevent the Swedish exports from falling significantly; in fact the collapse of exports was of the
same magnitude as in Finland if one takes differences in the export structure into account. More
recently the krona appreciated strongly, reflecting in part the fact that Sweden was perceived as
one of the few safe havens in Europe.
15
Figure 9 SEK exchange rates
EUR
USD
Source: Riksbank
The Lehman Brothers episode in September 2008 marked an abrupt stop to the normal function-
ing of the global financial markets. The effects were felt everywhere, including in the Nordic coun-
tries. The main effect in Europe was that the banks faced increasing difficulties to refinance their
assets in the market.
16
In order to ensure the liquidity of the banking system the central banks had to intervene. The ECB
started to offer longer-term refinancing for banks (against collateral) on the fixed rate full alloca-
tion basis. This led to a sharp expansion of the Eurosystem balance sheet in October 2008. Later
the Eurosystem introduced the covered bond purchasing programme and the securities market
purchasing programme in order to improve the transmission of monetary policy. In the end of
2011 and the beginning of 2012 the Eurosystem balance sheet expanded further as a result of two
three-year operations. As a result the Eurosystem balance sheet expanded first by 5 per cent in
relation to GDP and later by a further 15 per cent in the autumn of 2011.
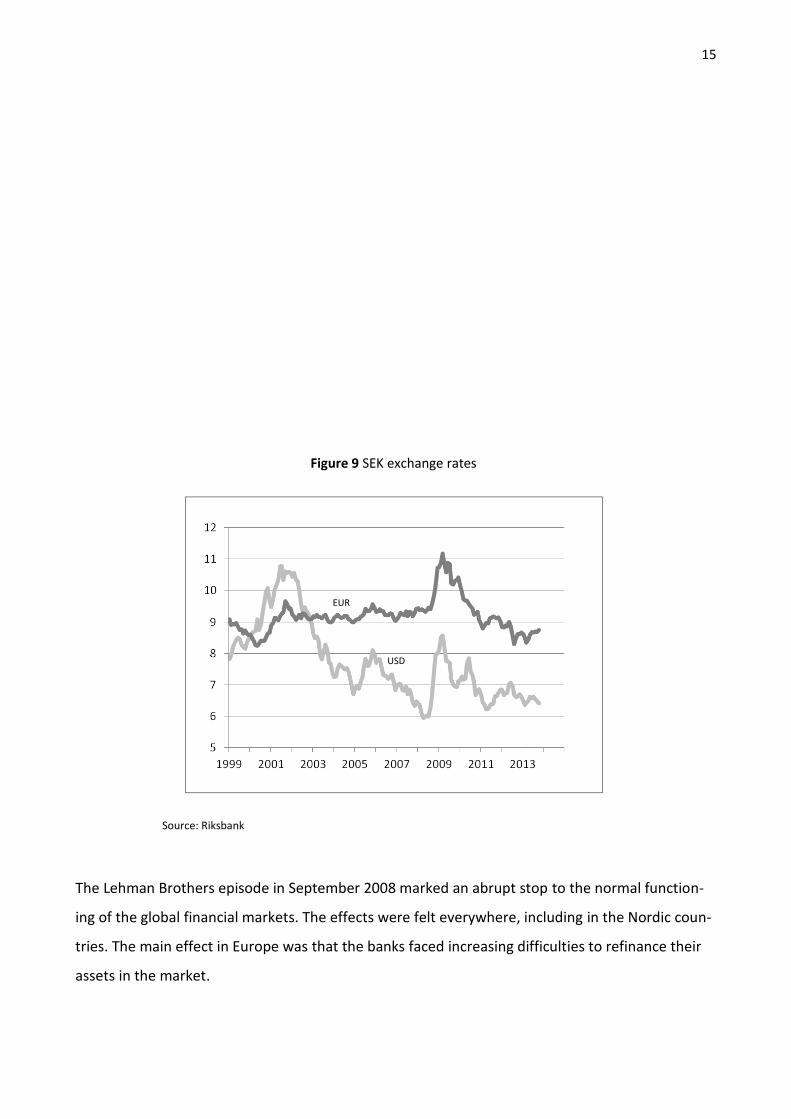
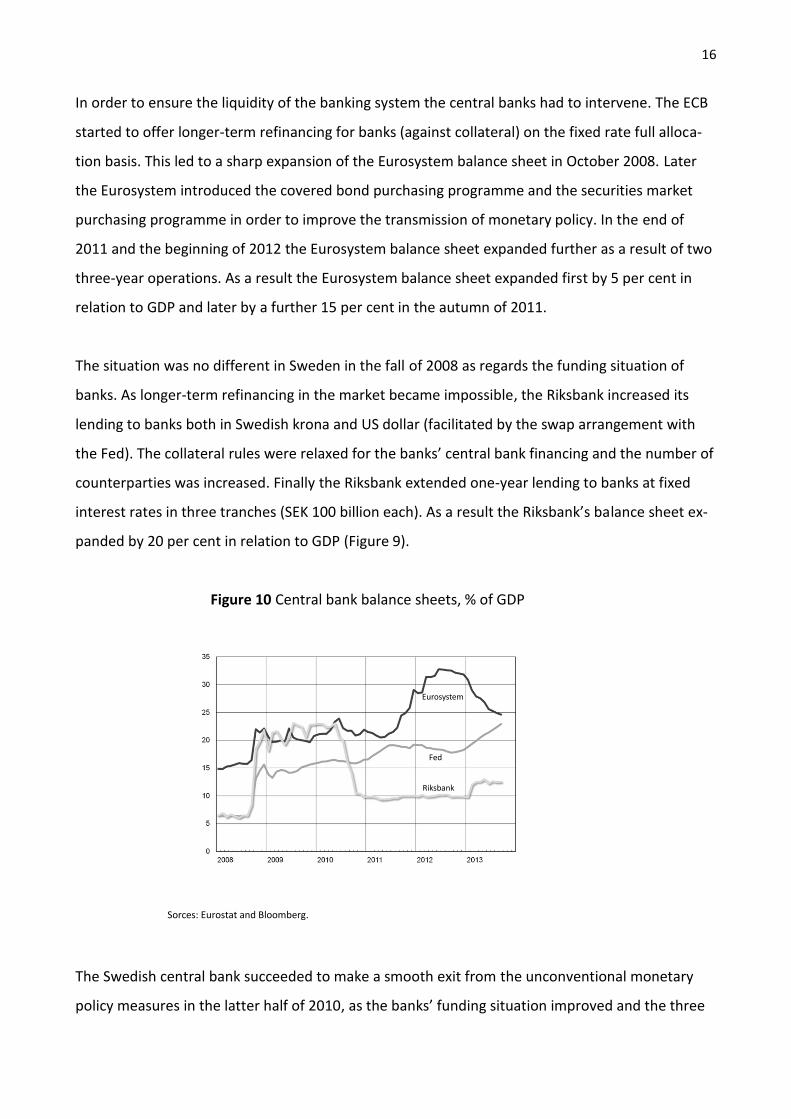
The situation was no different in Sweden in the fall of 2008 as regards the funding situation of
banks. As longer-term refinancing in the market became impossible, the Riksbank increased its
lending to banks both in Swedish krona and US dollar (facilitated by the swap arrangement with
the Fed). The collateral rules were relaxed for the banks’ central bank financing and the number of
counterparties was increased. Finally the Riksbank extended one-year lending to banks at fixed
interest rates in three tranches (SEK 100 billion each). As a result the Riksbank’s balance sheet ex-
panded by 20 per cent in relation to GDP (Figure 9).
Figure 10 Central bank balance sheets, % of GDP
Eurosystem
Riksbank
Fed
Sorces: Eurostat and Bloomberg.
The Swedish central bank succeeded to make a smooth exit from the unconventional monetary
policy measures in the latter half of 2010, as the banks’ funding situation improved and the three
17
one-year operations expired. This is not the case in the euro area, where the interbank market
does not function properly across borders and a large number of banks have continued to face
funding difficulties. The situation started to improve in the letter half of 2012. Between mid-2012
and the fall 2013 the size of the Eurosystem balance sheet diminished by 8 % of GDP reflecting the
diminution of the banks’ excess reserves which rose to record levels as result of the two alloca-
tions of the 36 month LTRO in December 2011 and February 2012.
The Bank of Finland’s balance sheet expanded markedly in late 2011 and early 2012. The reason,
however, was not the funding difficulties of the banks operating in Finland (many of which are
Nordic-owned). In fact, the banks were holding huge amounts of excess liquidity in the form of
overnight and term-deposits with the Bank of Finland. The main counterpart of these deposits on
the asset side of the balance sheet is the Target2-balances which are claims of the Bank of Finland
on the ECB.7 Most of these excess reserves disappeared in the course of 2013.
3.2 Fiscal policy
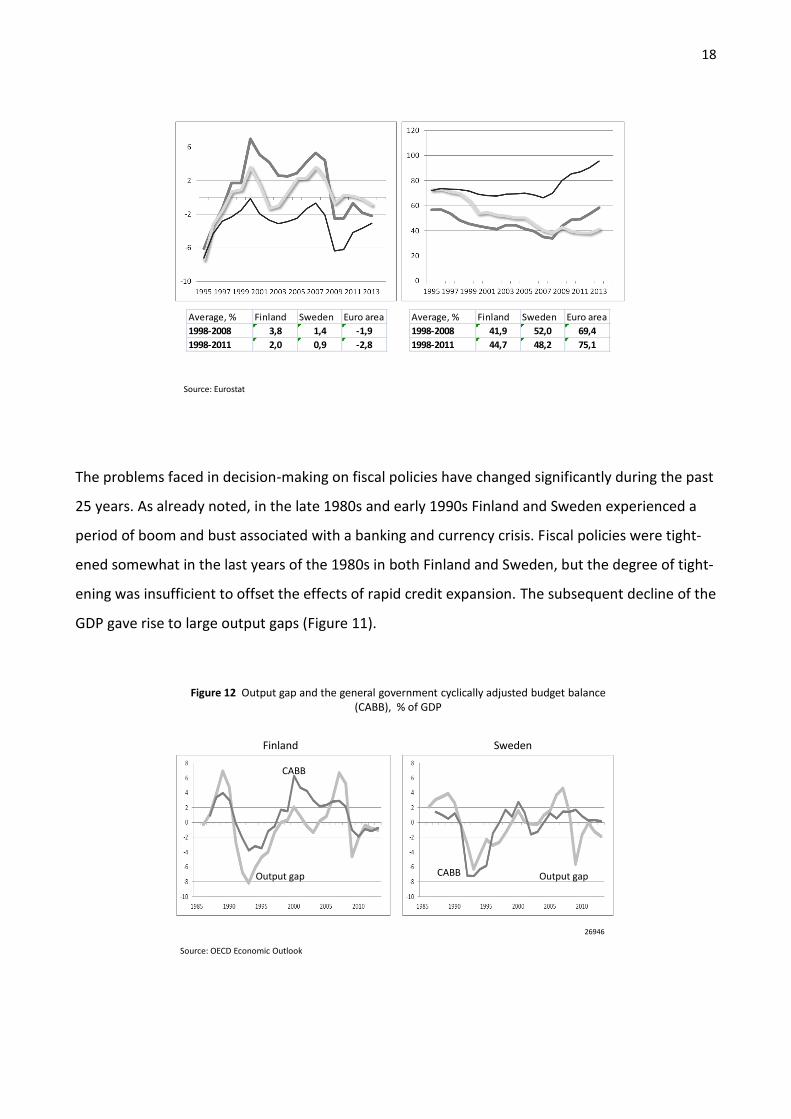
Since late 1990s until the recession in 2009 both countries were running sizable surpluses (Figure
11). As a result the public debt ratio was on a declining trend. In Finland the fiscal balance turned
into the deficit during the recession, while in Sweden it has remained more or less in balance and
the debt ratio has continued to fall.
Figure 11 Public deficit and debt, % of GDP
7 Target 2 is the payments systems of the eurosystem. On October 2012 The Bank of Finland had in this system a receivable of EUR
61 billion, which is formally a claim of the Bank of Finland on the ECB. On the liability side were the banks’ balances on their current accounts (EUR 31 billion, incl. minimum reserves), banks’ overnight deposits (EUR 16 billion) and term-deposits (EUR 18 billion). One year later, on October 2013, the Bank of Finland’s claim on the ECB in the form of Target 2 balances had dimin-ished to EUR 16 billion.
18
Average, % Finland Sweden Euro area
1998-2008 3,8 1,4 -1,9
1998-2011 2,0 0,9 -2,8
Average, % Finland Sweden Euro area
1998-2008 41,9 52,0 69,4
1998-2011 44,7 48,2 75,1
Source: Eurostat
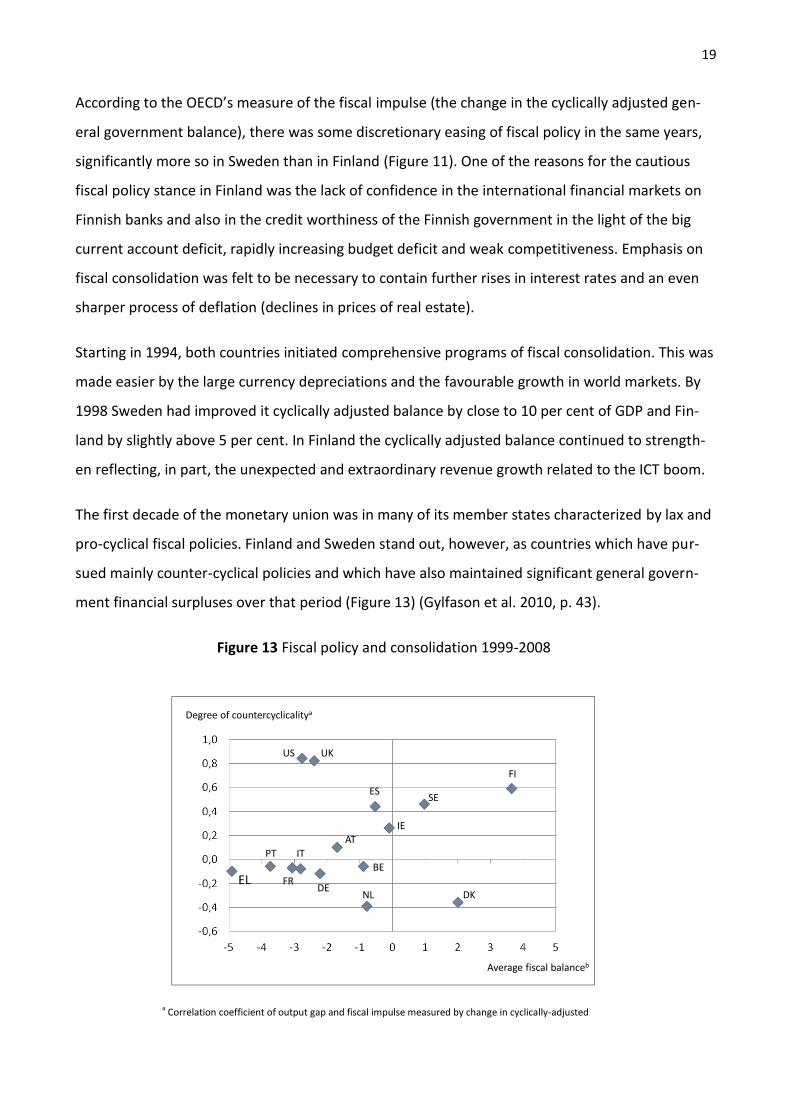
The problems faced in decision-making on fiscal policies have changed significantly during the past
25 years. As already noted, in the late 1980s and early 1990s Finland and Sweden experienced a
period of boom and bust associated with a banking and currency crisis. Fiscal policies were tight-
ened somewhat in the last years of the 1980s in both Finland and Sweden, but the degree of tight-
ening was insufficient to offset the effects of rapid credit expansion. The subsequent decline of the
GDP gave rise to large output gaps (Figure 11).
Figure 12 Output gap and the general government cyclically adjusted budget balance (CABB), % of GDP
Source: OECD Economic Outlook
26946
Finland Sweden
Output gap Output gap
CABB
CABB
19
According to the OECD’s measure of the fiscal impulse (the change in the cyclically adjusted gen-
eral government balance), there was some discretionary easing of fiscal policy in the same years,
significantly more so in Sweden than in Finland (Figure 11). One of the reasons for the cautious
fiscal policy stance in Finland was the lack of confidence in the international financial markets on
Finnish banks and also in the credit worthiness of the Finnish government in the light of the big
current account deficit, rapidly increasing budget deficit and weak competitiveness. Emphasis on
fiscal consolidation was felt to be necessary to contain further rises in interest rates and an even
sharper process of deflation (declines in prices of real estate).
Starting in 1994, both countries initiated comprehensive programs of fiscal consolidation. This was
made easier by the large currency depreciations and the favourable growth in world markets. By
1998 Sweden had improved it cyclically adjusted balance by close to 10 per cent of GDP and Fin-
land by slightly above 5 per cent. In Finland the cyclically adjusted balance continued to strength-
en reflecting, in part, the unexpected and extraordinary revenue growth related to the ICT boom.
The first decade of the monetary union was in many of its member states characterized by lax and
pro-cyclical fiscal policies. Finland and Sweden stand out, however, as countries which have pur-
sued mainly counter-cyclical policies and which have also maintained significant general govern-
ment financial surpluses over that period (Figure 13) (Gylfason et al. 2010, p. 43).
Figure 13 Fiscal policy and consolidation 1999-2008
FI
NL
US UK
ES
IE
DK
SE
IT
FR
PT
AT
DE
BE
Average fiscal balanceb
Degree of countercyclicalitya
a Correlation coefficient of output gap and fiscal impulse measured by change in cyclically-adjusted
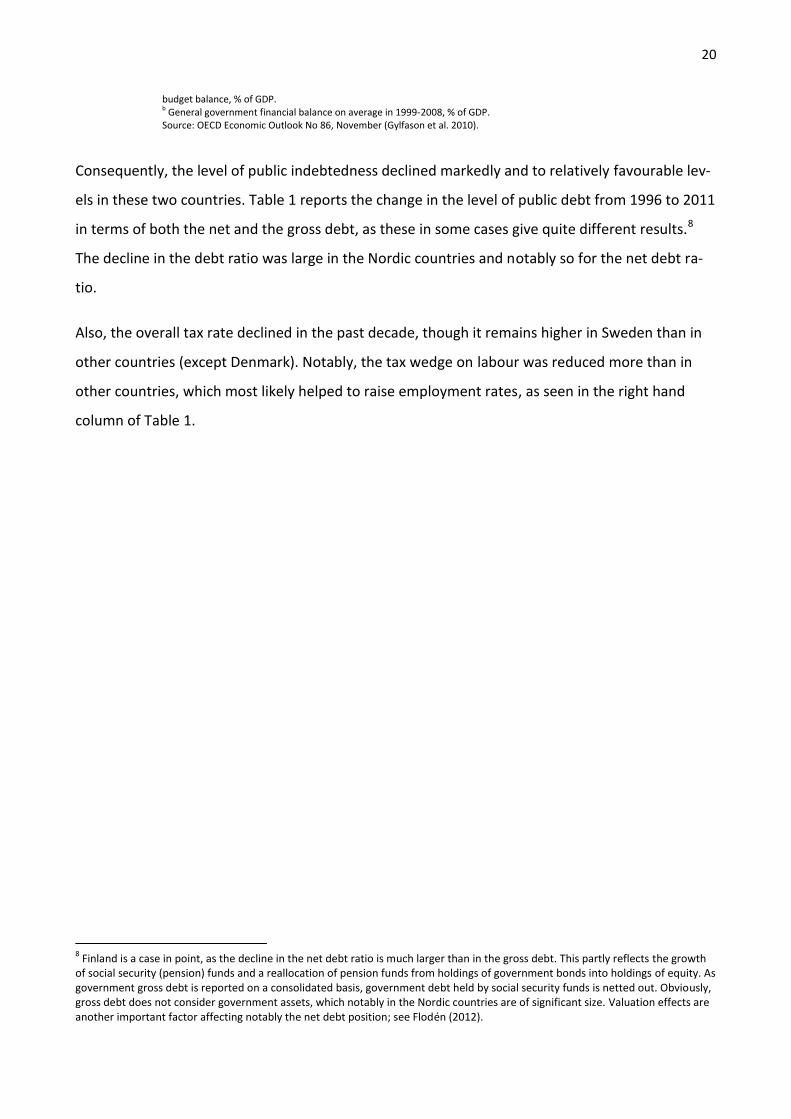
20
budget balance, % of GDP. b General government financial balance on average in 1999-2008, % of GDP. Source: OECD Economic Outlook No 86, November (Gylfason et al. 2010).
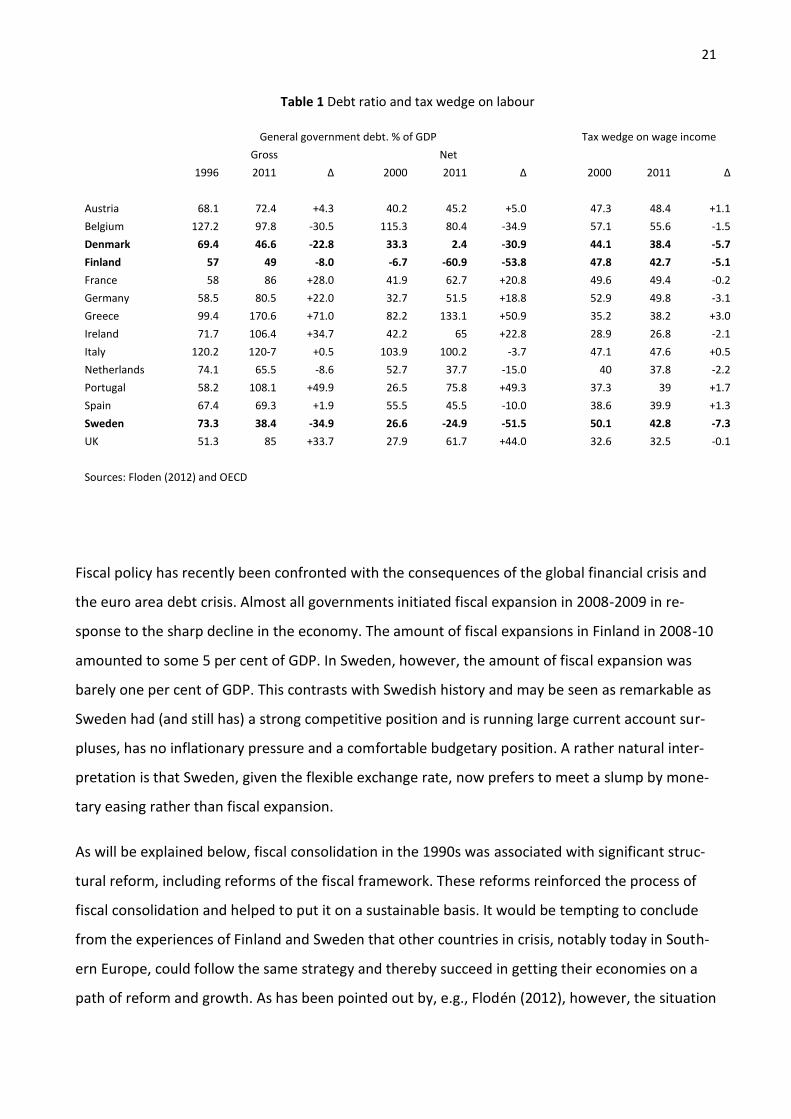
Consequently, the level of public indebtedness declined markedly and to relatively favourable lev-
els in these two countries. Table 1 reports the change in the level of public debt from 1996 to 2011
in terms of both the net and the gross debt, as these in some cases give quite different results.8
The decline in the debt ratio was large in the Nordic countries and notably so for the net debt ra-
tio.
Also, the overall tax rate declined in the past decade, though it remains higher in Sweden than in
other countries (except Denmark). Notably, the tax wedge on labour was reduced more than in
other countries, which most likely helped to raise employment rates, as seen in the right hand
column of Table 1.
8 Finland is a case in point, as the decline in the net debt ratio is much larger than in the gross debt. This partly reflects the growth
of social security (pension) funds and a reallocation of pension funds from holdings of government bonds into holdings of equity. As government gross debt is reported on a consolidated basis, government debt held by social security funds is netted out. Obviously, gross debt does not consider government assets, which notably in the Nordic countries are of significant size. Valuation effects are another important factor affecting notably the net debt position; see Flodén (2012).
21
Fiscal policy has recently been confronted with the consequences of the global financial crisis and
the euro area debt crisis. Almost all governments initiated fiscal expansion in 2008-2009 in re-
sponse to the sharp decline in the economy. The amount of fiscal expansions in Finland in 2008-10
amounted to some 5 per cent of GDP. In Sweden, however, the amount of fiscal expansion was
barely one per cent of GDP. This contrasts with Swedish history and may be seen as remarkable as
Sweden had (and still has) a strong competitive position and is running large current account sur-
pluses, has no inflationary pressure and a comfortable budgetary position. A rather natural inter-
pretation is that Sweden, given the flexible exchange rate, now prefers to meet a slump by mone-
tary easing rather than fiscal expansion.
As will be explained below, fiscal consolidation in the 1990s was associated with significant struc-
tural reform, including reforms of the fiscal framework. These reforms reinforced the process of
fiscal consolidation and helped to put it on a sustainable basis. It would be tempting to conclude
from the experiences of Finland and Sweden that other countries in crisis, notably today in South-
ern Europe, could follow the same strategy and thereby succeed in getting their economies on a
path of reform and growth. As has been pointed out by, e.g., Flodén (2012), however, the situation
Table 1 Debt ratio and tax wedge on labour
General government debt. % of GDP Tax wedge on wage income
Gross Net
1996 2011 Δ 2000 2011 Δ 2000 2011 Δ
Austria 68.1 72.4 +4.3 40.2 45.2 +5.0 47.3 48.4 +1.1
Belgium 127.2 97.8 -30.5 115.3 80.4 -34.9 57.1 55.6 -1.5
Denmark 69.4 46.6 -22.8 33.3 2.4 -30.9 44.1 38.4 -5.7
Finland 57 49 -8.0 -6.7 -60.9 -53.8 47.8 42.7 -5.1
France 58 86 +28.0 41.9 62.7 +20.8 49.6 49.4 -0.2
Germany 58.5 80.5 +22.0 32.7 51.5 +18.8 52.9 49.8 -3.1
Greece 99.4 170.6 +71.0 82.2 133.1 +50.9 35.2 38.2 +3.0
Ireland 71.7 106.4 +34.7 42.2 65 +22.8 28.9 26.8 -2.1
Italy 120.2 120-7 +0.5 103.9 100.2 -3.7 47.1 47.6 +0.5
Netherlands 74.1 65.5 -8.6 52.7 37.7 -15.0 40 37.8 -2.2
Portugal 58.2 108.1 +49.9 26.5 75.8 +49.3 37.3 39 +1.7
Spain 67.4 69.3 +1.9 55.5 45.5 -10.0 38.6 39.9 +1.3
Sweden 73.3 38.4 -34.9 26.6 -24.9 -51.5 50.1 42.8 -7.3
UK 51.3 85 +33.7 27.9 61.7 +44.0 32.6 32.5 -0.1
Sources: Floden (2012) and OECD
22
is far from comparable and the current problems of Southern Europe look much more severe. Not
only is the current level of public debt much higher in the crisis countries today than was the case
in Finland and Sweden in the 1990s, but also the demographic challenge is now much more de-
manding. Furthermore, the international environment is unhelpful in that external demand
growth is weak. And above all, the crisis countries cannot depreciate and thereby engineer a pro-
cess of export led growth as was done by Finland and Sweden in the late 1990s.
4. Institutions and structural policies
As set out by Esping-Andersen (1990), the Nordic model (or the social democratic model) differs in
certain respects from the other members of the family of European socio-economic models. In our
view the Nordic model is characterized by three broad features (Andersen et al. 2007 and Gylfason
et al. 2010). One of these is a set of labor market institutions that include a high unionization rate,
a strong role for labor market organizations and negotiations, significant elements of wage coordi-
nation, relatively generous unemployment benefits and a prominent role for active labor market
policies. A second feature is the high level of public and/or private spending on investment in hu-
man capital, including child care and education as well as R&D. Third, the Nordics maintain a com-
prehensive and inclusive welfare state, based (largely) on universalist principles, with emphasis on
transfers to households and publicly provided social services financed by high taxes. While classifi-
cations are always open to objections (as all countries are unique), it is a fact that the Nordics in
international comparisons tend to form a cluster of their own, though also some other small and
open countries (notably the Netherlands) share many of their characteristics.
As noted above, Finland and Sweden both experienced a banking crisis and a depression in the
early 1990s. The crisis management in the early 1990s has been the focus of much attention, no-
tably so for the handling of the banking crisis. Both countries undertook a number of important
measures to safeguard the functioning of their banking systems, and this was surely instrumental
in facilitating the subsequent recovery (see, e.g. Honkapohja 2009 and Gylfason et al. 2010). By
contrast, one of the most regrettable aspects of the handling of the current euro area debt crisis is
that action with regard to the banking system has in many countries been lacking or insufficient.
(This is also a striking difference when comparing crisis management in the US and the EU.)

23
One key factor in the recovery process was undoubtedly the large depreciation of the currencies
which followed upon the abolition of the pegged exchange rate regime. As noted above, the large
improvement in competitiveness, in combination with growth in international markets, was in-
strumental in creating a strong process of export-led growth in the latter part of the 1990s.
A long-lasting consequence of the crisis was that it paved the way for a number of structural re-
forms. Most of these were undertaken more or less in parallel and they were often rather similar,
partly because they were stimulated by international developments (such a she US tax reform in
the 1980s) or because authorities in Finland were encouraged by initiatives in Sweden. The most
important structural reforms probably were those concerning the tax system and the pension sys-
tem as well as the frameworks of monetary and fiscal policies. Many of these reforms were pro-
posed and discussed in the report of the so called Lindbeck Commission (Lindbeck et al. 1994).
Both countries undertook tax reforms with the aim of broadening the tax bases and reducing mar-
ginal rates. Most importantly, the dual tax system was introduced, meaning that capital income
was taxed at a proportional tax rate (of 30 per cent in Sweden and 25 per cent initially in Finland).
Finland also introduced the avoir fiscal system such that the double taxation of corporate income
was eliminated. (Subsequently the avoir fiscal system has been abolished but the dual tax system
retained.) This constituted a big change as compared to the earlier system with generous depreci-
ation allowances and double taxation of dividends in combination with no tax on capital gains on
holdings exceeding 10 years. The new tax system made it possible to reallocate resources arising
out of profits across companies and sectors, thus facilitating a process of “creative destruction”
and the transformation towards an economy relying on high tech exports.
Work was started on reforms of the compulsory pension system. In Sweden this led to a changeo-
ver from a defined benefit to a defined contribution system that was adopted in 1999. This pen-
sion reform is a benchmark case and has attracted a lot of international interest; cf. Holzman and
Palmer (2003). It is believed to have put the Swedish pension system on a sustainable footing,
avoiding the need for increases in the contribution rate in coming decades in spite of aging popu-
lations. The reform of the Finnish pension system was less radical and was implemented as late as
in 2005, but notably the introduction of a life expectancy parameter cutting monthly pensions as
life expectancy increases (an idea borrowed from the Swedish reform) will help to reduce pressure
on contribution rates.
24
The fiscal framework was modernized in both countries, notably by introducing multiannual ex-
penditure ceilings. Sweden also introduced a surplus target for public finances and balanced-
budget requirements for municipalities. Most importantly, a tradition has emerged in which the
prime minister and the minister of finance generally cooperate to ensure that the budget ceiling is
respected. This practice has been strongly established in both countries.
More recently Sweden introduced a fiscal policy council in 2007. In accordance with the require-
ments of the so called Fiscal Compact Finland is currently in the process of establishing such a
council, although its role and position seems not to become as prominent as in Sweden. It is an
open issue whether the fiscal council is essential for enhancing budget discipline. However, the
fiscal policy council should be helpful in improving transparency of policies and the quality of pub-
lic debate.
Both countries reformed the monetary framework by setting up independent central banks with
inflation targets and operating in a regime of floating exchange rates. This may partly be seen as a
consequence of the decision to join the EU (in 1995) but it also reflects the traumatic experiences
of the preceding pegged exchange rate regime.
Other actions undertaken aimed at improving competition on markets for goods and services and
to improve the functioning of labor markets. Sweden also prolonged election periods of the par-
liament from three to four years. A specific feature of Finnish policies was the rather strong in-
crease in government spending on R&D in the midst of the crisis and in spite of cuts in most gov-
ernment spending and rises in tax rates. This contributed to a rapid structural change as a result of
which the export structure became more broadly based reducing the country’s dependence on the
forest-based industries.
In all, these structural reforms helped to transform the economy in a liberal or market-friendly
direction, something which was not a trade mark of these countries in earlier decades. It should be
stressed that the process began already with the financial deregulation in the 1980s and was then
followed by the reforms initiated during the depression in the 1990s. While the pace may have
slowed, the Nordics have now established themselves as countries that combine a comprehensive
welfare state with a low level of regulation of markets. The latter point is illustrated in Figure 14,
which shows the degree of regulation in the “old” EU member states (except for Luxemburg),
which constitute a reasonable reference when making cross-country comparisons.

25
The first indicator is the OECD indicator of product market regulation (PMR) and the second is the
OECD indicator on employment protection legislation (EPL). As is seen, the regulatory policies of
the Nordic member states of the EU are in general more liberal than in other countries except for
the UK and Ireland.
Figure 14 Market regulation (2008)
Product market regulation
Employment protection legislation
UK IE
DK
NL
SE FI
ITAT
DE
BE
ES
EL
FR PT
Source: OECD
The general impression is that the Nordics are running structural policies geared towards allowing
markets to function effectively. The continental countries and notably the countries in Southern
Europe impose more heavy regulation, although this has started to change as a consequence of
the crisis experience in the most recent years.
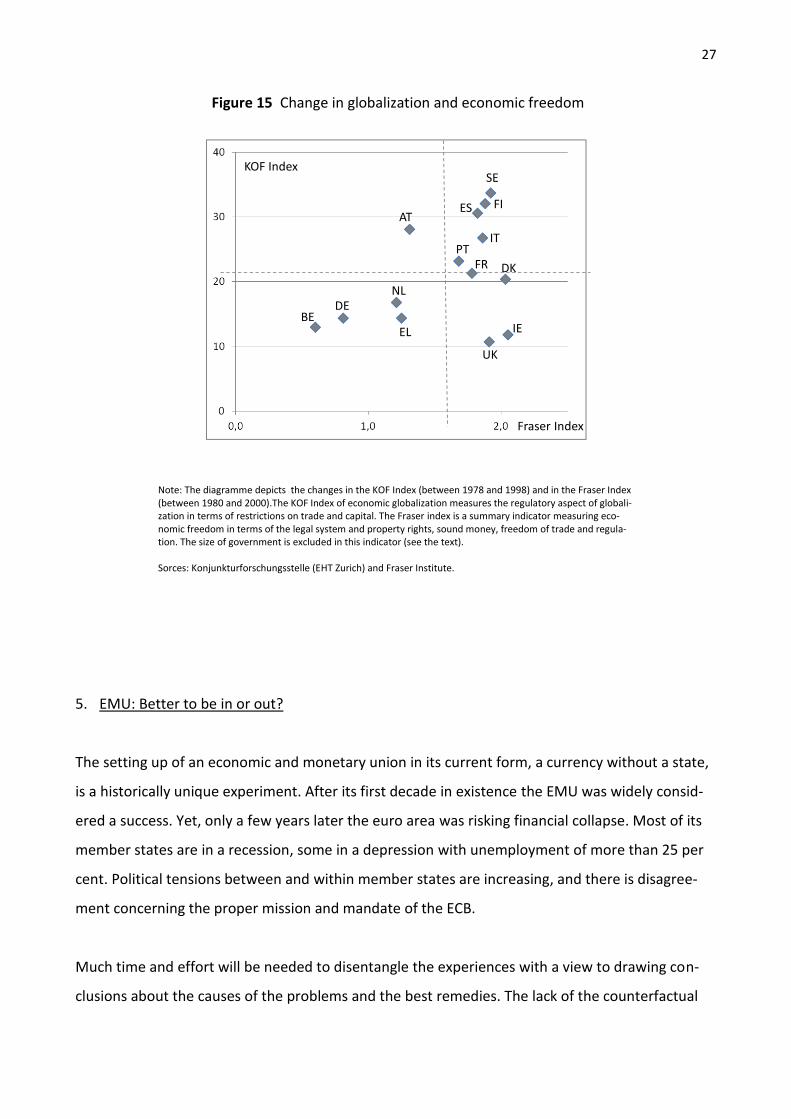
The Fraser index of economic freedom and the KOF-index of globalization have been widely used
in economic research (Bergh and Henrekson2012). In particular, an increase in one or both of
these factors should be conducive to a favorable growth performance (Dreher 2006). In figure 15
we show the change in economic freedom from the year 1980 to 2000 and in globalization from
1978 to 1998 (a slightly different time period because of data availability). We choose this time
period because financial liberalization in Finland and notably in Sweden started already in the ear-

26
ly 1980s, and as the structural reforms triggered by the depression in the early 1990s were by and
large implemented by the end of the decade.
The KOF-index used here measures the regulatory aspect of globalization in terms of restrictions
on trade and capital. The Fraser index is a summary index measuring economic freedom in terms
of the size of government, the legal system and property rights, sound money, freedom of trade
and regulation. Following Bergh (2006), we exclude the first component in our index of economic
freedom. After all, the impact on growth of the size of the public sector will depend crucially on
how revenues are spent. For instance, during the depression Finland increased spending on R&D
while making cuts to social spending. In addition, a significant proportion of public spending in the
Nordic countries is spent in a manner which directly raises the labour supply (e.g. day care of chil-
dren).9
As can be seen, Sweden was for two decades the country experiencing the fastest rate of globali-
zation and Finland was number two. Economic freedom increased most in Ireland and Denmark,
but Sweden was number three and Finland number five (with the UK in between as number four).
Taken together, it might be argued that Sweden and Finland had a particularly impressive combi-
nation of deepening globalization and increasing economic freedom.10 While we make no attempt
at explaining relative growth performance, we think it is likely that these developments contribut-
ed to the generally favorable economic performance that Finland and Sweden experienced in the
period up to 2008 (when financial turmoil erupted).
9 The relative performance of Finland would be slightly weaker without this adjustment. Also, the performance of
Sweden and notably of Finland is less impressive if comparisons are made using more recent observations. This is compatible with the hypothesis that the depression of the 1990s was of particular importance for structural policies and developments.
10 This statement is consistent with a similar chart by Bergh and Henreksson (2012, p. 120), though they cover a
somewhat different set of countries and a longer time period.
27
Figure 15 Change in globalization and economic freedom
BEDE
EL
NL
AT
PT
ES FI
SE
IT
UK
IE
DKFR
KOF Index
Fraser Index
Note: The diagramme depicts the changes in the KOF Index (between 1978 and 1998) and in the Fraser Index (between 1980 and 2000).The KOF Index of economic globalization measures the regulatory aspect of globali-zation in terms of restrictions on trade and capital. The Fraser index is a summary indicator measuring eco-nomic freedom in terms of the legal system and property rights, sound money, freedom of trade and regula-tion. The size of government is excluded in this indicator (see the text). Sorces: Konjunkturforschungsstelle (EHT Zurich) and Fraser Institute.
5. EMU: Better to be in or out?
The setting up of an economic and monetary union in its current form, a currency without a state,
is a historically unique experiment. After its first decade in existence the EMU was widely consid-
ered a success. Yet, only a few years later the euro area was risking financial collapse. Most of its
member states are in a recession, some in a depression with unemployment of more than 25 per
cent. Political tensions between and within member states are increasing, and there is disagree-
ment concerning the proper mission and mandate of the ECB.
Much time and effort will be needed to disentangle the experiences with a view to drawing con-
clusions about the causes of the problems and the best remedies. The lack of the counterfactual

28
makes it very hard to assess these issues and to evaluate the degree of success or failure of the
whole project.
Finland and Sweden joined the EU too late to be in a position to influence the Maastrich treaty or
the main architecture of the EMU. Given that it was being set up, they nevertheless had to decide
on their own attitude to the EMU. The governments of both countries set up expert committees to
evaluate the likely consequences of going in or staying out of the EMU. The Swedish Calmfors
commission acknowledged the efficiency advantages of a common currency but argued that the
risk of mistakes in wage setting and/or in fiscal policy in Sweden spoke against joining at the time
(Calmfors et al. 1997). (With the benefit of hindsight one might argue that the commission may
have come to the right conclusion but not for the right reasons.) The Finnish Pekkarinen commis-
sion did not directly take a stand on whether Finland should join but rather discussed measures to
improve fiscal consolidation and resilience of the economy in the face of shocks (Prime Minister’s
Office 1997).
The experience of Finland and Sweden of the pegged exchange rate regime were a source of frus-
tration. In retrospect it seems almost inevitable that the regime had to be abandoned. As is well
known from the “impossible trinity”, a fixed exchange rate is incompatible with free capital
movements and the ambition to run an autonomous monetary policy. Interestingly, Finland and
Sweden would seem to have drawn different conclusions from this: Finland gave up its monetary
policy, while Sweden abandoned the fixed exchange rate.
However, economic considerations or the views of these expert committees were not decisive
regarding the membership in the EMU. Both countries made their decisions primarily on the basis
of political factors. Finland joined the EU in order to clarify it geopolitical identity, having lived for
many decades in the problematic shadow of the Soviet Union. Given the possibility, the Finnish
political and economic establishment wanted to join not only the EU but also its “hard core”, the
EMU. In Sweden there were no similar considerations to support membership in the EMU, and
after a referendum with a negative outcome the Swedish government decided to stay outside for
the time being. It is our contention that the decisions on EMU-membership were not due to dif-
ferences in economic structure; they rather reflect differences in political appreciations of EMU.

29
Which country made the better choice? As seen in section 2 above, economic developments in
Finland and Sweden have been quite similar. Also, where differences emerge, these can mostly be
better explained by other factors than the difference in the monetary regime. The main impres-
sion is that differences in the monetary regime have not been associated with great differences in
economic performance in Finland as compared to Sweden. This is compatible with a broad inter-
pretation of the traditional view that money is “neutral” in the long run. However, this observation
contradicts claims, made in the heated debates on EMU in the years before the single currency
came into operation, that EMU would be either a curse (opponents) or a salvation (protagonists).
Our conclusion, with a number of caveats, is that the institutions of the socio-economic model at
large and the economic policies pursued are more important than the monetary regime as such.
One caveat is that the conclusion may hold only for countries pursuing relatively “sound” econom-
ic policies; for countries unable to “keep their house in order”, being outside the euro area may be
a less risky alternative than joining the euro. Given the experiences and prospects of countries like
Greece and Spain it is hard to foresee a turnaround sufficiently robust to avoid thinking that the
cumulative amount of problems might have been less if these countries had experienced neither
the low interest rates following upon entry into the euro area nor the subsequent difficulties of
restoring competitiveness and the high interest rates associated with their debt problems.
A related caveat is that a credible national central bank may help support wage moderation. Swe-
dish labour market organizations are aware of the risk that excessive wage inflation will trigger a
tightening of monetary policy of the Riksbank. In Finland there is no similar feedback from wage
behaviour to interest rates. This is conceivably a factor weakening wage discipline in Finland as
compared to Sweden (in otherwise comparable labour market situations). Recent developments
suggest this concern may not be unfounded.11
A further caveat is that membership may conceivably turn into a real liability also for Finland if the
debt crisis of the euro area is seriously mismanaged and the monetary union is in one way or an-
other transformed into a “transfer union”. This could happen through OSI (official sector involve-
ment) in debt restructurings (or through inflation). As part of the various rescue packages the
Finnish government has given guarantees and loans amounting by now to some 10 per cent of
11
This argument has been elaborated upon by i.a. Holden (2002) and Vartiainen (2002). Interestingly, Denmark also maintains the fixed exchange rate, but has been successful in maintaining wage moderation presumably because wage formation in the traded goods sector is generally accepted as a benchmark for overall wage formation.

30
GDP – even if the TARGET balance of the Bank of Finland were to be disregarded.12 While the sums
are large, however, they would even in a bad scenario amount to only a fraction of a per cent in
terms of the sustainability gap of public finances. The main risk, for Finland as well as for Sweden,
is a collapse of the EMU, which would trigger a Europe-wide banking crisis and depression.
Another path to a transfer union would be to introduce Eurobonds as an instrument of govern-
ment borrowing for the euro area as a whole. However, this would require a change of the treaty
and could hardly win acceptance in parliaments in Germany, the Netherlands or (perhaps particu-
larly) Finland. Overall the conclusion remains: although EMU may or may not have been a bad
idea, its design was certainly flawed13 and its implementation suffered from many errors, but it is
not clear on the basis of experience so far that the decisions on membership in EMU have created
significant differences in the performance or prospects of Finland and Sweden.
6. Concluding remarks
A comparison of the economic performance of Sweden and Finland supports three conclusions
that amount to rather sweeping generalizations. First, it is tempting to see a causal link from crisis
to reform illustrated by the developments and economic policies in Finland and Sweden following
the crisis in the early 1990s. With the benefit of hindsight, that crisis may be seen as somewhat of
a blessing in disguise. It created a political situation that allowed significant structural reforms to
be undertaken, and economic policies have since the crisis been more successful and “responsi-
ble” than in earlier periods.14 Policies have been geared towards, inter alia, allowing or fostering
structural change and maintaining sound public finances.
12
It may be noted that the current Finnish government has insisted that any guarantees or loans given by Finland must be backed up by collateral covering 40 per cent of the commitment. In effect, the collaterals have reduced the net contribution of Finland to the financial packages. On the significance of TARGET balances see de Grauwe (2012).
13 There is no reason to enter into the debate about the proper design of EMU in this context. However, most economists would by
now acknowledge that a single currency needs to be supported by some form of a banking union.
14 On may add that the reorientation of economic policies in Finland and Sweden started before the crisis in the 1990s. After all, the
crisis itself was triggered by the consequences of the deregulation of capital flows and financial markets in the 1980s. Also, the Swedish tax reform was prepared and even implemented already before the crisis. These developments were inspired partly by the change in economic policy thinking emphasizing deregulation and market efficiency. Another factor was the failure of the policy of recurrent devaluations and public sector expansion to generate sustainable growth, which led to the adoption of the fixed ex-change rate as a key policy objective or constraint. One might also argue that the banking crisis was due mainly to the deregulation and the hard currency policy and had little to do with the problems that the structural reforms in the 1990s were meant to tackle. However, it remains the case that the crisis created the mental or political preconditions for reforms to be undertaken.

31
One would like to think that the current crisis in the southern part of the euro area will in a similar
way trigger steps towards a reform path with large payoffs in future years. As pointed out above
and discussed in some detail by Floden (2012), however, the crisis countries in the euro area are
presently facing a more difficult situation than Finland and Sweden in the 1990s, when the Nordics
could benefit from large currency depreciations and favourable external conditions.
A second sweeping generalization, supported by the observations above, as well as other observa-
tions, is that the (current version of the) “Nordic model” is relatively successful in combining equi-
ty and efficiency. While caveats and qualifications are necessary, it remains a pertinent observa-
tion that the Nordic countries seem to outperform many others in terms of a number of social and
economic indicators.
A third conclusion, with certain caveats, is that the monetary regime may matter less for economic
performance than often argued in the heated debate on the pros and cons of a single currency.
While not constituting a laboratory experiment, a comparison of the performance of Finland and
Sweden supports this contention. Admittedly, the jury is still out in the sense that Finland is now
facing a structural weakness of its export base, and it remains to be seen whether domestic wage
adjustment will allow this difficulty to be overcome within a reasonable time span.
Literature
Andersen, T., B. Holmström, S. Honkapohja, S. Korkman, H. Tson Söderström and J. Vartiainen (2007), The Nordic Model - Embracing Globalization and Sharing Risks, The Research Institute of the Finnish Economy (ETLA).
Bordes, C., D. Currie, H. Tson Söderström (1993), Three Assessments of Finland's Economic Crisis and Economic Policy, Bank of Finland Publications C:9.
Berg, C. and R. Gröttheim (1997), “Monetary policy in Sweden since 1992”, in Monetary policy in the Nordic coun-tries: Experiences since 1992, BIS Policy Papers No 2.
Bergth, A. (2006), ”Explaining Welfare State Survival: The Role of Economic Freedom and Globalization”, Available at SSRN: http://ssm.com/abstract=897746.
Bergh, A. and M. Henreksson (2012), Varför går det bra för Sverige, Fores+Ivrig.
Calmfors, L., H. Flam, N. Gottfries, J.H. Matlary, M. Jerneck, R. Lindahl, C.N. Berntsson, E. Rabinowicz and A. Vredin (1997), EMU – A Swedish Perspective, Kluwer, Dordrecht.
Dornbusch, R. (1976). "Expectations and Exchange Rate Dynamics". Journal of Political Economy 84, pp. 1161–1176.
Dreher, A. (2006), “Does globalization Affect Growth? Empirical Evidence from a New Index”, Applied Economics 38, pp. 1091-1110.
Esping-Andersen, G. (1990), The Three Worlds of Welfare Capitalism. Cambridge: Polity Press & Princeton: Princeton University Press.

32
Flodén, M. (2012), “A Role Model for the Conduct of Fiscal Policy? Experiences for Sweden”, CEPR Discussion Paper 095.
Gylfason, T., B. Holmström, S. Korkman, H. Tson Söderström and V. Vihriälä (2010), Nordics in Global Crisis - Vulnera-bility and Resilience, The Research Institute of the Finnish Economy (ETLA).
Holden, S. (2002), "Wage setting under different monetary regimes”, Economica 70, 251-266.
Holzman, R. and E. Palmer, Editors (2003), Pension Reform. Issues and Prospects for Non-Financial Defined Contribu-tion (NDC) Schemes, The World Bank.
Honkapohja, S. (2009), “The 1990’s financial crisi on Nordic countries”, Bank of Finland Discussion Papers No. 5.
Honkapohja, S., E. Koskela, W. Leibfritz and R. Uusitalo (2009), Economic Prosperity Recaptured: The Finnish Path from Crisis to Rapid Growth, MIT Press.
Jonung, L., J. Kiander and P. Vartia (Eds.) (2009), The Great Financial Crisis in Finland and Sweden: The Nordic Experi-ence of Financial Liberalization, Edgar Elgar.
Kindleberger, C. and R. Aliber (2011), Manias, Panics, and Crashes, sixth edition, Palgrave MacMillan.
Lindbeck. A., P. Molander, T. Persson, O. Peterson, A. Sandmo, B. Swdenborg and N. Thygesen (1994), Turning Sweden Around, MIT Press (In Swedish SOU 1993:16, 1993).
Pikkarainen, P., A. Suvanto, J. Hukkinen and I. Pyyhtiä (1997), ”Monetary policy in Finland: experiences since 1992”, in Monetary policy in the Nordic countries: Experiences since 1992, BIS Policy Papers No 2.
Prime Minister’s Office (1997), Finland and EMU, Publication 1997/26, Helsinki.
Mayes, D. and A. Suvanto (2007), “Meeting the Challenge of Monetary Union: Lessons from the Finnish Experience”, Bank i Kredyt 38(10): 3-14.
Reinhart, C. and K. Rogoff (2008), “Is the 2007 US Sub-Prime Financial Crisis So Different? An International Historical Comparison”, The American Economic Review 98, pp. 339-344.
Reinhart, C. and K. Rogoff (2009), This Time Is Different: Eight Centuries of Financial Folly, Princeton University Press.
Suni, P, and V. Vihriälä (2013), “Euro – How Big a Difference; Finland and Sweden in Search of Macro Stability”, ETLA Reports No 7, 4 March.
Svensson, L.E.O., (1997), “Inflation Forecast Targeting: Implementing and Monitoring Inflation Targets”, European Economic Review 41, 1111-1146.
Svensson, L.E.O., (2006), “The Role of Science in Best-Practice Monetary Policy: In Honor of Otmar Issing”, paper presentd at the ECB Colloqium held in honor of Otmar Issing in Frankfurt, March 16-17, 2006.
Vartiainen, J. (2002), “Relative Prices in Monetary Union and Floating”, Scandinavian Journal of Economics 104, 277-287.