finnish food industry statistics 2019 - ruokatieto
TRANSCRIPT
Finnish Food Industry Statistics
2019
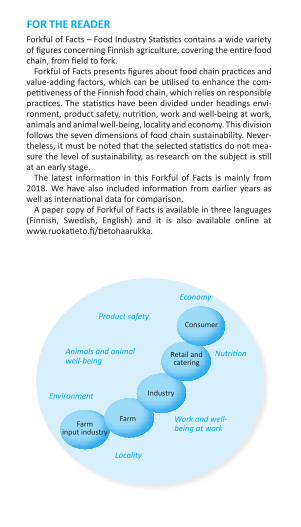
FOR THE READERForkful of Facts – Food Industry Statistics contains a wide variety of figures concerning Finnish agriculture, covering the entire food chain, from field to fork.
Forkful of Facts presents figures about food chain practices and value-adding factors, which can be utilised to enhance the com-petitiveness of the Finnish food chain, which relies on responsible practices. The statistics have been divided under headings envi-ronment, product safety, nutrition, work and well-being at work, animals and animal well-being, locality and economy. This division follows the seven dimensions of food chain sustainability. Never-theless, it must be noted that the selected statistics do not mea-sure the level of sustainability, as research on the subject is still at an early stage.
The latest information in this Forkful of Facts is mainly from 2018. We have also included information from earlier years as well as international data for comparison.
A paper copy of Forkful of Facts is available in three languages (Finnish, Swedish, English) and it is also available online at www.ruokatieto.fi/tietohaarukka.
Product safety
Economy
Nutrition
Work and well-being at work
Locality
Animals and animal well-being
Environment
Farm input industry
Farm
Industry
Retail andcatering
Consumer
1
TABLE OF CONTENTSGeneral informationHouseholds by size 3The population of Finland 3The population density of Finland 3The average size of a household 3Gross domestic product 4Gross value of and value added to production by industry branch 2017 5Bioeconomy in 2017 6Labour force 7Occupational diseases by industry 2015 8Number of occupational accidents 8Average age and number of agricultural entrepreneurs 8Most important reasons for retirement on disability pension among agricultural entrepreneurs 9
AgricultureMean precipitation 1981–2018 10Mean temperatures 1981–2018 10Weather conditions during the growing season 10Day lenght 10Environmental aid 11Volume of pesticides sales 11Pesticide residue control 2017 11Substituting for agricultural entrepreneurs 12Number of agricultural and horticultural enterprises 12Change in number of agricultural and horticultural enterprises 13Ownership of agricultural and horticultural enterprises 13Agricultural labour force 13Specialization in agricultural and horticultural enterprises 14Income of agricultural and horticultural enterprises per production sector 14
Other entrepreneurship on agricultural and horticultural enterprises 15Volume of fresh water self-ab-stracted from the environment by agriculture and food industry 16Use of arable land 16Organic production area and number of organic farms 17Number of organic producers 17Use of arable land on organic farms 18Orcanic production 19Market share of organic produce 19Crop 20Agricultural production costs 21Agricultural gross return 22Beekeeping figures 23Profitability coefficient on the Finnish farms 2001–2018e 23Entrepreneurial income 24Producer prices 24Livestock 25Average number of animals in farms 25Protection of animals inspections based on sample 26Prevention of cruelty to animals inspections in commercial animal deliveries 26Farms receiving animal well- being subsidies 26Implementation of animal welfare on pig and cow farms 27Responsible production limit values in pork production 28Use of antimicrobial agents in food-producing animals 28The foodpad dermititis score that represents the well- being of broiler chickens 28Henneries 29Barn types 2018 29Grazing and time outdoors 29Milking machines 2018 30Average yield per cow and milk contents 2018 30
2
Explanation of symbols:p. = preliminary data.. = data not available
Food
Food manufacturers by sector 31Food and drink industry plants according to enterprise size 32Food industry key sectors 33
Import and export of foodstuffs 34
Food exports by country 36Food exports by country and product group 2018 37The share of food industry´s R&D costs 38Consumption expenditure 38
Food expenditure 39
Real price development of food in Finland 2005–2018 39Retail prices 40
The most common value-added tax on food in the EU countries 2019 41Price indexes 2017 42Households consumption of food and non-alcoholic beverages 2015 43Meat 44Eggs 44Milk products and edible fats 45Bread grain 45Fish 46Fish consumption 46Vegetables and fruit 47Berries and mushrooms 48Game bag 49
Level of self-sufficiency in food products 50
Added value impact of the food sector (EUR million) by region and % of added value by region 51Non-compliant foods 2018 52
Causes of non-compliance 2018 53Veterinary medicinal product residues and other substances in live animals and animal products 53Food control figures 2018 54Number of recalls 55Reasons for product withdrawals 2018 55Foodborne and waterborne out-breaks and number of persons affected 2018 55Food borne outbreaks by food vehicle 2018 56Food consumption per capita in Finland and in the EU 57Average daily intake of energy- yielding nutrients and fibre and percentage out of the total energy intake 58Most important sources of energy and nutrients 59Actual vitamin and mineral intake compared to the recom-mendations 60Finns’ daily meals 61
Health behaviour 2018 62
Daily Consumer Goods Trade and Institutional KitchensNumber of shops by shop type 63Sales of daily consumer goods by shop type 63Number of kitchens and units served by industry, 2017 64Share of organic products in public catering 64Frequency of consumption of organic produce by catering providers 64
3
GENERAL INFORMATION
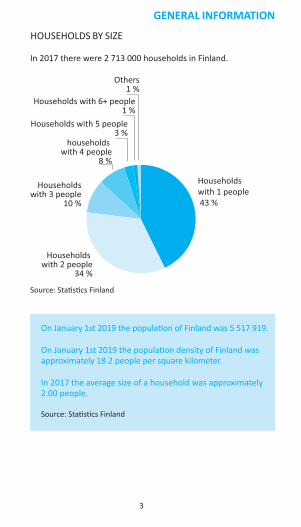
HOUSEHOLDS BY SIZE
Source: Statistics Finland
In 2017 there were 2 713 000 households in Finland.
On January 1st 2019 the population of Finland was 5 517 919.
On January 1st 2019 the population density of Finland was approximately 18.2 people per square kilometer.
In 2017 the average size of a household was approximately 2.00 people.
Source: Statistics Finland
Muut
6+ hengen talouksia
5 hengen talouksia
4 hengen talouksia
3 hengen talouksia
2 hengen talouksia
1 hengen talouksia
Households with 1 people 43 %
Households with 2 people
34 %
Householdswith 3 people
10 %
households with 4 people
8 %
Households with 5 people3 %
Households with 6+ people1 %
Others1 %
4
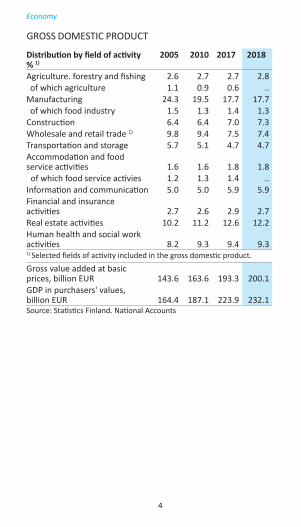
GROSS DOMESTIC PRODUCT
Distribution by field of activity % 1)
2005 2010 2017 2018
Agriculture. forestry and fishing 2.6 2.7 2.7 2.8of which agriculture 1.1 0.9 0.6 ..
Manufacturing 24.3 19.5 17.7 17.7of which food industry 1.5 1.3 1.4 1.3
Construction 6.4 6.4 7.0 7.3Wholesale and retail trade 1) 9.8 9.4 7.5 7.4Transportation and storage 5.7 5.1 4.7 4.7Accommodation and food service activities 1.6 1.6 1.8 1.8 of which food service activies 1.2 1.3 1.4 ..Information and communication 5.0 5.0 5.9 5.9Financial and insurance activities 2.7 2.6 2.9 2.7Real estate activities 10.2 11.2 12.6 12.2Human health and social work activities 8.2 9.3 9.4 9.31) Selected fields of activity included in the gross domestic product.
Gross value added at basic prices, billion EUR 143.6 163.6 193.3 200.1GDP in purchasers' values, billion EUR 164.4 187.1 223.9 232.1Source: Statistics Finland. National Accounts
Economy
5
Economy
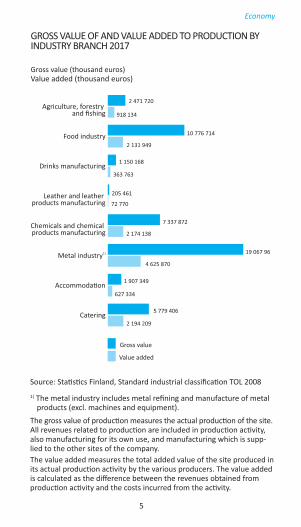
GROSS VALUE OF AND VALUE ADDED TO PRODUCTION BY INDUSTRY BRANCH 2017
Source: Statistics Finland, Standard industrial classification TOL 2008
1) The metal industry includes metal refining and manufacture of metal products (excl. machines and equipment).
The gross value of production measures the actual production of the site. All revenues related to production are included in production activity, also manufacturing for its own use, and manufacturing which is supp-lied to the other sites of the company.The value added measures the total added value of the site produced in its actual production activity by the various producers. The value added is calculated as the difference between the revenues obtained from production activity and the costs incurred from the activity.
Value added
Gross value
Catering
Accommoda�on
Metal industry1)
Chemicals and chemical products manufacturing
Leather and leather products manufacturing
Drinks manufacturing
Food industry
Agriculture, forestry and fishing
2 471 720
918 134
10 776 714
2 131 949
1 150 168
363 763
205 461
72 770
7 337 872
2 174 138
19 067 967
4 625 870
1 907 349
627 334
5 779 406
2 194 209
Gross value (thousand euros)Value added (thousand euros)
6
Economy
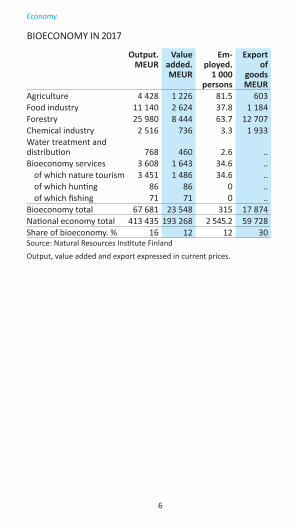
BIOECONOMY IN 2017
Output. MEUR
Value added. MEUR
Em-ployed.
1 000 persons
Export of
goods MEUR
Agriculture 4 428 1 226 81.5 603Food industry 11 140 2 624 37.8 1 184Forestry 25 980 8 444 63.7 12 707Chemical industry 2 516 736 3.3 1 933Water treatment and distribution 768 460 2.6 ..Bioeconomy services 3 608 1 643 34.6 ..
of which nature tourism 3 451 1 486 34.6 ..of which hunting 86 86 0 ..of which fishing 71 71 0 ..
Bioeconomy total 67 681 23 548 315 17 874National economy total 413 435 193 268 2 545.2 59 728Share of bioeconomy. % 16 12 12 30Source: Natural Resources Institute FinlandOutput, value added and export expressed in current prices.
7
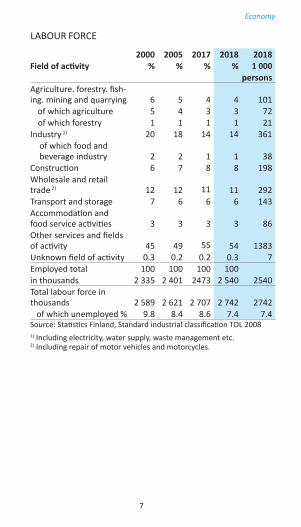
LABOUR FORCE
2000 2005 2017 2018 2018Field of activity % % % % 1 000
personsAgriculture. forestry. fish-ing. mining and quarrying 6 5 4 4 101
of which agriculture 5 4 3 3 72of which forestry 1 1 1 1 21
Industry 1) 20 18 14 14 361of which food and beverage industry 2 2 1 1 38
Construction 6 7 8 8 198Wholesale and retail trade 2) 12 12 11 11 292Transport and storage 7 6 6 6 143Accommodation and food service activities 3 3 3 3 86Other services and fields of activity 45 49 55 54 1383Unknown field of activity 0.3 0.2 0.2 0.3 7Employed total 100 100 100 100 in thousands 2 335 2 401 2473 2 540 2540Total labour force in thousands 2 589 2 621 2 707 2 742 2742 of which unemployed % 9.8 8.4 8.6 7.4 7.4Source: Statistics Finland, Standard industrial classification TOL 20081) Including electricity, water supply, waste management etc. 2) Including repair of motor vehicles and motorcycles.
Economy

8
OCCUPATIONAL DISEASES BY INDUSTRY 2015
Occupational diseases pcs per 10 000 employedCrop farming, animal hus-bandry, game husbandry 113 12.5Production of foodstuff 51 14.9Bevegare industry 2 5.6Food service activities 42 5.9Source: Finnish Institute of Occupational Health
NUMBER OF OCCUPATIONAL ACCIDENTS
Occupational accidents ¹⁾ per 100,000 working in the industry
2005 2010 2016 2017
Agricultural entrepreneurs 5 962 4 882 4 653 4 886Food and drink industry employees 7 696 6 919 2 636 2 504All occupations 2⁾ 2 581 2 103 1 673 1 697Source: Statistics Finland, Workers’ Compensation Center The accident frequency has been calculated as per the industry of the employer.1) Occupational accidents leading to at least 4 days of incapacity for work.2) Occupational groups with at least 10 000 employees.
Work and well-being at work
AVERAGE AGE AND NUMBER OF AGRICULTURAL ENTREPRENEURS
1995 2005 2018aver.age
num-ber
aver.age
num-ber
aver.age
num-ber
Agricultural entrepreneurs 45.1 142 000 47.6 90 000 48.9 57 000Start-up entrepreneurs 1) 29.9 70 29.8 760 29.3 180Retiring entrepreneurs 2) 60.2 6 600 60.8 3 900 62.2 1 400Recipients of farmers' early retirement aid 3) 57.8 560 58.6 1 420 59.7 280Source: Farmers’ Social Insurance Institution Mela, statistics based on data on agricultural entrepreneurs covered by insurance under the Farmers’ Pensions Act (MYEL)1) Entrepreneurs taking up farming through succession within the farmers’
early retirement aid scheme.2) Covering those retiring on old-age, disability and unemployment pension.3) Those giving up farming through succession within the farmers’ early
retirement aid scheme.
9
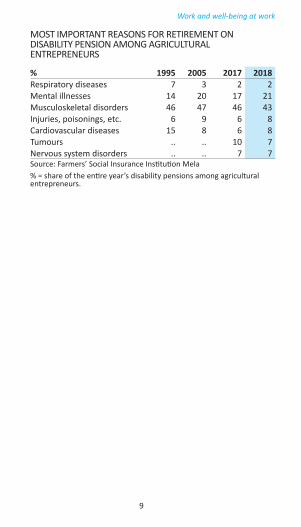
MOST IMPORTANT REASONS FOR RETIREMENT ON DISABILITY PENSION AMONG AGRICULTURAL ENTREPRENEURS
% 1995 2005 2017 2018Respiratory diseases 7 3 2 2Mental illnesses 14 20 17 21Musculoskeletal disorders 46 47 46 43Injuries, poisonings, etc. 6 9 6 8Cardiovascular diseases 15 8 6 8Tumours .. .. 10 7Nervous system disorders .. .. 7 7Source: Farmers’ Social Insurance Institution Mela% = share of the entire year’s disability pensions among agricultural entrepreneurs.
Work and well-being at work
10
AGRICULTURE
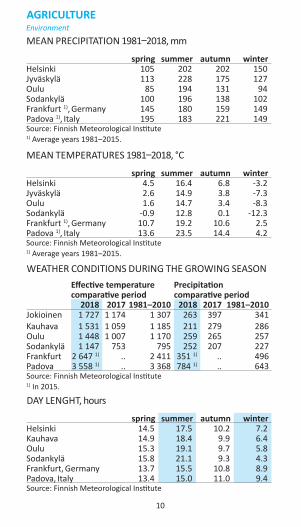
MEAN PRECIPITATION 1981–2018, mm
spring summer autumn winterHelsinki 105 202 202 150Jyväskylä 113 228 175 127Oulu 85 194 131 94Sodankylä 100 196 138 102Frankfurt 1), Germany 145 180 159 149Padova 1), Italy 195 183 221 149Source: Finnish Meteorological Institute1) Average years 1981–2015.
MEAN TEMPERATURES 1981–2018, °C
spring summer autumn winterHelsinki 4.5 16.4 6.8 -3.2Jyväskylä 2.6 14.9 3.8 -7.3Oulu 1.6 14.7 3.4 -8.3Sodankylä -0.9 12.8 0.1 -12.3Frankfurt 1), Germany 10.7 19.2 10.6 2.5Padova 1), Italy 13.6 23.5 14.4 4.2Source: Finnish Meteorological Institute 1) Average years 1981–2015.
WEATHER CONDITIONS DURING THE GROWING SEASONEffective temperature comparative period
Precipitation comparative period
2018 2017 1981–2010 2018 2017 1981–2010Jokioinen 1 727 1 174 1 307 263 397 341Kauhava 1 531 1 059 1 185 211 279 286Oulu 1 448 1 007 1 170 259 265 257Sodankylä 1 147 753 795 252 207 227Frankfurt 2 647 1) .. 2 411 351 1) .. 496Padova 3 558 1) .. 3 368 784 1) .. 643Source: Finnish Meteorological Institute1) In 2015.
DAY LENGHT, hours
spring summer autumn winterHelsinki 14.5 17.5 10.2 7.2Kauhava 14.9 18.4 9.9 6.4Oulu 15.3 19.1 9.7 5.8Sodankylä 15.8 21.1 9.3 4.3Frankfurt, Germany 13.7 15.5 10.8 8.9Padova, Italy 13.4 15.0 11.0 9.4Source: Finnish Meteorological Institute
Environment
11
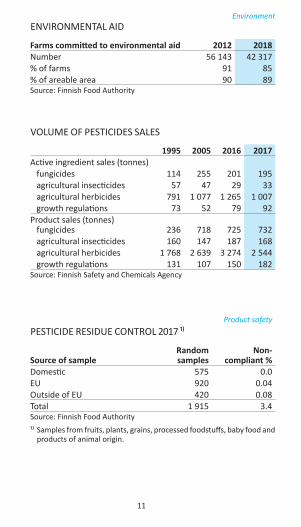
VOLUME OF PESTICIDES SALES
1995 2005 2016 2017Active ingredient sales (tonnes) fungicides 114 255 201 195 agricultural insecticides 57 47 29 33 agricultural herbicides 791 1 077 1 265 1 007 growth regulations 73 52 79 92Product sales (tonnes) fungicides 236 718 725 732 agricultural insecticides 160 147 187 168 agricultural herbicides 1 768 2 639 3 274 2 544 growth regulations 131 107 150 182Source: Finnish Safety and Chemicals Agency
PESTICIDE RESIDUE CONTROL 2017 ¹⁾
Source of sampleRandom samples
Non- compliant %
Domestic 575 0.0EU 920 0.04Outside of EU 420 0.08Total 1 915 3.4Source: Finnish Food Authority ¹⁾ Samples from fruits, plants, grains, processed foodstuffs, baby food and
products of animal origin.
Product safety
EnvironmentENVIRONMENTAL AID
Farms committed to environmental aid 2012 2018Number 56 143 42 317% of farms 91 85% of areable area 90 89Source: Finnish Food Authority
12
SUBSTITUTING FOR AGRICULTURAL ENTREPRENEURS
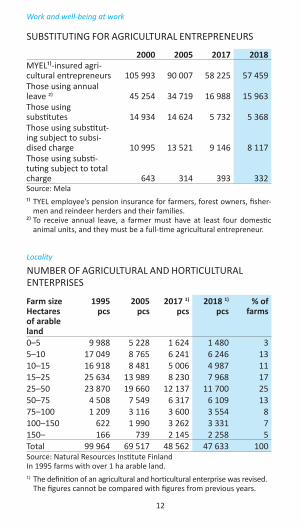
2000 2005 2017 2018MYEL¹⁾-insured agri-cultural entrepreneurs 105 993 90 007 58 225 57 459Those using annual leave ²⁾ 45 254 34 719 16 988 15 963Those using substitutes 14 934 14 624 5 732 5 368Those using substitut- ing subject to subsi-dised charge 10 995 13 521 9 146 8 117Those using substi-tuting subject to total charge 643 314 393 332Source: Mela¹⁾ TYEL employee’s pension insurance for farmers, forest owners, fisher-
men and reindeer herders and their families.²⁾ To receive annual leave, a farmer must have at least four domestic
animal units, and they must be a full-time agricultural entrepreneur.
Work and well-being at work
NUMBER OF AGRICULTURAL AND HORTICULTURAL ENTERPRISES
Farm sizeHectares of arable land
1995pcs
2005pcs
2017 1)
pcs2018 1)
pcs% of
farms
0–5 9 988 5 228 1 624 1 480 35–10 17 049 8 765 6 241 6 246 1310–15 16 918 8 481 5 006 4 987 1115–25 25 634 13 989 8 230 7 968 1725–50 23 870 19 660 12 137 11 700 2550–75 4 508 7 549 6 317 6 109 1375–100 1 209 3 116 3 600 3 554 8100–150 622 1 990 3 262 3 331 7150– 166 739 2 145 2 258 5Total 99 964 69 517 48 562 47 633 100Source: Natural Resources Institute FinlandIn 1995 farms with over 1 ha arable land. 1) The definition of an agricultural and horticultural enterprise was revised.
The figures cannot be compared with figures from previous years.
Locality
13
OWNERSHIP OF AGRICULTURAL AND HORTICULTURAL ENTERPRISES
Category 1995 1)
pcs2005
pcs2017 2)
pcs2018 2)
pcs% of
farms
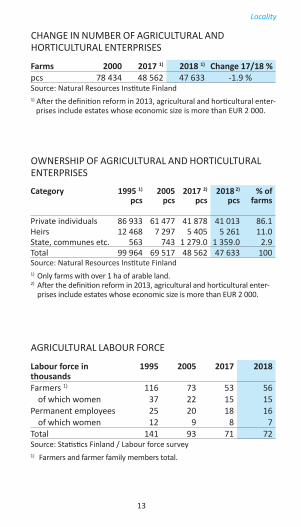
Private individuals 86 933 61 477 41 878 41 013 86.1Heirs 12 468 7 297 5 405 5 261 11.0State, communes etc. 563 743 1 279.0 1 359.0 2.9Total 99 964 69 517 48 562 47 633 100Source: Natural Resources Institute Finland1) Only farms with over 1 ha of arable land.2) After the definition reform in 2013, agricultural and horticultural enter-
prises include estates whose economic size is more than EUR 2 000.
AGRICULTURAL LABOUR FORCE
Labour force in thousands
1995 2005 2017 2018
Farmers 1) 116 73 53 56of which women 37 22 15 15
Permanent employees 25 20 18 16of which women 12 9 8 7
Total 141 93 71 72Source: Statistics Finland / Labour force survey1) Farmers and farmer family members total.
Locality
CHANGE IN NUMBER OF AGRICULTURAL AND HORTICULTURAL ENTERPRISES
Farms 2000 2017 1) 2018 1) Change 17/18 %pcs 78 434 48 562 47 633 -1.9 %Source: Natural Resources Institute Finland1) After the definition reform in 2013, agricultural and horticultural enter-
prises include estates whose economic size is more than EUR 2 000.
14
SPECIALIZATION IN AGRICULTURAL AND HORTICULTURAL ENTERPRISES
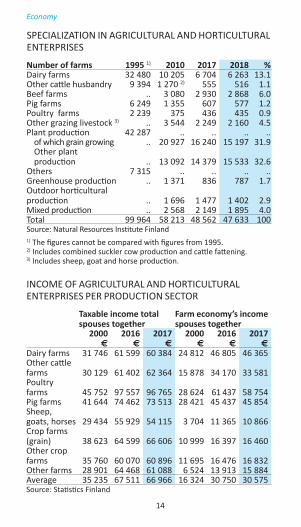
Number of farms 1995 1) 2010 2017 2018 %Dairy farms 32 480 10 205 6 704 6 263 13.1 Other cattle husbandry 9 394 1 270 2) 555 516 1.1 Beef farms .. 3 080 2 930 2 868 6.0 Pig farms 6 249 1 355 607 577 1.2 Poultry farms 2 239 375 436 435 0.9 Other grazing livestock 3) .. 3 544 2 249 2 160 4.5 Plant production 42 287 .. .. .. ..
of which grain growing .. 20 927 16 240 15 197 31.9 Other plant production .. 13 092 14 379 15 533 32.6
Others 7 315 .. .. .. ..Greenhouse production .. 1 371 836 787 1.7 Outdoor horticultural production .. 1 696 1 477 1 402 2.9 Mixed production .. 2 568 2 149 1 895 4.0 Total 99 964 58 213 48 562 47 633 100Source: Natural Resources Institute Finland1) The figures cannot be compared with figures from 1995.2) Includes combined suckler cow production and cattle fattening.3) Includes sheep, goat and horse production.
INCOME OF AGRICULTURAL AND HORTICULTURAL ENTERPRISES PER PRODUCTION SECTOR
Taxable income total spouses together
Farm economy’s incomespouses together
2000€
2016€
2017€
2000€
2016€
2017€
Dairy farms 31 746 61 599 60 384 24 812 46 805 46 365Other cattle farms 30 129 61 402 62 364 15 878 34 170 33 581Poultry farms 45 752 97 557 96 765 28 624 61 437 58 754Pig farms 41 644 74 462 73 513 28 421 45 437 45 854Sheep, goats, horses 29 434 55 929 54 115 3 704 11 365 10 866Crop farms (grain) 38 623 64 599 66 606 10 999 16 397 16 460Other crop farms 35 760 60 070 60 896 11 695 16 476 16 832Other farms 28 901 64 468 61 088 6 524 13 913 15 884Average 35 235 67 511 66 966 16 324 30 750 30 575Source: Statistics Finland
Economy
15
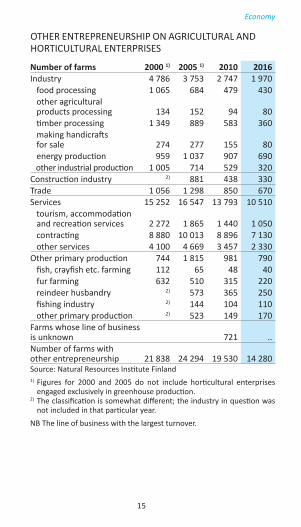
OTHER ENTREPRENEURSHIP ON AGRICULTURAL AND HORTICULTURAL ENTERPRISES
Number of farms 2000 1) 2005 1) 2010 2016Industry 4 786 3 753 2 747 1 970 food processing 1 065 684 479 430 other agricultural products processing 134 152 94 80 timber processing 1 349 889 583 360 making handicrafts for sale 274 277 155 80 energy production 959 1 037 907 690 other industrial production 1 005 714 529 320Construction industry 2) 881 438 330Trade 1 056 1 298 850 670Services 15 252 16 547 13 793 10 510 tourism, accommodation and recreation services 2 272 1 865 1 440 1 050 contracting 8 880 10 013 8 896 7 130 other services 4 100 4 669 3 457 2 330Other primary production 744 1 815 981 790 fish, crayfish etc. farming 112 65 48 40 fur farming 632 510 315 220 reindeer husbandry 2) 573 365 250 fishing industry 2) 144 104 110 other primary production 2) 523 149 170Farms whose line of business is unknown 721 ..Number of farms with other entrepreneurship 21 838 24 294 19 530 14 280Source: Natural Resources Institute Finland1) Figures for 2000 and 2005 do not include horticultural enterprises
engaged exclusively in greenhouse production.2) The classification is somewhat different; the industry in question was
not included in that particular year.NB The line of business with the largest turnover.
Economy

16
USE OF ARABLE LAND
1995 2005 2017 1) 2018 1)
1 000 ha 1 000 ha 1 000 ha 1 000 haGrassland 755 620 717 763Cereals. total 978 1 188 1 071 1 040 wheat 101 215 219 190 rye 21 14 32 17 barley 516 595 437 463 oats 329 346 337 324 mixed grain 11 16 43 42 other cereals 1 1 3,4 3,9Oil plants 85 77 65 58Sugar-beets 35 31 12 10Potatoes 36 29 22 22Other crops 29 49 101 104Area in production 1 918 1 993 1 988 1 996Fallow 223 241 254 246Cultivated area 2 141 2 235 2 242 2 242Source: Natural Resources Institute Finland1) Includes only enterprises that exceed the threshold value (SO 2000 EUR).
1995ha
2005ha
2017ha
2018ha
Mean arable land 22 33 47 48Source: Natural Resources Institute Finland
Economy
VOLUME OF FRESH WATER SELF-ABSTRACTED FROM THE ENVIRONMENT BY AGRICULTURE AND FOOD INDUSTRY
Toimiala 2010 20151 000 000 m3/a 1 000 000 m3/a
Growing of crops 9.2 ..Animal husbandry 35.7 35.0Food industry 22.2 22.2Beverage industry 6.3 5.6Food trading 3.1 ..Food service activities 11.2 ..Households 249.2 ..
foodchain related usage 99.7 ..Lähde: J. M. Salminen et al. Improving data quality, applicability and trans-parency of national water accoutns – A case study for Finland
Environment
17
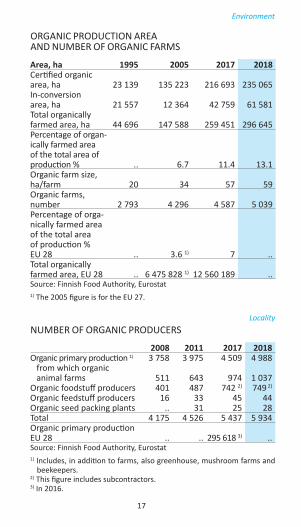
ORGANIC PRODUCTION AREA AND NUMBER OF ORGANIC FARMS
Area, ha 1995 2005 2017 2018Certified organic area, ha 23 139 135 223 216 693 235 065In-conversion area, ha 21 557 12 364 42 759 61 581Total organically farmed area, ha 44 696 147 588 259 451 296 645Percentage of organ-ically farmed area of the total area of production % .. 6.7 11.4 13.1Organic farm size, ha/farm 20 34 57 59Organic farms, number 2 793 4 296 4 587 5 039Percentage of orga- nically farmed area of the total area of production % EU 28 .. 3.6 1) 7 ..Total organically farmed area, EU 28 .. 6 475 828 1) 12 560 189 ..Source: Finnish Food Authority, Eurostat1) The 2005 figure is for the EU 27.
NUMBER OF ORGANIC PRODUCERS
2008 2011 2017 2018Organic primary production 1) 3 758 3 975 4 509 4 988 from which organic animal farms 511 643 974 1 037Organic foodstuff producers 401 487 742 2) 749 2)
Organic feedstuff producers 16 33 45 44Organic seed packing plants .. 31 25 28Total 4 175 4 526 5 437 5 934Organic primary production EU 28 .. .. 295 618 3) ..Source: Finnish Food Authority, Eurostat1) Includes, in addition to farms, also greenhouse, mushroom farms and
beekeepers.2) This figure includes subcontractors.3) In 2016.
Environment
Locality
18
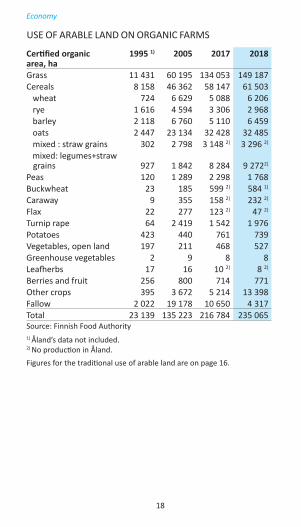
USE OF ARABLE LAND ON ORGANIC FARMS
Certified organic area, ha
1995 1) 2005 2017 2018
Grass 11 431 60 195 134 053 149 187Cereals 8 158 46 362 58 147 61 503 wheat 724 6 629 5 088 6 206 rye 1 616 4 594 3 306 2 968 barley 2 118 6 760 5 110 6 459 oats 2 447 23 134 32 428 32 485 mixed : straw grains 302 2 798 3 148 2) 3 296 2)
mixed: legumes+straw grains 927 1 842 8 284 9 2722)
Peas 120 1 289 2 298 1 768Buckwheat 23 185 599 2) 584 1)
Caraway 9 355 158 2) 232 2)
Flax 22 277 123 2) 47 2)
Turnip rape 64 2 419 1 542 1 976Potatoes 423 440 761 739Vegetables, open land 197 211 468 527Greenhouse vegetables 2 9 8 8Leafherbs 17 16 10 2) 8 2)
Berries and fruit 256 800 714 771Other crops 395 3 672 5 214 13 398Fallow 2 022 19 178 10 650 4 317Total 23 139 135 223 216 784 235 065Source: Finnish Food Authority 1) Åland’s data not included.2) No production in Åland.Figures for the traditional use of arable land are on page 16.
Economy
19
Economy
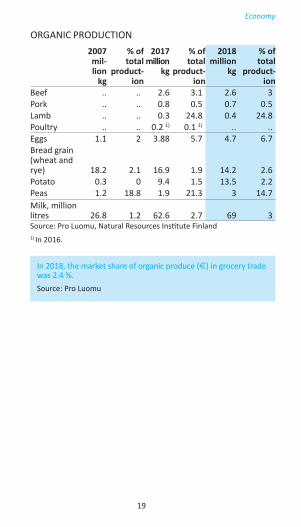
ORGANIC PRODUCTION
2007 mil-lion
kg
% of total
product- ion
2017million
kg
% of total
product- ion
2018million
kg
% of total
product- ion
Beef .. .. 2.6 3.1 2.6 3Pork .. .. 0.8 0.5 0.7 0.5Lamb .. .. 0.3 24.8 0.4 24.8Poultry .. .. 0.2 1) 0.1 1) .. ..Eggs 1.1 2 3.88 5.7 4.7 6.7Bread grain (wheat and rye) 18.2 2.1 16.9 1.9 14.2 2.6Potato 0.3 0 9.4 1.5 13.5 2.2Peas 1.2 18.8 1.9 21.3 3 14.7Milk, million litres 26.8 1.2 62.6 2.7 69 3Source: Pro Luomu, Natural Resources Institute Finland1) In 2016.
In 2018, the market share of organic produce (€) in grocery trade was 2.4 %.Source: Pro Luomu

20
CROP
1995 2005 2017 2018Wheat area (in 1 000 ha) 101 215 194 178 total yield (M kg) 380 801 802 495 yield kg/ha 3 770 3 730 4 130 2 780Rye area (in 1 000 ha) 21 14 29 16 total yield (M kg) 58 32 114 42 yield kg/ha 2 770 2 290 3 920 2 580Barley area (in 1 000 ha) 516 594 358 405 total yield (M kg) 1 764 2 103 1 460 1 336 yield kg/ha 3 420 3 540 4 070 3 300Oats area (in 1 000 ha) 329 345 270 289 total yield (M kg) 1 097 1 073 1 014 818 yield kg/ha 3 330 3 110 3 760 2 830Sugar-beets area (in 1 000 ha) 35 31 12 10 total yield (M kg) 1 110 1 181 430 355 yield kg/ha 31 900 37 870 36 550 36 270Oil plants area (in 1 000 ha) 85 77 55 53 total yield (M kg) 128 106 91 71 yield kg/ha 1 500 1 380 1 650 1 330Peas area (in 1 000 ha) 5 4 4 9 total yield (M kg) 11 8 9 20 yield kg/ha 2 420 93 2 180 2 350Potatoes area (in 1 000 ha) 36 29 21 21 total yield (M kg) 798 743 612 600 yield kg/ha 22 110 25 700 28 860 28 060Vegetables total yield (M kg) 234 248 254 257 tomatoes 31 38 39 39 cucumber (greenhouse) 24 32 43 45 cabbage 24 19 23 19 carrots 61 67 62 68 onions 17 21 26 24Potted vegetables (M pcs) 30 64 102 116Source: Natural Resources Institute Finland
Economy
21
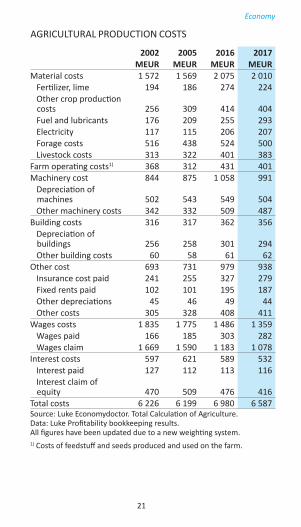
AGRICULTURAL PRODUCTION COSTS
2002 2005 2016 2017MEUR MEUR MEUR MEUR
Material costs 1 572 1 569 2 075 2 010 Fertilizer, lime 194 186 274 224 Other crop production
costs 256 309 414 404 Fuel and lubricants 176 209 255 293 Electricity 117 115 206 207 Forage costs 516 438 524 500 Livestock costs 313 322 401 383Farm operating costs1) 368 312 431 401Machinery cost 844 875 1 058 991 Depreciation of
machines 502 543 549 504 Other machinery costs 342 332 509 487Building costs 316 317 362 356 Depreciation of
buildings 256 258 301 294 Other building costs 60 58 61 62Other cost 693 731 979 938 Insurance cost paid 241 255 327 279 Fixed rents paid 102 101 195 187 Other depreciations 45 46 49 44 Other costs 305 328 408 411Wages costs 1 835 1 775 1 486 1 359 Wages paid 166 185 303 282 Wages claim 1 669 1 590 1 183 1 078Interest costs 597 621 589 532 Interest paid 127 112 113 116 Interest claim of
equity 470 509 476 416Total costs 6 226 6 199 6 980 6 587Source: Luke Economydoctor. Total Calculation of Agriculture. Data: Luke Profitability bookkeeping results.All figures have been updated due to a new weighting system.1) Costs of feedstuff and seeds produced and used on the farm.
Economy
22
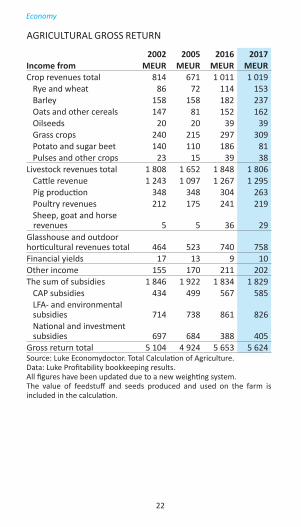
AGRICULTURAL GROSS RETURN
2002 2005 2016 2017Income from MEUR MEUR MEUR MEURCrop revenues total 814 671 1 011 1 019 Rye and wheat 86 72 114 153 Barley 158 158 182 237 Oats and other cereals 147 81 152 162 Oilseeds 20 20 39 39 Grass crops 240 215 297 309 Potato and sugar beet 140 110 186 81 Pulses and other crops 23 15 39 38Livestock revenues total 1 808 1 652 1 848 1 806 Cattle revenue 1 243 1 097 1 267 1 295 Pig production 348 348 304 263 Poultry revenues 212 175 241 219 Sheep, goat and horse
revenues 5 5 36 29Glasshouse and outdoor horticultural revenues total 464 523 740 758Financial yields 17 13 9 10Other income 155 170 211 202The sum of subsidies 1 846 1 922 1 834 1 829 CAP subsidies 434 499 567 585 LFA- and environmental subsidies 714 738 861 826 National and investment subsidies 697 684 388 405Gross return total 5 104 4 924 5 653 5 624Source: Luke Economydoctor. Total Calculation of Agriculture. Data: Luke Profitability bookkeeping results.All figures have been updated due to a new weighting system.The value of feedstuff and seeds produced and used on the farm is included in the calculation.
Economy

23
Source: Total Calculation of Luke Economic Research
Economy
-0,2-0,00,20,40,60,81,01,2
Alla gårdarSvinproduk�onÖvrig nötproduk�onMjölkproduk�onTrädgårdsproduk�onSpannmålsodling 20
18f.
2017
2016
2015
2014
2013
2012
2011
2010
2009
2008
2007
2006
2005
2004
2003
2002
2001
PROFITABILITY COEFFICIENT ON THE FINNISH FARMS 2001–2018e
BEEKEEPING FIGURES2017 2018
The Finnish Beekeepers' Association members
2 590 2 750
Professional beekeepers 1) 74 79Organic beekeepers 61 58Number of productive beehives 67 000 72 300Number of organic beehives 4 079 4 488Yield per beehive, kg 38 47Honey production, tonnes 2 100 2 606Imported honey, tonnes 1 970 2 003Honey consumption, tonnes 3 168 4 100Honey consumption, g/person 576 743Winter beehive losses 2) , % 15 19Gross profit, beekeeping 3), € 30 000 31 000The share of organic production and consumption, % 7 7Source: Suomen Mehiläishoitajain Liitto SML ry (The Finnish Beekeepers' Association)1) Beekeepers with more than 100 hives according to hive grant statistics.2) Percentage of bees that died during the winter. 3) Estimates from 2017 and 2018.
24
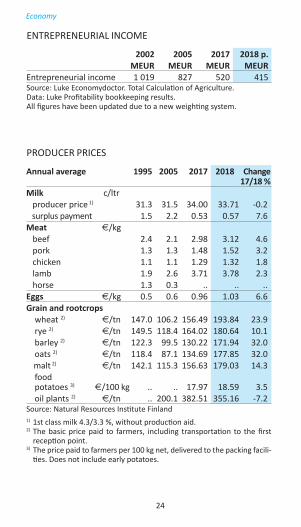
PRODUCER PRICES
Annual average 1995 2005 2017 2018 Change 17/18 %
Milk c/ltr producer price 1) 31.3 31.5 34.00 33.71 -0.2 surplus payment 1.5 2.2 0.53 0.57 7.6Meat €/kg beef 2.4 2.1 2.98 3.12 4.6 pork 1.3 1.3 1.48 1.52 3.2 chicken 1.1 1.1 1.29 1.32 1.8 lamb 1.9 2.6 3.71 3.78 2.3 horse 1.3 0.3 .. .. ..Eggs €/kg 0.5 0.6 0.96 1.03 6.6Grain and rootcrops wheat 2) €/tn 147.0 106.2 156.49 193.84 23.9 rye 2) €/tn 149.5 118.4 164.02 180.64 10.1 barley 2) €/tn 122.3 99.5 130.22 171.94 32.0 oats 2) €/tn 118.4 87.1 134.69 177.85 32.0 malt 2) €/tn 142.1 115.3 156.63 179.03 14.3 food potatoes 3) €/100 kg .. .. 17.97 18.59 3.5 oil plants 2) €/tn .. 200.1 382.51 355.16 -7.2Source: Natural Resources Institute Finland1) 1st class milk 4.3/3.3 %, without production aid.2) The basic price paid to farmers, including transportation to the first
reception point.3) The price paid to farmers per 100 kg net, delivered to the packing facili-
ties. Does not include early potatoes.
ENTREPRENEURIAL INCOME
2002 2005 2017 2018 p.MEUR MEUR MEUR MEUR
Entrepreneurial income 1 019 827 520 415Source: Luke Economydoctor. Total Calculation of Agriculture. Data: Luke Profitability bookkeeping results.All figures have been updated due to a new weighting system.
Economy
25
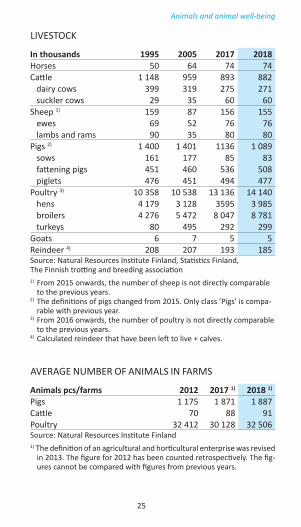
LIVESTOCK
In thousands 1995 2005 2017 2018Horses 50 64 74 74Cattle 1 148 959 893 882 dairy cows 399 319 275 271 suckler cows 29 35 60 60Sheep 1) 159 87 156 155 ewes 69 52 76 76 lambs and rams 90 35 80 80Pigs 2) 1 400 1 401 1136 1 089 sows 161 177 85 83 fattening pigs 451 460 536 508 piglets 476 451 494 477Poultry 3) 10 358 10 538 13 136 14 140 hens 4 179 3 128 3595 3 985 broilers 4 276 5 472 8 047 8 781 turkeys 80 495 292 299Goats 6 7 5 5Reindeer 4) 208 207 193 185Source: Natural Resources Institute Finland, Statistics Finland, The Finnish trotting and breeding association 1) From 2015 onwards, the number of sheep is not directly comparable
to the previous years.2) The definitions of pigs changed from 2015. Only class ’Pigs’ is compa-
rable with previous year.3) From 2016 onwards, the number of poultry is not directly comparable
to the previous years.4) Calculated reindeer that have been left to live + calves.
Animals and animal well-being
AVERAGE NUMBER OF ANIMALS IN FARMS
Animals pcs/farms 2012 2017 1) 2018 1)
Pigs 1 175 1 871 1 887Cattle 70 88 91Poultry 32 412 30 128 32 506Source: Natural Resources Institute Finland1) The definition of an agricultural and horticultural enterprise was revised
in 2013. The figure for 2012 has been counted retrospectively. The fig-ures cannot be compared with figures from previous years.
26
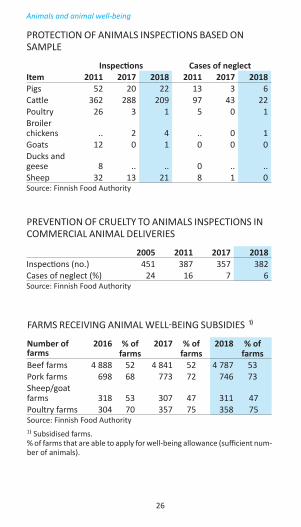
PROTECTION OF ANIMALS INSPECTIONS BASED ON SAMPLE
Inspections Cases of neglectItem 2011 2017 2018 2011 2017 2018Pigs 52 20 22 13 3 6Cattle 362 288 209 97 43 22Poultry 26 3 1 5 0 1Broiler chickens .. 2 4 .. 0 1Goats 12 0 1 0 0 0Ducks and geese 8 .. .. 0 .. ..Sheep 32 13 21 8 1 0Source: Finnish Food Authority
PREVENTION OF CRUELTY TO ANIMALS INSPECTIONS IN COMMERCIAL ANIMAL DELIVERIES
2005 2011 2017 2018Inspections (no.) 451 387 357 382Cases of neglect (%) 24 16 7 6Source: Finnish Food Authority
Animals and animal well-being
FARMS RECEIVING ANIMAL WELL-BEING SUBSIDIES ¹⁾
Number of farms
2016 % of farms
2017 % of farms
2018 % of farms
Beef farms 4 888 52 4 841 52 4 787 53Pork farms 698 68 773 72 746 73Sheep/goat farms 318 53 307 47 311 47Poultry farms 304 70 357 75 358 75Source: Finnish Food Authority 1⁾ Subsidised farms.% of farms that are able to apply for well-being allowance (sufficient num-ber of animals).
27
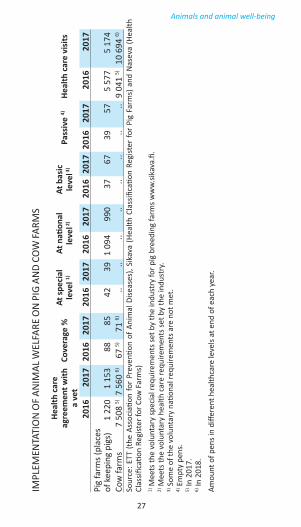
IMPL
EMEN
TATI
ON
OF
ANIM
AL W
ELFA
RE O
N PI
G AN
D CO
W FA
RMS
Heal
th c
are
agre
emen
t with
a
vet
Cove
rage
%At
spec
ial
leve
l 1)At
nati
onal
le
vel 2
)At
bas
ic
leve
l 3)
Pass
ive
4)He
alth
car
e vi
sits
2016
2017
2016
2017
2016
2017
2016
2017
2016
2017
2016
2017
2016
2017
Pig
farm
s (pl
aces
of
kee
ping
pig
s)1
220
1 15
388
8542
391
094
990
3767
3957
5 57
75
174
Cow
farm
s7
508
5)7
560
6)67
5)71
6)..
....
....
....
..9
041
5)10
694
6)
Sour
ce: E
TT (t
he A
ssoc
iatio
n fo
r Pr
even
tion
of A
nim
al D
iseas
es),
Sika
va (H
ealth
Cla
ssifi
catio
n Re
gist
er fo
r Pi
g Fa
rms)
and
Nas
eva
(Hea
lth
Clas
sifica
tion
Regi
ster
for C
ow F
arm
s)1)
Mee
ts th
e vo
lunt
ary
spec
ial r
equi
rem
ents
set b
y th
e in
dust
ry fo
r pig
bre
edin
g fa
rms w
ww
.sik
ava.
fi.2)
Mee
ts th
e vo
lunt
ary
heal
th c
are
requ
irem
ents
set b
y th
e in
dust
ry.
3) S
ome
of th
e vo
lunt
ary
natio
nal r
equi
rem
ents
are
not
met
.4)
Em
pty
pens
.5)
In 2
017.
6) In
201
8.
Amou
nt o
f pen
s in
diffe
rent
hea
lthca
re le
vels
at e
nd o
f eac
h ye
ar.
Animals and animal well-being
28
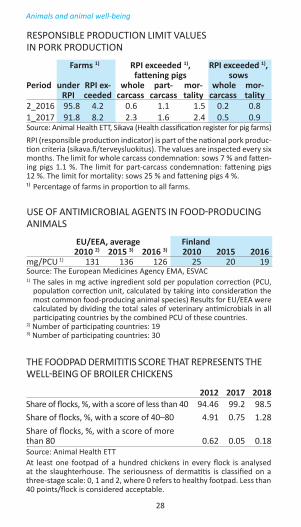
RESPONSIBLE PRODUCTION LIMIT VALUES IN PORK PRODUCTION
Farms 1) RPI exceeded 1), fattening pigs
RPI exceeded 1), sows
Period under RPI
RPI ex-ceeded
whole carcass
part-carcass
mor-tality
whole carcass
mor-tality
2_2016 95.8 4.2 0.6 1.1 1.5 0.2 0.81_2017 91.8 8.2 2.3 1.6 2.4 0.5 0.9Source: Animal Health ETT, Sikava (Health classification register for pig farms)RPI (responsible production indicator) is part of the national pork produc-tion criteria (sikava.fi/terveysluokitus). The values are inspected every six months. The limit for whole carcass condemnation: sows 7 % and fatten-ing pigs 1.1 %. The limit for part-carcass condemnation: fattening pigs 12 %. The limit for mortality: sows 25 % and fattening pigs 4 %.¹⁾ Percentage of farms in proportion to all farms.
Animals and animal well-being
USE OF ANTIMICROBIAL AGENTS IN FOOD-PRODUCING ANIMALS
EU/EEA, average Finland2010 2) 2015 3) 2016 3) 2010 2015 2016
mg/PCU 1) 131 136 126 25 20 19Source: The European Medicines Agency EMA, ESVAC1) The sales in mg active ingredient sold per population correction (PCU,
population correction unit, calculated by taking into consideration the most common food-producing animal species) Results for EU/EEA were calculated by dividing the total sales of veterinary antimicrobials in all participating countries by the combined PCU of these countries.
2) Number of participating countries: 193) Number of participating countries: 30
THE FOODPAD DERMITITIS SCORE THAT REPRESENTS THE WELL-BEING OF BROILER CHICKENS
2012 2017 2018Share of flocks, %, with a score of less than 40 94.46 99.2 98.5Share of flocks, %, with a score of 40–80 4.91 0.75 1.28Share of flocks, %, with a score of more than 80 0.62 0.05 0.18Source: Animal Health ETTAt least one footpad of a hundred chickens in every flock is analysed at the slaughterhouse. The seriousness of dermatitis is classified on a three-stage scale: 0, 1 and 2, where 0 refers to healthy footpad. Less than 40 points/flock is considered acceptable.
29
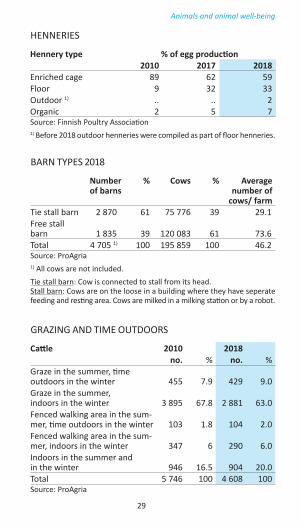
HENNERIES
Hennery type % of egg production2010 2017 2018
Enriched cage 89 62 59Floor 9 32 33Outdoor 1) .. .. 2Organic 2 5 7Source: Finnish Poultry Association1) Before 2018 outdoor henneries were compiled as part of floor henneries.
BARN TYPES 2018
Number of barns
% Cows % Average number of
cows/ farmTie stall barn 2 870 61 75 776 39 29.1Free stall barn 1 835 39 120 083 61 73.6Total 4 705 1) 100 195 859 100 46.2Source: ProAgria1) All cows are not included.Tie stall barn: Cow is connected to stall from its head. Stall barn: Cows are on the loose in a building where they have seperate feeding and resting area. Cows are milked in a milking station or by a robot.
Animals and animal well-being
GRAZING AND TIME OUTDOORS
Cattle 2010 2018no. % no. %
Graze in the summer, time outdoors in the winter 455 7.9 429 9.0Graze in the summer, indoors in the winter 3 895 67.8 2 881 63.0Fenced walking area in the sum- mer, time outdoors in the winter 103 1.8 104 2.0Fenced walking area in the sum-mer, indoors in the winter 347 6 290 6.0Indoors in the summer and in the winter 946 16.5 904 20.0Total 5 746 100 4 608 100Source: ProAgria
30
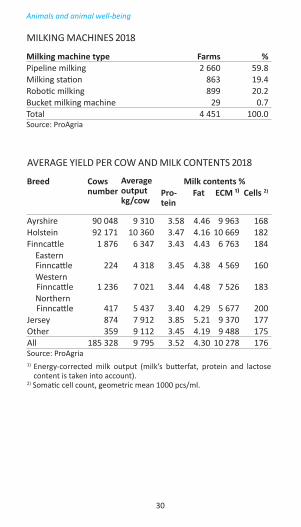
AVERAGE YIELD PER COW AND MILK CONTENTS 2018
Breed Cows number
Average output kg/cow
Milk contents %Pro-tein
Fat ECM ¹⁾ Cells 2)
Ayrshire 90 048 9 310 3.58 4.46 9 963 168Holstein 92 171 10 360 3.47 4.16 10 669 182Finncattle 1 876 6 347 3.43 4.43 6 763 184 Eastern Finncattle 224 4 318 3.45 4.38 4 569 160 Western
Finncattle 1 236 7 021 3.44 4.48 7 526 183 Northern
Finncattle 417 5 437 3.40 4.29 5 677 200Jersey 874 7 912 3.85 5.21 9 370 177Other 359 9 112 3.45 4.19 9 488 175All 185 328 9 795 3.52 4.30 10 278 176Source: ProAgria1) Energy-corrected milk output (milk’s butterfat, protein and lactose
content is taken into account).2) Somatic cell count, geometric mean 1000 pcs/ml.
MILKING MACHINES 2018
Milking machine type Farms %Pipeline milking 2 660 59.8Milking station 863 19.4Robotic milking 899 20.2Bucket milking machine 29 0.7Total 4 451 100.0Source: ProAgria
Animals and animal well-being
31
EconomyFOOD
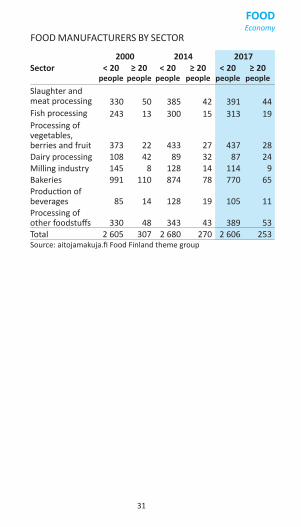
FOOD MANUFACTURERS BY SECTOR
2000 2014 2017Sector < 20
people≥ 20
people< 20
people≥ 20
people< 20
people≥ 20
peopleSlaughter and meat processing 330 50 385 42 391 44Fish processing 243 13 300 15 313 19Processing of vegetables, berries and fruit 373 22 433 27 437 28Dairy processing 108 42 89 32 87 24Milling industry 145 8 128 14 114 9Bakeries 991 110 874 78 770 65Production of beverages 85 14 128 19 105 11Processing of other foodstuffs 330 48 343 43 389 53Total 2 605 307 2 680 270 2 606 253Source: aitojamakuja.fi Food Finland theme group
32
Economy
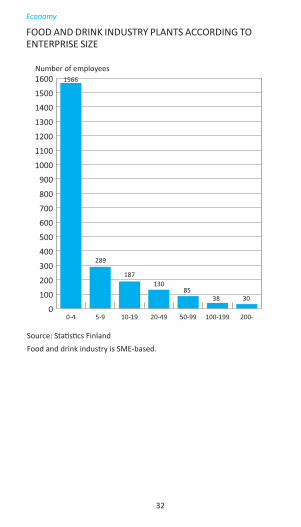
Source: Statistics FinlandFood and drink industry is SME-based.
FOOD AND DRINK INDUSTRY PLANTS ACCORDING TO ENTERPRISE SIZE
1566
289
187130
8538 30
0
100
200
300
400
500
600
700
800
900
1000
1100
1200
1300
1400
1500
1600
200-100-19950-9920-4910-195-90-4
Number of employees
33
Economy
FOO
D IN
DUST
RY K
EY S
ECTO
RSN
umbe
r of
plan
tsEm
ploy
ees
tota
l 1)Tu
rnov
er
1 00
0 €
Turn
over
1 0
00 €
/
empl
oyee
Sect
or20
1620
1720
1620
1720
1620
1720
1620
17Sl
augh
ter a
nd m
eat p
roce
ssin
g25
424
28
022
8 10
42
437
902
2 49
8 21
830
430
8Fi
sh p
rodu
cts
146
147
859
861
346
997
363
811
404
423
Frui
t and
veg
etab
les
155
159
1 93
61
979
567
744
569
958
293
288
Pro
cess
ing
and
pres
ervi
ng o
f pot
atoe
s44
4138
339
411
2 31
812
8 30
629
332
6Ed
ible
oils
and
fats
2018
147
143
59 2
3361
608
403
432
Dairy
pro
duct
s and
ice
crea
m89
844
119
4 50
42
044
459
2 04
4 29
449
645
4M
illin
g pr
oduc
ts a
nd st
arch
6565
618
615
354
053
333
999
573
543
Man
ufac
ture
of b
aker
y an
d fa
rinac
eous
pr
oduc
ts79
979
67
352
7 09
31
007
091
1 00
7 42
513
714
2M
anuf
actu
re o
f oth
er fo
od p
rodu
cts
269
283
5 88
65
934
1 81
4 54
51
885
814
308
318
S
ugar
44
268
274
197
116
238
364
735
869
C
hoco
late
, coc
oa a
nd c
onfe
ct.
4850
1 56
71
582
378
605
361
637
242
229
P
roce
ssin
g of
tea
and
coffe
e23
2446
443
136
0 00
637
5 60
877
687
2
Con
veni
ence
food
7780
1 93
51
889
376
207
383
703
194
203
F
ood
prep
arati
ons a
nd d
iete
tic fo
od9
1036
939
614
3 08
514
1 08
338
835
6
Soft
drin
ks17
719
02
807
2 77
41
214
119
1 25
3 97
443
345
2
Alc
ohol
ic b
ever
ages
2)14
816
12
517
2501
1 09
6 97
31
143
209
436
457
Food
indu
stry
, tot
al
1 88
21
879
29 9
0830
185
9 20
0 97
99
542
848
308
316
Sour
ce: S
tatis
tics F
inla
nd, r
egio
nal a
nd in
dust
rial s
tatis
tics o
n m
anuf
actu
ring
1) In
clude
s pai
d em
ploy
ees a
nd e
ntre
pren
eurs
. Em
ploy
ees a
re co
nver
ted
to a
nnua
l ful
l-tim
e em
ploy
ees s
o th
at, f
or e
xam
ple,
an
empl
oyee
w
orki
ng h
alf-ti
me
repr
esen
ts o
ne h
alf o
f a p
erso
n an
d tw
o em
ploy
ees w
orki
ng h
alf-ti
me
for o
ne ye
ar re
pres
ent o
ne a
nnua
l ful
l-tim
e em
ploy
ee.
2) D
istilli
ng a
nd m
ixin
g of
alco
holic
bev
erag
es: p
rodu
ction
of e
than
ol b
y fe
rmen
tatio
n as
wel
l as m
anuf
actu
re o
f cid
er a
nd fr
uit a
nd b
erry
win
es,
othe
r disti
lled
ferm
ente
d be
vera
ges a
nd b
eer p
rodu
ction
.
34
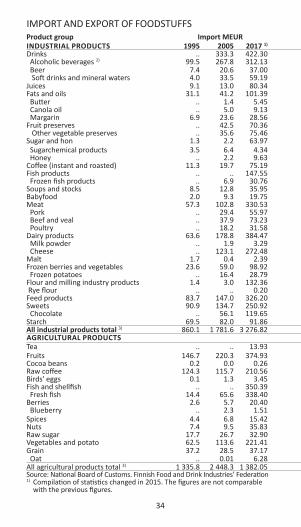
IMPORT AND EXPORT OF FOODSTUFFSProduct group Import MEUR Change Export MEUR ChangeINDUSTRIAL PRODUCTS 1995 2005 2017 1) 2018 1) 17/18 % 1995 2005 2017 1) 2018 1) 17/18 %Drinks .. 333.3 422.30 453.30 7.3 .. 90.2 182.47 173.43 -5.0 Alcoholic beverages 2) 99.5 267.8 312.13 326.23 4.5 40.1 73.4 149.01 145.50 -2.4 Beer 7.4 20.6 37.00 36.77 -0.6 19.7 11.3 14.02 12.17 -13.2 Soft drinks and mineral waters 4.0 33.5 59.19 77.83 31.5 7.4 4.8 19.45 15.75 -19.0 Juices 9.1 13.0 80.34 85.85 6.9 13.0 2.1 5.00 6.39 27.8 Fats and oils 31.1 41.2 101.39 105.47 4.0 7.0 26.5 157.16 160.78 2.3 Butter .. 1.4 5.45 5.37 -1.4 .. 85.1 137.01 138.98 1.4 Canola oil .. 5.0 9.13 14.45 58.2 .. 22.7 4.63 3.40 -26.6 Margarin 6.9 23.6 28.56 26.77 -6.3 30.7 32.7 6.51 7.72 18.5 Fruit preserves .. 42.5 70.36 65.66 -6.7 .. 3.2 2.24 2.29 2.3 Other vegetable preserves .. 35.6 75.46 79.44 5.3 .. 4.7 3.74 4.43 18.5 Sugar and honey 1.3 2.2 63.97 66.02 3.2 0.0 0.0 104.13 97.78 -6.1 Sugarchemical products 3.5 6.4 4.34 4.92 13.1 13.4 81.5 85.65 86.59 1.1 Honey .. 2.2 9.63 8.56 -11.1 .. 0.003 0.044 0.12 169.5 Coffee (instant and roasted) 11.3 19.7 75.19 77.77 3.4 21.9 8.0 37.00 30.29 -18.1 Fish products .. .. 147.55 147.14 -0.3 .. .. 17.71 16.07 -9.2 Frozen fish products .. 6.9 30.76 32.69 6.3 .. 6.1 12.04 10.37 -13.9 Soups and stocks 8.5 12.8 35.95 36.24 0.8 0.4 0.4 2.22 1.70 -23.5 Babyfood 2.0 9.3 19.75 20.92 5.9 7.4 4.9 6.64 7.57 14.0 Meat 57.3 102.8 330.53 345.90 4.6 26.4 91.5 118.27 106.61 -9.9 Pork .. 29.4 55.97 55.56 -0.7 .. 68.6 59.92 43.93 -26.7 Beef and veal .. 37.9 73.23 83.61 14.2 .. 6.4 14.92 17.63 18.1 Poultry .. 18.2 31.58 30.65 -3.0 .. 10.2 10.20 12.32 20.7 Dairy products 63.6 178.8 384.47 395.34 2.8 161.9 303.1 257.35 242.88 -5.6 Milk powder .. 1.9 3.29 3.62 10.0 .. 28.7 88.98 69.28 -22.1 Cheese .. 123.1 272.48 272.50 0.0 .. 119.7 47.22 48.06 1.8 Malt 1.7 0.4 2.39 1.31 -45.2 15.7 21.9 13.79 14.85 7.7 Frozen berries and vegetables 23.6 59.0 98.92 104.05 5.2 9.0 18.2 25.91 21.96 -15.3 Frozen potatoes .. 16.4 28.79 28.99 0.7 .. 0.2 0.32 0.09 -70.8 Flour and milling industry products 1.4 3.0 132.36 126.26 -4.6 4.3 7.7 45.96 58.58 27.5 Rye flour .. .. 0.20 0.26 26.5 .. .. 0.33 0.17 -48.8 Feed products 83.7 147.0 326.20 331.81 1.7 15.0 21.7 74.18 67.31 -9.3 Sweets 90.9 134.7 250.92 223.03 -11.1 94.9 86.3 100.44 92.35 -8.1 Chocolate .. 56.1 119.65 110.83 -7.4 .. 46.8 60.64 53.21 -12.3 Starch 69.5 82.0 91.86 94.28 2.6 8.5 15.7 10.98 11.08 0.9 All industrial products total 3) 860.1 1 781.6 3 276.82 3 224.02 -1.6 609.0 961.9 1 329.27 1 270.78 -4.4 AGRICULTURAL PRODUCTS Tea .. .. 13.93 12.44 -10.7 .. .. 0.408 0.32 -20.5 Fruits 146.7 220.3 374.93 381.62 1.8 13.0 0.8 7.76 7.45 -4.0 Cocoa beans 0.2 0.0 0.26 0.35 36.8 0.0 0.0 0.0043 0.01 244.2 Raw coffee 124.3 115.7 210.56 161.37 -23.4 2.3 0.0 24.13 4.21 -82.5 Birds' eggs 0.1 1.3 3.45 5.70 65.3 7.1 6.6 11.37 14.34 26.1 Fish and shellfish .. .. 350.39 362.23 3.4 .. .. 122.63 155.28 26.6 Fresh fish 14.4 65.6 338.40 349.06 3.1 2.3 0.0 122.49 155.18 26.7 Berries 2.6 5.7 20.40 29.27 43.5 0.8 0.2 0.54 0.01 -97.6 Blueberry .. 2.3 1.51 4.09 171.7 .. .. 0.41 0.0015 -99.6 Spices 4.4 6.8 15.42 15.68 1.7 1.5 1.9 10.27 8.53 -16.9 Nuts 7.4 9.5 35.83 33.31 -7.0 0.1 0.0 0.55 0.58 6.3 Raw sugar 17.7 26.7 32.90 6.62 -79.9 0.01 0.8 1.03 1.32 27.4 Vegetables and potato 62.5 113.6 221.41 228.13 3.0 7.2 3.9 6.39 7.46 16.7 Grain 37.2 28.5 37.17 50.50 35.9 35.8 42.3 111.26 80.31 -27.8 Oat .. 0.01 6.28 2.37 -62.3 .. 35.9 56.88 58.71 3.2 All agricultural products total 3) 1 335.8 2 448.3 1 382.05 1 359.84 -1.6 683.1 1 022.8 295.79 281.26 -4.9 Source: National Board of Customs. Finnish Food and Drink Industries’ Federation 1) Compilation of statistics changed in 2015. The figures are not comparable
with the previous figures.
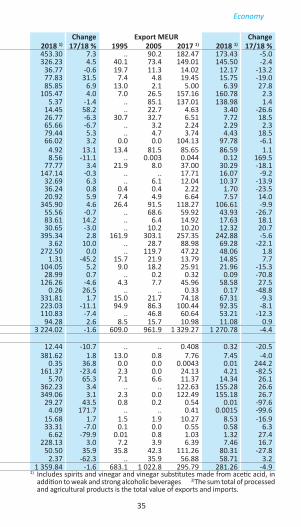
35
Economy
2) Includes spirits and vinegar and vinegar substitutes made from acetic acid, in addition to weak and strong alcoholic beverages 3)The sum total of processed and agricultural products is the total value of exports and imports.
IMPORT AND EXPORT OF FOODSTUFFSProduct group Import MEUR Change Export MEUR ChangeINDUSTRIAL PRODUCTS 1995 2005 2017 1) 2018 1) 17/18 % 1995 2005 2017 1) 2018 1) 17/18 %Drinks .. 333.3 422.30 453.30 7.3 .. 90.2 182.47 173.43 -5.0 Alcoholic beverages 2) 99.5 267.8 312.13 326.23 4.5 40.1 73.4 149.01 145.50 -2.4 Beer 7.4 20.6 37.00 36.77 -0.6 19.7 11.3 14.02 12.17 -13.2 Soft drinks and mineral waters 4.0 33.5 59.19 77.83 31.5 7.4 4.8 19.45 15.75 -19.0 Juices 9.1 13.0 80.34 85.85 6.9 13.0 2.1 5.00 6.39 27.8 Fats and oils 31.1 41.2 101.39 105.47 4.0 7.0 26.5 157.16 160.78 2.3 Butter .. 1.4 5.45 5.37 -1.4 .. 85.1 137.01 138.98 1.4 Canola oil .. 5.0 9.13 14.45 58.2 .. 22.7 4.63 3.40 -26.6 Margarin 6.9 23.6 28.56 26.77 -6.3 30.7 32.7 6.51 7.72 18.5 Fruit preserves .. 42.5 70.36 65.66 -6.7 .. 3.2 2.24 2.29 2.3 Other vegetable preserves .. 35.6 75.46 79.44 5.3 .. 4.7 3.74 4.43 18.5 Sugar and honey 1.3 2.2 63.97 66.02 3.2 0.0 0.0 104.13 97.78 -6.1 Sugarchemical products 3.5 6.4 4.34 4.92 13.1 13.4 81.5 85.65 86.59 1.1 Honey .. 2.2 9.63 8.56 -11.1 .. 0.003 0.044 0.12 169.5 Coffee (instant and roasted) 11.3 19.7 75.19 77.77 3.4 21.9 8.0 37.00 30.29 -18.1 Fish products .. .. 147.55 147.14 -0.3 .. .. 17.71 16.07 -9.2 Frozen fish products .. 6.9 30.76 32.69 6.3 .. 6.1 12.04 10.37 -13.9 Soups and stocks 8.5 12.8 35.95 36.24 0.8 0.4 0.4 2.22 1.70 -23.5 Babyfood 2.0 9.3 19.75 20.92 5.9 7.4 4.9 6.64 7.57 14.0 Meat 57.3 102.8 330.53 345.90 4.6 26.4 91.5 118.27 106.61 -9.9 Pork .. 29.4 55.97 55.56 -0.7 .. 68.6 59.92 43.93 -26.7 Beef and veal .. 37.9 73.23 83.61 14.2 .. 6.4 14.92 17.63 18.1 Poultry .. 18.2 31.58 30.65 -3.0 .. 10.2 10.20 12.32 20.7 Dairy products 63.6 178.8 384.47 395.34 2.8 161.9 303.1 257.35 242.88 -5.6 Milk powder .. 1.9 3.29 3.62 10.0 .. 28.7 88.98 69.28 -22.1 Cheese .. 123.1 272.48 272.50 0.0 .. 119.7 47.22 48.06 1.8 Malt 1.7 0.4 2.39 1.31 -45.2 15.7 21.9 13.79 14.85 7.7 Frozen berries and vegetables 23.6 59.0 98.92 104.05 5.2 9.0 18.2 25.91 21.96 -15.3 Frozen potatoes .. 16.4 28.79 28.99 0.7 .. 0.2 0.32 0.09 -70.8 Flour and milling industry products 1.4 3.0 132.36 126.26 -4.6 4.3 7.7 45.96 58.58 27.5 Rye flour .. .. 0.20 0.26 26.5 .. .. 0.33 0.17 -48.8 Feed products 83.7 147.0 326.20 331.81 1.7 15.0 21.7 74.18 67.31 -9.3 Sweets 90.9 134.7 250.92 223.03 -11.1 94.9 86.3 100.44 92.35 -8.1 Chocolate .. 56.1 119.65 110.83 -7.4 .. 46.8 60.64 53.21 -12.3 Starch 69.5 82.0 91.86 94.28 2.6 8.5 15.7 10.98 11.08 0.9 All industrial products total 3) 860.1 1 781.6 3 276.82 3 224.02 -1.6 609.0 961.9 1 329.27 1 270.78 -4.4 AGRICULTURAL PRODUCTS Tea .. .. 13.93 12.44 -10.7 .. .. 0.408 0.32 -20.5 Fruits 146.7 220.3 374.93 381.62 1.8 13.0 0.8 7.76 7.45 -4.0 Cocoa beans 0.2 0.0 0.26 0.35 36.8 0.0 0.0 0.0043 0.01 244.2 Raw coffee 124.3 115.7 210.56 161.37 -23.4 2.3 0.0 24.13 4.21 -82.5 Birds' eggs 0.1 1.3 3.45 5.70 65.3 7.1 6.6 11.37 14.34 26.1 Fish and shellfish .. .. 350.39 362.23 3.4 .. .. 122.63 155.28 26.6 Fresh fish 14.4 65.6 338.40 349.06 3.1 2.3 0.0 122.49 155.18 26.7 Berries 2.6 5.7 20.40 29.27 43.5 0.8 0.2 0.54 0.01 -97.6 Blueberry .. 2.3 1.51 4.09 171.7 .. .. 0.41 0.0015 -99.6 Spices 4.4 6.8 15.42 15.68 1.7 1.5 1.9 10.27 8.53 -16.9 Nuts 7.4 9.5 35.83 33.31 -7.0 0.1 0.0 0.55 0.58 6.3 Raw sugar 17.7 26.7 32.90 6.62 -79.9 0.01 0.8 1.03 1.32 27.4 Vegetables and potato 62.5 113.6 221.41 228.13 3.0 7.2 3.9 6.39 7.46 16.7 Grain 37.2 28.5 37.17 50.50 35.9 35.8 42.3 111.26 80.31 -27.8 Oat .. 0.01 6.28 2.37 -62.3 .. 35.9 56.88 58.71 3.2 All agricultural products total 3) 1 335.8 2 448.3 1 382.05 1 359.84 -1.6 683.1 1 022.8 295.79 281.26 -4.9 Source: National Board of Customs. Finnish Food and Drink Industries’ Federation 1) Compilation of statistics changed in 2015. The figures are not comparable
with the previous figures.

36
FOO
D EX
PORT
S BY
CO
UN
TRY
Perc
enta
ge o
f the
tota
l val
ue o
f exp
orts
1995
%20
05%
2017
1)%
2018
1)%
Russ
ia29
.5Ru
ssia
19.7
Swed
en18
.0Sw
eden
18.6
Swed
en14
.2Sw
eden
15.4
Esto
nia
8.9
Esto
nia
8.1
Esto
nia
6.9
Esto
nia
9.2
Russ
ia7.
3Fr
ance
6.7
Germ
any
5.1
U.S.
5.9
Fran
ce6.
0Ru
ssia
5.9
Belg
ium
4.4
Germ
any
5.3
Germ
any
4.6
Germ
any
5.6
Nor
way
3.7
UK
4.4
Denm
ark
4.5
Denm
ark
5.0
U.S.
3.6
Pola
nd3.
2Po
land
3.7
Pola
nd4.
2U
K3.
4N
orw
ay2.
9Th
e N
ethe
rland
s3.
4Th
e N
ethe
rland
s3.
9De
nmar
k3.
2De
nmar
k2.
8U
K3.
2Ch
ina
3.1
The
Net
herla
nds
2.8
Fran
ce2.
8Li
thua
nia
2.7
Lith
uani
a3.
0O
ther
s23
.2O
ther
s28
.4O
ther
s38
.3O
ther
s35
.9To
tal
100
Tota
l10
0To
tal
100
100
Sour
ce: N
ation
al B
oard
of C
usto
ms.
Fin
nish
Foo
d an
d Dr
ink
Indu
strie
s’ F
eder
ation
1)
Com
pila
tion
of st
atisti
cs c
hang
ed fr
om 2
014.
The
figu
res a
re n
ot c
ompa
rabl
e w
ith th
e pr
evio
us fi
gure
s.
Economy

37
FOOD
EXP
ORTS
BY
COUN
TRY
AND
PROD
UCT
GROU
P, EX
PORT
S 20
18
Economy
Russ
ia€
thou
sand
Com
poun
d fe
edin
g-
stuff
s17
681
Oth
er fo
odst
uffs
9 56
3Al
coho
lic b
ever
ages
9 18
7O
ther
bak
ery
prod
ucts
7 03
3M
alts
9 07
0Ch
ocol
ate
5 48
2O
ther
cer
eal p
rodu
cts
5 18
5Co
ffee,
raw
3 85
0O
ther
gra
in m
ill p
rodu
cts
3 75
3Be
er3
236
Oth
er20
703
Tota
l94
743
EU€
thou
sand
Fish
, fre
sh15
0 91
5Bu
tter a
nd o
ther
fats
and
oi
ls de
rived
from
milk
122
665
Alco
holic
bev
erag
es11
0 09
8O
at50
816
Oth
er m
ilk p
rodu
cts
41 9
17Ch
ocol
ate
40 2
07Ch
eese
28 2
12Co
ffee,
roas
ted
27 5
90O
ther
swee
ts26
771
Yogh
urt
24 8
94O
ther
394
308
Tota
l1
018
393
Oth
er c
ount
ries
€ th
ousa
ndM
ilk p
owde
r52
110
Pork
29 6
42O
ther
milk
pro
duct
s26
572
Alco
holic
bev
erag
es26
214
Chee
se19
763
Raw
mat
eria
ls fo
r fee
dstu
ff18
129
Butte
r and
oth
er fa
ts a
nd
oils
deriv
ed fr
om m
ilk15
418
Oth
er m
eat a
nd a
nim
al p
arts
8 97
1O
at7
898
Choc
olat
e7
519
Oth
er65
163
Tota
l27
7 39
9
Sour
ce: N
ation
al B
oard
of C
usto
ms,
Fin
nish
Foo
d an
d Dr
inks
Indu
strie
s’ F
eder
ation

38
THE SHARE OF FOOD INDUSTRY’S R&D COSTS(% of production)
Source: Statistics Finland, FoodDrinkEurope
CONSUMPTION EXPENDITURE
Private consumption expenditure at current prices, MEUR
1995 2005 2016 2017
Food and non-alcoholic beverages 7 411 9 381 13 528 13 403Share of food and non- alcoholic beverages in con-sumption expenditure, % 15 12 12 12Alcoholic beverages and tobacco 2 976 4 052 5 034 5 007Clothing and footwear 2 218 3 771 4 785 4 805Housing and energy 11 889 19 253 31 947 33 227Household equipment 2 132 4 147 5 368 5 461Health 1 631 3 367 5 240 5 419Transport 5 924 10 438 13 254 13 766Telecommunications 780 2 185 2 611 2 683Recreation and culture 5 087 9 094 11 829 12 144Education 228 333 447 460Hotels, cafés and restau-rants 3 383 5 259 7 243 7 642Other goods and services 4 709 7 074 11 078 11 240Source: Statistics Finland, National Accounts
Economy
0.650.46
0.550.23
0.64
0.63Japan 2015US 2015
EU-28, 2015Finland 2017Finland 2016Finland 2010

39
REAL PRICE DEVELOPMENT OF FOOD IN FINLAND 2005–2018
Source: Statistics Finland
FOOD EXPENDITURE
Food expen-diture of households, per capita
1995€/y %
2005€/y %
2016 €/y %
2017€/y %
Bread and cereal products 232 17 301 18 363 16 364 16Meat and meat products 311 23 359 21 474 21 466 20Fish and fish products 58 4 73 4 124 5 132 6Milk, cheese and eggs 248 18 308 18 437 19 426 19Fats and oils 42 3 39 2 40 2 40 2Fruit and vegetables 190 14 287 17 441 19 437 19Potatoes and potato products 45 3 45 3 58 3 55 2Sugar 21 2 14 1 11 0 13 1Coffee, tea and cocoa 69 5 45 3 74 3 76 3Other goods 1) 150 11 203 12 281 12 264 12Total 1 365 100 1 674 100 2 303 100 2 273 100Source: Statistics Finland, National Accounts1) Other drinks are not included.
Economy
0
50
100
150
200
Consumer price, breadConsumer prices, foodCereals (Includes seeds)Manufacture of food products
2018
2017
2016
2015
2014
2013
2012
2011
2010
2009
2008
2007
2006
2005
40
RETAIL PRICES
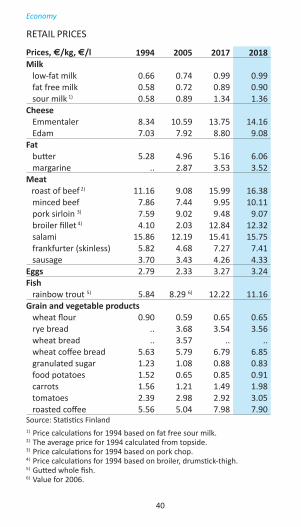
Prices, €/kg, €/l 1994 2005 2017 2018Milk low-fat milk 0.66 0.74 0.99 0.99 fat free milk 0.58 0.72 0.89 0.90 sour milk 1) 0.58 0.89 1.34 1.36Cheese Emmentaler 8.34 10.59 13.75 14.16 Edam 7.03 7.92 8.80 9.08Fat butter 5.28 4.96 5.16 6.06 margarine .. 2.87 3.53 3.52Meat roast of beef 2) 11.16 9.08 15.99 16.38 minced beef 7.86 7.44 9.95 10.11 pork sirloin 3) 7.59 9.02 9.48 9.07 broiler fillet 4) 4.10 2.03 12.84 12.32 salami 15.86 12.19 15.41 15.75 frankfurter (skinless) 5.82 4.68 7.27 7.41 sausage 3.70 3.43 4.26 4.33Eggs 2.79 2.33 3.27 3.24Fish rainbow trout 5) 5.84 8.29 6) 12.22 11.16Grain and vegetable products wheat flour 0.90 0.59 0.65 0.65 rye bread .. 3.68 3.54 3.56 wheat bread .. 3.57 .. .. wheat coffee bread 5.63 5.79 6.79 6.85 granulated sugar 1.23 1.08 0.88 0.83 food potatoes 1.52 0.65 0.85 0.91 carrots 1.56 1.21 1.49 1.98 tomatoes 2.39 2.98 2.92 3.05 roasted coffee 5.56 5.04 7.98 7.90Source: Statistics Finland1) Price calculations for 1994 based on fat free sour milk.2) The average price for 1994 calculated from topside.3) Price calculations for 1994 based on pork chop.4) Price calculations for 1994 based on broiler, drumstick-thigh.5) Gutted whole fish.6) Value for 2006.
Economy
41
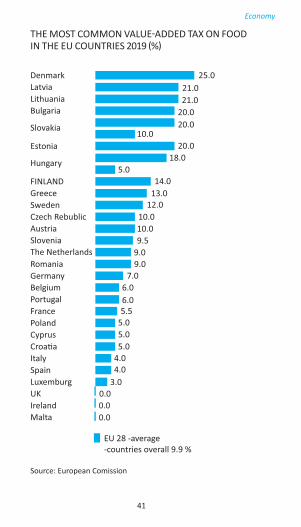
THE MOST COMMON VALUE-ADDED TAX ON FOOD IN THE EU COUNTRIES 2019 (%)
Economy
Source: European Comission
25.021.021.0
20.020.0
10.0
14.013.0
12.010.010.09.5
9.09.0
7.0
6.05.5
5.0
5.05.05.0
4.04.0
3.00.00.0
6.0
EU 28 -average-countries overall 9.9 %
20.018.0
0.0MaltaIrelandUKLuxemburgSpainItalyCroa�aCyprusPolandFrancePortugalBelgium
The Netherlands
GermanyRomania
SloveniaAustriaCzech RebublicSwedenGreeceFINLAND
Hungary
Estonia
Slovakia
BulgariaLithuaniaLatviaDenmark

42
PRIC
E IN
DEXE
S 201
7 (E
U15=
100)
Hous
ehol
d co
nsum
p-tio
n ex
pen-
ditu
re
Food
and
no
n-
alco
holic
be
vera
ges
Food
Brea
d an
d gr
ain
prod
ucts
Mea
t an
d m
eat
prod
ucts
Fish
an
d fis
h pr
oduc
ts
Milk
, ch
eese
an
d eg
gs
Fats
an
d oi
ls
Frui
t, ve
geta
-bl
es a
nd
pota
toes
Oth
er
food
-st
uffs
Non
-al-
coho
lic
beve
r-ag
esTh
e Net
herla
nds
106.
795
.995
.485
.811
1.6
100.
097
.891
.495
.885
.999
.8Be
lgiu
m10
4.5
107.
210
6.6
106.
811
4.3
108.
510
7.9
111.
598
.510
0.6
112.
4Sp
ain
87.2
90.6
90.7
102.
180
.785
.294
.284
.793
.498
.588
.9Ire
land
120.
111
7.3
115.
311
6.0
99.1
110.
112
2.2
109.
912
0.4
136.
413
7.2
UK
109.
489
.187
.681
.686
.379
.590
.785
.791
.093
.410
4.0
Italy
94.5
105.
210
6.7
110.
710
7.8
103.
511
3.8
96.9
101.
110
8.3
91.1
Aust
ria10
4.9
118.
311
9.3
126.
413
2.2
130.
810
4.3
126.
411
9.1
107.
211
0.6
Gree
ce77
.210
1.4
100.
010
8.6
84.1
107.
413
1.9
119.
877
.113
3.0
117.
6Lu
xem
bour
g13
0.2
117.
811
8.8
119.
512
6.6
112.
312
8.2
121.
011
0.8
112.
011
2.3
Port
ugal
77.7
94.4
92.5
91.5
76.9
94.2
107.
710
7.2
86.3
128.
111
9.0
Fran
ce99
.610
8.1
109.
010
4.6
118.
311
2.9
97.8
108.
211
4.5
103.
499
.4Sw
eden
125.
111
6.8
117.
312
2.9
113.
811
5.9
116.
212
0.3
122.
311
6.1
113.
6Ge
rman
y96
.595
.595
.494
.995
.312
0.4
90.6
103.
297
.792
.497
.4Fi
nlan
d11
4.7
112.
611
1.5
120.
110
9.5
110.
611
2.8
95.4
117.
210
7.7
122.
9De
nmar
k12
9.3
125.
212
4.7
145.
311
0.8
129.
511
4.7
115.
811
1.9
160.
213
2.3
EU-1
510
010
010
010
010
010
010
010
010
010
010
0So
urce
: Eur
osta
t/ K
anta
r TN
S Ag
ri Lt
d
Economy
43
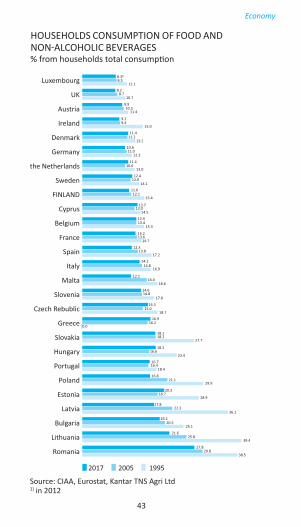
HOUSEHOLDS CONSUMPTION OF FOOD AND NON-ALCOHOLIC BEVERAGES% from households total consumption
Source: CIAA, Eurostat, Kantar TNS Agri Ltd1) in 2012
Economy
199520052017
Romania
Lithuania
Bulgaria
Latvia
Estonia
Poland
Portugal
Hungary
Slovakia
Greece
Czech Rebublic
Slovenia
Malta
Italy
Spain
France
Belgium
Cyprus
FINLAND
Sweden
the Netherlands
Germany
Denmark
Ireland
Austria
UK
Luxembourg
8.31)
8.5
8.28.7
11.1
10.7
9.910.3
11.4
9.29.4
15.0
11.411.2
13.210.611.0
12.3
11.410.6
13.0
12.412.0
14.111.612.1
15.4
13.713.0
14.513.413.4
15.3
13.213.6
14.7
12.313.8
17.214.2
14.816.9
12.116.0
18.614.614.8
17.8
16.315.0
18.716.9
16.20.0
18.1
16.6
27.7
18.2
18.2
23.4
16.716.4
18.4
16.821.1
29.9
20.318.7
28.9
17.822.3
36.119.2
20.525.1
21.625.8
39.4
27.829.8
38.5
44
Economy
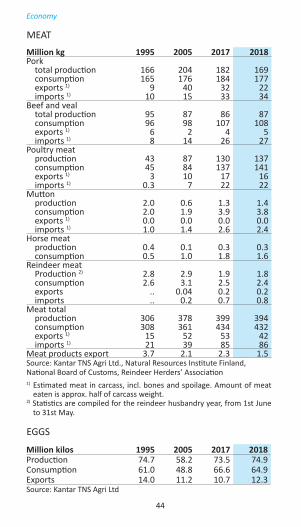
EGGS
Million kilos 1995 2005 2017 2018Production 74.7 58.2 73.5 74.9Consumption 61.0 48.8 66.6 64.9Exports 14.0 11.2 10.7 12.3Source: Kantar TNS Agri Ltd
MEAT
Million kg 1995 2005 2017 2018Pork total production 166 204 182 169 consumption 165 176 184 177 exports 1) 9 40 32 22 imports 1) 10 15 33 34Beef and veal total production 95 87 86 87 consumption 96 98 107 108 exports 1) 6 2 4 5 imports 1) 8 14 26 27Poultry meat production 43 87 130 137 consumption 45 84 137 141 exports 1) 3 10 17 16 imports 1) 0.3 7 22 22Mutton production 2.0 0.6 1.3 1.4 consumption 2.0 1.9 3.9 3.8 exports 1) 0.0 0.0 0.0 0.0 imports 1) 1.0 1.4 2.6 2.4Horse meat production 0.4 0.1 0.3 0.3 consumption 0.5 1.0 1.8 1.6Reindeer meat Production 2) 2.8 2.9 1.9 1.8 consumption 2.6 3.1 2.5 2.4 exports .. 0.04 0.2 0.2 imports .. 0.2 0.7 0.8Meat total production 306 378 399 394 consumption 308 361 434 432 exports 1) 15 52 53 42 imports 1) 21 39 85 86Meat products export 3.7 2.1 2.3 1.5Source: Kantar TNS Agri Ltd., Natural Resources Institute Finland,National Board of Customs, Reindeer Herders’ Association1) Estimated meat in carcass, incl. bones and spoilage. Amount of meat
eaten is approx. half of carcass weight.2) Statistics are compiled for the reindeer husbandry year, from 1st June
to 31st May.
45
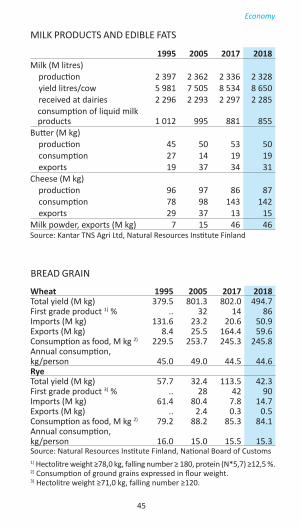
MILK PRODUCTS AND EDIBLE FATS
1995 2005 2017 2018Milk (M litres) production 2 397 2 362 2 336 2 328 yield litres/cow 5 981 7 505 8 534 8 650 received at dairies 2 296 2 293 2 297 2 285
consumption of liquid milk products 1 012 995 881 855
Butter (M kg) production 45 50 53 50 consumption 27 14 19 19 exports 19 37 34 31Cheese (M kg) production 96 97 86 87 consumption 78 98 143 142 exports 29 37 13 15Milk powder, exports (M kg) 7 15 46 46Source: Kantar TNS Agri Ltd, Natural Resources Institute Finland
Economy
BREAD GRAIN
Wheat 1995 2005 2017 2018Total yield (M kg) 379.5 801.3 802.0 494.7First grade product 1) % .. 32 14 86Imports (M kg) 131.6 23.2 20.6 50.9Exports (M kg) 8.4 25.5 164.4 59.6Consumption as food, M kg 2) 229.5 253.7 245.3 245.8Annual consumption, kg/person 45.0 49.0 44.5 44.6RyeTotal yield (M kg) 57.7 32.4 113.5 42.3First grade product 3) % .. 28 42 90Imports (M kg) 61.4 80.4 7.8 14.7Exports (M kg) .. 2.4 0.3 0.5Consumption as food, M kg 2) 79.2 88.2 85.3 84.1Annual consumption, kg/person 16.0 15.0 15.5 15.3Source: Natural Resources Institute Finland, National Board of Customs1) Hectolitre weight ≥78,0 kg, falling number ≥ 180, protein (N*5,7) ≥12,5 %.2) Consumption of ground grains expressed in flour weight.3) Hectolitre weight ≥71,0 kg, falling number ≥120.
46
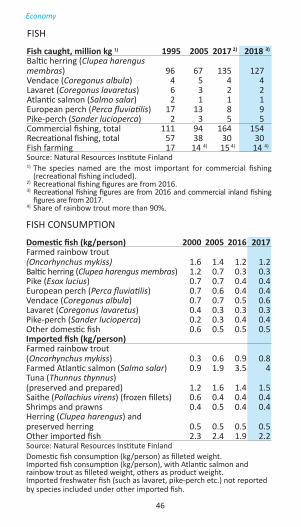
FISH
Fish caught, million kg 1) 1995 2005 2017 2) 2018 3)
Baltic herring (Clupea harengus membras) 96 67 135 127Vendace (Coregonus albula) 4 5 4 4Lavaret (Coregonus lavaretus) 6 3 2 2Atlantic salmon (Salmo salar) 2 1 1 1European perch (Perca fluviatilis) 17 13 8 9Pike-perch (Sander lucioperca) 2 3 5 5Commercial fishing, total 111 94 164 154Recreational fishing, total 57 38 30 30Fish farming 17 14 4) 15 4) 14 4)
Source: Natural Resources Institute Finland 1) The species named are the most important for commercial fishing
(recreational fishing included).2) Recreational fishing figures are from 2016.3) Recreational fishing figures are from 2016 and commercial inland fishing
figures are from 2017.4) Share of rainbow trout more than 90%.
Economy
FISH CONSUMPTION
Domestic fish (kg/person) 2000 2005 2016 2017Farmed rainbow trout (Oncorhynchus mykiss) 1.6 1.4 1.2 1.2Baltic herring (Clupea harengus membras) 1.2 0.7 0.3 0.3Pike (Esox lucius) 0.7 0.7 0.4 0.4European perch (Perca fluviatilis) 0.7 0.6 0.4 0.4Vendace (Coregonus albula) 0.7 0.7 0.5 0.6Lavaret (Coregonus lavaretus) 0.4 0.3 0.3 0.3Pike-perch (Sander lucioperca) 0.2 0.3 0.4 0.4Other domestic fish 0.6 0.5 0.5 0.5Imported fish (kg/person)Farmed rainbow trout (Oncorhynchus mykiss) 0.3 0.6 0.9 0.8Farmed Atlantic salmon (Salmo salar) 0.9 1.9 3.5 4Tuna (Thunnus thynnus) (preserved and prepared) 1.2 1.6 1.4 1.5Saithe (Pollachius virens) (frozen fillets) 0.6 0.4 0.4 0.4Shrimps and prawns 0.4 0.5 0.4 0.4Herring (Clupea harengus) and preserved herring 0.5 0.5 0.5 0.5Other imported fish 2.3 2.4 1.9 2.2Source: Natural Resources Institute Finland Domestic fish consumption (kg/person) as filleted weight. Imported fish consumption (kg/person), with Atlantic salmon and rainbow trout as filleted weight, others as product weight. Imported freshwater fish (such as lavaret, pike-perch etc.) not reported by species included under other imported fish.
47
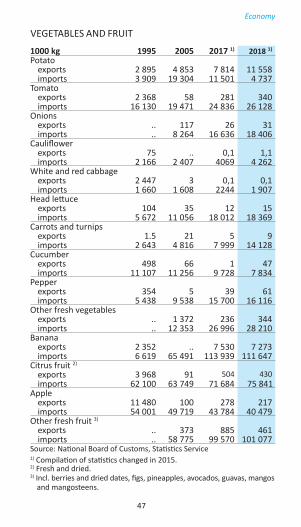
VEGETABLES AND FRUIT
1000 kg 1995 2005 2017 1) 2018 1)
Potatoexports 2 895 4 853 7 814 11 558imports 3 909 19 304 11 501 4 737
Tomatoexports 2 368 58 281 340imports 16 130 19 471 24 836 26 128
Onionsexports .. 117 26 31imports .. 8 264 16 636 18 406
Cauliflowerexports 75 .. 0,1 1,1imports 2 166 2 407 4069 4 262
White and red cabbageexports 2 447 3 0,1 0,1imports 1 660 1 608 2244 1 907
Head lettuceexports 104 35 12 15imports 5 672 11 056 18 012 18 369
Carrots and turnipsexports 1.5 21 5 9imports 2 643 4 816 7 999 14 128
Cucumberexports 498 66 1 47imports 11 107 11 256 9 728 7 834
Pepperexports 354 5 39 61imports 5 438 9 538 15 700 16 116
Other fresh vegetablesexports .. 1 372 236 344imports .. 12 353 26 996 28 210
Bananaexports 2 352 .. 7 530 7 273imports 6 619 65 491 113 939 111 647
Citrus fruit 2)
exports 3 968 91 504 430imports 62 100 63 749 71 684 75 841
Appleexports 11 480 100 278 217imports 54 001 49 719 43 784 40 479
Other fresh fruit 3)
exports .. 373 885 461imports .. 58 775 99 570 101 077
Source: National Board of Customs, Statistics Service1) Compilation of statistics changed in 2015. 2) Fresh and dried.3) Incl. berries and dried dates, figs, pineapples, avocados, guavas, mangos
and mangosteens.
Economy
48
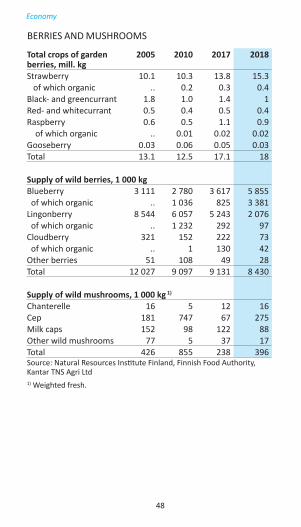
BERRIES AND MUSHROOMS
Total crops of garden berries, mill. kg
2005 2010 2017 2018
Strawberry 10.1 10.3 13.8 15.3 of which organic .. 0.2 0.3 0.4Black- and greencurrant 1.8 1.0 1.4 1Red- and whitecurrant 0.5 0.4 0.5 0.4Raspberry 0.6 0.5 1.1 0.9 of which organic .. 0.01 0.02 0.02Gooseberry 0.03 0.06 0.05 0.03Total 13.1 12.5 17.1 18
Supply of wild berries, 1 000 kgBlueberry 3 111 2 780 3 617 5 855 of which organic .. 1 036 825 3 381Lingonberry 8 544 6 057 5 243 2 076 of which organic .. 1 232 292 97Cloudberry 321 152 222 73 of which organic .. 1 130 42Other berries 51 108 49 28Total 12 027 9 097 9 131 8 430
Supply of wild mushrooms, 1 000 kg 1)
Chanterelle 16 5 12 16Cep 181 747 67 275Milk caps 152 98 122 88Other wild mushrooms 77 5 37 17Total 426 855 238 396Source: Natural Resources Institute Finland, Finnish Food Authority, Kantar TNS Agri Ltd1) Weighted fresh.
Economy
49
Economy
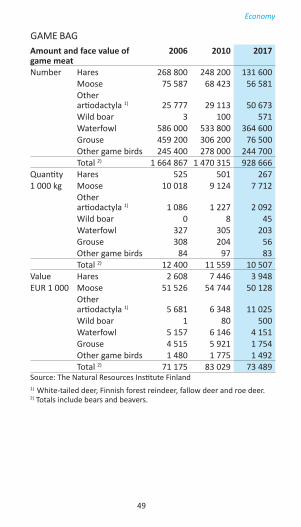
GAME BAGAmount and face value of game meat
2006 2010 2017
Number Hares 268 800 248 200 131 600Moose 75 587 68 423 56 581Other artiodactyla 1) 25 777 29 113 50 673Wild boar 3 100 571Waterfowl 586 000 533 800 364 600Grouse 459 200 306 200 76 500Other game birds 245 400 278 000 244 700Total 2) 1 664 867 1 470 315 928 666
Quantity Hares 525 501 2671 000 kg Moose 10 018 9 124 7 712
Other artiodactyla 1) 1 086 1 227 2 092Wild boar 0 8 45Waterfowl 327 305 203Grouse 308 204 56Other game birds 84 97 83Total 2) 12 400 11 559 10 507
Value Hares 2 608 7 446 3 948EUR 1 000 Moose 51 526 54 744 50 128
Other artiodactyla 1) 5 681 6 348 11 025Wild boar 1 80 500Waterfowl 5 157 6 146 4 151Grouse 4 515 5 921 1 754Other game birds 1 480 1 775 1 492Total 2) 71 175 83 029 73 489
Source: The Natural Resources Institute Finland 1) White-tailed deer, Finnish forest reindeer, fallow deer and roe deer. 2) Totals include bears and beavers.
50
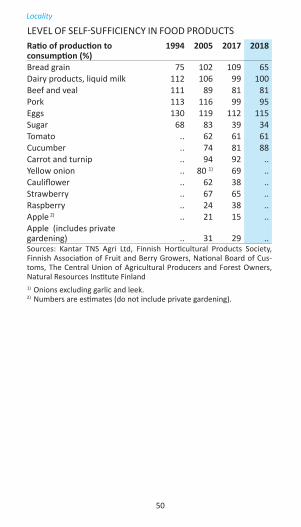
LEVEL OF SELF-SUFFICIENCY IN FOOD PRODUCTSRatio of production to consumption (%)
1994 2005 2017 2018
Bread grain 75 102 109 65Dairy products, liquid milk 112 106 99 100Beef and veal 111 89 81 81Pork 113 116 99 95Eggs 130 119 112 115Sugar 68 83 39 34Tomato .. 62 61 61Cucumber .. 74 81 88Carrot and turnip .. 94 92 ..Yellow onion .. 80 1) 69 ..Cauliflower .. 62 38 ..Strawberry .. 67 65 ..Raspberry .. 24 38 ..Apple 2) .. 21 15 ..Apple (includes private gardening) .. 31 29 ..Sources: Kantar TNS Agri Ltd, Finnish Horticultural Products Society, Finnish Association of Fruit and Berry Growers, National Board of Cus-toms, The Central Union of Agricultural Producers and Forest Owners, Natural Resources Institute Finland1) Onions excluding garlic and leek. 2) Numbers are estimates (do not include private gardening).
Locality
51
Locality
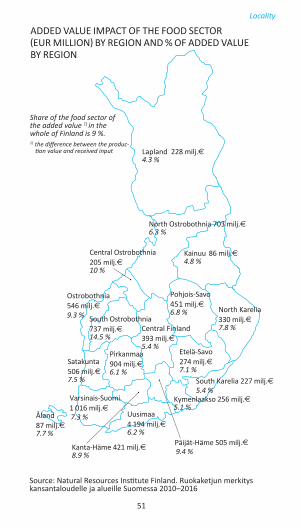
ADDED VALUE IMPACT OF THE FOOD SECTOR (EUR MILLION) BY REGION AND % OF ADDED VALUE BY REGION
Source: Natural Resources Institute Finland. Ruokaketjun merkitys kansantaloudelle ja alueille Suomessa 2010–2016
Share of the food sector of the added value 1) in the whole of Finland is 9 %.1) the difference between the produc-
tion value and received input Lapland 228 milj.€ 4.3 %
North Ostrobothnia 703 milj.€ 6.3 %
Kainuu 86 milj.€ 4.8 %
Central Ostrobothnia 205 milj.€ 10 %
South Ostrobothnia 737 milj.€ 14.5 %
Satakunta 506 milj.€ 7.5 %
Ostrobothnia 546 milj.€ 9.3 %
Åland 87 milj.€ 7.7 %
Varsinais-Suomi 1 016 milj.€ 7.3 %
Central Finland 393 milj.€ 5.4 %
North Karelia 330 milj.€ 7.8 %
Etelä-Savo 274 milj.€ 7.1 %
Pirkanmaa 904 milj.€ 6.1 %
South Karelia 227 milj.€ 5.4 %
Kymenlaakso 256 milj.€ 5.1 %
Uusimaa 4 194 milj.€ 6.2 %
Päijät-Häme 505 milj.€ 9.4 %
Pohjois-Savo451 milj.€ 6.8 %
Kanta-Häme 421 milj.€ 8.9 %
52
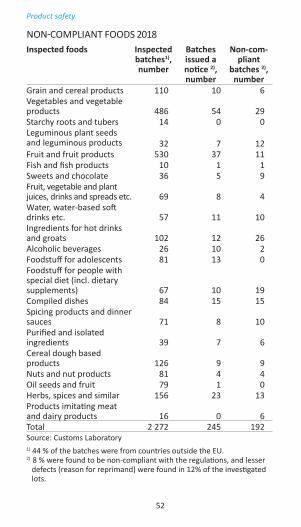
NON-COMPLIANT FOODS 2018Inspected foods Inspected
batches1), number
Batches issued a notice 2), number
Non-com-pliant
batches 2), number
Grain and cereal products 110 10 6Vegetables and vegetable products 486 54 29Starchy roots and tubers 14 0 0Leguminous plant seeds and leguminous products 32 7 12Fruit and fruit products 530 37 11Fish and fish products 10 1 1Sweets and chocolate 36 5 9Fruit, vegetable and plant juices, drinks and spreads etc. 69 8 4Water, water-based soft drinks etc. 57 11 10Ingredients for hot drinks and groats 102 12 26Alcoholic beverages 26 10 2Foodstuff for adolescents 81 13 0Foodstuff for people with special diet (incl. dietary supplements) 67 10 19Compiled dishes 84 15 15Spicing products and dinner sauces 71 8 10Purified and isolated ingredients 39 7 6Cereal dough based products 126 9 9Nuts and nut products 81 4 4Oil seeds and fruit 79 1 0Herbs, spices and similar 156 23 13Products imitating meat and dairy products 16 0 6Total 2 272 245 192Source: Customs Laboratory1) 44 % of the batches were from countries outside the EU.2) 8 % were found to be non-compliant with the regulations, and lesser
defects (reason for reprimand) were found in 12% of the investigated lots.
Product safety
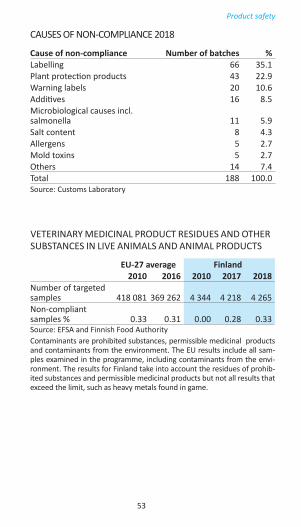
53
Product safety
VETERINARY MEDICINAL PRODUCT RESIDUES AND OTHER SUBSTANCES IN LIVE ANIMALS AND ANIMAL PRODUCTS
EU-27 average Finland2010 2016 2010 2017 2018
Number of targeted samples 418 081 369 262 4 344 4 218 4 265Non-compliant samples % 0.33 0.31 0.00 0.28 0.33Source: EFSA and Finnish Food AuthorityContaminants are prohibited substances, permissible medicinal products and contaminants from the environment. The EU results include all sam-ples examined in the programme, including contaminants from the envi-ronment. The results for Finland take into account the residues of prohib-ited substances and permissible medicinal products but not all results that exceed the limit, such as heavy metals found in game.
CAUSES OF NON-COMPLIANCE 2018
Cause of non-compliance Number of batches %Labelling 66 35.1Plant protection products 43 22.9Warning labels 20 10.6Additives 16 8.5Microbiological causes incl. salmonella 11 5.9Salt content 8 4.3Allergens 5 2.7Mold toxins 5 2.7Others 14 7.4Total 188 100.0Source: Customs Laboratory

54
FOO
D CO
NTR
OL F
IGU
RES 2
018
Insp
ectio
ns, n
umbe
rPr
imar
y pr
oduc
tion
1)M
anuf
actu
re
and
pack
agin
gDi
strib
ution
an
d tr
ans-
port
Reta
il sa
les
Serv
ice
sect
orTo
tal
Num
ber o
f est
ablis
hmen
ts38
034
3 42
82
197
11 3
0633
659
88 6
24N
umbe
r of e
stab
lishm
ents
insp
ecte
d77
81
491
391
3 61
314
190
20 4
63N
umbe
r of i
nspe
ction
s85
22
902
518
4 76
817
305
26 3
45N
umbe
r of e
stab
lishm
ents
com
mitti
ng
infr
inge
men
ts39
825
737
472
1 64
52
809
Type
of i
nfrin
gem
ent
Hygi
ene
(HAC
CP, t
rain
ing)
..12
020
175
707
1 02
2Ge
nera
l hyg
iene
..28
420
427
1 83
72
568
Com
positi
on..
148
100
32Q
ualit
y an
d co
ntam
inan
ts..
80
639
53La
belli
ng a
nd p
rese
ntati
on..
7120
182
122
395
Oth
er..
503
8383
219
Sour
ce: F
inni
sh F
ood
Auth
ority
, Rep
ort o
n th
e im
plem
enta
tion
of th
e M
ulti-
annu
al N
ation
al F
ood
Chai
n Co
ntro
l Aud
it Pl
an 2
015–
2019
in
201
8
1) P
rimar
y pr
oduc
tion
data
of f
oods
miss
ing
as c
ompr
ehen
sive
info
rmati
on n
ot a
vaila
ble
in 2
018.
Product safety

55
NUMBER OF RECALLS 2005 2010 2017 2018
Recalls 1), number 28 84 158 168Source: Finnish Food Authority 1) Incl. both retailer and mass caterer recalls. The statistics for different years
are not fully comparable, as recording methods have been defined.Includes even incidents where there were no more products available on the markets as the information reached Finland.
Product safety
REASONS FOR PRODUCT WITHDRAWALS 2018
Muut
Hyväksymättömät uuselintarvikkeet
Pakkausmerkintävirheet
Fysikaaliset virheet, liukenemiset
Allergeenit
Pestisidit, toksiinit, lisäaineylitykset ym.
Mikrobiologiset
Microbiological 18 %
Allergens 21 %
Pes�cides, toxins, excessive use of addi�ves etc. 22 %
Physical defects, dissolu�on 22 %
Labelling errors 8 %
Unauthorised novel foods 2 %
Other 7 %
Source: Finnish Food Authority
FOOD AND WATER BORNE OUTBREAKS AND NUMBER OF PERSONS AFFECTED 2018Disease-causing agent Number of
outbreaksNumber of persons
affectedN=75 N=1 947 %
Food borneBacillus cereus 2 25 2 Campylobacter 3 21 1 Clostridium perfringens 1 36 2 Listeria monocytogenes 1 30 2 Salmonella 5 56 4 Yersinia enterocolitica 2 22 1 Norovirus 25 958 65 Kryptosporidi 1 21 1 Histamine 1 2 0,1 Unknown 32 304 21 Total 73 1475 100WaterborneNorovirus + sapovirus + several other pathogens
1 463
Norovirus 1 9Total 2 472Source: Finnish Food Authority
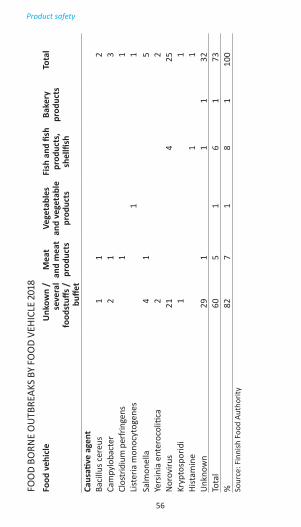
56
FOO
D BO
RNE
OU
TBRE
AKS
BY F
OO
D VE
HICL
E 20
18
Fo
od v
ehic
leU
nkow
n /
seve
ral
food
stuff
s /
buffe
t
Mea
t an
d m
eat
prod
ucts
Vege
tabl
es
and
vege
tabl
e pr
oduc
ts
Fish
and
fish
pr
oduc
ts,
shel
lfish
Bake
ry
prod
ucts
Tota
l
Caus
ative
age
ntBa
cillu
s cer
eus
11
2Ca
mpy
loba
cter
21
3Cl
ostr
idiu
m p
erfri
ngen
s1
1Li
ster
ia m
onoc
ytog
enes
11
Salm
onel
la4
15
Yers
inia
ent
eroc
oliti
ca2
2N
orov
irus
214
25Kr
ypto
spor
idi
11
Hist
amin
e1
1U
nkno
wn
291
11
32To
tal
605
16
173
%82
7
1 8
1 10
0 So
urce
: Fin
nish
Foo
d Au
thor
ity
Product safety

57
NutritionFOOD CONSUMPTION PER CAPITA IN FINLAND AND IN THE EU
Consumption kg/capita
1995 2005 2011 2017 2018 EU-28 1)
Grain 69.8 78.8 78.8 80.3 79.1 127.3Meat, total 60.3 73.0 77.6 81.0 81.3 85 2)
beef and veal 18.8 18.6 18.6 19.4 19.3 15.4 2)
pork 32.0 33.5 36.4 33.4 32.5 38.4 2)
poultry meat 9.0 16.1 18.2 24.9 25.6 24.1 3)
other meat 0.6 4.8 4.4 .. .. 2.8Liquid milk
products, total (litres) 203.0 187.8 181.8 159.9 150.7 236.4
milk 145.6 134.6 127.6 115.6 110.1 .. sour milk
products 37.1 36.8 40.7 31.9 31.6 .. cream (incl. sour
cream products) 6.8 6.6 8.8 9.3 9.0 3.9Butter 5.5 2.6 4.0 3.5 3.5 4.2 3)
Vegetable oils 4.3 5.3 5.5 .. .. 19.6Cheese 4) 14.8 17.2 21.0 25.8 25.7 19.3 3)
Eggs 11.8 9.3 10.0 11.9 11.8 12.5 3)
Sugar 35.4 32.0 30.1 30.6 29.2 31.7Fruit 5) 43.6 54.5 58.8 65.4 65.4 103.7Vegetables 6) 61.7 68.3 62.6 63.8 63.5 109.4Fish (fillet/product weight) 14.0 14.1 14.9 .. .. ..Coffee (roasted) 8.3 9.8 9.7 9.6 9.9 4.8Soft drinks (litres) 45.8 52.0 56.0 52.8 7) 53.0 ..Beer (litres) 8) 82.5 84.0 85.4 75.0 73.3 67.1Wine (litres) 8) 8.2 10.8 12.6 11.6 11.4 22.8Spirits (litres) 8) 4.9 6.6 5.4 4.4 4.2 ..Source: Source: Kantar TNS Agri Ltd, Natural Resources Institute Finland, FAO -Statistics Division - Food Balance Sheet, Canadean, ICO (International Coffee Organization), The Finnish Food and Drink Industries’ Federation, Federation of The Brewing and Soft Drinks Industry1) In 2013. Food product group specifications do not concern EU figures.2) In 20183) In 2017.4) Includes non-flavoured curd and cottage cheese.5) Excluding fruit juices and berries.6) From 2011 onwards, no frozen or preserved vegetables.7) The number is an estimate from the previous year.8) The numbers don't include private imports.

58
NutritionAVERAGE DAILY INTAKE OF ENERGY-YIELDING NUTRIENTS AND FIBRE AND PERCENTAGE OUT OF THE TOTAL ENERGY INTAKE
2012 2017Men Women Men Women Recom-
mendationProtein, g
Intake per day 95.0 72.0 98.0 73.0E % 1) 17.3 17.2 18.0 17.5 10–20 E %
Fat, 2) gIntake per day 93.0 71.0 97.0 75.0E % 1) 37.0 35.9 38.7 37.7 25–40 E %
Saturated fat 3), g
Intake per day 39.0 30.0 38.0 28.0E % 1) 15.5 15.1 15.1 14.4 < 10 E %
Monounsatu- rated fat 3), g
Intake per day 36.0 27.0 37.0 28.0E % 1) 14.5 13.8 14.6 14.3 10–20 E %
Polyunsatu- rated fat 3), g
Intake per day 17.2 13.4 17.0 14.0E % 1) 6.9 6.9 6.8 6.9 5–10 E %
Carbohydrates, gIntake per day 230.0 186.0 219.0 177.0E % 1) 42.2 43.9 41.3 42.5 45–60 E %
Sucrose, gIntake per day 51.0 43.0 43.0 39.0E % 1) 9.2 10.0 7.8 8.9 ≤ 10 E %
Fibre, g/vrkIntake per day 22.0 21.0 20.0 22.0 25–35 g
Energy, MJ (kcal) intake per day
9.4 (2 243)
7.3 (1 733)
9.5 (2 260)
7.4 (1 756)
Source: The National FinDiet 2012 Survey, The National FinDiet 2017 Survey25–64 years oldEnergy includes fibre and alcohol.1) Percentage of nutrient intake out of the total energy intake.2) Crude fat.3) As triglycerides.
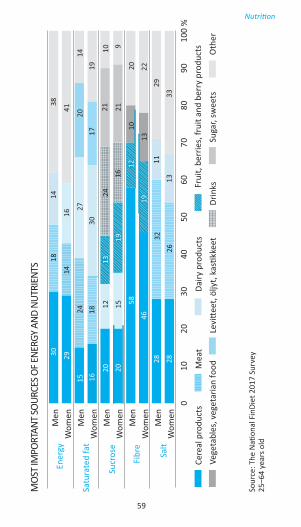
59
MOS
T IM
PORT
ANT
SOUR
CES O
F ENE
RGY
AND
NUTR
IENT
S
Nutrition
Sour
ce: T
he N
ation
al F
inDi
et 2
017
Surv
ey
25–6
4 ye
ars o
ld
010
2030
4050
6070
8090
100
%
Oth
erSu
gar,
swee
tsDr
inks
Levi
�eet
, öljy
t, ka
s�kk
eet
Vege
tabl
es, v
eget
aria
n fo
od
Frui
t, be
rrie
s, fr
uit a
nd b
erry
pro
duct
sDa
iry p
rodu
cts
Mea
tCe
real
pro
duct
s
Wom
enM
enW
omen
Men
Wom
enM
enW
omen
Men
Wom
enM
enEn
ergy
Fibr
e
Satu
rate
d fa
t
Salt
Sucr
ose
3014
29
1527
1630
2120
12 5810
4613
2811
2813
18
16
24
13
19
20
38
2014
1719
4114
18
2110
1519
924
16
12
2220
3226
29
33
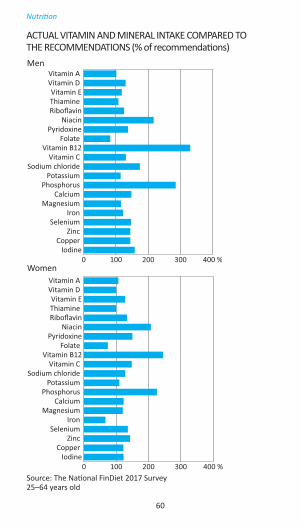
60
ACTUAL VITAMIN AND MINERAL INTAKE COMPARED TO THE RECOMMENDATIONS (% of recommendations)
Nutrition
Source: The National FinDiet 2017 Survey 25–64 years old
Women
Men
0 100 200 300 400 %Iodine
Copper Zinc
Selenium Iron
Magnesium Calcium
Phosphorus Potassium
Sodium chloride Vitamin C
Vitamin B12Folate
PyridoxineNiacin
RiboflavinThiamine Vitamin E
Vitamin D Vitamin A
0 100 200 300 400 %Iodine
Copper Zinc
Selenium Iron
Magnesium Calcium
Phosphorus Potassium
Sodium chloride Vitamin C
Vitamin B12Folate
PyridoxineNiacin
RiboflavinThiamine Vitamin E
Vitamin D Vitamin A
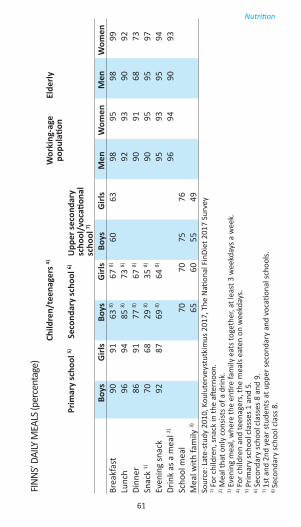
61
FINNS
’ DAI
LY M
EALS
(per
cent
age)
Nutrition
Child
ren/
teen
ager
s 4)W
orki
ng-a
ge
popu
latio
n El
derly
Prim
ary
scho
ol 5)
Seco
ndar
y sc
hool
6)U
pper
seco
ndar
y sc
hool
/voc
ation
al
scho
ol 7)
Boys
G
irls
Boys
G
irls
Boys
G
irls
Men
Wom
enM
enW
omen
Brea
kfas
t90
9163
8)67
8)60
6398
9598
99Lu
nch
9694
85 8)
73 8)
9293
9092
Dinn
er
8691
77 8)
67 8)
9091
6873
Snac
k 1)
7068
29 8)
35 8)
9095
9597
Even
ing
snac
k92
8769
8)64
8)95
9395
94Dr
ink
as a
mea
l 2)96
9490
93Sc
hool
mea
l70
7075
76M
eal w
ith fa
mily
3)65
6055
49So
urce
: Lat
e-st
udy
2010
, Kou
lute
rvey
stut
kim
us 2
017,
The
Nati
onal
Fin
Diet
201
7 Su
rvey
1) F
or c
hild
ren,
snac
k in
the
after
noon
.2)
Mea
l tha
t onl
y co
nsist
s of a
drin
k.3)
Eve
ning
mea
l, w
here
the
entir
e fa
mily
eat
s tog
ethe
r, at
leas
t 3 w
eekd
ays a
wee
k.4)
For
chi
ldre
n an
d te
enag
ers,
the
mea
ls ea
ten
on w
eekd
ays.
5) P
rimar
y sc
hool
cla
sses
1 a
nd 5
.6)
Sec
onda
ry sc
hool
cla
sses
8 a
nd 9
.7)
1st a
nd 2
nd y
ear s
tude
nts a
t upp
er se
cond
ary
and
voca
tiona
l sch
ools.
8) Se
cond
ary
scho
ol c
lass
8.
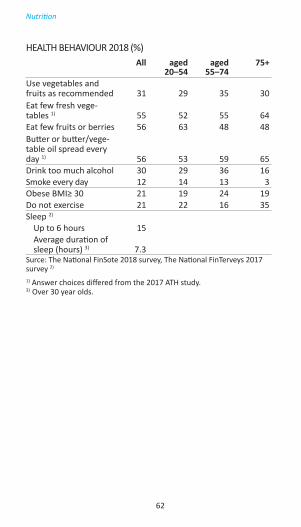
62
Nutrition
HEALTH BEHAVIOUR 2018 (%)All aged
20–54aged
55–74 75+
Use vegetables and fruits as recommended 31 29 35 30Eat few fresh vege- tables 1) 55 52 55 64Eat few fruits or berries 56 63 48 48Butter or butter/vege-table oil spread every day 1) 56 53 59 65Drink too much alcohol 30 29 36 16Smoke every day 12 14 13 3Obese BMI≥ 30 21 19 24 19Do not exercise 21 22 16 35Sleep 2)
Up to 6 hours 15Average duration of sleep (hours) 3) 7.3
Surce: The National FinSote 2018 survey, The National FinTerveys 2017 survey 2)
1) Answer choices differed from the 2017 ATH study.3) Over 30 year olds.

63
DAILY CONSUMER GOODS TRADE AND INSTITUTIONAL KITCHENS
NUMBER OF SHOPS BY SHOP TYPE Shop type Total 1.1.2019Hypermarkets 152Department stores 86Supermarkets, large 689Supermarkets, small 456Self-service shops, large 864Self-service shops, small 299Small shops 258Speciality shops 749Market halls 32Discount stores, part of the convenience goods offering 1) 352Service station stores, part of the convenience goods offering 1) 613Total 1.1.2018 4 550Mobile shops 11Closed down 227Source: A.C. Nielsen Finland Oy1) Selling a limited range of convenience goods.
SALES OF DAILY CONSUMER GOODS BY SHOP TYPE
MEUR 2018Hypermarkets ¹⁾ 5 112 Department stores 330 Supermarkets, large 7 002 Supermarkets, small 2 074 Self-service shops, large 2 172 Self-service shops, small 360 Small shops 185 Speciality shops 225 Market halls 33 Discount stores, part of the convenience goods offering 397 Service station stores, part of the convenience goods offering 190 Total 18 078 Mobile shops 4 Closed down 111 Total 18 193 Source: A.C. Nielsen Finland Oy¹⁾ Includes chains K-citymarket, Prisma and Minimani.
Economy
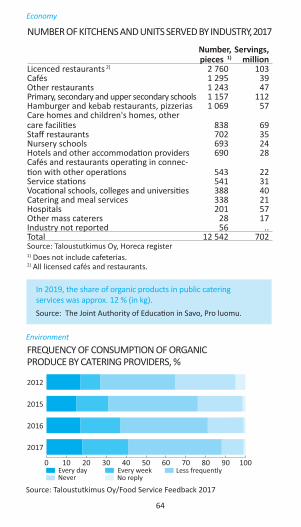
64
Economy
In 2019, the share of organic products in public catering services was approx. 12 % (in kg).Source: The Joint Authority of Education in Savo, Pro luomu.
Environment
Source: Taloustutkimus Oy/Food Service Feedback 2017
0 10 20 30 40 50 60 70 80 90 100
No replyNeverLess frequentlyEvery weekEvery day
2017
2016
2015
2012
FREQUENCY OF CONSUMPTION OF ORGANIC PRODUCE BY CATERING PROVIDERS, %
NUMBER OF KITCHENS AND UNITS SERVED BY INDUSTRY, 2017
Number, pieces 1)
Servings, million
Licenced restaurants 2) 2 760 103 Cafés 1 295 39 Other restaurants 1 243 47 Primary, secondary and upper secondary schools 1 157 112 Hamburger and kebab restaurants, pizzerias 1 069 57 Care homes and children's homes, other care facilities 838 69 Staff restaurants 702 35 Nursery schools 693 24 Hotels and other accommodation providers 690 28 Cafés and restaurants operating in connec-tion with other operations
543
22
Service stations 541 31 Vocational schools, colleges and universities 388 40 Catering and meal services 338 21 Hospitals 201 57 Other mass caterers 28 17 Industry not reported 56 .. Total 12 542 702 Source: Taloustutkimus Oy, Horeca register1) Does not include cafeterias.2) All licensed cafés and restaurants.
Forkful of Facts can be ordered from Finnish Food Information by e-mail: [email protected] or by phone +358 40 710 4170.
The publication is free, but postage are charged (handling 7 € + shipping costs).
Forkful of Facts 2018 – Food Industry Statistics -publication was produced by Finnish Food Information Association with the Finnish Association of Academic Agronomists, Central Union of Agricultural Producers, Association of ProAgria Centers, the Central Union of Swedish-speaking Agricultural Producers in Finland and Natural Resources Institute Finland. Valuable expert help has also been provided by Finnish Food Authority, Farmers’ Social Insurance Institution Mela, Finnish Poultry Association, The Finnish Beekeepers’ Association, Finnish Grocery Trade Association, Finnish Horticultural Products Society, Statistics Finland, Kantar TNS Agri Ltd, Customs Statistics Service, Reindeer herders’ Association and Finnish Workers’ Compensation Center. Finnish Food Information would like to extend warm thanks to all those who have provided assistance.
Managing editorSaana KarjalainenFinnish Food InformationHelsinki 2019

FORKFUL OF FACTSFinnish Food Industry Statistics
FINNISH FOOD INFORMATION tel. +358 40 710 4170www.ruokatieto.fi
Finnish Association of Academic Agronomists tel. +358 9 251 1160 www.agronomiliitto.fi
Natural Resources Institute Finland (Luke) tel. +358 29 532 6000 www.luke.fi
Central Union of Agricultural Producers and Forest Owners tel. +358 20 4131 www.mtk.fi
Central Union of Swedish-speaking Agricultural Producers in Finland tel. +358 9 586 0460 www.slc.fi
Association of ProAgria Centres tel. +358 20 747 2400 www.proagria.fi
2018