finnra internal publications 4/2000 -...
TRANSCRIPT

Finnra Internal Publications4/2000
S 12 Improvement solutions for main roads
R. Tapio Luttinen and Satu Innamaa
Nordic Highway CapacityUninterrupted Flow Facilities in Denmark, Finland,Norway, and Sweden
Finnish National Road AdministrationTraffic and Road Engineering
Helsinki 2000

TIEL 4000247
Sold by:FinnRA libraryFax: Int. +358 (0)204 44 2652http//:www.tieh.fi/libr.htm
Finnish National Road AdministrationTraffic and Road EngineeringOpastinsilta 12 AP.O. Box 3300521 HELSINKIFINLANDTelephone: Int. +358 (0)204 44 150

R.TAPIO LUTTINEN AND SATU INNAMAA: Nordic Highway Capacity—Uninterrupted FlowFacilities in Denmark, Finland, Norway, and Sweden. Helsinki 2000, Finnish National RoadAdministration, Finnra Internal Publications 4/2000, TIEL 4000247.
Keywords: Traffic flow theory, capacity, level of service
ABSTRACT
The comparison of Nordic highway capacity calculation methods is part of the Nordiccapacity cooperation project NORDKAP. This report presents a comparison of Nordiccapacity calculation methods for uninterrupted flow facilities (highway segments).
The Norwegian method follows the 1985 HCM most closely. In Finland the 1985HCM is followed on freeways and four-lane highways. For two-lane highways themethod is modified so that the parameters can be obtained from the Finnra highwaydatabase. In Denmark new methods have been documented in draft guidelines. Thesefollow roughly the 1994 HCM, but with a slightly modified logic and locally adjustedparameters. The Swedish method is also under development. The structure of themodel is similar to the 1985 HCM, but many adjustment factors are still undefined.
For two-lane highways the ideal capacity is 2,800pc/h in all Nordic countries. Forfreeways and multilane highways the ideal capacity 2,000pc/h/lane of the 1985 HCMis used in Finland and Norway. In Denmark and Sweden higher ideal capacities areused, which reflect more recent results.
The capacities obtained by the Finnish and Norwegian methods are practically thesame as the 1985 HCM capacities. The adjustment factors in the Danish method causea steeper capacity reduction than in the 1985 HCM as the conditions become less ideal.The Swedish method, on the other hand, uses the 1985 HCM adjustment factors for theroadway width, but other adjustments are mostly omitted. Consequently, the Swedishmethod gives high capacity estimates under unfavorable conditions.
In many countries calculations are performed by special computer software. Thesesoftware have not been used here, but the calculations and descriptions are based onreported capacity models. The parameters of Finnish IVAR software are, however,briefly discussed.

PREFACE
In 1996 the road administrations in Denmark, Finland, Norway and Sweden starteda cooperation project called NORDKAP (NORDiskt KAPacitetssamarbete, NordicCapacity Cooperation). The project has three objectives:
1. to compare calculation methods for capacity and level of service
2. to coordinate R&D efforts
3. to coordinate the development of national highway capacity manuals.
This report presents a comparison of Nordic capacity calculation methods for uninter-rupted flow facilities (highway segments).
There is an extensive development effort going on in all Nordic countries. This factemphasises the need for a methodological comparison, but also makes it difficult todefine the methods to be compared. In Finland and Norway the “handbook” methodshave been presented. The Danish and Swedish methods presented are based on currentdraft guidelines. It is assumed that the reader is familiar with the basic concepts ofcapacity and level-of-service analysis.
The report has been prepared by Dr. R. Tapio Luttinen from TL Consulting Engi-neers Ltd. and M.Sc.(Tech) Satu Innamaa from Helsinki University of Technology,Laboratory of Transportation Engineering. This project has been part of the Finnrastrategic project S12 (Improvement solutions for main roads). The work has been co-ordinated by deputy director PauliVelhonoja from Finnra Traffic and Road Engineeringand M.Sc.(Tech) Jukka Ristikartano from Finnra Consulting. M.Sc.(Tech) Åsa Enbergfrom Helsinki University of Technology, Laboratory of Transportation Engineering hasprovided very useful comments.
Hopefully, the results presented will be helpful in the development of national guide-lines, improve our understanding of highway capacity, and lead to better traffic perfor-mance in Nordic highway networks.
Helsinki, June 2000
Finnish National Road Administration
Traffic and Road Engineering

Nordic Highway Capacity
CONTENTS
5
Contents
1 INTRODUCTION 6
1.1 Highway Capacity Manual 6
1.2 Nordic capacity methods 7
2 CAPACITY 9
2.1 Capacity models 9
2.1.1 General description 9
2.1.2 Two-lane highways 9
2.1.3 Freeways and multilane highways 9
2.2 Capacity under ideal conditions 10
2.2.1 Ideal conditions 10
2.2.2 Ideal capacity 11
3 ADJUSTMENT FACTORS 13
3.1 Adjustment for terrain type 13
3.2 Adjustment for lane width 14
3.2.1 Freeways and multilane highways 14
3.2.2 Two-lane highways 15
3.3 Adjustment for heavy vehicles 20
3.4 Adjustment for directional distribution 22
3.5 Other adjustment factors 26
4 CONCLUSIONS 28
REFERENCES 29

6 Nordic Highway Capacity
INTRODUCTION
1 INTRODUCTION
1.1 Highway Capacity Manual
In 1950 thefirst editionof Highway Capacity Manual(Bureau of Public Roads 1950),HCM for short, defined three capacity measures for highways:
• Basic capacityis “the maximum number of passenger cars that can pass a givenpoint on a lane or roadway during one hour under the most nearly ideal roadwayand traffic conditions which can possibly be attained”.
• Possible capacityis “the maximum number of vehicles that can pass a givenpoint on a lane or a roadway during one hour, under the prevailing roadway andtraffic conditions”.
• Practical capacityis “the maximum number of vehicles that can pass a given pointon a roadway or in a designated lane during one hour without the traffic densitybeing so great as to cause unreasonable delay, hazard, or restriction to the drivers’freedom to maneuver under the prevailing roadway and traffic conditions”.
The second editionof HCM (Highway Research Board 1965) developed the idea ofpractical capacity by defining sixlevels of service(A–F). “The maximum number ofvehicles which has a reasonable expectation of passing over a given section of a lane orroadway in one direction on multilane highways (or in both directions on a two- or three-lane highway) during a specified time period while operating conditions are maintainedcorresponding to the selected or specified level of service” was calledservice volume.Capacitywas defined as “the maximum number of vehicles which has a reasonableexpectation of passing over a given section of a lane or a roadway in one direction (orin both directions for a two-lane or a three-lane highway) during a given time periodunder prevailing roadway and traffic conditions”. The definition was similar to thepossible capacity of HCM 1950 (Bureau of Public Roads 1950).
Level of service A described traffic and roadway conditions with “little or no restrictionin maneuverability due to the presence of other vehicles, and drivers can maintaintheir desired speeds with little or no delay”. Levels of service B, C, and D describedconditions with increasing restrictions in maneuverability. Level of service E describedtraffic flow at or near capacity. Level of service F described forced flow operation atlow speeds, where volumes were below capacity.
The third edition of HCM (Transportation Research Board 1985) was published 20years later. It extended the scope of the manual to freeway systems, arterial streets,transit, pedestrians and bicycles. The methods were updated to reflect the currentresearch. The third edition has been further updated in 1992 (Transportation ResearchBoard 1992), 1994 (Transportation Research Board 1994), and 1997 (TransportationResearch Board 1998).
A slightly revised definition ofcapacitywas given in HCM 1985. Capacity is
the maximum rate of flow at which persons or vehicles can be reasonablyexpected to traverse a point or uniform segment of a lane or roadwayduring a specified time period under prevailing roadway, traffic, and controlconditions, usually expressed as vehicles per hour or persons per hour.
Capacity was now defined in terms of ‘maximum rate of flow’—not ‘the maximumnumber of vehicles’ as in the 1965 HCM. Reflecting this change, the ‘service volume’concept in the 1965 HCM was now replaced withservice flow rate, which was
Nordic Highway Capacity
INTRODUCTION
7
the maximum hourly rate at which persons or vehicles can reasonably beexpected to traverse a point or uniform section of a lane or roadway duringa given period under prevailing roadway, traffic, and control conditionswhile maintaining a designated level of service.
Capacity and service flow rates were generally based on 15-minute time periods.
The fourth edition(HCM 2000) will be published by the year 2000. The methods forfreeways and multilane highways will be very similar to the HCM 1997 (TransportationResearch Board 1998), but the two-lane highway methodology will be totally revised(Harwood, May, Anderson, Leiman, & Archilla 1999).
1.2 Nordic capacity methods
All Nordic methods for calculating capacity on highway segments are based on theHighway Capacity Manual. Finland, Norway and Sweden have used the 1985 HCM(Transportation Research Board 1985). The current Danish method is based on the 1965HCM (Highway Research Board 1965), but the new draft guidelines (Vejdirektoratet1999a) follow more closely the 1994 update of HCM (Transportation Research Board1994). All these methods have been adjusted to local conditions.
In Denmarkgreat attention has been paid to freeways because traffic volumes on theDanish freeway network has increased substantially, and capacity is expected to bereached in several locations (Sørensen & Rysgaard 1997). The present Danish methodto calculate the capacity in highway segments is presented in the guidelinesVejreglerfrom 1981. Correction factors for freeways were revised in 1996 (Vejdirektoratet 1996).New guidelines for capacity and level of service are under development. The discussionbelow is based on the draft capacity manual (Vejdirektoratet 1999a). Levels of serviceare expressed in terms of volume-to-capacity ratios(v/c) and average travel speeds,without any classification, such as A–F used in the HCM.
In Finland, capacity is seldom a problem, and it is not considered as important as inother Nordic countries. Capacity problems occur only on certain major highways dur-ing summer weekends and on bigger radial highways in the Helsinki metropolitan area.Calculation methods for highway capacity are based on the 1985 HCM (TransportationResearch Board 1985) with minor modifications (Pursula & Ristikartano 1987). TheFinnish National Road Administration (Finnra) has published guidelines for two-lanehighways (Tiensuunnittelutoimisto 1986). Capacity calculations can also be performedwith the IVAR (Investment Impact Analysis Software) computer software (Tie- ja li-ikennetekniikka 1998b). IVAR applies the results of HCM (Transportation ResearchBoard 1985), the guidelines for two-lane highways (Tiensuunnittelutoimisto 1986), andan unpublished report for multilane highways (Kehittämiskeskus 1990).
The 1985 HCM level-of-service classification is used in Finland. The adjustment factorsfor two-lane highways have been adjusted to the Finnish terrain type classification. Inthe IVAR software (Tie- ja liikennetekniikka 1998a) the level of service is based onspeeds and volume-to-capacity ratios specified for 20 facility types.
The Norwegianhandbook covers one-lane and two-lane highways outside built-upareas, multilane highways, arterials in built-up areas, and weaving sections and ramps.The method does not take into account the correlation of different quality parametersthat are included in HCM (level of service, traffic density, speed, andv/c ratio). Levelsof service are based on the 1985 HCM. (Giæver 1997)
The Swedishcapacity manualBeräkning av kapacitet, kölängd, fördröjning i väg-trafikanläggningarwas published in 1977 (StatensVägverk 1977). Nowadays capacity
8 Nordic Highway Capacity
INTRODUCTION
calculations are based on the EVA model (Carlsson 1997). It has speed-flow diagramsdefined for every highway type and speed limit. The model was updated in the begin-ning of the 1990’s by using data from a traffic monitoring system of 80 fixed measuringpoints (Carlsson 1992). In addition, simulation was used for two-lane highways. Atraffic flow model for four-lane highways is under development. The results of the draftreport (Carlsson & Cedersund 1998) have been used below.
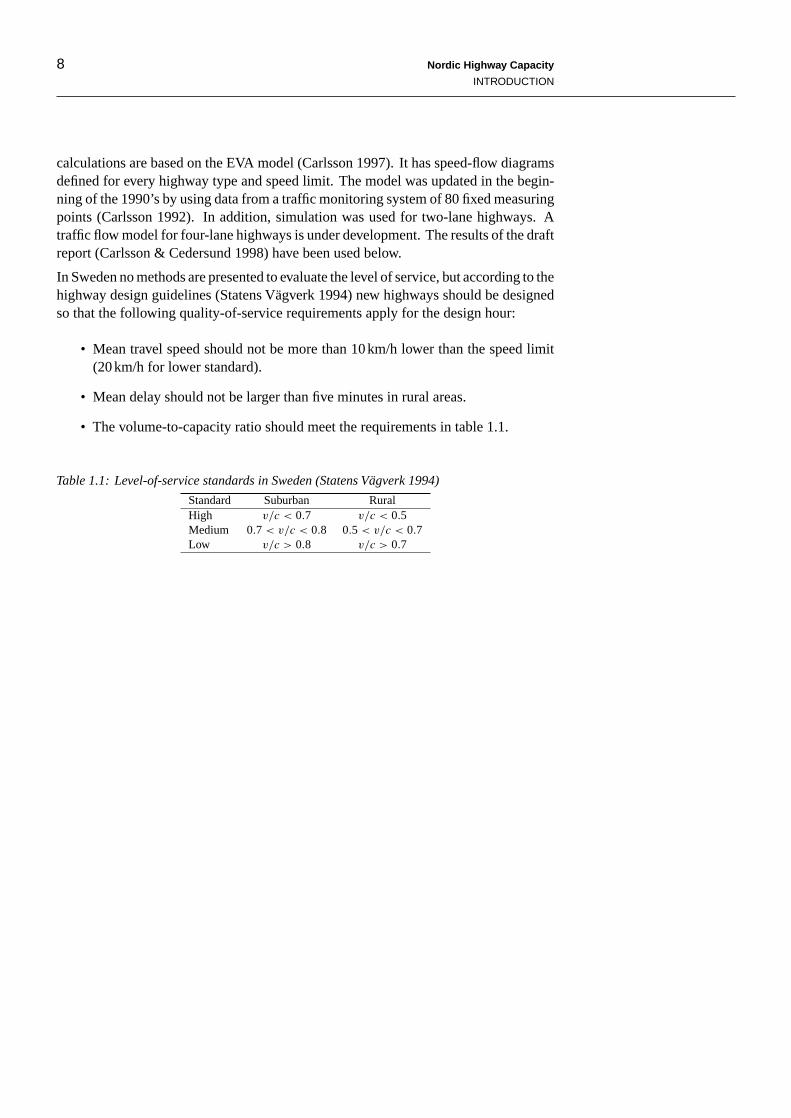
In Sweden no methods are presented to evaluate the level of service, but according to thehighway design guidelines (Statens Vägverk 1994) new highways should be designedso that the following quality-of-service requirements apply for the design hour:
• Mean travel speed should not be more than 10km/h lower than the speed limit(20km/h for lower standard).
• Mean delay should not be larger than five minutes in rural areas.
• The volume-to-capacity ratio should meet the requirements in table 1.1.
Table 1.1: Level-of-service standards in Sweden (Statens Vägverk 1994)
Standard Suburban RuralHigh v/c < 0.7 v/c < 0.5Medium 0.7 < v/c < 0.8 0.5 < v/c < 0.7Low v/c > 0.8 v/c > 0.7

Nordic Highway Capacity
CAPACITY
9
2 CAPACITY
2.1 Capacity models
2.1.1 General description
Capacity is the maximum rate of flow at which persons or vehicles can be reasonablyexpected to traverse a point or uniform segment of a lane or roadway during a specifiedtime period under prevailing roadway, traffic, and control conditions, usually expressedas vehicles per hour or persons per hour (Transportation Research Board 1998). Thecalculation methods are based on capacity (cj ) at ideal conditions. The prevailingtraffic and roadway conditions are considered by multiplying the ideal capacity withadjustment factors for the width of the roadway, the portion of heavy vehicles, thedirectional distribution of the traffic, etc. Under ideal conditions the adjustment factorsare equal to unity.
2.1.2 Two-lane highways
The calculation methods in the 1985 HCM (Transportation Research Board 1985) arebased on the level-of-service concept. Capacity is the service flow rate at level ofservice E. On two-lane highways the capacity (c) is
c = cj(v/c)EfwfHVfd, (2.1)
wherecj is the capacity under ideal conditions,fw is an adjustment factor for roadwaywidth, fHV is an adjustment factor for the percentage of heavy vehicles, andfd is anadjustment factor for the directional distribution. The maximum volume-to-capacityratio at level-of-service E,(v/c)E, is adjusted for terrain type and percent no passingzones. The 1985 HCM model structure is applied inFinland (Tiensuunnittelutoimisto1986) andNorway(Giæver 1997).
TheDanishmethod (Vejdirektoratet 1999a)
c = cjfwfHVfdfs (2.2)
does not have any adjustment for terrain type. The effect of vertical highway geometryis included in the adjustment factor for heavy vehicles (fHV ) only. There is also anadditional adjustment factorfs for slow vehicles, such as tractors or harvesters.
TheSwedishmethod (Carlsson 1997) follows the 1985 HCM method (equation (2.1))but without adjustments for heavy vehicles, terrain type or directional distribution:
c = cjfw. (2.3)
The capacity is independent of speed limit and sight class. In Sweden sight class isused as a highway classification measure instead of grade and curvature.
2.1.3 Freeways and multilane highways
On freewaysno adjustment for directional distribution or no-passing zones is needed.The ideal capacity in the 1985 HCM is calculated on a per lane basis and the idealroadway capacity is obtained by multiplying the lane capacity by the number of lanes(n). A new adjustment factor (fp) makes a correction for the character of traffic stream(weekday, commuter or other). The freeway capacity according to the 1985 HCM is
c = cjnfwfHVfp. (2.4)
10 Nordic Highway Capacity
CAPACITY
For multilane highwaysthe 1985 HCM (Transportation Research Board 1985) intro-duced an additional adjustment factor,fE, for the type of the highway (divided orundivided) and the development environment (rural or suburban). Accordingly, thecapacity equation is:
c = cjnfwfHVfpfE. (2.5)
The distance between signalized intersections should be greater than 2 miles (3.2 km),otherwise the method for arterial streets should be applied.
In Finland (Pursula & Ristikartano 1987) andNorway(Giæver 1997) the equation forfreeway capacity (2.4) is used for both freeways and multilane highways. There is,however, no practical difference, becausefE = 1 for freeways.
TheDanishmethod (Vejdirektoratet 1999a) does not use adjustment factorsfp andfE.The capacity equation for freeways and multilane highways is
c = cjnfwfHV . (2.6)
TheSwedishmethod calculates the capacity separately for each lane. No adjustmentfactors are used (Carlsson 1997). The draft report for four-lane highways (Carlsson &Cedersund 1998), however, defines adjustment factors for heavy vehicles. The capacityequation is
ci = cjifHV, (2.7)
whereci andcji are the capacity and the ideal capacity for lanei, respectively. Noadjustment factor for lane width(fw) could be obtained from the available data. Theadjustment factor for terrain type will be analysed later using microscopic models.
2.2 Capacity under ideal conditions
2.2.1 Ideal conditions
The ideal conditions are defined in the 1985 HCM (Transportation Research Board1985) as follows:
1. Twelve-feet (3.65 m) minimum lane widths.
2. Six-feet (1.8 m) minimum lateral clearance between the edge of the travel lanesand the nearest obstacle or object on the roadside or in the median.
3. Only passenger cars in the traffic stream.
4. Level terrain.
5. The design speed is 70mi/h (113km/h) or more on multilane highways and60mi/h (97km/h) or more on two-lane highways.
6. On freeways the driver characteristics are assumed to be typical of weekdaycommuter streams in urban areas, or regular users in other areas.
7. Multilane highways are divided with no direct access points along the roadway.
8. Two-lane highways have a 50/50 directional split of traffic and no ‘no-passingzones’.
9. No impediments to through traffic due to traffic control or turning vehicles.
Under these conditions, the adjustment factors are equal to unity.

Nordic Highway Capacity
CAPACITY
11
2.2.2 Ideal capacity
In the 1985 HCM (Transportation Research Board 1985) the ideal capacity (capacity un-der ideal conditions) on freeways and multilane highways is 2,000pc/h/lane. This wasthe capacity under ideal conditions already in the 1965 HCM (Highway Research Board1965). If the design speed is 50mi/h (80km/h), the ideal capacity is 1,900pc/h/lane.The ideal capacity of a two-lane highway is 2,800pc/h in both directions together.These are also the ideal capacities used in Finland and Norway (tables 2.1 and 2.2).
In the 1997 update of the HCM (Transportation Research Board 1998), the ideal capacityon freeways is 2,250–2,400pc/h/lane, depending on free flow speed. On multilanehighways the ideal capacity can reach 2,200pc/h/lane.
Table 2.1: Ideal capacities on multilane highways
Ideal capacity (pc/h/lane)Highway type Denmark Finland Norway SwedenFour-lane freeways 2,300 2,000 2,000 2,5002)
Six-lane freeways 2,300 2,000 2,000 2,1332)
Four-lane or six-lane highways 2,300 2,0001) 2,0001) 2,1002)
1) 1,900pc/h/lane, if design speed is≤80km/h.2) Average lane capacity (Carlsson 1992).
Table 2.2: Ideal capacities on two-lane and three-lane highways, both directions together
Ideal capacity (pc/h)Highway type Denmark Finland Norway SwedenTwo-lane highway 2,800 2,8001) 2,800 2,800Three-lane highway 2,660 2,6001) 3,080pc/h on semi-motorways.
All Nordic countries have adopted the 1985 HCM estimate (2,800pc/h) for ideal ca-pacity ontwo-lane highways. Wide two-lane highways in Denmark and Sweden have,however, higher ideal capacities (see section 3.2.2). A higher ideal capacity for widetwo-lane highways is also defined in the Finnish IVAR software (Tie- ja liikennetekni-ikka 1998a). For Finnish semi-motorways1 the capacity is estimated as 3,080pc/h. TheHCM 2000 capacity estimate for two-lane highways will be 1,700pc/h in one direction,but total capacity does not exceed 3,200pc/h (Harwood, May, Anderson, Leiman, &Archilla 1999). There will be no adjustment for roadway conditions.
In Denmark and Sweden the ideal capacity ofthree-lane highwaysis lower than thecapacity of two-lane highways. In Finland ‘no outstanding increase’ in capacity hasbeen found due to the three-lane design (Enberg 1997).
In Denmark, the ideal capacity of three-lane (2+1) highways is 1,900pc/h per direction,which gives two-way capacity of 2,660pc/h, when the effect of directional distribution(section 3.4) is considered. Passing lanes are assumed to be 900–1,400m long.
For freeways and multilane highwaysFinland and Norway follow the 1985 HCM. TheFinnish IVAR software (Tie- ja liikennetekniikka 1998a), however, defines(v/c)E =0.95 for multilane highways (facility types 13 and 14), which gives a capacity estimateof 1,900pc/h/lane. (See, however, the discussion about heavy vehicle adjustment in
1A semi-motorway is a high-class two-lane rural highway with full access control and motorised trafficonly.
12 Nordic Highway Capacity
CAPACITY
IVAR in section 3.3.) Denmark and Sweden use higher ideal capacities, which aremore in line with the current HCM update (Transportation Research Board 1998). Itis possible that in the final Danish guidelines six-lane freeways will have a highercapacity-per-lane estimate than four-lane freeways (Vejdirektoratet 1999b).
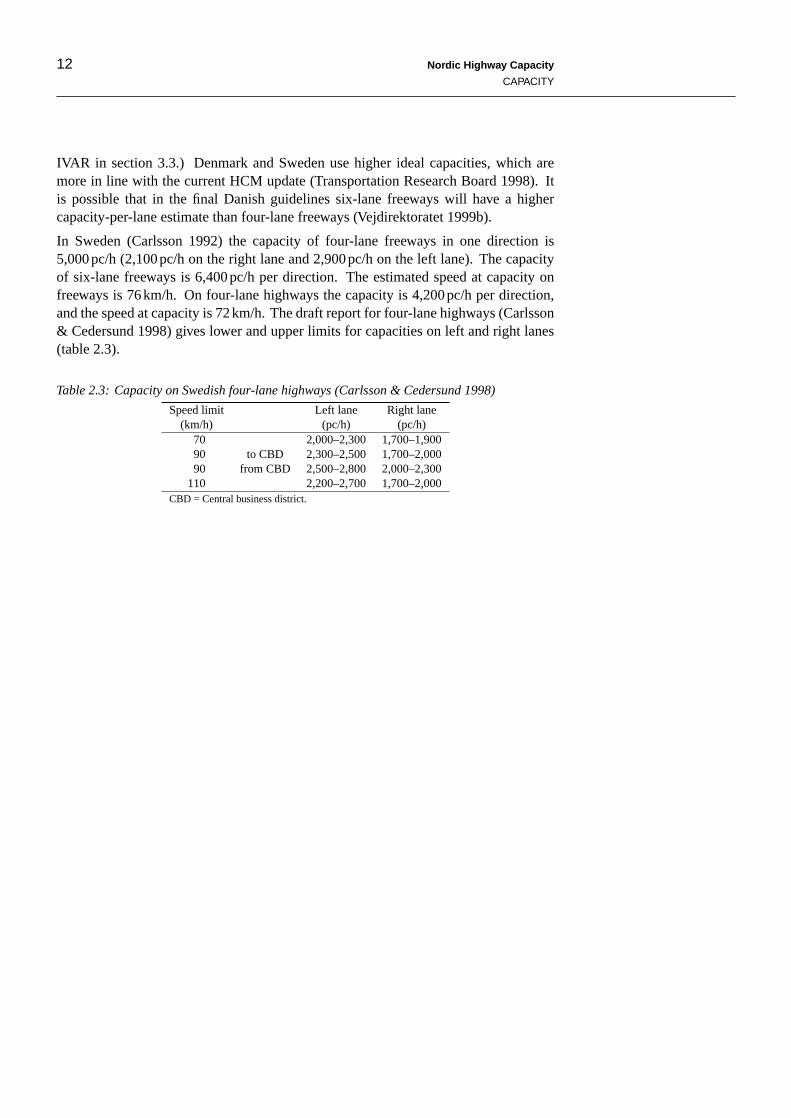
In Sweden (Carlsson 1992) the capacity of four-lane freeways in one direction is5,000pc/h (2,100pc/h on the right lane and 2,900pc/h on the left lane). The capacityof six-lane freeways is 6,400pc/h per direction. The estimated speed at capacity onfreeways is 76km/h. On four-lane highways the capacity is 4,200pc/h per direction,and the speed at capacity is 72km/h. The draft report for four-lane highways (Carlsson& Cedersund 1998) gives lower and upper limits for capacities on left and right lanes(table 2.3).
Table 2.3: Capacity on Swedish four-lane highways (Carlsson & Cedersund 1998)
Speed limit Left lane Right lane(km/h) (pc/h) (pc/h)
70 2,000–2,300 1,700–1,90090 to CBD 2,300–2,500 1,700–2,00090 from CBD 2,500–2,800 2,000–2,300
110 2,200–2,700 1,700–2,000CBD = Central business district.

Nordic Highway Capacity
ADJUSTMENT FACTORS
13
3 ADJUSTMENT FACTORS
3.1 Adjustment for terrain type
The 1985 HCM defines three terrain types (Transportation Research Board 1985):
1. Level terrain—Any combination of grades and horizontal and vertical alignmentpermitting heavy vehicles to maintain approximately the same speed as passenger cars;this generally includes short grades of no more than 1 to 2 percent.
2. Rolling terrain—Any combination of grades and horizontal or vertical alignmentcausing heavy vehicles to reduce their speeds substantially below those of passengercars, butnotcausing heavy vehicles to operate at crawl speeds for any significant lengthof time.
3.Mountainous terrain—Any combination of grades and horizontal and vertical align-ment causing vehicles to operate at crawl speeds for significant distances or at frequentintervals.
These terrain types are used to determine the passenger-car equivalents for heavy ve-hicles (see section 3.3). On two-lane highways the terrain types in conjunction withpercent no-passing zones are also used to determine the volume-to-capacity ratio (v/c
ratio) for each level of service. Ano-passing zoneis a roadway along which sightdistance is less than 1500 ft (460 m), or passing is prohibited. This adjustment isconsidered here.
Table 3.1 displays the adjustment factors(v/c)E for terrain type on two-lane highways.This procedure takes into account that capacities vary depending on terrain and thedegree of passing restrictions (Transportation Research Board 1985). On level terrainno adjustment is made for passing restrictions. For extended specific grades the 1985HCM has a separate analysis method.
Table 3.1: Adjustment factors(v/c)E for terrain type on two-lane highways in the 1985 HCM(Transportation Research Board 1985)
Percent no-passing zonesTerrain 0 20 40 60 80 100Level 1.00 1.00 1.00 1.00 1.00 1.00Rolling 0.97 0.94 0.92 0.91 0.90 0.90Mountainous 0.91 0.87 0.84 0.82 0.80 0.78
TheDanishguidelines define four (I–IV) grade categories (stigningskategori) based onthe average gradient and grade length (figure 3.1). The guidelines do not use(v/c)E,but the grade categories are applied in the estimation of passenger-car equivalents forheavy vehicles.
In Finland the adjustment for terrain type is based on hilliness classes (HC) accordingto table 3.2. HC1 corresponds to level terrain and HC3 to rolling terrain in the 1985HCM. HC4 does not reduce capacity as much as mountainous terrain. Hilliness classesare based on the hilliness index (table 3.3).
The 1985 HCM adjustment factors (table 3.1) are used inNorway. The definitions ofterrain types are, however, slightly modified: On level terrain (flat terreng) the gradesare shorter than one kilometer or not steeper than three percent. Rolling terrain (kupertterreng) has 1–2 km long grades of 5–6 percent. Otherwise the definitions are similarto the definitions in 1985 HCM.

14 Nordic Highway Capacity
ADJUSTMENT FACTORS
Figure 3.1: Danish grade categories by grade length (meters) and gradient (per mill) (Vejdi-rektoratet 1999a)
Table 3.2: The adjustment factor(v/c)E for terrain type on two lane highways in Finland(Tiensuunnittelutoimisto 1986)
Hilliness Percent no-passing zonesclass 0 20 40 60 80 100HC1 1.00 1.00 1.00 1.00 1.00 1.00HC2 0.98 0.97 0.96 0.96 0.95 0.95HC3 0.97 0.94 0.92 0.91 0.90 0.90HC4 0.94 0.91 0.88 0.87 0.85 0.84
TheSwedishmethod does not use adjustment for terrain type. Neither is terrain typeused in heavy vehicle adjustment.
Considering the different criteria for terrain type, the comparison of the methods isproblematic. The Swedish method does not have a correction for terrain type. InNorway the definitions are similar to the HCM, but with some quantitative definitionsadded. These definitions can be used to compare the Norwegian method with the Danishmethod. The Danish and Norwegian methods are based on grade length and gradient,whereas the Finnish method is based on hilliness classes. In Finland and Denmarkthere are no mountains and, consequently, no adjustment for mountainous terrain isdefined.
The Finnish hilliness class HC3 has the same adjustment factors as the rolling terrainin HCM. The Norwegian method defines rolling terrain as a highway section whichhas 1–2 km long grades of 5–6 percent. According to figure 3.1 this corresponds toDanish grade category IV. In terms of heavy vehicle adjustment (see section 3.3) theHCM rolling terrain is, however, more like Danish grade category III.
The capacities adjusted for the rolling terrain type are given in table 3.4. It is assumedthat the Finnish hilliness class HC3 is equivalent to the Norwegian rolling terrain. TheDanish and Swedish methods do not have any terrain type adjustment.
3.2 Adjustment for lane width
3.2.1 Freeways and multilane highways
In Finland (Pursula & Ristikartano 1987) the 1985 HCM adjustment factors (fw) forrestricted lane width and lateral clearance on freeways and multilane highways are fol-
Nordic Highway Capacity
ADJUSTMENT FACTORS
15
Table 3.3: Hilliness classes in FinlandHilliness Hilliness
class index (m/km)HC1 ≤9HC2 10–16HC3 17–22HC4 ≥23
Source: Pursula & Ristikartano (1987)
Table 3.4: Capacity on a two-lane highway on rolling terrain in Finland and Norway (otherconditions ideal)
Percent no-passing zones 0 20 40 60 80 100Capacity (pc/h) 2,716 2,632 2,576 2,548 2,520 2,520Sources: Tiensuunnittelutoimisto (1986), Giæver (1997)
lowed. Table 3.5 displays adjustment factors for 4-lane freeways. The adjustment fac-tors for 6-lane freeways are slightly higher (Pursula & Ristikartano 1987) as presentedin the 1985 HCM (Transportation Research Board 1985). For multilane highways theadjustment factors in table 3.5 are supplemented by a further adjustment factor(fE) asdescribed in section 3.5.
Table 3.5: Adjustment factor for restricted lane width and lateral clearance on four-lane free-ways highways in Finland
Lane Distance to obstruction Distance to obstructionwidth on one side (m) on both sides (m)(m) 1.8 1.2 0.6 0 1.8 1.2 0.6 03.65 1.00 0.99 0.97 0.90 1.00 0.98 0.94 0.813.35 0.97 0.96 0.94 0.87 0.97 0.95 0.91 0.793.05 0.91 0.90 0.88 0.82 0.91 0.89 0.86 0.742.75 0.81 0.80 0.79 0.73 0.91 0.79 0.76 0.66
Source: Pursula & Ristikartano (1987)
In Norway(Giæver 1997) the same (HCM) adjustment factors are used as in Finland,but the widths are lower. The Norwegian method also has separate adjustment factorsfor undivided multilane highways (table 3.6). In addition, a further adjustment factor(fE) for divided/undivided multilane highways is used as described in section 3.5.
The Danishadjustment factors for multilane highways and freeways (tables 3.7 and3.8) are slightly modified from the 1985 HCM. InSwedenfw is not defined.
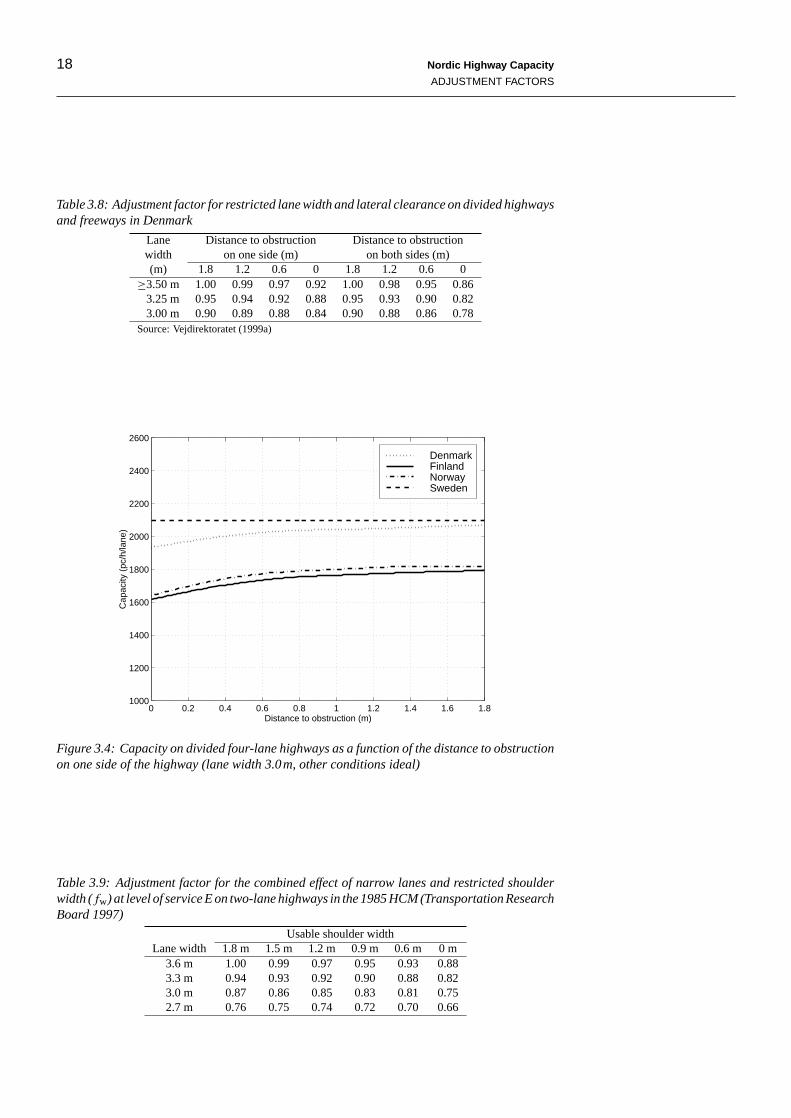
Capacities adjusted for distance to obstruction on four-lane freeways and highways arepresented in figures 3.2, 3.3, and 3.4. Cubic spline interpolation was used to calculateintermediate values.
3.2.2 Two-lane highways
Table 3.9 displays the adjustment factors for lane and shoulder width (fw) in the 1985HCM. These factors are used in Denmark and Norway, but lane widths are 3.50, 3.25,3.00 and 2.75 meters.
In Denmarkthe shoulder widths are 1.8, 1.2, 0.6 and 0 meters. Wide Danish two-lanehighways have a capacity of 3,200pc/h, but this estimate is not considered accurate

16 Nordic Highway Capacity
ADJUSTMENT FACTORS
0 0.2 0.4 0.6 0.8 1 1.2 1.4 1.6 1.81000
1200
1400
1600
1800
2000
2200
2400
2600
Distance to obstruction (m)
Cap
acity
(pc
/h/la
ne)
DenmarkFinlandNorwaySweden
Figure 3.2: Capacity on four-lane freeways as a function of the distance to obstruction on oneside of the highway (lane width 3.5m, other conditions ideal)
0 0.2 0.4 0.6 0.8 1 1.2 1.4 1.6 1.81000
1200
1400
1600
1800
2000
2200
2400
2600
Distance to obstruction (m)
Cap
acity
(pc
/h/la
ne)
DenmarkFinlandNorwaySweden
Figure 3.3: Capacity on divided four-lane highways as a function of the distance to obstructionon one side of the highway (lane width 3.5m, other conditions ideal)
Nordic Highway Capacity
ADJUSTMENT FACTORS
17
Table 3.6: The adjustment factor for restricted lane width and lateral clearance on freewaysand multilane highways in Norway
Type of Lane Distance to obstruction Distance to obstructioncross width on one side (m) on both sides (m)section (m) 1.5 1.0 0.5 0 1.5 1.0 0.5 0
3.50 1.00 0.99 0.97 0.90 1.00 0.98 0.94 0.81Divided 3.25 0.97 0.96 0.94 0.87 0.97 0.95 0.91 0.79
3.00 0.91 0.90 0.88 0.82 0.91 0.89 0.86 0.742.75 0.81 0.80 0.79 0.73 0.91 0.79 0.76 0.663.50 1.00 0.98 0.95 0.88 Not Not 0.94 0.81
Undivided 3.25 0.95 0.94 0.92 0.85 of of 0.91 0.793.00 0.89 0.88 0.86 0.80 current current 0.86 0.742.75 0.77 0.76 0.75 0.70 interest interest 0.66
Source: Giæver (1997)
Table 3.7: Adjustment factor for restricted lane width and lateral clearance on undividedhighways in Denmark
Lane Distance to obstructionwidth (m)(m) 1.8 1.2 0.6 0
≥3.50 1.00 0.97 0.93 0.883.25 0.94 0.92 0.88 0.823.00 0.87 0.85 0.81 0.752.75 0.76 0.74 0.70 0.66
Source: Vejdirektoratet (1999a)
(Vejdirektoratet 1999b). In one direction the maximum flow rate on Danish wide two-lane highways is 2,300pc/h.
In Norway lower values for shoulder widths are used: 1.5, 1.0, 0.5 and 0 meters.These modifications slightly increase the capacity estimates on some highways whencompared to the 1985 HCM. This effect can also be observed by comparing the Finnishand Norwegian capacity estimates for multilane highways in figures 3.3, and 3.4.
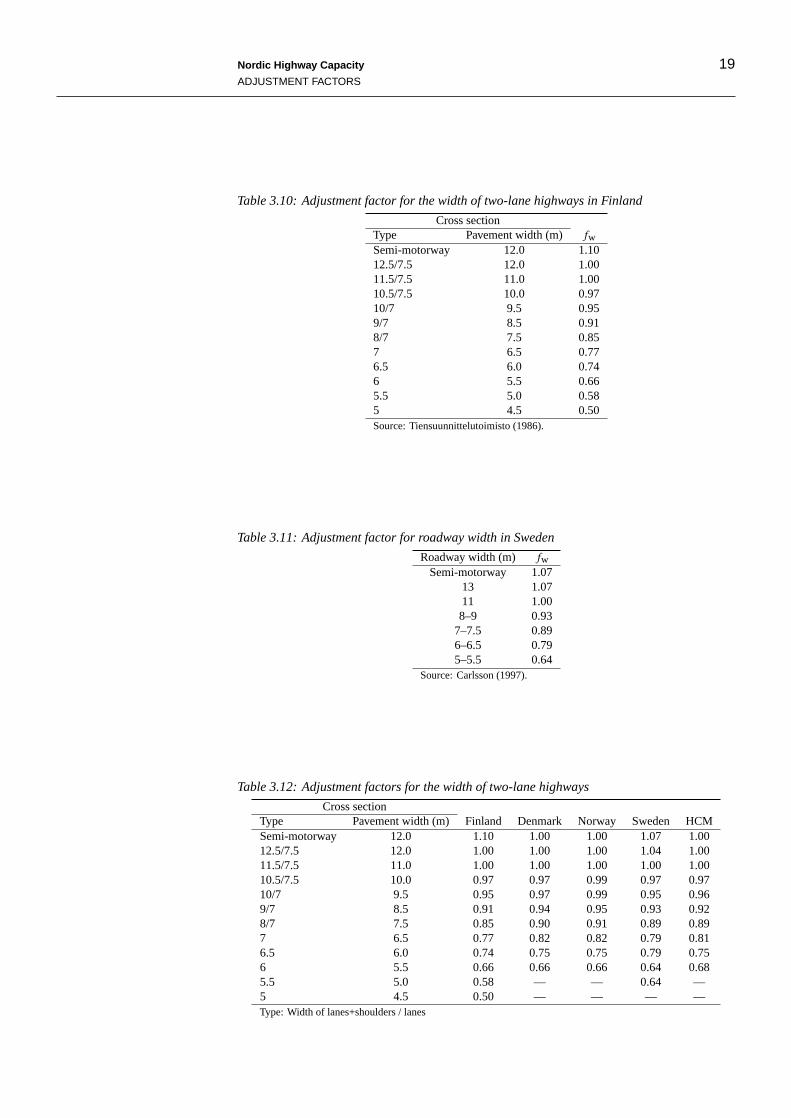
The adjustment factors inFinland (table 3.10) andSweden(table 3.11) are based onthe 1985 HCM, but are expressed in terms of standard cross sections. Both tables haveadjustment some factors greater than unity, which indicates capacities greater than2,800pc/h on some high-class two-lane highways.
In Finland (Tiensuunnittelutoimisto 1986) the ideal capacity for semi-motorways is3,080pc/h. The IVAR software (Tie- ja liikennetekniikka 1998a) applies 2,800pc/h forsemi-motorways also, but givesfw = 1.30 for two-lane highways having a wide lanesand pavement wider than 13 meters. The resulting capacity estimate is 3,640pc/h atideal conditions. On highways having 6.5–9.5m wide pavements the Finnish adjust-ment factors are slightly below the 1985 HCM factors.
In Sweden (Carlsson 1997) the capacity estimate for semi-motorways is 3,000pc/h,which is also the ideal capacity for 13 meters wide highways. Otherwise, the Swedishadjustment factors follow the 1985 HCM very closely. Table 3.12 displays a comparisonof Nordic adjustment factors for roadway width.
18 Nordic Highway Capacity
ADJUSTMENT FACTORS
Table 3.8: Adjustment factor for restricted lane width and lateral clearance on divided highwaysand freeways in Denmark
Lane Distance to obstruction Distance to obstructionwidth on one side (m) on both sides (m)(m) 1.8 1.2 0.6 0 1.8 1.2 0.6 0
≥3.50 m 1.00 0.99 0.97 0.92 1.00 0.98 0.95 0.863.25 m 0.95 0.94 0.92 0.88 0.95 0.93 0.90 0.823.00 m 0.90 0.89 0.88 0.84 0.90 0.88 0.86 0.78
Source: Vejdirektoratet (1999a)
0 0.2 0.4 0.6 0.8 1 1.2 1.4 1.6 1.81000
1200
1400
1600
1800
2000
2200
2400
2600
Distance to obstruction (m)
Cap
acity
(pc
/h/la
ne)
DenmarkFinlandNorwaySweden
Figure 3.4: Capacity on divided four-lane highways as a function of the distance to obstructionon one side of the highway (lane width 3.0m, other conditions ideal)
Table 3.9: Adjustment factor for the combined effect of narrow lanes and restricted shoulderwidth (fw) at level of service E on two-lane highways in the 1985 HCM (Transportation ResearchBoard 1997)
Usable shoulder widthLane width 1.8 m 1.5 m 1.2 m 0.9 m 0.6 m 0 m
3.6 m 1.00 0.99 0.97 0.95 0.93 0.883.3 m 0.94 0.93 0.92 0.90 0.88 0.823.0 m 0.87 0.86 0.85 0.83 0.81 0.752.7 m 0.76 0.75 0.74 0.72 0.70 0.66
Nordic Highway Capacity
ADJUSTMENT FACTORS
19
Table 3.10: Adjustment factor for the width of two-lane highways in Finland
Cross sectionType Pavement width (m) fwSemi-motorway 12.0 1.1012.5/7.5 12.0 1.0011.5/7.5 11.0 1.0010.5/7.5 10.0 0.9710/7 9.5 0.959/7 8.5 0.918/7 7.5 0.857 6.5 0.776.5 6.0 0.746 5.5 0.665.5 5.0 0.585 4.5 0.50Source: Tiensuunnittelutoimisto (1986).
Table 3.11: Adjustment factor for roadway width in Sweden
Roadway width (m) fwSemi-motorway 1.07
13 1.0711 1.008–9 0.93
7–7.5 0.896–6.5 0.795–5.5 0.64
Source: Carlsson (1997).
Table 3.12: Adjustment factors for the width of two-lane highways
Cross sectionType Pavement width (m) Finland Denmark Norway Sweden HCMSemi-motorway 12.0 1.10 1.00 1.00 1.07 1.0012.5/7.5 12.0 1.00 1.00 1.00 1.04 1.0011.5/7.5 11.0 1.00 1.00 1.00 1.00 1.0010.5/7.5 10.0 0.97 0.97 0.99 0.97 0.9710/7 9.5 0.95 0.97 0.99 0.95 0.969/7 8.5 0.91 0.94 0.95 0.93 0.928/7 7.5 0.85 0.90 0.91 0.89 0.897 6.5 0.77 0.82 0.82 0.79 0.816.5 6.0 0.74 0.75 0.75 0.79 0.756 5.5 0.66 0.66 0.66 0.64 0.685.5 5.0 0.58 — — 0.64 —5 4.5 0.50 — — — —Type: Width of lanes+shoulders / lanes
20 Nordic Highway Capacity
ADJUSTMENT FACTORS
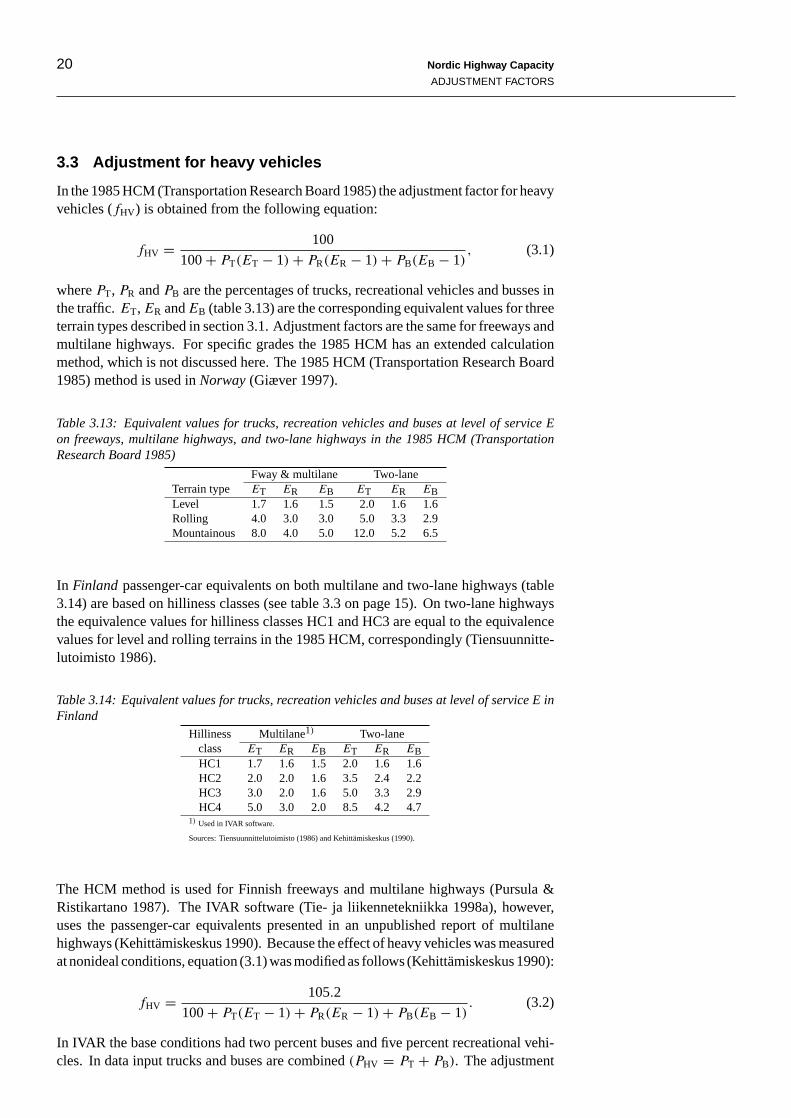
3.3 Adjustment for heavy vehicles
In the 1985 HCM (Transportation Research Board 1985) the adjustment factor for heavyvehicles (fHV) is obtained from the following equation:
fHV = 100
100+ PT(ET − 1) + PR(ER − 1) + PB(EB − 1), (3.1)
wherePT, PR andPB are the percentages of trucks, recreational vehicles and busses inthe traffic.ET, ER andEB (table 3.13) are the corresponding equivalent values for threeterrain types described in section 3.1. Adjustment factors are the same for freeways andmultilane highways. For specific grades the 1985 HCM has an extended calculationmethod, which is not discussed here. The 1985 HCM (Transportation Research Board1985) method is used inNorway(Giæver 1997).
Table 3.13: Equivalent values for trucks, recreation vehicles and buses at level of service Eon freeways, multilane highways, and two-lane highways in the 1985 HCM (TransportationResearch Board 1985)
Fway & multilane Two-laneTerrain type ET ER EB ET ER EBLevel 1.7 1.6 1.5 2.0 1.6 1.6Rolling 4.0 3.0 3.0 5.0 3.3 2.9Mountainous 8.0 4.0 5.0 12.0 5.2 6.5
In Finland passenger-car equivalents on both multilane and two-lane highways (table3.14) are based on hilliness classes (see table 3.3 on page 15). On two-lane highwaysthe equivalence values for hilliness classes HC1 and HC3 are equal to the equivalencevalues for level and rolling terrains in the 1985 HCM, correspondingly (Tiensuunnitte-lutoimisto 1986).
Table 3.14: Equivalent values for trucks, recreation vehicles and buses at level of service E inFinland
Hilliness Multilane1) Two-laneclass ET ER EB ET ER EBHC1 1.7 1.6 1.5 2.0 1.6 1.6HC2 2.0 2.0 1.6 3.5 2.4 2.2HC3 3.0 2.0 1.6 5.0 3.3 2.9HC4 5.0 3.0 2.0 8.5 4.2 4.7
1) Used in IVAR software.
Sources: Tiensuunnittelutoimisto (1986) and Kehittämiskeskus (1990).
The HCM method is used for Finnish freeways and multilane highways (Pursula &Ristikartano 1987). The IVAR software (Tie- ja liikennetekniikka 1998a), however,uses the passenger-car equivalents presented in an unpublished report of multilanehighways (Kehittämiskeskus 1990). Because the effect of heavy vehicles was measuredat nonideal conditions, equation (3.1) was modified as follows (Kehittämiskeskus 1990):
fHV = 105.2
100+ PT(ET − 1) + PR(ER − 1) + PB(EB − 1). (3.2)
In IVAR the base conditions had two percent buses and five percent recreational vehi-cles. In data input trucks and buses are combined(PHV = PT + PB). The adjustment

Nordic Highway Capacity
ADJUSTMENT FACTORS
21
is accordingly:
fHV = 100
100+ 5(ER − 1) + 2(EB − 1) + (PHV − 2)(ET − 1). (3.3)
IVAR uses the same modification (3.3) for two-lane highways also. If the assumptionsabout the percentages of buses and recreational vehicles are not valid, the model has abias.
The Danish guidelines use two categories of heavy vehicles. Categorya includes5.8–12 meters long vehicles. Categoryb includes vehicles longer than 12 meters.Accordingly, the adjustment factor for heavy vehicles is
fHV = 100
100+ Pa(Ea − 1) + Pb(Eb − 1). (3.4)
The passenger-car equivalents (table 3.15) for heavy vehicle categoriesa andb aredefined according to the grade categories in figure 3.1 on page 14.
Table 3.15: Equivalent values for heavy vehicles in Denmark
Grade Multilane Two-lanecategory Ea Eb Ea Eb
I 2.0 2.5 2.5 3.0II 3.0 4.0 3.5 4.5III 4.5 6.0 5.0 7.0IV 6.0 7.5 8.0 10.0
Source: Vejdirektoratet (1999a)
The ideal capacity in theSwedishmethod is expressed in vehicles per hour—not inpassenger car units. Consequently, no equivalence values are used. Currently theSwedish method does not have any heavy vehicle adjustment. The draft report forfour-lane highways (Carlsson & Cedersund 1998) has, however, proposed adjustmentfactors, which are presented in table 3.16. For lower (0–5) percentages the adjustmentfactors are different for left and right lanes. At higher heavy vehicle percentages theadjustment factors are the same for both lanes, because there have not been sufficientfield data to define separate values for different lanes.
Table 3.16: Adjustment factors for heavy vehicles on Swedish four-lane highways
Percentheavy vehicles fHV
0–5 0.98 left lane0–5 0.99 right lane5–10 0.96
10–15 0.9315–20 0.90
Source: Carlsson & Cedersund (1998)
Figure 3.5 displays the effect of heavy vehicles on the capacity of multilane highways.The HCM methodology is applied for multilane highways in Norway. These curvesalso describe the Finnish capacity estimates for hilliness classes HC1 and HC3. Thereare, however, separate curves for the IVAR software. The ideal capacity in IVAR is1,900pc/h, whereas the HCM curves are based on ideal capacity 2,000pc/h. Especiallyon rolling terrain (HC3) the effect of heavy vehicles is lower in IVAR than in the HCM.

22 Nordic Highway Capacity
ADJUSTMENT FACTORS
The Danish method is based on different classification of both terrain types and heavyvehicles. Assuming that the Danish grade categories I and III correspond to the level androlling terrain types in the HCM, the Danish adjustment factors are larger than the HCMfactors, but even adjusted capacities is higher than the HCM capacities. The Swedishadjustment factors are those presented in the draft report by Carlsson & Cedersund(1998) and in table 3.16.
0 5 10 15 20 25 301000
1200
1400
1600
1800
2000
2200
2400
Percentage of heavy vehicles
Cap
acity
(ve
h/h/
lane
)
HCM (level)HCM (rolling)IVAR (HC1)IVAR (HC3)Denmark (GC I)Denmark (GC III)Sweden
Figure 3.5: The effect of heavy vehicles (trucks = Danish category ‘a’vehicles) on capacity ondivided four-lane highways (other conditions ideal)
Figure 3.6 shows the effect of heavy vehicles on two-lane highway capacity. The HCMcurves for level and rolling terrain describe the results of the Norwegian method and theFinnish method for hilliness classes HC1 and HC3. The curves for IVAR software arealso displayed, and they are slightly below the HCM curves. This is caused by the effectof recreational vehicles in IVAR. For level terrain (CG I) the adjustment in Denmarkis larger than in the HCM. For grade category III the Danish method has the samepassenger car equivalent for trucks as the rolling terrain in HCM(Ea = ET = 5.0),but the capacity is higher, because the Danish method does not have any terrain typeadjustment for passenger cars. The Swedish method does not have any heavy vehicleadjustment.
3.4 Adjustment for directional distribution
The 1985 HCM (Transportation Research Board 1985) adjustment factors,fd(Pd), fordirectional distribution on two-lane highways are displayed in table 3.17. The two-waycapacity is
C = fd(Pd)2800pc/h, (3.5)
when the proportion of traffic in major direction isPd, but other conditions are ideal.There is a slight rounding error: At directional distribution 100/0 the capacity is1,988pc/h, not 2,000pc/h. The adjustment factors of HCM 1985 are used inFinlandandNorway.
The Finnish IVAR software (Tie- ja liikennetekniikka 1998a) is based on directionalanalysis. The adjustment factors (table 3.17) have been modified accordingly. The

Nordic Highway Capacity
ADJUSTMENT FACTORS
23
0 5 10 15 20 25 301000
1200
1400
1600
1800
2000
2200
2400
2600
2800
3000
Percentage of heavy vehicles
Cap
acity
(ve
h/h)
HCM (level)HCM (rolling)IVAR (HC1)IVAR (HC3)Denmark (GC I)Denmark (GC III)Sweden
Figure 3.6: The effect of heavy vehicles (trucks = Danish category ‘a’vehicles) on capacity ontwo-lane highways (other conditions ideal)
Table 3.17: Adjustment factors for directional distribution for two-lane highways in HCM 1985and IVAR
Directional distribution 50/50 60/40 70/30 80/20 90/10 100/0HCM 1985 1.00 0.94 0.89 0.83 0.75 0.71IVAR 0.50 0.55 0.62 0.66 0.68 0.71Sources: Transportation Research Board (1985) and Tie- ja liikennetekniikka (1998a).
capacity adjusted for the effect of opposing flow according to IVAR is
C = fd(Pd)2800
Pdpc/h, (3.6)
wherefd(Pd) is the adjustment factor for directional distributionPd. For an evendirectional distribution with no passing restrictions the capacity is
C = 0.50× 2 × 2800= 2800pc/h. (3.7)
The capacity of unidirectional traffic flow at otherwise ideal conditions is
C = 0.71× 1 × 2800= 1988pc/h. (3.8)
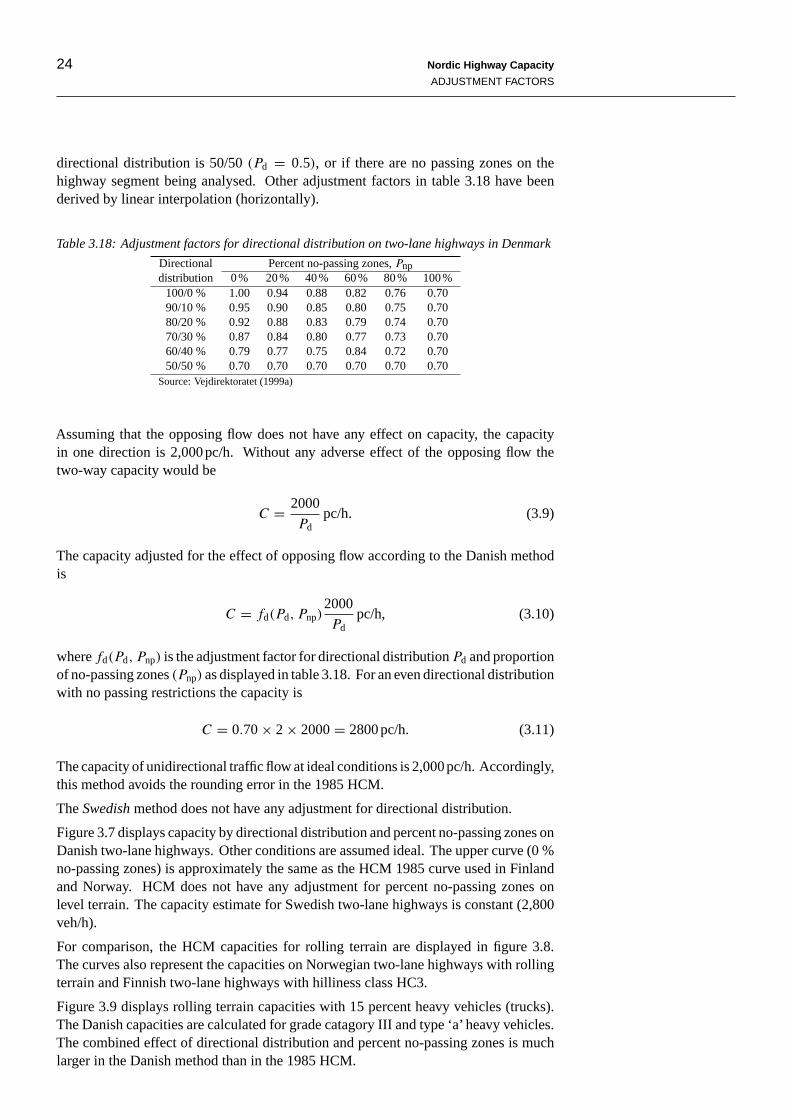
TheDanishadjustment for directional distribution uses the percentage of no-passingzones as an additional parameter (Vejdirektoratet 1999a). The approach will be followedin the HCM 2000, although the adjustment there will also depend on the two-way flowrate (Harwood, May, Anderson, Leiman, & Archilla 1999). In the 1985 HCM thepercentage of no-passing zones is included in the volume-to-capacity ratio(v/c)E,which is not used in the Danish method.
The Danish adjustment factors in table 3.18 are applied on a directional basis. Fora two-lane highway with no passing restrictions(Pnp = 0) the adjustment is, withinrounding precision, the same as in the 1985 HCM. The adjustment factor is 0.70, if
24 Nordic Highway Capacity
ADJUSTMENT FACTORS
directional distribution is 50/50(Pd = 0.5), or if there are no passing zones on thehighway segment being analysed. Other adjustment factors in table 3.18 have beenderived by linear interpolation (horizontally).
Table 3.18: Adjustment factors for directional distribution on two-lane highways in Denmark
Directional Percent no-passing zones,Pnpdistribution 0% 20% 40% 60% 80% 100%
100/0 % 1.00 0.94 0.88 0.82 0.76 0.7090/10 % 0.95 0.90 0.85 0.80 0.75 0.7080/20 % 0.92 0.88 0.83 0.79 0.74 0.7070/30 % 0.87 0.84 0.80 0.77 0.73 0.7060/40 % 0.79 0.77 0.75 0.84 0.72 0.7050/50 % 0.70 0.70 0.70 0.70 0.70 0.70
Source: Vejdirektoratet (1999a)
Assuming that the opposing flow does not have any effect on capacity, the capacityin one direction is 2,000pc/h. Without any adverse effect of the opposing flow thetwo-way capacity would be
C = 2000
Pdpc/h. (3.9)
The capacity adjusted for the effect of opposing flow according to the Danish methodis
C = fd(Pd, Pnp)2000
Pdpc/h, (3.10)
wherefd(Pd, Pnp) is the adjustment factor for directional distributionPd and proportionof no-passing zones(Pnp) as displayed in table 3.18. For an even directional distributionwith no passing restrictions the capacity is
C = 0.70× 2 × 2000= 2800pc/h. (3.11)
The capacity of unidirectional traffic flow at ideal conditions is 2,000pc/h. Accordingly,this method avoids the rounding error in the 1985 HCM.
TheSwedishmethod does not have any adjustment for directional distribution.
Figure 3.7 displays capacity by directional distribution and percent no-passing zones onDanish two-lane highways. Other conditions are assumed ideal. The upper curve (0 %no-passing zones) is approximately the same as the HCM 1985 curve used in Finlandand Norway. HCM does not have any adjustment for percent no-passing zones onlevel terrain. The capacity estimate for Swedish two-lane highways is constant (2,800veh/h).
For comparison, the HCM capacities for rolling terrain are displayed in figure 3.8.The curves also represent the capacities on Norwegian two-lane highways with rollingterrain and Finnish two-lane highways with hilliness class HC3.
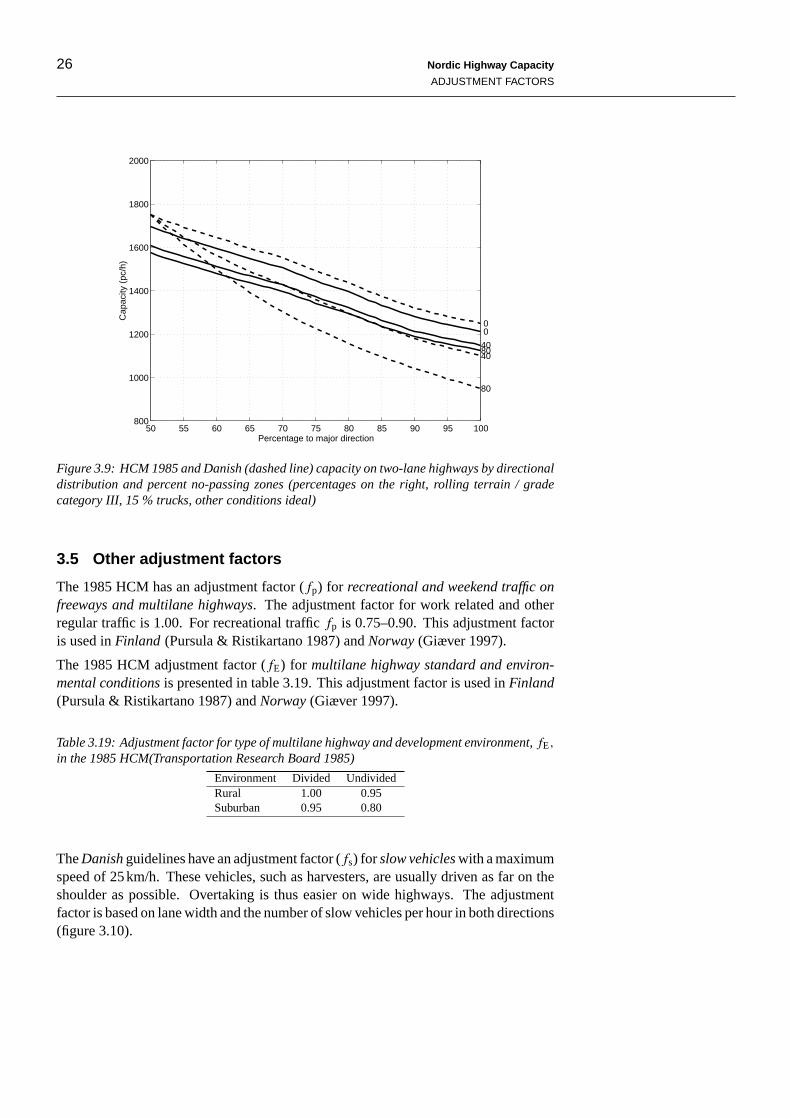
Figure 3.9 displays rolling terrain capacities with 15 percent heavy vehicles (trucks).The Danish capacities are calculated for grade catagory III and type ‘a’ heavy vehicles.The combined effect of directional distribution and percent no-passing zones is muchlarger in the Danish method than in the 1985 HCM.

Nordic Highway Capacity
ADJUSTMENT FACTORS
25
50 55 60 65 70 75 80 85 90 95 1001000
1200
1400
1600
1800
2000
2200
2400
2600
2800
3000
Percentage to major direction
Cap
acity
(pc
/h)
0
20
40
60
80
100
Figure 3.7: Capacity on Danish two-lane highways by directional distribution and percentno-passing zones (percentages on the right, other conditions ideal)
50 55 60 65 70 75 80 85 90 95 1001000
1200
1400
1600
1800
2000
2200
2400
2600
2800
3000
Percentage to major direction
Cap
acity
(pc
/h)
0
4080
Figure 3.8: HCM 1985 capacity on two-lane highways by directional distribution and percentno-passing zones (percentages on the right, rolling terrain, other conditions ideal)
26 Nordic Highway Capacity
ADJUSTMENT FACTORS
50 55 60 65 70 75 80 85 90 95 100800
1000
1200
1400
1600
1800
2000
Percentage to major direction
Cap
acity
(pc
/h)
0
40
80
0
4080
Figure 3.9: HCM 1985 and Danish (dashed line) capacity on two-lane highways by directionaldistribution and percent no-passing zones (percentages on the right, rolling terrain / gradecategory III, 15 % trucks, other conditions ideal)
3.5 Other adjustment factors
The 1985 HCM has an adjustment factor (fp) for recreational and weekend traffic onfreeways and multilane highways. The adjustment factor for work related and otherregular traffic is 1.00. For recreational trafficfp is 0.75–0.90. This adjustment factoris used inFinland (Pursula & Ristikartano 1987) andNorway(Giæver 1997).
The 1985 HCM adjustment factor (fE) for multilane highway standard and environ-mental conditionsis presented in table 3.19. This adjustment factor is used inFinland(Pursula & Ristikartano 1987) andNorway(Giæver 1997).
Table 3.19: Adjustment factor for type of multilane highway and development environment,fE,
in the 1985 HCM(Transportation Research Board 1985)
Environment Divided UndividedRural 1.00 0.95Suburban 0.95 0.80
TheDanishguidelines have an adjustment factor (fs) for slow vehicleswith a maximumspeed of 25km/h. These vehicles, such as harvesters, are usually driven as far on theshoulder as possible. Overtaking is thus easier on wide highways. The adjustmentfactor is based on lane width and the number of slow vehicles per hour in both directions(figure 3.10).

Nordic Highway Capacity
ADJUSTMENT FACTORS
27
Figure 3.10: Adjustment factor for slow vehicles on Danish two-lane highways (Vejdirektoratet1999a)

28 Nordic Highway Capacity
CONCLUSIONS
4 CONCLUSIONS
All Nordic capacity calculation methods follow the third edition of the Highway Ca-pacity Manual (Transportation Research Board 1985). The Norwegian guidelines areclosest to the 1985 HCM method. The Finnish method is also very close to the HCM.The Swedish method is a simplified version of the 1985 HCM. The draft guidelines inDenmark follow the 1994 update of HCM (Transportation Research Board 1994) andhave more originality than the other Nordic methods.
TheNorwegianmethod is almost a copy of the 1985 HCM. The only major modifica-tion is a distinct adjustment factor (fw) for restricted lane width and lateral clearanceon undivided multilane highways. This makes the capacity estimates for undividedhighways lower. Lane and shoulder widths on two-lane and multilane highways arerounded downwards so that the same capacity is reached on narrower highways thanin the HCM.
In Finland the 1985 HCM method for freeways and multilane highways is used. Fortwo-lane highways the major modifications are in the classification terrain in terms offour hilliness classes (HC1–HC4). This affects the adjustment for terrain type,(v/c)E,and the adjustment for heavy vehicles,fHV. In addition, the roadway width is expressedas standard cross sections. These modifications have been made so that the Finnish roaddatabase would be used more easily in capacity calculations. The ideal capacity for asemi-motorway is 3,080pc/h. The IVAR software gives an ideal capacity of 3,640pc/hfor two-lane highways with wide lanes.
In Denmarkthe ideal capacity on freeways and multilane highways is higher than inthe 1985 HCM, and consequently, in Finland and Norway. The Danish guidelines donot have an adjustment factor for terrain type [(v/c)E], for recreational and weekendtraffic on freeways and multilane highways (fp), or for multilane highway standard andenvironment (fE). The effect of percent no-passing zones is considered in the contextof the adjustment for directional distribution (fd). The adjustment factors for roadwaywidth (fw) are slightly modified, and the adjustment factors for heavy vehicles arebased on Danish classifications of terrain types and vehicle types. A distinctive featureof the Danish method is the adjustment factor for slow vehicles (fs). The estimatedideal capacity for wide two-lane highways is 3,200pc/h.
In Sweden, the adjustment factors for two-lane roadway width (fw) follow the 1985HCM. No other adjustment factors are used. Consequently, the capacity estimatesfor rolling or mountainous terrains with a skewed directional distribution, passing re-strictions and high heavy vehicle percentages are much higher than in other Nordicmethods. For semi-motorways and 13 meters wide two-lane highways the ideal capac-ity is 3,000pc/h. On freeways and multilane highways the capacity is higher on innerlane(s) than on outer lane(s). The overall capacity is also higher than in the 1985 HCM.Because the analytical methods are currently under development, simulation studiesare suggested for more complicated situations.
The capacity on ideal three-lane highways has been defined in Denmark and Sweden.The capacity estimate for Danish three-lane highways (2,660pc/h) is a little larger thanin Sweden (2,600pc/h).
In many countries calculations are performed by special computer software. Thesesoftware have not been used, but the calculations presented above are based on reportedcapacity models. The Finnish IVAR software was, however, briefly discussed.

Nordic Highway Capacity
REFERENCES
29
REFERENCES
Bureau of Public Roads 1950.Highway Capacity Manual. Washington, D.C.: U.S.Department of Commerce.
Carlsson, A. 1992.Hastighetsflödesdiagram på timnivå. Väg- och Trafikinstitutet,Trafikavdelningen.
Carlsson, A. 1997. NORDKAP—National översikt, Sverige. In: Vägverket (1997).
Carlsson, A. & Cedersund, H.-Å. 1998.Modell för fyrfältiga väglänkar: En makrohastighet-flödes-modell för fyrfältig väg. Royal Institute of Technology. Draftreport.
Enberg,Å. 1997.Traffic flow characteristics on a three-lane rural highway in Finland:Results from empirical studies and simulations. In:Transportation ResearchRecord 1572. pp. 33–42. Washington, D.C.: Transportation Research Board.
Giæver, T. 1997. Metoder for å bestemme kapasitet og servicenivå påvegstrekninger— en oversikt over allmenn praksis og pågående trafikkavviklings-forskning i Norge. In: Vägverket (1997).
Harwood, D. W., May, A. D., Anderson, I. B., Leiman, L., & Archilla, A. R. 1999.Capacity and Quality of Service of Two-Lane Highways. n.a.: TransportationResearch Board. (NCHRP Final Report 3-55(3)).
Highway Research Board 1965.Highway Capacity Manual. Washington, D.C. Spe-cial Report 87.
Kehittämiskeskus 1990.Monikaistaisten teiden palvelutaso[Level of service onmultilane highways]. Helsinki: Tiehallitus. Unpublished.
Pursula, M. & Ristikartano, J. 1987. Liikennevirta ja liikenteenvälityskyky [trafficflow and capacity]. In: Lyly, S. (ed.)Liikenne ja väylät I[Traffic and transportationfacilities I]. pp. 131–177. Helsinki: Suomen Rakennusinsinöörien Liitto RIL. RIL165-1.
Sørensen, H. & Rysgaard, R. 1997. NORDKAP—National oversigt, Danmark. In:Vägverket (1997).
Statens Vägverk 1977.Beräkning av kapacitet, kölängd, fördröjning i vägtrafikan-läggningar. TV 131.
Statens Vägverk 1994.Vägutformning 94, Del 5 Sektion. Borlänge. Publikation1994:051.
Tie- ja liikennetekniikka 1998a.IVAR: Investointihankkeiden vaikutusten arviointi-ohjelmisto[IVAR: Investment Impact Analysis Software]. Helsinki: Tielaitos.Version 1.2, Unpublished.
Tie- ja liikennetekniikka 1998b.IVAR-ohjelmiston käyttäjän opas[User’s Manualfor IVAR Software]. Helsinki: Tielaitos. Unpublished.
Tiensuunnittelutoimisto 1986.Kaksikaistaisen tien liikenteellinen palvelutaso:Laskentaohje[Level of service manual for two-lane highways]. Helsinki: Tie-ja vesirakennushallitus. TVH 723856.
Transportation Research Board 1985.Highway Capacity Manual. Washington, D.C.Special Report 209.
Transportation Research Board 1992.Highway Capacity Manual. Third ed. Wash-ington, D.C.: National Research Council. (Special Report 209). Revised May1992.
30 Nordic Highway Capacity
REFERENCES
Transportation Research Board 1994.Highway Capacity Manual. Third ed. Wash-ington, D.C.: National Research Council. (Special Report 209). Updated October1994.
Transportation Research Board 1997.Metric Analysis Reference Guide: Supplementto 1997 Update of Special Report 209 Highway Capacity Manual. Washington,D.C. Transportation Research Circular 489.
Transportation Research Board 1998.Highway Capacity Manual. Third ed. Wash-ington, D.C.: National Research Council. (Special Report 209). Updated Decem-ber 1997.
Vägverket 1997.NORDKAP—NORDiskt KAPacitetssamarbete: Nordiska metoderför beräkning av kapacitet ock servicenivå på vägsträckor. Dickursby, Finland.
Vejdirektoratet 1996.Korrektion for trafikkens sammensætning: Motorveje—fristrækning. Copenhagen. Notat nr. 26.
Vejdirektoratet 1999a.Kapacitet og serviceniveau. n.p. Draft.
Vejdirektoratet 1999b.Kapacitet og serviceniveau: Baggrund og dokumentation.n.p. Draft.