finolex industries limited investor presentation … · overview leading brand in indian pvc pipe...
TRANSCRIPT
Investor Presentation
June 2017
FINOLEX INDUSTRIES LIMITED

Contents
Disclaimer: No part of this presentation is to be circulated, quoted, or reproduced for any distribution without prior written approval from Finolex Industries Limited, Chinchwad, Pune-411 019, India. Certain part of this presentation describing estimates, objectives and projections may be a “forward looking statement” within the meaning of applicable laws and regulations. Actual results might differ materially from those either expressed or implied.
Overview 3
Milestones 4
Business Segments 5
Products 6
Manufacturing Plants 7
Pan India Reach 9
Value Chain 10
Business Model 11
Key Strategies 12
Union Budget Highlights 2017-18 13
2
Key Performance Indicators 17
Branding 15
Balance Sheet 19
Profit and Loss Account 20
Segmental – Profit and Loss 21
Q4FY17 & FY17 Results Summary 22
Quarterly - Profit and Loss 23
Green Initiatives 27
Corporate Social Responsibility (CSR)
Accolades and awards 31
Shareholding Pattern 32
Financial Highlights 16
29

Overview
Leading brand
in
Indian PVC
pipe
and fittings
One of the largest
PVC
resin manufacturer
in India
Largest backward
integrated pipe
and
fittings
manufacturer
in India
43 MW power
plant for captive
consumption in
Ratnagiri
3
Back to Contents
page
Milestones
4
Back to Contents
page
1981 1985 1994 1996 1999 2002 2006 2007 2008 2009 2012 2014 2015 2016
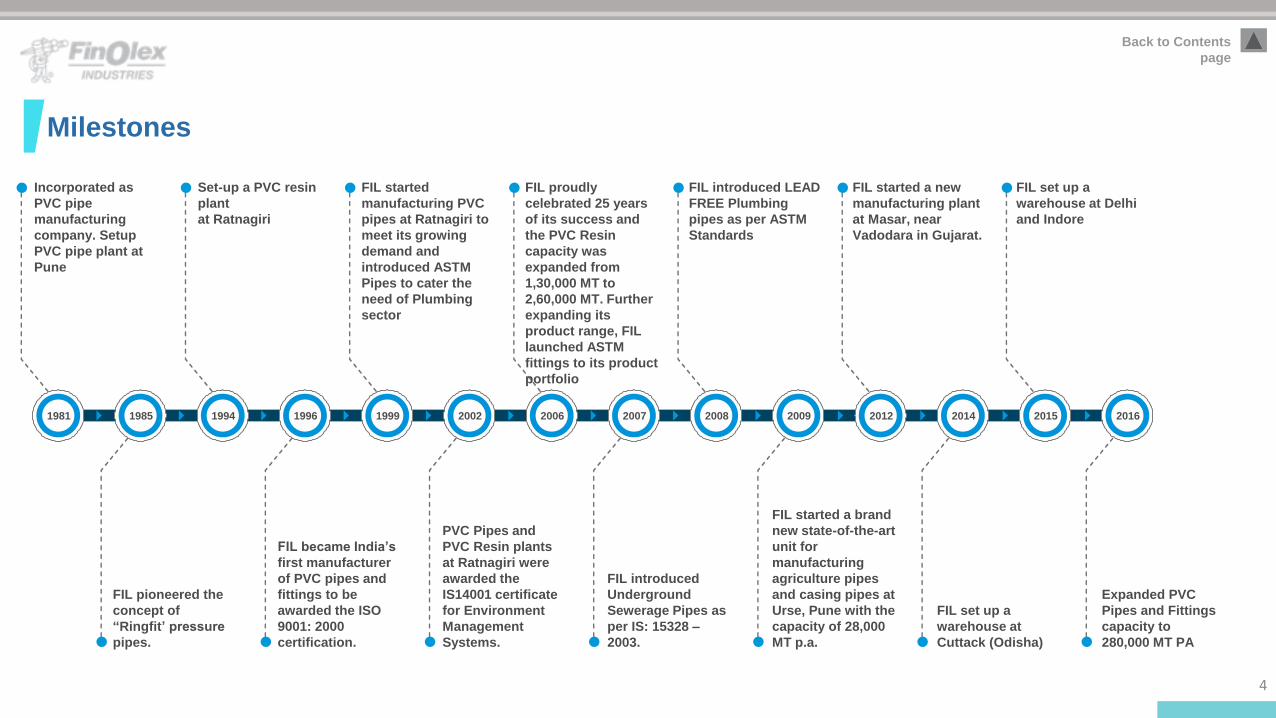
Incorporated as
PVC pipe
manufacturing
company. Setup
PVC pipe plant at
Pune
Set-up a PVC resin
plant
at Ratnagiri
FIL started
manufacturing PVC
pipes at Ratnagiri to
meet its growing
demand and
introduced ASTM
Pipes to cater the
need of Plumbing
sector
FIL proudly
celebrated 25 years
of its success and
the PVC Resin
capacity was
expanded from
1,30,000 MT to
2,60,000 MT. Further
expanding its
product range, FIL
launched ASTM
fittings to its product
portfolio
FIL introduced LEAD
FREE Plumbing
pipes as per ASTM
Standards
FIL started a new
manufacturing plant
at Masar, near
Vadodara in Gujarat.
FIL set up a
warehouse at Delhi
and Indore
FIL pioneered the
concept of
“Ringfit’ pressure
pipes.
FIL became India’s
first manufacturer
of PVC pipes and
fittings to be
awarded the ISO
9001: 2000
certification.
PVC Pipes and
PVC Resin plants
at Ratnagiri were
awarded the
IS14001 certificate
for Environment
Management
Systems.
FIL introduced
Underground
Sewerage Pipes as
per IS: 15328 –
2003.
FIL started a brand
new state-of-the-art
unit for
manufacturing
agriculture pipes
and casing pipes at
Urse, Pune with the
capacity of 28,000
MT p.a.
FIL set up a
warehouse at
Cuttack (Odisha)
Expanded PVC
Pipes and Fittings
capacity to
280,000 MT PA

Business Segments
With 3 manufacturing plants having a combined
capacity of 280,000 mtpa FIL offers a wide range
of PVC pipe & fittings for diverse applications in
agriculture and non-agriculture sectors including
housing, industrial and construction.
With a capacity of 272,000 mtpa of PVC resin,
backward integration gives FIL the unique
advantage of a consistent quality and availability
of raw material. With the rising internal
consumption of PVC resin, FIL’s business model
is increasingly transforming to be B2C.
43 MW power plant at Ratnagiri (Maharashtra) is
entirely for captive use and provides
uninterrupted power to FIL's production facility
there.
5
Back to Contents
page

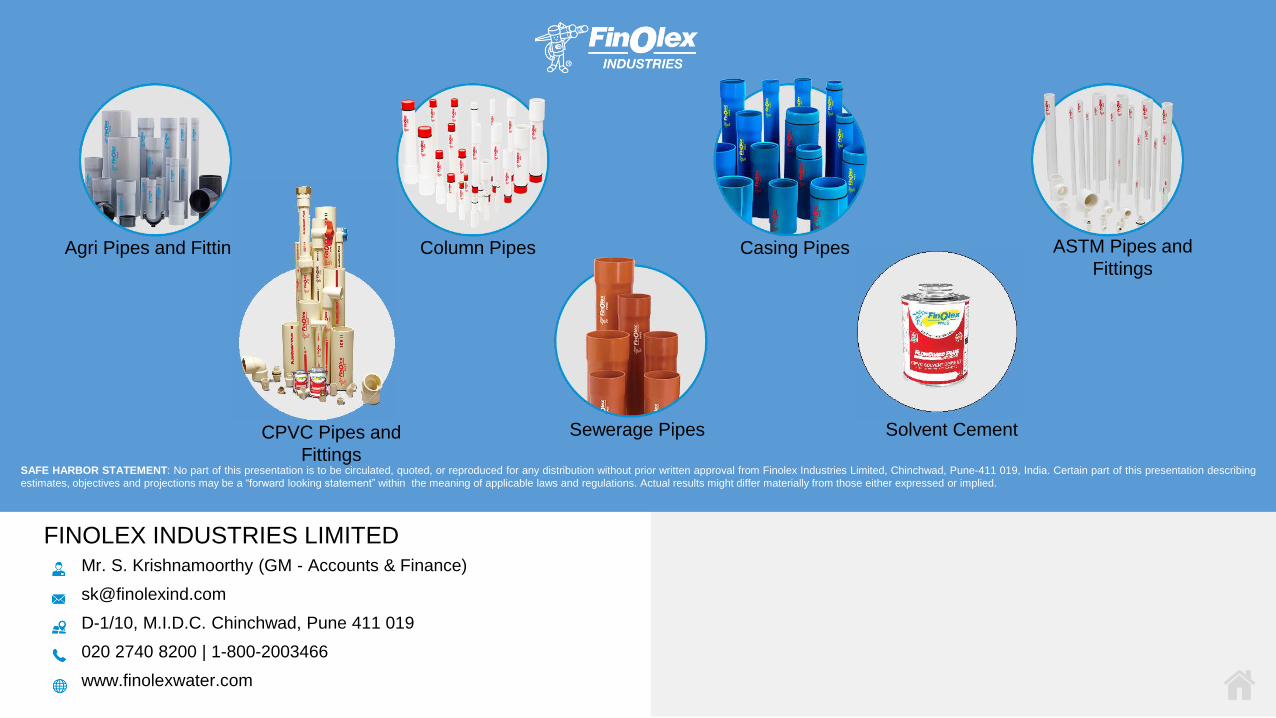
Products Agricultural Pipes & Fittings
Agricultural pipes & fittings Column pipes Casing pipes
Plumbing & Sanitation Pipes & Fittings
ASTM Pipes & Fittings CPVC Pipes & Fittings Sewerage Pipes
Solvent Cement
6
Back to Contents
page

Manufacturing Plant
Storage
tanks
for raw
material
PVC resin
Plant at
Ratnagiri
7
Back to Contents
page
PVC
resin
storage
section
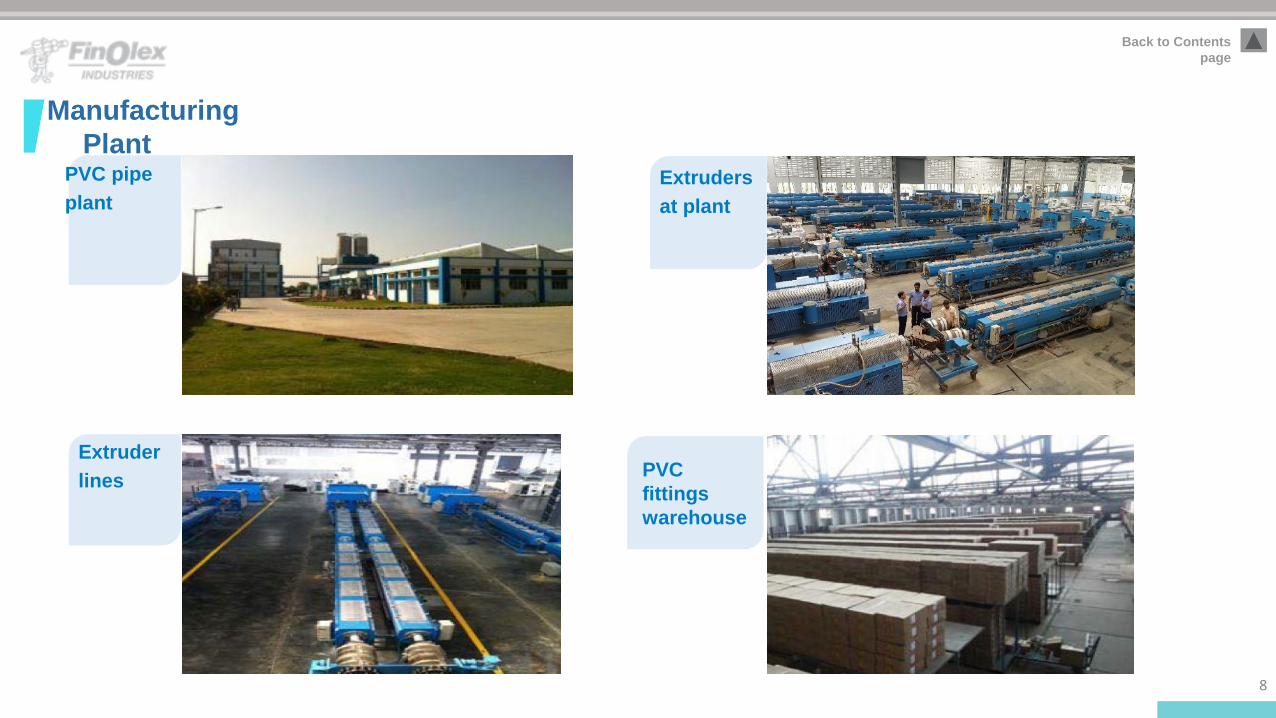
Manufacturing
Plant PVC pipe
plant
Extruders
at plant
Extruder
lines PVC
fittings
warehouse
8
Back to Contents
page
Pan India Reach
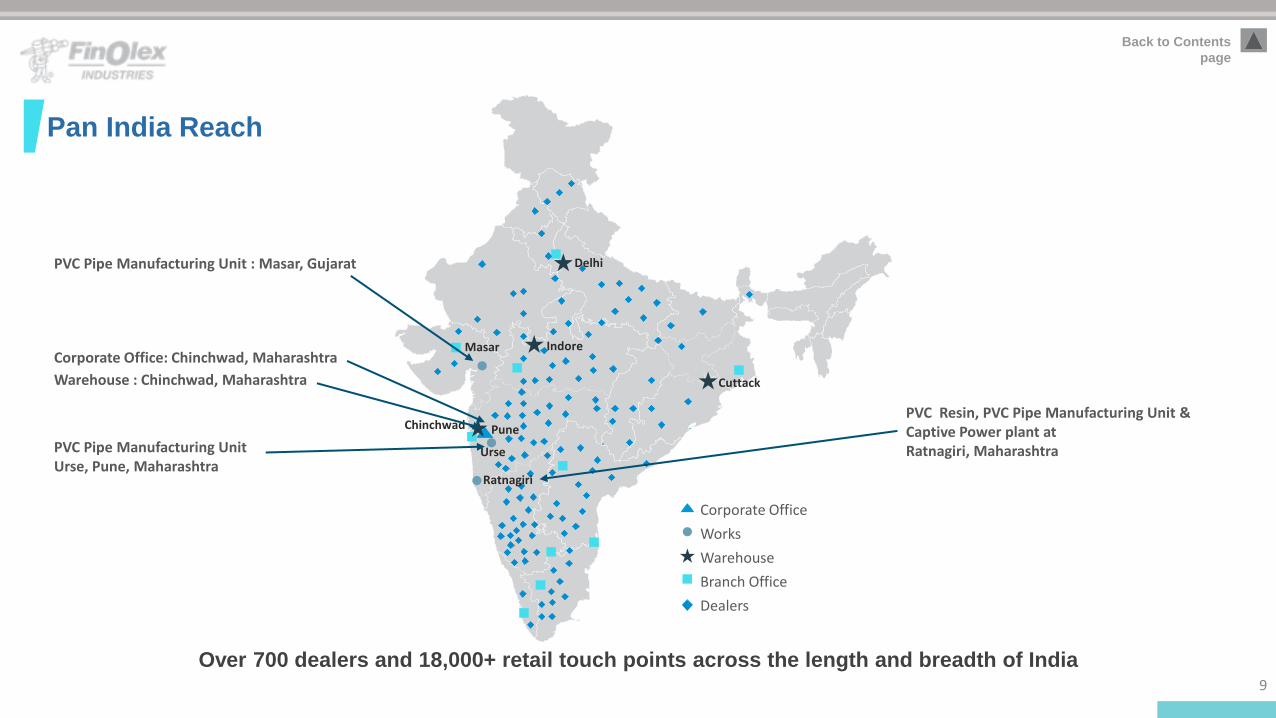
Over 700 dealers and 18,000+ retail touch points across the length and breadth of India 9
Back to Contents
page
Corporate Office
Works
Warehouse
Branch Office
Dealers
Delhi
Masar Indore
Urse
Pune Chinchwad
Cuttack
Ratnagiri
PVC Pipe Manufacturing Unit : Masar, Gujarat
PVC Pipe Manufacturing Unit Urse, Pune, Maharashtra
Corporate Office: Chinchwad, Maharashtra
PVC Resin, PVC Pipe Manufacturing Unit & Captive Power plant at Ratnagiri, Maharashtra
Warehouse : Chinchwad, Maharashtra

Value chain
10
Back to Contents
page

Business Model
Key revenue driver – mainly PVC pipes and fittings segment, with steadily increasing in-house consumption of
the PVC resin
Market wise sales are distributed between
Agriculture (70%) and Non-agriculture (30%).
Non-agriculture is mainly construction
Key cost components - EDC, Ethylene and VCM are key raw materials for PVC production. PVC Resin is the key
raw material for Pipes & Fittings production
Margins improvement initiatives are
underway, however, raw material prices
movement does impact operating
margins in PVC resin segment
PVC Pipe – Addressable Market
Operating under cash-n-carry model
FIL – 280,000 MT p.a. 25% share in organised
market
11
Back to Contents
page

Key Strategies
12
Back to Contents
page
MARGIN IMPROVEMENT
Increase sales of higher
margin products. Scale
up share of fittings in
sales mix.
CAPACITY EXPANSION Increase installed
capacities of PVC pipes
and fittings in order to
capture expected
increase in demand.
CASH-N-CARRY Cash-n-carry model to
keep the balance sheet
light.
BRANDING Growing brand and
quality consciousness
amongst consumer.
13
Back to Contents
page
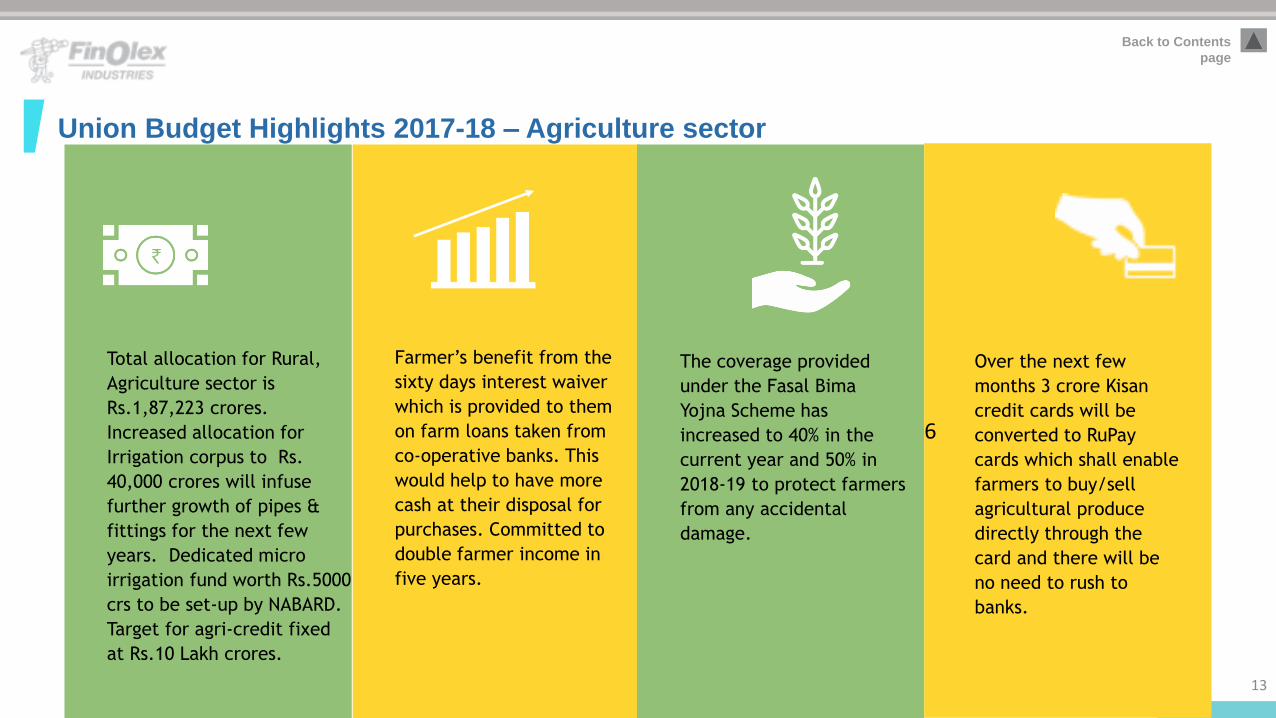
Union Budget Highlights 2017-18 – Agriculture sector
6
Total allocation for Rural,
Agriculture sector is
Rs.1,87,223 crores.
Increased allocation for
Irrigation corpus to Rs.
40,000 crores will infuse
further growth of pipes &
fittings for the next few
years. Dedicated micro
irrigation fund worth Rs.5000
crs to be set-up by NABARD.
Target for agri-credit fixed
at Rs.10 Lakh crores.
Farmer’s benefit from the
sixty days interest waiver
which is provided to them
on farm loans taken from
co-operative banks. This
would help to have more
cash at their disposal for
purchases. Committed to
double farmer income in
five years.
The coverage provided
under the Fasal Bima
Yojna Scheme has
increased to 40% in the
current year and 50% in
2018-19 to protect farmers
from any accidental
damage.
Over the next few
months 3 crore Kisan
credit cards will be
converted to RuPay
cards which shall enable
farmers to buy/sell
agricultural produce
directly through the
card and there will be
no need to rush to
banks.

14
Back to Contents
page
Non - Agriculture sector
Surplus liquidity post
demonetisation,
government initiates to
provide houses in rural
and urban areas which
may have a fresh demand
for pipes. Affordable
housing to be given
infrastructure status.
Proposal to complete
construction of one crore
houses by 2019. Boost in
housing due to refinancing
by NHB.
During 2017-18, another
5 lakh ponds will be
constructed for drought-
proofing.
Swachh Bharat Mission
(Gramin) has made
tremendous progress in
promoting safe sanitation.
Sanitation coverage in rural
India has gone up from 42%
in October 2014 to about
60%. Villages with sanitation
coverage are now being
given priority for piped
water supply.
15
Back to Contents
page
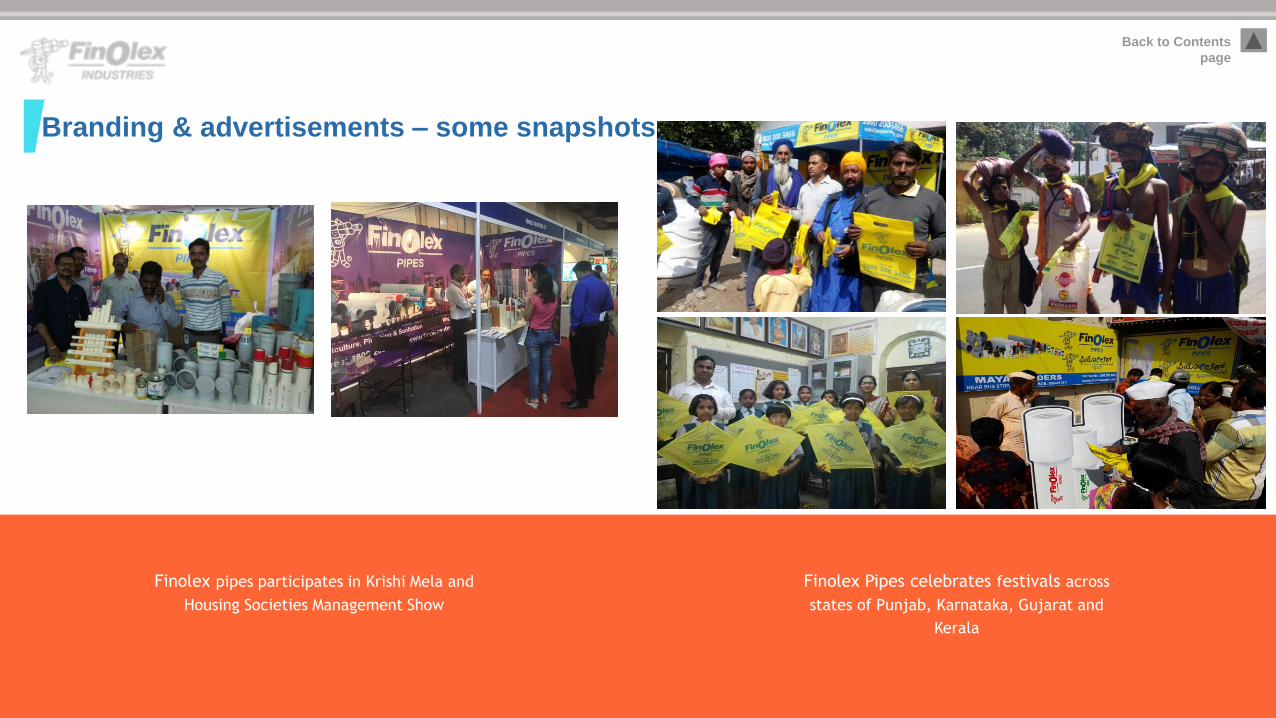
Branding & advertisements – some snapshots
Finolex pipes participates in Krishi Mela and
Housing Societies Management Show
Finolex Pipes celebrates festivals across
states of Punjab, Karnataka, Gujarat and
Kerala

Financial Highlights
Back to Contents
page
FY11 FY12 FY13 FY14 FY15 FY16 FY17
1,2
9,3
24
1,4
0,3
68
1,6
4,0
18
1,6
5,9
98
1,7
3,8
84
1,9
4,2
25
1,9
3,9
90
8,998 10,362
10,969 10,901 11,821
14,570 15,349
FY11 FY12 FY13 FY14 FY15 FY16 FY17
Pipes Fittings
Revenue breakup (INR Mn)
24,761 24,530
21,448 20,998
19,777
Resins Sales Volume (External) (MT PA)
FY11 FY12 FY13 FY14 FY15 FY16 FY17
PVC Pipe & Fittings 9,056
10,534 13,559 15,113 16,395 17,821 19,545
PVC Resin ( external sales)
8,907
9,051 7,115 8,664 7,680 6,696 6,347
Power ( external sales) 1,148
544 493 154 32 11 _
Total Revenue from
Operations
16
24,528
1,71,460 1,61,986
1,16,217 1,24,122 1,21,423
1,06,771
-
20,000
40,000
60,000
80,000
1,00,000
1,20,000
1,40,000
1,60,000
1,80,000
2,00,000
FY11 FY12 FY13 FY14 FY15 FY16 FY17
87236
25,892

Key performance indicators
17
Back to Contents
page
*Standalone EBITDA Margin (EBITDA before Exceptional item and other
income)
11.9% 11.0%
16.7% 16.2%
8.5%
16.3%
21.6%
FY11 FY12 FY13 FY14 FY15 FY16 FY17
EBITDA Margin*
1.20
1.60
1.20
0.90 0.80
0.13 0.04
FY11 FY12 FY13 FY14 FY15 FY16 FY17
Debt/Equity (x)
2.29 2.42
2.31
2.62 2.82
3.32 3.41
FY11 FY12 FY13 FY14 FY15 FY16 FY17
Fixed Asset Turnover (x)
7,466
10,424
8,394
7,134 6,371
2,117
942
FY11 FY12 FY13 FY14 FY15 FY16 FY17
Gross Debt (INR Mn)
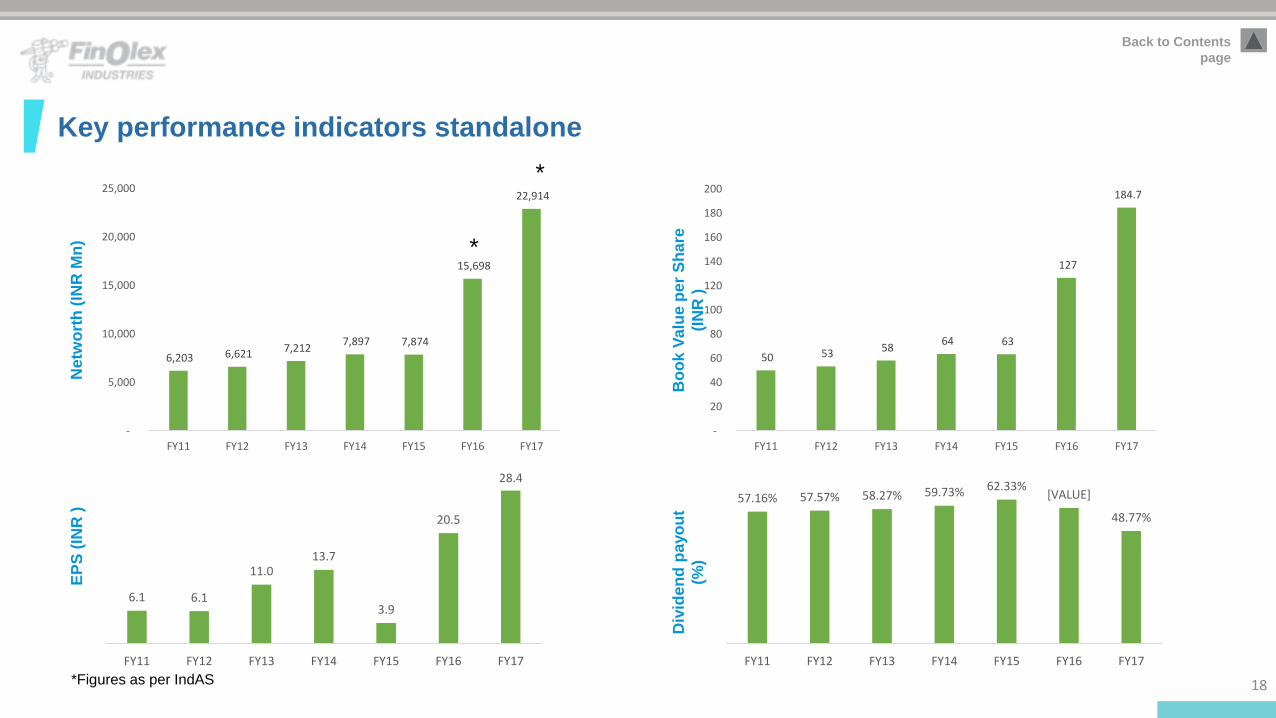
Key performance indicators standalone
18
Back to Contents
page
Netw
ort
h (
INR
Mn
)
6.1 6.1
11.0 13.7
3.9
20.5
28.4
FY11 FY12 FY13 FY14 FY15 FY16 FY17
EP
S (
INR
)
Bo
ok
Va
lue
per
Sh
are
(IN
R )
57.16% 57.57% 58.27% 59.73% 62.33% [VALUE]
48.77%
FY11 FY12 FY13 FY14 FY15 FY16 FY17
Div
ide
nd
payo
ut
(%)
6,203 6,621 7,212 7,897 7,874
15,698
22,914
-
5,000
10,000
15,000
20,000
25,000
FY11 FY12 FY13 FY14 FY15 FY16 FY17
*
*
50 53 58 64 63
127
184.7
-
20
40
60
80
100
120
140
160
180
200
FY11 FY12 FY13 FY14 FY15 FY16 FY17
*Figures as per IndAS

Balance sheet – Key indicators
19
Back to Contents
page
Note: As per the provisions of section 129 (3) of the Companies Act, 2013, the Company has prepared consolidated financials statements (includes Finolex Plasson Industries Pvt
Ltd) for the first time in FY 16.
*Figures as per IndAS
Balance Sheet (INR Mn) FY12 FY13 FY14 FY15 FY16* FY17*
Equity and liabilities
Share capital 1,241 1,241 1,241 1,241 1,241 1,241
Reserves and surplus 5,381 5,971 6,656 6,633 14,458 21,673
Long term borrowings 1,896 1,397 2,322 1,837 - -
Short term borrowings (incl. loans repayable in
one year) 8,528 6,997 4,812 4,534 1,117 942
Total borrowings 10,424 8,394 7,134 6,371 1,117 942
Assets
Fixed assets (Net block) 7,840 8,795 9,052 8,678 8,496 8,551
Capital WIP 854 506 325 104 66 217
Non current investments 1,221 1,274 1,274 1,246 6,485 11,656
Current investments 3,711 2,322 941 551 1,687 566

Profit & Loss – Key indicators
20
Back to Contents
page
Note: As per the provisions of section 129 (3) of the Companies Act, 2013, the Company has prepared consolidated financials statements (includes Finolex Plasson Industries Pvt
Ltd) for the first time in FY16 and as such previous years’ figures have not been disclosed.
*Figures as per IndAS
Profit & loss account (INR Mn) FY12 FY13 FY14 FY15 FY16* FY17*
Revenue from Operations (incl. excise duty) 23,219 24,334 27,867 28,271 28,431 29,876
Growth in sales (YoY %) 5.94% 4.80% 14.52% 1.44% 0.57% 5.08%
EBIDTA before exceptional items 2,313 3,587 3,966 2,111 4,044 5,630
EBIDTA margins before exceptional items
(%) 9.96% 14.74% 14.23% 7.47% 14.22% 18.84%
EBIDTA after exceptional items 2,168 2,626 3,268 1,896 4,289 5,630
PBT 967 1,902 2,419 808 3,733 5,170
PBT Margin (%) 4.16% 7.82% 8.68% 2.86% 13.13% 17.30%
PAT 752 1,361 1,701 478 2,544 3,522
PAT Margin (%) 3.24% 5.59% 6.10% 1.69% 8.95% 11.79%

Segmental – Profit and Loss Particulars (INR mn) FY11 FY12 FY13 FY14 FY15 FY16 FY17
Segmental revenues
PVC 14,848 14,910 15,637 17,130 15,601 16.287 17,567
PVC pipes & fittings 9,142 12,074 13.779 15,633 16,938 20,305 22,169
Power 1,482 1,756 2,071 1,645 1,307 1,395 1,449
Segmental profits
PVC 845 1,170 2.342 2,008 480 1,987 3,547
% of Revenues 5.69% 7.85% 14.98% 11.72% 3.07% 12.20% 20.19%
PVC pipes & fittings 721 579 717 1,321 1,337 1,787 1,774
% of Revenues 7.89% 4.80% 5.20% 8.45% 7.89% 8.80% 8.00%
Power 344 177 481 345 174 276 329
% of Revenues 23.19% 10.09% 23.24% 20.98% 13.34% 19.78% 22.70%
Capital employed
PVC 7,152 6,758 7,462 7,775 6,060 5,660 5,623
PVC pipes & fittings 2,180 2,085 3,119 3,393 4,649 4,337 5,683
Power 2,996 3,859 3,151 3,131 2,552 2,527 2,170
Segment revenue includes intersegment transfer 21
Back to Contents
page
*Figures as per IndAS
* *

# P&F represents Pipes and Fittings * Including inter segment transfer 22
Back to Contents
page
Q3FY17 & FY16 Results Summary
Volumes (MT) P & F #
67,693 63,982
Q4FY16 Q4FY17
5.5%
Volumes (MT) PVC
resin*
83,093 76,541
Q4FY16 Q4FY17
7.9%
Total Revenue (INR
Mn)
9,260 10,16
4
Q4FY16 Q4FY17
EBITDA (INR Mn)
1,156
1,785
Q4FY16 Q4FY17
54.4%
PAT (INR Mn)
820
1,233
Q4FY16 Q4FY17
50.4% 9.7%
Management Comment: We have benefited from lower crude prices which have positively affected the raw material costs and aided better margins.
Government initiatives as well as demand from agri and non-agri segments should push up growth in PVC pipe segment.
FY17
2,08,764 2,09,339
FY16 FY17
2,48,177
2,35,104
FY16 FY17
4,289
5,477
FY16 FY17
2,544
3,522
FY16 FY17
0.3% 5.240% 5.11% 27.77% 38.44% 28,431
29,876
FY16 FY17
*As per IndAS
*
* * *
* *

Profit & Loss Account
23
Back to Contents
page
Particulars (INR Mn) FY17 FY16
Total Income from operations 29,876 28,431
EBIDTA 5,630 4,044
EBIDTA margin (%) 18.84% 14.22%
Depreciation 550 506
EBIT 5,080 3,538
EBIT % 17.00% 12.44%
Other Income 243 396
Finance costs 153 447
Exceptional items (gain)/loss - (245)
PBT 5,170 3,733
PBT % 17.30% 13.13%
Tax 1,648 1,189
PAT 3,522 2,544
PAT % 11.79% 8.95%

Business Scenario
24
Back to Contents
page
Source: Platts Polymerscan weekly
reports
63,030
41,512
60,542
83,093
62,435
39,902
56,226
76,541
Q1'16 Q2'16 Q3'16 Q4'16 Q1'17 Q2'17 Q3'17 Q4'17
PVC/EDC Delta (USD/MT) PVC (USD/MT)
400
512
623
14-Jan-15
1-Apr-15
17-Jun-15
2-Sept-
15
4-Nov-15
27-Jan-16
30-Mar-16
1-Jun-16
3-Aug-16
5-Oct-16
7-Dec-16
1-Mar-17
500
720
940
1160
14-Jan-15
1-Apr-15
17-Jun-15
2-Sept-
15
4-Nov-15
27-Jan-16
30-Mar-16
1-Jun-16
3-Aug-16
5-Oct-16
7-Dec-16
01-Mar-17
57,967
40,689 42,445
67,693 66,125
38,266 40,966
63,982
Q1'16 Q2'16 Q3'16 Q4'16 Q1'17 Q2'17 Q3'17 Q4'17

Quarterly – Profit & Loss
25
Back to Contents
page
*As per IndAS
Particulars (INR Mn) Q1FY16 Q2FY16 Q3FY16 Q4FY16 Q1FY17 Q2FY17 Q3FY17 Q4FY17
Total income from operations * 7,323 5,341 6,251 9,260 7,769 5,234 6,656 10,164
EBIDTA 1,273 524 841 1,156 1,592 870 1,329 1,785
EBIDTA margins (%) 17.4% 9.8% 13.5% 12.5% 20.5% 16.6% 19.9% 17.56%
Depreciation 125 126 127 127 133 139 140 139
Other Income 54 114 30 198 32 89 29 94
Finance costs 158 164 81 45 50 33 59 11
PBT 1,044 592 663 1,181 1,441 788 1,158 1,729
PBT margins (%) 14.3% 11.1% 10.6% 12.8% 18.5% 15.1% 17.4% 17.0%
Tax 324 190 238 361 461 275 416 496
PAT 721 402 424 820 980 513 742 1,233
EPS 5.8 3.2 3.4 6.6 7.9 4.1 5.9 9.9
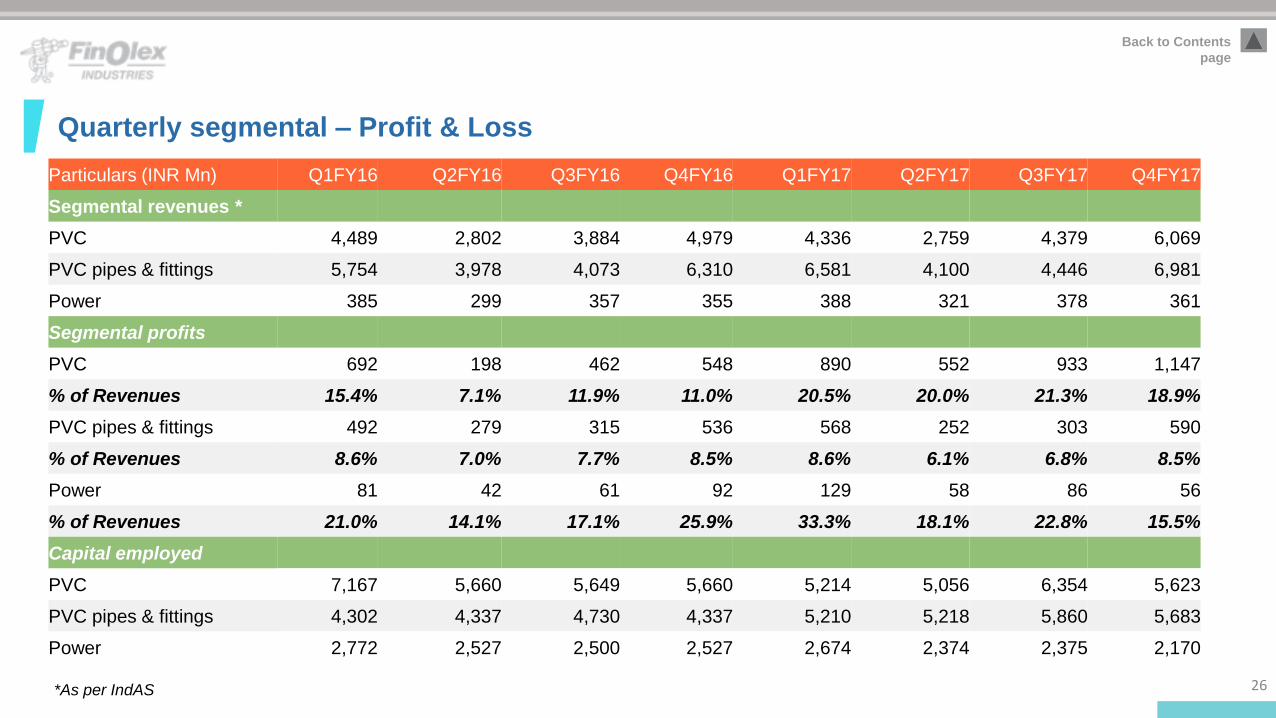
Quarterly segmental – Profit & Loss
26
Back to Contents
page
*As per IndAS
Particulars (INR Mn) Q1FY16 Q2FY16 Q3FY16 Q4FY16 Q1FY17 Q2FY17 Q3FY17 Q4FY17
Segmental revenues *
PVC 4,489 2,802 3,884 4,979 4,336 2,759 4,379 6,069
PVC pipes & fittings 5,754 3,978 4,073 6,310 6,581 4,100 4,446 6,981
Power 385 299 357 355 388 321 378 361
Segmental profits
PVC 692 198 462 548 890 552 933 1,147
% of Revenues 15.4% 7.1% 11.9% 11.0% 20.5% 20.0% 21.3% 18.9%
PVC pipes & fittings 492 279 315 536 568 252 303 590
% of Revenues 8.6% 7.0% 7.7% 8.5% 8.6% 6.1% 6.8% 8.5%
Power 81 42 61 92 129 58 86 56
% of Revenues 21.0% 14.1% 17.1% 25.9% 33.3% 18.1% 22.8% 15.5%
Capital employed
PVC 7,167 5,660 5,649 5,660 5,214 5,056 6,354 5,623
PVC pipes & fittings 4,302 4,337 4,730 4,337 5,210 5,218 5,860 5,683
Power 2,772 2,527 2,500 2,527 2,674 2,374 2,375 2,170

Internationally acclaimed Environment
management system under ISO 14001, in
place at the Ratnagiri plant.
Achieved the goal of Zero effluent
discharge at the Ratnagiri plant
Awarded with “Certificate of Merit –
believers Category” by “Frost and
Sullivan's Green Manufacturing
Excellence Award for Ratnagiri plant
Won Bronze trophy in the National Safety
Council Awards Competition 2013 for
the PVC manufacturing plant at Ratnagiri
Green initiatives
ISO
14001 0 Effluent
Discharge
27
Back to Contents
page

Corporate Social Responsibility – some snapshots
29
A series of CSR activities were
conducted in this quarter. Prominent
being donation of prosthetic limbs,
artificial limbs, walkers to Bandorwala
Hospital.
A RO water purifier was installed in a
primary school in Abhor village, Gujarat.
Ritu Prakash Chhabria, Managing trustee, Mukul
Madhav foundation was part of the National Women's
Parliament on February 10 at Amravati, Andhra
Pradesh. She shared the dais with N Chandrababu
Naidu, Chief Minister, Andhra Pradesh, Kodela Siva
Prasada Rao, Speaker, and other dignitaries.
Smt.Amruta Fadnavis, First Lady of
Maharashtra, visited Mukul Madhav
Vidyalaya,Ratnagiri for its Annual concert
held in February. The students were
felicitated for their achievements both in
academics and co-curricular activities.

Recent Updates
Recently Awarded with The Supply Chain Enterprise Icon of
the Year – 2017” by Global Logistics Excellence Awards
30
Mr. Prakash Chhabria, Executive Chairman, Finolex Industries Limited along
with Mr. Matthew Timmons, Managing Director, Lubrizol Advanced Materials
India Pvt. Ltd at the Finolex FlowGuard launch event

Accolades and awards
India’s most Trusted
Brand in the category
“Manufacturing – Pipes”
awarded by Brand Trust
Report 2015
The National Record
certificate by The Limca
Book of Records for
conducting the largest
number of plumbers meets
organised simultaneously
across 26 states and 58
cities on 11 March, 2016.
Global CSR Excellence &
Leadership Award at the
5th edition of Blue Dart
World CSR day initiative
Best Safety Practices
Award – 2015 by National
Safety council Maharashtra
Chapter & Directorate of
Industrial Safety & Health,
Maharashtra State
Recognized by Economic
Times as Top 100 Brands
in the Architecture and
Design Sector.
31
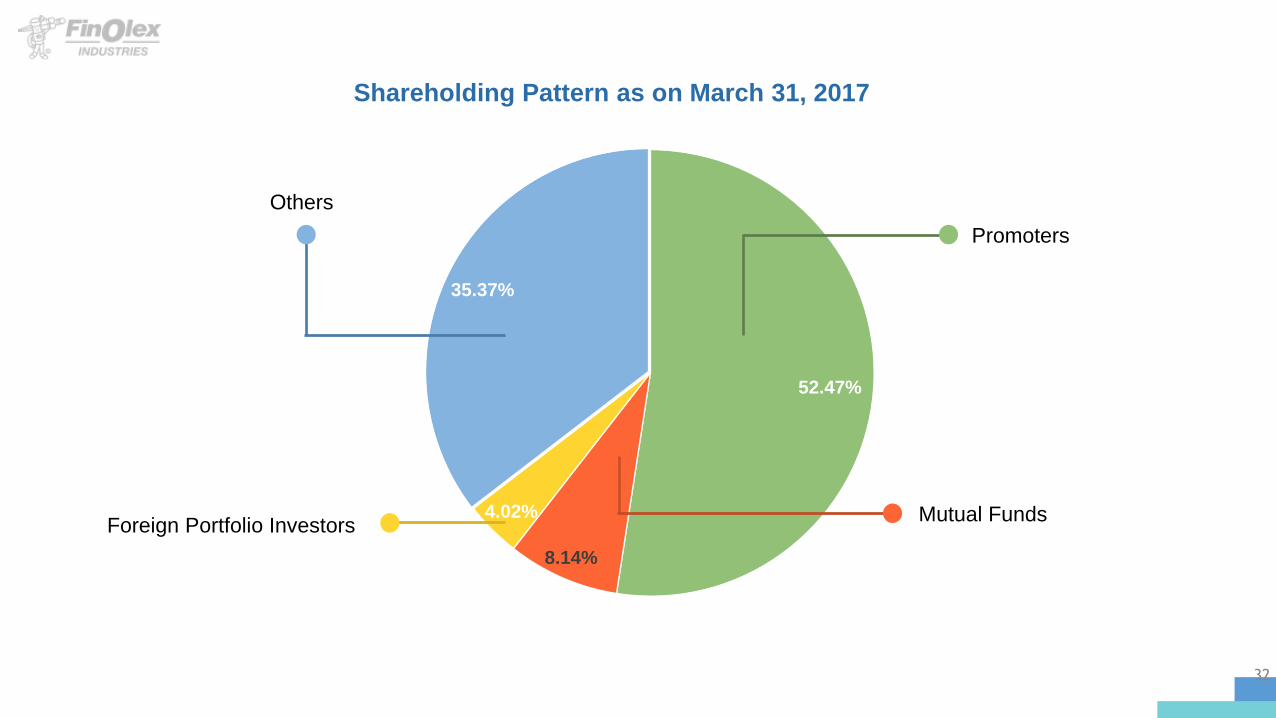
Shareholding Pattern as on March 31, 2017
4.02%
52.47%
8.14%
4.02%
35.37%
Promoters
Mutual Funds
Others
Foreign Portfolio Investors
32
FINOLEX INDUSTRIES LIMITED Mr. S. Krishnamoorthy (GM - Accounts & Finance)
D-1/10, M.I.D.C. Chinchwad, Pune 411 019
020 2740 8200 | 1-800-2003466
www.finolexwater.com
SAFE HARBOR STATEMENT: No part of this presentation is to be circulated, quoted, or reproduced for any distribution without prior written approval from Finolex Industries Limited, Chinchwad, Pune-411 019, India. Certain part of this presentation describing
estimates, objectives and projections may be a “forward looking statement” within the meaning of applicable laws and regulations. Actual results might differ materially from those either expressed or implied.
Agri Pipes and Fittings Column Pipes Casing Pipes ASTM Pipes and
Fittings
CPVC Pipes and
Fittings
Sewerage Pipes Solvent Cement