fintech group ag · pdf filefintech group ag germany ... fintech group (formerly known as...
TRANSCRIPT

FinTech Group AG Germany - Internet
Buy (initiation) 01-December-14
Christian Glowa Price target: EUR 17.00
Analyst
Price: EUR 9.50 Next result: Q4/FY'14 TBD
Bloomberg: FLA:XETRA Market cap: EUR 132.9 m [email protected]
Reuters: FLAG.DE Enterprise Value: EUR 116.8 m
Tel.: +49 40 414 3885 95
Entering a transformational era
FinTech is a German-based financial technology company operating an established vertically integrated B2C online broker (flatex) and targeting to disrupt established value chains in the financial services industry. FinTech is in a major favourable transformation process driven by a new management. Major steps include:
• M&A: The acquisition of CeFDex (B2B software and technology firm for CFDs and FOREX) and XCOM (technology provider for the financial industry) including its subsidiary biw Bank, a leading German white label transaction and outsourcing bank.
• Cost streamlining: The full integration of CeFDex and XCOM bears significant potential to cut overhead costs (eH&A: c. € 11m by 2017E).
• Sales synergies: Sales synergies should be explored by expanding the product offering (CFD, FOREX) and by optimising flatex customers’ deposit management (c. € 700m) which are administrated by XCOM’s subsidiary biw Bank. The full integration of XCOM is seen to lift interest income by c. € 8m from 2015E onwards.
• Growth investments: Cost savings and interest income should be used to kick start investments into growth at flatex which have been suspended in the last yrs.
After the integration of XCOM (lifting sales by c. € 58m in 2015E) sales are seen to grow by 20% CAGR ‘15E-‘17E mainly driven by customer growth of flatex (in alignment with increasing trading activities) and CeFDex. Given the pure online approach as well as the vertical integration of complementary businesses (CFD, deposit management) and considering significant cost savings, the bottom-line should increase disproportionately by c. 84% CAGR ‘15E-‘17E.
Additionally, upside not reflected in our estimates could stem from new business fields. On the basis of the technology capabilities (i.e. XCOM) and its full banking license, the company intends to launch new businesses in the field of technology-based lending such as P2P lending etc. As a result, FinTech aims to generate an additional 1-2% margin overall p.a. on the cash deposits of its clients from 2015 onwards.
Subject to the successful restructuring and revitalisation of growth, the stock should offer significant returns potential for investors which is only partially reflected in our valuation which is based on FCFY 2016E. We initiate with BUY, PT of € 17.
Y/E 31.12 (EUR m) 2011 2012 2013 2014E 2015E 2016E 2017E
Sales 23.7 15.6 14.3 21.7 102.3 122.3 147.7
Sales growth 53 % -34 % -8 % 52 % 371 % 20 % 21 %
EBITDA 10.1 1.3 -0.3 -5.9 11.6 33.6 46.1
EBIT 8.8 0.1 -1.1 -7.2 5.4 26.2 37.3
Net income 5.8 -0.4 -1.2 -6.1 9.2 24.0 30.6
Net debt -19.7 -9.7 -20.0 -16.1 33.3 11.7 -18.8
Net gearing -85.2 % -40.9 % -61.7 % -45.0 % 118.1 % 57.6 % 15.1 %
Net Debt/EBITDA 0.0 0.0 0.0 0.0 2.9 0.3 0.0
EPS pro forma 0.41 -0.03 -0.09 -0.43 0.66 1.72 2.19 CPS 0.36 -0.16 0.08 -0.46 0.69 1.72 2.19
DPS 0.00 0.00 0.00 0.00 0.00 0.00 0.00
Dividend yield 0.0 % 0.0 % 0.0 % 0.0 % 0.0 % 0.0 % 0.0 %
Gross profit margin 100.0 % 100.0 % 100.0 % 100.0 % 73.7 % 78.0 % 81.8 %
EBITDA margin 42.6 % 8.5 % -2.3 % -27.0 % 11.3 % 27.5 % 31.2 %
EBIT margin 37.2 % 0.5 % -7.6 % -32.9 % 5.2 % 21.4 % 25.2 %
ROCE 65.3 % 0.4 % -4.0 % -18.2 % 4.9 % 13.8 % 17.2 %
EV/sales 5.1 7.9 7.9 5.4 1.6 1.2 0.8
EV/EBITDA 11.9 93.7 -337.3 -19.9 14.4 4.3 2.5
EV/EBIT 13.6 1,460.4 -103.9 -16.3 31.0 5.5 3.1
PER 23.0 -334.2 -107.7 -22.0 14.4 5.5 4.3
Adjusted FCF yield 5.2 % -0.1 % -0.4 % -4.6 % 6.9 % 16.0 % 26.0 %
Source: Company data, Hauck & Aufhäuser Close price as of: 28.11.2014
Source: Company data, Hauck & Aufhäuser
High/low 52 weeks: 10.60 / 4.12
Price/Book Ratio: 4.0
Relative performance (SDAX):
3 months 29.2 %
6 months 76.2 %
12 months 124.0 %
Changes in estimates Sales EBIT EPS
old: 21.7 -7.2 -0.43 2014
∆ - - -
old: 102.3 5.4 0.66 2015
∆ - - -
old: 122.3 26.2 1.72 2016
∆ - - -
Key share data:
Number of shares: (in m pcs) 14.0
Authorised capital: (in € m) 14.0
Book value per share: (in €) 2.4
Ø trading volume: (1 months) 4,165
Major shareholders:
GfBk mbH 60.0 %Heliad Equity Partners 20.5 %Free float 19.5 %
Company description: FinTech is a German-based financial technology company and a leader in the German brokerage market. The group focuses on innovative financial B2C (online broker) and B2B (offering its partners access to the CFD market) products & services.

FinTech Group AG
2 Hauck & Aufhäuser Privatbankiers KGaA
Table of Contents
FinTech Group AG 1
FinTech in a nutshell 3
Competitive Quality 5
Growth 11
Valuation 22
Theme 25
Company Background 27
Financials 29
Contacts: Hauck&Aufhäuser Privatbankiers KGaA 36

FinTech Group AG
3 Hauck & Aufhäuser Privatbankiers KGaA
FinTech in a nutshell
A leading disruptor and innovator in the financial service industry FinTech Group AG is a German-based financial technology company. The group focuses on innovative financial B2C and B2B products & services targeting to disrupt established value chains in the financial services industry. FinTech Group (formerly known as flatex Holding AG) is in a major transformation process after new management joined in August this year, replacing the previous management that had not been able to unlock the enormous synergies and growth potentials of the existing business lines. For investors, the stock provides a great entry opportunity as restructuring measures look set to start bearing fruits in 2015E and given the substantial potential to improve the bottom-line. Subject to the successful re-positioning of the company, the stock offers significant returns potential for investors. What is fundamental for the success of FinTech Group is
1) its operational backbone flatex, a leading German B2C online broker AND CeFDex, a leading B2B CFD (incl. FOREX) market maker and technology provider
2) its newly launched subsidiary AKTIONÄRSBANK (fully licensed online bank) and
3) the latest acquisition XCOM, a premium technology provider within the European financial service sector. XCOM’s subsidiary (100%) biw Bank is a leading German white label transaction and outsourcing bank.
flatex is so far the heart of FinTech’s operations. Ever since its foundation in 2006, the company is disrupting the brokerage market in Germany and Austria with a flat fee pricing model. Not only its pricing leadership but also its straight-forward online trading interface enabled the company to constantly be voted among the best top 3 online brokers in Germany. This allowed the company to double its number of active trading customers within 4 yrs to about 100k by the end of 2013. Even more importantly, based on the most recent strategic acquisitions of CeFDex (2013) and XCOM (Oct. 2014), a new business era of high growth and at the same time high profitability is coming for FinTech Group:
• By the end of 2013 FinTech completely (100%) acquired CeFDex for € 9m (trading net sales c. € 9m in 2013). The acquisition of CeFDex (specialised CFD provider which among others, also serves flatex’s clients) is seen to enhance flatex’s existing value chain by increasing CFD (inc. FOREX) trading opportunities for its customers while at the same time allowing cost streamlining. Moreover, especially the CFD business is very appealing given that CFD transactions are providing much higher margins compared to spot market transactions.
• FinTech has contractually secured an option to acquire a majority stake of 54% in XCOM Group. Final closing is expected in January 2015. FinTech intends to fully take over XCOM by the end of 2016 valuing the target at approximately € 83m. XCOM group achieved sales of c. € 58m and an EBT of c. € 4.5m in 2013. This puts valuation on 18x EBT before potential significant synergies. Notably, the acquisition has been done on favourable terms considering that XCOM holds c. € 21m net cash, the EV is seen at c. € 62m.
The acquisition of XCOM, a leading provider of banking and brokerage IT and software solutions is seen to push FinTech towards its goal of becoming a leading financial service technology company in Europe. First and foremost, this strategic move allows FinTech to optimise the

FinTech Group AG
4 Hauck & Aufhäuser Privatbankiers KGaA
usage of flatex’s customer deposits & cash accounts (c. € 700m in 2013) which are administrated by XCOM’s subsidiary biw Bank. Moreover, XCOM should be the perfect innovation engine for the development of new business lines within FinTech Group (e.g. technology-based/P2P lending, crowd-funding, social trading etc.).
Besides capitalising on these two major acquisitions, the management is generally focused on 1) improving cost efficiency 2) cross-selling as well as expanding the product offering (e.g. enlarge loan volume & products, launch new business lines etc.) and 3) bolster growth of flatex by significantly expanding its marketing expenses (flatex did not significantly spend on marketing over the past 2 years) The two recent acquisitions should catapult FinTech’s revenue to c. € 100m by 2015E (vs c. € 21m in 2014E) and EBT to c. € 13.4m (vs c. € -9m in 2014E) despite integration costs (eH&A € 2m in 2015E). The repositioning of the company (eH&A € 2m restructuring costs in 2014E) as well as the full integration of XCOM should be largely completed in 2015E. We expect the business quality to become increasingly visible reflected in a significant improvement of EBT margins (>30% by 2017E vs -9.2% in 2013) as well as ROE (c. 40% in 2017E vs -4% in 2013 vs Comdirect Bank AG c. 15% in 2013)
flatex CeFDex Die AKTIONÄRSBANK XCOM Group
Products & services
A leading online broker in the B2C business: flatex is a financial service company providing online securties brokerage services in Germany and Austria. It is involved in trading of
shraes, certificates, warrants, bonds, funds, and eETFs. The compnay operates an automated Internet platform for online forwarding of
securties orders and provides mobile trading applications.
A B2B specialised CFD provider: CeFDex is a pure B2B partner for
banks and financial services companies, offering its customers cost-effective access to the CFD market and a wide service range: from trading to IT solutions, from
consulting to service center. Everything tailored to the individual
needs of customers.
AKTIONÄRSBANK was founded in mid 2012 with the idea of
expanding the existing business model of flatex Holding AG and with an own banking business. As per Oct. 2013 the company
received permission conducting banking
transactions from the Federal Financial Supervisory Authority in Germany. As a full-service bank, the company is entitled
operating deposits, lending, and securities deposit business, as
well as offer other services.
XCOM is a premium technology and
transaction provider for banks and
financial services. The group also
incorporates the biw bank, a full service settlement bank.
Net sales 15E (€ m) 23 19 3 58
Sales share 22% 19% 3% 57%
EBT 15E (€ m) n/a n/a n/a n/a
EBT-margin
ROE 15E - -
Customers/ End marketsB2C business with some 120k active (eH&A: 2015E) customers each with
about 50 trades on average p.a.
B2B partners such as Banks and other financial services companies
B2C business (eH&A. c. 11k active customers) with a pure
online set-upB2B business
Market position / share
ranked # 3 among the best online broker in Germany; ranked # 4 among the best online CFD broker in Germany
In 2013 total CFD trades accounted to c. 30k inGermany. The market share of CeFDex is about 7%.
n/a n/a
CompetitorsComDirect, CortalConsors, OnvVista, IngDiBa, S-Broker, LYNX, Maxclue. Cap Trader, NIBC Direct, Degiro, R
Only two competitors in Germany: CoBa and Saxo Bank.
Other from the UK are for instance CMC Markets and IG.
n/a n/a
Shareholder structure
Source: Hauck & Aufhäuser Estimates
Free float20%
Heliad Equity
Partners GmbH &
Co. KGaA21%
GfBK Gesellschaf
t für Börsenkommunikation
mbH59%

FinTech Group AG
5 Hauck & Aufhäuser Privatbankiers KGaA
Competitive Quality
Focus on disruptive and scalable business models
FinTech is in a major transformation process after Frank Niehage joined the company as the new CEO in August 2014 and Martin Korbmacher as new Chairman in October 2014. Originally, FinTech was solely focused (via its core brand flatex) on online brokerage with an innovative offering and a state of-the-art platform. In 2013 FinTech acquired CeFDex in order to broaden its product portfolio. Furthermore, the group has received the German banking license via its subsidiary AKTIONÄRSBANK by the end of 2013. The banking license allows FinTech to expand its business offering (e.g. into short term, technology-based lending, customer deposit management, and other retail banking products) and thus significantly enhances the company’s value chain and provides the backbone to disrupt established areas in the financial supply chain as well as setting high barriers to entry for other technology companies.
Flatex – focus on niche broker market
As a pioneer implementing a flat fee pricing model, its flagship flatex (c. 90% of total sales in 2013) is active as an online broker with a clear focus on frequently trading retail customers in Germany (average trading volume per active customer c. 51 trades p.a. vs c. 13 of comdirect customers). Here, flatex is the market leader and emerged already as # 3 in the overall market of online brokerage for retail clients.
Online & CFD broker ranking 2014
1
2
3
4
5
6
7
8
9
10
Source: Deutsches Aktieninstitut; Hauck & Aufhäuser
Online broker Online CFD brokerRank
The company’s technology background and strong focus has allowed developing a convenient and state-of-the-art platform for the niche market of online brokerage. Moreover, the introduction of a flat fee and transparent pricing is driving the company’s differentiation.
Price leadership
The company’s disruptive pricing model with a flat fee of € 5 per trade (plus third-party costs of € 1.89) differentiates the firm from the traditional online broker landscape in Germany and makes flatex the price leader.
• Most online brokers are part of full service online banks which in

FinTech Group AG
6 Hauck & Aufhäuser Privatbankiers KGaA
general ask for a base fee and a variable fee per trade. Overall, customers have to pay a minimum of € 9.90 and a maximum of € 59.90 per trade at full-service (direct) banks.
In our view, this clearly shows the benefit of flatex’ flat fee pricing model for retail customers trading frequently. Assuming an average retail customer invests at least € 5,000 per trade, there is no better alternative to flatex.
avg volume per order: 5,000€
annual trades flatex ING-DiBa comdirect Cortal Consors DKB Bank maxblue S-Bank
Annual savings for flatex vs next follower
1 6.89 14.25 17.48 18.40 12.50 14.50 18.97 5.613 20.67 39.25 42.63 43.40 37.50 39.50 43.97 16.835 34.45 64.25 67.78 68.40 62.50 64.50 68.97 28.05
10 68.90 126.75 130.65 130.90 125.00 127.00 131.47 56.1013 * 89.57 164.25 168.38 168.40 162.50 164.50 168.97 72.9351 ** 351.39 639.25 646.23 643.40 637.50 639.50 643.97 286.1150 344.50 626.75 633.65 630.90 625.00 627.00 631.47 280.50
100 689.00 1,251.75 1,262.40 1,255.90 1,250.00 1,252.00 1,256.47 561.00500 3,445.00 6,251.75 6,292.40 6,255.90 6,250.00 6,252.00 6,256.47 2,805.00
in % of annual trading volume 0.138% 0.284%
Source: Hauck & Aufhäuser - *: comdirect avg. 2013; **: flatex avg. 2013.
costs in EUR
Notably, each of comdirect's 1.8m customers (avg. 13 trades p.a.) would immediately save costs by switching to flatex and we assume a similar cost saving potential compared tothe majority of full-service direct banks (ING DiBa, maxblue, Cortal Consors, etc.). In our view, this clearly provides flatex with a competitive advantage and manifests the differentiation of its business model. We do not expect comdirect or Cortal Consors to lower their pricing model, as their internal costs per trade should exceed the € 5 per trade flatex is charging.
Overall, flatex is well perceived in the market manifested by high rankings in consumer tests on the back of its unbeatable pricing model, its attractive and innovative product portfolio as well as its execution friendly interface. This is visible in a continuous increase in new customers (CAGR active customers 2009-’13 c. 18%) although marketing spending was negligible in recent years.
Total and active customer development of flatex
Source: Company data; Hauck & Aufhäuser estimates
52k
157k
100k
0
20,000
40,000
60,000
80,000
100,000
120,000
140,000
160,000
180,000
200,000
2009 2010 2011 2012 2013 2014E 2015E 2016E 2017E
number of total customers average number of active customers
CAGR 2013-17E 12%

FinTech Group AG
7 Hauck & Aufhäuser Privatbankiers KGaA
Flatex - management to exploit unrealised potential While enjoying constant high consumer ratings (repeatedly voted among the best 3 online brokers in Germany) and high operating profitability (EBIT margin > 30% in 2011), flatex’s former management did not exploit profitable growth opportunities in the past 2 years. Above all, the previous management failed to invest into growth (new customer acquisitions AND in new product innovations), explore cross-selling opportunities AND to exploit customer deposits, which have been outsourced to biw bank (a 100% subsidiary of XCOM).
This has completely changed with the new management leading the transformation of the group.
FinTech is entering a new business era - scope & product enlargement through strategic acquisitions
FinTech group has recently made two complementary strategic acquisitions which are seen to be the starting point for a new business era of the group.
(1) CeFDex: By the end of 2013 (still under previous management) FinTech completely acquired CeFDex, a B2B specialised CFD and Forex provider for € 9m. The company is a partner for banks and other financial institutions mainly offering its customers cost-effective access to the CFD and FOREX market. CeFDex sales were c. € 9m in 2013 of which c. 90% was generated with flatex and c. 10% with external partners. The acquisition of CeFDex should enable flatex to enlarge its CFD offering. This should increase flatex’s CFD and FOREX trading volume and therewith also attract additional customers. Winning new customers should even be accelerated when FinTech re-initiates targeted advertising. Furthermore, the shift in the product mix towards CFDs should yield higher margin contributions in comparison to spot market transactions. Higher margin contributions are also seen to be realised by the general higher CFD trading volume resulting in improving efficiency and ultimately profitability (higher volume allow fewer hedging, as trades can be crossed internally).
(2) XCOM: FinTech has contractually secured an option to acquire a majority stake of 54% in XCOM Group (intended closing date Jan. 2015) and intends to fully take over the company by the end of 2016 for approximately € 82.4m. Considering that XCOM holds c. € 21 in net cash, the EV is seen at c. € 62m. XCOM is a premium technology and transaction provider for banks and financial institutions operating 5 business lines (banking, brokerage, business solutions, IT-Services and outsourcing). The target also comprises the ‘biw bank’, a full-service bank, which until now has been the settlement/ outsourcing bank for flatex’s customer deposit/ cash accounts as well as for other major financial institutions (e.g. Deutsche Bank, Commerzbank, HypoVereinsbank, Postbank etc.). In 2013, XCOM group generated sales of c. € 58m (thereof c. 70% financial services, 25% IT-Services & advisory, 5% hardware) and an EBT of c. € 4.5m (given that XCOM generates significant interest income, mainly through its subsidiary biw bank, EBT is the key profitability figure). The acquisition allows FinTech to better benefit from its customers’ (flatex) cash accounts (some € 700m in 2013). Flatex does not pay any interest rate to its clients on their cash accounts, however so far has also not really made proper use of this favourite refinancing conditions. Up to date, flatex just created c. € 1.6m in interest income in 2013. Post acquisition, flatex plans to make better use of this refinancing (e.g. Lombard credit) and build up technology-based lending businesses such as P2P lending, payroll lending or consumer financing. FinTech aims to generate an additional 1-2% margin overall p.a. from 2015E onwards on the cash deposits of its clients.
FinTech Group AG
8 Hauck & Aufhäuser Privatbankiers KGaA
Moreover, through a potential merger of the two full service banks (AKTIONÄRSBANK and biw bank) obvious synergy effects would lead to cost savings, a higher efficiency and thus higher margins. Ultimately, also considering the current low interest environment the deposit management provides pure upside once the interest environment changes. More importantly, XCOM’s technology and software capabilities should be the perfect innovation engine for the development of new fintech business lines under the roof of the group.
Cost efficiency & synergies
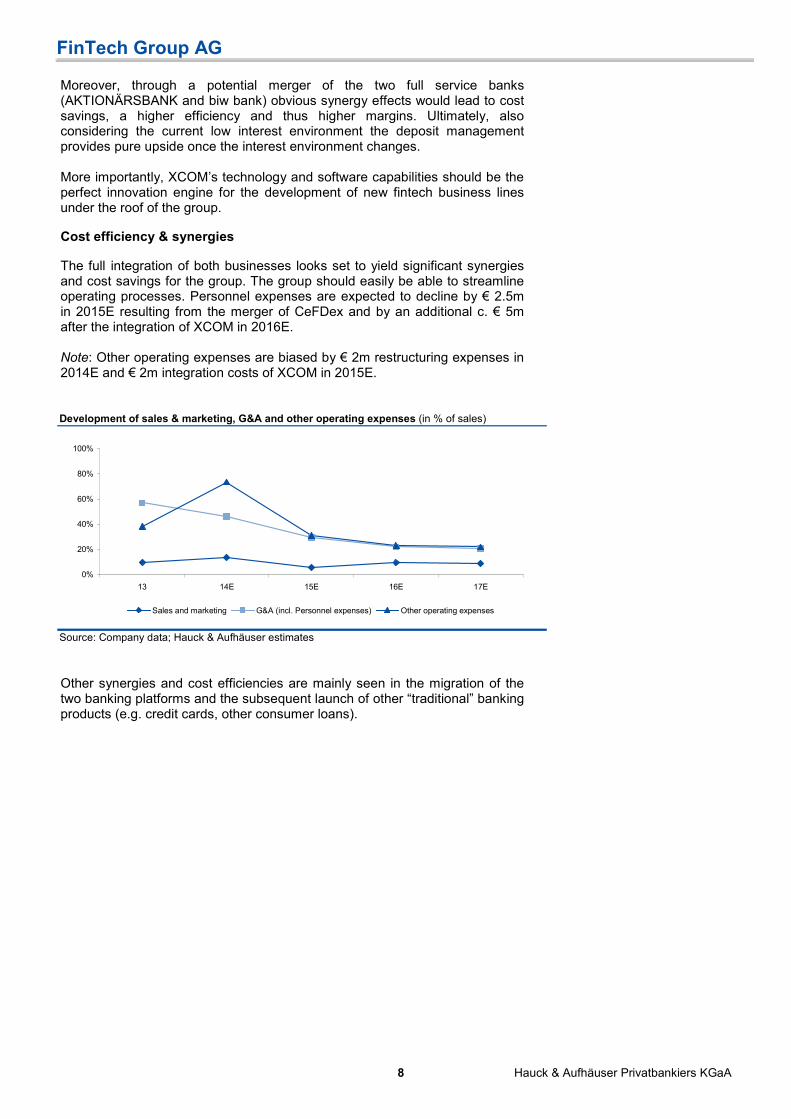
The full integration of both businesses looks set to yield significant synergies and cost savings for the group. The group should easily be able to streamline operating processes. Personnel expenses are expected to decline by € 2.5m in 2015E resulting from the merger of CeFDex and by an additional c. € 5m after the integration of XCOM in 2016E. Note: Other operating expenses are biased by € 2m restructuring expenses in 2014E and € 2m integration costs of XCOM in 2015E.
Development of sales & marketing, G&A and other operating expenses (in % of sales)
Source: Company data; Hauck & Aufhäuser estimates
0%
20%
40%
60%
80%
100%
13 14E 15E 16E 17E
Sales and marketing G&A (incl. Personnel expenses) Other operating expenses
Other synergies and cost efficiencies are mainly seen in the migration of the two banking platforms and the subsequent launch of other “traditional” banking products (e.g. credit cards, other consumer loans).

FinTech Group AG
9 Hauck & Aufhäuser Privatbankiers KGaA
Business Quality 2015E should already reveal benefits from the transformation of the group through the full merger of CeFDex (FY15E sales € 19m) and XCOM (FY15E sales c. € 58m), streamlining operating costs and the focus on revitalising growth of flatex (FY15E sales c. € 23m) driven by increasing marketing efforts. The following graph reflects the major impact of the acquisition of CeFDex (first-time consolidation in 2014) and XCOM (first-time consolidation in 2015) on the group.
Sales bridge
Source: Company data; Hauck & Aufhäuser estimates
812
7
3
102
2214
58
0
20
40
60
80
100
120
2013
flate
x
CeFDex
AKTIONÄRSBANK
2014
Efla
tex
CeFDex
AKTIONÄRSBANK
XCOM
2015
E
Returns
We expect the business quality to become increasingly visible, best reflected in an expected strong improvement of EBT and ROE. The group’s EBT is seen to improve to c. € 13.4m in 2015E while the company is seen to generate a ROE of c. 30% respectively.
Revenue & EBT development (in € m) Return on equity (%)
Source: Company data; Hauck & Aufhäuser estimates Source: Company data; Hauck & Aufhäuser estimates
-20
0
20
40
60
80
100
120
140
160
11 12 13 14E 15E 16E 17E -40%
-30%
-20%
-10%
0%
10%
20%
30%
40%
50%
Revenue (l.s.) EBT (l.s.) EBT-margin (r.s.)
-40.0%
-20.0%
0.0%
20.0%
40.0%
60.0%
11 12 13 14E 15E 16E 17E
The significant improvement of the group’s business quality is driven by the company’s management striving for cost efficiency and the revitalisation of highly scalable sales. The new CEO (Frank Niehage) joined FinTech in August 2014 and has vast experience across all relevant segments of the retail banking industry. During the transformation process of the company he especially focuses on: • Realising costs savings (eH&A: total cost savings should amount to c.
€ 11m by 2017E mainly relating to personnel expenses).
• Exploiting incremental high margin sales through 1) re-starting active

FinTech Group AG
10 Hauck & Aufhäuser Privatbankiers KGaA
customer acquisition at well perceived and differentiated online broker flatex and 2) pushing the favourable shift in the product mix towards CFDs and Forex trades.
• Increasingly monetising the deposits of flatex’s customers (mainly by building up technology based lending businesses).
The following graph reflects the major impact of the acquisition of CeFDex and XCOM on the group’s EBT. The interest income of c. € 10m in 2015E mainly stems from XCOM’ s subsidiary biw bank.
EBT bridge
Source: Company data; Hauck & Aufhäuser estimates
Source: Company data; Hauck & Aufhäuser estimates
(7.3)
34.2
(2)13.4
10
13
21
(6)(1.3)
-10
0
10
20
30
40
FY13 E
BT
Chang
e in
EBIT
FY14E E
BT
Chang
e in
EBIT
Inte
rest
incom
e
Inte
rest
expe
nses
FY15E E
BT
Chang
e in
EBIT
FY16E E
BT

FinTech Group AG
11 Hauck & Aufhäuser Privatbankiers KGaA
Growth
Ample growth opportunities
While flatex has enjoyed healthy customer growth (even without major marketing spending) on the back of its attractive pricing model as well as its state-of-the-art online platform, the new management is expected to further accelerate growth of flatex and the group.
Sales bridge
Source: Company data; Hauck & Aufhäuser estimates
9
6
87
13
10
12
4
4
3
14 22
148
122
10258
0
20
40
60
80
100
120
140
160
2013
flate
x
CeFDex
AKTIONÄRSBANK
2014
Efla
tex
CeFDex
AKTIONÄRSBANK
XCOM
2015
Efla
tex
CeFDex
AKTIONÄRSBANK
2016
Efla
tex
CeFDex
AKTIONÄRSBANK
2017
E
CAGR 20%
After the acquisition of XCOM (conservatively estimated to see a flat development in 2015E yoy) sales are seen to grow at a CAGR 2015-‘17E of 20% to c. € 148m. FinTech’s growth looks set to be driven:
flatex (CAGR 2013-17E 33% to c. € 38m): New customer growth was flat with about 10k new customers p.a. since 2012 (c. 20k new customer gains p.a. from 2009 to 2011) due to marginal marketing investments in the last two years. The new management looks set to further increase the brand awareness of flatex which should lead to growth in customers and average trading volume by re-investing cost savings of G&A into marketing. Additionally, growth in the number of customers is automatically generating an increase of customers’ cash deposits which are seen to grow from c. € 700m to c. € 1.3bn by 2017E.
CeFDex (CAGR 2013-17E 43% to c. € 42m): As a leading player in the oligopolistic market for CFD’s (incl. FOREX), CeFDex looks set to win several new external customers for its state-of-the-art CFD technology solution along with a slight increase of the average fee per trade (mainly driven by higher volumes). Further growth could stem from the introduction of the capital transaction tax in Germany. In France, this boosted the CFD market by 25% yoy. However, this is not reflected in our estimates
AKTIONÄRSBANK (CAGR 2014-17E 280% to c. € 10m): After obtaining the

FinTech Group AG
12 Hauck & Aufhäuser Privatbankiers KGaA
banking licence at the end of 2013, FinTech’s full service bank (pure online set-up) started operations by mid-2014. While the bank is offering a similar flat fee pricing model compared to flatex, based on its extended product offering (which should be further extended through synergies with the biw bank) it rather targets gaining customers from traditional or/ and direct banks. The bank should fuel growth from 2015E onwards. .
Transformation of the business reveals untapped growth potential
Additional growth should be fuelled by enlarging the existing product portfolio and increase cross-selling as well as by the launch of new business lines. • Expanding traditional retail banking products provided by FinTech’s full
service-banks (biw bank & AKTIONÄRSBANK) such as collateralised home loans, credit cards, other consumer loan products, crowd funding, social trading etc.
• Make use of its banking licence, leverage the software and technology capabilities of XCOM (around half of total employees of XCOM are highly skilled financial engineers) AND customers’ deposits (flatex) to increase lending volume and ultimately the launch of new technology-based lending businesses (e.g P2P lending). These new business lines are expected to generate a 1-2% margin on customers’ cash deposits (c. € 700m in 2013) p.a. from 2016E onwards. . Moreover, as these new business opportunities are highly scalable we would expect the group to expand new FinTech business models geographically across Europe or even beyond.
Conservatively, we have not reflected these new business lines in our estimates.
Underlying market growth
Online banking and innovative banking solutions on the move
The eCommerce market in Germany is expected to grow by a CAGR ‘13-‘16E of 15% p.a. to above € 50bn by 2016E. The underlying sub-market for online financial services accounts for some 11% of the total eCommerce market and is seen to grow by 15% p.a. to c. € 5.3bn by 2016E. The solid underlying market growth perspectives are underpinning that consumers are increasingly becoming comfortable to use efficient online channels.
eCommerce market development in Germany E-commerce - Buyer Profile, Germany 2013
Source: Statista; Hauck & Aufhäuser Source: Statistisches Bundesamt Aug. 2014; Hauck & Aufhäuser estimates
0
10
20
30
40
50
60
2008 2009 2010 2011 2012 2013 2014E 2015E 2016E
0.0 %
2.0 %
4.0 %
6.0 %
8.0 %
10.0 %
12.0 %
14.0 %
16.0 %
18.0 %
eCommerce market (l.s.) growth rates p.a. (r.s.)
65.4%
50.9%
40.1%
35.3%
28.0%
27.3%
24.6%
24.0%
19.9%
10.5%
0.0% 10.0% 20.0% 30.0% 40.0% 50.0% 60.0% 70.0%
Fashion, sports apparel
Books, magazines, newspapers
Films, music
Electronic hardware
Medicine
Software
Computers & accessories
Telecommunications
Video games
Financial products

FinTech Group AG
13 Hauck & Aufhäuser Privatbankiers KGaA
The online and mobile financial market should grow disproportionately
Especially mobile banking looks set to continue to grow dynamically as customers are continuously embracing banking on their smartphones and tablets when banks offer applications that are both useful and easy to navigate and therewith simplify people’s lives.
Since the mobile banking market is highly correlated with the mobile phone market, the development of mobile devices in general is an indicator for the mobile banking potential. The ongoing digitalisation which is mainly driven by the increasing use of mobile devices such as smartphones and tablets which in unit turns look set to grow by a 13% CAGR 2013-‘18E.
Indication of average use of information sources for financial products Global mobile phone shipments and growth rates
Source: Bain Retail Banking Study, 2012; Hauck & Aufhäuser Source: CCS Insight Report; Hauck & Aufhäuser
0.14 0.17 0.300.50
0.731.03
1.241.43 1.59 1.75 1.89
1.05 1.011.09
1.080.99
0.810.71
0.620.55
0.470.40
0
0.5
1
1.5
2
2.5
2008 2009 2010 2011 2012 2013 2014E 2015E 2016E 2017E 2018E
Smartphones Non-smartphones
global smartphone CAGR 13% 2013-'18E
50%
25% 23% 20%
10%
70%
0%
10%
20%
30%
40%
50%
60%
70%
80%
Internet Bank adversiers Friends Productprovidwer
Independentbroker
Other sources
Internet Bank adversiers Friends Product providwer Independent broker Other sources
In contrast, the number of domestic banking branches has been significantly reduced over the past two decades (e.g. only from 2000 to 2012 the number of branches declined by -36% to 38k) and this trend looks set to continue given that still too many routine and low/ no margin interactions (like making a deposit) take place in bank branches in many countries. However, banks can no longer afford the cost structure that supports such interactions, which could go through lower-cost, self-service digital channels. Globally, some two-thirds of branch interactions consist of routine processes, with only one-third being sale or service.
Development of mobile Internet access in Germany Development of number of domestic banking branches in Germany
Source: PWC; Hauck & Aufhäuser Source: Bankenverband; Hauck & Aufhäuser
1618
23
28
35
42
50
56
61
18.9% 22.2%
28.0%35.2%
43.3%
53.0%
62.2%
70.8%
77.2%
0
10
20
30
40
50
60
70
2008 2009 2010 2011 2012 2013E 2014E 2015E 2016E
0.0%
10.0%
20.0%
30.0%
40.0%
50.0%
60.0%
70.0%
80.0%
90.0%
Users o f mobile Internet (in million) Share of total population
38,336
53,461
0
10,000
20,000
30,000
40,000
50,000
60,000
70,000
80,000
1996
1997
1998
1999
2000
2001
2002
2003
2004
2005
2006
2007
2008
2009
2010
2011
2012
# of domestic banking branches in Germany
-3.7% CAGR 1996-2012+18.2% CAGR 2008-16E
Germans invest some 7% of their net assets in stocks with a rising trend
Total net assets of German private households increased by € 54bn to € 5,207bn in the first quarter of 2014. The majority still prefers cash deposits despite the low interest rate environment. However, German private households purchased shares in the amount of c. € 3bn in Q1 2014 – a record level (yoy) ever since 2011.

FinTech Group AG
14 Hauck & Aufhäuser Privatbankiers KGaA
Numer of shareholder development in Germany Asset allocation of private households as per Q1 2014
Source: Deutsches Aktieninstitut; Hauck & Aufhäuser Source: Deutsche Bundesbank; Hauck & Aufhäuser
-
1,000
2,000
3,000
4,000
5,000
6,000
7,000
8,000
1997 1998 1999 2000 2001 2002 2003 2004 2005 2006 2007 2008 2009 2010 2011 2012 2013
0%
2%
4%
6%
8%
10%
12%
Other shares only Employee shares and other sharesEmployee shares only Shareholders in % of total population
CAGR 2008-2013 5.1% p.a.
39%
30%
6%
9%
3%2%
11%
Cash deposits Insurances Shares Investmentfonds Bonds Certificates Others
The CFD market looks set to flourish and might be boosted by the implementation of the transaction tax
The CFD market in Germany is expected to grow by a CAGR 2013-2016E of 5% to c. 46m CFD trades by 2016E.
Develpemnt of CFD market in Germany (by number of trades in thousand) Allocation of traded volume per underlying asset in 2013
Source: CFD-Portal.com; Hauck & Aufhäuser estimates Source: CFD-Portal.com; Hauck & Aufhäuser
40,000
42,000
44,100
46,305
36,000
38,000
40,000
42,000
44,000
46,000
48,000
2013 2014E 2015E 2016E
total # of CFD trades in Germany index, 79.9%
FX, 15.6%
commodities, 3.1% bonds, 0.6%
shares, 0.7%
The most favourite underlying assets for CFD trades in Germany are indices, with some 70% on the DAX and c. 30% on the Dow Jones.
The overall CFD volume might potentially double p.a. (yoy) from 2015E onwards with the implementation of a transaction tax on stocks in Germany. The boost in volume is anticipated due to a shift of assets towards CFDs as they would be largely unaffected by the transaction tax.
• The implementation of the transaction tax in France negatively affected the overall traded volume in securities while that of CFDs increased by +25%.

FinTech Group AG
15 Hauck & Aufhäuser Privatbankiers KGaA
FinTech’s growth
FinTech’s top-line is seen to grow by c. 20% CAGR 2015-17E to c. € 148m. Conservatively, we extrapolate XCOM’s 2013 results to remain flat yoy looking forward. flatex sales are seen to increase by 33% CAGR 2013-17E from c. € 12m to c. € 38m by 2017E. The remaining growth is stemming from growth of CeFDex (CAGR 43% 2013-17E) as well as from FinTech’s recently launched online retail bank AKTIONÄRSBANK (CAGR 280% 2013-17E). We see growth of FinTech to be driven by:
flatex
As a pioneer in the online brokerage market with its flat-fee pricing model and its convenient interface (strong execution), flatex entered its domestic market in 2006. The model has been proven successful given that the company quickly gained traction and today has about 112k customers (eH&A 2014E).
The company mainly addresses high frequency traders where order costs play a major role. Providing a highly transparent, flat-fee pricing model and a reliable execution and convenient interface, flatex was able to nearly double its active customer base from 2009 to 2013 (CAGR 2009-13 c. 18% to 100k) without much marketing effort. Again, this proves the high brand awareness of flatex in the German brokerage market.
Total and active customer development of flatex
Source: Company data; Hauck & Aufhäuser estimates
52k
157k
100k
0
20,000
40,000
60,000
80,000
100,000
120,000
140,000
160,000
180,000
200,000
2009 2010 2011 2012 2013 2014E 2015E 2016E 2017E
number of total customers average number of active customers
CAGR 2013-17E 12%
Looking forward, flatex’s number of active customers is expected to grow by a CAGR of 12% to c. 157k by 2017E. Despite higher marketing efforts and re-innovated product offering (mainly CFDs) customer growth is somewhat subdued given competition from other brokers (e.g DEGIRO, a Dutch low-cost online broker started operations in 2014 in Germany).
Against the backdrop of flatex’s high market perception, we expect the new management to increase the marketing spending on the back of cost savings from restructuring as well as additional income on deposits from only c. € 1.4m in 2013 (c. 10% of sales) to c. € 3m in 2014E, c. € 6m in 2015E and to c. € 11.5m in 2016E (c. 23% of sales like for like excl. CeFDeX & XCOM) to drive new customer growth and also increase activity of CFD trading.
In our view, the marketing budget is seen to be predominately spent on online advertising which allows FinTech to most efficiently target its specific customer group. Hence, we are confident that flatex will be able to gain more than

FinTech Group AG
16 Hauck & Aufhäuser Privatbankiers KGaA
10,000 new customers p.a. resulting in a total active customer base of 157k by 2017E (CAGR 12% 2013-17E). Moreover, we do not only expect the marketing effort to result in a sound new customer growth but to disproportionately (CAGR 13% 2013-17E) increase average trading volume per customer as existing traders habits should also be positively stimulated by the enlarged and advertised CFD offering. • Thanks to CeFDex’s integration into the group (in 2014), marketing
should particularly increase customers’ attention to the broader and re-innovated CFD product offering of flatex. Hence, we expect flatex to significantly improve its CFD trading volume and also push this among its existing customer base.
While the number of average trades per customer looks set to decline by c. 4% yoy in 2014E driven by lower CFD volumes (flat FX, OTC) due to marginal targeted marketing, we see a strong increase in average trading volume (CAGR 2013-17E c. 13%) particularly driven by CFDs (CAGR 2013-17E c. 19%).
flatex 2013 2014E 2015E 2016E 2017ECAGR
'13-'17Enumber of total customers 126,111 112,150 132,240 153,770 182,430average number of active customers 100,000 108,500 117,000 135,000 157,000 11.9%yoy in % 8.1% 8.5% 7.8% 15.4% 16.3%
number of new customers 10,200 9,000 10,800 12,420 13,662yoy in % 13.3% -11.8% 20.0% 15.0% 10.0%
average number of total trades per active customer p.a. 51 49 63 72 83 12.8%yoy in % -4% 29% 14% 15%
CFD 20 18 23 30 39 18.5%FX 3 3 3 3 3 0.0%OTC / Kassa 28 28 37 39 40 9.4%
Source: Company data; Hauck & Aufhäuser estimates Moreover, growth should benefit from an increase of the average fee per trade mainly driven by the expected increase of CFDs fees. The latter should materialise on the back of higher volumes which requires less hedging (as trades can be crossed internally). The average fee per trade also comprises the fee for the spot market transactions relating to the actual market price which is cautiously kept flat looking forward.
flatex 2013 2014E 2015E 2016E 2017E
CAGR '13-'17E
avgerage net fee per trade (in €) 2.05 2.34 2.78 2.74 2.68
Net trading sales (in m €) 10.4 12.5 20.5 26.5 34.8 35.1%yoy in % 19.3% 64.5% 29.2% 31.2%
Source: Company data; Hauck & Aufhäuser estimates Ultimately, flatex’s customer gains should translate into increasing net sales from customers’ cash accounts which are seen to grow disproportionally (CAGR 2013-17E c. 17%) compared to the average number of active traders further benefiting from the higher CFD trading volume.

FinTech Group AG
17 Hauck & Aufhäuser Privatbankiers KGaA
flatex 2013 2014E 2015E 2016E 2017ECAGR
'13-'17Enumber of total customers 126,111 112,150 132,240 153,770 182,430average number of active customers 100,000 108,500 117,000 135,000 157,000 11.9%yoy in % 8.1% 8.5% 7.8% 15.4% 16.3%
number of new customers 10,200 9,000 10,800 12,420 13,662yoy in % 13.3% -11.8% 20.0% 15.0% 10.0%
average number of total trades per active customer p.a. 51 49 63 72 83 12.8%yoy in % -4% 29% 14% 15%
CFD 20 18 23 30 39 18.5%FX 3 3 3 3 3 0.0%OTC / Kassa 28 28 37 39 40 9.4%
avgerage net fee per trade (in €) 2.05 2.34 2.78 2.74 2.68
Net trading sales (in m €) 10.4 12.5 20.5 26.5 34.8 35.1%yoy in % 19.3% 64.5% 29.2% 31.2%
Total customers' cash deposits (in m €) 700 760 902 1,075 1,308yoy in % 9% 19% 19% 22%
interst rate (in %) 0.23% 0.23% 0.23% 0.23% 0.23%Net sales from depoist management (in m €) 1.6 1.7 2.1 2.5 3.0 16.9%
in % of total sales 13% 12% 9% 9% 8%
Total net sales 12.1 14.2 22.6 29.0 37.8 33.0%
yoy in % 18% 20% 15% 10%
in % of totale sales* 84% 65% 30% 24% 26%
Source: Company data; Hauck & Aufhäuser estimates
* in 2013 c. € 2.2m are stemming from KochBank which was merged with CeFDex in 2014 CeFDex
Based on its leading IT solutions and the increasing demand for CFDs in general, we expect CeFDex to win additional wholesale customers in 2015E.
CeFDex is a pure B2B player. It‘s software/ platform provides a customised interface and direct access to the CFD market for the customers of its business partners. Once a bank or other financial institution is connected to CeFDex’s software, the number of trades might increase significantly depending on the number of customer accounts of the respective new business partners.
CefDex 2013 2014E 2015E 2016E 2017ECAGR
'13-'17Etotal number of trades (in thousand) 1,972 2,240 4,350 6,570 9,590 49%yoy in % 14% 94% 51% 46%
number of trades with flatex customers 1,663 1,900 2,760 4,140 6,230
yoy in % 14% 45% 50% 50%
number of trades with AKTIONÄRSBANK customers 0 60 360 880 1,410yoy in % 500% 144% 60%
number of trades with external partner 309 280 1,230 1,550 1,950yoy in % -9% 339% 26% 26%
avgerage fee per trade (in €) 5.0 3.2 4.1 3.9 3.8Net sales in (in m €) 9.9 7.5 19.1 28.8 41.9 43%
yoy in % -25% 156% 51% 45%
in % of total sales* 34% 19% 24% 28%
Source: Company data; Hauck & Aufhäuser estimates The average fee per trade should rise significantly in 2015E particularly with regard to the boost of trading volume for external partners (fee higher compared to internal partners) as well as an improvement of efficiency. The latter should be realised by the new chief trader (will be hired in 2015) who will strictly focus on raising efficiency (e.g. the more effective use of trading data, spread management, favourable CFD shift in product mix etc).
While this should already allow for a sound growth in top-line, the effects from the introduction of the capital transaction tax in Germany could bolster growth further. When introduced in France, the CFD market experienced a boost in

FinTech Group AG
18 Hauck & Aufhäuser Privatbankiers KGaA
growth of about 25% yoy. This is due to a significantly lower transaction tax rate on CFDs compared to OTCs (0.01pp vs 0.1pp respectively). However, as we take a conservative stance, positive effects from the introduction of the planned transaction tax in Germany are not reflected in our estimates.
AKTIONÄRSBANK
The bank started operations by mid-2014 and is seen to gain traction from 2015E onwards.
AKTIONÄRSBANK 2014E 2015E 2016E 2017ECAGR
'14E-'17Enumber of total customers 4,800 17,400 29,130 39,530number of active customers - 11,090 23,190 34,110yoy in % - 109% 47%
number of new customers - 12,600 11,730 10,400yoy in % -7% -11%
number of trades per active customer (total) - 97 103 107CFD - 28.0 33.2 36.6FX - 4.6 4.8 4.4OTC / Kassa - 64.9 64.7 66.0
avg. fee per trade of active customers (total in €) - 2.5 2.7 2.7Net trading sales (in m €) 0.1 2.7 6.4 9.7 479%
Total customers' cash deposits (in m €) 0 91 160 229yoy in % 76% 43%
Interest rate (in %) 0.3% 0.3% 0.3%Net sales from depoist management (in m €) 0.0 0.3 0.5 0.7
Total net Sales (in m €) 0.1 3.0 6.8 10.4 279.7%yoy in % 5848.4% 130.3% 51.8%
in & of total sales 0.2% 2.9% 5.6% 7.0%
Source: Company data; Hauck & Aufhäuser estimates

FinTech Group AG
19 Hauck & Aufhäuser Privatbankiers KGaA
EBIT and EBT
EBIT is seen to return to its historical level yielding an EBIT margin of about 30% from 2017E onwards (c. 37% in 2011). In 2014E and 2015E the EBIT is biased by one-off restructuring costs (eH&A: € 2m restructuring costs mainly relating to redundancy payments) and integration costs with regard to the XCOM acquisition (eH&A: € 2m) respectively.
(in m €) 2013 2014E 2015E 2016E 2017ESales 14.3 21.7 102.3 122.3 147.7yoy in % 52% 371% 20% 21%
EBIT -1.1 -7.2 5.4 26.2 37.3EBIT-margin -8% -33% 5% 21% 25%
yoy in % 558% -175% 388% 43%
Adjusted EBIT -1.1 -5.2 7.4 26.2 37.3Adjusted EBIT-margin -8% -24% 7% 21% 25%
yoy in % 374% -243% 255% 43%
Source: Statista; Hauck & Aufhäuser estimates EBT is expected to significantly improve on the back of: • Cost savings (total c. € 11m by 2017E, thereof € 8.5m stemming from
the XCOM integration): We expect € 2.5m cost savings in personnel expenses in 2015E (-15% yoy) after the integration of CeFDex and an additional € 5m after the integration of XCOM in 2016E respectively. Further € 3.1m cost savings should be realised in 2017E (€ 2.6m relating to personnel expenses and € 0.5m to other operating expenses). Moreover, through a potential merger of the two full service banks (AKTIONÄRSBANK and biw bank) obvious synergy effects could lead to additional cost savings, more efficiency and thus higher margins (conservatively, not yet reflected in our estimates).
• Economies of scale: Exploiting incremental high margin sales through re-starting active customer acquisition at flatex (through marketing) and gaining additional external customers for CeFDex AND pushing the favourable shift in product mix towards CFDs and Forex trades.
• Earnings-accretive acquisition of XCOM: EBT should also be boosted by about c. € 8m p.a from 2015E onwards deriving from the XCOM acquisition (eH&A: based on expected 2013 results).
EBIT bridge EBT bridge
Source: Company data; Hauck & Aufhäuser estimates Source: Company data; Hauck & Aufhäuser estimates
26.2(1) - 4 4
(6)20
5.4
(5)4
(17)
(20)(3)54
-7.2
(1)-
(9)
(2)(2)7
-1.1-10
0
10
20
30
40
50
FY2013
EBIT
Gross
pro
fit ga
in/ lo
ss
Mar
ketin
g ex
pens
esG&A
Other
ope
ratin
g ex
pens
es
Other
ope
ratin
g inc
ome
D&A
FY14E E
BIT
Gross
pro
fit ga
in/ lo
ss
Mar
ketin
g ex
pens
esG&A
Other
ope
ratin
g ex
pens
es
Other
ope
ratin
g inc
ome
D&A
FY15E E
BIT
Gross
pro
fit ga
in/ lo
ss
Mar
ketin
g ex
pens
esG&A
Other
ope
ratin
g ex
pens
es
Other
ope
ratin
g inc
ome
D&A
FY16E E
BIT
(2)
34.2
(7.3)
13.4
13
10
(1.3) (6)
21
-10
0
10
20
30
40
FY13 E
BT
Chang
e in
EBIT
FY14E E
BT
Chang
e in
EBIT
Inte
rest
incom
e
Inte
rest
expe
nses
FY15E E
BT
Chang
e in
EBIT
FY16E E
BT

FinTech Group AG
20 Hauck & Aufhäuser Privatbankiers KGaA
2013 2014E 2015E 2016 2017FinTech Group FY FY FY FY FY
Total sales 14.3 21.7 102.3 122.3 147.7yoy 52.1% 370.7% 19.6% 20.8%
qoq
Cost of sales 0.0 0.0 26.9 26.9 26.9in % of sales 26.3% 22.0% 18.2%
yoy 0.0% 0.0%
Gross profit 14.3 21.7 75.4 95.4 120.8Gross profit margin 100.0% 100.0% 73.7% 78.0% 81.8%
Sales and marketing 1.4 3.0 6.0 11.5 15.5in % of sales 9.7% 13.8% 5.9% 9.4% 10.5%
G&A (incl. Personnel expenses) 8.1 10.0 30.4 26.9 31.3in % of sales 56.9% 46.0% 29.7% 22.0% 21.2%
Other operating income 0.4 0.4 4.6 4.6 4.6in % of sales 2.9% 1.8% 4.5% 3.8% 3.1%
Other operating expenses 5.5 15.0 32.0 28.0 32.5in % of sales 38.6% 69.0% 31.3% 22.9% 22.0%
EBITDA -0.3 -5.9 11.6 33.6 46.1EBITDA margin -2.3% -27.0% 11.3% 27.5% 31.2%
Depreciation & Amortisation 0.8 1.3 6.2 7.4 8.8in % of sales 5.3% 5.9% 6.1% 6.1% 6.0%
EBIT -1.1 -7.2 5.4 26.2 37.3EBIT margin -7.6% -32.9% 5.2% 21.4% 25.2%
yoy 558.0% -175.0% 387.7% 42.5%
Adjusted EBIT -1.1 -5.2 7.4 26.2 37.3Adjusted EBIT-margtin -7.6% -23.7% 7.2% 21.4% 25.2%
Interest income 0.0 0.0 9.9 9.9 9.9in % of sales 0.0% 0.0% 9.7% 8.1% 6.7%
Interest expenses 0.1 0.1 1.9 1.9 2.0in % of sales 0.5% 0.5% 1.9% 1.6% 1.3%
Investment income -0.2 0.0 0.0 0.0 0.0in % of sales 0.0 0.0 0.0 0.0 0.0
EBT -1.3 -7.3 13.4 34.2 45.2EBT margin -9.3% -33.4% 13.1% 27.9% 30.6%
Adjusted EBT -1.3 -5.3 15.4 34.2 45.2Adjusted EBT margin -9.3% -24.2% 15.0% 27.9% 30.6%
Income tax -0.1 -1.2 4.0 10.0 14.5Tax rate -6.4% -16.5% -29.9% -29.3% -32.1%
Other tax expenses 0.0 0.0 0.1 0.1 0.1Net profit -1.2 -6.1 9.2 24.0 30.6
Net profit margin -8.7% -27.9% 9.0% 19.6% 20.7%
yoy 386% -252% 160% 27%
EPS -0.09 -0.43 0.66 1.72 2.19Source: Hauck & Aufhäuser estimates

FinTech Group AG
21 Hauck & Aufhäuser Privatbankiers KGaA
FinTech Group stand alone (flatex, CeFDex, AKTIONÄRSBANK)
2013FY FY FY FY FY
FinTech Group (flatex, CeFDex, AKTIONÄRSBANK)Net Sales 14.3 21.7 44.7 64.7 90.1
yoy 52.1% 105.6% 44.8% 39.3%
COGS 0.0 0.0 0.0 0.0 0.0in % of sales 0.0% 0.0% 0.0% 0.0% 0.0%
Gross profit 14.3 21.7 44.7 64.7 90.1Gross profit margin 100.0% 100.0% 100.0% 100.0% 100.0%
Other operating income 0.4 0.4 0.4 0.4 0.4in % of sales 2.9% 1.8% 0.9% 0.6% 0.4%
Sales & marketing 1.4 3.0 6.0 11.5 15.5in % of sales 9.7% 13.8% 13.4% 17.8% 17.2%
Personnel expenses 5.5 10.0 8.5 10.0 12.0in % of sales 38.6% 46.0% 19.0% 15.5% 13.3%
Other operating expenses 8.1 15.0 17.0 15.0 20.0in % of sales 56.9% 69.0% 38.1% 23.2% 22.2%
EBITDA -0.3 -5.9 13.6 28.6 43.0EBITDA margin -2.3% -27.0% 30.4% 44.2% 47.7%
Depreciation & Amortisation 0.8 1.3 2.6 3.8 5.2in % of sales 5.3% 5.9% 5.8% 5.9% 5.8%
EBIT -1.1 -7.2 11.0 24.8 37.8EBIT margin -7.6% -32.9% 24.5% 38.3% 41.9%
yoy -1388.4% 558.0% -253.2% 125.8% 52.6%
Interest & other financial expenses 0.1 0.1 0.1 0.1 0.2in % of sales 0.5% 0.5% 0.2% 0.2% 0.2%
Interest & other financial income 0.0 0.0 0.0 0.0 0.0in % of sales 0.0% 0.0% 0.0% 0.0% 0.0%
Amotisation on financial assets 0.2 0.0 0.0 0.0 0.0in % of sales 1.2% 0.0% 0.0% 0.0% 0.0%
EBT -1.3 -7.3 10.9 24.7 37.6EBT margin -9.2% -33.4% 24.3% 38.1% 41.8%
Income tax -0.1 -1.2 3.0 7.0 11.0Tax rate -6.5% -16.5% -27.6% -28.4% -29.2%
Net profit -1.2 -6.1 7.9 17.7 26.6Net profit margin -8.6% -27.9% 17.6% 27.3% 29.6%
yoy 155.5% 390.5% -229.9% 124.6% 50.8%
Source: Hauck & Aufhäuser estimates
2014E 2015E 2016E 2017E
XCOM
Conservatively based on the 2013 results, we assume stable sales and profitability for XCOM looking forward. We only consider cost savings as described above.
2013 FY
XCOMTotal sales 57.6
yoy -5.9%
Material expenses 26.9in % of sales 46.7%
Gross profit 30.7Gross profit margin 53.3%
Personnel expenses 21.9in % of sales 38.0%
Other operating income 4.2in % of sales 7.3%
Other operating expenses 13.0in % of sales 22.6%
EBITDA 0.0EBITDA margin 0.0%
Depreciation & Amortisation 3.6in % of sales 6.3%
EBIT -3.6EBIT margin -6.2%
yoy -25.0%
Interest & other financial expenses 1.8in % of sales 3.1%
Interest & other financial income 9.9in % of sales 17.2%
EBT 4.5EBT margin 7.8%
yoy 50.0%
Income tax 2.0Tax rate -45.3%
Other tax expenses 0.1Net profit 2.3
Net profit margin 4.0%
yoy 60.0%
Source: Company Data; Hauck & Aufhäuser estimates

FinTech Group AG
22 Hauck & Aufhäuser Privatbankiers KGaA
Valuation
In order to derive a fair valuation for FinTech, the following valuation metrics were used:
• DCF model
• Adjusted FCF valuation
The PT of € 17.00 is based on FCFY 2016E.
The DCF model assumptions are:
• c. 20% CAGR 2015-2017E
• Decrease to 7% CAGR p.a. from 2017E to 2022E
• Terminal growth rate of 2%
• Terminal year EBIT margin of 25%
Terminal year WACC of 8% (1.5% risk free rate, beta of 1.1, risk premium of 6%).
2014E 2015E 2017E 2018E 2019E 2020E 2021ETerminal
value
-6.0 3.7 25.2 32.1 37.0 38.8 41.3 36.5
1.3 6.2 8.8 10.6 11.3 12.3 12.6 12.7
-1.0 -2.6 0.0 0.0 0.0 0.0 0.0 0.0
0.0 0.0 0.0 0.0 0.0 0.0 0.0 0.0
-7.0 -13.8 -8.9 -10.1 -11.1 -11.8 -12.3 -12.7
0.0 -61.4 0.0 0.0 0.0 0.0 0.0 0.0
2.9 0.0 0.0 0.0 0.0 0.0 0.0 0.0
-9.8 -67.9 25.2 32.6 37.2 39.3 41.7 36.5
-9.7 -63.0 19.8 23.8 25.1 24.5 26.0 333.2
8.0% 7.3% 8.0% 8.0% 8.0% 8.0% 8.0% 8.0%
DCF per share derived from DCF avg. growth and earnings assumptions
Total present value 393 Short term growth (2014-2017) 104.5%
thereof terminal value 85% Medium term growth (2017 - 2022) 7.0%
Net debt (net cash) at start of year -20 Long term growth (2021 - infinity) 2.0%
Financial assets 1 Terminal year EBIT margin 25.0%
Provisions and off balance sheet debt 7
Equity value 408 WACC derived from
Cost of borrowings before taxes 6.0%
Discounted cash flow per share 29.1 Tax rate 30.0%
upside/(downside) 207% Cost of borrowings after taxes 5.0%
Required return on invested capital 8.0%
Risk premium 6.0%
Risk-free rate 1.5%
Share price 9.50 Beta 1.1
Sensitivity analysis DCF Sensitivity analysis DCF
29.1 0% 1.0% 2.0% 2.5% 3.0% 29.1 23.0% 24.0% 25.0% 26.0% 27.0%
10.0% 17.4 18.9 20.7 21.8 23.1 10.0% 19.0 19.9 20.7 21.6 22.4
9.0% 19.8 21.7 24.3 25.8 27.6 9.0% 22.2 23.2 24.3 25.3 26.4
8.0% 22.8 25.5 29.1 31.4 34.2 8.0% 26.5 27.8 29.1 30.5 31.8
7.0% 26.9 30.7 36.1 39.7 44.2 7.0% 32.7 34.4 36.1 37.8 39.6
6.0% 32.5 38.2 46.9 53.0 61.3 6.0% 42.3 44.6 46.9 49.2 51.5
Source: Hauck & Aufhäuser estimates
No. of shares outstanding
WA
CC
Long term growth
Capex
Acquisitions
Capital increase
-9.8
0.0
0.0
13.7
EBIT margin terminal year
WA
CC
14.0
DCF (EUR m) (except per share data and beta)
NOPAT
Depreciation
Increase/decrease in working capital
Cash flow
Present value
WACC
Increase/decrease in long-term provisions and accruals
7.4
0.0
0.0
7.7%
16.0
2016E
18.4
Our DCF valuation yields a fair value per share of € 29.10 for FinTech.

FinTech Group AG
23 Hauck & Aufhäuser Privatbankiers KGaA
FCF Yield
Due to the fact that companies with such a strong focus on a niche rarely bear sufficient resemblance to peers in terms of geographical exposure, size or competition strength and due to the fact that long-term returns are flawed by the lack of sufficient visibility, an Adjusted Free Cash Flow analysis (adjusted FCF) has been conducted. The main driver of this model is the level of return available to a controlling investor, influenced by the cost of that investors’ capital (opportunity costs) and the purchase price – in this case the enterprise value of the company. Here, the adjusted FCF yield is used as a proxy for the required return and is defined as EBITDA less minority interest, taxes and investments required to maintain existing assets (maintenance capex). Generally, capital light businesses like FinTech recognise most costs to stay competitive in the P&L above EBITDA (e.g. FinTech’s significant boost of marketing expenses looking forward). After (from 2016E onwards) the full integration of XCOM, the premium technology and transaction provider for banks and financial institutions AND the backbone of FinTech’s future technology edge (especially with regard to the launch of its new business lines in the field of technology based lending), we assume that maintenance capex equals D&A. Simply put, the model assumes that investors require companies to generate a minimum return on the investor’s purchase price. The required tax return equals the model’s hurdle rate of 10% accounting for higher risk involved in the transformational process (generally H&A post tax hurdle rate of 7.5%). Anything less suggests the stock is expensive; anything more suggests the stock is cheap. The FCF Yield 2016E implies a fair value of € 17.00 (c. 80% upside) Valuation is based on FCFY 2016E (DCF PT € 29.40) to reflect the benefits of FinTech’s ongoing restructurings as well as the acquisition of XCOM, which should allow the company to tap further synergies (e.g. potential merger of biw bank and AKTIONÄRSBANK). However, valuing the company on 2016E FCFY can still be seen as conservative given the growth potential of the company. Based on 2017E, the FCFY would imply a fair value of € 24.10.
FinTech Group AG
24 Hauck & Aufhäuser Privatbankiers KGaA
FinTech Group AG
FCF yield, year end Dec. 31 2014E 2015E 2016E 2017E
EBITDA -4.2 21.0 41.7 54.2
- Maintenance capex 0.6 3.1 7.4 8.8
- Minorities 0.0 0.0 0.0 0.0
- tax expenses -1.2 4.0 10.0 14.5
= Adjusted Free Cash Flow -3.6 13.9 24.3 30.9
Actual Market Cap 132.9 132.9 132.9 132.9
+ Net debt (cash) -16.1 33.3 11.7 -18.8
+ Pension provisions 0.0 0.0 0.0 0.0
+ Off balance sheet financing 0.0 0.0 0.0 0.0
+ Adjustments prepayments 0.0 0.0 0.0 0.0
- Financial assets -1.2 -1.3 -1.3 -1.3
- Dividend payment 0.0 0.0 0.0 0.0
EV Reconciliations -17.4 32.0 10.4 -20.1
= Actual EV' 115.6 165.0 143.3 112.8
Adjusted Free Cash Flow yield -3.2% 8.5% 16.9% 27.4%
Sales 21.7 102.3 122.3 147.7
Actual EV/sales 5.3x 1.6x 1.2x 0.8x
Hurdle rate 10% 10% 10% 10%
FCF margin -16.8% 13.6% 19.8% 20.9%
Fair EV/sales -1.7x 1.4x 2.0x 2.1x
Fair EV -37.4 143.0 248.8 316.8
- EV Reconciliations -17.4 32.0 10.4 -20.1
Fair Market Cap -20.0 111.0 238.4 337.0
No. of shares (million) 14.0 14.0 14.0 14.0
Fair value per share -1.4 7.9 17.0 24.1
Premium (-) / discount (+) in % -115.1% -16.5% 79.4% 153.5%
Sensitivity analysis fair value
8% -2.2 11.0 22.4 30.9
10% -1.4 7.9 17.0 24.1
12% -0.9 5.8 13.4 19.5
15% -0.5 4.5 11.0 16.4Source: Hauck & Aufhäuser estimates
Hurdle rate
Notes:
• The EBITDA is pre one-off restructuring expenses (eH&A: € 2m in 2014E)
and integration costs relating to the XCOM acquisition (eH&A: € 2m in 2015E).
• From 2015E onwards the EBITDA comprises the net interest income stemming from XCOM (c. € 8.1m before tax mainly from biw bank) which is considered recurring and operative.
• Net debt is adjusted for any cash related to customer deposits etc. (theoretical liquidation of company).
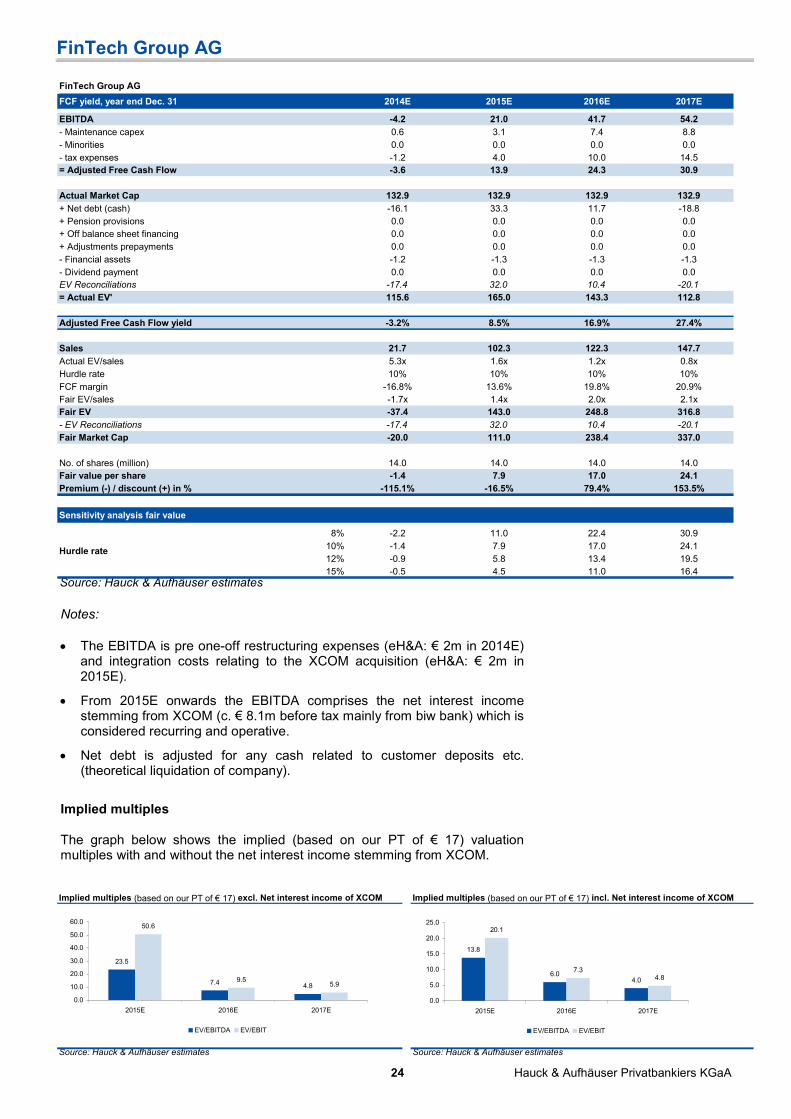
Implied multiples
The graph below shows the implied (based on our PT of € 17) valuation multiples with and without the net interest income stemming from XCOM.
Implied multiples (based on our PT of € 17) excl. Net interest income of XCOM Implied multiples (based on our PT of € 17) incl. Net interest income of XCOM
Source: Hauck & Aufhäuser estimates Source: Hauck & Aufhäuser estimates
23.5
7.4 4.8
50.6
9.55.9
0.0
10.0
20.0
30.0
40.0
50.0
60.0
2015E 2016E 2017E
EV/EBITDA EV/EBIT
13.8
6.04.0
20.1
7.34.8
0.0
5.0
10.0
15.0
20.0
25.0
2015E 2016E 2017E
EV/EBITDA EV/EBIT

FinTech Group AG
25 Hauck & Aufhäuser Privatbankiers KGaA
Theme
Plenty of opportunities to increase investors’ value
Repositioning of the business
The ongoing restructuring of the FinTech group is expected to result in significant improvements of both top-and bottom line already in the short term due to “low hanging fruits” that are easy to realise. For instance, the full integration of CeFDeX into the FinTech Group should not only improve cross selling between flatex and CeFDex but more importantly it should also allow the group to significantly reduce labour costs (eH&A: total cost savings of € 11m realised by 2017E) which is seen to have a positive impact on the P&L from next year onwards.
EBT and free cash flow development
Source: Company data; Hauck & Aufhäuser estimates
-20
-10
0
10
20
30
40
50
11 12 13 14E 15E 16E 17E
EBT (l.s.) Free Cashflow (r.s.)
Moreover, the company intends to explore other growth fields that are not reflected in our estimates:
• FinTech is keen on expanding its services and also start new innovative business models such as crowd funding, fund services, social trading or P2P lending. Overall, FinTech clients have approximately € 700m cash on their accounts at an interest rate of almost zero. At the moment, FinTech is working on building up technology-based lending with the aim to generate a 1-2% margin on its customers’ cash deposits. These new business models should contribute to earnings in 2016E at the latest.
XCOM enhances FinTech’s technology backbone
FinTech has contractually secured an option to acquire a majority stake of 54% in XCOM Group. Final closing is expected in January 2015. FinTech intends to fully take over XCOM by the end of 2016 (call option) valuing the target at approximately € 83m. Considering that XCOM holds c. € 21 in net cash, the EV is seen at c. € 62m. This implies an EV/EBT multiple of 14x.
XCOM Group is a leading provider of banking and brokerage IT and software solutions. XCOM's customers are primarily banks and financial institutions with an international approach as well as small and medium-sized enterprises in various industries. One important subsidiary of XCOM Group is "biwBank", a full-service bank mainly acting as an outsourcing and transaction partner for other banks and financial services companies (e.g. Deutsche Bank,

FinTech Group AG
26 Hauck & Aufhäuser Privatbankiers KGaA
Commerzbank, HypoVereinsbank, Postbank etc). The impressive client list assembles many of Germany's top financial institutions. FinTech's subsidiary flatex has also been a loyal client of biw Bank since its foundation in 2006.
XCOM Group is expected to achieve approximately c. € 58m of revenues (thereof c. 70% deriving from financial services, 25% software & advisory and 5% from selling hardware) and an EBT of around c. € 4.5m in 2013 with around 350 employees. The two groups will form one of the largest financial services technology providers in Europe with two pillars: third party transaction & out/ in-sourcing banking business and online retail banking business under their own brands. With the acquisition of XCOM, FinTech is seen to make a big step towards its goal of becoming a leading financial service technology provider in Germany.
The next big thing - Fintech companies are disrupting banking
Technology (Big Data) is seen as a game changer, and the infrastructure of banks in the POS is antiquated inviting companies with a technology and Internet-based background. Moreover, these fintech companies that have no branches and spend less on patching up legacy software work much more efficiently. An online-based business model also comes along with a high degree of scalability. Consequently, the price structure for traditional banking solutions could be eroded by the new entries. Having the huge market size of the banking sector and the growth potential for new entries in mind, the immense amount of regulation that any new entity is faced with, is however a massive barrier to entry for technology driven companies. Notably, FinTech Group has both, the technology background AND a German banking license with European passport. Hence, the company looks well equipped to exploit the huge market opportunity.
Increase market perception as it is currently not well covered and under owned
We expect transparency to increase through a broader coverage and an improved capital market activity of the new management team. At the current stage, FinTech is a relatively unknown growth company owned by two large shareholders (only 20% free float) which results in a significant undervaluation of the stock.

FinTech Group AG
27 Hauck & Aufhäuser Privatbankiers KGaA
Company Background
Structural overview of the FinTech Group
The organisational chart shows FinTech’s main operating units, which will be complemented by XCOM from 2015E onwards (transaction closing expected in Jan. 2015E).
Organisational chart Fintech Group
Source: Company data; Hauck & Aufhäuser
FinTech Group AG
Aktionärsbank
GmbH (100%)
Flatex GmbH (100%)
CeFDex AG (100%)
Management Team
Frank Niehage, CEO (46)
Frank has vast experience across all segments of retail and commercial banking. Frank previously worked as a Managing Director for Goldman Sachs until August 2014. Prior to Goldman he was instrumental in the growth of Bank Sarasin AG as a CEO in Germany. Frank also gained relevant experience in all aspects of commercial banking at Commerzbank, UBS, and Credit Suisee. Frank holds a Master in Law majoring in international economics.
Martin Korbmacher, Chairman of the Supervisory Board (AGE
Martin has extensive experience and ‘know how’ both in traditional banking as well as in financial services technologies. After being global head of equities at Dresdner Kleinwort, he was investment banking head of Germany and Austria for Credit Suisse from 2005 until 2011, then focused on entrepreneurial activities in alternative asset management and VC investments in various sectors including financial services technologies.

FinTech Group AG
28 Hauck & Aufhäuser Privatbankiers KGaA
Shareholder structure Shareholder structure
Source: Company data; Hauck & Aufhäuser
GfBK Gesellschaft für
Börsenkommunikation mbH59%
Heliad Equity Partners GmbH &
Co. KGaA21%
Free float20%
FinTech Group AG (formerly known as flatex Holding AG) is listed on the Frankfurt Stock Exchange (EntryStandard segment). In 2015, FinTech Group intends to change its listing from Entry Standard to Prime Standard of the Frankfurt Stock Exchange, combined with a dual listing at AIM, London. The main shareholder with some 60% of total shares is Bernd Förtsch via the investment vehicle GfBK Gesellschaft für Börsenkummunikation mbh. Heliad is an investment company providing capital for start-ups or companies which are in growth or change phases. The particular characteristics of the investment strategy include active support for the investments and the possibility of developing individual funding solutions. Heliad invests in both listed and non-listed companies and may acquire minority or majority interests.
Company’s History
Mar. 2006 Start online brokerage & trading via flatex portal Nov. 2008 Start CFD trading Jun. 2009 IPO of flatex AG. Dec. 2009 Foundation of affiliate ViTrade Sep. 2012 Rebranding in flatex Holding AG. Operations processed in
subsidiary flatex GmbH Sep. 2013 Subsidiary flatex alpha GmbH (today Die AKTIONÄRSBANK)
gets banking license approval Dec 2013 Disposal of ViTrade AG. Acquisition of CeFDex AG Feb 2014 Die AKTIONÄRSBANK starts operations Aug. 2014 Rebranding from flatex Holding AG to FinTech Group AG Oct. 2014 FinTech has contractually secured an option to acquire a
majority stake of 54% in XCOM Group (intended closing date Jan. 2015) and intends to fully take over the company by the end of 2016.

FinTech Group AG
29 Hauck & Aufhäuser Privatbankiers KGaA
Financials
Profit and loss (EUR m) 2011 2012 2013 2014E 2015E 2016E 2017E
Sales 23.7 15.6 14.3 21.7 102.3 122.3 147.7
Sales growth 53.1 % -34.4 % -8.2 % 52.1 % 370.7 % 19.6 % 20.8 %
Cost of sales 0.0 0.0 0.0 0.0 26.9 26.9 26.9
Gross profit 23.7 15.6 14.3 21.7 75.4 95.4 120.8
Sales and marketing 0.0 0.0 1.4 3.0 6.0 11.5 15.5
General and administration 3.8 4.5 5.5 10.0 30.4 26.9 31.3
Research and development 0.0 0.0 0.0 0.0 0.0 0.0 0.0
Other operating income 0.4 0.5 0.4 0.4 4.6 4.6 4.6
Other operating expenses 10.2 10.2 8.1 15.0 32.0 28.0 32.5
Unusual or infrequent items 0.0 0.0 0.0 0.0 0.0 0.0 0.0
EBITDA 10.1 1.3 -0.3 -5.9 11.6 33.6 46.1
Depreciation 0.0 0.0 0.0 0.0 0.0 0.0 0.0
EBITA 10.1 1.3 -0.3 -5.9 11.6 33.6 46.1
Amortisation of goodwill 0.0 0.0 0.0 0.0 0.0 0.0 0.0
Amortisation of intangible assets 1.3 1.2 0.8 1.3 6.2 7.4 8.8
Impairment charges 0.0 0.0 0.0 0.0 0.0 0.0 0.0
EBIT 8.8 0.1 -1.1 -7.2 5.4 26.2 37.3
Interest income 0.3 0.3 0.0 0.0 9.9 9.9 9.9
Interest expenses 0.0 0.0 0.1 0.1 1.9 1.9 2.0
Other financial result 0.2 0.1 0.2 0.0 0.0 0.0 0.0
Financial result 0.1 0.2 -0.2 -0.1 8.0 8.0 8.0
Recurring pretax income from continuing operations 8.9 0.2 -1.3 -7.3 13.4 34.2 45.2
Extraordinary income/loss 0.0 0.0 0.0 0.0 0.0 0.0 0.0
Earnings before taxes 8.9 0.2 -1.3 -7.3 13.4 34.2 45.2
Taxes 2.6 0.2 -0.1 -1.2 4.1 10.1 14.6
Net income from continuing operations 6.3 0.0 -1.2 -6.1 9.2 24.0 30.6
Result from discontinued operations (net of tax) 0.0 0.0 0.0 0.0 0.0 0.0 0.0
Net income 6.3 0.0 -1.2 -6.1 9.2 24.0 30.6
Minority interest 0.5 0.4 0.0 0.0 0.0 0.0 0.0
Net income (net of minority interest) 5.8 -0.4 -1.2 -6.1 9.2 24.0 30.6
Average number of shares 14.0 14.0 14.0 14.0 14.0 14.0 14.0
EPS reported 0.41 -0.03 -0.09 -0.43 0.66 1.72 2.19
Profit and loss (common size) 2011 2012 2013 2014E 2015E 2016E 2017E
Sales 100.0 % 100.0 % 100.0 % 100.0 % 100.0 % 100.0 % 100.0 %
Cost of sales 0.0 % 0.0 % 0.0 % 0.0 % 26.3 % 22.0 % 18.2 %
Gross profit 100.0 % 100.0 % 100.0 % 100.0 % 73.7 % 78.0 % 81.8 %
Sales and marketing 0.0 % 0.0 % 9.7 % 13.8 % 5.9 % 9.4 % 10.5 %
General and administration 16.1 % 28.9 % 38.6 % 46.0 % 29.7 % 22.0 % 21.2 %
Research and development 0.0 % 0.0 % 0.0 % 0.0 % 0.0 % 0.0 % 0.0 %
Other operating income 1.6 % 3.1 % 2.9 % 1.8 % 4.5 % 3.8 % 3.1 %
Other operating expenses 42.9 % 65.7 % 56.9 % 69.0 % 31.3 % 22.9 % 22.0 %
Unusual or infrequent items 0.0 % 0.0 % 0.0 % 0.0 % 0.0 % 0.0 % 0.0 %
EBITDA 42.6 % 8.5 % -2.3 % -27.0 % 11.3 % 27.5 % 31.2 %
Depreciation 0.0 % 0.0 % 0.0 % 0.0 % 0.0 % 0.0 % 0.0 %
EBITA 42.6 % 8.5 % -2.3 % -27.0 % 11.3 % 27.5 % 31.2 %
Amortisation of goodwill 0.0 % 0.0 % 0.0 % 0.0 % 0.0 % 0.0 % 0.0 %
Amortisation of intangible assets 5.4 % 7.9 % 5.3 % 5.9 % 6.1 % 6.1 % 6.0 %
Impairment charges 0.0 % 0.0 % 0.0 % 0.0 % 0.0 % 0.0 % 0.0 %
EBIT 37.2 % 0.5 % -7.6 % -32.9 % 5.2 % 21.4 % 25.2 %
Interest income 1.1 % 1.8 % 0.0 % 0.0 % 9.7 % 8.1 % 6.7 %
Interest expenses 0.0 % 0.0 % 0.5 % 0.5 % 1.9 % 1.6 % 1.3 %
Other financial result 0.7 % 0.7 % 1.3 % 0.0 % 0.0 % 0.0 % 0.0 %
Financial result 0.3 % 1.0 % -1.6 % -0.5 % 7.8 % 6.5 % 5.4 %
Recurring pretax income from continuing operations 37.5 % 1.5 % -9.2 % -33.4 % 13.1 % 27.9 % 30.6 %
Extraordinary income/loss 0.0 % 0.0 % 0.0 % 0.0 % 0.0 % 0.0 % 0.0 %
Earnings before taxes 37.5 % 1.5 % -9.2 % -33.4 % 13.1 % 27.9 % 30.6 %
Tax rate 29.4 % 82.2 % 6.5 % 16.5 % 31.0 % 29.7 % 32.4 %
Net income from continuing operations 26.5 % 0.3 % -8.6 % -27.9 % 9.0 % 19.6 % 20.7 %
Result from discontinued operations (net of tax) 0.0 % 0.0 % 0.0 % 0.0 % 0.0 % 0.0 % 0.0 %
Net income 26.5 % 0.3 % -8.6 % -27.9 % 9.0 % 19.6 % 20.7 %
Minority interest 2.1 % 2.8 % 0.0 % 0.0 % 0.0 % 0.0 % 0.0 %
Net income (net of minority interest) 24.3 % -2.6 % -8.6 % -27.9 % 9.0 % 19.6 % 20.7 % Source: Company data, Hauck & Aufhäuser

FinTech Group AG
30 Hauck & Aufhäuser Privatbankiers KGaA
Balance sheet (EUR m) 2011 2012 2013 2014E 2015E 2016E 2017E
Intangible assets 1.3 3.0 5.3 10.1 72.4 71.1 66.7
Property, plant and equipment 0.9 1.3 1.3 2.2 8.3 12.0 16.4
Financial assets 4.6 3.4 1.2 1.2 284.0 284.0 284.0
FIXED ASSETS 6.8 7.6 7.9 13.5 364.7 367.1 367.1
Inventories 0.0 0.0 0.0 0.0 1.3 1.3 1.3
Accounts receivable 2.1 1.8 2.0 3.0 3.0 3.0 3.0
Other current assets 0.2 1.6 1.8 1.8 344.3 344.3 344.3
Liquid assets 16.4 5.6 36.9 33.0 284.1 305.7 336.3
Deferred taxes 0.0 0.0 0.0 0.0 0.0 0.0 0.0
Deferred charges and prepaid expenses 0.1 0.3 2.4 2.4 8.3 8.3 8.3
CURRENT ASSETS 18.9 9.2 43.0 40.3 641.0 662.7 693.2
TOTAL ASSETS 25.7 16.8 50.9 53.8 1,005.7 1,029.7 1,060.3
SHAREHOLDERS EQUITY 19.3 13.6 30.5 33.4 58.7 82.7 113.3
MINORITY INTEREST 1.3 0.8 0.0 0.0 0.0 0.0 0.0
Long-term debt 0.0 0.0 0.0 0.0 0.0 0.0 0.0
Provisions for pensions and similar obligations 3.6 1.6 7.0 7.0 13.8 13.8 13.8
Other provisions 0.0 0.0 0.0 0.0 0.0 0.0 0.0
Non-current liabilities 3.6 1.6 7.0 7.0 13.8 13.8 13.8
short-term liabilities to banks 0.0 0.0 0.3 0.3 104.7 104.7 104.7
Accounts payable 0.9 0.7 0.1 0.1 0.1 0.1 0.1
Advance payments received on orders 0.0 0.0 0.0 0.0 0.0 0.0 0.0
Other liabilities (incl. from lease and rental contracts) 0.6 0.1 12.4 12.4 827.1 827.1 827.1
Deferred taxes 0.0 0.0 0.0 0.0 0.0 0.0 0.0
Deferred income 0.0 0.0 0.5 0.5 1.3 1.3 1.3
Current liabilities 1.5 0.8 13.4 13.4 933.2 933.2 933.2
TOTAL LIABILITIES AND SHAREHOLDERS EQUITY 25.7 16.8 50.9 53.8 1,005.7 1,029.7 1,060.3
Balance sheet (common size) 2011 2012 2013 2014E 2015E 2016E 2017E
Intangible assets 5.0 % 17.7 % 10.5 % 18.8 % 7.2 % 6.9 % 6.3 %
Property, plant and equipment 3.6 % 7.5 % 2.6 % 4.0 % 0.8 % 1.2 % 1.5 %
Financial assets 17.9 % 19.9 % 2.4 % 2.3 % 28.2 % 27.6 % 26.8 %
FIXED ASSETS 26.5 % 45.1 % 15.4 % 25.1 % 36.3 % 35.6 % 34.6 %
Inventories 0.0 % 0.0 % 0.0 % 0.0 % 0.1 % 0.1 % 0.1 %
Accounts receivable 8.1 % 10.4 % 3.9 % 5.6 % 0.3 % 0.3 % 0.3 %
Other current assets 0.8 % 9.4 % 3.5 % 3.3 % 34.2 % 33.4 % 32.5 %
Liquid assets 63.9 % 33.0 % 72.4 % 61.4 % 28.2 % 29.7 % 31.7 %
Deferred taxes 0.2 % 0.0 % 0.0 % 0.0 % 0.0 % 0.0 % 0.0 %
Deferred charges and prepaid expenses 0.4 % 2.1 % 4.8 % 4.6 % 0.8 % 0.8 % 0.8 %
CURRENT ASSETS 73.5 % 54.9 % 84.6 % 74.9 % 63.7 % 64.4 % 65.4 %
TOTAL ASSETS 100.0 % 100.0 % 100.0 % 100.0 % 100.0 % 100.0 % 100.0 %
SHAREHOLDERS EQUITY 75.0 % 80.9 % 59.9 % 62.1 % 5.8 % 8.0 % 10.7 %
MINORITY INTEREST 4.9 % 4.9 % 0.0 % 0.0 % 0.0 % 0.0 % 0.0 %
Long-term debt 0.0 % 0.0 % 0.0 % 0.0 % 0.0 % 0.0 % 0.0 %
Provisions for pensions and similar obligations 14.2 % 9.3 % 13.7 % 13.0 % 1.4 % 1.3 % 1.3 %
Other provisions 0.0 % 0.0 % 0.0 % 0.0 % 0.0 % 0.0 % 0.0 %
Non-current liabilities 14.2 % 9.3 % 13.7 % 13.0 % 1.4 % 1.3 % 1.3 %
short-term liabilities to banks 0.0 % 0.0 % 0.6 % 0.6 % 10.4 % 10.2 % 9.9 %
Accounts payable 3.5 % 4.2 % 0.3 % 0.3 % 0.0 % 0.0 % 0.0 %
Advance payments received on orders 0.0 % 0.0 % 0.0 % 0.0 % 0.0 % 0.0 % 0.0 %
Other liabilities (incl. from lease and rental contracts) 2.4 % 0.7 % 24.4 % 23.1 % 82.2 % 80.3 % 78.0 %
Deferred taxes 0.0 % 0.0 % 0.0 % 0.0 % 0.0 % 0.0 % 0.0 %
Deferred income 0.0 % 0.0 % 1.0 % 0.9 % 0.1 % 0.1 % 0.1 %
Current liabilities 5.9 % 4.9 % 26.3 % 24.9 % 92.8 % 90.6 % 88.0 %
TOTAL LIABILITIES AND SHAREHOLDERS EQUITY 100.0 % 100.0 % 100.0 % 100.0 % 100.0 % 100.0 % 100.0 %
Source: Company data, Hauck & Aufhäuser

FinTech Group AG
31 Hauck & Aufhäuser Privatbankiers KGaA
Cash flow statement (EUR m) 2011 2012 2013 2014E 2015E 2016E 2017E
Net profit/loss 6.3 0.0 -1.2 -6.1 9.2 24.0 30.6
Depreciation of fixed assets (incl. leases) 0.0 0.0 0.0 0.0 0.0 0.0 0.0
Amortisation of goodwill 0.0 0.0 0.0 0.0 0.0 0.0 0.0
Amortisation of intangible assets 1.3 1.2 0.8 1.3 6.2 7.4 8.8
Others 0.0 -2.4 2.7 0.0 0.0 0.0 0.0
Cash flow from operations before changes in w/c 7.6 -1.2 2.2 -4.8 15.4 31.4 39.4
Increase/decrease in inventory 0.0 0.0 0.0 0.0 0.0 0.0 0.0
Increase/decrease in accounts receivable -2.1 0.3 -0.2 -1.0 -2.6 0.0 0.0
Increase/decrease in accounts payable 0.9 -0.2 -0.6 0.0 0.0 0.0 0.0
Increase/decrease in other working capital positions 0.0 0.0 0.0 0.0 0.0 0.0 0.0
Increase/decrease in working capital -1.2 0.2 -0.8 -1.0 -2.6 0.0 0.0
Cash flow from operating activities 6.4 -1.0 1.4 -5.8 12.8 31.4 39.4
CAPEX 0.0 4.8 4.3 7.0 13.8 9.8 8.9
Payments for acquisitions 0.0 0.0 0.0 0.0 61.4 0.0 0.0
Financial investments 0.0 -1.0 0.0 0.0 0.0 0.0 0.0
Income from asset disposals 0.0 0.0 5.4 0.0 0.0 0.0 0.0
Cash flow from investing activities 0.0 -3.7 1.1 -7.0 -75.2 -9.8 -8.9
Cash flow before financing 6.4 -4.8 2.5 -12.8 -62.4 21.6 30.5
Increase/decrease in debt position 0.0 0.0 0.3 0.0 82.1 0.0 0.0
Purchase of own shares 0.0 0.0 0.0 -6.0 0.0 0.0 0.0
Capital measures 0.0 -6.2 9.5 2.9 0.0 0.0 0.0
Dividends paid 0.0 0.0 0.0 0.0 0.0 0.0 0.0
Others 0.0 0.0 18.9 0.0 231.4 0.0 0.0
Effects of exchange rate changes on cash 0.0 0.0 0.0 0.0 0.0 0.0 0.0
Cash flow from financing activities 0.0 -6.2 28.7 8.9 313.5 0.0 0.0
Increase/decrease in liquid assets 6.4 -10.9 31.2 -3.9 251.1 21.6 30.5
Liquid assets at end of period 12.3 5.7 36.9 33.0 284.1 305.7 336.3
Source: Company data, Hauck & Aufhäuser

FinTech Group AG
32 Hauck & Aufhäuser Privatbankiers KGaA
Key ratios (EUR m) 2011 2012 2013 2014E 2015E 2016E 2017E
P&L growth analysis
Sales growth 53.1 % -34.4 % -8.2 % 52.1 % 370.7 % 19.6 % 20.8 %
EBITDA growth 109.5 % -87.0 % -125.5 % 1654.0 % -296.8 % 190.2 % 37.3 %
EBIT growth 131.1 % -99.0 % -1388.4 %
558.0 % -175.0 % 387.7 % 42.5 %
EPS growth 103.2 % -106.9 % 210.4 % 390.5 % -252.3 % 160.4 % 27.4 %
Efficiency
Total operating costs / sales 57.4 % 91.5 % 102.3 % 127.0 % 62.4 % 50.5 % 50.6 %
Sales per employee 448.1 266.2 170.1 413.8 375.3 489.0 671.3
EBITDA per employee 191.0 22.5 -4.0 -111.9 42.4 134.2 209.5
Balance sheet analysis
Avg. working capital / sales 5.2 % 7.4 % 10.1 % 10.8 % 3.4 % 3.4 % 2.8 %
Inventory turnover (sales/inventory) n/a n/a n/a n/a 78.7 78.7 78.7
Trade debtors in days of sales 32.2 41.1 50.6 50.6 10.7 9.0 7.4
A/P turnover [(A/P*365)/sales] n/a n/a n/a n/a 1.9 1.9 1.9
Cash conversion cycle (days) n/a n/a n/a n/a 26.4 24.7 23.1
Cash flow analysis
Free cash flow 6.4 -5.8 -2.9 -12.8 -1.0 21.6 30.5
Free cash flow/sales 26.8 % -37.1 % -20.0 % -58.7 % -1.0 % 17.7 % 20.7 %
FCF / net profit 110.3 % 1451.6 % 231.4 % 210.7 % -11.0 % 90.1 % 99.8 %
Capex / depn 0.0 % 304.4 % 566.5 % 543.1 % 222.7 % 132.2 % 100.7 %
Capex / maintenance capex 0.0 % 126.7 % 156.4 % 135.8 % 115.5 % 49.6 % 50.3 %
Capex / sales 0.0 % 24.1 % 29.8 % 32.0 % 13.5 % 8.0 % 6.0 %
Security
Net debt -19.7 -9.7 -20.0 -16.1 33.3 11.7 -18.8
Net Debt/EBITDA 0.0 0.0 0.0 0.0 2.9 0.3 0.0
Net debt / equity -1.0 -0.7 -0.7 -0.5 0.6 0.1 -0.2
Interest cover 999.0 999.0 0.0 0.0 2.8 13.8 19.1
Dividend payout ratio 0.0 % 0.0 % 0.0 % 0.0 % 0.0 % 0.0 % 0.0 %
Asset utilisation
Capital employed turnover 1.0 1.0 0.4 0.5 0.6 0.6 0.6
Operating assets turnover 11.1 6.7 4.6 4.3 8.2 7.6 7.2
Plant turnover 25.6 12.4 11.0 10.0 12.3 10.2 9.0
Inventory turnover (sales/inventory) n/a n/a n/a n/a 78.7 78.7 78.7
Returns
ROCE 65.3 % 0.4 % -4.0 % -18.2 % 4.9 % 13.8 % 17.2 %
ROE 30.0 % -2.9 % -4.0 % -18.1 % 15.7 % 29.1 % 27.0 %
Other
Interest paid / avg. debt n/a n/a 23.1 % 31.1 % 3.6 % 1.8 % 1.9 %
No. employees (average) 53 59 84 53 273 250 220
Number of shares 14.0 14.0 14.0 14.0 14.0 14.0 14.0
DPS 0.0 0.0 0.0 0.0 0.0 0.0 0.0
EPS reported 0.41 -0.03 -0.09 -0.43 0.66 1.72 2.19
Valuation ratios
P/BV 6.9 9.8 4.4 4.0 2.3 1.6 1.2
EV/sales 5.1 7.9 7.9 5.4 1.6 1.2 0.8
EV/EBITDA 11.9 93.7 -337.3 -19.9 14.4 4.3 2.5
EV/EBITA 11.9 93.7 -337.3 -19.9 14.4 4.3 2.5
EV/EBIT 13.6 1460.4 -103.9 -16.3 31.0 5.5 3.1
EV/FCF 18.8 -21.3 -39.5 -9.2 -164.0 6.7 3.7
Adjusted FCF yield 5.2 % -0.1 % -0.4 % -4.6 % 6.9 % 16.0 % 26.0 %
Dividend yield 0.0 % 0.0 % 0.0 % 0.0 % 0.0 % 0.0 % 0.0 %
Source: Company data, Hauck & Aufhäuser

FinTech Group AG
33 Hauck & Aufhäuser Privatbankiers KGaA
Disclosures regarding research publications of Hauck & Aufhäuser Privatbankiers KGaA pursuant to section 34b of the German Securities Trading Act (WpHG) and the regulations of the German Financial Analysis Ordinance (FinAnV)
Pursuant to section 34b of the German Securities Trading Act (WpHG) and section 5 of the Financial Analysis Ordinance (FinAnV) a research report has to point out possible conflicts of interest in connection with the analysed company. A conflict of interest is presumed to exist in particular if Hauck & Aufhäuser Privatbankiers KGaA
(1) or its affiliate(s) was, within the past twelve months, a member in a consortium that acquired the financial instruments of the analysed company,
(2) has entered into an agreement on the production of the research report with the analysed company,
(3) or its affiliate(s) has, within the past twelve months, been party to an agreement on the provision of investment banking services with the analysed company or have received services or a promise of services under the term of such an agreement,
(4) or its affiliate(s) holds 5% or more of the share capital of the analysed company,
(5) or its affiliate(s) regularly holds a trading position in shares of the analysed company or derivatives thereof,
(6) or its affiliate(s) manages the financial instruments of the analysed company on the basis of an existing contractual relationship,
(7) or the analyst has any other significant financial interests relating to the analysed company such as, for example, exercising mandates in the interest of the analysed company.
(8) The research report has been made available to the company prior to its publication. Thereafter, only factual changes have been made to the report.
Conflicts of interest that existed at the time when this research report was published:
Company Disclosure
FinTech Group AG 3, 5, 8
Historical target price and rating changes for FinTech Group AG in the last 12 months
Initiation coverage
01-December-14
Hauck & Aufhäuser distribution of ratings and in proportion to investment banking services
Buy 68.00 % 100.00 %
Sell 8.80 % 0.00 %
Hold 23.20 % 0.00 %

FinTech Group AG
34 Hauck & Aufhäuser Privatbankiers KGaA
1. General Information/Liabilities This research report has been produced for the information purposes of institutional investors only, and is not in any way a recommendation, offer or solicitation to buy or sell the financial instruments mentioned herein. The document is confidential and is made available by Hauck & Aufhäuser Privatbankiers KGaA, exclusively to selected recipients [in DE, GB, FR, CH, US, Scandinavia, and Benelux or, in individual cases, also in other countries]. A distribution to private investors in the sense of the German Securities Trading Act (WpHG) is excluded. It is not allowed to pass the research report on to persons other than the intended recipient without the permission of Hauck & Aufhäuser Privatbankiers KGaA. Reproduction of this document, in whole or in part, is not permitted without prior permission Hauck & Aufhäuser Privatbankiers KGaA. All rights reserved. Under no circumstances shall Hauck & Aufhäuser Privatbankiers KGaA , any of its employees involved in the preparation, have any liability for possible errors or incompleteness of the information included in this research report – neither in relation to indirect or direct nor consequential damages. Liability for damages arising either directly or as a consequence of the use of information, opinions and estimates is also excluded. Past performance of a financial instrument is not necessarily indicative of future performance. 2. Responsibilities This research report was prepared by the research analyst named on the front page (the ʺProducerʺ). The Producer is solely responsible for the views and estimates expressed in this report. The report has been prepared independently. The content of the research report was not influenced by the issuer of the analysed financial instrument at any time. It may be possible that parts of the research report were handed out to the issuer for information purposes prior to the publication without any major amendments being made thereafter. 3. Organisational Requirements Hauck & Aufhäuser Privatbankiers KGaA took internal organisational and regulative precautions to avoid or accordingly disclose possible conflicts of interest in connection with the preparation and distribution of the research report. All members of Hauck & Aufhäuser Privatbankiers KGaA involved in the preparation of the research report are subject to internal compliance regulations. No part of the Producer’s compensation is directly or indirectly related to the preparation of this financial analysis. 4. Information Concerning the Methods of Valuation/Update The determination of the fair value per share, i.e. the price target, and the resultant rating is done on the basis of the adjusted free cash flow (adj. FCF) method and on the basis of the discounted cash flow – DCF model. Furthermore, a peer group comparison is made. The adj. FCF method is based on the assumption that investors purchase assets only at a price (enterprise value) at which the operating cash flow return after taxes on this investment exceeds their opportunity costs in the form of a hurdle rate of 7.5%. The operating cash flow is calculated as EBITDA less maintenance capex and taxes. Within the framework of the DCF approach, the future free cash flows are calculated initially on the basis of a fictitious capital structure of 100% equity, i.e. interest and repayments on debt capital are not factored in initially. The adjustment towards the actual capital structure is done by discounting the calculated free cash flows with the weighted average cost of capital (WACC), which takes into account both the cost of equity capital and the cost of debt. After discounting, the calculated total enterprise value is reduced by the interest-bearing debt capital in order to arrive at the equity value. Hauck & Aufhäuser Privatbankiers KGaA uses the following three-step rating system for the analysed companies: Buy: Sustainable upside potential of more than 10% within 12 months Sell: Sustainable downside potential of more than 10% within 12 months. Hold: Upside/downside potential is limited. No immediate catalyst visible. NB: The ratings of Hauck & Aufhäuser Privatbankiers KGaA are not based on a performance that is expected to be “relative“ to the market. The decision on the choice of the financial instruments analysed in this document was solely made by Hauck & Aufhäuser Privatbankiers KGaA. The opinions and estimates in this research report are subject to change without notice. It is within the discretion of Hauck & Aufhäuser Privatbankiers KGaA whether and when it publishes an update to this research report. 5. Major Sources of Information Part of the information required for this research report was made available by the issuer of the financial instrument. Furthermore, this report is based on publicly available sources (such as, for example, Bloomberg, Reuters, VWD-Trader and the relevant daily press) believed to be reliable. Hauck & Aufhäuser Privatbankiers KGaA has checked the information for plausibility but not for accuracy or completeness. 6. Competent Supervisory Authority Hauck & Aufhäuser Privatbankiers KGaA are under supervision of the BaFin – German Federal Financial Supervisory Authority Bundesanstalt für Finanzdienstleistungsaufsicht), Graurheindorfer Straße 108, 53117 Bonn and Marie-Curie-Straße 24 – 28, 60439 Frankfurt a.M. 7. Specific Comments for Recipients Outside of Germany This research report is subject to the law of the Federal Republic of Germany. The distribution of this information to other states in particular to the USA, Canada, Australia and Japan may be restricted or prohibited by the laws applicable within this state. This document is only being distributed to and is only directed at (i) persons who are outside the United Kingdom or (ii) to investment professionals falling within Article 19(5) of the Financial Services and Markets Act 2000 (Financial Promotion) Order 2005 (the „Order“) or (iii) high net worth entities, and other persons to whom it may lawfully be communicated, falling within Article 49(2)(a) to (d) of the Order. This document shall not be made available - whether directly or indirectly - to another group of people in or from the United Kingdom.

FinTech Group AG
35 Hauck & Aufhäuser Privatbankiers KGaA
This page is left blank intentionally

FinTech Group AG
36 Hauck & Aufhäuser Privatbankiers KGaA
Contacts: Hauck&Aufhäuser Privatbankiers KGaA
Hauck & Aufhäuser Research
Hauck & Aufhäuser Privatbankiers KGaA Mittelweg 16/17 20148 Hamburg Germany
Tel.: +49 (0) 40 414 3885 - 70 Fax: +49 (0) 40 414 3885 - 71 Email: [email protected] www.ha-research.de
Sascha Berresch, CFA Head of Research Tel.: +49 (0)40 414 3885 - 85 E-Mail: [email protected]
Leonhard Bayer Analyst Tel.: +49 (0)40 414 3885 - 79 E-Mail: [email protected]
Henning Breiter Analyst Tel.: +49 (0)40 414 3885 - 73 E-Mail: [email protected]
Lars Dannenberg Analyst Tel.: +49 (0)40 414 3885 - 92 E-Mail: [email protected]
Nils-Peter Gehrmann Analyst Tel.: +49 (0)40 414 3885 - 86 E-Mail: [email protected]
Christian Glowa Analyst Tel.: +49 (0)40 414 3885 - 95 E-Mail: [email protected]
Philippe Lorrain Analyst Tel.: +49 (0)40 414 3885 - 83 E-Mail: [email protected]
Christian Schwenkenbecher Analyst Tel.: +49 (0)40 414 3885 - 76 E-Mail: [email protected]
Torben Teichler Analyst Tel.: +49 (0)40 414 3885 - 74 E-Mail: [email protected]
Tim Wunderlich, CFA Analyst Tel.: +49 (0)40 414 3885 - 81 E-Mail: [email protected]
Hauck & Aufhäuser Sales
Vincent Bischoff Sales Tel.: +49 (0)40 414 3885 - 88 E-Mail: [email protected]
James Bonsor, CFA Sales Tel.: +44 207 408 1100 E-Mail: [email protected]
Hamish Edsell, CFA Sales Tel.: +44 207 408 1100 E-Mail: [email protected]
Alexander Lachmann Sales Tel.: +49 (0)40 414 3885 - 96 E-Mail: [email protected]
Hugues Madelin Sales Tel.: +33 1 78 41 40 62 E-Mail: [email protected]
Markus Weiss Sales Tel.: +49 (0)40 414 3885 - 89 E-Mail: [email protected]
Toby Woods Sales Tel.: +44 207 408 1100 E-Mail: [email protected]
Hauck & Aufhäuser Sales Trading
Hauck & Aufhäuser Privatbankiers KGaA Mittelweg 16/17 20148 Hamburg Germany
Tel.: +49 (0) 40 414 3885 - 75 Fax: +49 (0) 40 414 3885 - 71 Email: [email protected] www.hauck-aufhaeuser.de
Mirko Brueggemann Trading Tel.: +49 (0)40 414 3885 75 E.Mail: [email protected]
Christian von Schuler Trading Tel.: +49 (0)40 414 3885 77 E.Mail: [email protected]
Carolin Weber Middle-Office Tel.: +49 (0)40 414 3885 87 E.Mail: [email protected]