fire estimate summary - residential building fire trends ... · residential building fire trends...
TRANSCRIPT

11,000
11,500
12,000
12,500
13,000
13,500
14,000
14,500
TrendFire Injuries
2015201420132012201120102009200820072006
Estim
ate
of In
juri
es
Year
Residential Building Fire Injuries
12,550
13,525
13,100
12,600
13,900
13,050
12,45012,075
11,475
13,275
6.0
6.5
7.0
7.5
8.0
8.5
9.0
2015201420132012201120102009200820072006
Estim
ate
of D
olla
r Lo
ss
($bi
llion
s)
Year
Residential Building Fire Dollar Loss Adjusted to 2015 Dollars
7.8
8.2
8.8
8.0
7.0
7.3
7.0 6.9
7.1
Fire Dollar LossTrend
7.2
National estimates for residential building fires and losses in 2015, the most recent year for which data are available, are:
ĵ Fires: 380,900. ĵ Deaths: 2,565. ĵ Injuries: 11,475. ĵ Dollar loss: $7,099,300,000.
Overall trends for residential building fires and losses for the 10-year period of 2006 to 2015 show:
ĵ A 2 percent decrease in fires. ĵ A 2 percent increase in deaths. ĵ A 9 percent decrease in injuries. ĵ An 18 percent decrease in dollar loss. (Note: This overall
constant dollar-loss trend takes inflation into account by adjusting each year’s dollar loss to its equivalent 2015 value.)
Fire Estimate Summary
Residential Building Fire Trends (2006-2015)
Fire Estimate Summaries present basic data on the size and status of the f ire problem in the United States as depicted through data reported to the U.S. Fire Administration’s (USFA’s) National Fire Incident Repor ting System. Each Fire Estimate Summar y addresses the size of the specific fire or fire-related issue and highlights important trends in the data. Note: Fire Estimate Summaries are based on the USFA’s “National Estimates Methodology for Building Fires and Losses” (http://www.usfa.fema.gov/downloads/pdf/statistics/national_estimate_methodology.pdf). The USFA is committed to providing the best and most current information on the U.S. fire problem and, as a result, continually examines its data and methodology. Because of this commitment, changes to data collection strategies and estimate methodologies occur, causing estimates to change slightly over time. Previous estimates on specific issues (or similar issues) may have been a result of different methodologies or data definitions used and may not be directly comparable to current estimates.
National Fire Data Center16825 S. Seton Ave.Emmitsburg, MD 21727www.usfa.fema.gov/data/statistics/
Residential Building Fire Trends | May 2017
340,000
350,000
360,000
370,000
380,000
390,000
400,000
TrendFires
2015201420132012201120102009200820072006
Estim
ate
of F
ires
Year
Residential Building Fires
392,700390,300
378,200
356,200362,100
364,500
374,000
380,300 379,500
380,900
2,2002,3002,4002,5002,6002,7002,8002,9003,0003,100
2015201420132012201120102009200820072006
Estim
ate
of D
eath
s
Year
Residential Building Fire Deaths
2,490
2,765
2,650
2,480
2,450
2,385
2,755 2,765
2,565
Fire DeathsTrend
2,555

Fire Estimate Summary
Residential Building Fire Causes (2006-2015)
Residential Building Fire Causes | May 2017
Fire Estimate Summaries present basic data on the size and status of the f ire problem in the United States as depicted through data reported to the U.S. Fire Administration’s (USFA’s) National Fire Incident Reporting System (NFIRS). Each Fire Estimate Summary addresses the size of the specific fire or fire-related issue and highlights important trends in the data. Note: Fire Estimate Summaries are based on the USFA’s “National Estimates Methodology for Building Fires and Losses” (http://www.usfa.fema.gov/downloads/pdf/statistics/national_estimate_methodology.pdf). The USFA is committed to providing the best and most current information on the U.S. fire problem and, as a result, continually examines its data and methodology. Because of this commitment, changes to data collection strategies and estimate methodologies occur, causing estimates to change slightly over time. Previous estimates on specific issues (or similar issues) may have been a result of different methodologies or data definitions used and may not be directly comparable to current estimates.
National estimates for the leading causes of fires in residential buildings for 2015, the most recent year for which data are available, are:1. Cooking: 193,400 fires.2. Heating: 41,200 fires.3. Electrical malfunction: 24,500 fires.4. Other unintentional, careless: 24,500 fires.
Overall trends in the leading fire causes for the 10-year period of 2006 to 2015 show:
ĵ Cooking as the leading cause of residential building fires for the 10-year period.
ĵ A 21 percent increase in residential cooking fires. (This is likely due to an NFIRS coding edit implemented in 2012.)
ĵ A 20 percent decrease in residential heating fires. ĵ A 26 percent decrease in residential electrical malfunction fires. ĵ An 8 percent decrease in residential other unintentional or
careless fires.
Leading Causes of Residential Building Fires (2006-2015)
Estim
ate
of F
ires
Year
0
50,000
100,000
150,000
200,000
250,000
Electrical Malfunction
Other Unintentional, Careless
Heating
Cooking
2015201420132012201120102009200820072006
National Fire Data Center16825 S. Seton Ave.Emmitsburg, MD 21727www.usfa.fema.gov/data/statistics/

Fire Estimate Summary
Residential Building Fire Death Causes (2006-2015)
Residential Building Fire Death Causes | May 2017
Fire Estimate Summaries present basic data on the size and status of the f ire problem in the United States as depicted through data reported to the U.S. Fire Administration’s (USFA’s) National Fire Incident Reporting System (NFIRS). Each Fire Estimate Summary addresses the size of the specific fire or fire-related issue and highlights important trends in the data. Note: Fire Estimate Summaries are based on the USFA’s “National Estimates Methodology for Building Fires and Losses” (http://www.usfa.fema.gov/downloads/pdf/statistics/national_estimate_methodology.pdf). The USFA is committed to providing the best and most current information on the U.S. fire problem and, as a result, continually examines its data and methodology. Because of this commitment, changes to data collection strategies and estimate methodologies occur, causing estimates to change slightly over time. Previous estimates on specific issues (or similar issues) may have been a result of different methodologies or data definitions used and may not be directly comparable to current estimates.
National estimates for the leading causes of residential building fire deaths for 2015, the most recent year for which data are available, are:1. Other unintentional, careless: 440 deaths.2. Cause under investigation: 365 deaths.3. Smoking: 320 deaths.
Overall trends in the leading fire death causes for the 10-year period of 2006 to 2015 show:
ĵ Other unintentional, careless was the leading cause of residential fire deaths in seven years out of the 10-year period, and there was a 13 percent increase in residential other unintentionally- or carelessly-set fire deaths.
ĵ A 69 percent increase in residential cause under investigation fire deaths.
ĵ Although smoking was the third leading cause of residential fire deaths in 2015, there was a 36 percent decrease in residential smoking fire deaths.
Leading Causes of Residential Building Fire Deaths (2006-2015)
Estim
ate
of D
eath
s
Year
0
100
200
300
400
500
600
Intentional
Electrical Malfunction
Smoking
Cause Under Investigation
Other Unintentional, Careless
2015201420132012201120102009200820072006
National Fire Data Center16825 S. Seton Ave.Emmitsburg, MD 21727www.usfa.fema.gov/data/statistics/

Fire Estimate Summary
Residential Building Fire Injury Causes (2006-2015)
Residential Building Fire Injury Causes | May 2017
Fire Estimate Summaries present basic data on the size and status of the f ire problem in the United States as depicted through data reported to the U.S. Fire Administration’s (USFA’s) National Fire Incident Reporting System (NFIRS). Each Fire Estimate Summary addresses the size of the specific fire or fire-related issue and highlights important trends in the data. Note: Fire Estimate Summaries are based on the USFA’s “National Estimates Methodology for Building Fires and Losses” (http://www.usfa.fema.gov/downloads/pdf/statistics/national_estimate_methodology.pdf). The USFA is committed to providing the best and most current information on the U.S. fire problem and, as a result, continually examines its data and methodology. Because of this commitment, changes to data collection strategies and estimate methodologies occur, causing estimates to change slightly over time. Previous estimates on specific issues (or similar issues) may have been a result of different methodologies or data definitions used and may not be directly comparable to current estimates.
National estimates for the leading causes of residential building fire injuries for 2015, the most recent year for which data are available, are:1. Cooking: 3,775 injuries.2. Other unintentional, careless: 1,350 injuries.3. Open flame: 975 injuries.
Overall trends in the leading fire injury causes for the 10-year period of 2006 to 2015 show:
ĵ Cooking as the leading cause of residential building fire injuries.
ĵ A 34 percent increase in residential cooking fire injuries. (This is likely due to an NFIRS coding edit implemented in 2012.)
ĵ A 24 percent decrease in residential other unintentionally- or carelessly-set fire injuries.
ĵ A 31 percent decrease in residential open flame fire injuries.
Leading Causes of Residential Building Fire Injuries (2006-2015)
Estim
ate
of In
juri
es
Year
0
500
1,000
1,500
2,000
2,500
3,000
3,500
4,000
4,500
Other Heat
Appliances
Electrical Malfunction
Open Flame
Other Unintentional, Careless
Cooking
2015201420132012201120102009200820072006
National Fire Data Center16825 S. Seton Ave.Emmitsburg, MD 21727www.usfa.fema.gov/data/statistics/

Fire Estimate Summary
Residential Building Fire Dollar-Loss Causes (2006-2015)
Residential Building Fire Dollar-Loss Causes | May 2017
Fire Estimate Summaries present basic data on the size and status of the f ire problem in the United States as depicted through data reported to the U.S. Fire Administration’s (USFA’s) National Fire Incident Reporting System (NFIRS). Each Fire Estimate Summary addresses the size of the specific fire or fire-related issue and highlights important trends in the data. Note: Fire Estimate Summaries are based on the USFA’s “National Estimates Methodology for Building Fires and Losses” (http://www.usfa.fema.gov/downloads/pdf/statistics/national_estimate_methodology.pdf). The USFA is committed to providing the best and most current information on the U.S. fire problem and, as a result, continually examines its data and methodology. Because of this commitment, changes to data collection strategies and estimate methodologies occur, causing estimates to change slightly over time. Previous estimates on specific issues (or similar issues) may have been a result of different methodologies or data definitions used and may not be directly comparable to current estimates.
National estimates for the leading causes of residential building fire dollar loss for 2015, the most recent year for which data are available, are:1. Other unintentional, careless: $1,243,500,000.2. Electrical malfunction: $949,200,000.
Overall trends in the leading causes of fire dollar loss for the 10-year period of 2006 to 2015 show:
ĵ A 4 percent increase in residential other unintentionally- or carelessly-set fire dollar loss.
ĵ A 31 percent decrease in residential electrical malfunction fire dollar loss.
ĵ A 2007 spike in dollar loss for exposure fires, which reflects residential building fire losses as reported to the NFIRS from the October 2007 California firestorms.
Note: The overall constant dollar-loss trends take inflation into account by adjusting each year’s dollar loss to its equivalent 2015 value.
Leading Causes of Residential Building Fire Dollar Loss (2006-2015)Adjusted to 2015 Dollars
Estim
ate
of D
olla
r Lo
ss ($
mill
ions
)
Year
0.0
200.0
400.0
600.0
800.0
1,000.0
1,200.0
1,400.0
1,600.0
1,800.0
2,000.0
Exposure
Open Flame
Other Heat
Electrical Malfunction
Other Unintentional, Careless
2015201420132012201120102009200820072006
National Fire Data Center16825 S. Seton Ave.Emmitsburg, MD 21727www.usfa.fema.gov/data/statistics/
Fire Estimate Summary
Residential Building Cooking Fire Trends (2006-2015)
Residential Building Cooking Fire Trends | May 2017
Fire Estimate Summaries present basic data on the size and status of the f ire problem in the United States as depicted through data reported to the U.S. Fire Administration’s (USFA’s) National Fire Incident Repor ting System. Each Fire Estimate Summar y addresses the size of the specific fire or fire-related issue and highlights important trends in the data. Note: Fire Estimate Summaries are based on the USFA’s “National Estimates Methodology for Building Fires and Losses” (http://www.usfa.fema.gov/downloads/pdf/statistics/national_estimate_methodology.pdf). The USFA is committed to providing the best and most current information on the U.S. fire problem and, as a result, continually examines its data and methodology. Because of this commitment, changes to data collection strategies and estimate methodologies occur, causing estimates to change slightly over time. Previous estimates on specific issues (or similar issues) may have been a result of different methodologies or data definitions used and may not be directly comparable to current estimates.
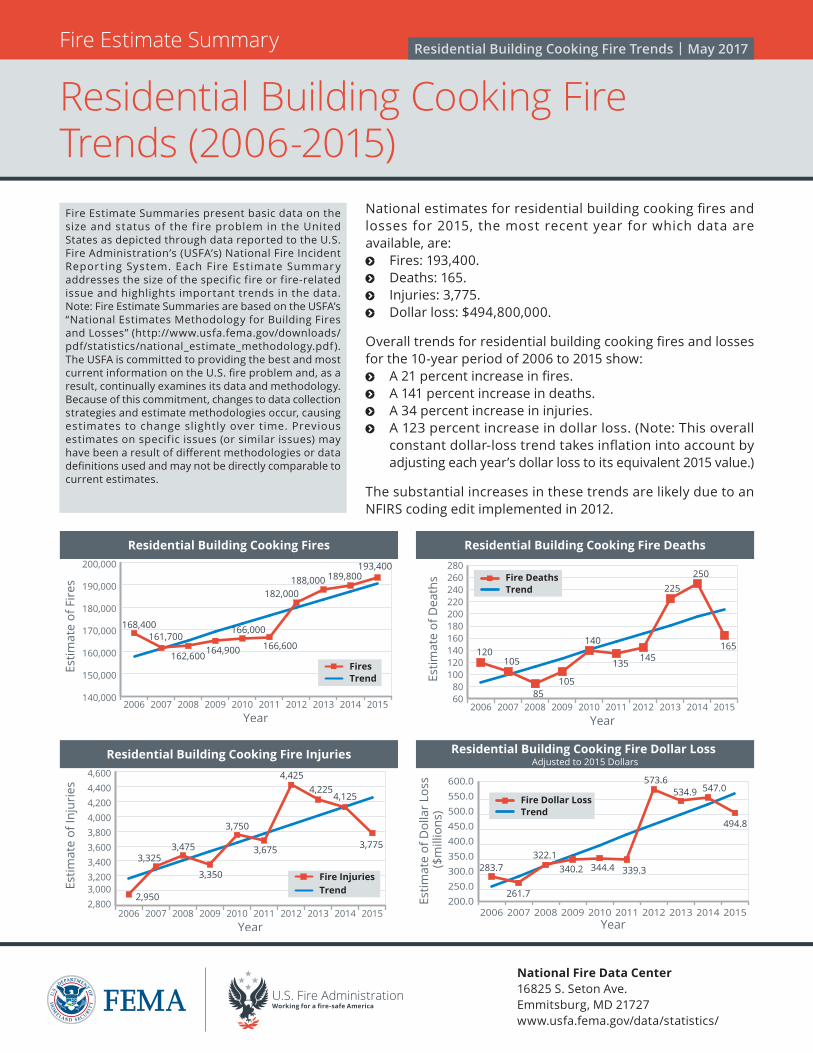
National estimates for residential building cooking fires and losses for 2015, the most recent year for which data are available, are:
ĵ Fires: 193,400. ĵ Deaths: 165. ĵ Injuries: 3,775. ĵ Dollar loss: $494,800,000.
Overall trends for residential building cooking fires and losses for the 10-year period of 2006 to 2015 show:
ĵ A 21 percent increase in fires. ĵ A 141 percent increase in deaths. ĵ A 34 percent increase in injuries. ĵ A 123 percent increase in dollar loss. (Note: This overall
constant dollar-loss trend takes inflation into account by adjusting each year’s dollar loss to its equivalent 2015 value.)
The substantial increases in these trends are likely due to an NFIRS coding edit implemented in 2012.
140,000
150,000
160,000
170,000
180,000
190,000
200,000
TrendFires
2015201420132012201120102009200820072006
Estim
ate
of F
ires
Year
Residential Building Cooking Fires
168,400161,700
162,600164,900
166,000
166,600
182,000188,000 189,800
193,400
6080
100120140160180200220240260280
2015201420132012201120102009200820072006
Estim
ate
of D
eath
s
Year
Residential Building Cooking Fire Deaths
120105
85105
135 145
225250
165
Fire DeathsTrend
140
2,8003,0003,2003,4003,6003,8004,0004,2004,4004,600
TrendFire Injuries
2015201420132012201120102009200820072006
Estim
ate
of In
juri
es
Year
Residential Building Cooking Fire Injuries
2,950
3,3253,475
3,350
3,675
4,4254,225
4,125
3,775
3,750
200.0250.0300.0350.0400.0450.0500.0550.0600.0
2015201420132012201120102009200820072006
Fire Dollar LossTrend
Estim
ate
of D
olla
r Lo
ss
($m
illio
ns)
Year
Residential Building Cooking Fire Dollar Loss Adjusted to 2015 Dollars
283.7
261.7
322.1340.2 339.3
573.6534.9 547.0
494.8
344.4
National Fire Data Center16825 S. Seton Ave.Emmitsburg, MD 21727www.usfa.fema.gov/data/statistics/

Fire Estimate Summary
Residential Building Other Unintentional, Careless Fire Trends (2006-2015)
Residential Building Other Unintentional, Careless Fire Trends | May 2017
Fire Estimate Summaries present basic data on the size and status of the f ire problem in the United States as depicted through data reported to the U.S. Fire Administration’s (USFA’s) National Fire Incident Repor ting System. Each Fire Estimate Summar y addresses the size of the specific fire or fire-related issue and highlights important trends in the data. Note: Fire Estimate Summaries are based on the USFA’s “National Estimates Methodology for Building Fires and Losses” (http://www.usfa.fema.gov/downloads/pdf/statistics/national_estimate_methodology.pdf). The USFA is committed to providing the best and most current information on the U.S. fire problem and, as a result, continually examines its data and methodology. Because of this commitment, changes to data collection strategies and estimate methodologies occur, causing estimates to change slightly over time. Previous estimates on specific issues (or similar issues) may have been a result of different methodologies or data definitions used and may not be directly comparable to current estimates.
National estimates for residential building other unintentional, careless fires and losses for 2015, the most recent year for which data are available, are:
ĵ Fires: 24,500. ĵ Deaths: 440. ĵ Injuries: 1,350. ĵ Dollar loss: $1,243,500,000.
Overall trends for residential building other unintentional, careless fires and losses for the 10-year period of 2006 to 2015 show:
ĵ An 8 percent decrease in fires. ĵ A 13 percent increase in deaths. ĵ A 24 percent decrease in injuries. ĵ A 4 percent increase in dollar loss. (Note: This overall constant
dollar-loss trend takes inflation into account by adjusting each year’s dollar loss to its equivalent 2015 value.)
20,000
21,000
22,000
23,000
24,000
25,000
26,000
27,000
TrendFires
2015201420132012201120102009200820072006
Estim
ate
of F
ires
Year
Residential Building Other Unintentional, Careless Fires
23,400
25,400
24,500
23,100
24,600
21,100
24,900
21,000
22,000
24,500
Residential Building Other Unintentional, Careless Fire Deaths
250
300
350
400
450
500
2015201420132012201120102009200820072006
Estim
ate
of D
eath
s
Year
365
380
430410
360
295
465450 440
Fire DeathsTrend
435
900
1,000
1,100
1,200
1,300
1,400
1,500
1,600
1,700
TrendFire Injuries
2015201420132012201120102009200820072006
Estim
ate
of In
juri
es
Year
Residential Building Other Unintentional, Careless Fire Injuries
1,350
1,5001,550 1,525
1,625
1,050 1,075 1,075
1,350
1,525
0.70.80.91.01.11.21.31.41.5
2015201420132012201120102009200820072006
Fire Dollar LossTrend
Estim
ate
of D
olla
r Lo
ss
($bi
llion
s)
Year
Residential Building Other Unintentional, CarelessFire Dollar Loss
Adjusted to 2015 Dollars
1.11.0
1.2
1.4
1.1
1.2
1.1 1.1
1.21.2
National Fire Data Center16825 S. Seton Ave.Emmitsburg, MD 21727www.usfa.fema.gov/data/statistics/

Fire Estimate Summary
Residential Building Smoking Fire Trends (2006-2015)
Residential Building Smoking Fire Trends | May 2017
Fire Estimate Summaries present basic data on the size and status of the f ire problem in the United States as depicted through data reported to the U.S. Fire Administration’s (USFA’s) National Fire Incident Repor ting System. Each Fire Estimate Summar y addresses the size of the specific fire or fire-related issue and highlights important trends in the data. Note: Fire Estimate Summaries are based on the USFA’s “National Estimates Methodology for Building Fires and Losses” (http://www.usfa.fema.gov/downloads/pdf/statistics/national_estimate_methodology.pdf). The USFA is committed to providing the best and most current information on the U.S. fire problem and, as a result, continually examines its data and methodology. Because of this commitment, changes to data collection strategies and estimate methodologies occur, causing estimates to change slightly over time. Previous estimates on specific issues (or similar issues) may have been a result of different methodologies or data definitions used and may not be directly comparable to current estimates.
National estimates for residential building smoking fires and losses for 2015, the most recent year for which data are available, are:
ĵ Fires: 8,000. ĵ Deaths: 320. ĵ Injuries: 675. ĵ Dollar loss: $255,800,000.
Overall trends for residential building smoking fires and losses for the 10-year period of 2006 to 2015 show:
ĵ An 11 percent decrease in fires. ĵ A 36 percent decrease in deaths. ĵ A 31 percent decrease in injuries. ĵ A 30 percent decrease in dollar loss. (Note: This overall
constant dollar-loss trend takes inflation into account by adjusting each year’s dollar loss to its equivalent 2015 value.)
5,000
6,000
7,000
8,000
9,000
10,000
11,000
TrendFires
2015201420132012201120102009200820072006
Estim
ate
of F
ires
Year
Residential Building Smoking Fires
9,700
8,900
8,300
7,0007,600 7,800
9,600
8,0007,600
8,000
250
300
350
400
450
500
550
2015201420132012201120102009200820072006
Estim
ate
of D
eath
s
Year
Residential Building Smoking Fire Deaths
485470
390360
305330
320 325 320
Fire DeathsTrend
350
650700750800850900950
1,0001,0501,1001,1501,200
TrendFire Injuries
2015201420132012201120102009200820072006
Estim
ate
of In
juri
es
Year
Residential Building Smoking Fire Injuries1,150
950 950900
1,050
800
850
775
675
950
200.0
225.0250.0275.0300.0325.0350.0375.0400.0
2015201420132012201120102009200820072006
Fire Dollar LossTrend
Estim
ate
of D
olla
r Lo
ss
($m
illio
ns)
Year
Residential Building Smoking Fire Dollar Loss Adjusted to 2015 Dollars
379.6
302.5
363.8387.5
312.4
359.3
290.2
230.2255.8
311.0
National Fire Data Center16825 S. Seton Ave.Emmitsburg, MD 21727www.usfa.fema.gov/data/statistics/

Fire Estimate Summary
Residential Building Electrical Malfunction Fire Trends (2006-2015)
Residential Building Electrical Malfunction Fire Trends | May 2017
Fire Estimate Summaries present basic data on the size and status of the f ire problem in the United States as depicted through data reported to the U.S. Fire Administration’s (USFA’s) National Fire Incident Repor ting System. Each Fire Estimate Summar y addresses the size of the specific fire or fire-related issue and highlights important trends in the data. Note: Fire Estimate Summaries are based on the USFA’s “National Estimates Methodology for Building Fires and Losses” (http://www.usfa.fema.gov/downloads/pdf/statistics/national_estimate_methodology.pdf). The USFA is committed to providing the best and most current information on the U.S. fire problem and, as a result, continually examines its data and methodology. Because of this commitment, changes to data collection strategies and estimate methodologies occur, causing estimates to change slightly over time. Previous estimates on specific issues (or similar issues) may have been a result of different methodologies or data definitions used and may not be directly comparable to current estimates.
National estimates for residential building electrical malfunction fires and losses for 2015, the most recent year for which data are available, are:
ĵ Fires: 24,500. ĵ Deaths: 290. ĵ Injuries: 850. ĵ Dollar loss: $949,200,000.
Overall trends for residential building electrical malfunction fires and losses for the 10-year period of 2006 to 2015 show:
ĵ A 26 percent decrease in fires. ĵ A 4 percent decrease in deaths. ĵ A 22 percent decrease in injuries. ĵ A 31 percent decrease in dollar loss. (Note: This overall
constant dollar-loss trend takes inflation into account by adjusting each year’s dollar loss to its equivalent 2015 value.)
15,000
20,000
25,000
30,000
35,000
TrendFires
2015201420132012201120102009200820072006
Estim
ate
of F
ires
Year
Residential Building Electrical Malfunction Fires
30,000 30,60029,100
24,70026,100
26,800
20,200
23,100
23,900 24,500
100
200
300
400
500
2015201420132012201120102009200820072006
Estim
ate
of D
eath
s
Year
Residential Building Electrical Malfunction Fire Deaths
290 295
380
280 280
210
335 325
290
Fire DeathsTrend
280
800
900
1,000
1,100
1,200
1,300
TrendFire Injuries
2015201420132012201120102009200820072006
Estim
ate
of In
juri
es
Year
Residential Building Electrical Malfunction Fire Injuries
1,000
1,175
1,075
1,1501,200
900875
925
850
1,050
0.6
0.8
1.0
1.2
1.4
1.6
2015201420132012201120102009200820072006
Fire Dollar LossTrend
Estim
ate
of D
olla
r Lo
ss
($bi
llion
s)
Year
Residential Building Electrical MalfunctionFire Dollar Loss
Adjusted to 2015 Dollars
1.2 1.2
1.3 1.3
1.1
0.80.9 0.9 0.9
1.1
National Fire Data Center16825 S. Seton Ave.Emmitsburg, MD 21727www.usfa.fema.gov/data/statistics/

Fire Estimate Summary
Residential Building Heating Fire Trends (2006-2015)
Residential Building Heating Fire Trends | May 2017
Fire Estimate Summaries present basic data on the size and status of the f ire problem in the United States as depicted through data reported to the U.S. Fire Administration’s (USFA’s) National Fire Incident Repor ting System. Each Fire Estimate Summar y addresses the size of the specific fire or fire-related issue and highlights important trends in the data. Note: Fire Estimate Summaries are based on the USFA’s “National Estimates Methodology for Building Fires and Losses” (http://www.usfa.fema.gov/downloads/pdf/statistics/national_estimate_methodology.pdf). The USFA is committed to providing the best and most current information on the U.S. fire problem and, as a result, continually examines its data and methodology. Because of this commitment, changes to data collection strategies and estimate methodologies occur, causing estimates to change slightly over time. Previous estimates on specific issues (or similar issues) may have been a result of different methodologies or data definitions used and may not be directly comparable to current estimates.
National estimates for residential building heating fires and losses for 2015, the most recent year for which data are available, are:
ĵ Fires: 41,200. ĵ Deaths: 165. ĵ Injuries: 575. ĵ Dollar loss: $392,300,000.
Overall trends for residential building heating fires and losses for the 10-year period of 2006 to 2015 show:
ĵ A 20 percent decrease in fires. ĵ A 27 percent increase in deaths. In 2014, there were 11
reported multifatality heating fires that contributed to the spike in fire deaths.
ĵ A 22 percent increase in injuries. ĵ A 60 percent increase in dollar loss. (Note: This overall
constant dollar-loss trend takes inflation into account by adjusting each year’s dollar loss to its equivalent 2015 value.)
37,50040,00042,50045,00047,50050,00052,50055,00057,50060,000
TrendFires
2015201420132012201120102009200820072006
Estim
ate
of F
ires
Year
Residential Building Heating Fires
53,600
54,40053,300
50,200
46,800
43,70045,200
49,00047,600
41,200
100
125
150
175
200
225
250
275
2015201420132012201120102009200820072006
Estim
ate
of D
eath
s
Year
Residential Building Heating Fire Deaths
175 175
145160
130
195 200
245
165
Fire DeathsTrend
145
450500550600650700750800850900
TrendFire Injuries
2015201420132012201120102009200820072006
Estim
ate
of In
juri
es
Year
Residential Building Heating Fire Injuries
575
700
550600
550
775
725
850
575575
200.0250.0300.0350.0400.0450.0500.0550.0600.0650.0
2015201420132012201120102009200820072006
Estim
ate
of D
olla
r Lo
ss
($m
illio
ns)
Year
Residential Building Heating Fire Dollar Loss Adjusted to 2015 Dollars
368.6
296.3
375.1
332.9298.5
434.8
521.7
604.9
392.3
Fire Dollar LossTrend
353.9
National Fire Data Center16825 S. Seton Ave.Emmitsburg, MD 21727www.usfa.fema.gov/data/statistics/

Fire Estimate Summary
Residential Building Cause Under Investigation Fire Trends (2006-2015)
Residential Building Cause Under Investigation Fire Trends | May 2017
Fire Estimate Summaries present basic data on the size and status of the f ire problem in the United States as depicted through data reported to the U.S. Fire Administration’s (USFA’s) National Fire Incident Repor ting System. Each Fire Estimate Summar y addresses the size of the specific fire or fire-related issue and highlights important trends in the data. Note: Fire Estimate Summaries are based on the USFA’s “National Estimates Methodology for Building Fires and Losses” (http://www.usfa.fema.gov/downloads/pdf/statistics/national_estimate_methodology.pdf). The USFA is committed to providing the best and most current information on the U.S. fire problem and, as a result, continually examines its data and methodology. Because of this commitment, changes to data collection strategies and estimate methodologies occur, causing estimates to change slightly over time. Previous estimates on specific issues (or similar issues) may have been a result of different methodologies or data definitions used and may not be directly comparable to current estimates.
National estimates for residential building cause under investigation fires and losses for 2015, the most recent year for which data are available, are:
ĵ Fires: 4,800. ĵ Deaths: 365. ĵ Injuries: 475. ĵ Dollar loss: $392,600,000.
Overall trends for reported residential building cause under investigation fires and losses for the 10-year period of 2006 to 2015 show:
ĵ A 39 percent increase in fires. ĵ A 69 percent increase in deaths. ĵ A 14 percent increase in injuries. ĵ A 16 percent increase in dollar loss. (Note: This overall
constant dollar-loss trend takes inflation into account by adjusting each year’s dollar loss to its equivalent 2015 value.)
3,0003,2003,4003,6003,8004,0004,2004,4004,6004,8005,000
TrendFires
2015201420132012201120102009200820072006
Estim
ate
of F
ires
Year
Residential Building Cause Under Investigation Fires
3,300
3,800 3,800
3,400
3,7003,800
4,400
4,300
4,500
4,800
Residential Building Cause Under InvestigationFire Deaths
100125150175200225250275300325350375400
2015201420132012201120102009200820072006
Estim
ate
of D
eath
s
Year
165
240265
240
350
285 275305
365Fire DeathsTrend
230
300
350
400
450
500
550
TrendFire Injuries
2015201420132012201120102009200820072006
Estim
ate
of In
juri
es
Year
Residential Building Cause Under Investigation Fire Injuries
375
425
375
450
425
500
450
375
475475
200.0
250.0
300.0
350.0
400.0
450.0
500.0
2015201420132012201120102009200820072006
Fire Dollar LossTrend
Estim
ate
of D
olla
r Lo
ss
($m
illio
ns)
Year
Residential Building Cause Under InvestigationFire Dollar Loss
Adjusted to 2015 Dollars
354.2
312.6349.1
415.6382.9
376.4
444.3
360.3392.6
372.4
National Fire Data Center16825 S. Seton Ave.Emmitsburg, MD 21727www.usfa.fema.gov/data/statistics/