fire research report - fireandemergency.nz · crf research report impact on life safety of the type...
TRANSCRIPT

Fire Research
Report
Impact on Life Safety of the Type 5 Alarm
Connell Mott MacDonald
April 2003
The June 2001 revision of the New Zealand Building Code ‘Approved Document C/AS1’ for fire safety (BIA 2001) introduced a new type of fire safety precaution (FSP). Termed a Type 5 alarm, this is applicable within accommodation and multi-unit residential buildings. Essentially, the Type 5 alarm allows localised warning and non-brigade connected alarms in guest suites. This is a departure from previous practice and increases the fire risk to occupants. The benefits are the reduction in unnecessary Fire Service call-out and the reduction in unnecessary total building evacuation. Qualitative arguments supported the new Type 5 alarm. This research develops a quantitative methodology to measure the increased risk. It concludes, that given the ability to measure the risk, decisions such as the introduction of the Type 5 alarm, which lower safety, should be supported by a formal and quantitative risk analysis.
New Zealand Fire Service Commission Research Report Number 40 ISBN Number 1-877349-03-8 © Copyright New Zealand Fire Service Commission

Connell Wagner Limited Level 4, Torrens House 195 Hereford Street Christchurch New Zealand Telephone: +64 3 366 0821 Facsimile: +64 3 379 6955 Email: [email protected] www.conmottmac.com
CRF RESEARCH REPORT Impact on Life Safety of the Type 5 Alarm For the NZ Fire Service Commission 30 May 2003 Reference 21494 35 MF Revision 6 Tony Enright, PhD Senior Fire Engineer

Document Control
Document ID: F:\PROJECTS\21494\35\docs\5. Design\RepSpec F01-6.doc
Rev No Date Revision Details Typist Author Verifier Approver
0 27.06.02 Draft – for Milestone 1 PAE PAE -- --
1 30.08.02 Draft – for Milestone 2 PAE PAE GHJ --
2 30.11.02 Draft – for Milestone 3 PAE PAE -- --
3 31.01.03 Draft – for Milestone 4 PAE PAE -- --
4 31.03.03 Draft – final report for verification PAE PAE GHJ --
5 30.04.03 Final report PAE PAE GHJ GKW
6 30.05.03 Final report including executive summary PAE PAE GHJ GKW
A person using Connell Wagner documents or data accepts the risk of: a) Using the documents or data in electronic form without requesting and checking them for accuracy against the original hard copy
version; and b) Using the documents or data for any purpose not agreed to in writing by Connell Wagner.

Disclaimer This report is scoped in accordance with instructions given by or on behalf of, the New Zealand Fire Service Commission. This report may not address issues which would need to be addressed with a third party if that party’s particular circumstances, requirements and experience with such reports were known. This report may make assumptions about matters of which a third party is not aware. It reflects Connell Wagner’s best judgement in the light of limited information available to it during preparation. Connell Wagner therefore does not assume any legal liability or responsibility in respect of the use this report by a third party, and the use of this report by a third party is at the risk of that party. Without limitation, in the event of any liability to a third party, Connell Wagner’s liability whether jointly or severally or otherwise rising out of the performance or non-performance of Connell Wagner’s services and this report, whether under the law of contract, tort or otherwise, shall be limited to $1,000 (one thousand dollars). This report is also based on information published in the public domain by third parties. This report is provided strictly on the basis that this information is assumed to be accurate, complete and adequate.

Impact on Life Safety of the Type 5 Alarm New Zealand Fire Service Commission CRF Research Report
Tab Section
AbstraExecuDefiniCHAP
11111
CHAP2222222222
CHAP33333
CHAP444444
CHAP55
CHAPNotatiRefereAppen
E
C:\WEB_C
le of Contents
Pagect 1 tive summary 2 tions 3 TER 1: Introduction 6 .1 Preamble 6 .2 Motivation for research 6 .3 Risk management 6 .4 The Type 5 alarm 7 .5 Event tree analysis 8
TER 2: Probabilities 10 .1 Fire incidence 10 .2 Fire location (guest room / suite) 13 .3 Fire growth beyond incipient stage 14 .4 Occupant awake 15 .5 Manual suppression 16 .6 Automatic suppression 16 .7 Automatic alarm 17 .8 Alarm direct to all occupants 18 .9 Fire spread: confined to room and spread beyond room 18 .10 Summary of event tree probabilities 19
TER 3: Consequences 20 .1 Outcome scenarios (consequences) 20 .2 General equation 20 .3 Case study 21 .4 Outcome scenario variables 22 .5 Specific equations 26
TER 4: Risk analysis 27 .1 Calculation of risk 27 .2 Pre-calibration results 27 .3 Model validation 29 .4 Model sensitivity 29 .5 Model calibration 30 .6 Post-calibration results 30
TER 5: Risk assessment 32 .1 Risk evaluation & risk assessment 32 .2 Individual versus societal risk 32
TER 6: Conclusions 33 on 34 nces 35 dix A 37 vent trees (post-calibration) 37
ONVERSION_ETC\CONVERSION FOLDER\CONTESTIBLE FUND\NEW\300603_IMPACT ON LIFE SAFETY OF THE TYPE 5 ALARM.DOC⏐ 30 MAY 2003 ⏐ REVISION 6 ⏐ PAGE I

Impact on Life Safety of the Type 5 Alarm New Zealand Fire Service Commission CRF Research Report
Appendix B 42 Results, pre-calibration 42
Appendix C 47 Results, post-calibration 47
C:\WEB_CONVERSION_ETC\CONVERSION FOLDER\CONTESTIBLE FUND\NEW\300603_IMPACT ON LIFE SAFETY OF THE TYPE 5 ALARM.DOC⏐ 30 MAY 2003 ⏐ REVISION 6 ⏐ PAGE II

Impact on Life Safety of the Type 5 Alarm New Zealand Fire Service Commission CRF Research Report
The June 2001 revision of the New Zealand Building Code ‘Approved Document C/AS1’ for fire safety (BIA 2001) introduced a new type of fire safety precaution (FSP). Termed a Type 5 alarm, this is applicable within accommodation and multi-unit residential buildings. Essentially, the Type 5 alarm allows localised warning and non-brigade connected alarms in guest suites. This is a departure from previous practice and increases the fire risk to occupants. The benefits are the reduction in unnecessary Fire Service call-out and the reduction in unnecessary total building evacuation. Qualitative arguments supported the new Type 5 alarm. This research develops a quantitative methodology to measure the increased risk. It concludes, that given the ability to measure the risk, decisions such as the introduction of the Type 5 alarm, which lower safety, should be supported by a formal and quantitative risk analysis.
Abstract
C:\WEB_CONVERSION_ETC\CONVERSION FOLDER\CONTESTIBLE FUND\NEW\300603_IMPACT ON LIFE SAFETY OF THE TYPE 5 ALARM.DOC⏐ 30 MAY 2003 ⏐ REVISION 6 ⏐ PAGE 1

Impact on Life Safety of the Type 5 Alarm New Zealand Fire Service Commission CRF Research Report
Introduction Type 5 alarm
The June 2001 revision of the New Zealand Building Code ‘Approved Document C/AS1’ for fire safety (BIA 2001) introduced a new type of fire safety precaution. Termed a Type 5 alarm, this is applicable within accommodation and multi-unit residential buildings. Essentially, the Type 5 alarm allows localised warning and non-brigade connected alarms in guest suites. This is a departure from previous practice and increases the fire risk to occupants. The benefits are the reduction in unnecessary Fire Service call-out and the reduction in unnecessary building evacuation.
Motivation for research Decision making tool
Qualitative arguments supported the new Type 5 alarm. This research demonstrates that a quantitative approach is available to assist in such decision making. This project contributes to a key research priority identified by the New Zealand Fire Service Commission: the cost-benefit study to support legislative change to improve fire safety.
Methodology Event tree analysis
The methodology is based on an event tree analysis. Four event trees are developed that can be applied to most accommodation buildings with a Type 5 alarm. These event trees are paired; the Type 4 and 4e, (“e” denotes the Type 5 variation) and the Type 7 and 7e systems. Non-safe outcomes on each event tree are characterised by generic models comprising of limit state equations of escape time margin. The event trees and limit state equations are populated with probability distributions. The former gained from NZ fire incident statistics and the latter based on Swedish research. A fictitious but exemplar case study is then developed to provide a magnitude for the consequences. The analysis is run using Monte Carlo simulation for each event tree. The Type 4 risk profile is calibrated and the complete analysis model re-run. The measure of risk for the complimentary event trees are compared to quantify the increase in life safety. Because the fire origin is assumed in a guest room, which is the point of differentiation of the Type 5, the risk measures are not complete for the whole building but only the subset that will affect a Type 5.
Results
The case study results in the following mean individual fire risks (to life): • 9.8 x 10⁻⁶ (Type 4) and 12.0 x 10⁻⁶ (Type 4e), increase 2.2 x 10⁻⁶ • 1.3 x 10⁻⁷ (Type 7) and 1.5 x 10⁻⁷ (Type 7e), increase 0.2 x 10⁻⁷
Conclusions
This research does not comment on the magnitude of the increased risk, as risk evaluation is the domain of the policy maker. However, this research does conclude, that given the ability to measure the risk, decisions such as the introduction of the Type 5 alarm which lower safety, should be supported by a formal and quantitative risk analysis. This research also concludes, that even allowing for sprinkler failure, the risk to life in sprinkler-protected buildings is typically two magnitudes of order better than in non-sprinklered buildings. Therefore, future research using multiple case studies may give consideration to the cost-benefit of fire safety systems incorporating fire sprinklers without the necessity of smoke alarm systems in corridors, assuming that alarms are required in guest rooms to detect smouldering fires. Future research may also incorporate a sub-model for fire barrier failure as a function of time, to allow for meaningful societal risk calculations.
Executive summary
C:\WEB_CONVERSION_ETC\CONVERSION FOLDER\CONTESTIBLE FUND\NEW\300603_IMPACT ON LIFE SAFETY OF THE TYPE 5 ALARM.DOC⏐ 30 MAY 2003 ⏐ REVISION 6 ⏐ PAGE 2

Impact on Life Safety of the Type 5 Alarm New Zealand Fire Service Commission CRF Research Report
Consequence outcome of an event. Note: There may be one or more consequences, expressed positively or negatively, quantitatively or qualitatively. (ISO/PDTS 16732)
Definitions
Consequence model a term used in this research to describe the limit state equation for escape time margin associated with the event tree path synonymous with outcome scenario. Event tree a depiction of temporal, causal sequences of events, built around a single initiating condition. Note: A fire scenario in an event tree is given by a time-sequence path from the initiating condition through a succession of intervening events to an end-event (ISO/PDTS 16732). In this research the end event is termed the outcome scenario. Event tree analysis a technique which describes the possible range and sequence of the outcomes which may arise from an initiating event. (AS/NZS 4360:1999) Expected loss of life (ELL) a term used in this research to describe the probability of loss of life for a given outcome scenario. Fire hazard potential for injury and/or damage from fire (from ISO 13943:2000, Fire safety – vocabulary). Note: In the context of fire risk assessment, “fire hazard” may be understood either as a measure of consequence, using the term “potential” in a quantitative sense, or as a physical object or condition with the potential to affect the probability or consequences of certain fire scenarios (ISO/PDTS 16732). Fire risk (a) When defined as risk of an event or scenario, the combination of the probability of that event or scenario and its consequence. (b) When defined as risk of a design, the combination of the probabilities and consequences of all events or scenarios associated with the design. Note 1: The general mathematical formulation of a combination of the probabilities and consequences of all scenarios associated with a design is: Risk = ∑ f (probability, consequence of a given scenario), for all scenarios (from ISO/TR 13387-1:1999, Fire safety engineering). The two most frequently used specific mathematical formulations are: Risk = ∑ (probability x consequence of a given scenario), for all scenarios (from ISO/TR 13387:1999, Fire safety engineering; and ISO 13943: 2000, Fire safety – vocabulary). Risk = ∑ (probability of a given scenario), for all scenarios where the consequences exceed the specified safety threshold (from ISO/TR 13387:1999, Fire safety engineering). Note 2: “Fire risk” requires a scenario structure and an explicit decision on the treatment of every scenario. If calculations are performed on only a small number of scenarios, then either all other scenarios must be shown to be represented by the ones analysed, or the ones not represented must be shown to be excluded from the definition of risk being used (e.g., risk against fires with a single point of origin, as a definition that would explicitly exclude fires that are started at several different points). Note 3: Fire risk does not require explicit observation or mathematical calculation but can be done, in whole or in part, non-quantitatively and/or through the use of subjective estimates (e.g., engineering judgement).
C:\WEB_CONVERSION_ETC\CONVERSION FOLDER\CONTESTIBLE FUND\NEW\300603_IMPACT ON LIFE SAFETY OF THE TYPE 5 ALARM.DOC⏐ 30 MAY 2003 ⏐ REVISION 6 ⏐ PAGE 3

Impact on Life Safety of the Type 5 Alarm New Zealand Fire Service Commission CRF Research Report
Note 4: The choice of the function linking probability and consequence can be used to capture risk aversion. For example, if the consequence value is raised to a power greater than one before being multiplied by probability, this will quantify the common belief that a fixed value outcome is less preferred as the expected value of a risky situation than as the certain outcome of a risk-free situation. (ISO/PDTS 16732) Limit state a state beyond which the structure no longer satisfies the design performance requirements (from ISO 2394:1998, General principles on reliability for structures). Note: In the context of fire risk assessment, a “limit state” defines a threshold or limiting value on a consequence severity scale, usually in the context of a time-sequence state description of the fire scenario. This means the structure can return to a state that does not exceed the limit state. The “limit state” concept can be applied to designed objects other than structures. (ISO/PDTS 16732) Monte Carlo a process of sampling from the universe of fire scenarios and other system conditions, in order to produce a manageable calculation burden when closed-form analysis is not possible. Note: “Monte Carlo” simulation is not a type of probabilistic model but is rather a numerical calculation procedure for sampling-based analysis using a probabilistic model. The use of Monte Carlo methods does not eliminate the need to define and justify the relevant probability distribution functions and does not provide a rationale for the default usage of any simple standard distributions (e.g., uniform, normal). Outcome scenario a term used in this research to describe the limit state equation for escape time margin associated with the event tree path and synonymous with consequence model. Positive alarm sequence An automatic sequence that results in an alarm signal, even when manually delayed for investigation (NFPA 72:2002 ‘National Fire Alarm Code’) – similar to some Type 5 alarm applications where monitored staffing stations have time delays. Reliability probability that a unit will perform a required function for given conditions and for a given period of time (from ISO 921: 1997, Nuclear energy – vocabulary). Note: Reliability applies to the performance of any building or product design feature whose performance can influence the course of fire development, thereby contributing to the specification of the fire scenario that occurs and the risk consequences associated with that scenario. It is also possible that the design feature performance is better described by a range of partial successes or partial failures. This requires a more general and flexible definition than the one given above. (ISO/PDTS 16732) Risk (see also fire risk) the chance of something happening that will have an impact upon objectives. It is measured in terms of consequences and likelihood. (AS/NZS 4360:1999) Risk analysis a systematic use of available information to determine how often specified events may occur and the magnitude of their consequences. (AS/NZS 4360:1999) Risk assessment the overall process of risk analysis and risk evaluation. (AS/NZS 4360:1999) Risk evaluation the process used to determine risk management priorities by comparing the level of risk against predetermined standards, target risk levels or other criteria. (AS/NZS 4360:1999) Risk, individual a measure of fire risk limited to consequences experienced by a particular individual or entity. Note: For example, if the fire risk measure is probability of an unwanted consequence, such as death, then individual risk would be an estimate, typically expressed as events per unit time, of the probability of that unwanted consequence for a specific individual. The risk measure may be expressed as conditional on exposure to the hazard, such as being at a hazardous location. Individual risk is independent of the number of persons affected. Contrast with “risk, societal.” (ISO/PDTS 16732)
C:\WEB_CONVERSION_ETC\CONVERSION FOLDER\CONTESTIBLE FUND\NEW\300603_IMPACT ON LIFE SAFETY OF THE TYPE 5 ALARM.DOC⏐ 30 MAY 2003 ⏐ REVISION 6 ⏐ PAGE 4

Impact on Life Safety of the Type 5 Alarm New Zealand Fire Service Commission CRF Research Report
Risk, tolerable In the risk evaluation phase of a risk assessment, risks that satisfy defined tolerability criteria and so do not form a basis for required change to a design proposal. (ISO/PDTS 16732) Risk, societal a measure of fire risk combining consequences experienced by every affected person and group. Note 1: Combining consequences to all affected parties will also affect the overall probability of an incident. It will equal the sum of the individual risks of all affected individuals but can be expressed as a rate relative to the number of affected or exposed people, in which case it will be in a form directly comparable to the component individual risk measures. (ISO/PDTS 16732) Sensitivity a measure of the degree to which a small perturbation of a system will create a large change in system status. Note: In a fire risk assessment, analysis of “sensitivity” of the calculation to small variations in each of the variables, parameters, and relationships provides information useful in setting priorities for a subsequent analysis of “uncertainty,” by focusing attention on those variations most likely to change the conclusion of the analysis. (ISO/PDTS 16732) Theoretical annual loss of life (TALL) a term used in this research as the sum of ELL across all scenarios and assuming 100% building occupancy rate. Type 4 Alarm an automatic fire alarm system with smoke detectors and manual call points. (BIA 2001) Type 4e Alarm an automatic fire alarm system with smoke detectors and manual call points. A Type 5 Alarm is permitted as an alternative alarm system within firecells containing sleeping accommodation. (BIA 2001) Type 5 Alarm an automatic fire alarm system with modified smoke/heat detection and manual call points. A variation of the Type 4 and Type 7 Alarm systems permitting part of the smoke detection component to comprise only a local alarm. (BIA 2001) Type 7 Alarm an automatic fire sprinkler system with smoke detectors and manual call points. (BIA 2001) Type 7e Alarm an automatic fire sprinkler system with smoke detectors and manual call points. A Type 5 Alarm is permitted as an alternative alarm system within firecells containing sleeping accommodation. (BIA 2001) Uncertainty a quantification of the systematic and random error. (ISO/PDTS 16732) Variability a quantification of the probability distribution function for a variable, parameter, or condition. (ISO/PDTS 16732)
C:\WEB_CONVERSION_ETC\CONVERSION FOLDER\CONTESTIBLE FUND\NEW\300603_IMPACT ON LIFE SAFETY OF THE TYPE 5 ALARM.DOC⏐ 30 MAY 2003 ⏐ REVISION 6 ⏐ PAGE 5

Impact on Life Safety of the Type 5 Alarm New Zealand Fire Service Commission CRF Research Report
CHAPTER 1: Introduction
1.1 Preamble The June 2001 revision of the New Zealand Building Code ‘Approved Document C/AS1’ for fire safety (BIA 2001) introduced a new type of fire safety precaution (FSP). Termed a Type 5 alarm, this is applicable within accommodation and multi-unit residential buildings. Essentially, the Type 5 alarm allows localised warning and non-brigade connected alarms in guest suites. This is a departure from previous practice and increases the fire risk to occupants. The benefits are the reduction in unnecessary Fire Service call-out and the reduction in unnecessary total building evacuation.. Qualitative arguments supported the new Type 5 alarm. This research demonstrates that a quantitative approach is available to assist in such decision making.
1.2 Motivation for research This project contributes to a key research priority identified by the New Zealand Fire Service Commission: the cost-benefit study to support legislative change to improve fire safety. New Zealand’s Building Act 1991 similarly imposes a cost-benefit test for all proposed changes to fire safety requirements. In the case of the changes leading to the introduction of the Type 5 alarm the cost-benefit test was qualitatively based. Understanding and assessing the benefits of new or proposed requirements should involve a sound appreciation of the risks associated with competing priorities. The benefits include the reduced frequency of unnecessary fire service call-out and the reduced frequency of unnecessary total building evacuation. The increased risk is dealt with subjectively. This research develops an objective technique for analysing the increased risk. The methodology has a wider application as a decision making tool, than the specific example provided.
1.3 Risk management Risk analysis and risk evaluation are sub-components of risk assessment, which itself is a sub-component of a risk management process. A good overview description of the risk management process applied to engineering risk is given by Keey (2000). The risk management process described below, is reproduced from the joint Australia and New Zealand Standard on Risk Management AS/NZS4360:1999 (SNZ 1999). Descriptions of risk analysis, risk evaluation and risk assessment are included in the definitions section and are sourced from AS/NZS 4360 (SNZ 1999). Because these are key terms in this research, the definitions are repeated here. • Risk analysis a systematic use of available information to determine how often specified events
may occur and the magnitude of their consequences • Risk evaluation the process used to determine risk management priorities by comparing the level of
risk against predetermined standards, target risk levels or other criteria • Risk assessment the overall process of risk analysis and risk evaluation.
C:\WEB_CONVERSION_ETC\CONVERSION FOLDER\CONTESTIBLE FUND\NEW\300603_IMPACT ON LIFE SAFETY OF THE TYPE 5 ALARM.DOC⏐ 30 MAY 2003 ⏐ REVISION 6 ⏐ PAGE 6

Impact on Life Safety of the Type 5 Alarm New Zealand Fire Service Commission CRF Research Report
Figure 1: Risk management overview, reproduced from AS/NZS
Assess risks
Establish the context
Analyse Risks
Evaluate Risks
Treat Risks
Monit
or an
d Rev
iew Identify Risks
Comm
unica
te an
d Con
sult
1.4 The Type 5 alarm Where an automatic fire alarm system is required by the Acceptable Solution C/AS1 in buildings with accommodation or residential purpose groups, the system is either a Type 4e alarm or Type 7e alarm, that is; automatic smoke detectors or fire sprinklers and automatic smoke detectors. The annotated “e” allows that “a Type 5 is permitted as an alternative alarm system within firecells containing sleeping accommodation”. The Type 5 is described in Appendix A of C/AS1as follows:
A variation of the Type 4 and Type 7 alarm systems permitting part of the smoke detection component to comprise only a local alarm The local alarm system, activated by the presence of smoke, has audible alerting devices to warn only the firecell occupants and the building management, where such management exists. Examples of such management situations are motels, hotels or multi-unit residential accommodation in a retirement village. The local alarm component of a Type 5 system: a) Is restricted to single firecells containing sleeping accommodation being household
units in purpose group SR or individual suites in purpose group SA. The local alarm system shall not be extended to other areas such as exitways or common spaces which shall retain a Type 4 smoke detection system, and
b) Shall be permitted only where an automatic fire detection and alarm system activated
by heat detectors (part of the main fire alarm system) is also installed in sleeping firecells which do not already have an automatic sprinkler system.
The Type 5 description is followed by the comment:
The local smoke alarm provides the necessary early fire warning for the firecell occupants. If the firecell is unoccupied or if the occupants fail to respond to the local alarm and there is
C:\WEB_CONVERSION_ETC\CONVERSION FOLDER\CONTESTIBLE FUND\NEW\300603_IMPACT ON LIFE SAFETY OF THE TYPE 5 ALARM.DOC⏐ 30 MAY 2003 ⏐ REVISION 6 ⏐ PAGE 7

Impact on Life Safety of the Type 5 Alarm New Zealand Fire Service Commission CRF Research Report
a developing fire, the automatic alarm activated by either heat detectors or sprinklers will alert the Fire Service and occupants in the building. The small increase in risk, due to the brief delay between activation of the local smoke alarm and activation of the automatic alarm, is more than compensated for by avoiding Fire Service call out and total building evacuation in the event of a false alarm in one firecell.
This last paragraph is particularly relevant to this research which puts a measure to “the small increase in risk”. Fire alarm installations are subject to the Standard NZS4512 ‘Fire alarm systems in buildings’ (SNZ 1997). However, the Standard does not specifically cater for the new Type 5 alarm leading to ambiguous installation practice. The Standard is currently undergoing a significant revision and in its current form DZ4512 (SNZ 2002) appears to more specifically address and define the installation practice for the Type 5 alarm.
1.5 Event tree analysis The risk analysis of the impact of the Type 5 alarm is done using event tree analysis. Event tree analysis is a technique which describes the possible range and sequence of the outcomes which may arise from an initiating event. A simple example of an event tree is described by Figure 2, which is reproduced from Frantzich’s work (Frantzich 1997).
Figure 2: Example Event Tree, reproduced from Frantzich (1997)
C:\WEB_CONVERSION_ETC\CONVERSION FOLDER\CONTESTIBLE FUND\NEW\300603_IMPACT ON LIFE SAFETY OF THE TYPE 5 ALARM.DOC⏐ 30 MAY 2003 ⏐ REVISION 6 ⏐ PAGE 8

Impact on Life Safety of the Type 5 Alarm New Zealand Fire Service Commission CRF Research Report
Complementary pairs of event trees are developed for the Type 4 and 4e alarms and the Type 7 and 7e. The event trees are appended. A theoretical annual loss of life (TALL) is calculated for each event tree. The complementary pairs are compared to determine the increase in risk, measured in loss of life, of the Type 5 alarm. The initiating event is a fire in an accommodation building followed by a second event determining whether the origin is a guest room or suite, ie; the point of difference of a type fire alarm. If the fire is not in a guest room of suite then a ‘safe’ result is returned, which is a misnomer because it is more correct that the result is not of significance to the Type 5. For this reason, the risk calculation is not for a whole building, but for a hotel building where the guest room is the location of origin‡. Therefore, in interpreting the results during risk assessment, care is taken to discuss the relative or differential increase in TALL between the complementary event trees rather than absolute risks. Probabilities and consequences are assigned to the event tree. Each is discussed in detail in the following chapters. Uncertainty, error and indeterminacy are treated by assigning distributions to each of the variables. Risk is calculated across the event tree by using Monte Carlo Simulation.
‡ To give this some context: From US data (NFPA 1999), 30 of 38 of hotel fire deaths between 1992 to 1996 are from the guest room being the room of origin.)
C:\WEB_CONVERSION_ETC\CONVERSION FOLDER\CONTESTIBLE FUND\NEW\300603_IMPACT ON LIFE SAFETY OF THE TYPE 5 ALARM.DOC⏐ 30 MAY 2003 ⏐ REVISION 6 ⏐ PAGE 9

Impact on Life Safety of the Type 5 Alarm New Zealand Fire Service Commission CRF Research Report
CHAPTER 2: Probabilities
2.1 Fire incidence Fire incidence data in accommodation§ buildings is a particularly important statistic as it is the starting point of the event tree analysis and the final risk-calculation result is linearly proportional to this value. Due to its importance, NZ data is checked against several international sources. In this research fire incidence is report per annum and per 100 occupants. This does not, at this stage, factor occupancy rates. These appear latter in the analysis. New Zealand data NZ fire data is gained from the NZFS Fire Incidence Reporting System database (FIRS) which is published in a user friendly format as the Emergency Incident Statistics (EIS) book (NZFS 2001). A useful discussion of the limitations of such FIRS-based data can be found in ‘Source of Uncertainty’ in Chen (2001).The EIS fire incident data is manipulated by relating it to accommodation capacity, to provide a rate ie fires per year per capacity. This is necessary for the incidence to be a function of building size. Accommodation capacity data is gained from Statistics New Zealand (2002). Full (100%) occupancy is assumed. This is necessary to calculate first the theoretical annual loss of life (TALL) from which the expected loss of life (ELL) will later be calculated, based on actual occupancy rates. The capacity data is taken from the period June to May to match the NZFS EIS reporting period. The fire frequency data was first reduced to include buildings likely to have a Type 5 Alarm ie; flats > 20 Units, boarding houses, hotels, motels and lodges. It was further reduced, ie the value appearing in parenthesis in Table 1, to the subset of those buildings likely to be categorised as ‘guest’ rooms in the Statistics NZ survey, ie they exclude flats and apartments but include hotels, motels and lodges, this is necessary to match and marry the data with rooms numbers to gain a rate per capacity. The Statistics New Zealand data has also been reduced to exclude caravan parks, camping grounds and home-stays.
Year
No. of fires No. of beds (103) Incidence (p.a. & 100 cap.)
1997 218 (102) 52.4* 0.19 1998 253 (127) 55.1 0.23 1999 224 (88) 59.5 0.15 2000 229 (88) 62.3 0.14 2001 187 (99) 65.0 0.15
µ = 0.17 σ = 0.034
Table 1: NZ fire incident data for accommodation buildings Notes to Table 1: • (*) assumed value, in this case extrapolated from least squares fit of other four years’ data, the
correlation is excellent, as expected for such a large sample as accommodation capacity with low annual change, the correlation coefficient, r = 99% (and r2 = 98%)
• The corporate year 1996/97 is referred to as 1997 etc • The results are reported to two or three significant figures, anything more detailed implies false
accuracy
§ ie; non-domestic residential such as hotels, motels, hostels and large multi-unit residential apartments
C:\WEB_CONVERSION_ETC\CONVERSION FOLDER\CONTESTIBLE FUND\NEW\300603_IMPACT ON LIFE SAFETY OF THE TYPE 5 ALARM.DOC⏐ 30 MAY 2003 ⏐ REVISION 6 ⏐ PAGE 10

Impact on Life Safety of the Type 5 Alarm New Zealand Fire Service Commission CRF Research Report
USA data The NFPA (1999) data is the most comprehensive reviewed in terms of numbers and location of fires in the building types of interest. Unfortunately, it doesn’t relate the number of fire starts to the number of total buildings; Hotels, Motels and Apartments or Hotel rooms, from which an incidence probability could be gained. However, international hotel industry data is available from Mintel (1998), including room numbers. This can be used to approximate an incident probability. The Mintel data is for the period 1990 to 1997 whereas the NFPA fire data is 1985 to 1996. Therefore, the period 1990 to 1996 is matched for the purposes of calculating an incidence statistic with an average number of rooms per Hotel assumed at the 1995 value.
Year
No. of fires No. of rooms (x 103)
Incidence (p.a. & 100 occ’s)
1985 1,800 -- -- 1986 1,600 -- -- 1987 1,500 -- -- 1988 1,800 -- -- 1989 1,600 -- -- 1990 1,600 3,033 0.053 1991 1,300 3,057 0.043 1992 1,300 3,080 0.042 1993 1,000 3,080 0.032 1994 900 3,175 0.028 1995 1,000 3,225 0.031 1996 1,100 3,275 0.034 1997 -- 3,323 --
µ = 0.038 σ = 0.0080
Table 2: USA fire incident data for accommodation buildings Notes to Table 2: • The Mintel data doesn’t report number of rooms in 1991, a value was linearly interpolated on the
basis that the figures for 1990, 1992 & 1993 were reasonably constant (< 1% difference) • The Mintel average number of rooms per Hotel / Motel is gathered from the major chains only. It
may be assumed then that the figure may be lower, however the Mintel figure is used as it produces a conservative result of a higher incidence rate per Hotel / Motel
Swedish data Frantzich (1997) bases probability of guest room fire starts, on limited data of hotel fires in the Swedish city of Helsingborg over a period of seven years. In this period, there were five fires for a total of 1431 hotel rooms. This is represented as a probability of 0.05 fires per year, per 100 hotel rooms. An important note about this data set is that the five fires were five fires that the Fire Service attended. It was reasoned that this approximated well to the actual number of fires on the basis that most Hotels in Helsingborg have brigade-connected automatic fire alarms. This leads to the simplifying assumption that if there is a fire using this probability, then it is a fire that has grown beyond the incipient stage, which is useful for a later event.
Period (years)
No. of fires No. of rooms
Incidence p.a. & 100 occ’s
7 5 1,431 0.050 Table 3: Swedish fire incident data for accommodation buildings
C:\WEB_CONVERSION_ETC\CONVERSION FOLDER\CONTESTIBLE FUND\NEW\300603_IMPACT ON LIFE SAFETY OF THE TYPE 5 ALARM.DOC⏐ 30 MAY 2003 ⏐ REVISION 6 ⏐ PAGE 11

Impact on Life Safety of the Type 5 Alarm New Zealand Fire Service Commission CRF Research Report
British Data Annex B to the draft British Standard DD240 ,1:1997 (BSI 1997) is an informative annex entitled ‘Selected data for use in probabilistic risk assessment’. As the title suggests, it has a variety of data useful to quantitative risk assessment. Tables B1 to B3 of the Annex provide data for probability of fire starts by occupancy. Disappointingly, accommodation buildings are not included. The closest occupancy type is ‘Dwellings’ which are at an incidence rate of 3.0 x 10⁻³ per occupancy per year. This research does not attempt to correlate these statistics to accommodation. Alternatively, the Fire Protection Association (Scoones 1994) report fire starts in hotels and other accommodation buildings as an annual figure from 1998 to 1992. As with the USA data, the Mintel data is matched to derive incident statistics as per Table 4.
Year
No. of fires No. of rooms (x 103)
P(Incidence ) (p.a. & 100 occ’s)
1988 1,872 497* 0.38 1989 2,188 497* 0.44 1990 1,900 497 0.38 1991 1,752 468** 0.37 1992 1,805 438 0.41
µ = 0.40 σ = 0.025
Table 4: British fire incident data for accommodation buildings Notes to Table 4: • (*) assumed values • (**) interpolated value(s) Summary The data is summarised in Table 5.
Source country
P( Incidence) Per annum and per 100
occupants New Zealand 0.170 USA 0.038 Swedish 0.050 British 0.400 µ = 0.1645
Table 5: International fire incident data for Accommodation buildings Notes to Table 5: • The Swedish data, given such a low sample size, returned a mean result very similar to the USA
data • The UK data is a magnitude of order higher than the USA and Swedish data • The NZ data is somewhere between the UK and US data NZ statistics are based on a smaller sample size than either the US or UK data sets, however they are clearly of the most relevance to this research. It had originally been intended to supplement the NZ statistic with international data to increase confidence (by increasing sample size). However, it is clear that there are some regional differences and so since the NZ data is within a magnitude of order of comparable countries, this research will use the NZ mean incidence, albeit adjusted for uncertainty.
C:\WEB_CONVERSION_ETC\CONVERSION FOLDER\CONTESTIBLE FUND\NEW\300603_IMPACT ON LIFE SAFETY OF THE TYPE 5 ALARM.DOC⏐ 30 MAY 2003 ⏐ REVISION 6 ⏐ PAGE 12

Impact on Life Safety of the Type 5 Alarm New Zealand Fire Service Commission CRF Research Report
Table 1 presents a mean and standard deviation of NZ fire incidence. The deviation is a representation of annual variability in the data rather than a representation inclusive of uncertainty.
Normal(0.17, 0.034) Trunc(0,1)
0
2
4
6
8
10
12
14
0.00
0.05
0.10
0.15
0.20
0.25
0.30
0.35
0.40
0.45
0.50
>2.5% 2.5%95.0%0.1034 0.2366
Figure 3: Probability distribution for fire incidence (per annum per 100 occupants)
2.2 Fire location (guest room / suite) This event determines the fire location in terms of guest room / suite or not. It determines whether the automatic alarm is via a Type 5 or conventional Type 4 or 7 ie if the fire origin is elsewhere than in a hotel or apartment sleeping area, then by definition the alarm will be ‘global’, rather than ‘accommodation local’. Fires elsewhere than in a Type 5 Alarm zone are not of interest to this research. Because of this, it is important to note, that the risk profiles ultimately generated in this analysis are not complete building risk profiles, ie the TALL and ELL will be not only for (say) a hotel fire, but a hotel fire conditional upon a guest room / suite fire origin. The source for this data is the Emergency Incident Statistics book (NZFS 2001). EIS reports bedrooms as accounting for an average 11.3% of residential fires over the five year reporting period. These figures are reported annually in Column (4) of Table 6 below, so that annual variations can be reported as a standard deviation. This data must be interpreted with care, since by far the largest proportion of residential fires are domestic single unit households (83% five year mean) rather than accommodation fires where a Type 5 alarm is expected to be present. Therefore it is assumed that a domestic bedroom location correlates to an accommodation bedroom / suite fire. Consider Column (5), a proportion of fires were unrecorded. The figures are adjusted pro-rata allowing for this origin-unrecorded blank in FIRS. Consider Column (6), by far the largest single location contributor is the kitchen (28.2% five year mean) and in some accommodation cases, the kitchen will be in the Type 5 Alarm zone, especially in NZ motels and accommodation bed-sits. This is why the term suite is also used. Therefore, given that 11% (five year mean) of residential fires are in accommodation buildings of interest we qualitatively assume that 10% of this stock will have kitchens in the Type 5 Alarm zone, leading to an adjustment of 1.1% to bedroom / suite fire location.
C:\WEB_CONVERSION_ETC\CONVERSION FOLDER\CONTESTIBLE FUND\NEW\300603_IMPACT ON LIFE SAFETY OF THE TYPE 5 ALARM.DOC⏐ 30 MAY 2003 ⏐ REVISION 6 ⏐ PAGE 13

Impact on Life Safety of the Type 5 Alarm New Zealand Fire Service Commission CRF Research Report
Year
(1)
Bedroom / suite fires
(2)
All origins
(3)
% bedroom / suite
(4)
Adjusted % Unrecorded
(5)
Adjusted % cooking
(6)
P(bedroom / suite)
(7)
1997 632 4,762 13.3 + 1.7 + 1.1 0.161 1998 596 4,863 12.3 + 1.7 + 1.1 0.151 1999 487 4,484 10.8 + 1.6 + 1.1 0.135 2000 428 4,564 9.4 + 1.2 + 1.1 0.117 2001 423 3,973 10.6 + 1.9 + 1.1 0.136
µ = 0.140 σ = 0.015
Table 6: Fire location data
Normal(0.14, 0.015) Trunc(0,1)
0
5
10
15
20
25
30
0.00
0.05
0.10
0.15
0.20
0.25
>2.5% 2.5%95.0%0.1106 0.1694
Figure 4: Probability distribution for fire located in bedroom / suite
2.3 Fire growth beyond incipient stage This event determines whether the fire grows beyond the incipient phase to potentially life threatening and assumes that incipient fires in themselves are not life threatening. Because the fire incidence statistic is based on fires attended by the fire service and excludes false alarms, the probability of fires not growing beyond an incipient stage approaches zero, or rather the probability that the fire does grow beyond incipient stage is almost unity. However, to allow for variability, it is assumed that 2% of fire events, that were not false alarms and that were attended and recorded by the fire service, would not have grown beyond the incipient stage.
C:\WEB_CONVERSION_ETC\CONVERSION FOLDER\CONTESTIBLE FUND\NEW\300603_IMPACT ON LIFE SAFETY OF THE TYPE 5 ALARM.DOC⏐ 30 MAY 2003 ⏐ REVISION 6 ⏐ PAGE 14

Impact on Life Safety of the Type 5 Alarm New Zealand Fire Service Commission CRF Research Report
Normal(0.02, 0.005) Trunc(0,1)
Values in Thousandths
0
10
20
30
40
50
60
70
80
90
0 25 50 75 100
>2.5%95.0%10.2029
Figure 5: Probability distribution for fire not growing beyond incipient stage
2.4 Occupant awake This event is concerned with whether an occupant is awake, yes and no states lead to different parameters in the consequence model, most notably in the occupant reaction time. In determining this probability a simplifying assumption is made that if the time of fire event is between certain hours then the occupant is awake (06:00-21:59), or else they are asleep (22:00 – 05:59). The source for NZ data is the Emergency Incident Statistics book (NZFS 2001). The results are summarised in Table 7. The probability is determined from ‘all structure’ fires. Unfortunately residential fires (or better still, accommodation fires) are not distinguished in the EIS.
Year
(1)
Fires 22:00-05:59
(2)
Fires 06:00-21:59
(3)
P(awake)
(4) 1997 1,498 5,627 0.790 1998 1,487 5,625 0.791 1999 1,385 5,158 0.788 2000 1,399 5,282 0.791 2001 1,182 4,432 0.789
µ = 0.790 σ = 0.001
Table 7: Occupant awake
C:\WEB_CONVERSION_ETC\CONVERSION FOLDER\CONTESTIBLE FUND\NEW\300603_IMPACT ON LIFE SAFETY OF THE TYPE 5 ALARM.DOC⏐ 30 MAY 2003 ⏐ REVISION 6 ⏐ PAGE 15

Impact on Life Safety of the Type 5 Alarm New Zealand Fire Service Commission CRF Research Report
Normal(0.79, 0.08) Trunc(0,1)
0
1
2
3
4
5
6
0.5
0.6
0.7
0.8
0.9
1.0
< 5.0% 90.0%0.6582 0.9185
Figure 6: Probability distribution for occupant awake
2.5 Manual suppression This event is concerned with whether the fire is manually controlled prior to it becoming life threatening. This event differs between whether the occupant is awake or asleep. Here the data is poor. The only directly relevant reference found was from 1968 where Chandler (1968) reports, of hotel fires, that 53% are ‘tackled’ by occupants before Fire Service attendance and ‘nearly half’ of these are extinguished before Fire Service attendance. Assume ‘nearly half’ refers to 25% of hotel fires and that this is applicable now, as it was in 1968. To further simplify, assume that this refers to occupants that were awake and unawake occupants do not manually suppress the fire.
Uniform(0, 0.25)
0.0
0.5
1.0
1.5
2.0
2.5
3.0
3.5
4.0
4.5
0.00
0.05
0.10
0.15
0.20
0.25
0.30
0.35
0.40
0.45
0.50
2.5%95.0%0.0063 0.2438
Figure 7: Probability distribution for manual suppression if occupant awake
2.6 Automatic suppression This event is concerned with whether the fire is automatically controlled prior to it becoming life threatening. Effectively, for the building type of interest, it amounts to whether a sprinkler system is present or not.
C:\WEB_CONVERSION_ETC\CONVERSION FOLDER\CONTESTIBLE FUND\NEW\300603_IMPACT ON LIFE SAFETY OF THE TYPE 5 ALARM.DOC⏐ 30 MAY 2003 ⏐ REVISION 6 ⏐ PAGE 16
Impact on Life Safety of the Type 5 Alarm New Zealand Fire Service Commission CRF Research Report
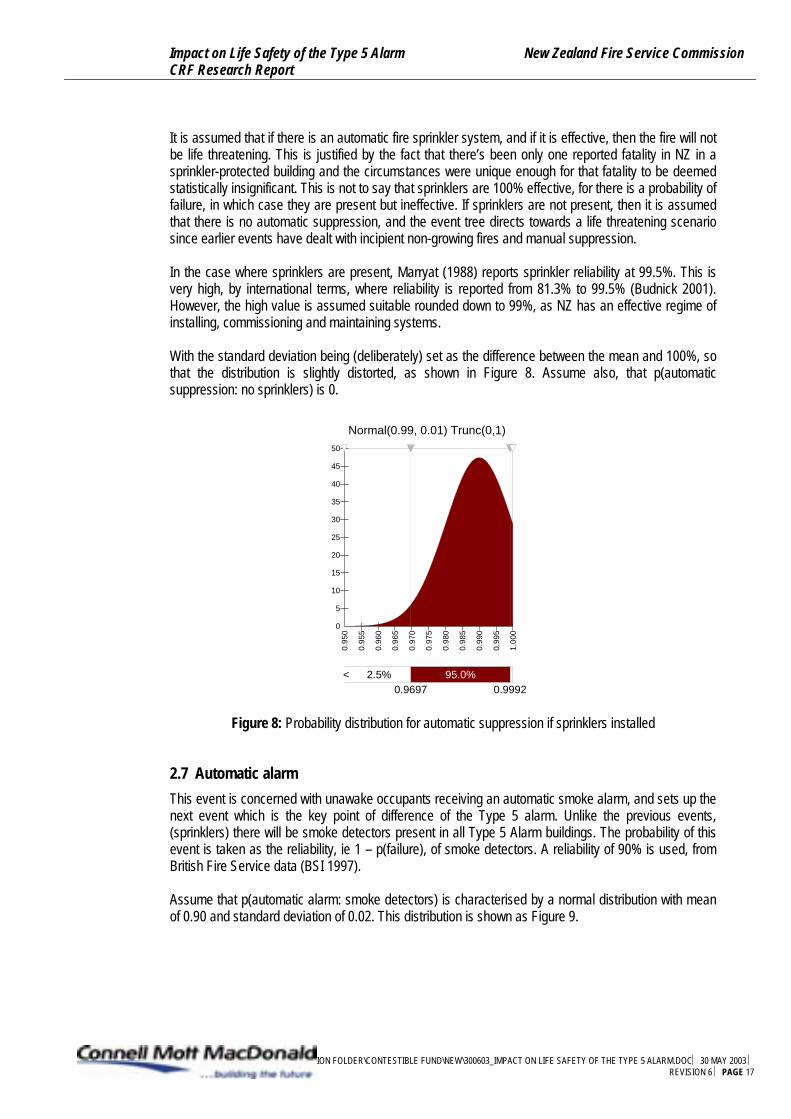
It is assumed that if there is an automatic fire sprinkler system, and if it is effective, then the fire will not be life threatening. This is justified by the fact that there’s been only one reported fatality in NZ in a sprinkler-protected building and the circumstances were unique enough for that fatality to be deemed statistically insignificant. This is not to say that sprinklers are 100% effective, for there is a probability of failure, in which case they are present but ineffective. If sprinklers are not present, then it is assumed that there is no automatic suppression, and the event tree directs towards a life threatening scenario since earlier events have dealt with incipient non-growing fires and manual suppression. In the case where sprinklers are present, Marryat (1988) reports sprinkler reliability at 99.5%. This is very high, by international terms, where reliability is reported from 81.3% to 99.5% (Budnick 2001). However, the high value is assumed suitable rounded down to 99%, as NZ has an effective regime of installing, commissioning and maintaining systems. With the standard deviation being (deliberately) set as the difference between the mean and 100%, so that the distribution is slightly distorted, as shown in Figure 8. Assume also, that p(automatic suppression: no sprinklers) is 0.
Normal(0.99, 0.01) Trunc(0,1)
0
5
10
15
20
25
30
35
40
45
50
0.95
0
0.95
5
0.96
0
0.96
5
0.97
0
0.97
5
0.98
0
0.98
5
0.99
0
0.99
5
1.00
0
< 2.5% 95.0%0.9697 0.9992
Figure 8: Probability distribution for automatic suppression if sprinklers installed
2.7 Automatic alarm This event is concerned with unawake occupants receiving an automatic smoke alarm, and sets up the next event which is the key point of difference of the Type 5 alarm. Unlike the previous events, (sprinklers) there will be smoke detectors present in all Type 5 Alarm buildings. The probability of this event is taken as the reliability, ie 1 – p(failure), of smoke detectors. A reliability of 90% is used, from British Fire Service data (BSI 1997). Assume that p(automatic alarm: smoke detectors) is characterised by a normal distribution with mean of 0.90 and standard deviation of 0.02. This distribution is shown as Figure 9.
C:\WEB_CONVERSION_ETC\CONVERSION FOLDER\CONTESTIBLE FUND\NEW\300603_IMPACT ON LIFE SAFETY OF THE TYPE 5 ALARM.DOC⏐ 30 MAY 2003 ⏐ REVISION 6 ⏐ PAGE 17

Impact on Life Safety of the Type 5 Alarm New Zealand Fire Service Commission CRF Research Report
Normal(0.9, 0.02) Trunc(0,1)
0
5
10
15
20
25
0.5
0.6
0.7
0.8
0.9
1.0
< >2.5%0.8608
Figure 9: Probability distribution for automatic alarm reliability
2.8 Alarm direct to all occupants This is the key event in differentiating between Type 5 Alarms and conventional Type 4 or 7. It is a binary event, if there’s a Type 5 present the probability is p(0,1) if it’s a Type 4 or 7 its p(1,0). This event is not concerned about the probability, but the consequences change, ie it directs the analysis to consequence scenarios with delayed alarm times.
2.9 Fire spread: confined to room and spread beyond room These two events relate to fire spread; horizontal and vertical fire spread. As with the preceding event, these events are concerned with directing or weighting the analysis towards varying consequences. Unlike the preceding event, they are based on statistics rather than being a binary event. In this case the NZ data is not used. The EIS data (NZFS 2001) is considered to be too skewed or shifted (from what this study is interested in) by the high proportion of domestic, single-storey structures. EIS data for horizontal fire spread from room to room or from the structure to ancillary structures is not necessarily representative of the accommodation structure model, in which firecells are significantly more compartmented. Instead, more purpose-specific fire and smoke spread data is found in the NFPA Report (NFPA 1995)] with the results for the period 1992 to 1996 reported in Table 8. The USA-based data for hotels and motels is used, rather than including apartment buildings, on the basis that their definition of a hotel / motel room is more likely to represent the NZ accommodation firecell. The number of fire and fatalities are reported. It is interesting that these do not correlate linearly, for example when fires spread beyond the floor of origin there is a disproportionate level of fatalities. Upon consideration, this is an expected result, as multiple-level fires usually corresponds to unsafe egress from upper levels. In this analysis the probabilities of fire rather than fatalities is used, on the basis that the consequence models will deal with fatalities.
Confined to room of origin
Beyond room but confined to floor
Beyond floor of origin
Fires 4,680 87.6 % 200 3.8% 460 8.6% Fatalities 14 36.8% 2 5.3% 22 57.9%
Table 8: Extent of flame and smoke damage Assume that p(fire spread confined to room of origin) is characterised by a normal distribution with mean of 0.876 and standard deviation of 0.044 (arbitrarily set). Similarly, assume that p(fire spread
C:\WEB_CONVERSION_ETC\CONVERSION FOLDER\CONTESTIBLE FUND\NEW\300603_IMPACT ON LIFE SAFETY OF THE TYPE 5 ALARM.DOC⏐ 30 MAY 2003 ⏐ REVISION 6 ⏐ PAGE 18

Impact on Life Safety of the Type 5 Alarm New Zealand Fire Service Commission CRF Research Report
confined floor of origin: fire spread beyond room of origin) is characterised by a normal distribution with mean of 0.303 and standard deviation of 0.1 (arbitrarily set). These distribution are shown as Figure 8 and Figure 9 respectively.
Normal(0.876, 0.044) Trunc(0,1)
0
1
2
3
4
5
6
7
8
9
10
0.5
0.6
0.7
0.8
0.9
1.0
< 2.5% 95.0%0.7897 0.9605
Normal(0.303, 0.1) Trunc(0,1)
0.0
0.5
1.0
1.5
2.0
2.5
3.0
3.5
4.0
4.5
0.00
0.15
0.30
0.45
0.60
0.75
>2.5%95.0%0.1090 0.4990
Figure 10: Probability distribution for fire spread confined to room of origin
Figure 11: Probability distribution for fire spread confined to floor of origin given that its spread
beyond the room of origin.
2.10 Summary of event tree probabilities Event Statistic
Dist. Type
Mean Std Dev Units
1 p(incident) Normal 0.17 0.034 Fires / yr / 100 ppl 2 p(located in bedroom / suite) Normal 0.14 0.015 Dimensionless 3 p(incipient only) Normal 0.02 0.005 Dimensionless 4 p(occupant awake) Normal 0.79 0.08 Dimensionless 5a p(manual suppression: awake) Uniform 0.125 0.072 Dimensionless 5b p(manual suppression: not awake) -- 0 N/a Dimensionless 6a p(automatic suppression: sprinklers) Normal 0.99 0.01 Dimensionless 6b p(automatic suppression: no sprinklers) -- 0 N/a Dimensionless 7 p(automatic alarm) Normal 0.90 0.02 Dimensionless 8a p(alarm direct to all occupants: Type 5) Binary 0 N/a Dimensionless 8b p(alarm direct to all occupants: not Type 5) Binary 1 N/a Dimensionless 9 p(fire limited to room of origin) Normal 0.876 0.044 Dimensionless 10 p(fire limited to floor: spread beyond room) Normal 0.303 0.100 Dimensionless
Table 9: Summary of event probabilities
C:\WEB_CONVERSION_ETC\CONVERSION FOLDER\CONTESTIBLE FUND\NEW\300603_IMPACT ON LIFE SAFETY OF THE TYPE 5 ALARM.DOC⏐ 30 MAY 2003 ⏐ REVISION 6 ⏐ PAGE 19

Impact on Life Safety of the Type 5 Alarm New Zealand Fire Service Commission CRF Research Report
CHAPTER 3: Consequences
3.1 Outcome scenarios (consequences) Each event tree branch terminates at an outcome, as outcomes may differ in consequence within an event tree these are termed outcome scenarios. An outcome scenario is the point where a particular consequence can be generally described by the events leading up to it. For example one outcome is a life threatening bedroom / suite fire, while the occupants sleep in a non-sprinkler protected building, with fire spread confined to the room / firecell of origin. Depending on the geometry of the building and other specific details the magnitude of that outcome (ie the consequence) needs to be determined to calculate the risk. In this research the calculation of the magnitude of an outcome is termed consequence modelling, and it is done following the methodology of Frantzich [1997]. In this work, a limit state function is derived for each outcome expressing the escape time margin. The consequence is the product of the probability of a negative escape time margin multiplied by the maximum** number of occupants.
3.2 General equation
Limit State Function Starting with the limit state function, G the escape time margin is calculated by:
Equation 1 RSETASETG −=
Escape time margin (s)
RSETASETG
Available safe egress time (s) Required safe egress time (s)
The limit state function G, is based on a classical deterministic approach to egress. A negative escape time margin equates to a loss, and a positive escape time margin equates to a safe state. This form of equation may be found, with differing notation, in many national design guidelines such as the New Zealand Fire Engineering Design Guide (Buchanan 2001) and the Australian Fire Engineering Guidelines (Warren Centre 1996). The deterministic approach is converted to a risk-based approach by assigning probability distributions to the random and calculated variables within the limit state function. There is therefore a probability of a loss and a probability of safety. ASET and RSET The ASET is calculated as a function of fire growth, using a mathematical model that Frantzich (1997) developed from a regression analysis of results of the computer model CFAST (Peacock et al 1993). CFAST has since been superseded by FAST (Peacock et al 2000). However, the changes do not alter the regression algorithm.
Equation 2
Time to untenable conditions, calculated (s) Uncertainty factor applied to S, characterised by the distribution Normal (1.35,0.11)
The RSET is itself, composed of some basic variables.
SUSASET ⋅=
sUS
** The maximum occupant load leads to the TALL, this is then adjusted for actual occupancy rates to gain an ELL.
C:\WEB_CONVERSION_ETC\CONVERSION FOLDER\CONTESTIBLE FUND\NEW\300603_IMPACT ON LIFE SAFETY OF THE TYPE 5 ALARM.DOC⏐ 30 MAY 2003 ⏐ REVISION 6 ⏐ PAGE 20

Impact on Life Safety of the Type 5 Alarm New Zealand Fire Service Commission CRF Research Report
Equation 3 erid ttttRSET +++=
Detection time, calculated or random variable (s)
e
r
i
d
tttt
Investigation time (from Frantzich) or delayed alarm if Type 5, random variable (s) Occupant response time, random variable (s) Occupant movement time, random variable, (s)
The general equation is derived by substituting into Equation 1 for Equation 4.
Equation 4 ( )erids ttttUSG +++−⋅=
3.3 Case study For the analysis to produce meaningful risk profiles, basic details of building geometry must be assumed. An example building layout is therefore chosen, from the case study Hotel building used by Frantzich (1997). The following description is based on text in Frantzich’s report, but modified to suit the Type 5 scenario rather than the ‘positive alarm sequence’ used in Sweden. Frantzich’s Hotel case study The calculations are based around one floor in a multi-level hotel. It is assumed that the occupants can evacuate without any assistance from other occupants or the hotel staff. Following alarm, the occupant responds to the alarm signal and after a period, begin evacuation. Each guest room has a floor area of 6.0 m x 5.0 m and a height to the ceiling of 2.4 m. The room has a window, 0.9 m x 0.9 m, to the outside and a door, 2.0 x 1.0 m leading to the corridor. Each room is a separate firecell. The door to the corridor is a fire doorset with a closing device. The door is assumed to open into the guest room. Even if the door is fire rated some leakage is assumed. Leakage openings of 2.0 x 0.005 m at the side and 1.0 m x 0.010 m under the door are assumed for the CFAST simulations. The window is assumed to have a leak opening to the outside of 0.9 m x 0.01 m. The corridor length is 30 m. The corridor is 3 m wide and 2.5 m high. The number of guest rooms per floor is 12 rooms. The walls and ceiling are covered by gypsum sheets applied on non-combustible material and the floor is constructed of concrete. The NZBC requirement for corridor ventilation is assumed not to be present nor are subdividing corridor smoke control doorsets. In both ends of the corridor it is assumed that safe path staircases, lead to a safe place. The doors leading to the staircases are assumed to be closed. They will, however, be opened during evacuation, letting smoke and people out to the staircase. To simulate this, these doors will be kept open during the whole simulation with an area of 2.0 m x 0.100 m. This is an engineering assumption which also makes the fire calculations easier. The staircases are assumed to be a place of safety. It is further assumed that there is one occupant in each room and that no queuing occurs at the staircases leading to the ground floor. When the individual risk is calculated the number of occupants on the floor is irrelevant as the safety is affecting the last person to leave the location of interest. However, in terms of societal risk, that is based on the risk of multiple affected people, the number must be part of the calculation. As the number of occupants on the floor is low, it is assumed that the arrival rate at the staircases is one occupant every four seconds. This rate is determined by the distance between the rooms and not by the flow capacity at the doorway. This information is needed to calculate the number of occupants not yet in safety when the corridor escape time margin is less than zero. The limit state function described by Equation 4, is not appropriate in considering vertical fire spread beyond the floor of origin. Instead an approximation of the consequence of vertical fire spread is developed based on an ‘escalation model’. Frantzich’s hotel case study must be expanded to include a
C:\WEB_CONVERSION_ETC\CONVERSION FOLDER\CONTESTIBLE FUND\NEW\300603_IMPACT ON LIFE SAFETY OF THE TYPE 5 ALARM.DOC⏐ 30 MAY 2003 ⏐ REVISION 6 ⏐ PAGE 21
Impact on Life Safety of the Type 5 Alarm New Zealand Fire Service Commission CRF Research Report
number of storeys. The escalation model is a function of the location of the fire (floor of origin) and the number of occupants threatened, above that floor. This is treated as an outcome scenario variable developed in the following section.
3.4 Outcome scenario variables
Alarm type The consequence scenarios, ie the specific consequence equations, are of the form of Equation 4. However, the variables will differ as a function of alarm type. For this research, four distinct event trees are necessary, two pairs of two. The first pair relate to Type 4 and Type 4e (ie Type 5) Alarms, and the second pair relate to the Type 7 and Type 7e (ie Type 5 with sprinklers). The risk profiles are then compared of the Type 4 versus Type 4e and Type 7 versus Type 7e to determine the relative change in level of risk, measured in ELL. Time to untenable conditions The time to untenable conditions depends on whether the scenario is considering the occupant in the room of origin, on the floor of origin or elsewhere in the building. This latter is not dealt with using classical ASET versus RSET calculations and is more statistically-based. Frantzich (1997) develops a relationship, based on a regression analysis of multiple CFAST simulations, for the time to untenable conditions as a function of fire growth rate, assuming that the fire is characterised by the classical alpha-time-squared relationship, refer to Equation 5.
Equation 5 qrS −⋅= α
qr, Geometry-dependent constants (--)
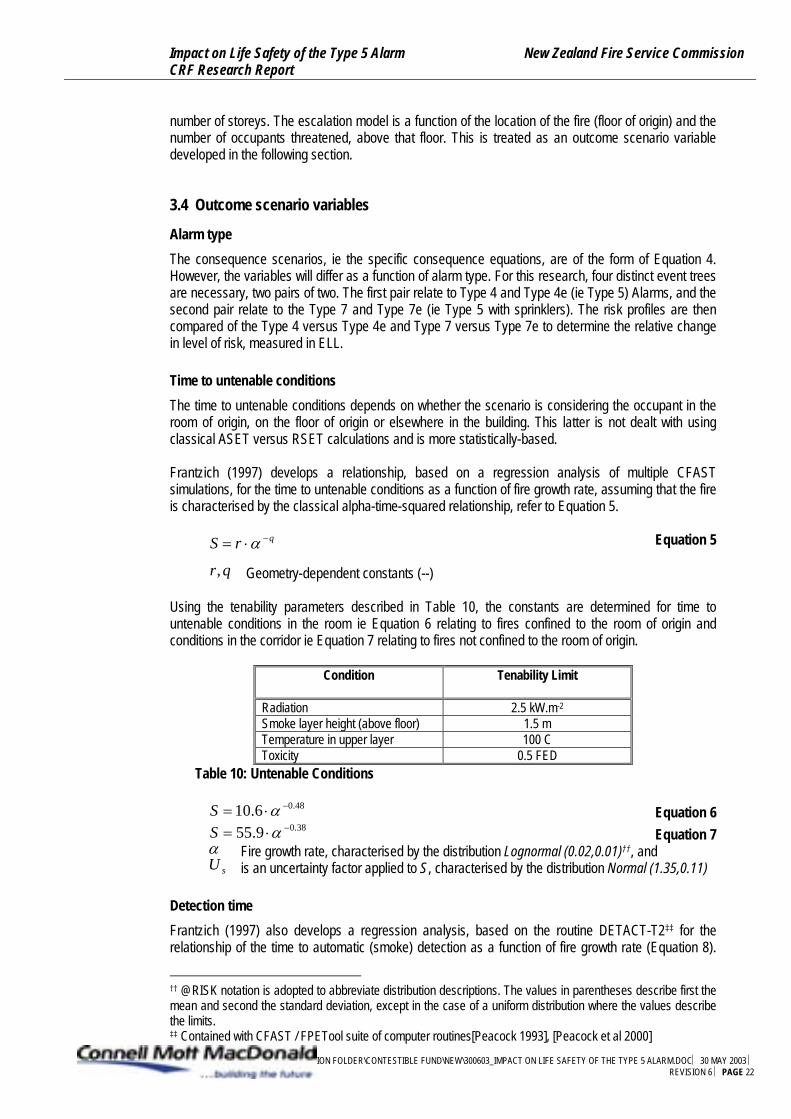
Using the tenability parameters described in Table 10, the constants are determined for time to untenable conditions in the room ie Equation 6 relating to fires confined to the room of origin and conditions in the corridor ie Equation 7 relating to fires not confined to the room of origin.
Condition
Tenability Limit
Radiation 2.5 kW.m-2
Smoke layer height (above floor) 1.5 m Temperature in upper layer 100 C Toxicity 0.5 FED
Table 10: Untenable Conditions
Equation 6 38.0
48.0
9.556.10
−
−
⋅=⋅=αα
SS
Equation 7
sUα Fire growth rate, characterised by the distribution Lognormal (0.02,0.01)††, and
is an uncertainty factor applied to S, characterised by the distribution Normal (1.35,0.11)
Detection time Frantzich (1997) also develops a regression analysis, based on the routine DETACT-T2‡‡ for the relationship of the time to automatic (smoke) detection as a function of fire growth rate (Equation 8).
†† @RISK notation is adopted to abbreviate distribution descriptions. The values in parentheses describe first the mean and second the standard deviation, except in the case of a uniform distribution where the values describe the limits. ‡‡ Contained with CFAST / FPETool suite of computer routines[Peacock 1993], [Peacock et al 2000]
C:\WEB_CONVERSION_ETC\CONVERSION FOLDER\CONTESTIBLE FUND\NEW\300603_IMPACT ON LIFE SAFETY OF THE TYPE 5 ALARM.DOC⏐ 30 MAY 2003 ⏐ REVISION 6 ⏐ PAGE 22

Impact on Life Safety of the Type 5 Alarm New Zealand Fire Service Commission CRF Research Report
Frantzich assumes probability distributions for time to detection if the occupant is intimate with fire and awake (Equation 9), or a third party manual detection if the first two conditions fail ie not detected automatically by the alarm or manually by the intimate occupant (Equation 10).
Equation 8 Equation 9
Equation 10
( )( )300,120
3,156.20
3
2
1
30.0
UniformtLognormalt
t
d
d
d
==
⋅= −α
Where;
3
2
1
d
d
d
ttt Time to automatic smoke detection (s)
Time to manual detection if awake and intimate with fire (s) Time to manual detection otherwise (s)
Investigation alarm – Type 5 Alarm delay time (key variable) In Frantzich’s (1997) work, the next variable is , the investigation time that represents the ‘positive alarm sequence’. That is, the situation where the local alarm activates in the room of origin and at a remote staff-attended monitor, allowing the staff time to investigate and activate a global alarm if necessary. This is characterised by the distribution Lognormal(60,15). However, in the case of the Type 5 there is no investigation time, in so far as positive alarm sequence. Instead, there is a time delay between local and global alarms. This is the time between smoke and thermal activation (thermal inclusive of sprinklers). This is termed the ‘Type 5 delay time’ and is the key variable in the risk analysis. It is notated as
it
dt∆ .
14 dddi tttt −=∆= Equation 11
4d
d
tt∆ Type 5 Alarm delay time (s)
Time to automatic thermal (incl. sprinkler) detection (s)
The general equation (Equation 4) is revised as;
Equation 12
( )erdds ttttUSG ++∆+−⋅=
The value of is derived from a regression analysis of DETACT-T2 results. These results appear in Table 11 and Figure 12. The regression equation, as Equation 13 and the calculation of delay time as Equation 14.
4dt
Equation 13
30.034.0
34.0
6.202.492.49
4
−−
−
⋅−=∆
=
ααα
d
d
tt
Equation 14
C:\WEB_CONVERSION_ETC\CONVERSION FOLDER\CONTESTIBLE FUND\NEW\300603_IMPACT ON LIFE SAFETY OF THE TYPE 5 ALARM.DOC⏐ 30 MAY 2003 ⏐ REVISION 6 ⏐ PAGE 23

Impact on Life Safety of the Type 5 Alarm New Zealand Fire Service Commission CRF Research Report
Fire growth
Alpha (kW.m-2)
Detection time Smoke (s),
1dtDetection time
Thermal (s), 4dt
Slow 0.0029 119 362 Medium 0.0117 78 218 Fast 0.0469 52 137 Ultra-fast 0.1876 34 88
Table 11: Detector activation, thermal alarm Notes to Table 11 • Rather than set as a discrete difference it is left in the form of Equation 13 to allow the growth
rate distribution function to be modelled in the MCS. dt∆
• Assumed parameters for a typical hotel room and thermal detector (for simplicity assumed the same for Heat and Sprinkler element) are: height from fire to detector is 2.1 m (ie fire 300 mm above floor level), radius from fire centre to detector ~3.0 m, ambient temperature 17 C, activation temperature 68 C, thermal detector response time index 57 (m.s)0.5
Figure 12: Type 5 Alarm, delay time
Type 5 Alarm Delay Time
34
137
88
52
119
78
362
218
y = 20.6x-0.3
y = 49.2x-0.34
0
50
100
150
200
250
300
350
400
0.00
0.05
0.10
0.15
0.20
Fire growth rate, alpha (kW.s-2)
Det
ectio
n tim
e (s
)
Smoke detection Thermal (incl. Sprinkler) detection Thermal approximation
Response time This is the time immediately following alarm and up to evacuation. This time is also commonly called pre-movement time. Depending on the outcome scenario, the occupant will be awake or asleep, and intimate or remote from the fire. Using Frantzich’s (1997) statistics, in the room of origin, with the occupant awake the response time, is assumed to follow the distribution described by Equation 15. Otherwise, Equation 16.
C:\WEB_CONVERSION_ETC\CONVERSION FOLDER\CONTESTIBLE FUND\NEW\300603_IMPACT ON LIFE SAFETY OF THE TYPE 5 ALARM.DOC⏐ 30 MAY 2003 ⏐ REVISION 6 ⏐ PAGE 24

Impact on Life Safety of the Type 5 Alarm New Zealand Fire Service Commission CRF Research Report
Equation 15 Equation 16
( )( )20,120
3,15
2
1
LognormaltLognormalt
r
r
==
2
1
r
r
tt Response time for occupants awake and intimate with the fire (s)
Response time otherwise (s)
Evacuation time This is the travel time, both traversal and queuing. However, for such a low occupant load as a hotel guest floor with 30 occupants, queuing is assumed not to occur. Again, Frantzich’s (1997) example is used.
Equation 17
( )3,20Normalte =
Occupant movement time, in this case evacuation (movement) time to safe path stair (s) et
Consequences The limit state equation gives an escape time margin. The consequence is the probability of a negative escape time margin in the room multiplied by room occupancy (one) plus the probability of a negative escape time margin in the corridor multiplied by the floor’s occupant load (twelve). Fire spread to other upper floors is treated separately, as described in the next section. Escalation model As described previously, Frantzich’s case study must be expanded to consider the consequence of vertical fire spread beyond the floor of origin. The first step is to determine a building height, in number of storey, for the case study hotel. The height should be representative of the NZ sample but should be tall enough to: • be representative of building likely to have a Type 5 alarm, ie; single storey buildings are unlikely
to require a Type 5 • allow for high consequence event in the risk profile§§ The NZ hospitality data (Statistics NZ 2002) provides NZ accommodation annual capacity and establishment number. The data has been reduced to exclude caravan parks, camping grounds and home-stays. From this data we can determine a mean number of beds. Refer to Table 12 below.
Year
No. of establishments
No. of beds (x103 per night)
Mean No. of beds per establishment
1998 2,210 55.1 24.9 1999 2,301 59.5 25.9 2000 2,364 62.3 26.4 2001 2,998 65.0 21.6
µ = 25 σ = 2
Table 12: NZ accommodation data Notes to Table 12:
§§ High consequences are balanced in risk profile by their probability, but it is important that high-consequence events are included in the first place
C:\WEB_CONVERSION_ETC\CONVERSION FOLDER\CONTESTIBLE FUND\NEW\300603_IMPACT ON LIFE SAFETY OF THE TYPE 5 ALARM.DOC⏐ 30 MAY 2003 ⏐ REVISION 6 ⏐ PAGE 25

Impact on Life Safety of the Type 5 Alarm New Zealand Fire Service Commission CRF Research Report
• The corporate year 1997/98 is referred to as 1998, etc • The results are reported to two or three significant figures, anything more detailed implies false
accuracy The data in Table 12 indicates that the mean accommodation building in NZ has 25 bed capacity. Qualitatively, it can be assumed that the mean NZ structure is low rise, typically two storey. For the case study building, it is assumed an atypical case of four storeys of accommodation at 12 bedrooms per floor. Further assume an equal probability of fire incidence per floor. For example, there is a 25% chance that the L1 occupants are exposed, ie; a fire start on L1, 50% for L2 occupants, ie fire start L1 or L2 and so on. The consequence is assumed as the number of people exposed, which are 12 multiplied by the number of floors.
3.5 Specific equations Scenario specific, limit state equations are developed and reported on the event trees in CHAPTER 4: ‘Risk ’.
C:\WEB_CONVERSION_ETC\CONVERSION FOLDER\CONTESTIBLE FUND\NEW\300603_IMPACT ON LIFE SAFETY OF THE TYPE 5 ALARM.DOC⏐ 30 MAY 2003 ⏐ REVISION 6 ⏐ PAGE 26

Impact on Life Safety of the Type 5 Alarm New Zealand Fire Service Commission CRF Research Report
CHAPTER 4: Risk analysis
4.1 Calculation of risk The event trees are included as Appendix A. These are populated with event probabilities and outcome scenarios. The ELL is calculated for each scenario and then summed and divided by the total occupant load to provide the TALL. This is described by Equations 18 and 19.
( ) ( )
( )NELLTALL
NELLELLNGPSCENPELL
i
iii
=⋅=
⋅<⋅=
∑ 1000 Equation 18
Equation 19 Equation 20
The theoretical annual loss of life assumes 100% occupancy. A lower occupancy rate decreases the risk of a fatality overall. However, it simultaneously increases the probability to any specific individual occupant (refer also to the definition of individual risk). The net effect is assumed to be a constant individual risk. In this research, the risk measure is relative and so differing occupancy rates have negligible effect on the results. The software @RISK (Palisade 2002) is an add-in to the spreadsheet package Microsoft Excel and contains a Monte Carlo Simulation engine. @RISK is used to model uncertainty and variability in the input variables and to generate the probability density functions required for Equation 18. @RISK is also used as a reporting tool to generate the graphs and tables included in this section. Two-step simulations were run for each event tree. The first step had P(G<0) as the output. The second, had ELLi, ELL and TALL as the outputs, given P(G<0). Each step and each simulation involved 100,000, samples using Latin Hyperbole sampling (LHS).
4.2 Pre-calibration results Detailed pre-calibration results are included in Appendices B. Key probability and risk results are included in Table 13 and Table 14.
SCEN Type 4 Type 4e Type 7 Type 7e P(SCEN)
P(G<0)
x10-2 ie% P(SCEN) P(G<0)
x10-2 ie% P(SCEN) P(G<0)
x10-2 ie% P(SCEN) P(G<0)
x10-2 ie% 04 1.4 x 10⁻² 1.0 1.4 x 10⁻² 1.0 1.8 x 10⁻⁴ 1.0 1.8 x 10⁻⁴ 1.0 05 6.1 x 10⁻⁴ 1.6 6.1 x 10⁻⁴ 1.6 7.8 x 10⁻⁶ 1.6 7.8 x 10⁻⁶ 1.6 06 1.4 x 10⁻³ 0.2 1.4 x 10⁻³ 0.2 1.8 x 10⁻⁵ 0.2 1.8 x 10⁻⁵ 0.2 09 3.9 x 10⁻³ 100 -- -- 5.0 x 10⁻⁵ 100 -- -- 10 1.7 x 10⁻⁴ 3.0 -- -- 2.1 x 10⁻⁶ 3.0 -- -- 11 3.8 x 10⁻⁴ 0.3 -- -- 4.9 x 10⁻⁶ 0.3 -- -- 12 -- -- 3.9 x 10⁻³ 100 -- -- 5.0 x 10⁻⁵ 100 13 -- -- 1.7 x 10⁻⁴ 34 -- -- 2.1 x 10⁻⁶ 34 14 -- -- 3.8 x 10⁻⁴ 3 -- -- 4.9 x 10⁻⁶ 3 15 4.3 x 10⁻⁴ 100 4.3 x 10⁻⁴ 100 5.5 x 10⁻⁶ 100 5.5 x 10⁻⁶ 100 16 1.9 x 10⁻⁵ 48 1.9 x 10⁻⁵ 48 2.4 x 10⁻⁷ 48 2.4 x 10⁻⁷ 48 17 4.3 x 10⁻⁵ 5 4.3 x 10⁻⁵ 5 5.5 x 10⁻⁷ 5 5.5 x 10⁻⁷ 5 Table 13: Probability data, pre-calibration
Comparing the P(G < 0) SCEN 10 with SCEN 13 illustrates the impact of the Type 5 Alarm in terms of the increased likelihood of a negative escape time margin. These are not yet ‘risk’ profiles, as they must yet be weighted by P(SCEN) and consequence data.
C:\WEB_CONVERSION_ETC\CONVERSION FOLDER\CONTESTIBLE FUND\NEW\300603_IMPACT ON LIFE SAFETY OF THE TYPE 5 ALARM.DOC⏐ 30 MAY 2003 ⏐ REVISION 6 ⏐ PAGE 27

Impact on Life Safety of the Type 5 Alarm New Zealand Fire Service Commission CRF Research Report
TYPE
ELL TALL
TYPE 4 2.4 x 10⁻³ 4.9 x 10⁻⁵
TYPE 4e 2.8 x 10⁻³ 5.9 x 10⁻⁵
TYPE 7 3.0 x 10⁻⁵ 6.2 x 10⁻⁷
TYPE 7e 3.6 x 10⁻⁵ 7.6 x 10⁻⁷
Table 14: Risk profiles, pre-calibration
Figure 13: Case study probability density functions of TALL, comparing Types 4 and 4e
Distribution for TYPE 4 TALL/S81
Val
ues
in 1
0^ 3
Values in 10^-6
0
5
10
15
20
25
ETA Type 4!S81: Mean=4.8987E-05
ETA Type 4e!S81: Mean=5.872821E-05
0 50 100 150 200
ETA Type 4!S81: Mean=4.8987E-05
ETA Type 4e!S81: Mean=5.872821E-05
Figure 14: Case study probability density functions of TALL, comparing Types 7 and 7e
Distribution for TYPE 7 TALL/S81
Val
ues
in 1
0^ 6
Values in 10^-6
0.000
0.200
0.400
0.600
0.800
1.000
1.200
ETA Type 7!S81: Mean=6.268438E-07
ETA Type 7e!S81: Mean=7.588829E-07
0 1.5 3 4.5 6
ETA Type 7!S81: Mean=6.268438E-07
ETA Type 7e!S81: Mean=7.588829E-07
The relative increase in TALL between the Type 4 and 4e, and the Type 7 and 7e is the impact of the Type 5 alarm, about 20% in each case. The results require validation.
C:\WEB_CONVERSION_ETC\CONVERSION FOLDER\CONTESTIBLE FUND\NEW\300603_IMPACT ON LIFE SAFETY OF THE TYPE 5 ALARM.DOC⏐ 30 MAY 2003 ⏐ REVISION 6 ⏐ PAGE 28

Impact on Life Safety of the Type 5 Alarm New Zealand Fire Service Commission CRF Research Report
4.3 Model validation Assume the tolerable level of individual risk in a Hotel is ~1 x 10⁻⁵ deaths per annum (refer to CHAPTER 5: ‘Risk assessment’). Assume also, that the BIA Acceptable Solution C/AS1’Fire Safety’ (BIA 2002) provides for a tolerable level of risk. Given this, it follows that the TALL for the Type 4 in the case study should have been less than 1 x 10⁻⁵. From the USA data (NFPA 1999), for the period 1992 to 1996, 30 of 38 Hotel and Motel fire fatalities (civilian) were from fires originating in the bedroom. Based on this statistic, the TALL for the case study with a Type 4 alarm should have been ~ 8 x 10⁻⁶. The calculated value of ~ 5 x 10⁻⁵ is therefore almost a magnitude of order high. This indicates that the model requires calibration in terms of the absolute value of TALL. A value calibrated for the Type 4 alarm will also automatically calibrate the other alarms. It should be noted that this research is a risk relative exercise, ie the difference in TALL between the Type 4 and 4e and similarly the Type 7 and 7e. It is desirable but not essential that the absolute TALL values are correct to any more than a magnitude of order, to be able to comment on the impact of the Type 5 alarm. In terms of the relationship between the Type 4 and 4e data with their Type 7 and 7e pairings, the relative difference is two magnitudes of order. This is an expected result given the assigned mean 99% reliability of the automatic fire sprinkler system.
4.4 Model sensitivity Figure 15 is a sensitivity analysis generated by @RISK for the case study with a Type 4. This, and the other sensitivity analyses are included in Appendix B. It can be seen that the TALL for a guest room fatality, is most sensitive to the probability that an occupant is awake, the probability that the location of origin is a guest room and the probability that there is a fire start. If the correlation is negative, this means that an increased probability of that variable decreases the TALL. If the correlation is positive, the reverse holds.
Figure 15: Sensitivity of the TALL in the case study (Type 4)
Regression Sensitivity for TYPE 4TALL/S81
Std b Coefficients
Yes - awake/E16 .002
Yes - location/C16-.002
Yes - incipient/D8-.003
Yes - confined to floor/K24 .003
Yes - location/C16 .003
Yes - incipient/D8-.013
Yes - manual suppression 1.../F12-.016
Yes - automatic alarm/H49-.017
Yes - confined to room/J20 .037
Yes - confirned to floor/K24 .04
Yes - fire start/B41 .056
Yes - location/C16 .293
Yes - awake/E16-.945
-1 -0.75 -0.5 -0.25 0 0.25 0.5 0.75 1
The results require discussion. Note the positive effect of the fire location being confined to the room and floor. The positive sensitivity implies that increased confinement increases TALL. This is
C:\WEB_CONVERSION_ETC\CONVERSION FOLDER\CONTESTIBLE FUND\NEW\300603_IMPACT ON LIFE SAFETY OF THE TYPE 5 ALARM.DOC⏐ 30 MAY 2003 ⏐ REVISION 6 ⏐ PAGE 29

Impact on Life Safety of the Type 5 Alarm New Zealand Fire Service Commission CRF Research Report
explained, but not necessarily satisfactorily, by the fact that the event trees in diverting to the escalation model are lowering the risk by having disproportionate probability / consequence relationship. Whilst this is not particularly valid, the sensitivity is low enough for it to be ignored, any errors are ‘lost in the noise’. It is also, that this is partially corrected in the sensitivity of the Type 4e where the fire is confined to the room. Another curiosity of Figure 15 is that there are repeat entries for the same input, such as location. This is because the sensitivity analysis is considering the contribution of individual ELLi, calculations. Hence the multiple entries. As the case of fire confinement above, the repeated entries beyond the first are insignificant and so can be ignored. It is also notable, that the variables used within the outcome scenarios do not feature greatly in the sensitivity analysis. Table 13 demonstrates that except for the SCEN 13 and SCEN 16, the P(G<0)i is ‘hit or miss’, that is either close to zero or close to unity. This is expected given that many of the predetermining events such as ‘occupant awake’ or ‘automatic alarm’ lead to great differences in P(G<0).
4.5 Model calibration The model will be calibrated by adjusting the fire incidence data. This statistic is discussed in detail in CHAPTER 2: ‘Probabilities’, specifically section 2.1 ‘Fire incidence’. The fire incidence data is reduced by half a magnitude of order (ie divided by a factor of five). This takes it to 0.034 per annum per 100 beds and brings it in line with USA and Swedish data (0.038 and 0.050 respectively). Qualitatively, this can be justified by assuming that a large number of motels and hotels included in the EIS sample (NZFS 2002) with > 20 beds will not necessarily require a Type 4 alarm because they will be made up of several low rise detached units, and are therefore outside of the sample set of interest. A second area of calibration was considered. The model is clearly conservative in that it doesn’t incorporate a time dimension to barrier failure. Such a sub-model is incorporated in the CESARE-Risk fire growth and smoke spread model (Beck and Zhao (1999)). However, given that the model is not sensitive to the outcome scenario inputs (see above) this was disregarded as likely to produce an insignificant effect.
4.6 Post-calibration results SCEN Type 4 Type 4e Type 7 Type 7e
P(SCEN)
P(G<0) x10-2 ie%
P(SCEN) P(G<0) x10-2 ie%
P(SCEN) P(G<0) x10-2 ie%
P(SCEN) P(G<0) x10-2 ie%
04 2.8 x 10⁻³ 1.2 2.8 x 10⁻³ 1.2 3.6 x 10⁻⁵ 1.2 3.6 x 10⁻⁵ 1.2 05 1.2 x 10⁻⁴ 1.5 1.2 x 10⁻⁴ 1.5 1.6 x 10⁻⁶ 1.5 1.6 x 10⁻⁶ 1.5 06 2.8 x 10⁻⁴ 0.2 2.8 x 10⁻⁴ 0.2 3.6 x 10⁻⁶ 0.2 3.6 x 10⁻⁶ 0.2 09 7.8 x 10⁻⁴ 100 -- -- 1.0 x 10⁻⁵ 100 -- -- 10 3.3 x 10⁻⁵ 3.0 -- -- 4.3 x 10⁻⁷ 3.0 -- -- 11 7.7 x 10⁻⁵ 0.3 -- -- 9.9 x 10⁻⁷ 0.3 -- -- 12 -- -- 7.8 x 10⁻⁴ 100 -- -- 1.0 x 10⁻⁵ 100 13 -- -- 3.3 x 10⁻⁵ 33 -- -- 4.3 x 10⁻⁷ 33 14 -- -- 7.7 x 10⁻⁵ 3 -- -- 9.9 x 10⁻⁷ 3 15 8.6 x 10⁻⁵ 100 8.6 x 10⁻⁵ 100 1.1 x 10⁻⁶ 100 1.1 x 10⁻⁶ 100 16 3.7 x 10⁻⁶ 48 3.7 x 10⁻⁶ 48 4.8 x 10⁻⁸ 48 4.8 x 10⁻⁸ 48 17 8.5 x 10⁻⁶ 5 8.5 x 10⁻⁶ 5 1.1 x 10⁻⁷ 5 1.1 x 10⁻⁷ 5 Table 15: Probability data, post-calibration
C:\WEB_CONVERSION_ETC\CONVERSION FOLDER\CONTESTIBLE FUND\NEW\300603_IMPACT ON LIFE SAFETY OF THE TYPE 5 ALARM.DOC⏐ 30 MAY 2003 ⏐ REVISION 6 ⏐ PAGE 30

Impact on Life Safety of the Type 5 Alarm New Zealand Fire Service Commission CRF Research Report
TYPE
ELL TALL
TYPE 4 4.7 x 10⁻⁴ 9.8 x 10⁻⁶
TYPE 4e 5.6 x 10⁻⁴ 1.2 x 10⁻⁵
TYPE 7 6.1 x 10⁻⁶ 1.3 x 10⁻⁷
TYPE 7e 7.3 x 10⁻⁶ 1.5 x 10⁻⁷
Table 16: Risk profiles, post-calibration
Figure 16: Case study probability density functions of TALL, comparing Types 4 and 4e
Distribution for TYPE 4 TALL/S81
Val
ues
in 1
0^ 3
Values in 10^-6
0
20
40
60
80
100
120
ETA Type 4!S81: Mean=9.834632E-06
ETA Type 4e!S81: Mean=1.171684E-05
0 11.25 22.5 33.75 45
ETA Type 4!S81: Mean=9.834632E-06
ETA Type 4e!S81: Mean=1.171684E-05
Figure 17: Case study probability density functions of TALL, comparing Types 7 and 7e
Distribution for TYPE 7 TALL/S81
Val
ues
in 1
0^ 6
Values in 10^-6
0
1
2
3
4
5
6
ETA Type 7!S81: Mean=1.266445E-07
ETA Type 7e!S81: Mean=1.506007E-07
0 0.3 0.6 0.9 1.2
C:\WEB_CONVERSION_ETC\CONVERSION FOLDER\CONTESTIBLE FUND\NEW\300603_IMPACT ON LIFE SAFETY OF THE TYPE 5 ALARM.DOC⏐ 30 MAY 2003 ⏐ REVISION 6 ⏐ PAGE 31

Impact on Life Safety of the Type 5 Alarm New Zealand Fire Service Commission CRF Research Report
CHAPTER 5: Risk assessment
5.1 Risk evaluation & risk assessment In a conventional risk management process, risk evaluation is concerned about deciding whether a risk is tolerable or not. More formally it is defined as the process to determine risk management priorities by comparing the level of risk against predetermined standards, target risk levels or other criteria. Refer also to Figure 1. Risk assessment is the overall process of risk analysis and risk evaluation This research does not formally evaluate the risks. It is a risk analysis project rather than a risk assessment. Risk evaluation is in the domain of the policy maker and that is not an objective of this research. A risk evaluation process might look at the increased individual risk of the type five alarm by comparing the TALL results of Table 16 and compare these to tolerable criteria. Detailed information on tolerable criteria in fire risk can be found in Wolski et al (2000).
5.2 Individual versus societal risk This research measures fire risk as fatalities per annum per person. It deals with individual risk, ie the risk to a specific building occupant. Another risk measure, that was not used in this research, is societal risk, ie multiple fatality fires. Society is less tolerant of one fire killing 10 people in a year than ten fires killing one. The event trees can be used to calculate societal risk by summing the probabilities of the multiple fatality fires and reporting probabilities of ELL for N (or more) deaths. Unfortunately, because the methodology doesn’t incorporate a fire separation failure sub-model, overly conservative results are obtained for societal risk. As discussed in section 4.3 ‘Model calibration’, individual risk is not sensitive to the lack of such a sub-model, but societal risk is. This is an expected result, since multiple fire fatalities are clearly a function of fire barrier reliability. Future research may incorporate a sub-model for fire barrier failure. For more information on societal risk, refer to Frantzich (1997), Keey (2000) and Vrijling et al (1995).
C:\WEB_CONVERSION_ETC\CONVERSION FOLDER\CONTESTIBLE FUND\NEW\300603_IMPACT ON LIFE SAFETY OF THE TYPE 5 ALARM.DOC⏐ 30 MAY 2003 ⏐ REVISION 6 ⏐ PAGE 32

Impact on Life Safety of the Type 5 Alarm New Zealand Fire Service Commission CRF Research Report
CHAPTER 6: Conclusions The June 2001 revision of the New Zealand Building Code ‘Approved Document C/AS1’ for fire safety (BIA 2001) introduced a new type of fire safety precaution (FSP). Termed a Type 5 alarm, this is applicable within accommodation and multi-unit residential buildings. Essentially, the Type 5 alarm allows localised warning and non-brigade connected alarms in guest suites. This is a departure from previous practice and increases the fire risk to occupants. The benefits are the reduction in unnecessary Fire Service call-out and the reduction in unnecessary total building evacuation. Qualitative arguments supported the new Type 5 alarm. This research develops the following quantitative methodology to measure the increased risk. The analysis is based on four event trees generic to a guest suite fire in an accommodation building, ie the event trees can be applied to most accommodation buildings with a Type 5 alarm. These are paired as; the Type 4 and 4e, and the Type 7 and 7e systems. Non-safe outcomes on each event tree are characterised by generic models comprising of limit state equations of escape time margin. The event trees and limit state equations are populated with probability distributions. The former gained from NZ fire incident statistics and the latter based on Swedish research. A case study is then developed to provide a magnitude for the consequences. The analysis is run in a two-step process using Monte Carlo simulation for each event tree. The first step determines the probability distribution of escape time margin for each potentially life threatening scenario. The second step incorporates this new distribution and calculates probability distributions for expected loss of life for each scenario and sums these and divides by the population for a theoretical annual loss of life, which is the measure of risk. The measure of risk for the complimentary event trees are compared to quantify the increase in life safety. Because the fire origin is assumed in a guest room, which is the point of differentiation of the Type 5, the risk measures are not complete for the whole building but only the subset that will affect a Type 5. For this reason the risk measures should be compared relative to each other. Absolute comparisons should allow for and incorporate the proportion of fire deaths in accommodation buildings that have origins other than in the guest rooms. Table 17 summarises the increase in life safety for the representative case study.
ALARM TYPE TALL Increase TYPE 4 9.8 x 10⁻⁶ TYPE 4e 1.2 x 10⁻⁵ 2.2 x 10⁻⁶
TYPE 7 1.3 x 10⁻⁷ TYPE 7e 1.5 x 10⁻⁷ 2.0 x 10⁻⁸
Table 17: Impact of the Type 5 alarm (case study) It can be seen from Table 17 that the risk increases by about 20%. This research does not comment on the magnitude of the increased risk, as risk evaluation is the domain of the policy maker. However, this research does conclude, that given the ability to measure the risk, decisions such as the introduction of the Type 5 alarm which lower safety, should be supported by a formal and quantitative risk analysis. This research also concludes, that even allowing for sprinkler failure, the risk to life in sprinkler-protected buildings is typically two magnitudes of order better than in non-sprinklered. Therefore, future research using multiple case studies, may give consideration to the cost-benefit of fire safety systems incorporating fire sprinklers without the necessity of smoke alarm systems in corridors, assuming that alarms are required in guest rooms to detect smouldering fires. Future research may also incorporate a sub-model for fire barrier failure as a function of time, to allow for meaningful societal risk calculations.
C:\WEB_CONVERSION_ETC\CONVERSION FOLDER\CONTESTIBLE FUND\NEW\300603_IMPACT ON LIFE SAFETY OF THE TYPE 5 ALARM.DOC⏐ 30 MAY 2003 ⏐ REVISION 6 ⏐ PAGE 33

Impact on Life Safety of the Type 5 Alarm New Zealand Fire Service Commission CRF Research Report
α Fire growth rate (kW.m-2)
Notation
µ Mean (units vary) σ Standard deviation (units vary)
dt∆ Type 5 Alarm delay time (s)
ASET Available safe egress time (s) G Escape time margin (s) q Geometry dependent constant (--) r Geometry dependent constant (--) RSET Required safe egress time (s) S Time to untenable conditions, calculated (s)
dt Detection time, calculated or random variables (s)
1dt Time to automatic smoke detection (s)
2dt Time to manual detection if awake and intimate with fire (s)
3dt Time to manual detection otherwise (s)
4dt Time to automatic thermal (inc. sprinkler) detection (s)
et Occupant movement time, random variable (s)
it Investigation time (from Frantzich) or delayed alarm if Type 5, random variable (s)
rt Occupant response time, random variable (s)
1rt Response time for occupants awake and intimate with the fire (s)
2rt Response time otherwise (s) Us Model uncertainty factor, random variable (--)
C:\WEB_CONVERSION_ETC\CONVERSION FOLDER\CONTESTIBLE FUND\NEW\300603_IMPACT ON LIFE SAFETY OF THE TYPE 5 ALARM.DOC⏐ 30 MAY 2003 ⏐ REVISION 6 ⏐ PAGE 34

Impact on Life Safety of the Type 5 Alarm New Zealand Fire Service Commission CRF Research Report
Beck, V. (1999), and Zhao, L. “CESARE-RISK: An aid for performance-based fire design – Some preliminary results” Proceedings of the Sixth International Symposium, Fire Safety Science pp159-170
References
BIA “Approved Documents for New Zealand Building Code”, Fire Safety, Clauses C1, C2, C3, C4”
Building Industry Authority, Wellington NZ (2001) BSI “Fire safety engineering in buildings. Part 1. Guide to the application of fire safety engineering
principles” Draft for development. DD240 Part1:1997, British Standards Institute (1997) Buchanan, A. H. (Editor) “Fire Engineering Design Guide” 2nd Edition, Centre for Advanced
Engineering, Christchurch, NZ (2001) Budnick, E. K. “Automatic Sprinkler System Reliability” Fire Protection Engineering 9, pp7-12 Society
of Fire Protection Engineers (2001) Chandler, S. E. “Fires in Hotels” Fire Research Note FRN737/68 Fire Research Station,
Borehamwood, UK (1968) Chen, T. Y. “Statistical Analysis of Hospitality Industry Fire Experience” Fire Engineering Research
Report 01/3 University of Canterbury, Christchurch NZ (2001) Frantzich, H. “Fire Safety Risk Analysis of a Hotel” Lund University Research Report 3091, Department
of Fire Safety Engineering, Lund University, Sweden (1997) ISO “Fire safety engineering – Guidance on fire risk assessment” ISO/PDTS 16732 Preparatory Draft
Technical Specification, International Organisation for Standardisation, Geneva (2003) Keey, R. B., “Management of engineering risk” Institution of Professional Engineers (NZ) and the
Centre for Advanced Engineering, Christchurch NZ (2000) Marryat, H. W. “Fire: A century of automatic sprinkler protection in Australia and New Zealand 1886-
1986” Australian Fire Protection Association, Melbourne, Australia (1988) Mintel International Group “The international hotel industry” Travel & Tourism Intelligence,
www.mintel.com (1998) NFPA, “National Fire Alarm Code” NFPA72:2002 National Fire Protection Association, Quincy MA
(2002) NFPA, “Special data information package. High-rise fatal fires, hotel and motel buildings” National Fire
Protection Association, Quincy MA (1999) NZFS “Emergency Incident Statistics” Web-based at www.fire.org.nz, New Zealand Fire Service,
Wellington, NZ (2001) Palisade “Guide to using @RISK Risk Analysis and Simulation Add-in for Microsoft Excel” Palisade
Corporation, Version 4.5 (2002) Peacock, R. D., et al “A User’s Guide for FAST: Engineering Tools for Estimating Fire Growth and
Smoke Transport” NIST Special Publication 921, National Institute of Standards and Technology Gaithersburg, MD (2000)
C:\WEB_CONVERSION_ETC\CONVERSION FOLDER\CONTESTIBLE FUND\NEW\300603_IMPACT ON LIFE SAFETY OF THE TYPE 5 ALARM.DOC⏐ 30 MAY 2003 ⏐ REVISION 6 ⏐ PAGE 35

Impact on Life Safety of the Type 5 Alarm New Zealand Fire Service Commission CRF Research Report
Peacock, R. D., et al “CFAST the Consolidated Model of Fire Growth and Smoke Transport” NIST Technical Note 1299, National Institute of Standards and Technology, Gaithersburg, MD (1993)
Scoones, K “Serious fires in hotels and houses in multiple occupation during 1992” Fire Prevention
275, Fire Protection Association (1994) SNZ “Fire Alarm Systems in Buildings” New Zealand Standard NZS4512:1997 (including Amendment
2), Standards New Zealand, Wellington NZ (1997) SNZ “Fire Detection and Alarm Systems in Buildings” Draft New Zealand Standard DZ4512:2002,
Standards New Zealand, Wellington NZ (2002) SNZ “Risk Management” Joint Australia / New Zealand Standard AS/NZS4360:1999, Standards New
Zealand, Wellington NZ (1999) Statistics NZ “Accommodation survey – Information releases” web-based monthly accommodation
results at www.stats.govt.nz, Statistics New Zealand, Wellington, NZ (2002) Vrijling, J. K., van Hengel, W., and Houben, R. J. “A Framework for Risk Evaluation” Journal of
Hazardous Materials 43 pp245-261 (1995) Warren Centre “Fire Engineering Guidelines” Fire Code Reform Centre, Sydney, Australia (1996) Wolski, A., Dembsey, N. A., and Meacham, B. J. “Accommodating perceptions of risk in
performance-based building fire safety code development” Fire Safety Journal 34 pp297-309 (2000)
C:\WEB_CONVERSION_ETC\CONVERSION FOLDER\CONTESTIBLE FUND\NEW\300603_IMPACT ON LIFE SAFETY OF THE TYPE 5 ALARM.DOC⏐ 30 MAY 2003 ⏐ REVISION 6 ⏐ PAGE 36

Impact on Life Safety of the Type 5 Alarm New Zealand Fire Service Commission CRF Research Report
Appendix A Event trees (post-calibration)
C:\WEB_CONVERSION_ETC\CONVERSION FOLDER\CONTESTIBLE FUND\NEW\300603_IMPACT ON LIFE SAFETY OF THE TYPE 5 ALARM.DOC⏐ 30 MAY 2003 ⏐ REVISION 6 ⏐ PAGE 37

������
����� �
��� �����
���������
����� ��
� �� ��
����� ����
����� ���
�� ���������
��������������
��������������
������
����� !
��"���# $���
%������ &
������������'&
� (&
%���%%���&
%���%%����&
� �&
�������� ��%&
������������&
�������������&
%�� ��
�)��������� �*#��
�������������
���
�%�+���������
,��������
-.
���� ���
��������������
�%�+�� �� ��%���%%����,
-��������
,-/0.
�����������
��� �������!�
�%�+���� ����
�%�+� � (
�%�+� ���� ����%���%%���
1�����"��
,�.
23.
4.
���� ���
����� ������ �
���� ���
�����!������#
���� ���
�����������
�
�%�+���������������
���#����$
��
��%
$�$#����
#!��%
55.
���� ���
�����#!�������
�
�
��%
�%�+����������������
0 �� ����
!�
��%
�
�� �����
�#%
14.
�
���� ���
�����$�$���� �
�%
�
6��!�����
���%
$�
�������
!�%
�%�+�� �� ��%���%%����-
2�����"��
4.
&����'
(��
5�����"��
�%
(��
3!�!�����
� $
��%
!�!�����
���*�
�%�+����%� �
�
##%
1/�4�+4-
� %
���� ���
������$��������#
�%�+� � ��������������� ��%
,44.
(��
,4
$�$�����
�!
$%
�
�������
&����'
$�%
�
�%
�
�
,,
!��!����
��$%
$�
��������
��%
�%�+� ���� ���� � �
!�%
34.
���� ���
�������������
(��
,-
�����"��
##%
�
�%
(��
,1
�����"��
$�%
�
�%
�
�
,�
�����"��
��%
!�%
(��
,0
#�������
� �
��%
#�������
##%
�
�%
(��
,6
$�! ����
� �
�#%
�
�� �����
$�%
�
�%
�
,2
#�������
�%
$�
��$����
!�%
�
,5
��������
#�%
�)��7
$�������
����7
��!�����
��� �����%��8�����%����� ��� ��4� ���,/44
���(�)��7
,/44
�����7
��#$����
()�
��
��
��
��
��
++
−⋅
=�
� ()�
��
��
��
��
��
++
−⋅
=�
�
�=
�
�=
�
�=
�
()�
��
��
��
��
��
++
−⋅
=�
� ()�
��
��
��
��
��
++
−⋅
=�
�
�
���
���
=
�
���
���
=
()�
��
��
��
��
��
++
−⋅
=�
� ()�
��
��
��
��
��
++
−⋅
=�
�
�� �
�� �
�� �
�� �
�� �
�
���
���
=
�� �

�������
����� �
��� ����
���������
����� ��
� �� ��
����� ���
����� ��
�� ���������
��������������
��������������
�������
����� !
��"���# $���
%������� � &
����������'&
� (�&
%����%%��&
%����%%���&
� �&
�������� ��%&
����������&
�����������&
%��� �
�)��������� �*#��
�������������
���
��%�+�������
,��������
-.
���� ���
��������������
��%�+�� �� ��%����%%���,
-��������
,-/0.
�����������
��� �������!�
��%�+���� ���
��%�+� � (�
��%�+� ���� ���%����%%��
1�����"��
,�.
23.
4.
���� ���
����� ������ �
���� ���
�����!������#
���� ���
�����������
�
��%�+���������������
���#����$
��
%
$�$#����
#!��%
55.
���� ���
�����#!�������
�
�
��%
��%�+����������������
0 �� ����
!�
�%
�
�� �����
�#%
14.
�
���� ���
�����$�$���� �
�%
�
6��!�����
���%
$�
�������
!�%
��%�+�� �� ��%����%%���-
2�����"��
4.
&����'
(��
5�����"��
�%
(��
3�����"��
���*�
��%�+����%� �
�
##%
1/�4�+4-
� %
���� ���
������$��������#
��%�+� � ��������������� ��%
4.
(��
,4
�����"��
&����'
$�%
�
�%
�
�
,,
�����"��
��%
��%�+� ���� ��� � �
!�%
34.
���� ���
�������������
(��
,-
!�!�����
� $
��%
!�!�����
##%
�
��%
(��
,1
$�$�����
#$$%
�
�$�����
$�%
�
�%
�
�
,�
!��!����
$%
$�
!�������
��%
!�%
(��
,0
#�������
� �
��%
#�������
##%
�
�%
(��
,6
$�! ����
� �
�#%
�
�� �����
$�%
�
�%
�
,2
#�������
�%
$�
��$����
!�%
�
,5
��������
#�%
�)��7
$�������
����7
��������
���� ����%�8����%����� ���� ��4� ���,/44
����(�)��7
,/44
�����7
� !����
()�
��
��
��
��
��
++
−⋅
=�
� ()�
��
��
��
��
��
++
−⋅
=�
� �
���
���
=
�=
�
�=
�
�=
�
()�
��
��
��
��
��
++
−⋅
=�
� ()�
��
��
��
��
��
��
++
+−
⋅=
�� �
���
���
=
�
���
���
=
()�
��
��
��
��
��
++
−⋅
=�
� ()�
��
��
��
��
��
++
−⋅
=�
�
� ��
� ��
� ��
� ��
� ��
� ��
�������� !�����$��)�*�+���
�
����#
�
�
�
����
����
�� �
�� �
����
����
��$�
��$�
����
����
����
,���%
���%
����%
�� �$�
���$��
�������� ������ ��)�*�+���
�
��
�
�
��
��
$�
����
����
�� �
�� �
����
����
,���%
���%
����%
�� ��
�� ���
������������������)�*�+���
�-��*������).�*���/0.�
�
�
��
$�
��
��
��
!�
#�
��
�
��
��
!�
��
,���%
����%
������
���
�����!������#�)�*�+���
�
� �$���
���
���
��!
��#
���
��
����%
����%
����#�
��� #�
���
������������ �)�*�+���
�
��
�
�
��
��
$�
$�
��
��
��
�����
�����
�����
�����
���!�
���!�
���#�
���#�
�����
�����
����
����%
����%
�����!
������
�������
��������
�
���
���
��
��
���
���
$��
$��
���
���
����
����
�� �
�� �
����
����
��$�
��$�
����
����
����
���%
����%
�����$
����$#
��������#!���������)�*�+���
�
� �$���!#�
�
���
���
��!
��#
���
��
����%
����%
��!#�!
������
��������$�$���� �)�*�+���
�
���
���
��
��
���
���
$��
$��
���
���
����
�� �
��$�
����
����
��!�
,���%
����%
�� ���
������

������
����� �
��� �����
���������
����� ��
� �� ��
����� ����
����� ���
�� ���������
��������������
��������������
������
����� !
��"���# $���
%������ &
������������'&
� (&
%���%%���&
%���%%����&
� �&
�������� ��%&
������������&
�������������&
%�� ��
�)��������� �*#��
�������������
���
�%�+���������
,��������
-.
���� ���
��������������
�%�+�� �� ��%���%%����,
-��������
,-/0.
�����������
��� �������!�
�%�+���� ����
�%�+� � (
�%�+� ���� ����%���%%���
1"� #���"
,2.
�3.
33.
���� ���
����� ������ �
���� ���
�����!������#
���� ���
�����������
�
�%�+���������������
2"��"����
��
$
��"����!
#!��$
44.
���� ���
�����#!�������
�
�
$
�%�+���������������
0 �������
!�
�$
�
��# ���!
�#$
15.
�
���� ���
�����"�"���� �
�$
�
6"�������
�$
"�
�� ���!
!�$
�%�+�� �� ��%���%%����-
������%��
5.
&����'
(��
4��! ����
��$
(��
3���#����
� "
��$
���#����
���*�
�%�+����%� �
�
##$
1/25�+5-
� $
���� ���
������"��������#
�%�+� � ��������������� ��%
,55.
(��
,5
��"����!
�!
"$
�
������!
&����'
"�$
�
�$
�
�
,,
��#!���!
��"$
"�
#�##���#
��$
�%�+� ���� ���� � �
!�$
35.
���� ���
�������������
(��
,-
�����%��
##$
�
�$
(��
,1
�����%��
"�$
�
�$
�
�
,2
�����%��
$
!�$
(��
,0
� ����
� �
��$
� ����
##$
�
�$
(��
,6
��!!���#
� �
�#$
�
��!����!
"�$
�
�$
�
,�
� ����!
�$
"�
��#���!
!�$
�
,4
��������
#�$
�)��7
"�������
����7
���!����
��� �����%��8�����%����� ��� ��5� ���,/55
���(�)��7
,/55
�����7
������!
()�
��
��
��
��
��
++
−⋅
=�
� ()�
��
��
��
��
��
++
−⋅
=�
� �
���
���
=
�=
�
�=
�
�=
�
()�
��
��
��
��
��
++
−⋅
=�
� ()�
��
��
��
��
��
++
−⋅
=�
�
�
���
���
=
�
���
���
=
()�
��
��
��
��
��
++
−⋅
=�
�
()�
��
��
��
��
��
++
−⋅
=�
�
�� �
�� �
�� �
�� �
�� �
�� �

��
��
���
�
���
� �
��
� �
��
��
���
��
���
����
� �
��
�
� ��
��
���
�
��
��
���
�
��
� �
��
����
���
���
��
��
��
���
��
���
��
��
��
���
��
���
��
��
��
��
� �
��
��
!�
��
"#
���
$��
��
��
� �
%
���
��
���
��&
% �
'�%
$�
��
�$$�
�%
$�
��
�$$�
��%
�
�%
����
���
� �
�$%
��
���
���
�
�%
���
��
���
�
��
%$���
��
(�
)�
��
��)
�"
��
��
�������������
���
��$�*
��
��
��
�+
��������
,-
���� ���
��������������
��$�*
�� �
� ��$�
��
�$$�
��+
,��������
+,./
-
�����������
��� �������!�
��$�*
���
� �
��
��$�*
� �
'�
��$�*
� �
���
�
��$
��
��
$$�
�0
"� #���"
+1-
�2-
22-
���� ���
����� ������ �
���� ���
�����!������#
���� ���
�����������
�
��$�*
���
��
���
���
��
��
1"��"����
��
$
��"����!
#!��$
33-
���� ���
�����#!�������
�
�
$
��
$�*
���
��
��
���
���
���
/
�������
!�
�$
�
��# ���!
�#$
04-
�
���� ���
�����"�"���� �
�$
�
5"�������
�$
"�
�� ���!
!�$
��$�*
�� �
� ��$�
��
�$$�
��,
������%��
4-
&����'
(��
3��! ����
��$
(��
2�����%��
��
��
��
�$�*
��
��$
� �
�
##$
0.1
4�
*4,
� $
���� ���
������"��������#
��$�*
� �
���
����
����
���
� �
�$
4-
(��
+4
�����%��
&����'
"�$
�
�$
�
�
++
�����%��
��$
��$�*
� �
���
�
��
� �
!�$
24-
���� ���
�������������
(��
+,
���#����
� "
��$
���#����
##$
�
��$
(��
+0
��"����!
#""$
�
�!�����
"�$
�
�$
�
�
+1
��#!���!
"$
"�
��!!���!
$
!�$
(��
+/
� ����
� �
��$
� ����
##$
�
�$
(��
+5
��!!���#
� �
�#$
�
��!����!
"�$
�
�$
�
+�
� ����!
�$
"�
��#���!
!�$
�
+3
��������
#�$
�(
��6
"�������
��
��6
!�������
"�
���
����
$�
7�
��
�$��
��
� ��
��
��4�
��
�+.4
4
)�
��'�
(�
�6+.4
4�
��
��6
�� ���!
()�
��
��
��
��
��
++
−⋅
=�
� ()�
��
��
��
��
��
++
−⋅
=�
� �
���
���
=
�=
�
�=
�
�=
�
()�
��
��
��
��
��
++
−⋅
=�
� ()�
��
��
��
��
��
��
++
+−
⋅=
�� �
���
���
=
�
���
���
=
()�
��
��
��
��
��
++
−⋅
=�
�
()�
��
��
��
��
��
++
−⋅
=�
�
� ��
� ��
� ��
� ��
� ��
� ��

Impact on Life Safety of the Type 5 Alarm New Zealand Fire Service Commission CRF Research Report
Appendix B Results, pre-calibration
C:\WEB_CONVERSION_ETC\CONVERSION FOLDER\CONTESTIBLE FUND\NEW\300603_IMPACT ON LIFE SAFETY OF THE TYPE 5 ALARM.DOC⏐ 30 MAY 2003 ⏐ REVISION 6 ⏐ PAGE 42

Impact on Life Safety of the Type 5 Alarm New Zealand Fire Service Commission CRF Research Report
Simulation Results forTYPE 4 TALL / S81
Statistic Value %tile ValueMinimum 2.95E-06 5% 2.08E-05Maximum 1.22E-04 10% 2.65E-05Mean 4.90E-05 15% 3.06E-05Std Dev 1.77E-05 20% 3.40E-05Variance 3.13466E-10 25% 3.67E-05Skewness 0.242986004 30% 3.93E-05Kurtosis 2.936347143 35% 4.16E-05Median 4.80E-05 40% 4.36E-05Mode 4.82E-05 45% 4.59E-05Left X 2.08E-05 50% 4.80E-05Left P 5% 55% 5.03E-05Right X 7.94E-05 60% 5.27E-05Right P 95% 65% 5.50E-05Diff X 5.86E-05 70% 5.77E-05Diff P 90% 75% 6.08E-05#Errors 0 80% 6.39E-05Filter Min 85% 6.77E-05Filter Max 90% 7.24E-05#Filtered 0 95% 7.94E-05
Rank Name Regr Corr#1 Yes - awake / $E -0.945 -0.947#2 Yes - location / $ 0.292 0.285#3 Yes - fire start / 0.056 0.052#4 Yes - confirned t 0.040 0.039#5 Yes - confined to 0.037 0.028#6 Yes - incipient / -0.013 -0.018#7 Yes - confined to 0.003 -0.014#8 Yes - location / $ -0.002 0.019#9 alpha / $D$4 0.000 0.012#10 Us / $D$7 0.000 -0.013#11 td3 / $D$12 0.000 -0.012#12 Yes - awake / $E 0.000 0.014#13 Yes - automatic 0.000 0.011#14 Yes - automatic 0.000 0.015#15 Yes - location / $ 0.000 0.015#16 Yes - confined to 0.000 -0.011
Summary Information
Summary Statistics
Sensitivity
Simulation Duration 00:01:58Random Seed 1243287559
Simulation Start Time 4/02/03 09:13Simulation Stop Time 4/02/03 09:15
Number of Outputs 20Sampling Type Latin Hypercube
Number of Iterations 10000Number of Inputs 41
Workbook Name ETA.xlsNumber of Simulations 1
Distribution for TYPE 4 TALL/S81V
alue
s in
10^
3
Values in 10^-6
0
5
10
15
20
25
Mean=4.8987E-05
0 35 70 105 140
Mean=4.8987E-05
Distribution for TYPE 4 TALL/S81
Values in 10^-6
0.000
0.200
0.400
0.600
0.800
1.000
Mean=4.8987E-05
0 35 70 105 1400 35 70 105 140
5% 90% 5% 20.7625 79.3674
Mean=4.8987E-05
Regression Sensitivity for TYPE 4TALL/S81
Std b Coefficients
Yes - awake/E16 .002 Yes - location/C16-.002 Yes - incipient/D8-.003
Yes - confined to floor/K24 .003Yes - location/C16 .003
Yes - incipient/D8-.013 Yes - manual suppression 1.../F12-.016
Yes - automatic alarm/H49-.017Yes - confined to room/J20 .037Yes - confirned to floor/K24 .04Yes - fire start/B41 .056Yes - location/C16 .293
Yes - awake/E16-.945
-1 -0.75 -0.5 -0.25 0 0.25 0.5 0.75 1
C:\WEB_CONVERSION_ETC\CONVERSION FOLDER\CONTESTIBLE FUND\NEW\300603_IMPACT ON LIFE SAFETY OF THE TYPE 5 ALARM.DOC⏐ 30 MAY 2003 ⏐ REVISION 6 ⏐ PAGE 43

Impact on Life Safety of the Type 5 Alarm New Zealand Fire Service Commission CRF Research Report
Simulation Results forTYPE 4e TALL / S81
Statistic Value %tile ValueMinimum 2.84E-06 5% 2.43E-05Maximum 1.70E-04 10% 3.14E-05Mean 5.87E-05 15% 3.62E-05Std Dev 2.17E-05 20% 4.03E-05Variance 4.71292E-10 25% 4.37E-05Skewness 0.28645083 30% 4.68E-05Kurtosis 3.107372412 35% 4.96E-05Median 5.77E-05 40% 5.25E-05Mode 4.81E-05 45% 5.51E-05Left X 2.43E-05 50% 5.77E-05Left P 5% 55% 6.07E-05Right X 9.65E-05 60% 6.32E-05Right P 95% 65% 6.60E-05Diff X 7.22E-05 70% 6.93E-05Diff P 90% 75% 7.28E-05#Errors 0 80% 7.66E-05Filter Min 85% 8.11E-05Filter Max 90% 8.71E-05#Filtered 0 95% 9.65E-05
Rank Name Regr Corr#1 Yes - awake / $E -0.937 -0.933#2 Yes - location / $ 0.290 0.261#3 Yes - confined to -0.129 -0.129#4 Yes - confined to 0.103 0.101#5 Yes - fire start / 0.054 0.041#6 Yes - incipient / -0.013 -0.019#7 Yes - manual su -0.011 -0.024#8 Yes - automatic -0.006 -0.015#9 Us / $D$7 0.000 0.019#10 tr1 / $D$16 0.000 -0.017#11 tr2 / $D$17 0.000 0.015#12 Yes - awake / $E 0.000 0.014#13 Yes - automatic 0.000 -0.018#14 Yes - confined to 0.000 -0.015#15 Yes - automatic 0.000 -0.016#16 Yes - awake / $E 0.000 -0.013
Summary Information
Summary Statistics
Sensitivity
Simulation Duration 00:01:58Random Seed 1243287559
Simulation Start Time 4/02/03 09:13Simulation Stop Time 4/02/03 09:15
Number of Outputs 20Sampling Type Latin Hypercube
Number of Iterations 10000Number of Inputs 41
Workbook Name ETA.xlsNumber of Simulations 1
Distribution for TYPE 4e TALL/S81V
alue
s in
10^
3
Values in 10^-6
02468
101214161820
Mean=5.872821E-05
0 45 90 135 180
Mean=5.872821E-05
Distribution for TYPE 4e TALL/S81
Values in 10^-6
0.000
0.200
0.400
0.600
0.800
1.000
Mean=5.872821E-05
0 45 90 135 1800 45 90 135 180
5% 90% 5% 24.3138 96.4641
Mean=5.872821E-05
Regression Sensitivity for TYPE 4eTALL/S81
Std b Coefficients
Yes - fire start/B41 .002te/D19 .003
Yes - incipient/D8-.004 Yes - automatic alarm/H49-.006
Yes - manual suppression 1.../F12-.011 Yes - incipient/D8-.013
Yes - fire start/B41 .054Yes - confined to floor/K24 .103
Yes - confined to room/J20-.129Yes - location/C16 .29
Yes - awake/E16-.937
-1 -0.75 -0.5 -0.25 0 0.25 0.5 0.75 1
C:\WEB_CONVERSION_ETC\CONVERSION FOLDER\CONTESTIBLE FUND\NEW\300603_IMPACT ON LIFE SAFETY OF THE TYPE 5 ALARM.DOC⏐ 30 MAY 2003 ⏐ REVISION 6 ⏐ PAGE 44

Impact on Life Safety of the Type 5 Alarm New Zealand Fire Service Commission CRF Research Report
Simulation Results forTYPE 7 TALL / S81
Statistic Value %tile ValueMinimum 4.56E-11 5% 6.20E-08Maximum 4.49E-06 10% 1.20E-07Mean 6.27E-07 15% 1.69E-07Std Dev 4.71E-07 20% 2.21E-07Variance 2.21782E-13 25% 2.70E-07Skewness 1.281312287 30% 3.22E-07Kurtosis 5.444135287 35% 3.69E-07Median 5.28E-07 40% 4.22E-07Mode 9.10E-07 45% 4.75E-07Left X 6.20E-08 50% 5.28E-07Left P 5% 55% 5.87E-07Right X 1.53E-06 60% 6.48E-07Right P 95% 65% 7.12E-07Diff X 1.47E-06 70% 7.87E-07Diff P 90% 75% 8.69E-07#Errors 0 80% 9.69E-07Filter Min 85% 1.10E-06Filter Max 90% 1.26E-06#Filtered 0 95% 1.53E-06
Rank Name Regr Corr#1 Yes - automatic -0.822 -0.860#2 Yes - awake / $E -0.452 -0.431#3 Yes - location / $ 0.150 0.124#4 Yes - confined to 0.025 0.020#5 Yes - confined to 0.016 0.025#6 te / $D$19 0.010 -0.020#7 td2 / $D$11 0.000 0.013#8 tr1 / $D$16 0.000 -0.014#9 Yes - confirned t 0.000 -0.012#10 Yes - awake / $E 0.000 0.015#11 Yes - fire start / 0.000 0.011#12 Yes - automatic 0.000 -0.025#13 Yes - location / $ 0.000 -0.016#14 Yes - automatic 0.000 -0.012#15 Yes - confined to 0.000 0.015#16 Yes - fire start / 0.000 0.014
Summary Information
Summary Statistics
Sensitivity
Simulation Duration 00:01:58Random Seed 1243287559
Simulation Start Time 4/02/03 09:13Simulation Stop Time 4/02/03 09:15
Number of Outputs 20Sampling Type Latin Hypercube
Number of Iterations 10000Number of Inputs 41
Workbook Name ETA.xlsNumber of Simulations 1
Distribution for TYPE 7 TALL/S81V
alue
s in
10^
6
Values in 10^-6
0.000
0.200
0.400
0.600
0.800
1.000
1.200
Mean=6.268438E-07
0 1.125 2.25 3.375 4.5
Mean=6.268438E-07
Distribution for TYPE 7 TALL/S81
Values in 10^-6
0.000
0.200
0.400
0.600
0.800
1.000
Mean=6.268438E-07
0 1.125 2.25 3.375 4.50 1.125 2.25 3.375 4.5
90% 5% .062 1.5343
Mean=6.268438E-07
Regression Sensitivity for TYPE 7TALL/S81
Std b Coefficients
Us/D7-.006
Yes - automatic alarm/H49-.007 Yes - incipient/D8-.009
te/D19 .01 Yes - manual suppression 1.../F12-.012
Yes - confined to room/K24 .017Yes - confined to room/J20 .025Yes - fire start/B41 .034Yes - location/C16 .15
Yes - awake/E16-.452 Yes - automatic suppressio.../G16-.822
-1 -0.75 -0.5 -0.25 0 0.25 0.5 0.75 1
C:\WEB_CONVERSION_ETC\CONVERSION FOLDER\CONTESTIBLE FUND\NEW\300603_IMPACT ON LIFE SAFETY OF THE TYPE 5 ALARM.DOC⏐ 30 MAY 2003 ⏐ REVISION 6 ⏐ PAGE 45

Impact on Life Safety of the Type 5 Alarm New Zealand Fire Service Commission CRF Research Report
Simulation Results forTYPE 7e TALL / S81
Statistic Value %tile ValueMinimum 8.71E-11 5% 7.51E-08Maximum 5.64E-06 10% 1.42E-07Mean 7.59E-07 15% 2.05E-07Std Dev 5.78E-07 20% 2.67E-07Variance 3.34291E-13 25% 3.24E-07Skewness 1.352747996 30% 3.85E-07Kurtosis 5.985296617 35% 4.39E-07Median 6.36E-07 40% 5.04E-07Mode 8.14E-07 45% 5.67E-07Left X 7.51E-08 50% 6.36E-07Left P 5% 55% 7.06E-07Right X 1.87E-06 60% 7.77E-07Right P 95% 65% 8.65E-07Diff X 1.79E-06 70% 9.60E-07Diff P 90% 75% 1.06E-06#Errors 0 80% 1.18E-06Filter Min 85% 1.33E-06Filter Max 90% 1.53E-06#Filtered 0 95% 1.87E-06
Rank Name Regr Corr#1 Yes - automatic -0.814 -0.859#2 Yes - awake / $E -0.451 -0.434#3 Yes - location / $ 0.140 0.119#4 Yes - confined to -0.062 -0.053#5 Yes - confined to 0.050 0.038#6 Yes - fire start / 0.024 0.038#7 Yes - location / $ -0.010 -0.012#8 Yes - manual su -0.008 -0.020#9 alpha / $D$4 0.000 -0.012#10 td2 / $D$11 0.000 -0.013#11 te / $D$19 0.000 0.010#12 Yes - automatic 0.000 -0.013#13 Yes - confined to 0.000 -0.018#14 Yes - confined to 0.000 -0.020#15 Yes - incipient / 0.000 0.011#16 Yes - automatic 0.000 0.015
Summary Information
Summary Statistics
Sensitivity
Simulation Duration 00:01:58Random Seed 1243287559
Simulation Start Time 4/02/03 09:13Simulation Stop Time 4/02/03 09:15
Number of Outputs 20Sampling Type Latin Hypercube
Number of Iterations 10000Number of Inputs 41
Workbook Name ETA.xlsNumber of Simulations 1
Distribution for TYPE 7e TALL/S81V
alue
s in
10^
3
Values in 10^-6
0100200300400500
600700800900
Mean=7.588829E-07
0 1.5 3 4.5 6
Mean=7.588829E-07
Distribution for TYPE 7e TALL/S81
Values in 10^-6
0.000
0.200
0.400
0.600
0.800
1.000
Mean=7.588829E-07
0 1.5 3 4.5 60 1.5 3 4.5 6
90% 5% .0751 1.8664
Mean=7.588829E-07
Regression Sensitivity for TYPE 7eTALL/S81
Std b Coefficients
tr1/D16-.006
Yes - manual suppression 1.../F12-.008
Yes - location/C16-.01
Yes - fire start/B41 .024
Yes - confined to floor/K24 .05
Yes - confined to room/J20-.062
Yes - location/C16 .14
Yes - awake/E16-.452
Yes - automatic suppressio.../G16-.814
-1 -0.75 -0.5 -0.25 0 0.25 0.5 0.75 1
C:\WEB_CONVERSION_ETC\CONVERSION FOLDER\CONTESTIBLE FUND\NEW\300603_IMPACT ON LIFE SAFETY OF THE TYPE 5 ALARM.DOC⏐ 30 MAY 2003 ⏐ REVISION 6 ⏐ PAGE 46

Impact on Life Safety of the Type 5 Alarm New Zealand Fire Service Commission CRF Research Report
Appendix C Results, post-calibration
C:\WEB_CONVERSION_ETC\CONVERSION FOLDER\CONTESTIBLE FUND\NEW\300603_IMPACT ON LIFE SAFETY OF THE TYPE 5 ALARM.DOC⏐ 30 MAY 2003 ⏐ REVISION 6 ⏐ PAGE 47

Impact on Life Safety of the Type 5 Alarm New Zealand Fire Service Commission CRF Research Report
Simulation Results forTYPE 4 TALL / S81
Statistic Value %tile ValueMinimum 4.85E-07 5% 3.74E-06Maximum 3.62E-05 10% 4.86E-06Mean 9.83E-06 15% 5.69E-06Std Dev 4.12E-06 20% 6.35E-06Variance 1.69563E-11 25% 6.95E-06Skewness 0.629209875 30% 7.46E-06Kurtosis 3.706575717 35% 7.96E-06Median 9.40E-06 40% 8.44E-06Mode 8.25E-06 45% 8.94E-06Left X 3.74E-06 50% 9.40E-06Left P 5% 55% 9.91E-06Right X 1.72E-05 60% 1.04E-05Right P 95% 65% 1.10E-05Diff X 1.34E-05 70% 1.17E-05Diff P 90% 75% 1.24E-05#Errors 0 80% 1.31E-05Filter Min 85% 1.40E-05Filter Max 90% 1.53E-05#Filtered 0 95% 1.72E-05
Rank Name Regr Corr#1 Yes - awake / $E -0.811 -0.816#2 Yes - fire start / 0.480 0.465#3 Yes - location / $ 0.255 0.246#4 Yes - confined to 0.036 0.020#5 Yes - confirned t 0.035 0.036#6 Yes - automatic -0.014 -0.014#7 Yes - manual su -0.013 -0.016#8 alpha / $D$4 0.000 -0.011#9 Us / $D$7 0.000 0.027#10 tr2 / $D$17 0.000 -0.013#11 Yes - incipient / 0.000 -0.012#12 Yes - location / $ 0.000 0.011#13 Yes - confined to 0.000 0.016#14 Yes - confined to 0.000 -0.020#15 Yes - location / $ 0.000 -0.019#16 Yes - confined to 0.000 -0.019
Summary Information
Summary Statistics
Sensitivity
Simulation Duration 00:01:48Random Seed 2078304831
Simulation Start Time 5/02/03 18:36Simulation Stop Time 5/02/03 18:38
Number of Outputs 32Sampling Type Latin Hypercube
Number of Iterations 10000Number of Inputs 38
Workbook Name ETA.xlsNumber of Simulations 1
Distribution for TYPE 4 TALL/S81V
alue
s in
10^
3
Values in 10^-6
0
20
40
60
80
100
120
Mean=9.834632E-06
0 10 20 30 40
Mean=9.834632E-06
Distribution for TYPE 4 TALL/S81
Values in 10^-6
0.000
0.200
0.400
0.600
0.800
1.000
Mean=9.834632E-06
0 10 20 30 400 10 20 30 40
5% 90% 5% 3.7435 17.1899
Mean=9.834632E-06
Regression Sensitivity for TYPE 4TALL/S81
Std b Coefficients
Yes - manual suppression 1.../F12-.012
Yes - incipient/D8-.014
Yes - automatic alarm/H49-.014
Yes - confirned to floor/K24 .034
Yes - confined to room/J20 .036
Yes - location/C16 .255
Yes - fire start/B41 .48
Yes - awake/E16-.811
-1 -0.75 -0.5 -0.25 0 0.25 0.5 0.75 1
C:\WEB_CONVERSION_ETC\CONVERSION FOLDER\CONTESTIBLE FUND\NEW\300603_IMPACT ON LIFE SAFETY OF THE TYPE 5 ALARM.DOC⏐ 30 MAY 2003 ⏐ REVISION 6 ⏐ PAGE 48

Impact on Life Safety of the Type 5 Alarm New Zealand Fire Service Commission CRF Research Report
Simulation Results forTYPE 4e TALL / S81
Statistic Value %tile ValueMinimum 6.95E-07 5% 4.45E-06Maximum 4.09E-05 10% 5.76E-06Mean 1.17E-05 15% 6.70E-06Std Dev 5.00E-06 20% 7.47E-06Variance 2.49516E-11 25% 8.16E-06Skewness 0.656482892 30% 8.82E-06Kurtosis 3.709723762 35% 9.44E-06Median 1.12E-05 40% 1.00E-05Mode 9.59E-06 45% 1.06E-05Left X 4.45E-06 50% 1.12E-05Left P 5% 55% 1.18E-05Right X 2.08E-05 60% 1.25E-05Right P 95% 65% 1.32E-05Diff X 1.64E-05 70% 1.39E-05Diff P 90% 75% 1.47E-05#Errors 0 80% 1.56E-05Filter Min 85% 1.68E-05Filter Max 90% 1.83E-05#Filtered 0 95% 2.08E-05
Rank Name Regr Corr#1 Yes - awake / $E -0.814 -0.817#2 Yes - fire start / 0.466 0.445#3 Yes - location / $ 0.251 0.235#4 Yes - confined to -0.107 -0.089#5 Yes - confined to 0.082 0.063#6 Yes - incipient / -0.013 -0.024#7 Yes - automatic -0.010 0.014#8 Yes - manual su 0.004 0.016#9 Us / $D$7 0.000 0.014#10 td3 / $D$12 0.000 -0.017#11 Yes - confirned t 0.000 0.012#12 Yes - incipient / 0.000 0.014#13 Yes - manual su 0.000 0.018#14 Yes - incipient / 0.000 0.023#15 Yes - manual su 0.000 0.014#16 Yes - automatic 0.000 0.013
Summary Information
Summary Statistics
Sensitivity
Simulation Duration 00:01:48Random Seed 2078304831
Simulation Start Time 5/02/03 18:36Simulation Stop Time 5/02/03 18:38
Number of Outputs 32Sampling Type Latin Hypercube
Number of Iterations 10000Number of Inputs 38
Workbook Name ETA.xlsNumber of Simulations 1
Distribution for TYPE 4e TALL/S81V
alue
s in
10^
3
Values in 10^-6
01020304050
60708090
Mean=1.171684E-05
0 11.25 22.5 33.75 45
Mean=1.171684E-05
Distribution for TYPE 4e TALL/S81
Values in 10^-6
0.000
0.200
0.400
0.600
0.800
1.000
Mean=1.171684E-05
0 11.25 22.5 33.75 450 11.25 22.5 33.75 45
5% 90% 5% 4.4521 20.823
Mean=1.171684E-05
Regression Sensitivity for TYPE 4eTALL/S81
Std b Coefficients
Yes - manual suppression 1.../F12 .004
Yes - manual suppression 1.../F12-.01
Yes - automatic alarm/H49-.01
Yes - incipient/D8-.013
Yes - confined to floor/K24 .083
Yes - confined to room/J20-.107
Yes - location/C16 .251
Yes - fire start/B41 .466
Yes - awake/E16-.814
-1 -0.75 -0.5 -0.25 0 0.25 0.5 0.75 1
C:\WEB_CONVERSION_ETC\CONVERSION FOLDER\CONTESTIBLE FUND\NEW\300603_IMPACT ON LIFE SAFETY OF THE TYPE 5 ALARM.DOC⏐ 30 MAY 2003 ⏐ REVISION 6 ⏐ PAGE 49

Impact on Life Safety of the Type 5 Alarm New Zealand Fire Service Commission CRF Research Report
Simulation Results forTYPE 7 TALL / S81
Statistic Value %tile ValueMinimum 2.08E-11 5% 1.18E-08Maximum 9.65E-07 10% 2.34E-08Mean 1.27E-07 15% 3.29E-08Std Dev 1.01E-07 20% 4.30E-08Variance 1.01614E-14 25% 5.33E-08Skewness 1.580214865 30% 6.27E-08Kurtosis 7.137097876 35% 7.17E-08Median 1.03E-07 40% 8.15E-08Mode 1.09E-07 45% 9.20E-08Left X 1.18E-08 50% 1.03E-07Left P 5% 55% 1.16E-07Right X 3.21E-07 60% 1.29E-07Right P 95% 65% 1.43E-07Diff X 3.09E-07 70% 1.57E-07Diff P 90% 75% 1.73E-07#Errors 0 80% 1.95E-07Filter Min 85% 2.22E-07Filter Max 90% 2.58E-07#Filtered 0 95% 3.21E-07
Rank Name Regr Corr#1 Yes - automatic -0.776 -0.834#2 Yes - awake / $E -0.433 -0.416#3 Yes - fire start / 0.256 0.217#4 Yes - location / $ 0.141 0.116#5 Yes - confined to 0.019 0.011#6 td3 / $D$12 0.000 -0.015#7 Yes - incipient / 0.000 0.017#8 Yes - manual su 0.000 0.015#9 Yes - location / $ 0.000 0.018#10 Yes - confined to 0.000 0.021#11 Yes - incipient / 0.000 0.013#12 Yes - manual su 0.000 0.019#13 Yes - awake / $E 0.000 -0.012#14 Yes - manual su 0.000 -0.013#15 Yes - awake / $E 0.000 -0.012#16 Yes - confined to 0.000 -0.011
Summary Information
Summary Statistics
Sensitivity
Simulation Duration 00:01:48Random Seed 2078304831
Simulation Start Time 5/02/03 18:36Simulation Stop Time 5/02/03 18:38
Number of Outputs 32Sampling Type Latin Hypercube
Number of Iterations 10000Number of Inputs 38
Workbook Name ETA.xlsNumber of Simulations 1
Distribution for TYPE 7 TALL/S81V
alue
s in
10^
6
Values in 10^-6
0
1
2
3
4
5
6
Mean=1.266445E-07
0 0.25 0.5 0.75 1
Mean=1.266445E-07
Distribution for TYPE 7 TALL/S81
Values in 10^-6
0.000
0.200
0.400
0.600
0.800
1.000
Mean=1.266445E-07
0 0.25 0.5 0.75 10 0.25 0.5 0.75 1
90% 5% .0118 .3209
Mean=1.266445E-07
Regression Sensitivity for TYPE 7TALL/S81
Std b Coefficients
alpha/D4 .006
Yes - incipient/D8-.007
Yes - automatic alarm/H49-.011
Yes - confined to room/J20 .016
Yes - confined to room/K24 .019
Yes - location/C16 .141
Yes - fire start/B41 .256
Yes - awake/E16-.433
Yes - automatic suppressio.../G16-.777
-1 -0.75 -0.5 -0.25 0 0.25 0.5 0.75 1
C:\WEB_CONVERSION_ETC\CONVERSION FOLDER\CONTESTIBLE FUND\NEW\300603_IMPACT ON LIFE SAFETY OF THE TYPE 5 ALARM.DOC⏐ 30 MAY 2003 ⏐ REVISION 6 ⏐ PAGE 50

Impact on Life Safety of the Type 5 Alarm New Zealand Fire Service Commission CRF Research Report
Simulation Results forTYPE 7e TALL / S81
Statistic Value %tile ValueMinimum 1.41E-11 5% 1.48E-08Maximum 1.06E-06 10% 2.66E-08Mean 1.51E-07 15% 3.82E-08Std Dev 1.19E-07 20% 5.00E-08Variance 1.4067E-14 25% 6.16E-08Skewness 1.433990115 30% 7.33E-08Kurtosis 6.213695574 35% 8.53E-08Median 1.24E-07 40% 9.74E-08Mode 1.14E-07 45% 1.11E-07Left X 1.48E-08 50% 1.24E-07Left P 5% 55% 1.38E-07Right X 3.79E-07 60% 1.53E-07Right P 95% 65% 1.70E-07Diff X 3.64E-07 70% 1.88E-07Diff P 90% 75% 2.10E-07#Errors 0 80% 2.34E-07Filter Min 85% 2.65E-07Filter Max 90% 3.10E-07#Filtered 0 95% 3.79E-07
Rank Name Regr Corr#1 Yes - automatic -0.780 -0.825#2 Yes - awake / $E -0.438 -0.414#3 Yes - fire start / 0.251 0.234#4 Yes - location / $ 0.132 0.109#5 Yes - confined to -0.048 -0.053#6 Yes - confined to 0.045 0.029#7 Yes - awake / $E 0.008 0.019#8 td3 / $D$12 0.000 -0.013#9 tr1 / $D$16 0.000 -0.017#10 Yes - confined to 0.000 0.026#11 Yes - incipient / 0.000 -0.015#12 Yes - manual su 0.000 0.012#13 Yes - location / $ 0.000 0.014#14 Yes - confined to 0.000 -0.012#15 Yes - awake / $E 0.000 -0.020#16 Yes - automatic 0.000 0.015
Summary Information
Summary Statistics
Sensitivity
Simulation Duration 00:01:48Random Seed 2078304831
Simulation Start Time 5/02/03 18:36Simulation Stop Time 5/02/03 18:38
Number of Outputs 32Sampling Type Latin Hypercube
Number of Iterations 10000Number of Inputs 38
Workbook Name ETA.xlsNumber of Simulations 1
Distribution for TYPE 7e TALL/S81V
alue
s in
10^
6
Values in 10^-6
0.0000.5001.0001.5002.0002.500
3.0003.5004.0004.500
Mean=1.506007E-07
0 0.3 0.6 0.9 1.2
Mean=1.506007E-07
Distribution for TYPE 7e TALL/S81
Values in 10^-6
0.000
0.200
0.400
0.600
0.800
1.000
Mean=1.506007E-07
0 0.3 0.6 0.9 1.20 0.3 0.6 0.9 1.2
90% 5% .0148 .3792
Mean=1.506007E-07
Regression Sensitivity for TYPE 7eTALL/S81
Std b Coefficients
Yes - automatic alarm/H49 .007
Yes - awake/E16 .008
Yes - confined to floor/K24 .045
Yes - confined to room/J20-.048
Yes - location/C16 .132
Yes - fire start/B41 .251
Yes - awake/E16-.438
Yes - automatic suppressio.../G16-.78
-1 -0.75 -0.5 -0.25 0 0.25 0.5 0.75 1
C:\WEB_CONVERSION_ETC\CONVERSION FOLDER\CONTESTIBLE FUND\NEW\300603_IMPACT ON LIFE SAFETY OF THE TYPE 5 ALARM.DOC⏐ 30 MAY 2003 ⏐ REVISION 6 ⏐ PAGE 51