fire safety in the united states since 1980
TRANSCRIPT

THROUGH THE LENS OF THE NFPA FIRE & LIFE SAFETY ECOSYSTEM
Marty Ahrens & Birgitte Messerschmidt I NFPA 2021
Fire Safety in the United States since 1980
Copyright © 2021 National Fire Protection Association (NFPA)

2
Executive Summary
The number of fires and fire deaths in the United States has reduced dramatically since 1980. A lot of progress has been
made in the years since the America Burning report was published in 1973. However, the success in taming fire, one of humanity’s oldest enemies, has unfortunately led to fire safety taking a back seat to other societal concerns that seem more pressing. To better understand the role of fire in today’s society, we must examine the various factors that have contributed to the decline in the number of fires and fire deaths and identify areas where work is still needed. As a result, fire incident data and existing research have been studied in detail and analyzed against the framework of what is known as the NFPA Fire & Life Safety Ecosystem.
The NFPA Fire & Life Safety analysis shows that the most successful recipe for fire safety in the built environment is the implementation of fire safety technologies through mandated codes and standards. Buildings such as hospitals, nursing homes, schools, and hotels have seen stricter requirements for fire safety in the last four decades and, as a result, catastrophic fires in these types of buildings are now rare. For homes, we have seen a decline in the number of deaths per 1,000 reported fires in apartment buildings, while there has been an increase in the deaths in less regulated one- and two-family homes.
The biggest success story, especially in relation to home fires, is the increasing presence of smoke alarms. The combination of an engineered solution enforced by codes and standards and supported by public education has been effective in bringing down the number of reported fires and fire deaths. Adding sprinklers as an additional safety layer further reduces the fire death rate confirming their positive impact seen in other occupancies.
Most of the common causes of fire are related to human actions or lack thereof. One of the ways to tackle this issue is with continued public education alerting people to the potential dangers of fire and how to prevent them. Another method is reducing the ignition risk by utilizing fire safety standards specific to the products involved. Successful implementation of product standards to reduce fire risk has been seen, for example, with the safety standard
“A lot of progress has been made in the years since the America Burning report was published in 1973. However, the success in taming fire, one of humanity’s oldest enemies, has unfortunately led to fire safety taking a back seat to other societal concerns that seem more pressing.”
“The NFPA Fire & Life Safety analysis shows that the most successful recipe for fire safety in the built environment is the implementation of fire safety technologies through mandated codes and standards.”
“The biggest success story, especially in relation to home fires, is the increasing presence of smoke alarms.”

3
for cigarette lighters and the voluntary product standard for candles. Implementation of both of these standards was followed by a decrease in the overall number of fires. In addition, the cigarette lighter standard is also considered to have had a big impact on the reduction of fire deaths of young children.
Despite the overall decline in the number of fires and fire deaths, the NFPA Fire & Life Safety Ecosystem analysis also uncovered areas where more work is necessary. Cooking remains the leading cause of home fires and home fire injuries, and it is one of the leading causes of home fire deaths. Cooking is the only major cause of fire that resulted in more fires and fire deaths in 2014–2018 than in 1980–1984, which emphasizes the need for fire safety solutions in this area. The UL fire safety standards for new electric coil ranges are a step in the right direction, but more work is needed to ensure that something as simple as food preparation does not lead to death and destruction.
Upholstered furniture and beds are vital to comfortable homes. However, it appears that what we have gained in comfort in the last few decades has come at the cost of safety. There has been some success in reducing the ignition potential of furniture over the years, but some of these tactics have caused further concerns about the health effects of flame retardants. This is an example of how efforts to reduce one problem can exacerbate others if you are not looking at the issue holistically. Work continues in this area to ensure we can be comfortable and fire safe in our homes without causing other health challenges.
Smoking has been the leading cause of home fire deaths for most of the last four decades, showing that educating people about the fire risk associated with smoking has not been enough to prevent these fires. Another tactic was taken by the introduction of Reduced Ignition
Executive Summary
“Cooking is the only major cause of fire that resulted in more fires and fire deaths in 2014–2018 than in 1980–1984.”
COOKING is the #1
cause of home fires and home fire injuries.
SMOKING has been the
leading cause of home fire
deaths in most of the last
four decades.

4
Propensity Cigarettes intended to prevent the ignition of furniture by cigarettes. However, the data does not yet tell a clear story about their impact.
We have been successful in dramatically reducing the number of fire deaths of children under five, but there has been little change in the death toll of older adults. Several factors contribute to older adult fire death toll, including the increasing age of the population overall, older adults increasingly living alone, the increase in disabilities with age, and the tendency for older adults to live in older homes. To reverse this trend, we must dedicate new research to understanding the fire risks impacting older adults and the possible mitigation measures.
One of the biggest challenges to fire safety in the United States going forward is wildfire. Wildfire is becoming the dominant type of fire that causes catastrophic multiple deaths as well as large losses. The framework of the NFPA Fire & Life Safety Ecosystem has proven to be successful in reducing the structure fire problem. Now we need to apply the lessons learned to prevent wildfires from becoming modern-day conflagrations when impacting communities in the wildland/urban interface (WUI). Outthink Wildfire™, an NFPA policy initiative, outlines five tenets for all levels of government to foster collaboration, enact change, achieve resilience, and enhance protection from wildfire.
A lack of code compliance is a common factor in catastrophic fires in nightclubs and other assemblies. The low priority of investment in safety is also often called out in these events in particular related to sprinklers not being installed. The importance of code enforcement in fire safety should not be underestimated.
Many fatal home fires and home fire deaths can be traced back to a lack of Investment in Safety, from something as simple as not maintaining smoke alarms to using inexpensive, unskilled labor to work on electrical systems or heating systems.
Executive Summary
“Wildfire is becoming the dominant type of fire that causes catastrophic multiple deaths as well as large losses. The framework of the NFPA Fire & Life Safety Ecosystem has proven to be successful in reducing the structure fire problem. Now we need to apply the lessons learned to prevent wildfires from becoming modern-day conflagrations when impacting communities in the wildland/urban interface (WUI).”
“We have been successful in dramatically reducing the number of fire deaths of children under five, but there has been little change in the death toll of older adults.”

5
Fire and life safety is impacted by factors that are not immediately apparent in the NFPA Fire & Life Safety Ecosystem. Because of public health messages on secondhand smoke, fewer households allow indoor smoking and, hence, have reduced the risk of a smoking-related home structure fire. Also, anti-pollution regulations and requirements limiting the use of woodstoves might be contributing to the reduction in chimney fires. The concern about energy use and the production of greenhouse gases has led many people to switch from incandescent light bulbs to LEDs or compact fluorescents, reducing the risk of a fire started by an electrical light. Unfortunately, the same environmental concern also introduce unintended fire safety challenges, such as the increased use of new technologies and products developed without accounting for their impact on fire and life safety. More work is needed to ensure a holistic approach to fire safety and energy efficiency.
The NFPA Fire & Life Safety Ecosystem has been instrumental in reducing the number of fires and fire deaths since 1980, and it will continue to be so as we attempt to solve the issues highlighted in this study. Approaching fire safety as a system, and not individual bits and pieces, provides an opportunity to unravel this complex and ongoing challenge to society.
Executive Summary
“The NFPA Fire & Life Safety Ecosystem has been instrumental in reducing the number of fires and fire deaths since 1980, and it will continue to be so as we attempt to solve the issues highlighted in this study. Approaching fire safety as a system, and not individual bits and pieces, provides an opportunity to unravel this complex and ongoing challenge to society.”
“The importance of code enforcement in fire safety should not be underestimated.”

6
Acknowledgements
This project was sponsored and executed by NFPA with administrative oversight provided by the Fire Protection Research Foundation in accordance with its advisory services policies. NFPA appreciates the
project management by the Fire Protection Research Foundation Executive Director Amanda Kimball, the guidance provided by the project technical panelists, and the support provided by our NFPA colleagues: Greg Harrington, Chad Duffy, Michele Steinberg, and Nancy Schwartz.
Project Technical Panel
Peter J. Ashley, HUD
Scott Ayers, CPSC
Liza Bowles, Newport Partners
Otto Drozd, Seminole County, FL (Metro Chiefs representative)
Veronica Helms Garrison, HUD
Casey Grant, DSRAE
Meghan Housewright, NFPA
Chris Jelenewicz, SFPE
Bruce Johnson, UL
Karyl Kinsey, Austin, TX Fire Department (retired)
Eileen McDonald, Johns Hopkins Bloomberg School of Public Health
Jon Narva, NASFM Representative
Jeff Sargent, NFPA
Kevin Sehlmeyer, IFMA Representative
Beth Tubbs, ICC
Research Team
Marty Ahrens, NFPA
Birgitte Messerschmidt, NFPA
Project Sponsor
Lorraine Carli, NFPA
Keywords: Fire Safety, Fire Incident Data, Fire & Life Safety Ecosystem, Home Fires, Fire Trends, Fire Statistics.
NFPA No. USS114

7
Executive Summary ............................................2
Acknowledgements ............................................6
Project Technical Panel ..................................6
Research Team ................................................6
Project Sponsor ..............................................6
Introduction ........................................................8
The NFPA Fire & Life Safety Ecosystem ............9
Government Responsibility ..........................10
Development and Use of Current Codes ....10
Referenced Standards ..................................10
Investment in Safety .....................................10
Skilled Workforce ...........................................11
Code Compliance ..........................................11
Preparedness and Emergency Response ....11
Informed Public .............................................11
Home Structure Fires ....................................... 12
Data Trends ................................................... 13
The Impact of Fire Protection Technologies ................................................. 15
Smoke Alarms........................................... 15
Home Fire Sprinklers ................................ 19
High Rise Apartment Fires ....................... 21
Impact of Fire Vulnerability ..........................25
Victims of Home Structure Fires .............25
Changing Demographics Among High-Rise Apartment Occupants ........... 29
Age of Housing ......................................... 30
Causes of Home Structure Fires .................33
Smoking ....................................................33
Heating ......................................................35
Electrical Distribution and Lighting .........37
Cooking .................................................... 39
Playing with Fire ....................................... 40
Candles ...................................................... 41
Intentional Firesetting ............................. 42
Furniture ....................................................... 43
Impact of the NFPA Fire & Life Safety Ecosystem .................................................... 44
Government Responsibility ..................... 44
Development and Use of Current Codes ............................................ 46
Informed Public ........................................47
Hospitals........................................................... 48
Impact of the NFPA Fire & Life Safety Ecosystem .................................................... 48
Government Responsibility ..................... 48
Nursing Homes ................................................ 49
Impact of the NFPA Fire & Life Safety Ecosystem .................................................... 49
Government Responsibility ..................... 49
Catastrophic Multiple-Death Fires ................. 50
Impact of the NFPA Fire & Life Safety Ecosystem .....................................................53
Code Compliance .....................................53
Wildland/Urban Interface (WUI) .................... 54
Impact of the NFPA Fire & Life Safety Ecosystem .................................................... 56
Government Responsibility ..................... 56
Informed Public ........................................57
Preparedness and Emergency Response ...............................57
Discussion ........................................................ 58
Conclusion ....................................................... 63
Table of Contents

8
Introduction
While we are currently seeing fewer fires in the US than in past decades, statistically, if a fire is reported in your
home, you are more likely to die today than you were 40 years ago. Today’s homes with their synthetic furnishings and open floor plans burn faster than homes did in the past.1 Occupants might have fewer than three minutes to escape after a fire starts. Every 24 seconds, a US fire department responds to a fire somewhere in the country. Nationwide, a civilian died in a fire every 3 hours and 10 minutes and a home fire injury occurred every 43 minutes.2 So, even though we have made considerable progress, we still have work to do.
This study looks at fire data and other research to provide an analysis of what has impacted fire safety in the United States in the last 40 years. Through the lens of the NFPA Fire & Life Safety
Ecosystem,3 we highlight successes, new and ongoing challenges, and opportunities for improvement. Increasing the understanding of what has impacted fire safety can help identify what needs to be done to continue improving all aspects of fire and life safety.
The main focus of this study is on reported fires in homes, as home structure fires have consistently accounted for the largest share of reported structure fires and the majority of the reported civilian fire deaths and injuries. The term home includes one- and two-family homes, including manufactured homes, and apartments. For the purposes of this analysis, residential condominiums are considered apartments.
The study also analyzes fires involving hospitals and nursing homes, as well as catastrophic multiple-death fires and fires in the wildland/urban interface (WUI), as they have the potential to cause significant human loss. This study does not discuss fires where the primary loss is financial, such as fires in industrial, warehouse, or other types of business occupancies.
1 Kerber, Stephen, “Analysis of Changing Residential Fire Dynamics and Its Implications on Firefighter Operational Timeframes,” Fire Technology 48 (2012): p. 865-891.
2 Marty Ahrens and Ben Evarts. Fire Loss in the United States During 2019; NFPA; September 2020. https://www.nfpa.org/ecosystem
3 https://www.congress.gov/116/bills/hr748/BILLS-116hr748enr.pdf
The time occupants have to escape a fire.
A U.S. fire department responds to a fire.
A home fire injury occurs in the U.S.
24EverySECONDS...
43EveryMINUTES...
Less thanMINUTES...
3
“While we are currently seeing fewer fires in the US than in past decades, statistically, if a fire is reported in your home, you are more likely to die today than you were 40 years ago.”

9
The NFPA Fire & Life Safety Ecosystem
The NFPA Fire & Life Safety Ecosystem is a framework for safety made up of eight key elements that play a critical role in
fire, life, and electrical safety. The elements are government responsibility, development and use of current codes, referenced standards, investment in safety, a skilled workforce, code compliance, preparedness and emergency
response, and an informed public. When all these elements work together, the result is a fully functioning system that can benefit everyone. If one or more of the elements fails, the system breaks down and tragedy can occur. We can almost always trace the cause (of a tragedy) back to a breakdown of at least one of the elements.
Figure 1. The NFPA Fire & Life Safety Ecosystem

10
The NFPA Fire & Life Safety Ecosystem
Government ResponsibilityAll levels of government have a responsibility to maintain an effective policy and regulatory environment that supports fire, life and electrical
safety. Spending priorities should be dictated by public safety needs and not by special interests. The role of government is essential, as most people believe that their safety is secured through policies and regulations even though government regulations (model codes and regulations) provide only the accepted level of safety, which might not agree with what people expect.
Development and Use of Current CodesOpen, transparent, and regularly updated building and fire prevention codes, which are developed with
broad stakeholder engagement based on fire safety principles, are key to the NFPA Fire & Life Safety Ecosystem. Codes and standards developing organizations around the world update their codes and standards on a set schedule or via a continuous process, providing the opportunity to incorporate learnings from recent research, technological advances, case studies, loss experience, and proven best practices.
Even if the latest versions of codes and standards perfectly reflected today’s hazards, another challenge remains — their use. Leaving outdated codes and standards in use can prevent the latest knowledge from being used to keep the public safe.
Referenced StandardsSafety codes developed by national or worldwide experts as well as national regulations often reference other codes and standards, listed products,
and documents. These referenced elements are foundational parts of the codes/regulations and must be considered. This ensures the minimum level of safety established by the codes/regulations. Referenced standards provide critical
guidance to designers, installers, facility operators, and enforcers, all of whom share the responsibility for safety in the built environment.
As with codes and regulations, it is important to ensure that the latest knowledge is used to develop and update the referenced standards. Especially for fire test standards for products and systems, it is important to continuously evaluate if what we test and the resulting data are relevant in today’s built environment.
Investment in SafetySafety should always be a priority for policy makers, designers, contractors, businesses, occupants, and building owners, including
homeowners. However, too often, safety is taken for granted and, sometimes unknowingly, it can take a back seat to higher economic gain. Fire safety is measured in the number of fires, deaths, and injuries and, for many countries, these numbers have declined significantly over the last 40 years. This success has led to complacency about the risks associated with fire at all levels. Homeowners often invest in comforts and aesthetics before considering upgrading safety systems beyond the minimum required in codes and regulations. Meanwhile, policy makers have allowed economic and market share concerns of special interests to influence regulations. If decisions are based solely on financial gains, tragedies can occur.
Investing in safety also means investing in research into all aspects of the fire problem. Public funding for fire research has declined over the last 30 years and researchers often rely on sponsorships from industry. While it is great that some industries understand the importance of fire research, relying purely on this type of funding will lead to research that is focused on specific products and/or solutions. Fundamental research is needed to answer the remaining questions about fire and its consequences. This requires unbiased funding in addition to industry sponsorships.
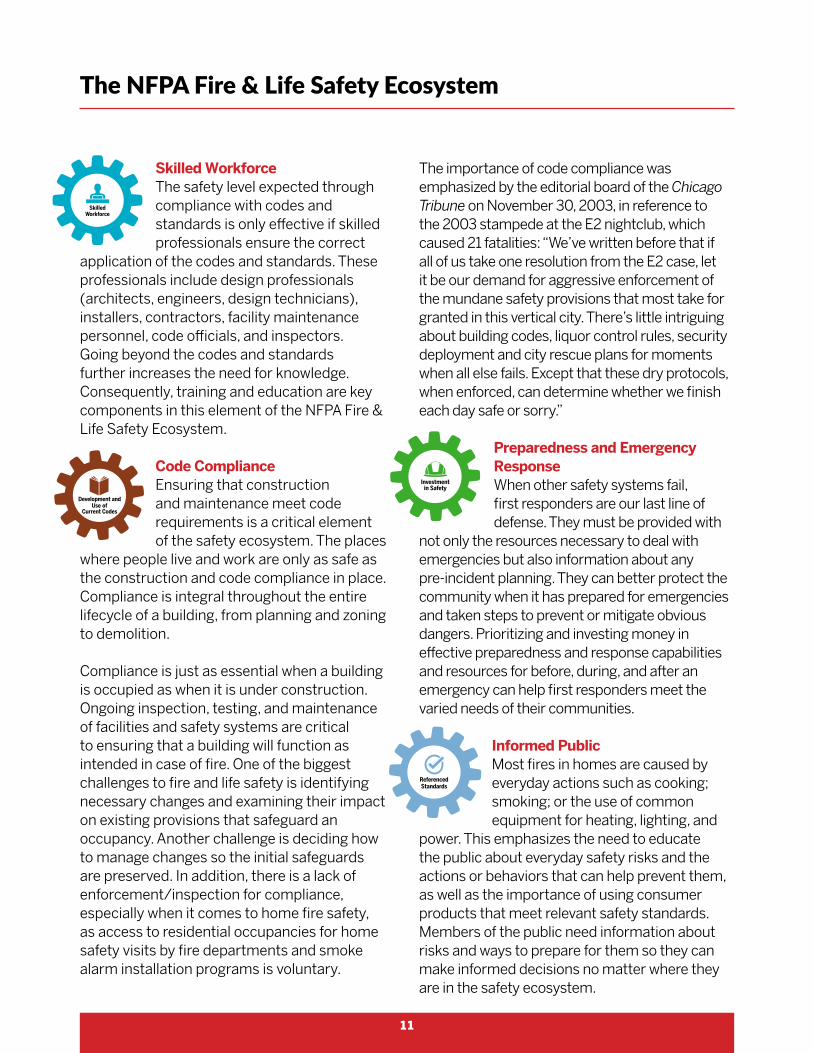
11
The NFPA Fire & Life Safety Ecosystem
Skilled WorkforceThe safety level expected through compliance with codes and standards is only effective if skilled professionals ensure the correct
application of the codes and standards. These professionals include design professionals (architects, engineers, design technicians), installers, contractors, facility maintenance personnel, code officials, and inspectors. Going beyond the codes and standards further increases the need for knowledge. Consequently, training and education are key components in this element of the NFPA Fire & Life Safety Ecosystem.
Code ComplianceEnsuring that construction and maintenance meet code requirements is a critical element of the safety ecosystem. The places
where people live and work are only as safe as the construction and code compliance in place. Compliance is integral throughout the entire lifecycle of a building, from planning and zoning to demolition.
Compliance is just as essential when a building is occupied as when it is under construction. Ongoing inspection, testing, and maintenance of facilities and safety systems are critical to ensuring that a building will function as intended in case of fire. One of the biggest challenges to fire and life safety is identifying necessary changes and examining their impact on existing provisions that safeguard an occupancy. Another challenge is deciding how to manage changes so the initial safeguards are preserved. In addition, there is a lack of enforcement/inspection for compliance, especially when it comes to home fire safety, as access to residential occupancies for home safety visits by fire departments and smoke alarm installation programs is voluntary.
The importance of code compliance was emphasized by the editorial board of the Chicago Tribune on November 30, 2003, in reference to the 2003 stampede at the E2 nightclub, which caused 21 fatalities: “We’ve written before that if all of us take one resolution from the E2 case, let it be our demand for aggressive enforcement of the mundane safety provisions that most take for granted in this vertical city. There’s little intriguing about building codes, liquor control rules, security deployment and city rescue plans for moments when all else fails. Except that these dry protocols, when enforced, can determine whether we finish each day safe or sorry.”
Preparedness and Emergency ResponseWhen other safety systems fail, first responders are our last line of defense. They must be provided with
not only the resources necessary to deal with emergencies but also information about any pre-incident planning. They can better protect the community when it has prepared for emergencies and taken steps to prevent or mitigate obvious dangers. Prioritizing and investing money in effective preparedness and response capabilities and resources for before, during, and after an emergency can help first responders meet the varied needs of their communities.
Informed PublicMost fires in homes are caused by everyday actions such as cooking; smoking; or the use of common equipment for heating, lighting, and
power. This emphasizes the need to educate the public about everyday safety risks and the actions or behaviors that can help prevent them, as well as the importance of using consumer products that meet relevant safety standards. Members of the public need information about risks and ways to prepare for them so they can make informed decisions no matter where they are in the safety ecosystem.
12
Home Structure Fires
Data Trends
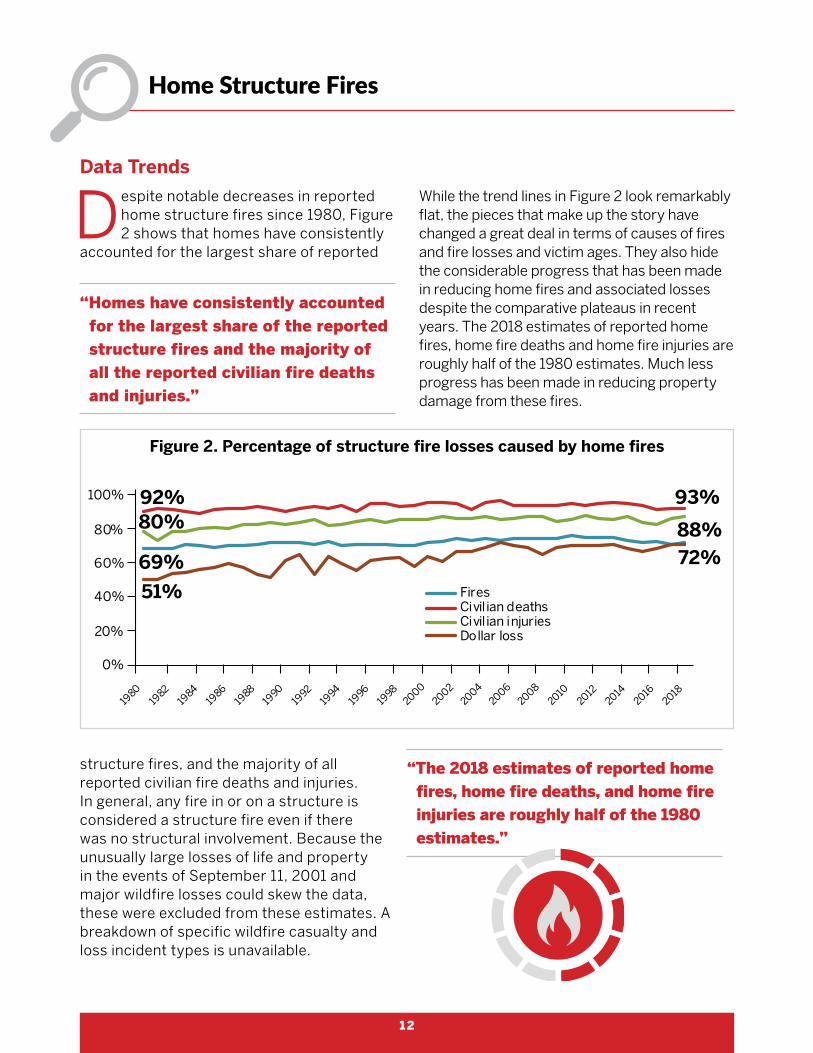
Despite notable decreases in reported home structure fires since 1980, Figure 2 shows that homes have consistently
accounted for the largest share of reported
Figure 2. Percentage of structure fire losses caused by home fires
structure fires, and the majority of all reported civilian fire deaths and injuries. In general, any fire in or on a structure is considered a structure fire even if there was no structural involvement. Because the unusually large losses of life and property in the events of September 11, 2001 and major wildfire losses could skew the data, these were excluded from these estimates. A breakdown of specific wildfire casualty and loss incident types is unavailable.
While the trend lines in Figure 2 look remarkably flat, the pieces that make up the story have changed a great deal in terms of causes of fires and fire losses and victim ages. They also hide the considerable progress that has been made in reducing home fires and associated losses despite the comparative plateaus in recent years. The 2018 estimates of reported home fires, home fire deaths and home fire injuries are roughly half of the 1980 estimates. Much less progress has been made in reducing property damage from these fires.
69%
92% 93%80% 88%
51%
72%
0%
20%
40%
60%
80%
100%
1980
1982
1984
1986
1988
1990
1992
1994
1996
1998
20002002
20042006
20082010
20122014
20162018
FiresCivilian deathsCivilian injuriesDollar loss
“Homes have consistently accounted for the largest share of the reported structure fires and the majority of all the reported civilian fire deaths and injuries.”
“The 2018 estimates of reported home fires, home fire deaths, and home fire injuries are roughly half of the 1980 estimates.”

13
Figure 3. Reported home structure fires and associated losses, by year: 1980–2018
Progress in reducing the toll of home fires is even greater when the increase in population is considered. Population-based rates for home fires, home fire deaths, and home fire injuries were three-fifths to two-thirds lower in 2018 than in 1980, while per capita home fire dollar loss was roughly one-third lower.
5,200
2,720
0
1,000
2,000
3,000
4,000
5,000
6,000
1980
1982
1984
1986
1988
1990
1992
1994
1996
1998
20002002
20042006
20082010
20122014
20162018
B. Deaths
734,000
363,000
0
100,000
200,000
300,000
400,000
500,000
600,000
700,000
800,000
1980
1982
1984
1986
1988
1990
1992
1994
1996
1998
20002002
20042006
20082010
20122014
20162018
A. Fires
19,700
11,200
0
5,000
10,000
15,000
20,000
25,000
1980
1982
1984
1986
1988
1990
1992
1994
1996
1998
20002002
20042006
20082010
20122014
20162018
C. Injuries
$8.7 $8.0
$0.0
$2.0
$4.0
$6.0
$8.0
$10.0
$12.0
1980
1982
1984
1986
1988
1990
1992
1994
1996
1998
20002002
20042006
20082010
20122014
20162018
D. Property loss in billions(Adjusted to 2018 dollars)
Home Structure Fires
Fire injuries & home fire dollar loss
Trending down compared to 1980

14
Home Structure Fires
Figure 4. Reported home structure fires and losses: population-based rates by year: 1980–2018
Although reported home fires and home fire deaths have been cut roughly in half since 1980, and population-based home fire and fire death rates have fallen by roughly two-thirds, the death rate per 1,000 reported home fires has remained fairly consistent and was slightly higher in most recent years than it was in 1980 as shown in Figure 5.
This was driven by an even more pronounced increase in the death rate in one- or two-family home fires. It appears that most of the reduction in fire deaths and death rate
per capita over the past decades has been due to a reduction in fires or reported fires rather than the prevention of harm after a fire is reported. The role of the ecosystem in this reduction is explored further in this document.
$38.4
$24.5
0
5
10
15
20
25
30
35
40
45
1980
1982
1984
1986
1988
1990
1992
1994
1996
1998
20002002
20042006
20082010
20122014
20162018
Do
llar
loss
pe
r ca
pit
a
D. Dollar loss per capita in 2018 dollars
3.2
1.1
0
1
1
2
2
3
3
4
1980
1982
1984
1986
1988
1990
1992
1994
1996
1998
20002002
20042006
20082010
20122014
20162018
Fir
es
pe
r th
ou
san
d p
op
ula
tio
n
A. Fire rates per thousand population
87
34
0
20
40
60
80
100
1980
1982
1984
1986
1988
1990
1992
1994
1996
1998
20002002
20042006
20082010
20122014
20162018
Inju
rie
s p
er
mill
ion
po
pu
lati
on
C. Injuries per million population
22.9
8.3
0
5
10
15
20
25
1980
1982
1984
1986
1988
1990
1992
1994
1996
1998
20002002
20042006
20082010
20122014
20162018
De
ath
s p
er
mill
ion
po
pu
lati
on
B. Deaths per million population
“The death rate per 1,000 reported home fires has remained fairly consistent and was slightly higher in more recent years than it was in 1980.”

15
Home Structure Fires
Figure 5. Deaths per 1,000 reported home fires by year and occupancy
7.5
7.1 8.5
4.2
0
2
4
6
8
10
12
1980
1982
1984
1986
1988
1990
1992
1994
1996
1998
20002002
20042006
20082010
20122014
20162018
De
ath
s p
er
1,0
00
Fir
es
All homes
1- or 2-familyApartments
Smoke AlarmsBefore discussing smoke alarms, it is necessary to understand the terminology. In the early decades of smoke detection, all such devices were called smoke detectors. Over time, a distinction was made between smoke alarms, which detected smoke and provided a warning, and smoke detectors, which, as part of a system, detected smoke and transmitted a signal to another device that provided the warning. This report uses
the term smoke alarm to describe any device or system that warns occupants of fire.
The 1976 edition of NFPA 101®, Life Safety Code®, was the most current edition in 1980. It required an electrically powered smoke alarm in each unit of apartment buildings that would notify occupants only within the affected unit. One- and two-family dwellings were also required to have at least one alarm. In new construction of these properties, the alarm was required to be electrically powered, but existing properties were allowed to have battery-powered alarms. Existing dwellings are still permitted to use battery-powered smoke alarms. The code has evolved over the years to require additional smoke alarms (e.g., one on each level and inside and in the immediate vicinity of sleeping rooms).
The Impact of Fire Protection Technologies

16
Home Structure Fires
The widespread use of smoke alarms in homes has been one of the biggest success stories in fire safety in the past 50 years. In a 2000 presentation on the history of smoke alarms, John Hall4 reported that an estimated 4 percent of US homes had fire detectors in 1970. This increased to 22 percent by 1977. From 1999 on, 95 percent to 97 percent of households (surveyed by phone) reported having at least one smoke alarm. The increase in the use of smoke alarms tracks the decrease in the number of fires and fire deaths, showing the significant impact of this technology.
Figure 6 shows the growth in home smoke alarm use based on telephone surveys.5 Households without telephones were not included. Self-reporting might overstate the presence of smoke alarms or working smoke alarms. Estimates of the reported home fires in homes with smoke alarms were derived from NFIRS and NFPA annual fire experience survey. Many fire departments and public health organizations have created programs to increase smoke alarm use in high-risk households. These programs often found that larger percentages of these homes were lacking smoke alarms or working smoke alarms.
“The widespread use of smoke alarms in homes has been one of the biggest success stories in fire safety in the past 50 years.”
4 John R. Hall, Jr. A Brief History of Smoke Alarms. Quincy, MA: NFPA, 2000.
5 Source for homes with smoke alarms: 1977, 1980, and 1982 estimates from sample surveys by the US Fire Administration; 1983–1995 estimates from Louis Harris surveys, Prevention Magazine; “1997 Fire Awareness Survey for NFPA”; “1999 NFPA National Fire Escape Survey”; “2004 Fire Prevention Week survey for NFPA,” Harris Interactive; CPSC‘s Michael A. Greene and Craig Andres, 2004–2005 National Sample Survey of Unreported Residential Fires, 2009; “Smoke Alarm Omnibus Question Report,” 2008; Harris Poll National Quorum; “National Fire Protection Association — Smoke Alarms,” September 2010.
Figure 6. Growth in home smoke alarm usage: 1977–2010
22
50
6774
76
778281
85
8688
9092
9596
9796
96
18
53
73 74
78
10 40
20
40
60
80
100
1977
1979
1981
1983
1985
1987
1989
1991
1993
1995
1997
1999
20012003
20052007
20092011
20132015
2017Per
cen
t o
f h
om
es w
ith
sm
ok
e al
arm
s
Homes with smoke alarms
Reported home fires with smoke alarms
Homes with NO smoke alarms
Due to the uncertainty of estimates during the transition to NFIRS 5.0 in 1999–2001, estimates of fires in these years were not included.
17
Home Structure Fires
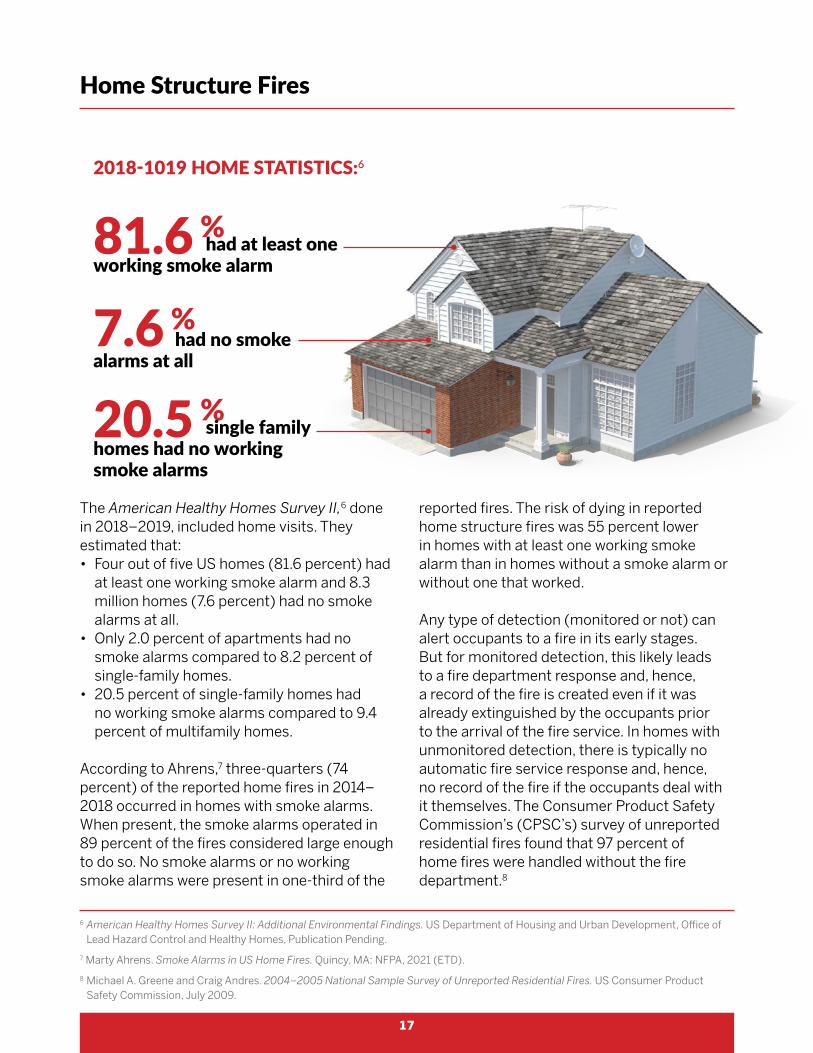
The American Healthy Homes Survey II,6 done in 2018–2019, included home visits. They estimated that:• Four out of five US homes (81.6 percent) had
at least one working smoke alarm and 8.3 million homes (7.6 percent) had no smoke alarms at all.
• Only 2.0 percent of apartments had no smoke alarms compared to 8.2 percent of single-family homes.
• 20.5 percent of single-family homes had no working smoke alarms compared to 9.4 percent of multifamily homes.
According to Ahrens,7 three-quarters (74 percent) of the reported home fires in 2014–2018 occurred in homes with smoke alarms. When present, the smoke alarms operated in 89 percent of the fires considered large enough to do so. No smoke alarms or no working smoke alarms were present in one-third of the
reported fires. The risk of dying in reported home structure fires was 55 percent lower in homes with at least one working smoke alarm than in homes without a smoke alarm or without one that worked.
Any type of detection (monitored or not) can alert occupants to a fire in its early stages. But for monitored detection, this likely leads to a fire department response and, hence, a record of the fire is created even if it was already extinguished by the occupants prior to the arrival of the fire service. In homes with unmonitored detection, there is typically no automatic fire service response and, hence, no record of the fire if the occupants deal with it themselves. The Consumer Product Safety Commission’s (CPSC’s) survey of unreported residential fires found that 97 percent of home fires were handled without the fire department.8
6 American Healthy Homes Survey II: Additional Environmental Findings. US Department of Housing and Urban Development, Office of Lead Hazard Control and Healthy Homes, Publication Pending.
7 Marty Ahrens. Smoke Alarms in US Home Fires. Quincy, MA: NFPA, 2021 (ETD).
8 Michael A. Greene and Craig Andres. 2004–2005 National Sample Survey of Unreported Residential Fires. US Consumer Product Safety Commission, July 2009.
81.6 %
7.6 %
had at least one working smoke alarm
had no smoke alarms at all
20.5 % single family homes had no working smoke alarms
2018-1019 HOME STATISTICS:6
18
Home Structure Fires
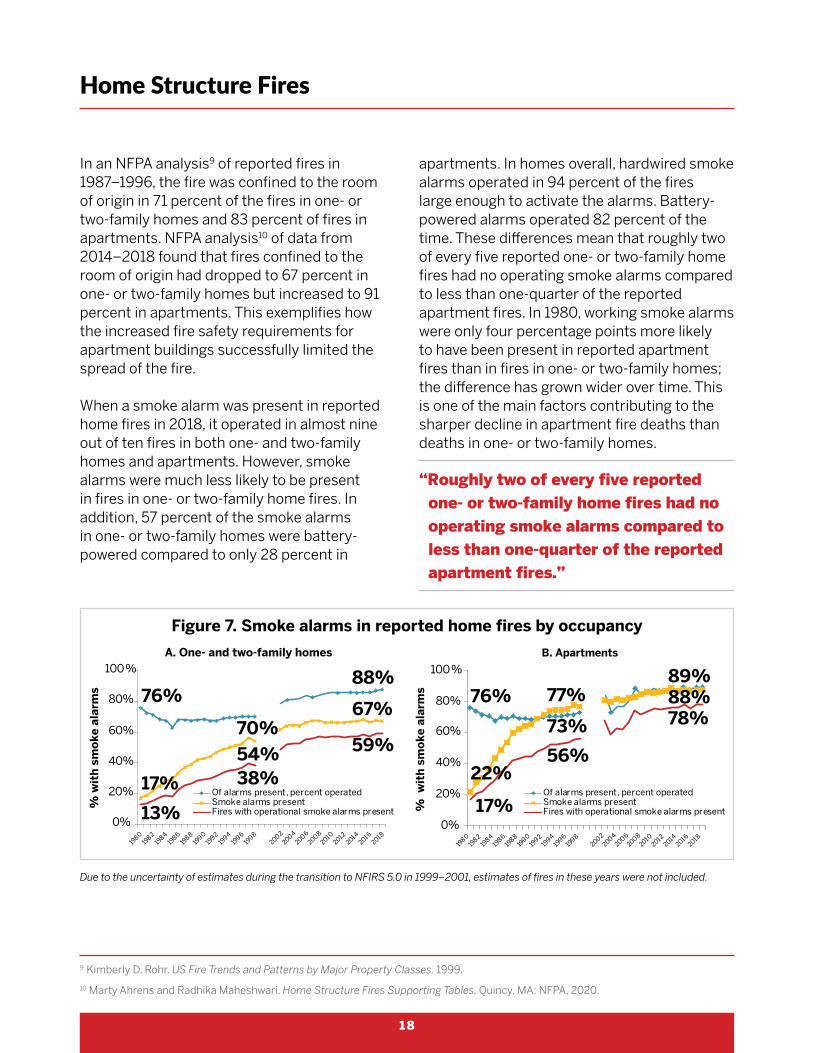
In an NFPA analysis9 of reported fires in 1987–1996, the fire was confined to the room of origin in 71 percent of the fires in one- or two-family homes and 83 percent of fires in apartments. NFPA analysis10 of data from 2014–2018 found that fires confined to the room of origin had dropped to 67 percent in one- or two-family homes but increased to 91 percent in apartments. This exemplifies how the increased fire safety requirements for apartment buildings successfully limited the spread of the fire.
When a smoke alarm was present in reported home fires in 2018, it operated in almost nine out of ten fires in both one- and two-family homes and apartments. However, smoke alarms were much less likely to be present in fires in one- or two-family home fires. In addition, 57 percent of the smoke alarms in one- or two-family homes were battery-powered compared to only 28 percent in
apartments. In homes overall, hardwired smoke alarms operated in 94 percent of the fires large enough to activate the alarms. Battery-powered alarms operated 82 percent of the time. These differences mean that roughly two of every five reported one- or two-family home fires had no operating smoke alarms compared to less than one-quarter of the reported apartment fires. In 1980, working smoke alarms were only four percentage points more likely to have been present in reported apartment fires than in fires in one- or two-family homes; the difference has grown wider over time. This is one of the main factors contributing to the sharper decline in apartment fire deaths than deaths in one- or two-family homes.
9 Kimberly D. Rohr. US Fire Trends and Patterns by Major Property Classes. 1999.
10 Marty Ahrens and Radhika Maheshwari. Home Structure Fires Supporting Tables. Quincy, MA: NFPA, 2020.
“Roughly two of every five reported one- or two-family home fires had no operating smoke alarms compared to less than one-quarter of the reported apartment fires.”
Figure 7. Smoke alarms in reported home fires by occupancy
76%
73%
89%
22%
77% 88%
17%
56%
78%
0%
20%
40%
60%
80%
100%
1980
1982
1984
1986
1988
1990
1992
1994
1996
1998
20022004
20062008
20102012
20142016
2018
% w
ith
sm
ok
e al
arm
s
B. Apartments
76%
70%
88%
17%
54%
67%
13%
38%
59%
0%
20%
40%
60%
80%
100%
1980
1982
1984
1986
1988
1990
1992
1994
1996
1998
20022004
20062008
20102012
20142016
2018
% w
ith
sm
ok
e al
arm
s
A. One- and two-family homes
Of alarms present, percent operatedSmoke alarms presentFires with operational smoke alarms present
Of alarms present, percent operatedSmoke alarms presentFires with operational smoke alarms present
Due to the uncertainty of estimates during the transition to NFIRS 5.0 in 1999–2001, estimates of fires in these years were not included.

19
Home Structure Fires
11 Mark Pertschuk, et al., “Grassroots Movement Building and Preemption in the Campaign for Residential Fire Sprinklers.” American Journal of Public Health 103 (2013): p. 1780–1787. https://ajph.aphapublications.org/doi/full/10.2105/AJPH.2013.301317
12 Marty Ahrens. US Experience with Sprinklers. Quincy, MA: NFPA, 2017.
Figure 8. Average fire death rate per 1,000 reported home structure fires by presence of smoke alarms and automatic extinguishing systems (AES):
2014–2018
12.0
7.8 5.9
3.7 1.1
0
5
10
15
No alarmor AES
Battery alarmbut no AES
Any alarmbut no AES
Hardwired alarmbut no AES
Hardwired smokealarm and sprinkler
DDeeaa
tthhss
ppeerr
11,,00
0000
ffiirr
eess
Home Fire SprinklersSmoke alarms are a key part of home fire protection, as they provide an essential early warning. However, they cannot control a fire or help those who are not able to take action to save themselves. Fire sprinklers can control a fire until the fire department arrives and thereby provide more time for safe evacuation. The risk of fire death per 1,000 reported home fires steadily declines as the levels of fire protection increase. Figure 8 shows that the death rate is lowest in homes with fire sprinklers and hardwired smoke alarms. These rates are based on the presence of fire sprinklers and hardwired smoke alarms in reported fires only. Again, homes include one- and two-family dwellings and apartments. Note that monitored smoke alarms are likely to be hardwired and to result in a fire
department response. It is likely that many people who were alerted to a small fire by a battery-powered smoke alarm handled the situation without calling the fire department. This could result in an underestimate of the effectiveness of battery-powered smoke alarms when focusing on the death rate per 1,000 reported fires.
In a 2013 article, Mark Pertshuk, et. al.11 described how a grassroots movement started in the late 1970s led to the passage of 360 ordinances requiring residential fire sprinklers in all new residential construction across the US, including one- and two-family dwellings.
“The risk of fire death per 1,000 reported home fires steadily declines as the levels of fire protection increase.”
“The death rate per 1,000 reported home fires was 86 percent lower in fires in which fire sprinklers were present compared to fires in homes with no automatic extinguishing system.”

20
Home Structure Fires
13 2011 National Health and Safety Characteristics — All Occupied Units, Variable 1, Units by Structure Type. American Housing Survey Table Creator, US Census Bureau. https://www.census.gov/programs-surveys/ahs/tech-documentation/user-notes/ahs-table-creator-release-notes.html. Accessed on March 23, 2017.
Figure 9. Percentage of occupied units with sprinklers in 2011 American Housing Survey
31%22%
15%9%
5%14%
8%2%
1%5%
0% 10% 20% 30% 40%
In buildings with 50 or more units
In buildings with 20-49 units
In buildings with 10-19 units
In buildings with 5-9 units
In buildings with 2-4 units
In all multi-unit buildings
Single-family attached
Single-family detached homes
Manufactured homes
Year-round housing
According to Ahrens,12 1 percent of the reported home fires in 1980–1984 occurred in homes that had some type of automatic extinguishing equipment. In 2014–2018, fire sprinklers were present in 7 percent of reported home fires. They operated in 95 percent of fires that were considered large enough to expect activation and were effective in controlling the fire in 97 percent of the fires in which they operated. Taken together, when fire sprinklers were present in home fires large enough to activate them, they operated 92 percent of the time. The death rate per 1,000 reported home fires was 86 percent lower
in fires in which fire sprinklers were present compared to fires in homes with no automatic extinguishing system.
According to the 2011 American Housing Survey,13 buildings with more housing units were more likely to have fire sprinklers. Figure 9 shows that 5 percent of housing units occupied year-round had sprinklers, ranging from a low of 1 percent in manufactured homes to a high of 31 percent in buildings with at least 50 units. Note that NFIRS groups townhouses with apartments.
FIRE SPRINKLERS control 97% of the fires in which they operate.
21
Figure 10. Reported fires, fire deaths, and death rates per 1,000 reported fires in high-rise apartments: 1985–1989, 1994–1998, and 2014–2018
6.05.1
3.4
0.0
2.0
4.0
6.0
8.0
1985–1989 1994–1998 2014–2018
Dea
ths
per
1,0
00
fire
s
C. Deaths per 1,000 reported fires
62
44 29
0
1020
30
4050
6070
1985–1989 1994–1998 2014–2018
B. Deaths
10,400 8,700 8,600
0
2,000
4,000
6,000
8,000
10,000
12,000
1985–1989 1994–1998 2014–2018
A. Fires
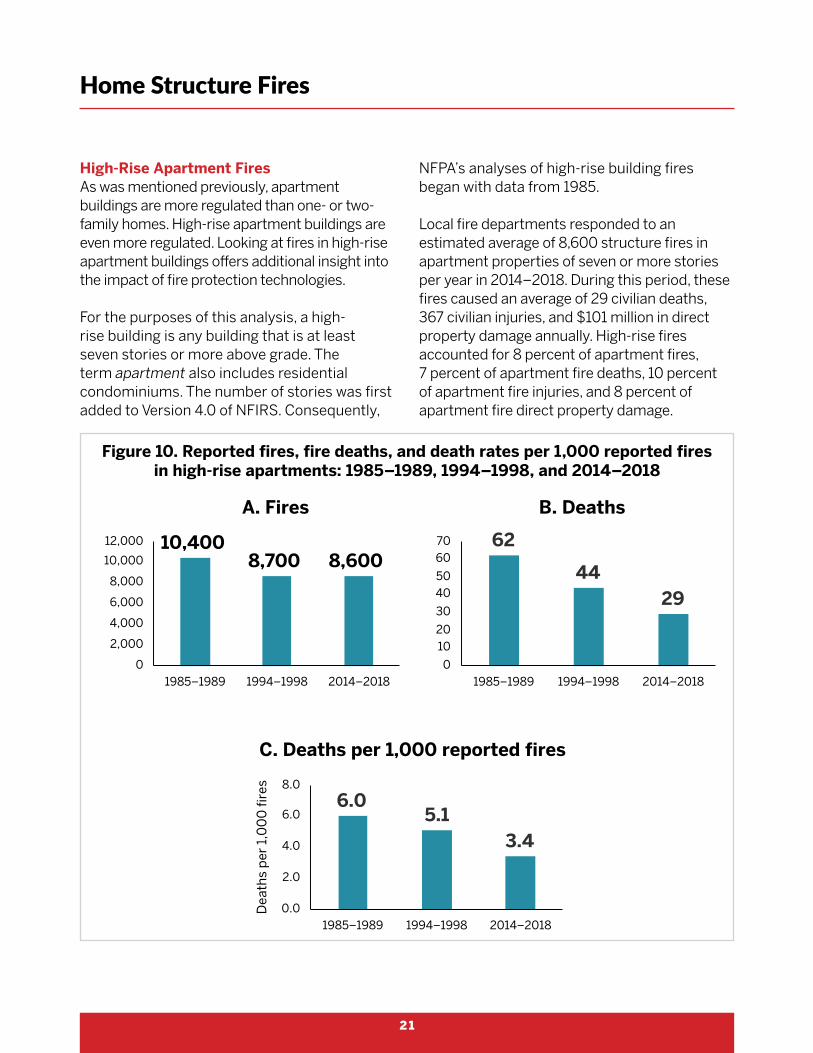
High-Rise Apartment FiresAs was mentioned previously, apartment buildings are more regulated than one- or two-family homes. High-rise apartment buildings are even more regulated. Looking at fires in high-rise apartment buildings offers additional insight into the impact of fire protection technologies.
For the purposes of this analysis, a high-rise building is any building that is at least seven stories or more above grade. The term apartment also includes residential condominiums. The number of stories was first added to Version 4.0 of NFIRS. Consequently,
NFPA’s analyses of high-rise building fires began with data from 1985.
Local fire departments responded to an estimated average of 8,600 structure fires in apartment properties of seven or more stories per year in 2014–2018. During this period, these fires caused an average of 29 civilian deaths, 367 civilian injuries, and $101 million in direct property damage annually. High-rise fires accounted for 8 percent of apartment fires, 7 percent of apartment fire deaths, 10 percent of apartment fire injuries, and 8 percent of apartment fire direct property damage.
Home Structure Fires

22
14 Michael S. Isner. Investigation Report: Apartment High-Rise Fire: Manhattan, New York, January 11, 1988. Quincy, MA: NFPA, 1988. https://www.nfpa.org/-/media/Files/News-and-Research/Resources/Fire-Investigations/fimanhattan.ashx. Accessed on March 23, 2021.
Figure 11. Fire protection status in reported high-rise apartment fires:1985–1989, 1994–1998, and 2014–2018
21%
67%57%
32%
85%
50%48%
93%
0%
50%
100%
Sprinklers/AES present Detection present Fire-resistiveconstruction
1985–1989 1994–1998 2014–2018
While reported fires in these properties declined by roughly 25 percent since 1985–1989, there was little change from 1994–1998 to 2014–2108. The drop in deaths and deaths per 1,000 fires was much greater.
Compartmentation requirements have long been an essential part of fire protection in high-rise buildings, while requirements for detection and sprinklers have increased in recent decades. The importance of all three of these fire protection components was highlighted in an NFPA investigative report about a 10-story building in Manhattan in which four civilians died in 1988.14 Each of the apartments on the third through tenth floors was equipped with a single-station, battery-powered smoke alarm, but many were missing or lacked batteries. A basement storage room was protected by a wet pipe sprinkler system, but these were the only sprinklers in the building. The lower two floors housed commercial properties. The fire started in a first-floor office and spread on the floor
before the fire department arrived. Two victims were found in a stairway near the roof access, one was found in a ninth-floor apartment, and the fourth was found in a stairway between the first and second floor. Compartmentation helped protect the occupants in the apartments, as the metal apartment doors and unpenetrated masonry walls prevented smoke from entering the units. The investigation noted that a lack of automatic detection and suppression systems was a factor in the fire, as were stairway doors on the first floor that had been propped open, allowing heat and smoke to spread.
Figure 11 shows how the presence of automatic detection and sprinklers has increased in reported fires. Although fire-resistive construction shows a decrease from the first period to the second, this could be due to changes in NFIRS 4.1 participation or other normal fluctuation. Unfortunately, the fire-resistive construction type was dropped from NFIRS 5.0. Prior to NFIRS 5.0, all the types of
Home Structure Fires

23
automatic extinguishing systems (AES) were grouped together and could not be separated. It should also be noted that sprinkler presence percentages exclude fires reported to have partial systems and fires in which the system did not operate because it was not in the area of origin. Increasing the layers of protection is most likely the reason for the decline in fire deaths.
Little change has been seen in the number of fires spreading beyond the room of origin in high-rise apartment buildings in recent years. However, the percentage of deaths resulting from fires confined to the room of origin has increased. Individuals who are intimately involved with ignition or are very close to a fire might not benefit from the early warning of a smoke alarm. Those in other rooms have more time to escape.
An analysis of residential high-rise fires in 1986–1995 found that flame damage was confined to the object or room of origin in 97 percent of fires in properties with automatic extinguishing systems and in 92 percent of high-rise residential fires that lacked such protection.15
In 2014–2018, fire spread was confined to the room of origin in 98 percent of fires in sprinklered high-rise apartments and in 94 percent when such properties were unsprinklered.
While deaths are unusual in high-rise apartment fires, 89 percent of the deaths in sprinklered high-rise apartments in 2014–2018 resulted from fires that did not spread beyond the room of origin. That was true for only 61 percent of the deaths in unsprinklered high-rise apartments. In 1986–1995, flame damage was limited to the room of origin in 82 percent of the high-rise residential fire deaths that occurred when some type of AES, usually sprinklers, was present but only 51 percent of the fatalities when such properties lacked AES.
Home Structure Fires
FLAME DAMAGE was confined to the object or room of origin in 97% of the fires in residential high rise properties with automatic extinguishing systems.
15 Marty Ahrens. Sprinkler Status and the Extent of Flame and Smoke Damage in High-Rise and Mid-Rise Structure Fires Reported to US Public Fire Departments 1986–1995. Quincy, MA: NFPA, 1997. Residential properties include one- and two-family homes, apartments, hotels and motels, dorms, rooming houses, and unclassified residential properties. Apartments are by far the most common high-rise residential occupancy.

24
The decrease in fire deaths in high-rise buildings follows the increase in the use of sprinklers in these buildings. While compartmentation is clearly successful in limiting the spread of fire outside the room of origin, adding the additional safety layer of sprinklers can confine even more fires to the object or room of origin. Sprinklers were
first mandated for new high-rise apartment buildings in the 1988 edition of NFPA 101. The 1991 edition introduced a sprinkler requirement for existing high-rise apartment buildings, but it also included an engineered life safety system exemption, which effectively negated the sprinkler mandate.
“The death rate per 1,000 reported home fires was 86 percent lower in fires in which fire sprinklers were present compared to fires in homes with no automatic extinguishing system.”
Home Structure Fires
Figure 12. Fires and resulting deaths from fires confined to the object or room of origin in fires in high-rise apartment buildings:
1994–1998 vs. 2014–2018
94%
51%
96%
70%
0%
50%
100%
Fires Deaths
1994–1998 2014–2018

25
Home Structure Fires
Victims of Home Structure FireWhen looking at potential fire victims, at least two questions should be considered:
1. Who are the most common victims?
2. Given their share of the population, who faces the greatest risk?
The age distribution of fire fatalities was very different in 2018 than it was in 1980. The sharpest reduction in fire deaths was seen in children under five. Very large reductions
were seen in victims through age 34 and a lesser, but still substantial, reduction was seen in the 35–49 age group. The home fire death toll among those 50 and over has seen little change. However, the percentage of the population that is over 35 has been increasing. All age groups showed a substantial decrease in the death rate per million population, with the largest again seen in children under five, as well as in the under 50 age group. Although less dramatic, reductions for older adults were still substantial.
Figure 13. Home fire deaths by age group: 1980 and 2018
Figure 14. Home fire deaths per million population by age group: 1980 and 2018
950
440270 220
1070
620700
430
550
140 110 50 40
250390
670 490 540
0
500
1000
1500
Under 5 5–9 10–14 15–19 20–34 35–49 50–64 65–74 75 and over
1980 2018
58
26
1510
18 1721
27
55
7 5 2 2 4 6 1116
25
0
20
40
60
80
Under 5 5–9 10–14 15–19 20–34 35–49 50–64 65–74 75 and over
Dea
ths
per
mil
lio
n p
op
ula
tio
n
1980 2018 1980 all ages 2018 all ages
Impact of Fire Vulnerability

26
Home Structure Fires
16 Marty Ahrens. US Fire Death Rates by State. Quincy, MA: NFPA, 2019.
17 Christian Sesseng, Karolina Storesund, and Anne Steen-Hansen, “Analysis of fatal fires in Norway in the 2005–2014 period,” RISE Fire Research, Report A17, 6:2, 2017.
18 Lin Xiong, Dorothy Bruck, and Michelle Ball, “Comparative Investigation of ‘Survival’ and Fatality Factors in Accidental Residential Fires,” Fire Safety Journal 73 (2015): p. 37–47.
19 Joanna Giebułtowicz, et al., “Analysis of Fire Deaths in Poland and Influence of Smoke Toxicity,” Forensic Science International (2017): p. 77–87.
20 Marty Ahrens. Home Structure Fires. Quincy, MA: NFPA, 2020, p. 8.
21 “HH-4. Households by Size: 1960 to Present,” Current Population Survey, March and Annual Social and Economic Supplements, US Census Bureau.
An analysis by Ahrens16 of death certificate data for all fire victims (not just home fire victims) in 2013–2017, found that:• Fire death rates varied considerably by
state, with average death rates per million population ranging from a low of 4.6 percent to a high of 23.5 percent.
• Nine of the 10 states with the highest overall fire death rates were in the South.
• All but three states had fewer fire deaths in 2013–2017 than in 1981–1985. All states had lower population-based fire death rates in 2013–2017 than in 1981–1985.
Studies from Sweden,17 Australia,18 and Poland19 have found that people who live or are alone face a higher risk of fire death. When someone else is present, that person can offer assistance to get the individual to safety, control the fire, or get help. In 2014–2018, one-third of the fatal home fire victims in the US were in the area of origin and involved in ignition according to Ahrens.20
The number of people living alone is increasing in the US. Data from the Current Population Survey from the US Census21 shows that the percentage of households with only one person increased from 23 percent in 1980 to 28 percent in 2019. A significant amount of people living alone are seniors.
States with higher fire death rates correlate with larger percentages of people who:
Have a disability
Are current smokers
Have incomes below the
poverty line
Are either African-American or Black or are Native American
or Alaskan Native
Live in rural areas

27
Figure 15. Percentage of fatal home fire victims who were under five or at least 65 years of age by year
18%6%
19%
36%
0%
10%
20%
30%
40%
1980
1982
1984
1986
1988
1990
1992
1994
1996
1998
2000
2002
2004
2006
2008
2010
2012
2014
2016
2018
Under 5 65 and older
According to the Harvard Joint Center for Housing Studies report, Housing America’s Older Adults 2019,22 42 percent of households headed by someone 65 or older contained only one person. This climbed to 57 percent for households headed by someone 80 or older. If the pattern continues, in 2038, there
will be 10.1 million single-person households with someone 80 or older.
An analysis of the percentage of people of selected ages who lived alone found that the percentage of 75-year-olds who live alone has fallen since 1980, while the percentage has increased for 89-year-olds.23 In many cases, one person in a couple dies or moves into some type of care facility, leaving the other alone.
In 1980, two age groups, children under five and people 65 or older, each accounted for almost one-fifth of the home fire deaths. The percentage of older adult fire deaths was almost twice as high in 2018, while the percentage of preschool-age fire deaths was only one-third as high.
Home Structure Fires
Due to the uncertainty of estimates during the transition to NFIRS 5.0 in 1999–2001, estimates for these years were not included.
22 Harvard Joint Center for Housing Studies. Housing America’s Older Adults: A Supplement to the State of the Nation’s Housing Report. https://www.jchs.harvard.edu/sites/default/files/Harvard_JCHS_Housing_Americas_Older_Adults_2019.pdf. Accessed on January 18, 2021.
23 “Percentage of Americans living alone, by age,” 1900 to 2018. https://ourworldindata.org/grapher/percentage-of-americans-living-alone-by-age. Accessed on January 4, 2021.
“In 1980, two age groups, children under five and people 65 or older, each accounted for almost one-fifth of the home fire deaths. The percentage of older adult fire deaths was almost twice as high in 2018, while the percentage of preschool-age fire deaths was only one-third as high.”

28
American Community Survey data shows that disabilities, including vision, hearing, cognitive, ambulatory, self-care, and independent living difficulties, increase with age in the noninstitutionalized population.24 Of those people between 35 and 64, 13 percent have at least one disability. This is true for one-quarter of those between 65 and 74 and half (49 percent) of people 75 or older. In 2014–2018, 17 percent of fatal fire victims who were 80 or older were unable to act at the time
of the fire. Nearly one-third (31 percent) had some type of disability.
Allman and Blackwell25 reported that from 2000 to 2010, 27 percent of people of all ages who lived in one-person households had a disability. One-quarter (25 percent) of households with an adult 18–64 who had a disability contained only one person. This jumped to 43 percent of one-person
Home Structure Fires
24 2014–2018 American Community Survey 5-Year Estimates, Table S1810, “Disability Characteristics,” US Census Bureau. https://data.census.gov/cedsci/table?q=S18&y=2018&tid=ACSST5Y2018.S1810&hidePreview=true
25 B.M. Altman and D.L. Blackwell, “Disability in US Households, 2000–2010: Findings from the National Health Interview Survey,” Family Relations, 63(1), 20–38, 2016. DOI: 10.1111/fare.12044.
Figure 16. Percentage of US adults of selected ages living alone: 1980, 2000, and 2016
1%6%
9%6%
14%
32% 29%
1%5%
10% 11%
16%
29%
41%
1%4%
9% 9%
18%25%
42%
0%
10%
20%
30%
40%
50%
18 21 30 45 60 75 89Years of age
1980 2000 2018
27%of all people in
one-person households have a disability. (2000-2010)
households with someone 65 or older who had a disability.

29
Changing Demographics Among High-Rise Apartment OccupantsEstimates from the American Housing Survey (AHS) provide some data about the number of units in high-rise apartment buildings and the people who inhabit them.26 Compared to other properties, high-rise apartments are less likely to be owned by the occupant, although the percentage of owner-occupied units has increased since 1985. High-rise occupants are more likely to have incomes below the poverty
line than are occupants of shorter buildings. The percentage of occupants 65 and older is also higher in high-rise properties, although, in 2019, it was the same as in one-story buildings. A question about disabilities was added to the AHS in recent years. In 2019, roughly one-quarter of the occupants of one-story and high-rise buildings had some type of disability. People who find stairs challenging are likely to prefer either one-story buildings or buildings with elevators.
Figure 17. Percentages of high-rise occupants by selected demographics AHS data: 1985, 2001, and 2019
16%
40%
28%24%
38%32%
22%
31%27%
0%
50%
Own unit Age 65 or older Income below poverty line
1985 2001 2019
Home Structure Fires
26 AHS reports for 1985 and 2001. Downloaded from https://www.census.gov/programs-surveys/ahs/data.html and AHS table creator for 2019.
1/4 of occupants
of one-story and high-rise buildings have some type of disability. (2019)

30
Age of HousingThe median age in housing units in the US has been getting higher. Based on data from the American Housing Survey compiled by Karyl Kinsey,27 Figure 18 shows that the median age of occupied housing has been steadily increasing since the mid-1980s.
Older homes were unlikely to have been built to comply with current codes. However, while older homes are often correlated with increased risk of fire or fire death, states like Connecticut and Massachusetts have considerable older housing stock,28 yet relatively low rates of fire death.29 This indicates that it is not just the age of a building that is of relevance but, more importantly, it is the maintenance of the building as well as any major renovations that might have been done to bring the building up to code.
According to the American Housing Survey data,30 the percentage of homes considered to be moderately to severely inadequate in quality decreased from 9 percent for homes built before 1940 to only 2 percent for homes
Figure 18. Median age of housing — occupied units
23 25 26 27 28 28 30 30 31 32 32 34 35 37 38 39 40 41
1985
1987
1989
1991
1993
1995
1997
1999
20012003
20052007
20092011
20132015
20172019
0
20
40
60
Home Structure Fires
27 American Housing Survey, https://www.census.gov/programs-surveys/ahs/data.html. The source data was national-level general housing data tables for 1985 through 2019. Analysis was limited to occupied housing units; the median age of housing was calculated by subtracting the median year the structure was built from the AHS survey year.
28 Na Zhao, “Age of Housing Stock by State,” National Association of Home Builders, August 2018. http://eyeonhousing.org/2018/08/age-of-housing-stock-by-state-2/
29 Marty Ahrens. US Fire Death Rate by State. Quincy, MA: NFPA, 2019. https://www.nfpa.org/News-and-Research/Data-research-and-tools/US-Fire-Problem/Fire-deaths-by-state
30 National Housing Quality — All Occupied Units. US Census Bureau, American Housing Survey 2019. Accessed on November 12, 2020.
“It is not just the age of a building that is of relevance but, more importantly, it is the maintenance of the building as well as any major renovations that might have been done to bring the building up to code.”

31
built from 2000 to 2009. Water leakage from the outside was also notably more common in older homes. See Figure 19.
Older homes were slightly more likely to have exposed wires and bars on windows than newer properties. Homes built before 1940 were more likely to be uncomfortably cold for at least one day.
Exposed wiring can be a factor in electrical fires while uncomfortably cold days can result in unsafe heating practices. Bars on windows can make it difficult to escape should a fire occur.
AHS data also shows that, in 2019, older adults were less likely to live in homes built between 2010 and 2019 and most likely to live in homes built in the 1970s.31
Figure 19. Quality issues by year unit was built per AHS: 2019
2%
9%
6%
3%
5%
1%
5%
4%
2%
2%
1%
9%
5%
2%
4%
2%
9%
6%
2%
5%
3%
16%
10%
4%
9%
0% 5% 10% 15% 20%
Bars on windows
Water leakagefrom outside
Uncomfortably cold≥ 24 hours
Exposed wiring
Moderately toseverely
inadequate Before 1940
1970–1979
1980–1989
2000–2009
Total
Home Structure Fires
31 National Household Demographics — All Occupied Units by Year Built. American Housing Survey 2019, US Census Bureau. https://www.census.gov/programs-surveys/ahs/data/interactive/ahstablecreator.html?s_areas=00000&s_year=2019&s_tablename=TABLE8A&s_bygroup1=4&s_bygroup2=1&s_filtergroup1=1&s_filtergroup2=1. Accessed on January 4, 2021.

32
Figure 20. Age of home owner by year unit was built per AHS: 2019
11%
5%
11% 11%
17%
14%13% 13%
5%
13%
5%
12%14%
16%
12% 12% 12%
4%
13%
4%
10%11%
14%
13% 13% 14%
7%
0%
2%
4%
6%
8%
10%
12%
14%
16%
18%
20%
Before
1940
1940–19
49
1950–19
59
1960–19
69
1970–19
79
1980–19
89
1990–19
99
2000–2009
2010–2019
65 to 74 75 or older All ages
Home Structure Fires
Figure 21. Percentage of home fires and fire deaths by fire cause: 1980 and 2018
2%
1%
47%
9%
13%
5%
1%
6%
20%
9%
31%
10%
0% 10% 20% 30% 40% 50%
Candle
Playing with fire
Cooking
Electrical distributionand lighting
Heating
Smoking materials
A. Fires
19802018
4%
2%
20%
16%
18%
26%
1%
8%
10%
10%
19%
35%
0% 10% 30% 50%
Candle
Playing with fire
Cooking
Electrical distributionand lighting
Heating
Smoking
B. Deaths
1980
2018

33
32 Marty Ahrens. Home Structure Fires, Quincy, MA: NFPA, 2020.
Home Structure Fires
Causes of Home Structure Fires
Cooking is a much larger part of the fire and fire death problem today than in the past.32 The share of electrical distribution and lighting fire deaths has also increased. Heating fires have fallen sharply, but little change has been seen in the share of heating fire deaths. The percentage of fires started by smoking materials has been cut in half. The decrease in the smoking material share of home firedeaths is substantial but
smaller than the fire decline. Smoking remains the leading cause of home fire deaths nationally in five-year averages. In some years, another cause surpassed smoking.
SmokingFrom 2014 through 2018, smoking materials started an estimated average of 16,800 reported home fires per year. These fires caused an average of 590 civilian deaths; 1,050 civilian injuries; and $492 million in direct property damage annually. The 2018 estimate of 16,100 such fires was 77 percent lower than the 1980 estimate of 70,800.
Smoking has been a leading cause of home fire deaths for decades. The 1980 percentage of home fires started by smoking materials was twice the percentage in 2018, while the percentage of home fire deaths from these fires was 1.3 times as high in 1980 as in 2018. The 2018 estimate of 680 associated deaths was 62 percent lower than the 1,820 such deaths in 1980. However, the 42 deaths per 1,000 reported home fires started by smoking materials in 2018 is 64 percent higher than the 26 deaths per 1,000 smoking material fires in
“Cooking is a much larger part of the fire and fire death problem today than in the past. The share of electrical distribution and lighting fire deaths has also increased.”
Figure 22. Reported home structure fires started by smoking materials by year: 1980-2018
70.8
16.1
0
10
20
30
40
50
60
70
80
1980
1982
1984
1986
1988
1990
1992
1994
1996
1998
20002002
20042006
20082010
20122014
20162018
In T
ho
usa
nd
s
A. Fires B. Deaths
1,820
680
0
500
1000
1500
2000
2500
1980
1982
1984
1986
1988
1990
1992
1994
1996
1998
20002002
20042006
20082010
20122014
20162018
Due to the uncertainty of estimates during the transition to NFIRS 5.0 in 1999–2001, estimates for these years were not included.

34
Home Structure Fires
33 TW Wang, “Tobacco Product Use Among Adults — United States, 2017,” Morbidity and Mortality Weekly Report, 67, 2018. DOI: 10.15585/mmwr.mm6744a2.
1980. Although these fires have become less common, when such a fire has been reported in recent years, it was more likely to be deadly than in the early 1980s.
Smoking patterns have changed considerably over the last 40 years. In 2017, only one of every six (17 percent) adults smoked combustible tobacco products,33 roughly half the 33 percent of adult cigarette smokers in 1980. According to the American Lung Association’s analysis of the CDC’s National Health Interview Survey, the number of cigarettes
smoked per day per smoker has also steadily decreased. As of 2017, almost two-thirds of smokers smoked fewer than 15 cigarettes a day. Finally, the percentage of households that have banned smoking nearly doubled from 1992–1993 to 2010–2011, with a five-fold increase in such rules for households with at least one smoker and a six-fold increase in households with adult smokers and children under 18. While the precise impact of these changes on smoking fires and fire deaths cannot be quantified, it is clear that the probability of a cigarette fire decreases when people smoke fewer cigarettes.
SMOKING has been a leading cause of home fire deaths for decades. 33%
of adults were cigarette smokers.
17%of adults were
cigarette smokers.
1980: 2017:
Figure 23. Percent of reported home structure fires started by smoking materials by year: 1980–2018
A. Fires B. Deaths
10%
5%
0%
2%
4%
6%
8%
10%
12%
1980
1982
1984
1986
1988
1990
1992
1994
1996
1998
20002002
20042006
20082010
20122014
20162018
35%
26%
0%
5%
10%
15%
20%
25%
30%
35%
40%
1980
1982
1984
1986
1988
1990
1992
1994
1996
1998
20002002
20042006
20082010
20122014
20162018
Due to the uncertainty of estimates during the transition to NFIRS 5.0 in 1999–2001, estimates for these years were not included.
35
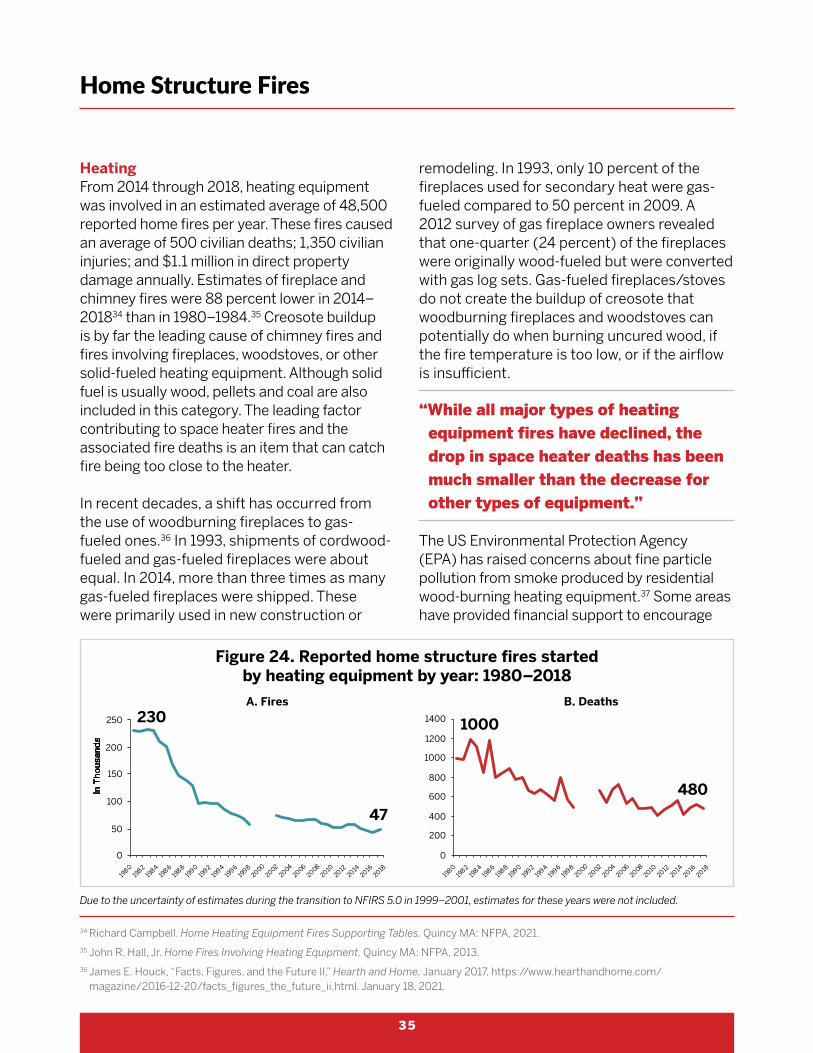
HeatingFrom 2014 through 2018, heating equipment was involved in an estimated average of 48,500 reported home fires per year. These fires caused an average of 500 civilian deaths; 1,350 civilian injuries; and $1.1 million in direct property damage annually. Estimates of fireplace and chimney fires were 88 percent lower in 2014–201834 than in 1980–1984.35 Creosote buildup is by far the leading cause of chimney fires and fires involving fireplaces, woodstoves, or other solid-fueled heating equipment. Although solid fuel is usually wood, pellets and coal are also included in this category. The leading factor contributing to space heater fires and the associated fire deaths is an item that can catch fire being too close to the heater.
In recent decades, a shift has occurred from the use of woodburning fireplaces to gas-fueled ones.36 In 1993, shipments of cordwood-fueled and gas-fueled fireplaces were about equal. In 2014, more than three times as many gas-fueled fireplaces were shipped. These were primarily used in new construction or
remodeling. In 1993, only 10 percent of the fireplaces used for secondary heat were gas-fueled compared to 50 percent in 2009. A 2012 survey of gas fireplace owners revealed that one-quarter (24 percent) of the fireplaces were originally wood-fueled but were converted with gas log sets. Gas-fueled fireplaces/stoves do not create the buildup of creosote that woodburning fireplaces and woodstoves can potentially do when burning uncured wood, if the fire temperature is too low, or if the airflow is insufficient.
The US Environmental Protection Agency (EPA) has raised concerns about fine particle pollution from smoke produced by residential wood-burning heating equipment.37 Some areas have provided financial support to encourage
Figure 24. Reported home structure fires started by heating equipment by year: 1980–2018
A. Fires B. Deaths
230
47
0
50
100
150
200
250
1980
1982
1984
1986
1988
1990
1992
1994
1996
1998
20002002
20042006
20082010
20122014
20162018
In T
ho
usa
nd
s
1000
480
0
200
400
600
800
1000
1200
1400
1980
1982
1984
1986
1988
1990
1992
1994
1996
1998
20002002
20042006
20082010
20122014
20162018
Home Structure Fires
34 Richard Campbell. Home Heating Equipment Fires Supporting Tables. Quincy MA: NFPA, 2021.
35 John R. Hall, Jr. Home Fires Involving Heating Equipment. Quincy MA: NFPA, 2013.
36 James E. Houck, “Facts, Figures, and the Future II,” Hearth and Home, January 2017. https://www.hearthandhome.com/magazine/2016-12-20/facts_figures_the_future_ii.html. January 18, 2021.
Due to the uncertainty of estimates during the transition to NFIRS 5.0 in 1999–2001, estimates for these years were not included.
“While all major types of heating equipment fires have declined, the drop in space heater deaths has been much smaller than the decrease for other types of equipment.”
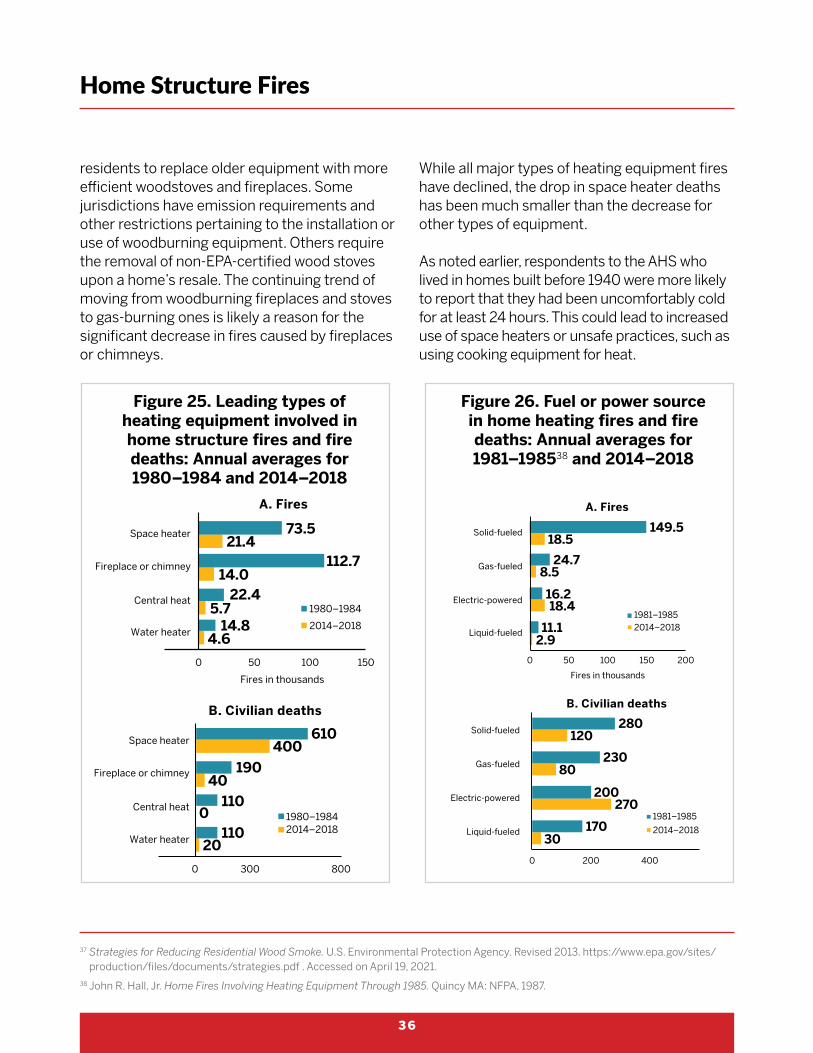
36
residents to replace older equipment with more efficient woodstoves and fireplaces. Some jurisdictions have emission requirements and other restrictions pertaining to the installation or use of woodburning equipment. Others require the removal of non-EPA-certified wood stoves upon a home’s resale. The continuing trend of moving from woodburning fireplaces and stoves to gas-burning ones is likely a reason for the significant decrease in fires caused by fireplaces or chimneys.
While all major types of heating equipment fires have declined, the drop in space heater deaths has been much smaller than the decrease for other types of equipment.
As noted earlier, respondents to the AHS who lived in homes built before 1940 were more likely to report that they had been uncomfortably cold for at least 24 hours. This could lead to increased use of space heaters or unsafe practices, such as using cooking equipment for heat.
Figure 25. Leading types of heating equipment involved in home structure fires and fire deaths: Annual averages for 1980–1984 and 2014–2018
20
0
40
400
110
110
190
610
0 300 800
Water heater
Central heat
Fireplace or chimney
Space heater
B. Civilian deaths
1980–19842014–2018
4.6
5.7
14.0
21.4
14.8
22.4
112.7
73.5
0 50 100 150
Water heater
Central heat
Fireplace or chimney
Space heater
Fires in thousands
A. Fires
1980–1984
2014–2018
Home Structure Fires
37 Strategies for Reducing Residential Wood Smoke. U.S. Environmental Protection Agency. Revised 2013. https://www.epa.gov/sites/production/files/documents/strategies.pdf . Accessed on April 19, 2021.
38 John R. Hall, Jr. Home Fires Involving Heating Equipment Through 1985. Quincy MA: NFPA, 1987.
20
0
40
400
110
110
190
610
0 300 800
Water heater
Central heat
Fireplace or chimney
Space heater
B. Civilian deaths
1980–19842014–2018
4.6
5.7
14.0
21.4
14.8
22.4
112.7
73.5
0 50 100 150
Water heater
Central heat
Fireplace or chimney
Space heater
Fires in thousands
A. Fires
1980–1984
2014–2018
Figure 26. Fuel or power source in home heating fires and fire deaths: Annual averages for 1981–198538 and 2014–2018
B. Civilian deathsA. Fires
2.9
18.4
8.5
18.5
11.1
16.2
24.7
149.5
0 50 100 150 200
Liquid-fueled
Electric-powered
Gas-fueled
Solid-fueled
Fires in thousands
1981–19852014–2018
30
270
80
120
170
200
230
280
0 200 400
Liquid-fueled
Electric-powered
Gas-fueled
Solid-fueled
1981–1985
2014–2018
B. Civilian deathsA. Fires
2.9
18.4
8.5
18.5
11.1
16.2
24.7
149.5
0 50 100 150 200
Liquid-fueled
Electric-powered
Gas-fueled
Solid-fueled
Fires in thousands
1981–19852014–2018
30
270
80
120
170
200
230
280
0 200 400
Liquid-fueled
Electric-powered
Gas-fueled
Solid-fueled
1981–1985
2014–2018

37
Electrical Distribution and LightingFrom 2014 through 2018, electrical distribution and lighting equipment was involved in an estimated average of 33,900 reported home fires per year. These fires caused 470 deaths; 1,100 injuries; and $1.4 billion in direct property damage annually. The percentage of reported home fires started by electrical distribution and lighting equipment was the same in 2018 as it was in 1980. However, this equipment’s share of the deaths was 1.6 times as high in 2018 as it was in 1980.
While the 2014–2018 estimate of the number of fires caused by wiring and related equipment was about one-third lower than the 1980–84 estimate from a 2013 NFPA report,39 the estimated deaths from those fires remained unchanged. Deaths from cord-and-plug fires also remained steady, despite a notable drop in the number of such fires.
Fires and fatalities associated with lamps, bulbs, and lighting have fallen in recent years. Efficient light-emitting diodes (LEDs) and compact fluorescent bulbs have become more common, and because these bulbs do not get as hot, they are less likely to start a fire. While human action can contribute to the probability of wiring fires, such actions often occur a long time before a fire, and the individuals who caused the problem might no longer have any relationship to the property. The last in-depth study of wiring fires of which we are aware was conducted by the Consumer Product Safety Commission (CPSC) in 1984 and 1985.40 Fire departments from 16 jurisdictions investigated and reported on 149 residential fires that began with electrical systems. The study showed that roughly half of the homes that were over 20 years old had fuses. All the homes that were no more than 20 years old had circuit breakers. None of the newer homes had knob and tube or armored cable wiring. Such wiring was common in homes
Figure 27. Electrical distribution and lighting equipment in home structure fires by leading types of equipment:
Annual averages for 1980–1984 and 2014–2018
B. Civilian deathsA. Fires
30
170
240
70
170
240
0 100 200 300
Cord or plug
1980–19842014–2018
1980–19842014–20184.6
3.3
23.6
11.4
11.7
34.8
0 10 20 30 40
Lamp, bulbor lighting
Lamp, bulbor lighting
Cord or plug
Wiring and relatedequipment
Wiring and relatedequipment
Fires in thousands
Home Structure Fires
39 John R. Hall, Jr. Electrical Fires. Quincy, MA: NFPA, 2013.
40 Linda Smith and Dennis McCoskrie, “What Causes Wiring Fires in Residences?” Fire Journal, January/February 1990. https://www.cpsc.gov/s3fs-public/firejournal.pdf

38
that were more than 40 years old. The factors contributing to electrical fires included:
• Improper alterations (37 percent)• Improper initial installation (20 percent)• Deterioration due to aging (17 percent)• Improper use (15 percent)• Inadequate electrical capacity (15 percent)• Faulty product (11 percent)• Unknown (9 percent)
Multiple factors are sometimes associated with one fire. Improper initial installation was the most common cause of wiring fires in homes that were no more than 20 years old. All of the factors except improper installation were more commonly seen in fires in older homes. Improper use tended to involve incandescent bulbs with wattages that were too high for a fixture and extension cord misuse. Inadequate electrical capacity included overloaded and abused extension cords, over-fusing, and using a portable electric heater on an overloaded system. The authors of the CPSC report noted
that “Many of these electrical distribution system fires were the result of failure to update a dwelling’s original electrical system to meet increased demand.” They concluded that consumers were often unaware of the risks of handling their own electrical upgrades or hiring someone without the necessary training. Many could not afford to hire a qualified electrician. Electrical systems do not last forever. In their study, CPSC recommended more resources for electrical inspection and suggested that electrical inspections when homes change hands could identify incipient problems.
As was noted earlier, respondents to the AHS who lived in homes built before 1940 were more likely to report exposed wiring.
Electrical distribution and lighting equipment accounted for half of the home structure fires reported from 2012–2016 that were caused by electrical failures or malfunctions.41 Such failures can occur in any equipment powered by electricity.
Figure 28. Equipment involved in home fires started by electrical failures or malfunctions: 2012–2016
3%
9%
9%
15%
50%
Clothes dryers
Heating equipment
Fan or air conditioner
Cooking equipment
Electrical distributionand lighting
0% 10% 20% 30% 40% 50% 60%
Home Structure Fires
41 Richard Campbell. Home Electrical Failures. Quincy, MA: NFPA, 2019.

39
CookingFrom 2014 through 2018, cooking caused an estimated average of 172,900 home fires per year. These fires caused an annual average of 550 civilian deaths; 4,820 civilian injuries; and $1.2 billion in property damage. Cooking is the only major cause of fire that saw more fires and fire deaths in 2014–2018 than in 1980–1984. The percentage of reported home fires started by cooking in 2018 was 2.4 times higher than in 1980 and the percentage of cooking fire deaths was twice as high. Less progress has been made in reducing deaths from home cooking fires than from most other fire causes.
Ranges or cooktops were involved in most cooking fires and losses. From 1980 through 1984, stoves or ranges were involved in roughly three-quarters of the home cooking fires and 84 percent of the home cooking fire deaths.42 In 2014–2108, ranges or cooktops were involved in three-fifths of the home cooking fires, 87 percent of the home cooking fire deaths, and 78 percent of the home cooking fire injuries.43
Because cooking is such a normal part of daily life, it is easy to forget the dangers associated with high heat. In addition, cooking oil and grease fires are a major part of the cooking fire problem. Unattended cooking is by far the leading cause of cooking fires and cooking fire casualties. Households that use electric ranges have a higher risk of cooking fires and associated losses than those using gas ranges. Only 60 percent of households primarily use electric cooking appliances, yet 80 percent of ranges or cooktops involved in the reported cooking fires were powered by electricity.44
Figure 29. Reported home structure fires started by cooking by year: 1980–2018
148170
0
20
40
60
80
100120
140
160
180
200
1980
1982
1984
1986
1988
1990
1992
1994
1996
1998
20002002
20042006
20082010
20122014
20162018
In T
ho
usa
nd
s
A. Fires B. Deaths
500 540
0
100
200
300
400
500
600
700
1980
1982
1984
1986
1988
1990
1992
1994
1996
1998
20002002
20042006
20082010
20122014
20162018
Home Structure Fires
42 John R. Hall, Jr. US Home Cooking Fire Patterns and Trends through 1985. Quincy, MA: NFPA, 1987.
43 Marty Ahrens. Home Cooking Fires. Quincy, MA: NFPA, 2020. Note the different terms in later years. NFIRS added a code for “heating stove” that appears to be sometimes used for ranges.
44 2015 and 2017 National Heating, Air Conditioning, and Appliances — All Occupies, Units. American Housing Survey (AHS) Table Creator, US Census Bureau. Accessed April 5, 2020.
“Less progress has been made in reducing deaths from home cooking fires than from most other fire causes.”
Due to the uncertainty of estimates during the transition to NFIRS 5.0 in 1999–2001, estimates for these years were not included.

40
Playing with FireIn 2014–2018, playing with fire caused an estimated 5,000 reported home fires per year. These fires caused an average of 50 civilian deaths, 400 civilian injuries, and $112 million in direct property damage. The 2018 estimate of 4,400 such fires was 90 percent lower than the 1980 estimate of 43,800. The 2018 estimate of 50 such home fire deaths was 88 percent lower than the 1980 estimate of 430.
From 1981–1985, 30 percent of the fire deaths among children who were five and under resulted from fires caused by children playing with fire.45
A cigarette lighter was the item most often used when young children were playing with fire. In a 1990 NFPA report, Hall46 showed that the proportion of child-play fires started by lighters was steadily increasing from 1980–1987. According to a 1981 story in the New York Times, butane lighters had taken over half of the market share held by matches in the previous five years. The cost of matches had been increasing and they were less likely to be given away for free with cigarettes. Many smokers switched to disposable lighters.47 This made lighters more accessible to children.
Figure 31. Reported home structure fires started by someone playing with fire by year: 1980–2018A. Fires B. Deaths
430410
50
0
100
200
300
400
500
600
1980
1982
1984
1986
1988
1990
1992
1994
1996
1998
20002002
20042006
20082010
20122014
20162018
43.8
4.4
0
5
10
15
2025
30
35
40
45
50
CPSC lighter standard took e�ect in 1994
CPSC lighter standard took e�ect in 1994
1980
1982
1984
1986
1988
1990
1992
1994
1996
1998
20002002
20042006
20082010
20122014
20162018
24.0
Home Structure Fires
45 Michael J. Karter, Jr. Patterns of Civilian Fire Casualties in Home Fires by Age and Sex, 1981–1985. Quincy, MA: NFPA, 1987.
46 John R. Hall, Jr. Children Playing with Fire, 1980–1997. Quincy, MA: NFPA, 1990.
Due to the uncertainty of estimates during the transition to NFIRS 5.0 in 1999–2001, estimates for these years were not included.
Figure 30. Percent of home structure fires started by cookingA. Fires B. Deaths
20%
47%
0%
10%
20%
30%
40%
50%
60%
1980
1982
1984
1986
1988
1990
1992
1994
1996
1998
20002002
20042006
20082010
20122014
20162018
1980
1982
1984
1986
1988
1990
1992
1994
1996
1998
20002002
20042006
20082010
20122014
20162018
10%
20%
0%
5%
10%
15%
20%
25%
Due to the uncertainty of estimates during the transition to NFIRS 5.0 in 1999–2001, estimates for these years were not included.

41
The CPSC was petitioned in 1985 to start rulemaking to create requirements to make it harder for young children to operate disposable lighters.48
The percentage of home fire deaths in children under 5 years of age has declined since 1994 — the same year the Safety Standard for Cigarette Lighters (16 CFR, Part 1210) took effect. This standard requires disposable and novelty lighters to have a mechanism that makes it harder for young children to operate.
The success of this standard can be seen in the 2018 estimate of deaths caused by playing with fire, which was 90 percent lower than it was in 1980 — a great sign for the protection of some of society’s most vulnerable.
CandlesFrom 2014 through 2018, candles caused an estimated average of 7,610 home fires per year. These fires caused an average of 80 civilian deaths, 680 civilian injuries, and $278 million in property damage annually. While most types of fires had been steadily declining, as candles became more popular in the 1990s, candle fires started to increase. In 1980, candles started 1 percent of home fires. This climbed to 5 percent in 2002. In the past few years, candles have caused 2 percent of home fires.
No standards for candles existed in the 1990s. The CPSC requested that ASTM develop candle fire safety standards, a request that the National Candle Association supported. An ASTM Consumer Product subcommittee wrote standards addressing safety labels,
glass candle containers, maximum flame height, secondary ignitions, end-of-useful-life, and tip-over requirements. Today, the subcommittee includes a task group that reviews publicly available reports of candle fires and recalls to ensure that the causes and circumstances are addressed by the ASTM standards. The CPSC’s saferproducts.gov is a primary source for candle fire reports and recalls.
Since the introduction of the candle fire safety standards, the number of candle fires has steadily decreased. The last decade has also seen an increase in the use of battery-operated LED candles, a safe alternative to traditional candles.
Home Structure Fires
47 Algis Salpukas, “Match Industry Struggles to Hold Its Own,” The New York Times, March 30, 1981. https://www.nytimes.com/1981/ 03/30/business/match-industry-struggles-to-hold-its-own.html
48 L.E. Smith, M.A. Greene, and H.A. Singh, “Study of the effectiveness of the US safety standard for child resistant cigarette lighters,” Injury Prevention 8 (2002): p. 192–196. https://www.cpsc.gov/s3fs-public/lighters.pdf
“The success of this standard can be seen in the 2018 estimate of deaths caused by playing with fire, which was 90 percent lower than it was in 1980 — a great sign for the protection of some of society’s most vulnerable.”
Figure 32. Reported home structure fires started by candles by year:
1980–2018
10.47.5
0
5
10
15
20
1980
1982
1984
1986
1988
1990
1992
1994
1996
1998
20002002
20042006
20082010
20122014
20162018
In T
ho
usa
nd
s
Due to the uncertainty of estimates during the transition to NFIRS 5.0 in 1999–2001, estimates for these years were not included.

42
Intentional Fire SettingDue to changes in definitions between NFIRS versions, long-term trends in intentionally set home fires and home fire deaths cannot be measured. In earlier versions of NFIRS, fires that were considered incendiary or suspicious were deemed arson. Both of these categories were replaced by the ‘intentional’ fire classification, which does not necessarily imply criminal intent. In 2014–2018, an estimated average of 28,300 intentionally set home fires were reported per year. These fires caused an average of 370 civilian deaths, 790 civilian injuries, and $547 million in direct property damage.
Death certificate data provides some interesting insights about the total of intentional fire deaths, including information on the victims who were not in homes at the time of the fatal injury. While the average number of intentional fire deaths fell 20 percent from 1981–1985 to 2014–2018, homicide fire deaths were cut in half and fire deaths by suicide rose 29 percent.49 The early warning offered by smoke alarms and the quick response of sprinklers can help people escape deliberately set fires. The increased use of these technologies is most likely the reason that the number of homicides from intentional fires has been cut in half since 1981. However, such protection is much less likely to prevent a suicide.
Figure 33. Intentional fire deaths — suicide vs. homicide:1981–1985 and 2014–2018 annual averages
150190
220
110
0
50
100
150
200
250
1981–1985 2014–2018
Suicide Homicide
Home Structure Fires
Source: WISQARS. Fatal Injury Reports. Centers for Disease Control and Prevention.
49 WISQARS. Fatal Injury Reports, National, Regional, and State, 1981–2019. Centers for Disease Control and Prevention. https://webappa.cdc.gov/sasweb/ncipc/mortrate.html. Accessed on January 18, 2021.
28,300Intentionally set home fires were reported per year. (2014-2018)

43
The item first ignited and material available to fuel a fire play a major role in the fire’s outcome. In a 2012 article, Stephen Kerber50 described experimental burns that compared living-room-style spaces containing items common in t modern homes and rooms with legacy or natural furnishings. He discovered that flashover times decreased from roughly 30 minutes with legacy furnishings to roughly five minutes with modern, synthetic items.
The data also indicated that changes to furniture had a significant impact on how fires developed and killed. Kerber noted that upholstered
furniture in modern homes is much more likely to be covered with synthetic fabrics and to use polyurethane foam instead of cotton for padding. Modern homes also tend to have more furnishings. The rate of fire death per 1,000 reported home fires in living rooms and bedrooms was twice as high in 2014–2018 as it was in 1980–1984. In contrast, the fire death rate per 1,000 reported home fires originating in the kitchen fell to three in 2014–2018 from four in 1980–1984.
Upholstered furniture and mattresses or bedding accounted for 1 and 2 percent of the reported fires in 2014–2018, but 17 percent and 12 percent of the home fire deaths, respectively. These are relatively low-frequency, high-consequence fires. On average, one of every 12 upholstered furniture fires and one of every 26 mattress or bedding fires in 2014–2018 resulted in death. The death rates per 1,000 fires were higher for upholstered furniture and mattresses or bedding than for living rooms and bedrooms, indicating that these items were major factors in the fires beginning in these rooms.
The role of modern furniture in fires has led to an ongoing discussion about how to control their flammability. California is the only state to have introduced flammability testing of furniture but has made changes to those requirements in recent years due to concerns related to the use of flame-retardant chemicals that could be released into indoor environments and are associated with health risks. The flammability of upholstered furniture is a challenge that needs to be tackled, but as with all fire safety technologies, it is important to ensure that the solution to the fire problem does not create other problems.
Figure 34. Deaths per 1,000 fires that began with uphostered furniture
or mattresses and bedding: 1980–1984 vs. 2014–2018
Figure 35. Deaths per 1,000 reported fires in selected areas
of origin: 1980–1984 vs. 2014–2018
Dea
ths
per
1,0
00
fire
s
42
15
86
38
0
50
100
Upholstered furniture Mattress or bedding
1980–1984 2014–2018
Dea
ths
per
1,0
00
fire
s
1980–1984 2014–2018
25
144
54
28
3 0
20
40
60
Living room Bedroom Kitchen
Home Structure Fires
“Flashover times decreased from roughly 30 minutes with legacy furnishings to roughly five minutes with modern, synthetic items.”
50 Stephen Kerber, “Analysis of Changing Residential Fire Dynamics and Its Implications on Firefighter Operational Timeframes,” Fire Technology 48 (2012): p. 865–891.
Furniture

44
Government ResponsibilitySmoke AlarmsAs of 1977, 31 states did not require smoke alarms or detectors at all in one- or two-family homes or apartments. Today, according to First Alert’s “Fire Safety Laws
and Legislation by State,”51 smoke alarm requirements exist in every state.
In an effort to reduce the prevalence of smoke alarms with dead or disconnected batteries, numerous states have passed legislation requiring that all battery-powered smoke alarms use a sealed, 10-year battery source. Some states specify the use of lithium batteries in alarms.
Home Fire SprinklersIn 1985, Scottsdale, Arizona passed an ordinance requiring fire sprinklers in all new commercial buildings and multifamily homes.52 As of January 1, 1986, approved sprinklers were also required in new single-family homes. By 2016, almost 50,000 homes were protected by fire sprinklers, accounting for more than half of the city’s homes. Scottsdale’s efforts to ensure the use of sprinklers in single-family homes were mobilized after a developer agreed to install residential sprinklers in two new homes, showing that installation was possible. While the city required fire sprinklers in garages, they eliminated requirements for a one-hour separation and fire-rated door between a garage and house. A coalition of planners, building officials, developers, and insurers collaborated to identify cost offsets or design freedoms made possible by the use of sprinklers,
including increases in hydrant spacing. Officials realized they could not offer design freedoms if sprinklers were optional. If some homes did not have sprinklers, the hydrant fire flow and spacing requirements could not be changed.
According to a 2016 NFPA Journal, Scottsdale’s recent fire loss per capita is $7.31 compared to the Western United States’ $36 per capita or the national average of $27 per capita. Over the 30 years since the ordinance was enacted, only one home fire fatality occurred in a sprinklered home. The victim, who had serious physical limitations, had been smoking while using medical oxygen.
Prince George’s County in Maryland enacted a sprinkler ordinance for new one- and two-family homes in 1992. In a 2009 analysis, Steve Weatherby53 reported that from 1992 through 2007, 101 fire deaths and 328 civilian injuries resulted from 13,249 fires in unsprinklered single-family homes or townhouses in the county. No deaths and only six civilian injuries resulted from the 245 fires in sprinklered single-family homes and townhouses. The average loss per fire with sprinklers present was half that of those without sprinklers present.
SmokingBecause cigarettes are such a frequent cause of fatal fires, legislative efforts were made in the 1980s and 1990s to require cigarettes to have a reduced ignition propensity. In 2004, New York became the first state to require cigarettes to pass a standard test. All 50 states required fire standard compliant (FSC) cigarettes by 2012.
Home Structure Fires
51 https://www.firstalert.com/photoelectric-legislation.html Accessed April 20, 2021.
52 Beverly Ford, “Desert Success,” NFPA Journal: Home Fire Sprinkler Edition, 2016. https://www.nfpa.org/News-and-Research/Publications-and-media/NFPA-Journal/2016/Home-Fire-Sprinkler-Edition/Features/The-Scottsdale-Ordinance-at-30. Accessed January 4, 2021.
53 Benefits of Residential Fire Sprinklers: Prince George’s County 15-Year History with its Single-Family Residential Dwelling Fire Sprinkler Ordinance. Prepared by Steve Weatherby, August 2009. https://nfsa.org/wp-content/uploads/2019/07/Prince-Georges-County-Report.pdf. Accessed December 2, 2020.
Impact of the NFPA Fire & Life Safety Ecosystem

45
Butry and Thomas54 estimated that FSC cigarettes reduced the number of residential upholstered furniture fires by 45 percent and the associated deaths by 23 percent in 2011. There was a greater impact on the frequency of such fires in states with more heavy smokers.
Bonander, Kakobsson, and Nilson55 examined the effective date of the FSC requirements and cigarette fire data through 2014 by state. They found no statistically significant differences in residential fire mortality or the rate of fires started by cigarettes. Only some of the estimates of changes in cigarette-related fire deaths were significant. More studies are needed to determine the impact of introducing FSC cigarettes with reduced ignition propensity
To reduce smoking in public housing, as well as in privately owned, HUD-assisted multifamily housing, the US Department of Housing and Urban Development (HUD) passed a regulation that prohibited the use of lit tobacco products in public housing. This took effect on July 30, 2018.56
HUD is also promoting the voluntary adoption of smoke-free housing policies in HUD-subsidized, privately owned, multifamily properties.57
FurnitureThe fire performance test for mattresses developed by NIST was successfully
incorporated into the CPSC’s 2007 furniture flammability regulation. According to a recently published study by NIST,58 this regulation has reduced the number of deaths caused by flaming ignition of mattresses by close to 80 percent since its implementation.
The Upholstered Furniture Action Council’s Construction Criteria serves as a voluntary standard for upholstered furniture manufacturers.59 The Safer Occupancy Furniture Flammability Act was included in the Provisions of Interest Fiscal 2021 Omnibus Legislation Public Law No: 116–260. “The upholstered furniture flammability legislation was sponsored by Senator Roger Wicker and renamed the COVID-19 Regulatory Relief and Work from Home Safety Act (S. 2101. It requires the US Consumer Product Safety Commission (CPSC) to adopt California’s Technical Bulletin 117–2013 as a federal flammability standard for residential upholstered furniture.”60
Playing with FireThe CPSC was petitioned in 1985 to start rulemaking to create requirements to make it harder for young children to operate disposable lighters.61 Since this standard took effect, the percentage of home fire deaths in children under 5 years of age has declined. This standard requires disposable and novelty lighters to have a mechanism that makes it harder for young children to operate.
Home Structure Fires
54 D.T. Butry and D.S. Thomas, “Cigarette Fires Involving Upholstered Furniture in Residences: The Role that Smokers, Smoker Behavior, and Fire Standard Compliant Cigarettes Play,” Fire Technology 53(3) (2017): p. 1123–1146. DOI: 10.1007/s10694-016-0621-3. Epub September 2016. PMID: 28751788; PMCID: PMC5524378.
55 C. Bonander, N. Jakobsson, and F. Nilson, “Are fire safe cigarettes actually fire safe? Evidence from changes in US state laws,” Injury Prevention 24(3) (2018): p. 193–198. https://doi.org/10.1136/injuryprev-2017-042322.
56 “Smoke-Free Public Housing,” US Department of Housing and Urban Development, HUD.gov. https://www.hud.gov/program_offices/public_indian_housing/programs/ph/phecc/smokefree. Accessed March 25, 2021.
57 Carol J. Galante, “Further Encouragement for O/As to Adopt Optional Smoke-Free Housing Policies,” US Department of Housing and Urban Development, October 26, 2012. https://www.hud.gov/sites/documents/12-22HSGN.PDF. Accessed March 25, 2021.
58 Stanley Gilbert, David Butry, Rick Davis, and Richard Gann, “Estimating the Impact of 16 CFR Part 1633 on Bed Fire Outcomes,” NIST Technical Notes 2092, 2020.
59 “Technical Specifications,” UFAC. https://ufac.org/technical-specifications/. Accessed on January 28, 2021.
60 Provisions of Interest Fiscal 2021 Omnibus Legislation Public Law No: 116–260. 2021.

46
Development and Use of Current CodesSmoke AlarmsIn 1976, NFPA 101,® Life Safety Code,® required smoke alarms in new and
existing dwellings and apartments for the first time. Battery-powered devices were allowed in existing dwellings, while hardwired detectors were required for new construction.
UL collaborated with the National Institute of Standards and Technology (NIST) in the development of the first edition of UL 217, Standard for Smoke Alarms, released in 1976.62
In 1989, 85 percent of households surveyed by phone reported that they had at least one smoke alarm. With such widespread use, attention could then be focused on improving protection. For a smoke alarm’s early warning to be effective, it has to be heard or recognized and occupants must be capable of taking effective action. Single-station smoke alarms might not be heard throughout a home. NFPA 74, Recommended Good Practices for the Installation of Automatic Fire Alarm Systems for Private Dwellings, first recommended interconnected smoke alarms in new construction in 1989.
In the last decade, codes and standards work related to smoke alarms has focused on improving the technology used for detection. As part of a Fire Protection Research Foundation project,63 UL characterized the
smoke produced by flaming and smoldering polyurethane foam (which is typically found in upholstered furniture) and the activation time of ionization and photoelectric sensors. Because cooking has been identified as a frequent source of nuisance activations of smoke alarms, UL also researched the characteristics of normal cooking smoke. Findings from these studies led to changes in UL 217, 8th edition and UL 268, Standard for Smoke Detectors for Fire Alarm Systems, 7th edition.64 The new smoke alarm technology is designed to respond promptly to both flaming and smoldering fires and not sound when normal cooking is underway.
Another area of improvement in the technology has been increasing the audibility of alarms for people with hearing loss. The 2013 edition of NFPA 72®, National Fire Alarm and Signaling Code®, requires audible notification appliances used in bedrooms to produce a low-frequency signal for those with mild to severe hearing loss.
In an effort to increase smoke alarm reliability, a number of states have passed legislation requiring long-life batteries in smoke alarms. Concerns about the impact of these requirements were raised at the 2019 National Smoke Alarm Summit. The report from the summit65 notes that “Legislation for smoke alarms varies across the nation and often conflicts with nationally recognized standards.
Home Structure Fires
61 L.E. Smith, M.A. Greene, and H.A. Singh, “Study of the effectiveness of the US safety standard for child resistant cigarette lighters,” Injury Prevention 8 (2002): p. 192–196. https://www.cpsc.gov/s3fs-public/lighters.pdf.
62 What You Need to Know About Smoke Alarms,” UL, February 2018. https://www.ul.com/news/what-you-need-know-about-smoke-alarms
63 Thomas Z. Fabian and Pravinray D. Gandhi, Smoke Characterization Project Technical Report. Fire Protection Research Foundation, 2007.
64 “UL Releases New Requirements to Smoke Alarm Standards, Opens New Test Lab,” UL, February 2018. https://www.ul.com/news/ul-releases-new-requirements-smoke-alarm-standards-opens-new-test-lab. Accessed June 15, 2020.
65 2019 National Smoke Alarm Summit: Evidence Informing Action: Consensus Priorities to Increase the Use of Smoke Alarms in US Homes. Johns Hopkins Center for Injury Research and Policy. Prepared for: The Vision 20/20 Project, p. 6. https://strategicfire.org/wp-content/uploads/2020/04/V2020-2019-Smoke-Alarm-Summit-Report-01.03.20-2.pdf

47
A legislative agenda needs to be developed to prevent potential conflicts in issues such as battery life, new technologies, and combination alarm configurations that may not be currently allowed under some state, city, or local laws.”
CookingMultiple studies by the CPSC66, 67 and the Fire Protection Research Foundation68 ultimately led to the inclusion of requirements for electric coil ranges in UL 858, Standard for Household Electric Ranges, to prevent the ignition of cooking oil. These requirements took effect in June 2018. Efforts are underway to develop similar requirements for other range technologies. However, because ranges last a long time, it will take years before these ranges become common in US homes. A retrofit technology for electric coil ranges has been found to reduce cooking fires in housing for low-income older adults.69
CandlesSeveral voluntary fire safety standards for candles were developed by ASTM at the request of the CPSC in the 1990s. After the introduction of these standards, the number of candle fires started to decline.
Informed PublicSmoke AlarmsThe 1977 NFPA Fire Prevention Week (FPW) theme was “Where there’s smoke … there should be an alarm” with the subtitle “It’s
one sure way to get out of the house in time.”
As smoke alarms have become more common, the focus of fire safety has shifted to testing and maintenance of alarms. By the mid-to-late 1980s, no smoke alarms operated in roughly one-third of the reported home fires considered large enough to activate the smoke alarms that were present.70 By 1988, four out of five (81 percent) US households had a smoke alarm.
The NFPA 1988 FPW theme was “A sound you can live with: Test your detector.”
Then in 2016, the NFPA Fire Prevention Week theme was “Don’t Wait — Check the Date. Replace smoke alarms every 10 years.”
CookingWith cooking causing an increasing share of the nation’s home fires and home fire deaths, NFPA chose “Serve Up Fire Safety in the Kitchen!” as its 2020 Fire Prevention Week theme.
Home Structure Fires
66 Contractor Report on Development and Testing of a Temperature-Sensing Control System for Preventing Cooking Fires on Ranges and Status of Staff Cooking Fire Reduction Efforts. Primaira, 2012. https://www.cpsc.gov/s3fs-public/cookingfires.pdf
67 Erik L. Johnson. Study of Technology for Detecting Pre-Ignition Conditions of Cooking-Related Fires Associated with Electric and Gas Ranges and Cooktops, Final Report: Part 1 or 2. NIST, 1998. https://www.cpsc.gov/s3fs-public/pdfs/352178c.pdf
68 Joshua Dinaburg and Daniel T. Gottuk. Development of Standardized Cooking Fires for Evaluation of Prevention Technologies: Data Analysis. Fire Protection Research Foundation, July 2014. https://www.nfpa.org/News-and-Research/Data-research-and-tools/Electrical/Development-of-Standardized-Cooking-Fires-for-Evaluation-of-Prevention-Technologies
69 Annie Pickett, “Teaching and Technology: A Recipe for Fire Safe Cooking,” 2018 Model Performance in Community Risk Reduction Symposium (Reston, VA: 2018). Accessed at https://strategicfire.org/wp-content/uploads/2018/05/Fire-Safe-Cooking-Pickett-Summary.pdf on June 24, 2020.
70 John R. Hall, Jr. US Experience with Smoke Detectors. Quincy, MA: NFPA, 1990.
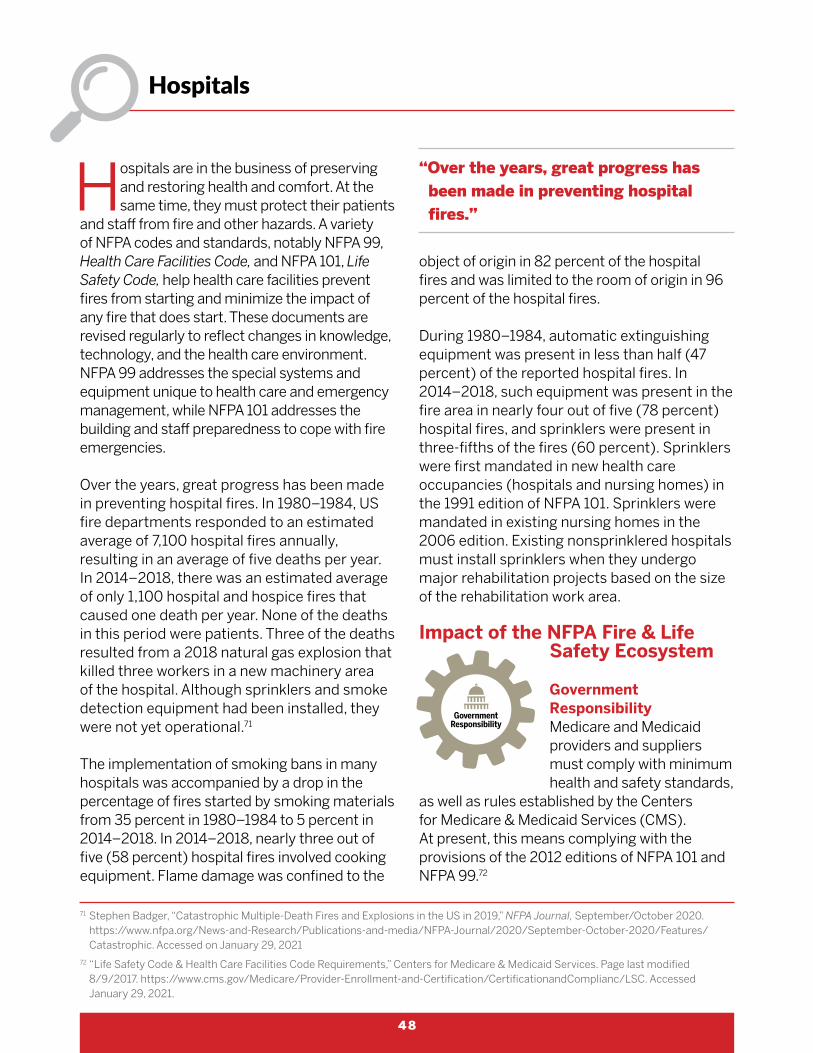
48
Hospitals are in the business of preserving and restoring health and comfort. At the same time, they must protect their patients
and staff from fire and other hazards. A variety of NFPA codes and standards, notably NFPA 99, Health Care Facilities Code, and NFPA 101, Life Safety Code, help health care facilities prevent fires from starting and minimize the impact of any fire that does start. These documents are revised regularly to reflect changes in knowledge, technology, and the health care environment. NFPA 99 addresses the special systems and equipment unique to health care and emergency management, while NFPA 101 addresses the building and staff preparedness to cope with fire emergencies.
Over the years, great progress has been made in preventing hospital fires. In 1980–1984, US fire departments responded to an estimated average of 7,100 hospital fires annually, resulting in an average of five deaths per year. In 2014–2018, there was an estimated average of only 1,100 hospital and hospice fires that caused one death per year. None of the deaths in this period were patients. Three of the deaths resulted from a 2018 natural gas explosion that killed three workers in a new machinery area of the hospital. Although sprinklers and smoke detection equipment had been installed, they were not yet operational.71
The implementation of smoking bans in many hospitals was accompanied by a drop in the percentage of fires started by smoking materials from 35 percent in 1980–1984 to 5 percent in 2014–2018. In 2014–2018, nearly three out of five (58 percent) hospital fires involved cooking equipment. Flame damage was confined to the
object of origin in 82 percent of the hospital fires and was limited to the room of origin in 96 percent of the hospital fires.
During 1980–1984, automatic extinguishing equipment was present in less than half (47 percent) of the reported hospital fires. In 2014–2018, such equipment was present in the fire area in nearly four out of five (78 percent) hospital fires, and sprinklers were present in three-fifths of the fires (60 percent). Sprinklers were first mandated in new health care occupancies (hospitals and nursing homes) in the 1991 edition of NFPA 101. Sprinklers were mandated in existing nursing homes in the 2006 edition. Existing nonsprinklered hospitals must install sprinklers when they undergo major rehabilitation projects based on the size of the rehabilitation work area.
Impact of the NFPA Fire & Life Safety Ecosystem
Government ResponsibilityMedicare and Medicaid providers and suppliers must comply with minimum health and safety standards,
as well as rules established by the Centers for Medicare & Medicaid Services (CMS). At present, this means complying with the provisions of the 2012 editions of NFPA 101 and NFPA 99.72
Hospitals
71 Stephen Badger, “Catastrophic Multiple-Death Fires and Explosions in the US in 2019,” NFPA Journal, September/October 2020. https://www.nfpa.org/News-and-Research/Publications-and-media/NFPA-Journal/2020/September-October-2020/Features/Catastrophic. Accessed on January 29, 2021
72 “Life Safety Code & Health Care Facilities Code Requirements,” Centers for Medicare & Medicaid Services. Page last modified 8/9/2017. https://www.cms.gov/Medicare/Provider-Enrollment-and-Certification/CertificationandComplianc/LSC. Accessed January 29, 2021.
“Over the years, great progress has been made in preventing hospital fires.”

49
Looking at long-term trends in fires in nursing homes is not possible due to a change in how these fires are coded.
In NFIRS 5.0, property use code 311 is used to identify nursing homes. Earlier versions of NFIRS did not have a property use code specifically for nursing homes or board and care facilities. Rather, there were only four choices under the classification of Care of the Aged: • 311. Care of the aged with nursing staff. • 312. Care of the aged without nursing staff. • 319. Care of the Aged not classified above. • 310. Care of the Aged; insufficient
information available to classify further.
Since 2002, the number of reported nursing home fires has fluctuated from 2,500 to 3,200 with no clear trend.
The two deadliest nursing home fires in this century both occurred in 2003. One fire claimed 16 lives, while the other claimed 14. Both properties were unsprinklered.73 In 2014–2018, all the nursing home fire deaths (2 per year) occurred in properties with sprinklers. During this period, local fire departments responded to an estimated average of 2,870 nursing home fires per year. These fires caused an average of two civilian deaths, 97 civilian injuries, and $12 million in direct property damage annually.
Nursing Homes
74 Ashley Smith, “Old & New,” NFPA Journal, December 2014. www.nfpa.org/News-and-Research/Publications-and-media/NFPA-Journal/2015/January-February-2015/Features/Old-and-New
Figure 36. Reported nursing home fires 2002–2018
0
500
1,000
1,500
2,000
2,500
3,000
3,500
2000 2002 2004 2006 2008 2010 2012 2014 2016 2018 2020
Government ResponsibilityThe CMS eventually finalized a retrofit requirement for sprinklers in existing nursing homes based on the 2006 edition of NFPA 101.74 Such work was to be completed
by August 13, 2013. Failure to comply could result in violation notices or eventual denial of Medicare and Medicaid reimbursement for facilities with serious or chronic violations.
The CMS estimated that by 2015, 97 percent of US nursing homes had new or updated sprinkler systems, although more than 380 nursing homes, accounting for 52,000 residents in 39 states, remained without full or any sprinkler protection.
There has been little increase in sprinkler presence in reported nursing home fires; it is still hovering around two-thirds of the fires.
Impact of the NFPA Fire & Life Safety Ecosystem

50
While most fires kill one person or occasionally two, non-residential fires that kill three or more people and
residential fires that kill five or more people are much less common. Annual NFPA studies have tracked these fires since 1988.
NFPA actively seeks information on these incidents, first through media accounts, then through information requests to the responding fire department, and finally in follow-up surveys from state fire authorities. For the purpose of these studies, NFPA does not consider board and care properties or vacant buildings as residential occupancies. The information in this section of the report was obtained from NFPA’s annual studies of catastrophic multiple-death fires.
Figure 37 shows a clear downward trend from 1988 through 2018, dropping from an average of 56 such fires per year in 1988–1992 to an average of 21 such incidents annually in 2014–2018.
The number of deaths resulting from these multiple-death fires has shown a similar downward trend, with an average of 338 such deaths per year in 1988–1992 dropping to an annual average of 139 deaths per year in 2014–2018. However, the death count for the last three years was higher than the earlier years in the decade. It is too early though to say if this is a fluctuation or a consistent upward trend. See Figure 38.
Catastrophic Multiple-Death Fires
Figure 37. Catastrophic non-vehicle multiple-death fires by year
Figure 38. Catastrophic non-vehicle multiple-death fire victims by year
50 5248
43
28
41 42
3229
3431
38
24
3025
29
23
15
27 27
18 16
28
20
1419 20
8
20 2124
0
10
20
30
40
50
60
1988
1989
1990
1991
1992
1993
1994
1995
1996
1997
1998
1999
20002001
20022003
20042005
20062007
20082009
20102011
20122013
20142015
20162017
2018
Fires 5-year average
251
329329
278
148
275249
324
159184171181
130156
129
280
12098
165155
11182
172
10272
117108
38
146150
198
0
50
100
150
200
250
300
350
1988
1989
1990
1991
1992
1993
1994
1995
1996
1997
1998
1999
20002001*
20022003
20042005
20062007
20082009
20102011
20122013
20142015
20162017
2018
Deaths 5-year average
* The 2,666 fire deaths at the World Trade Center and the 125 deaths at the Pentagon caused by the terrorist attacks on September 11, 2001, are not included in this graph.
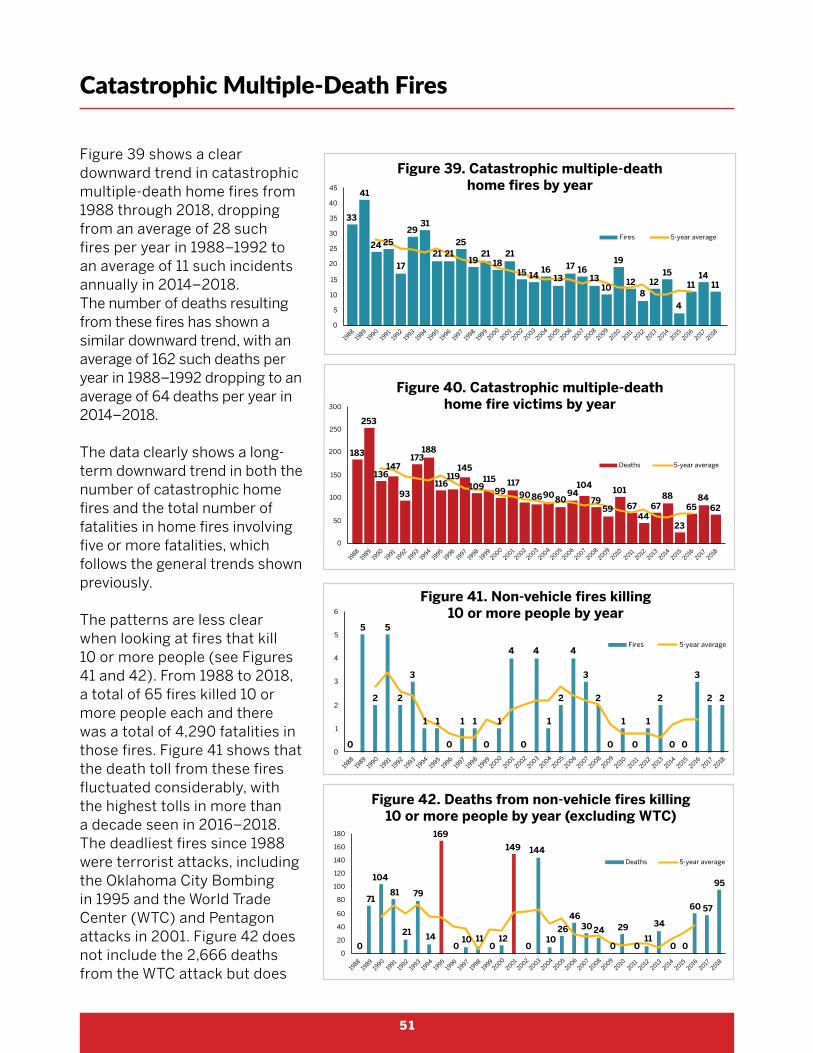
51
Figure 39 shows a clear downward trend in catastrophic multiple-death home fires from 1988 through 2018, dropping from an average of 28 such fires per year in 1988–1992 to an average of 11 such incidents annually in 2014–2018. The number of deaths resulting from these fires has shown a similar downward trend, with an average of 162 such deaths per year in 1988–1992 dropping to an average of 64 deaths per year in 2014–2018.
The data clearly shows a long-term downward trend in both the number of catastrophic home fires and the total number of fatalities in home fires involving five or more fatalities, which follows the general trends shown previously.
The patterns are less clear when looking at fires that kill 10 or more people (see Figures 41 and 42). From 1988 to 2018, a total of 65 fires killed 10 or more people each and there was a total of 4,290 fatalities in those fires. Figure 41 shows that the death toll from these fires fluctuated considerably, with the highest tolls in more than a decade seen in 2016–2018. The deadliest fires since 1988 were terrorist attacks, including the Oklahoma City Bombing in 1995 and the World Trade Center (WTC) and Pentagon attacks in 2001. Figure 42 does not include the 2,666 deaths from the WTC attack but does
Catastrophic Multiple-Death Fires
Figure 39. Catastrophic multiple-death home fires by year
Figure 40. Catastrophic multiple-death home fire victims by year
33
41
24 25
17
2931
21 2125
1921
1821
15 1416
1317 16
1310
19
128
1215
4
1114
11
0
5
10
15
20
25
30
35
40
45
1988
1989
1990
1991
1992
1993
1994
1995
1996
1997
1998
1999
20002001
20022003
20042005
20062007
20082009
20102011
20122013
20142015
20162017
2018
Fires 5-year average
183
253
136147
93
173188
116119
145
109115
99117
9086908094
104
7959
101
6744
6788
23
6584
62
0
50
100
150
200
250
300
1988
1989
1990
1991
1992
1993
1994
1995
1996
1997
1998
1999
20002001
20022003
20042005
20062007
20082009
20102011
20122013
20142015
20162017
2018
Deaths 5-year average
Figure 41. Non-vehicle fires killing 10 or more people by year
Figure 42. Deaths from non-vehicle fires killing 10 or more people by year (excluding WTC)
0
5
2
5
2
3
1 1
0
1 1
0
1
4
0
4
1
2
4
3
2
0
1
0
1
2
0 0
3
2 2
0
1
2
3
4
5
6
1988
1989
1990
1991
1992
1993
1994
1995
1996
1997
1998
1999
20002001
20022003
20042005
20062007
20082009
20102011
20122013
20142015
20162017
2018
Fires 5-year average
0
71
104
81
21
79
14
169
010 11
012
149
0
144
1026
4630 24
0
29
011
34
0 0
60 57
95
0
20
40
60
80
100
120
140
160
180
1988
1989
1990
1991
1992
1993
1994
1995
1996
1997
1998
1999
20002001
20022003
20042005
20062007
20082009
20102011
20122013
20142015
20162017
2018
Deaths 5-year average

52
Catastrophic Multiple-Death Fires
Figure 43. Deaths from non-vehicle fires killing 10 or more people by leading types and year: 1988–2018
(terrorist attacks in 1995 and 2001 excluded)
0
20
40
60
80
100
120
140
160
1988
1989
1990
1991
1992
1993
1994
1995
1996
1997
1998
1999
20002001
20022003
20042005
20062007
20082009
20102011
20122013
20142015
20162017
2018
Other residential
Nursing home
Board and care
Wildland/urban interface
Assembly, including the Ghost Ship
Home
Manufacturing, process, or utility
include the victims from the Pentagon. Only fire deaths are shown in these graphs. In many cases, others died of non-fire injuries.
Figure 43 helps tell the story of what causes the fluctuations in these numbers by removing the deaths caused by terrorist attacks and identifies the number of deaths per property type for the other fires. The high number of deaths in the early nineties was caused by the Happy Land nightclub fire in New York in 1990 (87 fatalities) and the fire resulting from the Waco raid in Texas in 1993 (47 fatalities). In 2003, the Station Nightclub fire in Rhode Island
caused 100 fatalities and, in 2016, the Ghost Ship fire in California caused 36 fatalities. Figure 43 also shows a low but consistent involvement of homes over the years. The growing share of wildland/urban interface (WUI) fires causing a high number of fatalities shows the impact of the increased wildfire risk. This will be explored further in the next section.
“The growing share of wildland/urban interface (WUI) fires causing a high number of fatalities shows the impact of the increased wildfire risk.”

53
Catastrophic Multiple-Death Fires
Code Compliance While the general downward trend in fires involving catastrophic multiple deaths shows the successes discussed in previous sections, fires
with 10 or more fatalities tell a different story. Apart from wildland fires, the biggest losses in single events are caused by fires in assembly-type occupancies like nightclubs. These fires include the Happy Land nightclub fire in New York in 1990 (87 fatalities), the Station Nightclub fire in Rhode Island in 2003 (100 fatalities), and the Ghost Ship fire in California in 2016 (36 fatalities). A common thread in those fires was a lack of enforcement of the codes in place.
Tolle, Chen, and Hsu studied the 2016 Ghost Ship fire, compared it to other catastrophic nightclub fires, and found several common factors: crowding, poor maintenance, code violations, lack of permits, insufficient egress, and insufficient or lack of suppression systems.75
Fire Code Specialist Tom Jenson of the Minnesota State Fire Marshal’s Office recently wrote76 that the week of February 17, 2003, was a bad week for nightclubs. Early in the morning of February 17, 21 people were fatally injured in a stampede at the E2 Nightclub in Chicago after guards used pepper spray to break up a fight. The establishment had been ordered closed due to building code violations but was still operating. On February 20, a fire started by illegal pyrotechnics in the Station Nightclub in West Warwick, Rhode Island claimed 100 lives. However, only one person needed treatment at the scene of a fire in the Minneapolis Fire Line Music Café, which was started by illegal pyrotechnics on the night of February 17. In response to news coverage of the E2 disaster, Fine Line management had called a staff meeting that morning to review their emergency plan. Their property was also protected by sprinklers. Trained staff and sprinklers made the difference.
Impact of the NFPA Fire & Life Safety Ecosystem
75 Frederick Tolle, Allison P. Chen, and Edbert B. Hsu, “Fire at the Oakland Ghost Ship Warehouse: A Disaster Life Cycle-Based Analysis,” American Journal of Disaster Medicine 15(4) (2020): 293–302. DOI: https://doi.org/10.5055/ajdm.2020.0378
76 Tom Jenson. “Remembering the Week of February 17, 2003.” SFMD Newsletter. https://dps.mn.gov/divisions/sfm/for-fire-departments/sfmd-newsletter/Pages/the-week-of-february-17.aspx. Accessed February 2, 2021.
“Apart from wildland fires, the biggest losses in single events are caused by fires in assembly-type occupancies like nightclubs.”
“A common thread in those fires was a lack of enforcement of the codes in place.”
Common factors in catastrophic nightclub fires:
• Crowding
• Poor maintenance
• Code violations
• Lack of permits
• Insufficient egress
• Insufficient or lack of suppression systems

54
As the wildland/urban interface has grown, so too has the intensity of the fire problem in these areas. According to data from
NFPA annual reports of catastrophic multiple-death fires, from 1988 through 2018, a total of 248 people died in WUI fires that killed at least 10 people. The 2019 NFPA Largest Fires in the United States77 list showed that 7 of the 10 costliest (inflation-adjusted) fires in the US were fires in the wildland/urban interface. The earliest was the Oakland firestorm in 1991. Five were in 2015 or later. Information on these catastrophic fires was collected separately from the National Fire Incident Reporting System. WUI fires burn homes, cars, and a wide variety of other properties. Fatal injuries can occur in homes, outside, or in vehicles while trying to evacuate. NFPA does not have detailed information on these catastrophic fires. Limitations of the various reporting systems make it impossible to obtain all the details.
In 2014–2018, local fire departments responded to an estimated average of 299,700 brush, grass, or forest fires. That number does not include fires handled exclusively by state or federal agencies. Most of these fires were small. Unfortunately, different data sources use different definitions and classifications for fires. For most incidents, NFIRS does not capture if the fire occurred in an urban, suburban, rural, or WUI environment.
Radeloff, et al. notes78 that the WUI has more fires than uninhabited wildland as a result of
Wildland/Urban Interface (WUI)
Figure 44. Brush, grass, and forest fires reported to local fire departments by type of fire: 2014–2018 annual averages
Brush or brush and grass mixture, 122,300
Grass, 110,200
Forest, woods, or wildland, 28,200
Unclassified natural vegetation, 38,900
13%
9%
37%
41%
“The 2019 NFPA Largest Fires in the United States list showed that 7 of the 10 costliest (inflation-adjusted) fires in the US were fires in the wildland/urban interface. Five were in 2015 or later.”
77 “Largest fire losses in the United States,” Quincy, MA: NFPA, 2019. https://www.nfpa.org/News-and-Research/Data-research-and-tools/US-Fire-Problem/Large-loss-fires-in-the-United-States/Largest-fire-losses-in-the-United-States
78 V.C. Radeloff, et al., “Rapid growth of the US wildland-urban interface raises wildfire risk,” Proceedings of the National Academy of Sciences of the United States of America 115(13) (2018): p. 3314–3319. https://doi.org/10.1073/pnas.1718850115

55
Wildland/Urban Interface (WUI)
Figure 45. Average fire season length in relation to human- and lightning-caused fires: 1992–2015
148164
141
7245 42
0
50
100
150
200
WUI VLDH Wildlands
Nu
mb
er o
f day
s
Human Lightning
human activity. Because such fires threaten lives and homes, letting them burn is often not an option. From 1990 to 2010, the number of homes in the WUI grew 41 percent, from 31 million to 43 million. Although the WUI accounts for less than 10 percent of the conterminous US, one-third of the nation’s homes and almost one-third of the country’s population are in these areas. From 1990 to 2010, 43 percent of new houses were built in the WUI.
Mietkiewicz, et al.79 reported that roughly 85 percent of the wildfire-prone land in the West is undeveloped, leaving considerable potential for growth. They reported that from 1990 to 2015, the number of homes in the WUI increased by 32 million, or 145 percent. They also compared wildfire events that were caused by lightning or humans in the
WUI, very low-density housing (VLDH), and wildland areas. Fires in the WUI tended to be smaller than other wildland fires.
Wildland fire season lasts longer due to human-caused ignition rather than lightning causes. Human-caused WUI fires made up 97 percent of WUI fires compared to 85 percent of the fires in VLDH areas and 59 percent of all wildfires. The most common causes of WUI fires were burning debris, arson, and equipment use, while railroads, roads, power lines, and campsites were leading factors in wildland fires outside the WUI.
From 1992–2015, more than 1 million homes in total were within the perimeter of human-caused WUI fires. Including homes within 1,000 meters of these fires, almost 60 million homes
79 Mietkiewicz, Nathan; Balch, Jennifer K.; Schoennagel, Tania; Leyk, Stefan; St. Denis, Lise A.; Bradley, Bethany A. 2020. “In the Line of Fire: Consequences of Human-Ignited Wildfires to Homes in the US (1992–2015).” Fire 3, no. 3: 50.
1 MILLIONHomes were within the perimeter of human-caused WUI fires . (1992-2015)

56
Wildland/Urban Interface (WUI)
were threatened by such incidents in the 24-year period. Less than 2 million WUI homes were threatened by fires caused by lightning.
From 1999 to 2014, an average of 2.5 million WUI homes was either in the perimeter or within one km of a human-started wildfire.
Wildfires that were smaller than 1 km2 in size threatened an average of 1.4 million homes, while wildfires that were larger than 500 km2 threatened an average of 551 homes. While large fires get more media coverage, the dangers of small wildfires should not be overlooked.
Data from the National Interagency Fire Center shows an upward trend in the total acreage burned in wildfires each year. From 1983 to 1993, an average of 2.7 million acres burned each year; during the following 10-year period, that number was 4.2 million acres; and, following that, from 2003 to 2012, an average of 7.3 million acres burned each year.80 While the number of homes and businesses destroyed by wildfires each year is difficult to calculate, major incidents that result in hundreds or even thousands of destroyed homes continue to occur annually.81 Notably, the 2018 Camp Fire in Butte County, California killed 85 people and destroyed
18,800 structures.82 These structures included 13,700 single-family homes and 300 multifamily housing units, causing between $6 and $9 billion in insured losses and between $11 and $13 billion in total losses.83 In 2016, a wildfire in the eastern part of Tennessee destroyed 2,100 homes and killed 14 people.84
Impact of the NFPA Fire & Life Safety Ecosystem
Government ResponsibilityA study of a small number of municipalities that had adopted WUI regulations sought to understand the motivations and obstacles for using such
regulations to address community wildfire risk. In interviews with these communities, Duerksen, Elliott, and Anthony85 learned that most of the localities first adopted WUI regulations after a major wildfire. A
80 “Total Wildland Fires and Acres, 1926–2017,” National Interagency Fire Center. https://www.nifc.gov/fireInfo/fireInfo_stats_totalFires.html
81 “Wildland Fire Summaries, 2014–2017,” National Interagency Fire Center. https://www.nifc.gov/fireInfo/fireInfo_statistics.html (Recent wildfire incident documentation shows thousands of structures destroyed not only in California but also in Colorado, Texas, and Tennessee).
82 “Top 20 Most Destructive California Wildfires,” CAL FIRE, March 2019. https://www.fire.ca.gov/media/t1rdhizr/top20_destruction.pdf
83 “Modeler: Insured Losses from Camp Wildfire in California at $6B to $9B,” Insurance Journal, December 2018. https://www.insurancejournal.com/news/west/2018/12/06/511240.htm
84 Stephen Badger. Catastrophic Multiple-Death Fires in 2016. Quincy, MA: NFPA, 2017. https://www.nfpa.org/News-and-Research/Data-research-and-tools/US-Fire-Problem/Catastrophic-multiple-death-fires
85 C. Duerksen, D. Elliott, and P. Anthony. Addressing Community Wildfire Risk: A Review and Assessment of Regulatory and Planning Tools. Clarion Associates, Fire Protection Research Foundation, 2011.
The total acreage burned in wildfires each year is
Trending up

57
Wildland/Urban Interface (WUI)
few did so proactively or in response to state requirements or incentives. However, a strong public education campaign was needed to convince a skeptical public. None of the communities adopted a model WUI-related code in its entirety, while some used model codes to craft their own regulations.
Informed PublicWildfire safety programs are responsible for educating property owners on the basic steps necessary to reduce the risk of property loss
due to wildfire, and experience has shown that such programs can have a direct impact on life safety, the scale of property loss, and recovery costs. The Firewise USA® recognition program empowers residents to work collaboratively to reduce wildfire risks. Currently, there are more than 1,700 recognized Firewise USA® sites in 43 states actively engaging residents to prepare and protect their homes against the threat of wildfire.
Preparedness and Emergency ResponseLocal fire departments are frequently called to brush, grass, and forest fires.86 While small fires can often be handled easily, a lack
of specialized training and gear can make larger brush, grass, and forest fires more challenging and dangerous for local firefighters. The NFPA Fourth Needs Assessment of the U.S. Fire Service87 found that:
86 Marty Ahrens. Brush, Grass, and Forest Fires. Quincy, MA: NFPA, 2018.
87 Fourth Needs Assessment of the US Fire Service: Conducted in 2015 and Including Comparisons to the 2001, 2005, and 2010 Needs Assessment Surveys. (Quincy, MA: NFPA, 2016), 79–81.
Almost 3/4 (71 percent) of the fire departments that perform wildland firefighting or fight structure fires in the WUI have not formally trained all their firefighters for such work.
2/3 of the departments that fight these fires have personnel who do not have personal protective clothing designed for wildland firefighting.
Around 29% of the departments have
firefighters who have not received specialized training in firefighting in the wildland/urban interface.

58
Through the lens of the NFPA Fire & Life Safety Ecosystem, government responsibility, the development and use of
current codes, and an informed public have had the most obvious impact on the fire experience since 1980. This is best exemplified by the impact of smoke alarms. The combination of an engineered solution enforced through the codes and supported by educating the public has been effective in bringing down the number of reported fires and fire deaths. Smoke alarms provide a warning, while public education helps to make people aware of the importance of leaving quickly through the nearest exit and ensuring that doors are closed behind them to prevent fire from spreading further.
The impact of codes and standards is also reflected in the difference in death rate per 1,000 reported fires in 1- and 2-family homes compared to apartment buildings. Occupants of high-rise buildings are more likely to be vulnerable to fire due to poverty and/or age, yet the death rate per 1,000 fires in high-rise buildings has dropped from 6.0 from 1985 to 1989 to 3.4 in 2014 to 2018. In apartment buildings overall, the death rate per 1,000 fires
has decreased from 7.1 in 1980 to 4.2 in 2018. For 1- and 2-family homes, the death rate per 1,000 fires has increased from 7.1 in 1980 to 8.5 in 2018. It should be kept in mind that monitored alarm systems, which are present in some apartment buildings but rarely in 1- and 2-family homes, can cause more minor fires to be reported in those buildings and, therefore, could potentially skew the death rate per 1,000 fires to a lower number for apartment buildings. However, the difference in the fire death rate between apartment buildings and 1- and 2-family homes is so significant that it also speaks to the positive impact of fire protection measures as apartment buildings and, in particular, high-rise buildings have stricter code requirements related to compartmentation and
Discussion
“Through the lens of the NFPA Fire & Life Safety Ecosystem, government responsibility, the development and use of current codes, and an informed public have had the most obvious impact on the fire experience since 1980.”
“The difference in the fire death rate between apartment buildings and 1- and 2-family homes is so significant that it also speaks to the positive impact of fire protection measures as apartment buildings and, in particular, high-rise buildings have stricter code requirements related to compartmentation and sprinklers. Using these lessons from apartment buildings to protect 1- and 2-family homes could reduce the home fire problem.”

59
Discussion
sprinklers. Using these lessons from apartment buildings to protect 1- and 2-family homes could reduce the home fire problem.
Looking at the data for catastrophic US fires with 10 or more deaths, the data shows that these types of fires have become rare in buildings such as hospitals, nursing homes, hotels, and schools. These types of buildings typically have stricter code requirements in particular related to the installation of sprinklers. This indicates that where sprinklers are required by codes, we see an impact. Catastrophic fires with 10 or more deaths are now primarily caused by wildfires, which will be discussed later.
Despite continuous public education on the importance of maintaining smoke alarms, unwanted alarms, typically caused by ordinary cooking, often lead to smoke alarms being disabled by removing the battery or disconnecting it from the power source. Beginning in 2022, manufacturers seeking UL listing for their smoke detectors and smoke alarms will be required to demonstrate that the devices are resistant to cooking nuisance alarms while also activating within three minutes to burning polyurethane foam. This is an example of how product standards can impact fire safety. Studies to assess the impact of this new technology on unwanted alarms and on both reported and unreported fires will be needed.
Product standards (voluntary and mandatory) play an important role in fire safety. The impact of a voluntary standard is evidenced by the introduction of candle fire safety standards. A dramatic increase in candle sales in the 1990s was accompanied by a corresponding increase in candle fires. Instead of issuing mandatory requirements, CPSC requested that ASTM develop candle fire safety standards. These
standards contributed to a marked decrease in these fires.
Smoking has been the leading cause of home fire deaths for most of the last four decades and has remained the leading cause for 2014–2018 as a whole. The government has tried several approaches to address this issue. Upholstered furniture or mattresses and bedding are often the item first ignited by smoking materials, which led the CPSC to issue mandatory flammability standards for mattresses and support voluntary upholstered furniture standards, such as the Upholstered Furniture Action Council’s Construction Criteria. Another proposed solution was limiting the potential for cigarettes to ignite
“Looking at the data for catastrophic US fires with 10 or more deaths, the data shows that these types of fires have become rare in buildings such as hospitals, nursing homes, hotels, and schools. These types of buildings typically have stricter code requirements in particular related to the installation of sprinklers.”
60
Discussion
other items. All 50 states required fire standard compliant (FSC) cigarettes by 2012. Studies on the impact of this change have had mixed findings. Fatalities due to smoking while on medical oxygen, for example, cannot be prevented with FSC cigarettes.
Furniture is playing an increasing role in our fire experience. From 2014 to 2018 the death rates per 1,000 fires were higher for fires that began with upholstered furniture and mattresses or
bedding than for living rooms and bedrooms, indicating that these items were major factors in fires beginning in these rooms. These are relatively low-frequency, high-consequence fires. There continues to be interest in reducing the flammability of furniture. However, in recent years, concerns about the health effects of flame retardants have been raised, including the impact of test standards on the need to add flame retardants to upholstered furniture. California’s Technical Bulletin 117–2013 addressed these concerns. This is an example of how efforts to reduce one problem can exacerbate others if you are not looking at the issue holistically.
While it is not yet apparent in the data, the number of consumer electronics using lithium-ion batteries that require regular recharging is expected to be an increasing challenge to fire safety. To avoid them becoming fire hazards, product standards need to be developed/updated and consumers must be educated on the safe use of lithium-ion batteries.
The impact of other cogs of the NFPA Fire & Life Safety Ecosystem (referenced standards, an investment in safety, a skilled workforce, and code compliance) is not as easily identifiable in the high-level estimates of the fire problem. This, however, does not mean that they do not have a significant impact. On the contrary, without
“Furniture is playing an increasing role in our fire experience. From 2014 to 2018 the death rates per 1,000 fires were higher for fires that began with upholstered furniture and mattresses or bedding than for living rooms and bedrooms, indicating that these items were major factors in fires beginning in these rooms. These are relatively low-frequency, high-consequence fires.”
“Without the use of the referenced standards within a code, a continuous investment in safety, a skilled workforce to build and maintain our buildings, and enforcement of the codes, the safety system would fall apart.”

61
Discussion
the use of the referenced standards within a code, a continuous investment in safety, a skilled workforce to build and maintain our buildings, and enforcement of the codes, the safety system would fall apart. To see their impact, one must dive deeper into specific events.
As was already mentioned, a lack of code compliance is a common thread in the catastrophic events in nightclubs and other assemblies. The low priority of an investment in safety is also often mentioned in relation to these events, specifically where sprinklers have not been installed.
The lack of investment in fire safety is not only an issue in big catastrophic fires. Examples of not investing in safety in homes are not installing or maintaining smoke alarms; using inexpensive, unskilled labor to work on electrical systems or heating systems; and not installing home fire sprinklers in new
1- and 2-family homes. Older homes tend to have older wiring that might not be adequate for today’s needs. In today’s do-it-yourself world, untrained people often feel comfortable tackling electrical and heating work.
In addition, hiring qualified electricians or other technicians might not be affordable for all. A study by Fahy88 shows how poverty can be linked to elevated fire risk. She concludes that fire is only one of the risks that low-income people face, and safety can become a low priority when it is difficult to meet basic needs. Issues related to substandard housing, overcrowding, food insecurity, and neighborhood safety might take higher priority in their everyday lives.
Wildfires are becoming the dominant type of fires causing catastrophic multiple-death events, as well as large losses. While we have been successful in reducing the urban fire problem, we have yet to take the steps needed to prevent wildfires from becoming conflagrations when impacting communities in the WUI. An informed public is the cog in the NFPA Fire & Life Safety Ecosystem that has received the most attention from stakeholders; however, that one cog is far from enough. The time has come to start tackling wildfire with all the cogs of the NFPA Fire & Life Safety Ecosystem.
“Examples of not investing in safety in homes are not installing or maintaining smoke alarms; using inexpensive, unskilled labor to work on electrical systems or heating systems; and not installing home fire sprinklers in new 1- and 2-family homes.”
“Wildfires are becoming the dominant type of fires causing catastrophic multiple-death events, as well as large losses. While we have been successful in reducing the urban fire problem, we have yet to take the steps needed to prevent wildfires from becoming conflagrations when impacting communities in the WUI.”
“A lack of code compliance is a common thread in the catastrophic events in nightclubs and other assemblies. The low priority of an investment in safety is also often mentioned in relation to these events, specifically where sprinklers have not been installed.”
88 R. Fahy. Poverty and Fire Safety. Quincy, MA: NFPA, 2021.

62
Discussion
Fire and life safety can also be impacted by factors that are not immediately apparent through the NFPA Fire & Life Safety Ecosystem. One such positive impact is a public that has absorbed the message about the health hazards of secondhand smoke, which has led to an increase in the percentage of households that do not allow indoor smoking. These bans, combined with a general decline in smoking, have contributed to a reduction in smoking fires. Similarly, requirements in a number of states to restrict the use of wood-burning equipment to reduce air pollution have likely had an impact on the frequency of chimney fires.
The recent focus on climate change and the reduction of greenhouse gas emissions has created opportunities and challenges for fire and life safety. The introduction of more energy-efficient LED lights and compact fluorescents, which can be used to replace incandescent light bulbs, can reduce the risk of fires starting by electrical lighting. Use of alternative energy sources, such as solar panels, has introduced new hazards, as has the use of combustible insulation and cladding on facades. Unfortunately, fire and life safety are rarely taken into consideration in the early phases of the development of new technologies and products. That means safety precautions have to be applied after these products have been put in place.
In their report on the fire safety challenges of green buildings and attributes, Meacham and McNamee89 highlighted areas that still need attention, including the need to integrate green (sustainable) attributes of buildings into fire incident reporting systems; to incorporate fire performance considerations into the research and development of sustainable materials, technologies, and features; and to transition to more holistic, sociotechnical system approaches for building regulatory systems.
While government responsibility, development, and use of the current codes and referenced standards are cornerstones in the approach to fire safety in the built environment, this study shows the importance of all the safety cogs in the NFPA Fire & Life Safety Ecosystem. The future work and challenges discussed can all be dealt with using this system thinking. Approaching fire safety as a system, and not individual bits and pieces, provides the opportunity to unravel this complex and ongoing challenge to society and reduce further loss.
The impact of preparedness and emergency response has not been covered in detail in this study, as it is currently being studied by other organizations. Continuous training, resourcing, and preparedness of emergency responders is essential to ensuring public safety.
“Fire and life safety are rarely taken into consideration in the early phases of the development of new technologies and products. That means safety precautions have to be applied after these products have been put in place.”
“Approaching fire safety as a system, and not individual bits and pieces, provides the opportunity to unravel this complex and ongoing challenge to society and reduce further loss.”
89 Brian Meacham and Margaret McNamee. Fire Safety Challenges of Green Buildings and Attributes. Fire Protection Research Foundation, October 2020.

63
The data presented in this report tells an overall story of success when it comes to lowering the number of fires and fire
deaths. As shown, using the framework of the NFPA Fire & Life Safety Ecosystem and ensuring it is fully functional has been key to this success. The biggest single factor contributing to that success has been the use of smoke alarms, as mandated by the codes, as well as continued public education about their significance. Other successes include the impact of stricter code requirements in apartment buildings and, in particular, high-rise buildings. The introduction of hardwired smoke alarms and sprinklers in these buildings has helped reduce the death rate per 1,000 fires significantly compared to the death rate in 1- and 2-family homes.
Product safety standards also play a significant role in reducing the fire problem. The introduction of the CPSC’s safety standards for lighters was immediately followed by a decrease in fire deaths in young children. Concerns about flame retardants used to reduce furniture flammability have shown the importance of thinking about safety holistically to avoid other concerns.
Our work is far from done and, in some areas, it has only just begun. While we can enjoy the successes of safety measures implemented in the last 40 years, there are both long-term and new challenges that we need to deal with, such as the following:
• With more home cooking fires and cooking fire deaths in recent years than in the early 1980s, it is clear that more work in this area is needed.
• With roughly one of every three fatal home fire victims being 65 or older, research is needed on how to protect our most vulnerable citizens.
• Studies are needed to assess the impact of new technology for smoke alarms on unwanted alarms and both reported and unreported fires.
• The impact of wildfire on communities must be tackled using all the cogs of the NFPA Fire & Life Safety Ecosystem.
• A holistic approach to fire safety and energy efficiency is needed to ensure that new products and technologies developed to mitigate challenges do not cause unintended fire risk.
• To prevent consumer electronics using new technology from becoming fire hazards, product standards need to be developed/updated and consumers educated on potential risks.
• Efforts to educate the public about how to protect themselves from fire must be expanded to reduce fatalities and increase life safety.
Conclusion
“The data presented in this report tells an overall story of success when it comes to lowering the number of fires and fire deaths.”
“The biggest single factor contributing to that success has been the use of smoke alarms, as mandated by the codes, as well as continued public education about their significance.”
“Product safety standards also play a significant role in reducing the fire problem.”