fireinspector 2.01 user’s manual - teledyne...
TRANSCRIPT

2403 Walsh Avenue, Santa Clara, CA 95051-1302 Tel: +1/408.727.6600 Fax: +1/408.727.6622
CATC™ FireInspector™ 2.01
IEEE 1394 Bus & Protocol Analyzer
User’s Manual
Document Revision 2.01
April 18, 2002 730-0002-00

CATC FIREINSPECTOR 2.01
User’s Manual
CATC FireInspector 2.01 IEEE 1394 Bus & Protocol Analyzer User’s Manual, Document Revision 2.01
CopyrightCopyright © 2002, Computer Access Technology Corporation (CATC). Protected as an unpublished work. All Rights Reserved.
This document may be printed and reproduced without additional permission, but all copies should contain this copyright notice.
Document DisclaimerThe information in this document has been carefully checked and is believed to be reliable. However, no responsibility can be assumed for inaccuracies that may not have been detected.
CATC reserves the right to revise the information presented in this document without notice or penalty.
Changes or ModificationsAny change or modification not expressly approved by Computer Access Technology Corporation voids the user’s authority to operate this equipment.
Trademarks and ServicemarksCATC, FireInspector, Trace, and BusEngine are trademarks of Computer Access Technology Corporation.
FireWire is a trademark of Apple Computer, Inc., registered in the U.S. and other countries.
i.LINK is a trademark of Sony Electronics Inc.
Microsoft, Windows, and Windows NT are either registered trademarks or trademarks of Microsoft Corporation in the United States and/or other countries.
Intel, Pentium, and Celeron are trademarks or registered trademarks of Intel Corporation or its subsidiaries in the United States and other countries.
AMD, Athlon, Duron, and AMD-K6 are trademarks of Advanced Micro Devices, Inc.
All other trademarks are property of their respective companies.
Part number: 730-0002-00
ii

CATC FIREINSPECTOR 2.01
User’s Manual Conformance Statements
CONFORMANCE STATEMENTS
FCC Conformance Statement
This equipment has been tested and found to comply with the limits for a Class A digital device, pursuant to Part 15 of the FCC Rules. These limits are designed to provide reasonable protection against harmful interference when the equipment is operated in a commercial environment. This equipment generates, uses, and can radiate radio frequency energy, and, if not installed and used in accordance with the instruction manual, may cause harmful interference to radio communications. Operation of this equipment in a residential area is likely to cause harmful interference in which case the user will be required to correct the interference at his own expense. The end user of this product should be aware that any changes or modifications made to this equipment without the approval of CATC could result in the product not meeting the Class A limits, in which case the FCC could void the user's authority to operate the equipment.
EU Conformance Statement
This equipment complies with the EMC Directive 89/336/EEC and the Low Voltage Directive 73/23/EEC, and their associated amendments for Class A Information Technology Equipment. It has been tested and found to comply with EN55022:1995 Class A, EN61000-4-2:1995, EN61000-4-3:1995, EN61000-4-4:1995, and EN60950:1995. In a domestic environment this product may cause radio interference in which case the user may be required to take adequate measures.
iii

CATC FIREINSPECTOR 2.01
User’s Manual References
REFERENCES• IEEE Std 1394-1995, IEEE Standard for a High Performance Serial Bus, IEEE
Computer Society, 30 August 1996• ISO/IEC 13213:1994, Control and Status Register (CSR) Architecture for
Microcomputer Buses
• IEEE Std 1394a-2000: IEEE Standard for a High Performance Serial Bus — Amendment 1
• IEC-1883, Proposed standard for Digital Interface for Consumer Electronic Audio/Video Equipment.
• ANSI T10 Project 1155D, Working Draft, Revision 4, Information Technology — Serial Bus Protocol 2 (SBP-2), 19 May 1998.
• RFC2734, IPv4 over IEEE 1394
• RFC791, Internet Protocol DARPA Internet Program Protocol Specification
• RFC792, Internet Control Message Protocol DARPA Internet Program Protocol Specification
• RFC768, User Datagram Protocol
iv
CATC FIREINSPECTOR 2.01
User’s Manual Table Of Contents
TABLE OF CONTENTS
Conformance Statements . . . . . . . . . . . . . . . . . . . . . . . . . . . . . . . . . . . .iiiFCC Conformance Statement . . . . . . . . . . . . . . . . . . . . . . . . . . . . . . . . . . . . . . . . iiiEU Conformance Statement. . . . . . . . . . . . . . . . . . . . . . . . . . . . . . . . . . . . . . . . . . iii
References. . . . . . . . . . . . . . . . . . . . . . . . . . . . . . . . . . . . . . . . . . . . . . . . .iv
Table Of Contents . . . . . . . . . . . . . . . . . . . . . . . . . . . . . . . . . . . . . . . . . . v
1 FireInspector Overview. . . . . . . . . . . . . . . . . . . . . . . . . . . . . . . . . . . . . . 1IEEE 1394 Bus Version . . . . . . . . . . . . . . . . . . . . . . . . . . . . . . . . . . . . . . . . . . . . . . . . . 2The FireInspector Analyzer System Components . . . . . . . . . . . . . . . . . . . . . . . . . . . . . 3The FireInspector Analyzer Unit . . . . . . . . . . . . . . . . . . . . . . . . . . . . . . . . . . . . . . . . . . 3
Front Panel Description . . . . . . . . . . . . . . . . . . . . . . . . . . . . . . . . . . . . . . . . . . . . . 3IEEE 1394 6-Pin Port Connectors . . . . . . . . . . . . . . . . . . . . . . . . . . . . . . . . . . . 4The Trigger Push-Button . . . . . . . . . . . . . . . . . . . . . . . . . . . . . . . . . . . . . . . . . . 4
Back Panel Description . . . . . . . . . . . . . . . . . . . . . . . . . . . . . . . . . . . . . . . . . . . . . . 4Data In/Out Connector . . . . . . . . . . . . . . . . . . . . . . . . . . . . . . . . . . . . . . . . . . . . 5
External Interface Breakout Board . . . . . . . . . . . . . . . . . . . . . . . . . . . . . . . . . . . . . . . . 6Specifications . . . . . . . . . . . . . . . . . . . . . . . . . . . . . . . . . . . . . . . . . . . . . . . . . . . . . . . . . 7
Package . . . . . . . . . . . . . . . . . . . . . . . . . . . . . . . . . . . . . . . . . . . . . . . . . . . . . . . 7Power Requirements . . . . . . . . . . . . . . . . . . . . . . . . . . . . . . . . . . . . . . . . . . . . . 7Environmental Conditions . . . . . . . . . . . . . . . . . . . . . . . . . . . . . . . . . . . . . . . . . 7LEDs . . . . . . . . . . . . . . . . . . . . . . . . . . . . . . . . . . . . . . . . . . . . . . . . . . . . . . . . . 7Recording Memory Size . . . . . . . . . . . . . . . . . . . . . . . . . . . . . . . . . . . . . . . . . . 7Certification . . . . . . . . . . . . . . . . . . . . . . . . . . . . . . . . . . . . . . . . . . . . . . . . . . . . 7Basic Events Detected . . . . . . . . . . . . . . . . . . . . . . . . . . . . . . . . . . . . . . . . . . . . 7
Features of FireInspector . . . . . . . . . . . . . . . . . . . . . . . . . . . . . . . . . . . . . . . . . . . . . . . . 8System Requirements. . . . . . . . . . . . . . . . . . . . . . . . . . . . . . . . . . . . . . . . . . . . . . . . . . . 8
2 Getting Started . . . . . . . . . . . . . . . . . . . . . . . . . . . . . . . . . . . . . . . . . . . . 11Installing FireInspector . . . . . . . . . . . . . . . . . . . . . . . . . . . . . . . . . . . . . . . . . . . . . . . . 11
Software Installation . . . . . . . . . . . . . . . . . . . . . . . . . . . . . . . . . . . . . . . . . . . . . . . 11Hardware Installation. . . . . . . . . . . . . . . . . . . . . . . . . . . . . . . . . . . . . . . . . . . . . . . 11
Starting and Stopping FireInspector . . . . . . . . . . . . . . . . . . . . . . . . . . . . . . . . . . . . . . 11Starting the Application . . . . . . . . . . . . . . . . . . . . . . . . . . . . . . . . . . . . . . . . . . . . . 11Exiting the Application . . . . . . . . . . . . . . . . . . . . . . . . . . . . . . . . . . . . . . . . . . . . . 12Starting the Analyzer Box . . . . . . . . . . . . . . . . . . . . . . . . . . . . . . . . . . . . . . . . . . . 12Shutting Down the Analyzer Box . . . . . . . . . . . . . . . . . . . . . . . . . . . . . . . . . . . . . 12
v

CATC FIREINSPECTOR 2.01
User’s Manual Table Of Contents
Displaying Help . . . . . . . . . . . . . . . . . . . . . . . . . . . . . . . . . . . . . . . . . . . . . . . . . . . . . .12Setting Up the Analyzer . . . . . . . . . . . . . . . . . . . . . . . . . . . . . . . . . . . . . . . . . . . . . . . .12
Resetting the Analyzer . . . . . . . . . . . . . . . . . . . . . . . . . . . . . . . . . . . . . . . . . . . . . .12Updating the BusEngine and Firmware . . . . . . . . . . . . . . . . . . . . . . . . . . . . . . . . .13
Updating the Driver . . . . . . . . . . . . . . . . . . . . . . . . . . . . . . . . . . . . . . . . . . . . . . . . . . .13Updating the Driver on Windows 2000 . . . . . . . . . . . . . . . . . . . . . . . . . . . . . . . . .14Updating the Driver on Windows 98 SE . . . . . . . . . . . . . . . . . . . . . . . . . . . . . . . .14Updating the Driver on Windows Me. . . . . . . . . . . . . . . . . . . . . . . . . . . . . . . . . . .15Updating the Driver on Windows XP. . . . . . . . . . . . . . . . . . . . . . . . . . . . . . . . . . .16
License Keys. . . . . . . . . . . . . . . . . . . . . . . . . . . . . . . . . . . . . . . . . . . . . . . . . . . . . . . . .16Update License . . . . . . . . . . . . . . . . . . . . . . . . . . . . . . . . . . . . . . . . . . . . . . . . . . . .17License Information . . . . . . . . . . . . . . . . . . . . . . . . . . . . . . . . . . . . . . . . . . . . . . . .17
3 FireInspector User Interface . . . . . . . . . . . . . . . . . . . . . . . . . . . . . . . . .19Application Layout . . . . . . . . . . . . . . . . . . . . . . . . . . . . . . . . . . . . . . . . . . . . . . . . . . . .19Menus . . . . . . . . . . . . . . . . . . . . . . . . . . . . . . . . . . . . . . . . . . . . . . . . . . . . . . . . . . . . . .20Toolbars . . . . . . . . . . . . . . . . . . . . . . . . . . . . . . . . . . . . . . . . . . . . . . . . . . . . . . . . . . . .23Keyboard Shortcuts. . . . . . . . . . . . . . . . . . . . . . . . . . . . . . . . . . . . . . . . . . . . . . . . . . . .26
4 Recording 1394 Traffic . . . . . . . . . . . . . . . . . . . . . . . . . . . . . . . . . . . . . .27Recording Options . . . . . . . . . . . . . . . . . . . . . . . . . . . . . . . . . . . . . . . . . . . . . . . . . . . .27
General Recording Options . . . . . . . . . . . . . . . . . . . . . . . . . . . . . . . . . . . . . . . . . .28Event Options . . . . . . . . . . . . . . . . . . . . . . . . . . . . . . . . . . . . . . . . . . . . . . . . . . . . .29
Event Groups . . . . . . . . . . . . . . . . . . . . . . . . . . . . . . . . . . . . . . . . . . . . . . . . . .30Action Options . . . . . . . . . . . . . . . . . . . . . . . . . . . . . . . . . . . . . . . . . . . . . . . . . . . .32
Trigger . . . . . . . . . . . . . . . . . . . . . . . . . . . . . . . . . . . . . . . . . . . . . . . . . . . . . . .33Filter . . . . . . . . . . . . . . . . . . . . . . . . . . . . . . . . . . . . . . . . . . . . . . . . . . . . . . . . .33Restart . . . . . . . . . . . . . . . . . . . . . . . . . . . . . . . . . . . . . . . . . . . . . . . . . . . . . . . .33Count1 and Count2 . . . . . . . . . . . . . . . . . . . . . . . . . . . . . . . . . . . . . . . . . . . . . .33Event to Event Sequencing . . . . . . . . . . . . . . . . . . . . . . . . . . . . . . . . . . . . . . . .34Enable/Disable External General Purpose Output . . . . . . . . . . . . . . . . . . . . . .34Enable External General Purpose Output Only . . . . . . . . . . . . . . . . . . . . . . . .34External Output Form . . . . . . . . . . . . . . . . . . . . . . . . . . . . . . . . . . . . . . . . . . . .35
Saving Recording Options . . . . . . . . . . . . . . . . . . . . . . . . . . . . . . . . . . . . . . . . . . .35Loading Recording Options . . . . . . . . . . . . . . . . . . . . . . . . . . . . . . . . . . . . . . . . . .35
Making a Recording . . . . . . . . . . . . . . . . . . . . . . . . . . . . . . . . . . . . . . . . . . . . . . . . . . .36Recording . . . . . . . . . . . . . . . . . . . . . . . . . . . . . . . . . . . . . . . . . . . . . . . . . . . . . . . .36Uploading . . . . . . . . . . . . . . . . . . . . . . . . . . . . . . . . . . . . . . . . . . . . . . . . . . . . . . . .37Recording Status . . . . . . . . . . . . . . . . . . . . . . . . . . . . . . . . . . . . . . . . . . . . . . . . . . .37
Pre-Trigger . . . . . . . . . . . . . . . . . . . . . . . . . . . . . . . . . . . . . . . . . . . . . . . . . . . .37Post-Trigger . . . . . . . . . . . . . . . . . . . . . . . . . . . . . . . . . . . . . . . . . . . . . . . . . . .38Uploading . . . . . . . . . . . . . . . . . . . . . . . . . . . . . . . . . . . . . . . . . . . . . . . . . . . . .38
Resetting the 1394 Bus . . . . . . . . . . . . . . . . . . . . . . . . . . . . . . . . . . . . . . . . . . . . . . . . .38
vi

CATC FIREINSPECTOR 2.01
User’s Manual Table Of Contents
Enabling and Disabling Configuration ROM . . . . . . . . . . . . . . . . . . . . . . . . . . . . . . . 39
5 CATC Trace Files . . . . . . . . . . . . . . . . . . . . . . . . . . . . . . . . . . . . . . . . . 41Display Options . . . . . . . . . . . . . . . . . . . . . . . . . . . . . . . . . . . . . . . . . . . . . . . . . . . . . . 42
General Display Options . . . . . . . . . . . . . . . . . . . . . . . . . . . . . . . . . . . . . . . . . . . . 42Field Color, Format, and Hiding Options . . . . . . . . . . . . . . . . . . . . . . . . . . . . . . . 43
Set Field Colors . . . . . . . . . . . . . . . . . . . . . . . . . . . . . . . . . . . . . . . . . . . . . . . . 44Set Field Formats . . . . . . . . . . . . . . . . . . . . . . . . . . . . . . . . . . . . . . . . . . . . . . . 45Set Field Bit or Byte Order . . . . . . . . . . . . . . . . . . . . . . . . . . . . . . . . . . . . . . . 46Set Field Hiding . . . . . . . . . . . . . . . . . . . . . . . . . . . . . . . . . . . . . . . . . . . . . . . . 46
Level Hiding Options. . . . . . . . . . . . . . . . . . . . . . . . . . . . . . . . . . . . . . . . . . . . . . . 47Define Packets to Hide Dialog. . . . . . . . . . . . . . . . . . . . . . . . . . . . . . . . . . . . . 48
Restore Factory Presets . . . . . . . . . . . . . . . . . . . . . . . . . . . . . . . . . . . . . . . . . . . . . 49Saving Display Options . . . . . . . . . . . . . . . . . . . . . . . . . . . . . . . . . . . . . . . . . . . . . 49Loading Display Options . . . . . . . . . . . . . . . . . . . . . . . . . . . . . . . . . . . . . . . . . . . . 49
Viewing Trace Files . . . . . . . . . . . . . . . . . . . . . . . . . . . . . . . . . . . . . . . . . . . . . . . . . . . 50Packet-Level Decoding . . . . . . . . . . . . . . . . . . . . . . . . . . . . . . . . . . . . . . . . . . . . . 50
General Packet Display Elements . . . . . . . . . . . . . . . . . . . . . . . . . . . . . . . . . . 50Asynchronous Packet Fields . . . . . . . . . . . . . . . . . . . . . . . . . . . . . . . . . . . . . . 52Isochronous Data Block (IsoDB) Packets . . . . . . . . . . . . . . . . . . . . . . . . . . . . 55PHY Packets . . . . . . . . . . . . . . . . . . . . . . . . . . . . . . . . . . . . . . . . . . . . . . . . . . 56
Transaction-Level Decoding . . . . . . . . . . . . . . . . . . . . . . . . . . . . . . . . . . . . . . . . . 58Transaction Number Field . . . . . . . . . . . . . . . . . . . . . . . . . . . . . . . . . . . . . . . . 58Expanding and Collapsing Transaction Rows . . . . . . . . . . . . . . . . . . . . . . . . . 58IEEE 1394 (1394) Transactions . . . . . . . . . . . . . . . . . . . . . . . . . . . . . . . . . . . 59Serial Bus Protocol (SBP) Transactions . . . . . . . . . . . . . . . . . . . . . . . . . . . . 60Decode SBP Transactions Dialog . . . . . . . . . . . . . . . . . . . . . . . . . . . . . . . . . . 62Function Control Protocol (FCP) Transactions . . . . . . . . . . . . . . . . . . . . . . . 63Internet Protocol version 4 Over 1394 (IP or IPv4/1394) Transactions . . . . 66Internet Protocol Datagrams (IPDG or IP Datagrams) . . . . . . . . . . . . . . . . . 68High-Level Internet Protocols (IPPR) . . . . . . . . . . . . . . . . . . . . . . . . . . . . . . 69Digital Camera 1.30 (DC) Transactions . . . . . . . . . . . . . . . . . . . . . . . . . . . . . 70Decode Camera Transactions Dialog. . . . . . . . . . . . . . . . . . . . . . . . . . . . . . . . 7161883 Common Isochronous Packets (CIP) . . . . . . . . . . . . . . . . . . . . . . . . . 72
Expanding and Collapsing Rows and Fields . . . . . . . . . . . . . . . . . . . . . . . . . . . . . 73Cell Context Menus . . . . . . . . . . . . . . . . . . . . . . . . . . . . . . . . . . . . . . . . . . . . . . . . 74
View Fields . . . . . . . . . . . . . . . . . . . . . . . . . . . . . . . . . . . . . . . . . . . . . . . . . . . 75View Raw Quadlets . . . . . . . . . . . . . . . . . . . . . . . . . . . . . . . . . . . . . . . . . . . . . 75Set Marker . . . . . . . . . . . . . . . . . . . . . . . . . . . . . . . . . . . . . . . . . . . . . . . . . . . . 76Edit Marker . . . . . . . . . . . . . . . . . . . . . . . . . . . . . . . . . . . . . . . . . . . . . . . . . . . 77Clear Marker . . . . . . . . . . . . . . . . . . . . . . . . . . . . . . . . . . . . . . . . . . . . . . . . . . 77Time From Trigger. . . . . . . . . . . . . . . . . . . . . . . . . . . . . . . . . . . . . . . . . . . . . . 77Time From Marker. . . . . . . . . . . . . . . . . . . . . . . . . . . . . . . . . . . . . . . . . . . . . . 78
vii

CATC FIREINSPECTOR 2.01
User’s Manual Table Of Contents
Format > Numeric Format . . . . . . . . . . . . . . . . . . . . . . . . . . . . . . . . . . . . . . . .78Color > Color Chart . . . . . . . . . . . . . . . . . . . . . . . . . . . . . . . . . . . . . . . . . . . . .78Hide. . . . . . . . . . . . . . . . . . . . . . . . . . . . . . . . . . . . . . . . . . . . . . . . . . . . . . . . . .78Search for the next Type. . . . . . . . . . . . . . . . . . . . . . . . . . . . . . . . . . . . . . . . . .78Reconstruct Topology Tree . . . . . . . . . . . . . . . . . . . . . . . . . . . . . . . . . . . . . . .78Reconstruct Configuration ROM . . . . . . . . . . . . . . . . . . . . . . . . . . . . . . . . . . .78Find response . . . . . . . . . . . . . . . . . . . . . . . . . . . . . . . . . . . . . . . . . . . . . . . . . .78View Data Block. . . . . . . . . . . . . . . . . . . . . . . . . . . . . . . . . . . . . . . . . . . . . . . .78Expand/Collapse Field or Transaction . . . . . . . . . . . . . . . . . . . . . . . . . . . . . . .78Expand All Fields or Transactions . . . . . . . . . . . . . . . . . . . . . . . . . . . . . . . . . .79Collapse All Fields or Transactions . . . . . . . . . . . . . . . . . . . . . . . . . . . . . . . . .79Export Data . . . . . . . . . . . . . . . . . . . . . . . . . . . . . . . . . . . . . . . . . . . . . . . . . . . .79View Type Fields . . . . . . . . . . . . . . . . . . . . . . . . . . . . . . . . . . . . . . . . . . . . . . .79
Cell Context Menu Commands for Traffic Generation Files . . . . . . . . . . . . . . . . .79Edit Packet . . . . . . . . . . . . . . . . . . . . . . . . . . . . . . . . . . . . . . . . . . . . . . . . . . . .79Delete Packet . . . . . . . . . . . . . . . . . . . . . . . . . . . . . . . . . . . . . . . . . . . . . . . . . .79Insert Packet . . . . . . . . . . . . . . . . . . . . . . . . . . . . . . . . . . . . . . . . . . . . . . . . . . .79Change all...Dest_IDs . . . . . . . . . . . . . . . . . . . . . . . . . . . . . . . . . . . . . . . . . . . .79
Trace View Menus . . . . . . . . . . . . . . . . . . . . . . . . . . . . . . . . . . . . . . . . . . . . . . . . .79Display Options . . . . . . . . . . . . . . . . . . . . . . . . . . . . . . . . . . . . . . . . . . . . . . . .80Edit As Text . . . . . . . . . . . . . . . . . . . . . . . . . . . . . . . . . . . . . . . . . . . . . . . . . . .80Unhide Cells > Field name . . . . . . . . . . . . . . . . . . . . . . . . . . . . . . . . . . . . . . . .80Zoom In. . . . . . . . . . . . . . . . . . . . . . . . . . . . . . . . . . . . . . . . . . . . . . . . . . . . . . .80Zoom Out . . . . . . . . . . . . . . . . . . . . . . . . . . . . . . . . . . . . . . . . . . . . . . . . . . . . .80Wrap . . . . . . . . . . . . . . . . . . . . . . . . . . . . . . . . . . . . . . . . . . . . . . . . . . . . . . . . .80View Packets Only . . . . . . . . . . . . . . . . . . . . . . . . . . . . . . . . . . . . . . . . . . . . . .80View 1394 Transactions . . . . . . . . . . . . . . . . . . . . . . . . . . . . . . . . . . . . . . . . . .80View Serial Bus Protocol (SBP) Transactions . . . . . . . . . . . . . . . . . . . . . . . . .80View Function Control Protocol (FCP) Transactions. . . . . . . . . . . . . . . . . . . .80View IPv4 over 1394 Transactions. . . . . . . . . . . . . . . . . . . . . . . . . . . . . . . . . .80View Internet Protocol (IP) Datagrams . . . . . . . . . . . . . . . . . . . . . . . . . . . . . .81View High Level Internet Protocols . . . . . . . . . . . . . . . . . . . . . . . . . . . . . . . . .81View Digital Camera 1.30 Transactions. . . . . . . . . . . . . . . . . . . . . . . . . . . . . .81View 61883 Common Isochronous Packets (CIPs) . . . . . . . . . . . . . . . . . . . . .81View User Defined Transactions > Transaction(s). . . . . . . . . . . . . . . . . . . . . .81
Saving Trace Files . . . . . . . . . . . . . . . . . . . . . . . . . . . . . . . . . . . . . . . . . . . . . . . . . . . .81Saving Traffic Generation (.txg) Trace Files . . . . . . . . . . . . . . . . . . . . . . . . . . . . .81Saving Traffic Recording (.fdb) Trace Files. . . . . . . . . . . . . . . . . . . . . . . . . . . . . .82
Trace File Comments . . . . . . . . . . . . . . . . . . . . . . . . . . . . . . . . . . . . . . . . . . . . . . . . . .83Searching Trace Files . . . . . . . . . . . . . . . . . . . . . . . . . . . . . . . . . . . . . . . . . . . . . . . . . .83
Go to Trigger . . . . . . . . . . . . . . . . . . . . . . . . . . . . . . . . . . . . . . . . . . . . . . . . . . . . .83Go to Packet/Transaction . . . . . . . . . . . . . . . . . . . . . . . . . . . . . . . . . . . . . . . . . . . .83Go to Marker. . . . . . . . . . . . . . . . . . . . . . . . . . . . . . . . . . . . . . . . . . . . . . . . . . . . . .83
viii

CATC FIREINSPECTOR 2.01
User’s Manual Table Of Contents
All Markers Dialog . . . . . . . . . . . . . . . . . . . . . . . . . . . . . . . . . . . . . . . . . . . . . 84Go to. . . . . . . . . . . . . . . . . . . . . . . . . . . . . . . . . . . . . . . . . . . . . . . . . . . . . . . . . . . . 84Find . . . . . . . . . . . . . . . . . . . . . . . . . . . . . . . . . . . . . . . . . . . . . . . . . . . . . . . . . . . . 85Search Direction. . . . . . . . . . . . . . . . . . . . . . . . . . . . . . . . . . . . . . . . . . . . . . . . . . . 86
Exporting Trace Files. . . . . . . . . . . . . . . . . . . . . . . . . . . . . . . . . . . . . . . . . . . . . . . . . . 87
6 Decoder Scripts . . . . . . . . . . . . . . . . . . . . . . . . . . . . . . . . . . . . . . . . . . . 89CATC Decoder Scripting Files . . . . . . . . . . . . . . . . . . . . . . . . . . . . . . . . . . . . . . . . . . 89Custom Decoder Scripts. . . . . . . . . . . . . . . . . . . . . . . . . . . . . . . . . . . . . . . . . . . . . . . . 89
7 Traffic Generation . . . . . . . . . . . . . . . . . . . . . . . . . . . . . . . . . . . . . . . . . 91Traffic Generation Keys. . . . . . . . . . . . . . . . . . . . . . . . . . . . . . . . . . . . . . . . . . . . . . . . 91Defining Data Blocks. . . . . . . . . . . . . . . . . . . . . . . . . . . . . . . . . . . . . . . . . . . . . . . . . . 95Maximum Block Size for Asynchronous Data . . . . . . . . . . . . . . . . . . . . . . . . . . . . . . 95Stress Testing With Asynchronous Data . . . . . . . . . . . . . . . . . . . . . . . . . . . . . . . . . . . 95Generating Isochronous Traffic . . . . . . . . . . . . . . . . . . . . . . . . . . . . . . . . . . . . . . . . . . 95Maximum Block Size for Isochronous Data . . . . . . . . . . . . . . . . . . . . . . . . . . . . . . . . 96Creating Different Traffic Patterns With Isochronous Data . . . . . . . . . . . . . . . . . . . . 96Editing Tools in FireInspector . . . . . . . . . . . . . . . . . . . . . . . . . . . . . . . . . . . . . . . . . . . 96
Edit Packet . . . . . . . . . . . . . . . . . . . . . . . . . . . . . . . . . . . . . . . . . . . . . . . . . . . . . . . 96Edit Packet Dialogs . . . . . . . . . . . . . . . . . . . . . . . . . . . . . . . . . . . . . . . . . . . . . 97
Delete Packet . . . . . . . . . . . . . . . . . . . . . . . . . . . . . . . . . . . . . . . . . . . . . . . . . . . . 100Insert Packet . . . . . . . . . . . . . . . . . . . . . . . . . . . . . . . . . . . . . . . . . . . . . . . . . . . . . 101Change all...Dest_IDs . . . . . . . . . . . . . . . . . . . . . . . . . . . . . . . . . . . . . . . . . . . . . 101Edit As Text . . . . . . . . . . . . . . . . . . . . . . . . . . . . . . . . . . . . . . . . . . . . . . . . . . . . . 102
8 Bus Topology Trees . . . . . . . . . . . . . . . . . . . . . . . . . . . . . . . . . . . . . . . 103Retrieving a Bus Topology Tree . . . . . . . . . . . . . . . . . . . . . . . . . . . . . . . . . . . . . . . . 103
Advanced Tree Retrieving Options . . . . . . . . . . . . . . . . . . . . . . . . . . . . . . . . . . . 104Viewing Bus Topology . . . . . . . . . . . . . . . . . . . . . . . . . . . . . . . . . . . . . . . . . . . . . . . 104Bus Topology Tree Menus. . . . . . . . . . . . . . . . . . . . . . . . . . . . . . . . . . . . . . . . . . . . . 105
Topology Context Menu . . . . . . . . . . . . . . . . . . . . . . . . . . . . . . . . . . . . . . . . . . . 105Tree View Menu . . . . . . . . . . . . . . . . . . . . . . . . . . . . . . . . . . . . . . . . . . . . . . . . . 106
Reconstructing Bus Topology . . . . . . . . . . . . . . . . . . . . . . . . . . . . . . . . . . . . . . . . . . 106Saving Tree Files . . . . . . . . . . . . . . . . . . . . . . . . . . . . . . . . . . . . . . . . . . . . . . . . . . . . 107Reading and Viewing Configuration ROM . . . . . . . . . . . . . . . . . . . . . . . . . . . . . . . . 107
Reading Configuration ROM From a Device . . . . . . . . . . . . . . . . . . . . . . . . . . . 108Reading Configuration ROM From a File . . . . . . . . . . . . . . . . . . . . . . . . . . . . . . 108Reconstructing Configuration ROM . . . . . . . . . . . . . . . . . . . . . . . . . . . . . . . . . . 108Viewing Configuration ROM as Text . . . . . . . . . . . . . . . . . . . . . . . . . . . . . . . . . 109Saving Configuration ROM files . . . . . . . . . . . . . . . . . . . . . . . . . . . . . . . . . . . . . 109
Vendor Information . . . . . . . . . . . . . . . . . . . . . . . . . . . . . . . . . . . . . . . . . . . . . . . . . . 110
ix
CATC FIREINSPECTOR 2.01
User’s Manual Table Of Contents
9 Reports . . . . . . . . . . . . . . . . . . . . . . . . . . . . . . . . . . . . . . . . . . . . . . . . . .111File Information . . . . . . . . . . . . . . . . . . . . . . . . . . . . . . . . . . . . . . . . . . . . . . . . . . . . .111Error Summary . . . . . . . . . . . . . . . . . . . . . . . . . . . . . . . . . . . . . . . . . . . . . . . . . . . . . .112Timing and Bus Usage Calculator . . . . . . . . . . . . . . . . . . . . . . . . . . . . . . . . . . . . . . .113Transaction Summary . . . . . . . . . . . . . . . . . . . . . . . . . . . . . . . . . . . . . . . . . . . . . . . . .114Bus Utilization . . . . . . . . . . . . . . . . . . . . . . . . . . . . . . . . . . . . . . . . . . . . . . . . . . . . . .116
File Options. . . . . . . . . . . . . . . . . . . . . . . . . . . . . . . . . . . . . . . . . . . . . . . . . . . . . .116Display Settings . . . . . . . . . . . . . . . . . . . . . . . . . . . . . . . . . . . . . . . . . . . . . . . . . .117
Toolbar Commands . . . . . . . . . . . . . . . . . . . . . . . . . . . . . . . . . . . . . . . . . . . .117Graph Area Menu . . . . . . . . . . . . . . . . . . . . . . . . . . . . . . . . . . . . . . . . . . . . . .119
Data Settings . . . . . . . . . . . . . . . . . . . . . . . . . . . . . . . . . . . . . . . . . . . . . . . . . . . . .119Use the following toolbar items to configure data settings: . . . . . . . . . . . . . .120Select Range . . . . . . . . . . . . . . . . . . . . . . . . . . . . . . . . . . . . . . . . . . . . . . . . . .120Graphs Menu. . . . . . . . . . . . . . . . . . . . . . . . . . . . . . . . . . . . . . . . . . . . . . . . . .120
10 Printing and Exporting Files . . . . . . . . . . . . . . . . . . . . . . . . . . . . . . . .125Printing Files. . . . . . . . . . . . . . . . . . . . . . . . . . . . . . . . . . . . . . . . . . . . . . . . . . . . . . . .125
Print a Trace file . . . . . . . . . . . . . . . . . . . . . . . . . . . . . . . . . . . . . . . . . . . . . . . . . .125Print a tree file. . . . . . . . . . . . . . . . . . . . . . . . . . . . . . . . . . . . . . . . . . . . . . . . . . . .125Print a bus utilization graph . . . . . . . . . . . . . . . . . . . . . . . . . . . . . . . . . . . . . . . . .125
Exporting Files . . . . . . . . . . . . . . . . . . . . . . . . . . . . . . . . . . . . . . . . . . . . . . . . . . . . . .125Export to Packet View Format . . . . . . . . . . . . . . . . . . . . . . . . . . . . . . . . . . . . . . .126Export to Generator Text File Format . . . . . . . . . . . . . . . . . . . . . . . . . . . . . . . . .126Export to Comma Separated Value Format . . . . . . . . . . . . . . . . . . . . . . . . . . . . .126Export to Data Format . . . . . . . . . . . . . . . . . . . . . . . . . . . . . . . . . . . . . . . . . . . . .127
11 Contact and Warranty Information . . . . . . . . . . . . . . . . . . . . . . . . . .129Contact Information . . . . . . . . . . . . . . . . . . . . . . . . . . . . . . . . . . . . . . . . . . . . . . . . . .129Warranty and License . . . . . . . . . . . . . . . . . . . . . . . . . . . . . . . . . . . . . . . . . . . . . . . . .129
Index . . . . . . . . . . . . . . . . . . . . . . . . . . . . . . . . . . . . . . . . . . . . . . . . . . .131
x

CATC FIREINSPECTOR 2.01 CHAPTER 1
User’s Manual FireInspector Overview
CHAPTER 1: FIREINSPECTOR OVERVIEWThe CATC FireInspector IEEE 1394 Bus & Protocol Analyzer is a development and test tool for IEEE 1394-based (FireWire® and i.LINK®) products. When connected to any point in a 1394 tree, FireInspector can monitor the bus activity and display information about the recorded packets.
The FireInspector analyzer consists of the IEEE 1394 Bus & Protocol Analyzer unit and the FireInspector software. The analyzer unit is configured and controlled by a desktop or laptop PC running the FireInspector software and connected to the analyzer via a Universal Serial Bus (USB) cable.
The FireInspector analyzer connects to the IEEE 1394 bus topology as an active node and acts as a repeater to all data and arbitration signals received on the bus. The analyzer listens and records relevant signals on the bus and is also capable of transmission.
The analyzer box can be used with portable computers for field service and maintenance, as well as with desktop units in a development environment. The FireInspector analyzer is easily installed by connecting a cable between the host computer’s USB port and the analyzer’s USB port. The FireInspector analyzer includes provisions for on-the-fly
Figure 1-1: CATC FireInspector Bus and Protocol Analyzer configuration
PW RTrig ger
T rig g e r edR ec o r d ing
Po rt 1 Port 2 Po rt 3
FireInspector
IEEE 1394
Node A
IEEE 1394
Node B
External Events
IEEE 1394 Bus
Universal Serial Bus
R 1R 2R 3R 4R 5R 6R 7R 8R 9R 1 0R 1 1R 1 2R 1 3R 1 4R 1 5R 1 6R 1 7R 1 8R 1 9
GN DGN D5 VT r i gg e r Ou t- - -I 0I 1I 2I 3I 4I 5I 6I 7O0O1O2O3O4O5
O6O7GN DGN D
1
2 3
J 1FireI nspec t orBreakout B oa rd
P 1
Analyzer
1

CATC FIREINSPECTOR 2.01 CHAPTER 1
User’s Manual FireInspector Overview
detection of, and triggering on, numerous events. Such events include specific user-defined bus conditions, PHY packets, any packet header information, data patterns, and many abnormal (error) bus conditions. When recording manually or with a specified trigger condition, the FireInspector analyzer continuously records the bus data in a wrap-around fashion until manually stopped or until the trigger event is detected and a specified post-trigger amount of bus data is recorded.
Upon detection of a triggering event, the analyzer continues, as necessary, to record data (post-trigger) up to a point specified by the user. Real-time event detectors can be individually enabled or disabled to allow triggering on bus events, as the events happen. This includes predefined exception or error conditions, and a user-defined set of search conditions. The unit can also be triggered by an externally supplied signal. An external DB-37 connector provides a path for externally supplied data or timing information to be recorded along with bus traffic.
Real-time event detection information is available via an external DB-37 connector, making many control, timing, and recovered signals available externally. These signals can be probed and used by other circuitry.
The FireInspector application may be used with or without the analyzer box. When used without the analyzer box, it functions as a Trace™ viewer. As a Trace viewer, it can be used to view, analyze and print CATC Trace files.
1.1 IEEE 1394 Bus VersionThe FireInspector IEEE analyzer supports the cable version of the IEEE 1394 bus. The IEEE 1394 designation refers to a high performance serial bus and defines both a serial backplane physical layer and a point-to-point cable-connected virtual bus. The cable version supports data rates of 100, 200 and 400 Mbits/s across the cable medium.
The primary application of the cable version is the integration of Input/Output (I/O) connectivity at the back panel of personal computers using a low-cost, scalable, high-speed serial interface. The IEEE 1394 standard also provides for real-time I/O and live connect/disconnect capability for external devices like disk drives and printers, and peripherals such as scanners and cameras.
The IEEE 1394 standard is a transaction-based packet technology operating on a serial bus and is organized as if it were memory space interconnected between devices. Device addressing is 64-bits wide, partitioned as 10 bits for network IDs, 6 bits for node IDs and 48 bits for memory addresses. The result is the capability to address 1023 networks of 63 nodes, each with 128 terabytes of memory.
2

CATC FIREINSPECTOR 2.01 CHAPTER 1
User’s Manual FireInspector Overview
Please refer to the IEEE Std 1394 for details on the protocol. The IEEE 1394 specification is available from the Institute of Electrical and Electronic Engineers (IEEE); it can be ordered by sending e-mail to [email protected]. Other information regarding the IEEE 1394 application is available from the 1394 Trade Association at:
1.2 The FireInspector Analyzer System Components
The FireInspector analyzer package includes the following items:
• One FireInspector analyzer unit with AC power cord
• One External Interface Breakout Board with a 37-pin ribbon cable
• One USB cable
• Two IEEE 1394 cables
• One 6/6 pin
• One 6/4 pin
• FireInspector software program installation diskette(s)
• Product documentation including on-line Help
1.3 The FireInspector Analyzer UnitThe FireInspector analyzer has several user-accessible controls on its front and back panels.
1.3.1 Front Panel Description
The front panel, shown in Figure 1-2, includes, from left to right, the following items:
• Three IEEE 1394 6-pin connectors labeled Port 1, Port 2 and Port 3.• Green Recording LED illuminates when the unit is recording.
• Yellow Triggered LED lights up when a trigger event occurs during a recording session. This LED also lights up during power-on testing and will blink when the hardware is faulty.
1394 Trade Association1111 South Main Street, Suite 100Grapevine, Texas 76051
Tel: +1/817.410.5750Fax: +1/817.410.5752Web: http://www.1394ta.org/
Figure 1-2: FireInspector front panel
FireInspector™
Port 2 Port 3Recording Triggered
TriggerPWR
Port 1
3

CATC FIREINSPECTOR 2.01 CHAPTER 1
User’s Manual FireInspector Overview
• Push-button Trigger switch is used to manually force a trigger event during a recording session.
• Red PWR (power) indicator LED. The LED illuminates when the unit is powered on.
IEEE 1394 6-Pin Port Connectors
The 1394 bus is an unsupervised connection of nodes in a tree structure. The only restriction is that there can be no loops. The FireInspector analyzer box is equipped with three identical and interchangeable IEEE 1394 ports: Port 1, Port 2, and Port 3. The analyzer is a node with three connectors. Using the three connectors as necessary, the analyzer can be connected to one node, inserted between any two or three nodes of a tree, or as a leaf. Connect the analyzer box to the 1394 bus network that is being tested. Figure 1-3 provides three examples of analyzer configurations.
The Trigger Push-Button
The push-button Trigger switch provides the means to manually force a trigger event during a recording session. The session finishes when a specified post-trigger amount of bus data is recorded.
1.3.2 Back Panel Description
The rear panel, shown in Figure 1-4, includes, from left to right, the following items:
• 120 Volt AC connector module
• Power socket• Enclosed fuse
Figure 1-3: Analyzer configuration examples
Figure 1-4: FireInspector back panel
PWRTr igger
Tr i gger edR ec o rdi ng
Port 1 Port 2 Port 3
CATC IEEE 1394 Bus Analyzer
PWRTrigger
Tr i gg er edR ec o rd ing
Port 1 Port 2 Port 3
CATC IEEE 1394 Bus Analyzer
PWRTr igger
Tr igg er edR ec o rd ing
Port 1 Port 2 Port 3
CATC IEEE 1394 Bus Analyzer
Node
Leaf Leaf Leaf Leaf Leaf
Root
Leaf
Node
Leaf
RootRoot
1
20
19
37
USB Data In/Out
4

CATC FIREINSPECTOR 2.01 CHAPTER 1
User’s Manual FireInspector Overview
• Power on/off switch• USB type “B” host computer connector
• Data In/Out DB-37 (37-pin) external interface connector
Data In/Out Connector
The 37-pin Data In/Out connector, shown in Figure 1-5, provides a convenient method for connecting the External Interface Breakout Board. See page 6 for details regarding the External Interface Breakout Board. The Data In/Out connector is located on the back of the FireInspector analyzer box as shown in Figure 1-4.
Table 1-1 lists the pin-out and signal descriptions for the Data In/Out connector. Trigger/signal inputs (Ix) function under control of the FireInspector program and may be assigned as active-low or active-high by settings in the Recording Options. Signal outputs (Ox) function under the control of the FireInspector program and are used to link any triggered events to an external signal.
Table 1-1: Data In/Out Connector – Pin-Out
Pin Signal Description Pin Signal Description
1 5V, 500mA DC source 20 Ground
2 - Trigger Output (active low) 21 Ground
3 Not connected 22 Ground
4 I 0 – Trigger/signal input 23 Ground
5 I 1 – Trigger/signal input 24 Ground
6 I 2 – Trigger/signal input 25 Ground
7 I 3 – Trigger/signal input 26 Ground
8 I 4 – Trigger/signal input 27 Ground
9 I 5 – Trigger/signal input 28 Ground
10 I 6 – Trigger/signal input 29 Ground
11 I 7 – Trigger/signal input 30 Ground
12 O 0 – Signal output 31 Ground
13 O 1 – Signal output 32 Ground
14 O 2 – Signal output 33 Ground
15 O 3 – Signal output 34 Ground
16 O 4 – Signal output 35 Ground
17 O 5 – Signal output 36 Ground
18 O 6 – Signal output 37 Ground
19 O 7 – Signal output
1
20
19
37Figure 1-5: Data In/Out Connector
5
CATC FIREINSPECTOR 2.01 CHAPTER 1
User’s Manual FireInspector Overview
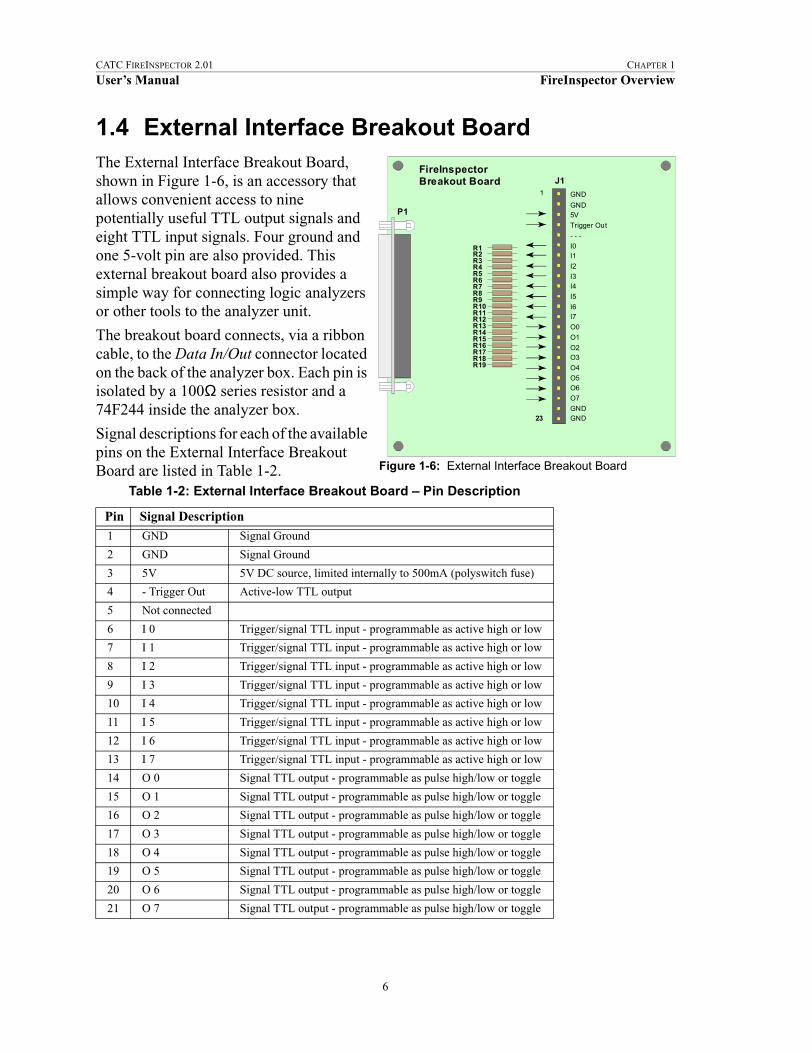
1.4 External Interface Breakout BoardThe External Interface Breakout Board, shown in Figure 1-6, is an accessory that allows convenient access to nine potentially useful TTL output signals and eight TTL input signals. Four ground and one 5-volt pin are also provided. This external breakout board also provides a simple way for connecting logic analyzers or other tools to the analyzer unit.
The breakout board connects, via a ribbon cable, to the Data In/Out connector located on the back of the analyzer box. Each pin is isolated by a 100Ω series resistor and a 74F244 inside the analyzer box.
Signal descriptions for each of the available pins on the External Interface Breakout Board are listed in Table 1-2.
Table 1-2: External Interface Breakout Board – Pin Description
Pin Signal Description
1 GND Signal Ground
2 GND Signal Ground
3 5V 5V DC source, limited internally to 500mA (polyswitch fuse)
4 - Trigger Out Active-low TTL output
5 Not connected
6 I 0 Trigger/signal TTL input - programmable as active high or low
7 I 1 Trigger/signal TTL input - programmable as active high or low
8 I 2 Trigger/signal TTL input - programmable as active high or low
9 I 3 Trigger/signal TTL input - programmable as active high or low
10 I 4 Trigger/signal TTL input - programmable as active high or low
11 I 5 Trigger/signal TTL input - programmable as active high or low
12 I 6 Trigger/signal TTL input - programmable as active high or low
13 I 7 Trigger/signal TTL input - programmable as active high or low
14 O 0 Signal TTL output - programmable as pulse high/low or toggle
15 O 1 Signal TTL output - programmable as pulse high/low or toggle
16 O 2 Signal TTL output - programmable as pulse high/low or toggle
17 O 3 Signal TTL output - programmable as pulse high/low or toggle
18 O 4 Signal TTL output - programmable as pulse high/low or toggle
19 O 5 Signal TTL output - programmable as pulse high/low or toggle
20 O 6 Signal TTL output - programmable as pulse high/low or toggle
21 O 7 Signal TTL output - programmable as pulse high/low or toggle
R1R2R3R4R5R6R7R8R9R10R11R12R13R14R15R16R17R18R19
GND
GND5V
Trigger Out
- - -
I0I1
I2I3I4I5
I6I7
O0
O1
O2O3
O4O5O6O7
GNDGND
1
23
J1FireInspectorBreakout Board
P1
Figure 1-6: External Interface Breakout Board
6
CATC FIREINSPECTOR 2.01 CHAPTER 1
User’s Manual FireInspector Overview
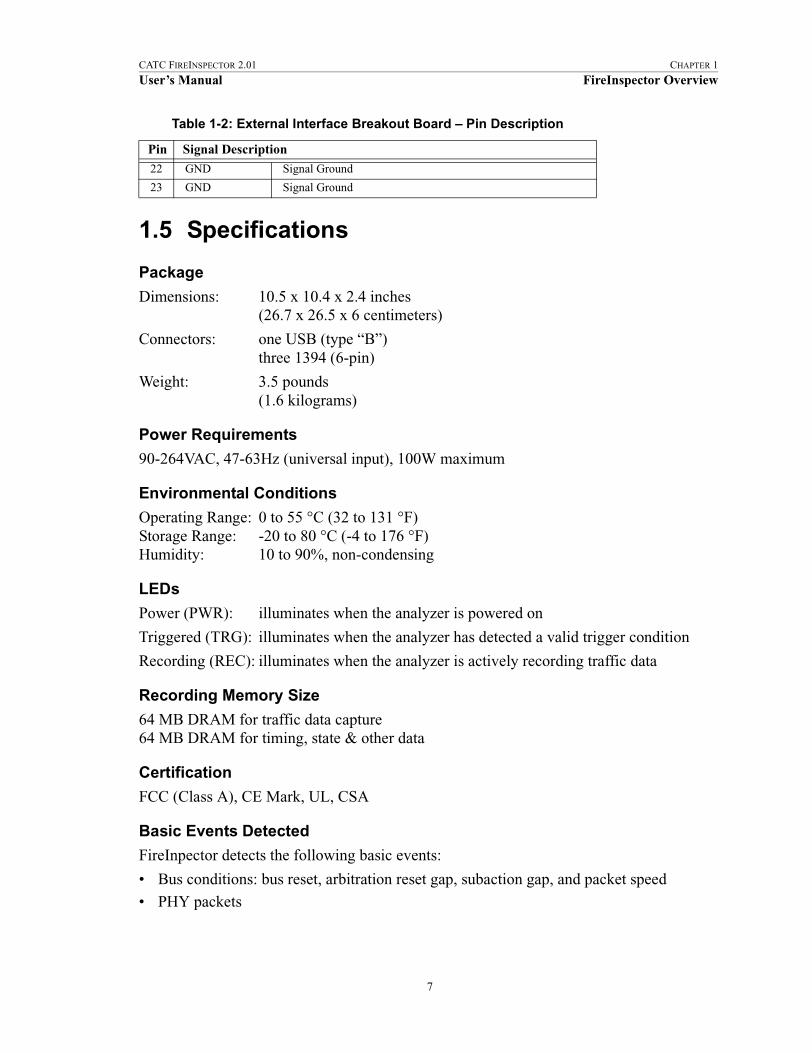
1.5 Specifications
Package
Dimensions: 10.5 x 10.4 x 2.4 inches(26.7 x 26.5 x 6 centimeters)
Connectors: one USB (type “B”)three 1394 (6-pin)
Weight: 3.5 pounds(1.6 kilograms)
Power Requirements
90-264VAC, 47-63Hz (universal input), 100W maximum
Environmental Conditions
Operating Range: 0 to 55 °C (32 to 131 °F)Storage Range: -20 to 80 °C (-4 to 176 °F)Humidity: 10 to 90%, non-condensing
LEDs
Power (PWR): illuminates when the analyzer is powered on
Triggered (TRG): illuminates when the analyzer has detected a valid trigger condition
Recording (REC): illuminates when the analyzer is actively recording traffic data
Recording Memory Size
64 MB DRAM for traffic data capture64 MB DRAM for timing, state & other data
Certification
FCC (Class A), CE Mark, UL, CSA
Basic Events Detected
FireInpector detects the following basic events:
• Bus conditions: bus reset, arbitration reset gap, subaction gap, and packet speed• PHY packets
22 GND Signal Ground
23 GND Signal Ground
Table 1-2: External Interface Breakout Board – Pin Description
Pin Signal Description
7

CATC FIREINSPECTOR 2.01 CHAPTER 1
User’s Manual FireInspector Overview
• Acknowledge packets• Transaction codes: cycle start, data quadlet read request, data block read request, data
quadlet read response, data block read response, data quadlet write request, data block write request, write response, lock request, lock response, isochronous (stream) data packet, and asynchronous stream packet
• Packet header contents (first four quadlets)
• Data block pattern (first two quadlets)• Hardware-detected errors: bad PHY packet complement, bad header or data CRC, and
bad acknowledge parity
• External (user-supplied) signals
1.6 Features of FireInspector• Sophisticated software analyzes all bus transactions
• Identifies & highlights abnormal bus conditions
• Decodes standard CSR accesses and other encapsulated protocols
• 128 MB of physical data recording memory nets 64 MB of raw 1394 traffic
• Programmable real-time event triggering and traffic capture filtering
• CATC Trace graphical presentation of captured data with extensive customization options
• Graphical display of bus topology
• Adjustable recording size
• Adjustable pre-/post-trigger position
• Comprehensive search functions
• Accurate timestamping of bus packets
• Field upgradeable firmware and BusEngine™• Software operates as a stand-alone Trace viewer
• Connects to the host computer through a USB port
• One-year warranty and hotline customer support
1.7 System RequirementsThe following is the recommended configuration for the host machine that runs the FireInspector Analyzer application and is connected to the FireInspector Analyzer box.
• Operating system: Microsoft® Windows® 98 SE, Windows 2000, Windows Me, or Windows XP operating system. The FireInspector application can be used on machines with a Windows NT® 4.0 operating system to view Trace files; however, in order to
8

CATC FIREINSPECTOR 2.01 CHAPTER 1
User’s Manual FireInspector Overview
record 1394 bus traffic, a separate FireInspector application installation for Windows NT 4.0 is required.
• Required setup: Microsoft Internet Explorer 4 or later must be installed.
• Processor: For optimum performance, use processors of the Intel® Pentium® III or Pentium 4 family, the AMD® Athlon® or Duron® family, or other compatible proces-sors with clock speed of 500mHz or higher. Must have, as a minimum, a processor from the Intel Pentium II or Celeron® family, AMD-K6® family, or equivalent with clock speed of 300mHz.
• Memory: For the best performance, it is recommended to have physical RAM twice the size of the recording buffer setup – 256 MB or more (minimum of 64 MB of RAM).
• Hard disk: At least 20 MB of free hard disk space is required for the installation. Addi-tional disk space is needed for storing the recorded data in files during the recording process (can be as much as 128 MB when recording a full buffer size).
• Display: Resolution of 1024 x 768 with at least 16-bit color is recommended (resolution of 800 x 600 with 16-bit color is a minimum).
• Connectivity: A USB interface is required to connect the host computer to the FireIn-spector analyzer box. This is not a requirement if the FireInspector application is going to be used only as a Trace viewer.
• If Windows NT drivers are used, the computer should have the Windows NT 4.0 operat-ing system with Service Pack 1 or later installed.
Note: Please contact CATC for information about controlling the FireInspector analyzer from a computer using Windows NT 4.0.
9

CATC FIREINSPECTOR 2.01 CHAPTER 1
User’s Manual FireInspector Overview
10
CATC FIREINSPECTOR 2.01 CHAPTER 2
User’s Manual Getting Started
CHAPTER 2: GETTING STARTEDThis chapter describes how to install FireInspector and its software, how to start FireInspector, and how to set up the analyzer unit.
2.1 Installing FireInspectorFireInspector can be installed on any PC or laptop computer running the Windows 98 SE, Windows Me, Windows 2000, or Windows XP operating system. For Windows NT support, please contact CATC.
2.1.1 Software Installation
The FireInspector software can be installed from a set of installation diskettes or from downloaded installation files. If you are installing the application from the diskettes, you will need to insert Disk 1 into the computer’s floppy drive before continuing with the steps below.
Step 1 Select Start > Run... from the Windows taskbar and enter “a:\Setup.exe” in the Run dialog box and click OK.Note: If you are using a drive other than the “a” drive, substitute the appropriate
drive letter for “a.”
orSelect Start > Run... from the Windows taskbar and click the Browse button, then navigate to the Disk 1 directory of the FireInspector installation download. Select the file Setup.exe and click Open.
Step 2 Follow the on-screen instructions to complete the software installation.
2.1.2 Hardware Installation
Step 1 Attach the power cord to the FireInspector analyzer box and connect it to a 120-volt electrical outlet.
Step 2 Attach the USB cable to the analyzer box and connect it to a USB port on the host computer.
Note: FireInspector does not meet the galvanic isolation requirements specified in the IEEE 1394 specification. To avoid potential ground loop problems, it is suggested that the device under test should be connected to outlets physically close to that used by the analyzer.
2.2 Starting and Stopping FireInspector
2.2.1 Starting the Application
Use one of the following procedures to start the FireInspector application:
11

CATC FIREINSPECTOR 2.01 CHAPTER 2
User’s Manual Getting Started
• Select Start > Programs > CATC > CATC FireInspector from the Windows taskbar.• In Windows Explorer or My Computer, navigate to the directory that contains
FireInspector, then double-click on the FireInspector.exe icon.
2.2.2 Exiting the Application
Any of the following actions will close the FireInspector application:
• Click on the ‘X’ in the upper right corner of the application window.• Select File > Exit from the menu bar.• Press Alt + F4.• Double-click the FireInspector control icon in the upper left corner of the application
window.• Click the FireInspector control icon to access the Control menu and choose Close.
2.2.3 Starting the Analyzer Box
Start the FireInspector box by turning the power switch on the back of the unit to the ‘On’ position. The analyzer will initialize itself and perform an exhaustive self-diagnostic test that lasts about five seconds. The Triggered LED blinks during testing and turns off once the tests are completed.
2.2.4 Shutting Down the Analyzer Box
Shut down the FireInspector box by turning the power switch on the back of the unit to the ‘Off’ position.
2.3 Displaying HelpThe FireInspector application has a help file that is useful as an on-screen reference. Access the help file by choosing Help > Help Topics... from the menu bar.
2.4 Setting Up the AnalyzerSeveral utilities for setting up the analyzer unit are available via the Setup menu in the application.
2.4.1 Resetting the Analyzer
The Reset Analyzer command provides a way to reset the analyzer without turning it off. It causes the analyzer to reset, perform self-diagnostics, and then return to service. The self-diagnostics should complete in about 5 seconds, during which time the yellow Triggered light on the analyzer will be lit. If the diagnostics fail, the light will blink continually as the analyzer attempts to successfully complete the tests. If this occurs, please contact CATC, as it may indicate a hardware problem.
12
CATC FIREINSPECTOR 2.01 CHAPTER 2
User’s Manual Getting Started
To reset the FireInspector analyzer:
Step 1 Select Setup > Analyzer... from the menu bar.The Analyzer Setup dialog will open.
Step 2 Click the Reset Analyzer button.
2.4.2 Updating the BusEngine and Firmware
The BusEngine core is the heart of the FireInspector analyzer. Using state-of-the-art PLD technology, it incorporates both the high speed recording engine and the configureable building blocks that implement data/state/error detections, triggering, capture filtering, external signal monitoring, and event counting and sequencing. Both the BusEngine program and the firmware that manage the internal microcontroller are fully field-upgradeable.
The most current BusEngine file (fireinsp.rbf) and firmware file (firefw.ihx) are included in the FireInspector installation software.
To update the BusEngine and/or firmware:
Step 1 Select Setup > Analyzer... from the menu bar.The Analyzer Setup dialog will open.
Step 2 To update the BusEngine:Click Update BusEngine.The Select the engine file to download dialog will open.To update the firmware:Click Update Firmware.The Select the firmware file to download dialog will open.
Step 3 Select the appropriate file and click Open.The new code will be downloaded to the FireInspector analyzer box.Note: If the BusEngine is updated, it's necessary to turn the analyzer off and then
power back on so that the update will take effect.
Note: If the firmware is updated, it's necessary to unplug the USB cable from the back of the analyzer, and then plug it back in so that the update will take effect.
2.5 Updating the DriverIt’s necessary to manually update the driver if you have upgraded to a newer version of FireInspector. However, if FireInspector was not previously installed on the host computer, the analyzer box should be detected as being new hardware, and the New Hardware Wizard will guide you through the driver installation process.
To find out the current driver version number, please consult FireInspector’s Readme.txt file.
13

CATC FIREINSPECTOR 2.01 CHAPTER 2
User’s Manual Getting Started
Note: The FireInspector analyzer box must be attached to the computer via the USB cable and powered on before updating the driver.
2.5.1 Updating the Driver on Windows 2000
Step 1 Select Start > Settings > Control Panel from the desktop taskbar, then double-click on Add/Remove Hardware in the Control Panel window.The Add/Remove Hardware Wizard will open.
Step 2 Click Next.Step 3 Choose “Uninstall/Unplug a device” and click Next.Step 4 Choose “Unplug/Eject a device” and click Next.Step 5 Select CATC FireInspector IEEE 1394 Bus Analyzer from the list of devices
and click the Properties button.The Properties window will open.
Step 6 Select the Driver tab in the Properties window and click Update Driver.The Upgrade Device Driver Wizard will open.
Step 7 Click Next.Step 8 Choose “Display a list of the known drivers for this device so that I can
choose a specific driver.” Then, click Next.Step 9 Choose “Have disk” and click Next.
The Install from Disk window will open.Step 10 Install from Disk 1 of the FireInspector installation diskette set:
Make sure that the disk is in the computer’s floppy drive, then select the drive from the drop-down list or type the drive letter (e.g., “a:”) in the combo box, then click OK.Install from a directory on the computer’s hard drive:Browse or enter the path to the Disk 1 directory of the FireInspector installation, then click OK.The Install from Disk window will close.
Step 11 Select CATC FireInspector IEEE 1394 Bus Analyzer from the list of devices in the Upgrade Device Driver Wizard and click Next.
Step 12 Click Next to install the driver.Step 13 Click Finish to close the Wizard.Step 14 Check the driver version on the Driver tab of the Properties window to make
sure that the driver was successfully upgraded.Step 15 Close the remaining open windows.
2.5.2 Updating the Driver on Windows 98 SE
Step 1 Select Start > Settings > Control Panel from the desktop taskbar, then double-click on System Properties in the Control Panel window.The System Properties window will open.
14

CATC FIREINSPECTOR 2.01 CHAPTER 2
User’s Manual Getting Started
Step 2 Select the Device Manager tab.Step 3 Look in the CATC Analyzers directory and select CATC FireInspector IEEE
1394 Bus Analyzer.orLook in the Universal Serial Bus Controllers directory and select CATC FireInspector IEEE 1394 Bus Analyzer.
Step 4 Click the Properties button.The Properties window will open.
Step 5 Select the Driver tab and click on the Update Driver button.The Update Device Driver Wizard will open.
Step 6 Click Next.Step 7 Choose “Search for a better driver than the one your device is using now.”
and click Next.Step 8 Enter or browse to the location of the driver and click Next.Step 9 Click Next to install the driver.
Note: If a message appears saying that Windows cannot locate the driver, click OK to close the message box and then enter or browse to the location of the driver to continue.
Step 10 Click Finish.Step 11 Click the Driver File Details button to check the driver version and make
sure that the driver was successfully upgraded.Step 12 Close the remaining open windows.
2.5.3 Updating the Driver on Windows Me
Step 1 Select Start > Settings > Control Panel from the desktop taskbar, then double-click on System Properties in the Control Panel window.The System Properties window will open.
Step 2 Select the Device Manager tab.Step 3 Look in the CATC Analyzers directory and select CATC FireInspector IEEE
1394 Bus Analyzer.orLook in the Universal Serial Bus Controllers directory and select CATC FireInspector IEEE 1394 Bus Analyzer.
Step 4 Click the Properties button.The Properties window will open.
Step 5 Select the Driver tab and click on the Update Driver button.The Update Device Driver Wizard will open.
Step 6 Choose “Automatically search for a better driver.” and click Next.The Select Other Driver window will open.
Step 7 Select the newest driver and click OK.
15

CATC FIREINSPECTOR 2.01 CHAPTER 2
User’s Manual Getting Started
The driver will install.Step 8 Click Finish.Step 9 Click the Driver File Details button to check the driver version and make
sure that the driver was successfully upgraded.Step 10 Close the remaining open windows.
2.5.4 Updating the Driver on Windows XP
Step 1 Select Start > Control Panel from the desktop taskbar, then double-click Performance and Maintenance.
Step 2 Double-click on System.The System Properties window will open.
Step 3 Select the Hardware tab and click the Device Manager button.The Device Manager window will open.
Step 4 Look in the CATC Analyzers directory and select CATC FireInspector IEEE 1394 Bus Analyzer.orLook in the Universal Serial Bus Controllers directory and select CATC FireInspector IEEE 1394 Bus Analyzer.
Step 5 Select Action > Update Driver... from the Device Manager menu bar.The Hardware Update Wizard will open.
Step 6 Choose “Install from a list or specific location.”Step 7 Choose “Don’t search” then click Have Disk.Step 8 Enter or browse to the location of the driver and click OK.Step 9 Select CATC FireInspector IEEE 1394 Bus Analyzer from the list and click
Next.The driver will install.
Step 10 Click Finish.Step 11 Select Action > Properties from the Device Manager menu bar to check the
driver version and make sure that the driver was successfully upgraded.Step 12 Close the remaining open windows.
2.6 License KeysLicense Keys are necessary to enable software maintenance, traffic generation and Havi decoding. If they are not enabled, a message will appear if an attempt is made to access these features, stating that a License Key is necessary in order to use them. License Keys must be obtained from CATC.
16
CATC FIREINSPECTOR 2.01 CHAPTER 2
User’s Manual Getting Started
2.6.1 Update License
Follow these steps to install a license key:
Step 1 Select Help > Update License… from the menu bar.The Update License dialog will come up.
Step 2 Enter the path and filename for the License Key or use the Browse button to navigate to the directory that contains the License Key. Select the .lic file, and then click Update Device.
2.6.2 License Information
Licensing information for FireInspector may be viewed by selecting Help > Display License Information... from the menu bar. The License Information window will open, displaying the maintenance expiration and features data for FireInspector.
17

CATC FIREINSPECTOR 2.01 CHAPTER 2
User’s Manual Getting Started
18

CATC FIREINSPECTOR 2.01 CHAPTER 3
User’s Manual FireInspector User Interface
CHAPTER 3: FIREINSPECTOR USER INTERFACEThis chapter introduces you to the FireInspector application’s user interface. It describes the elements of the application window, as well as the commands available via the menus, toolbars, and keyboard shortcuts.
3.1 Application LayoutThe FireInspector application contains the following elements:
• Title bar: The title bar is located at the top of the application window. It identifies the window as CATC FireInspector Bus and Protocol Analyzer. When there is data in the display area, the name of the active file is included on the title bar as well.
• Menu bar: The menu bar is located below the title bar, by default. It contains the menus. The menu bar can be moved by clicking on a blank area of the bar and then dragging the menu to a new position. It can be docked in another part of the application window or moved outside of the window to become a floating menu.
• Toolbars: The toolbars are located below the menu bar, by default. They contain the toolbar shortcuts available in FireInspector. Each toolbar, like the menu bar, can be
Figure 3-1: FireInspector application window
19
CATC FIREINSPECTOR 2.01 CHAPTER 3
User’s Manual FireInspector User Interface
moved and docked in a new position in the application window or made to float outside of the window.
• Display area: The display area is the main part of the application window. When files are open, they are shown in the display area and the name of the active file is shown on the title bar. Each file is contained in its own window within the display area.
• Status bar: The status bar is located at the bottom of the application window. The left end of the status bar displays hints, if available, as you position the mouse pointer over toolbar and menu items. The right end of the bar shows the current zoom level and search direction settings. During a recording session, the middle portion of the status bar displays information about the recording status.
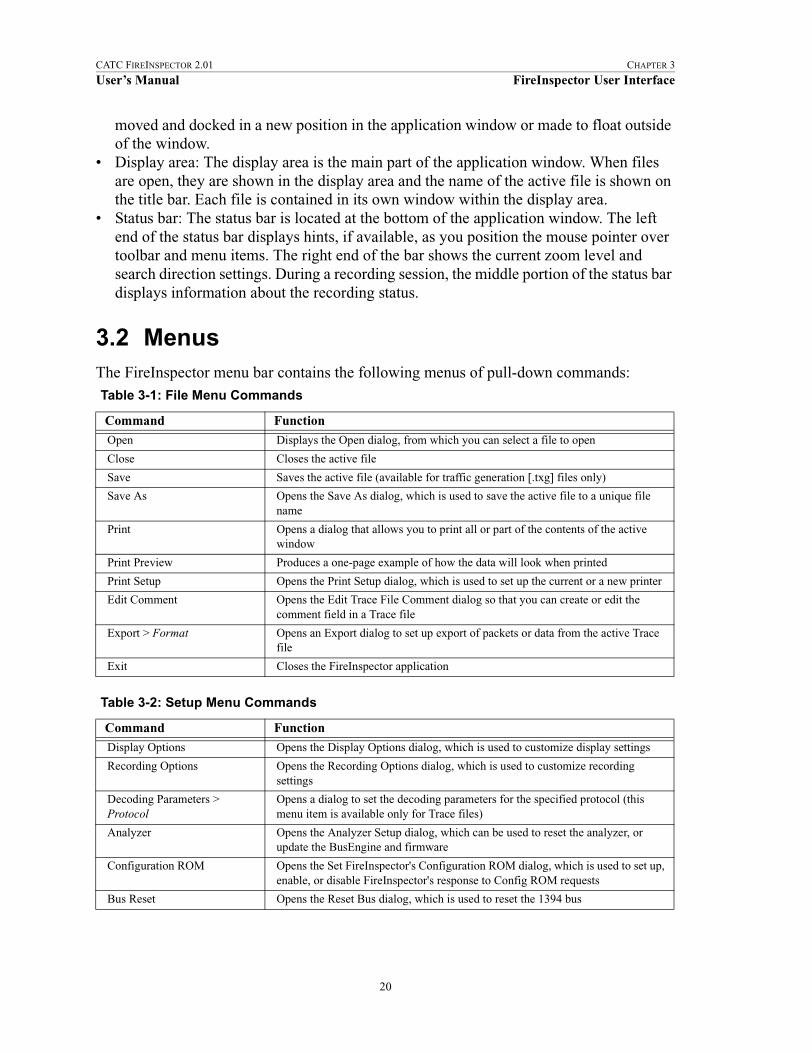
3.2 MenusThe FireInspector menu bar contains the following menus of pull-down commands: Table 3-1: File Menu Commands
Command Function
Open Displays the Open dialog, from which you can select a file to open
Close Closes the active file
Save Saves the active file (available for traffic generation [.txg] files only)
Save As Opens the Save As dialog, which is used to save the active file to a unique file name
Print Opens a dialog that allows you to print all or part of the contents of the active window
Print Preview Produces a one-page example of how the data will look when printed
Print Setup Opens the Print Setup dialog, which is used to set up the current or a new printer
Edit Comment Opens the Edit Trace File Comment dialog so that you can create or edit the comment field in a Trace file
Export > Format Opens an Export dialog to set up export of packets or data from the active Trace file
Exit Closes the FireInspector application
Table 3-2: Setup Menu Commands
Command Function
Display Options Opens the Display Options dialog, which is used to customize display settings
Recording Options Opens the Recording Options dialog, which is used to customize recording settings
Decoding Parameters > Protocol
Opens a dialog to set the decoding parameters for the specified protocol (this menu item is available only for Trace files)
Analyzer Opens the Analyzer Setup dialog, which can be used to reset the analyzer, or update the BusEngine and firmware
Configuration ROM Opens the Set FireInspector's Configuration ROM dialog, which is used to set up, enable, or disable FireInspector's response to Config ROM requests
Bus Reset Opens the Reset Bus dialog, which is used to reset the 1394 bus
20

CATC FIREINSPECTOR 2.01 CHAPTER 3
User’s Manual FireInspector User Interface
Table 3-3: Record Menu Commands
Command Function
Start Starts a recording session
Stop Stops a recording session
Table 3-4: Report Menu Commands*
Command Function
File Information Displays the File Information window, which provides information about the active file and its recording conditions
Error Summary Displays the Error Summary window, which details the errors in a file
Timing Calculations Opens the Timing and Bus Usage calculator dialog, which is used to set up calculation of timing and bus usage
Transaction Summary Opens the Specify Packets in Transaction Summary dialog, which is used to set parameters for generating a Transaction Summary report
Bus Usage Opens the Bus Utilization window, which graphs information about packet length, data length, and packet speed
*The Report menu is available only when a Trace (.fdb or .txg) file is active in the Display Area.
Table 3-5: Search Menu Commands*
Command Function
Go to Trigger Jumps to the packet immediately preceding the trigger event
Go to Packet/Transaction Opens the Go to Packet/Transaction dialog, which is used to specify a packet or marker, then jumps to the specified packet
Go to Marker > Packet (marker)
Jumps to the specified marker
Go to > Event type > Event Jumps to the specified event
Find Opens the Find dialog, which is used to set search parameters
Find Next Repeats the previous Find operation
Search Direction Forward/Backward
The current search direction; selecting it reverses the search direction
*The Search menu is available only when a Trace (.fdb or .txg) file is active in the Display Area.
Table 3-6: Tree Menu Commands
Command Function
Retrieve Tree Opens the Tree Retrieving dialog, which is used to reset the 1394 bus and then collect information to generate a bus topology tree
Read Configuration ROM Opens the Configuration ROM dialog, which is used to read, view and save Config ROM data
Gather All Vendor Info Collects any available vendor information for devices in an active bus topology display and shows it in the vendor information blocks of the tree nodes
21

CATC FIREINSPECTOR 2.01 CHAPTER 3
User’s Manual FireInspector User Interface
Table 3-7: View Menu Commands
Command Function
Toolbars > Toolbar name Shows or hides the selected toolbar
Status Bar Shows or hides the Status bar
The following View commands are available for both Trace and tree files:
Zoom In Increases the size of the displayed transaction or tree
Zoom Out Decreases the size of the displayed transaction or tree
The following View commands are available only for Trace files:
Wrap Toggles on or off wrapping of displayed packets to fit in the window
View Packets Only Hides all visible transactions and displays just the packets in an active Trace file
View 1394 Transactions Shows or hides 1394 transactions in an active Trace file
View Serial Bus Protocol (SBP) Transactions
Decodes and displays SBP transactions in an active Trace file; if SBP hasn’t been previously decoded in the active Trace file, then the Decode SBP Transactions dialog, which is used to set SBP decoding parameters, opens first
View Function Control Protocol (FCP) Transactions
Decodes and displays FCP transactions in an active Trace file
View IPv4 over 1394 Transactions
Shows or hides IPv4/1394 transactions in an active Trace file
View Internet Protocol (IP) Datagrams
Shows or hides IP Datagram transactions in an active Trace file
View High Level Internet Protocols
Shows or hides IP Protocol transactions in an active Trace file
View Digital Camera 1.30 Transactions
Opens the Decode Camera Transactions dialog to set Digital Camera decoding parameters and then display the decoded transactions in an active Trace file
View 61883 Common Isochronous Packets (CIPs)
Shows or hides CIP transactions in an active Trace file
View User Defined Transactions > Transaction(s)
Shows or hides transactions defined in custom decoders
Table 3-8: Generate Menu Commands*
Command Function
Start/Stop Starts/stops traffic generation
Repeat Mode Opens the Generation Repeat Mode dialog, which is used to set the number of times that traffic generation will repeat
*The Generate menu is available only when a traffic generation (.txg) Trace file is active in the Display Area.
Table 3-9: Window Menu Commands*
Command Function
New Window Opens a new instance of the active file
Cascade Cascades the windows in the FireInspector display, not including minimized files
Tile Tiles the windows in the FireInspector display, not including minimized files
Arrange Icons Arranges the minimized file icons along the bottom of the FireInspector display
Windows Opens the Windows window, which can be used to activate, save, close, cascade, tile horizontally, tile vertically, or minimize a window
*The Window menu is available only when a file is open in the Display Area.
22
CATC FIREINSPECTOR 2.01 CHAPTER 3
User’s Manual FireInspector User Interface
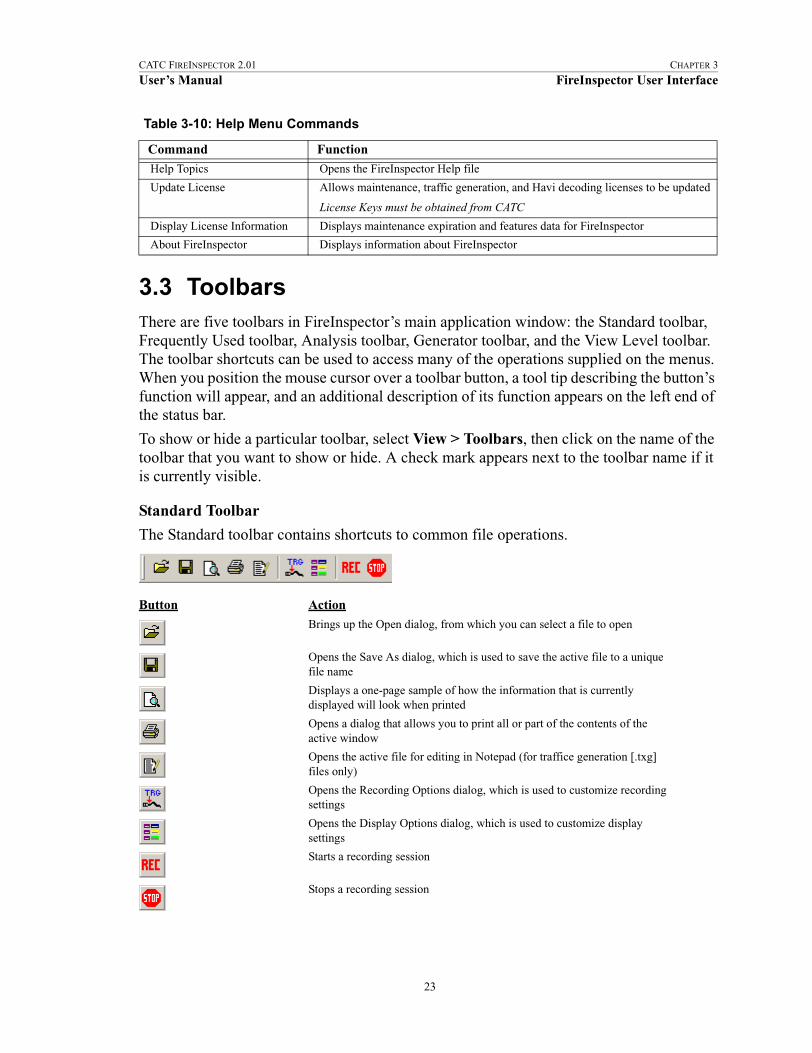
3.3 ToolbarsThere are five toolbars in FireInspector’s main application window: the Standard toolbar, Frequently Used toolbar, Analysis toolbar, Generator toolbar, and the View Level toolbar. The toolbar shortcuts can be used to access many of the operations supplied on the menus. When you position the mouse cursor over a toolbar button, a tool tip describing the button’s function will appear, and an additional description of its function appears on the left end of the status bar.
To show or hide a particular toolbar, select View > Toolbars, then click on the name of the toolbar that you want to show or hide. A check mark appears next to the toolbar name if it is currently visible.
Standard Toolbar
The Standard toolbar contains shortcuts to common file operations.
Table 3-10: Help Menu Commands
Command Function
Help Topics Opens the FireInspector Help file
Update License Allows maintenance, traffic generation, and Havi decoding licenses to be updated
License Keys must be obtained from CATC
Display License Information Displays maintenance expiration and features data for FireInspector
About FireInspector Displays information about FireInspector
Button Action
Brings up the Open dialog, from which you can select a file to open
Opens the Save As dialog, which is used to save the active file to a unique file name
Displays a one-page sample of how the information that is currently displayed will look when printed
Opens a dialog that allows you to print all or part of the contents of the active window
Opens the active file for editing in Notepad (for traffice generation [.txg] files only)
Opens the Recording Options dialog, which is used to customize recording settings
Opens the Display Options dialog, which is used to customize display settings
Starts a recording session
Stops a recording session
23

CATC FIREINSPECTOR 2.01 CHAPTER 3
User’s Manual FireInspector User Interface
Frequently Used Toolbar
The Frequently Used toolbar contains shortcuts to commonly used commands.
Analysis Toolbar
The Analysis toolbar contains shortcuts to file reports.
Button Action
Increases the size of the displayed transaction or tree
Decreases the size of the displayed transaction or tree
Toggles on or off wrapping of displayed packets to fit in the window
Hides or shows Cycle Start packets in an active Trace file
Hides or shows Isochronous Datablock packets in an active Trace file
Opens the Tree Retrieving dialog, which is used to reset the 1394 bus and then collect information to generate a bus topology tree
Opens the Find dialog, which is used to set search parameters
Repeats the previous Find operation
Button Action
Displays the File Information window
Displays the Error Summary window
Opens the Timing and Bus Usage calculator dialog
Opens the Specify Packets in Transaction Summary dialog
Opens the Bus Utilization window
24
CATC FIREINSPECTOR 2.01 CHAPTER 3
User’s Manual FireInspector User Interface
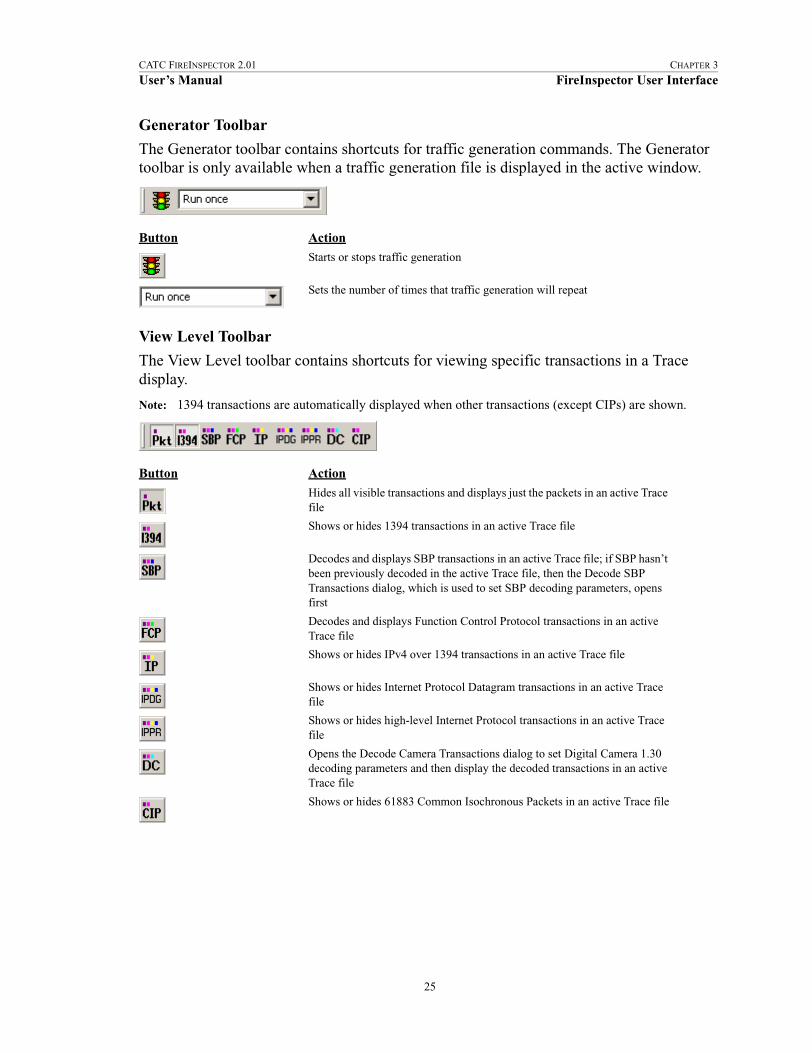
Generator Toolbar
The Generator toolbar contains shortcuts for traffic generation commands. The Generator toolbar is only available when a traffic generation file is displayed in the active window.
View Level Toolbar
The View Level toolbar contains shortcuts for viewing specific transactions in a Trace display.
Note: 1394 transactions are automatically displayed when other transactions (except CIPs) are shown.
Button Action
Starts or stops traffic generation
Sets the number of times that traffic generation will repeat
Button Action
Hides all visible transactions and displays just the packets in an active Trace file
Shows or hides 1394 transactions in an active Trace file
Decodes and displays SBP transactions in an active Trace file; if SBP hasn’t been previously decoded in the active Trace file, then the Decode SBP Transactions dialog, which is used to set SBP decoding parameters, opens first
Decodes and displays Function Control Protocol transactions in an active Trace file
Shows or hides IPv4 over 1394 transactions in an active Trace file
Shows or hides Internet Protocol Datagram transactions in an active Trace file
Shows or hides high-level Internet Protocol transactions in an active Trace file
Opens the Decode Camera Transactions dialog to set Digital Camera 1.30 decoding parameters and then display the decoded transactions in an active Trace file
Shows or hides 61883 Common Isochronous Packets in an active Trace file
25

CATC FIREINSPECTOR 2.01 CHAPTER 3
User’s Manual FireInspector User Interface
3.4 Keyboard ShortcutsThese are the keyboard shortcuts available in the FireInspector application:Table 3-11: Keyboard Shortcuts
Key Combination Operation
Ctrl + O Open file
Ctrl + W Close file
Ctrl + R Start recording
Ctrl + T Stop recording
Ctrl + P Print file
Ctrl + plus key Zoom in
Ctrl + minus key Zoom out
F3 Find next
Alt + F4 Exit
26

CATC FIREINSPECTOR 2.01 CHAPTER 4
User’s Manual Recording 1394 Traffic
CHAPTER 4: RECORDING 1394 TRAFFICThe FireInspector analyzer box monitors and records bus activity when connected to any point in a 1394 tree. It then displays the recorded packets in CATC Trace format.
The analyzer connects to the IEEE 1394 bus topology as an active node and acts as a repeater to all data and arbitration signals received on the bus. It listens and records relevant signals on the bus.
The FireInspector analyzer includes provisions for on-the-fly detection of, and triggering on, numerous events. Such events include specific user-defined bus conditions, PHY packets, packet header information, data patterns, and abnormal (error) bus conditions. FireInspector continuously records the bus data in a wrap-around mode.
Upon detecting a triggering event, FireInspector records data up to a specified point. Real-time event detectors can be individually enabled or disabled to allow triggering on bus events, as the events happen. This includes predefined exception or error conditions, and a user-defined set of search conditions. The unit can also be triggered by an externally supplied signal.
Real-time event detection information is available via an external DB-37 connector, making many control, timing, and recovered signals available externally. These signals can be probed and used by other circuitry.
The following sections explain how to set up recording options, how to make a bus traffic recording, how to reset the 1394 bus, and how to enable or disable Configuration ROM in FireInspector.
4.1 Recording OptionsYou can customize the way that bus traffic is recorded using the Recording Options dialog in FireInspector. These settings can then be saved as a recording options (.rec) file. You can load saved settings to use them at any time.
To access the Recording Options dialog, do one of the following:
• Click the Recording Options icon on the toolbar.
• Select Setup > Recording Options from the menu bar.
There are three tabs in the Recording Options dialog:
• General: the General tab contains options for generic recording settings.• Events: the Events tab is used to specify the events that are used on the Actions tab.
• Actions: the Actions tab is used to configure what takes place when specified events occur.
27
CATC FIREINSPECTOR 2.01 CHAPTER 4
User’s Manual Recording 1394 Traffic
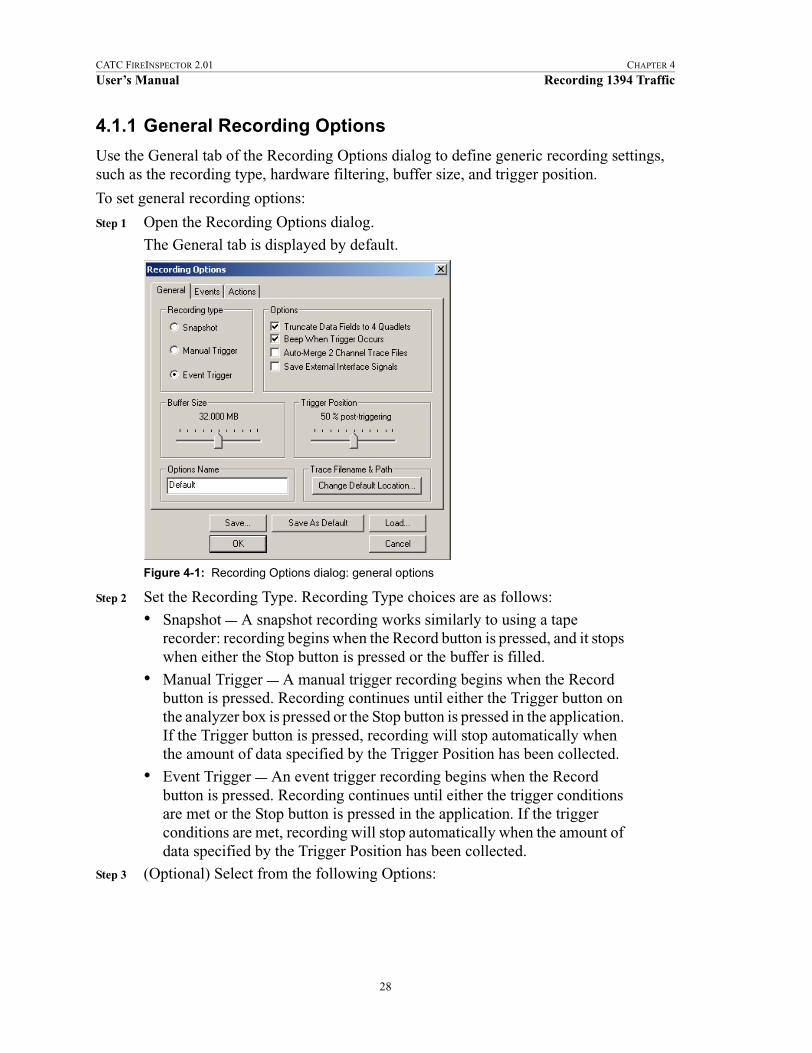
4.1.1 General Recording Options
Use the General tab of the Recording Options dialog to define generic recording settings, such as the recording type, hardware filtering, buffer size, and trigger position.
To set general recording options:
Step 1 Open the Recording Options dialog.
The General tab is displayed by default.
Step 2 Set the Recording Type. Recording Type choices are as follows:
• Snapshot — A snapshot recording works similarly to using a tape recorder: recording begins when the Record button is pressed, and it stops when either the Stop button is pressed or the buffer is filled.
• Manual Trigger — A manual trigger recording begins when the Record button is pressed. Recording continues until either the Trigger button on the analyzer box is pressed or the Stop button is pressed in the application. If the Trigger button is pressed, recording will stop automatically when the amount of data specified by the Trigger Position has been collected.
• Event Trigger — An event trigger recording begins when the Record button is pressed. Recording continues until either the trigger conditions are met or the Stop button is pressed in the application. If the trigger conditions are met, recording will stop automatically when the amount of data specified by the Trigger Position has been collected.
Step 3 (Optional) Select from the following Options:
Figure 4-1: Recording Options dialog: general options
28

CATC FIREINSPECTOR 2.01 CHAPTER 4
User’s Manual Recording 1394 Traffic
• Truncate Data Fields to 4 Quadlets — Selecting this option causes all data blocks to be truncated after the first four quadlets. This feature is useful when the contents of the data are not as important as the number of packets recorded. Truncating the data packets leaves more room in the buffer for other data.
• Beep When Trigger Occurs — When this option is selected, the analyzer box will beep when the trigger event is detected.
• Save External Interface Signals — Selecting this option causes signals from the External Interface Breakout Board to be saved in the recording file. The analyzer records external signals provided by the user (bits I0-I7on the External Breakout Board). These bits, along with output bits, are sampled once per each packet's quadlet during recording. Selecting this option instructs the software to save those signals in the recording file during data uploading so they can be viewed and analyzed later. Select this option only if you provide valuable data on external inputs/outputs.
Step 4 Set the Buffer Size. Use the slider or the arrow keys on the keyboard to adjust the buffer size. It can be set anywhere between 640 kilobytes and 64 megabytes. This determines the amount of data that the analyzer will record.
Step 5 Set the Trigger Position (for manual and event trigger recordings only). Use the slider or the arrow keys on the keyboard to adjust the trigger position. It can be set anywhere between 1 and 99%. This determines the amount of data that will be recorded before and after the trigger event. For example, if the slider is set at 30% post-triggering, then the first 70% of the data in the recording will be things that happened before the trigger, and the last 30% will be things that occurred after the trigger.
Step 6 (Optional) Enter an Options Name. You can use the options name to identify the current set of recording options. If you save the settings, then the next time the options file is loaded, the options name is displayed in the text box.
Step 7 (Optional) Set the Trace Filename & Path. Use this option to specify a name and location for the Trace file that is generated with the current set of recording options. If not specified, the default name, data.fdb, and the default location, \FireInspector, are used.
Step 8 Click OK to apply the settings and close the Recording Options dialog.
4.1.2 Event Options
Use the Events tab of the Recording Options dialog to define event groups and parameters that will be used for triggering, filtering, and other actions.
To define event settings:
Step 1 Open the Recording Options dialog.
29
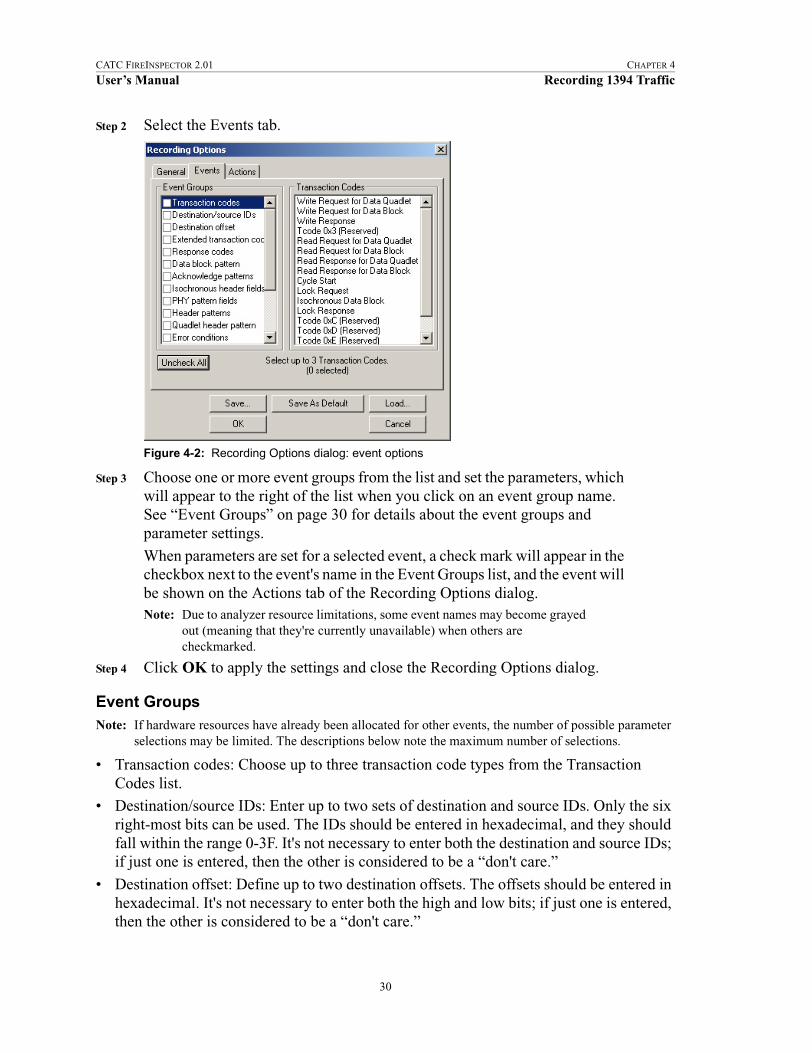
CATC FIREINSPECTOR 2.01 CHAPTER 4
User’s Manual Recording 1394 Traffic
Step 2 Select the Events tab.
Step 3 Choose one or more event groups from the list and set the parameters, which will appear to the right of the list when you click on an event group name. See “Event Groups” on page 30 for details about the event groups and parameter settings.
When parameters are set for a selected event, a check mark will appear in the checkbox next to the event's name in the Event Groups list, and the event will be shown on the Actions tab of the Recording Options dialog.Note: Due to analyzer resource limitations, some event names may become grayed
out (meaning that they're currently unavailable) when others are checkmarked.
Step 4 Click OK to apply the settings and close the Recording Options dialog.
Event GroupsNote: If hardware resources have already been allocated for other events, the number of possible parameter
selections may be limited. The descriptions below note the maximum number of selections.
• Transaction codes: Choose up to three transaction code types from the Transaction Codes list.
• Destination/source IDs: Enter up to two sets of destination and source IDs. Only the six right-most bits can be used. The IDs should be entered in hexadecimal, and they should fall within the range 0-3F. It's not necessary to enter both the destination and source IDs; if just one is entered, then the other is considered to be a “don't care.”
• Destination offset: Define up to two destination offsets. The offsets should be entered in hexadecimal. It's not necessary to enter both the high and low bits; if just one is entered, then the other is considered to be a “don't care.”
Figure 4-2: Recording Options dialog: event options
30

CATC FIREINSPECTOR 2.01 CHAPTER 4
User’s Manual Recording 1394 Traffic
• Extended transaction codes: Enter up to two extended transaction codes. Choose a code from the drop-down list, or enter a hexadecimal value from 0-FFFF.
• Response codes: Enter up to two response codes. Choose a code from the drop-down list. If desired, check “Include Reserved field” in order to include the reserved field that follows the rcode field in the packet header.
• Data block pattern: When “Data Block pattern” is selected in the Event Groups list, you can define the pattern of the first two quadlets of a data block. See “Data Pattern Edi-tors” on page 32 for details.
• Acknowledge patterns: Enter up to two acknowledge patterns. Choose a code from the drop down list, or enter a code's hexadecimal value.
• Isochronous header fields: Enter up to two ISO header fields. Enter a channel number and/or data_length in decimal. It's not necessary to enter both a channel number and a data_length; if just one is entered, then the other is considered to be a “don't care.”
• PHY pattern fields: When “PHY pattern fields” is selected in the Event Groups list, you may specify the pattern of the first quadlet of a PHY packet. See “Data Pattern Editors” on page 32 for details.
• Header patterns: When “Header patterns” is selected in the Event Groups list, you may specify the pattern of the first four quadlets of up to two packet headers. See “Data Pat-tern Editors” on page 32 for details.
• Quadlet header pattern: When “Quadlet header pattern” is selected in the Event Groups list, you may specify the pattern of the first quadlets of a packet header. See “Data Pat-tern Editors” on page 32 for details.
• Error conditions: Choose any combination of three response codes: bad PHY, bad ACK, and bad CRC.
• Bus conditions: Choose any combination of six bus conditions: Arbitration Reset Gap, Subaction Gap, Bus reset, Speed 100 Mb/sec, Speed 200 Mb/sec, and Speed 400 Mb/sec.
• External trigger sources: When “External trigger sources” is selected in the Event Groups list, you may enable or disable one or more trigger inputs from the External Interface Breakout Board. Place a checkmark next to an input to enable it; uncheck to disable it. The inputs can be set as Active High or Active Low signals. Note that using the Active High trigger signal polarity requires special hardware to pull external inputs down.
• FCP Event: Define up to two FCP events. Choose Command or Response for each event and check “Use” to enable “FCP Event” in the Event Groups list.
• CIP header: When “CIP header” is selected in the Event Groups list, you may use up to two CIP headers. Check the “Use” box for each CIP header that you want to use.
• SBP Management Offset: Define up to two SBP management offsets. Specify the off-sets in hexadecimal. It's not necessary to enter both high 16 bits and low 32 bits; if just one is entered, then the other is considered to be a “don't care.”
31

CATC FIREINSPECTOR 2.01 CHAPTER 4
User’s Manual Recording 1394 Traffic
• SBP Fetch Agent Offset: Define up to two SBP fetch agent offsets. Specify the offsets in hexadecimal and select a register from the drop-down list. It's not necessary to enter both high 16 bits and low 32 bits; if just one is entered, then the other is considered to be a “don't care.”
Data Pattern Editors
The Data block pattern, PHY pattern fields, Header patterns, and Quadlet header patterns event groups allow you to edit the contents of the packets in order to define recording actions.
1. Click the Edit button to access the Edit...Pattern dialog.2. Select a tab to work with. Each tab contains a bit pattern template.
3. Enter bit pattern, Mask, or Match values.Bit patterns should be entered in binary (1 or 0); use “X” for irrelevant values. Mask and Match values should be entered in hexadecimal. Hint: Use the X, 0, and 1 buttons on the right to change all of the bit values to X, 0, or 1.
4. Press OK to return to the Recording Options dialog.
5. Check the box marked “Use” to enable the pattern event group in the Event Groups list.
4.1.3 Action Options
Use the Actions tab of the Recording Options dialog to set up the sequencing and filtering of the events that you selected on the Events tab. The Actions tab allows you to set complex dependencies and actions for the events.
Figure 4-3: Recording Options dialog: Action options
32
CATC FIREINSPECTOR 2.01 CHAPTER 4
User’s Manual Recording 1394 Traffic
To define event actions and sequencing:
Step 1 Open the Recording Options dialog.Step 2 Define event settings on the Events tab. For information about event settings,
please see “Event Options” on page 29.
Step 3 Select the Actions tab.By default, all events are set up as triggers.
Step 4 Associate events with actions and other events by left-clicking on an event, then moving the mouse pointer to the desired action or event. A thick, black arrow will follow the pointer as you drag the mouse. Complete the connection by clicking on the target action or event.
Step 5 Click OK to apply the settings and close the Recording Options dialog.
Trigger
This action designates an event as a recording trigger. If more than one event is designated as a trigger, the recording will trigger on the first one that is detected.
Filter
Events can be filtered in or filtered out of a recording. This allows you to focus on just the packets you're interested in on heavily loaded buses. If Filter Out is selected, packets that match the events associated with the filter action are excluded from the recording. However, if Filter In is selected, only the packets that match any of the events specified on the Events tab will be recorded.
To change the filter polarity:
Step 1 Click on the light blue circle in the upper left of the Filter box.
A menu will pop up.
Step 2 Choose Filter In or Filter Out from the menu.
The name on the Filter box will change to reflect your choice.
Restart
This action works in conjunction with the counters and/or a sequence of two events. When an event with the Restart action occurs, all the counter values are reset to initial values and the event sequences are restarted to the “wait for the first event in sequence” state.
Count1 and Count2
The Count action allows the specified events to happen a specified number of times before the trigger is generated. You can connect several events to a counter. Each time one of these events comes across the bus, the value of the counter is decreased by one. When the counter value reaches zero, the trigger is generated. If there are one or more events linked to each counter, then the trigger will be generated by the first event that causes a counter value to reach zero.
33

CATC FIREINSPECTOR 2.01 CHAPTER 4
User’s Manual Recording 1394 Traffic
To change the counter values:
Step 1 Click on the light blue circle in the upper left corner of a Count box.A menu will pop up.
Step 2 Select Change Counter Value.
The Input Counter Value dialog will open.Step 3 Enter a value between 1 and 15.
Step 4 Click OK.
The new value will be displayed in parentheses on the Count box.
Event to Event Sequencing
When an event is sequenced to another event, the recording engine waits for the first event to happen and then enables the second event for triggering. Note that an event can be sequenced to another event only if the second event is designated as a trigger or to generate external output only, and both are header-type events.
Enable/Disable External General Purpose Output
This option enables or disables an event's ability to generate an output signal on one of the external interface breakout board output pins. When this option is enabled, the event can generate the external output as well as being associated with another action.
To Enable or Disable External General Purpose Output:
Step 1 Click on the light blue circle in the upper left corner of an event box.
A menu will pop up.
Step 2 Select Enable External General Purpose Output or Disable External General Purpose Output.
If external output is enabled, a small magenta arrow will protrude from the lower right side of the event box. If external output is disabled, the arrow will disappear.
Enable External General Purpose Output Only
This option enables an event's ability to generate an output signal on one of the breakout board output pins and disassociates it from all other actions and events. When this option is enabled, the event will only generate external output.
To enable External General Purpose Output Only:
Step 1 Click on the light blue circle in the upper left corner of an event box.
A menu will pop up.Step 2 Select Enable External General Purpose Output only.
If external output is enabled, a small magenta arrow will protrude from the lower right side of the event box. If the event was previously associated with an action or other event, those associations will be removed.
34
CATC FIREINSPECTOR 2.01 CHAPTER 4
User’s Manual Recording 1394 Traffic
The External General Purpose Output Only option can be disabled by associating the event with an action or other event. If you do this, the External General Purpose Output option is automatically enabled for the event.
External Output Form
This option is available when external output is enabled for an event. This allows you to change the output signal form for an event.
To select the External Output Form:
Step 1 Click on the light blue circle in the upper left corner of an event box.
A menu will pop up.
Step 2 Select External Output Form.A menu with the following choices will pop up:
• Pulse Low: This format causes the analyzer to transmit a -5 volt, 16.66 nanosecond signal.
• Pulse High: This is the default format. It causes the analyzer to transmit a 5-volt, 16.66-nanosecond signal.
• Toggle: This format causes the analyzer to transmit a signal that will toggle between a continuous 5-volt signal and a continuous -5 volt signal with each trigger event.
Step 3 Select Pulse Low, Pulse High, or Toggle.
4.1.4 Saving Recording Options
Once you have set recording options using the Recording Options dialog, you can save the settings in a Recording Options (.rec) file.
• Use the Save... button to access the Save As dialog and save the settings with a unique name.
• Use the Save As Default button to save the settings and designate them to be automati-cally loaded the next time the FireInspector software is started. Then, if no other record-ing options file is loaded in the meantime, the settings will automatically be applied to the next recording session. The settings will be saved with the name default.rec. If you save another set of recording options as default, the file default.rec will be overwritten.
4.1.5 Loading Recording Options
Recording options (.rec) files can be loaded and applied via the Recording Options dialog. Recording options files are created by saving recording settings.
To load a Recording options file:
Step 1 Open the Recording Options dialog.
The General tab is displayed by default.
35

CATC FIREINSPECTOR 2.01 CHAPTER 4
User’s Manual Recording 1394 Traffic
Step 2 From any tab, click the Load... button.The Open dialog will appear.
Step 3 Navigate to the file that you want to use, then click Open.
The Open dialog will close and you'll be returned to the Recording Options dialog. The settings in the dialog will reflect the settings from the file you chose.
Step 4 Click OK to use the settings and close the Recording Options dialog.
4.2 Making a RecordingDuring a recording session, FireInspector monitors and records bus activity according to the specifications set by the user. When the session ends, FireInspector decodes the data, uploads it to the PC, and displays the recorded packets and related information as a CATC Trace file.
4.2.1 Recording
To record bus traffic:
Step 1 Set up recording options or load a recording options file.
Step 2 Select Record > Start from the menu bar or press the Record button on the standard toolbar.
• Before recording starts, FireInspector checks to see whether there is enough space on the current hard drive to save data and alerts you if there is not enough space.
• The recording session will run according to the specified recording options.
• Recording status is tracked and reported on an activity meter on the status bar.
Step 3 (Optional) Press the Trigger button on the front of the analyzer to force a trigger event to occur. This is possible only when the Recording Type is set to Event or Manual on the General tab of the Recording Options dialog.
Step 4 Select Record > Stop from the menu bar, press the Stop button on the standard toolbar, or press the Escape (Esc) key on the keyboard to manually stop the recording session. This step is optional if the Recording Type is set to Event or Manual on the General tab of the Recording Options dialog.
36
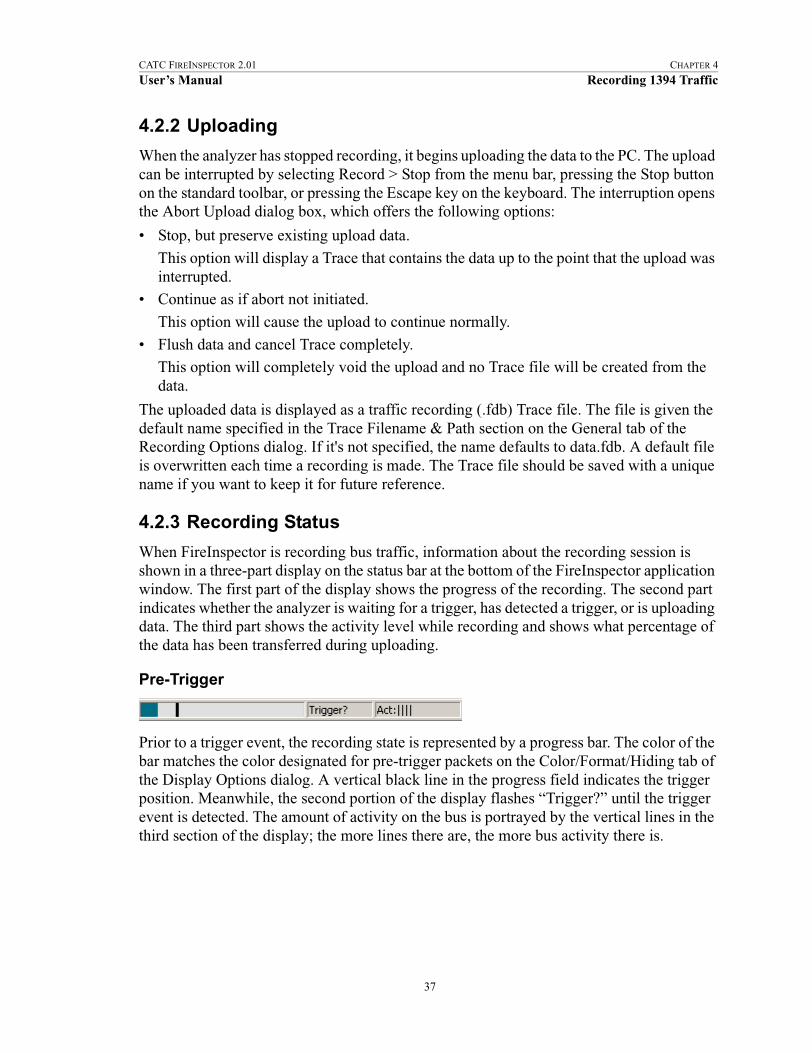
CATC FIREINSPECTOR 2.01 CHAPTER 4
User’s Manual Recording 1394 Traffic
4.2.2 Uploading
When the analyzer has stopped recording, it begins uploading the data to the PC. The upload can be interrupted by selecting Record > Stop from the menu bar, pressing the Stop button on the standard toolbar, or pressing the Escape key on the keyboard. The interruption opens the Abort Upload dialog box, which offers the following options:
• Stop, but preserve existing upload data.
This option will display a Trace that contains the data up to the point that the upload was interrupted.
• Continue as if abort not initiated.
This option will cause the upload to continue normally.
• Flush data and cancel Trace completely.This option will completely void the upload and no Trace file will be created from the data.
The uploaded data is displayed as a traffic recording (.fdb) Trace file. The file is given the default name specified in the Trace Filename & Path section on the General tab of the Recording Options dialog. If it's not specified, the name defaults to data.fdb. A default file is overwritten each time a recording is made. The Trace file should be saved with a unique name if you want to keep it for future reference.
4.2.3 Recording Status
When FireInspector is recording bus traffic, information about the recording session is shown in a three-part display on the status bar at the bottom of the FireInspector application window. The first part of the display shows the progress of the recording. The second part indicates whether the analyzer is waiting for a trigger, has detected a trigger, or is uploading data. The third part shows the activity level while recording and shows what percentage of the data has been transferred during uploading.
Pre-Trigger
Prior to a trigger event, the recording state is represented by a progress bar. The color of the bar matches the color designated for pre-trigger packets on the Color/Format/Hiding tab of the Display Options dialog. A vertical black line in the progress field indicates the trigger position. Meanwhile, the second portion of the display flashes “Trigger?” until the trigger event is detected. The amount of activity on the bus is portrayed by the vertical lines in the third section of the display; the more lines there are, the more bus activity there is.
37
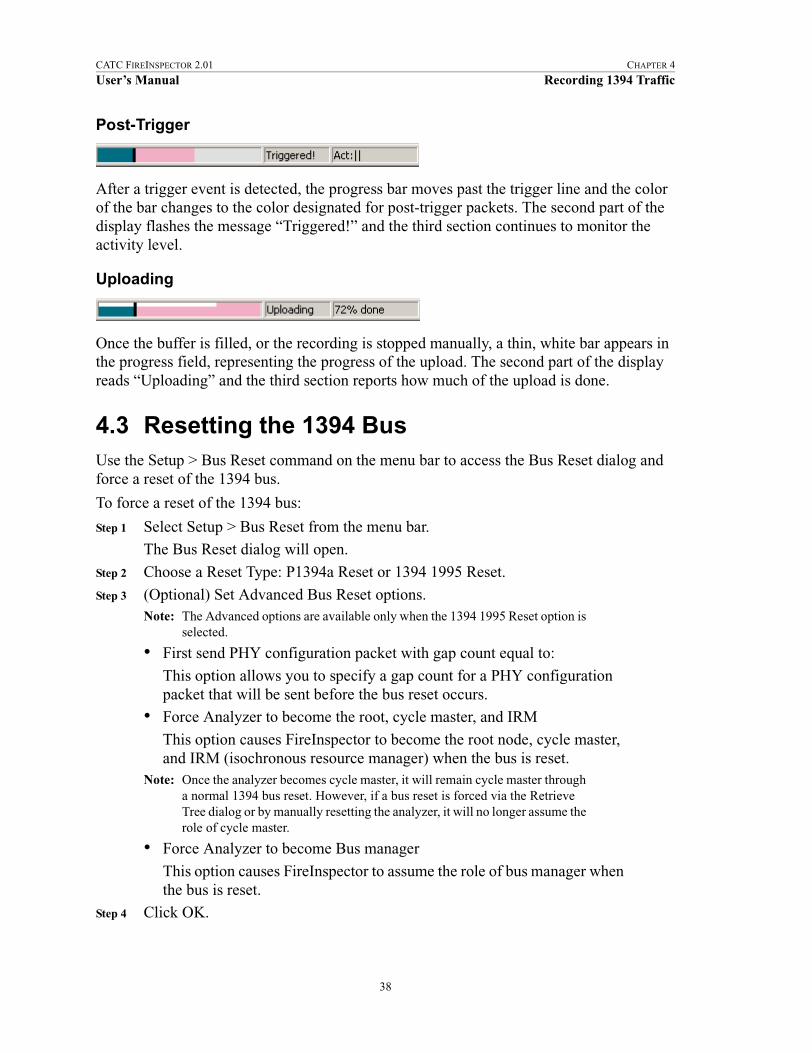
CATC FIREINSPECTOR 2.01 CHAPTER 4
User’s Manual Recording 1394 Traffic
Post-Trigger
After a trigger event is detected, the progress bar moves past the trigger line and the color of the bar changes to the color designated for post-trigger packets. The second part of the display flashes the message “Triggered!” and the third section continues to monitor the activity level.
Uploading
Once the buffer is filled, or the recording is stopped manually, a thin, white bar appears in the progress field, representing the progress of the upload. The second part of the display reads “Uploading” and the third section reports how much of the upload is done.
4.3 Resetting the 1394 BusUse the Setup > Bus Reset command on the menu bar to access the Bus Reset dialog and force a reset of the 1394 bus.
To force a reset of the 1394 bus:
Step 1 Select Setup > Bus Reset from the menu bar.
The Bus Reset dialog will open.
Step 2 Choose a Reset Type: P1394a Reset or 1394 1995 Reset.
Step 3 (Optional) Set Advanced Bus Reset options. Note: The Advanced options are available only when the 1394 1995 Reset option is
selected.
• First send PHY configuration packet with gap count equal to:
This option allows you to specify a gap count for a PHY configuration packet that will be sent before the bus reset occurs.
• Force Analyzer to become the root, cycle master, and IRM
This option causes FireInspector to become the root node, cycle master, and IRM (isochronous resource manager) when the bus is reset.
Note: Once the analyzer becomes cycle master, it will remain cycle master through a normal 1394 bus reset. However, if a bus reset is forced via the Retrieve Tree dialog or by manually resetting the analyzer, it will no longer assume the role of cycle master.
• Force Analyzer to become Bus manager
This option causes FireInspector to assume the role of bus manager when the bus is reset.
Step 4 Click OK.
38

CATC FIREINSPECTOR 2.01 CHAPTER 4
User’s Manual Recording 1394 Traffic
4.4 Enabling and Disabling Configuration ROMWhen configuration ROM is disabled in FireInspector, the analyzer reports only a minimal configuration ROM. In order to have FireInspector respond with a richer configuration ROM, you must enable the default configuration ROM in FireInspector. If you subsequently disable configuration ROM, FireInspector will once again report the minimal configuration ROM.
To enable or disable configuration ROM:
Step 1 Select Setup > Configuration ROM from the menu bar.The Set FireInspector's Configuration ROM dialog will appear.
Step 2 Click Enable Default Config ROM or Disable Config ROM.
The dialog will close.
You can force FireInspector to return the same configuration ROM as the device being analyzed by using the Advanced option when enabling FireInspector's configuration ROM.
To select a custom configuration ROM for FireInspector:
Step 1 Select Setup > Configuration ROM from the menu bar.
The Set FireInspector's Configuration ROM dialog will appear.
Step 2 Click the Advanced... button.
The Open dialog will appear.
Step 3 Select a Config ROM (.rom) file to use and click Open.
Both dialogs will close.
Note: A configuration ROM file is a text file that contains one hexadecimal quadlet of data per line and does not exceed one kilobyte in size. The quadlet in the file is returned by the analyzer when a request is addressed to the ROM offset 0xFFFFF0000400, and successive quadlets are addressed sequentially.
Note: Resetting the analyzer will disable configuration ROM.
39

CATC FIREINSPECTOR 2.01 CHAPTER 4
User’s Manual Recording 1394 Traffic
40

CATC FIREINSPECTOR 2.01 CHAPTER 5
User’s Manual CATC Trace Files
CHAPTER 5: CATC TRACE FILESFireInspector displays both bus traffic recording (.fdb) files and traffic generation (.txg) files in CATC Trace graphical format.
The CATC Trace display makes extensive use of color and graphics to fully document the captured data. Individual packets (subactions) are shown on separate rows, with every field labeled, numbered, and color-coded. Packet rows also display time stamps, idle times, data rates, bus resets, and the presence of subaction and arbitration reset gaps. Built-in or custom-made transaction-level decoding can be easily applied to a Trace to reveal protocol-specific information. Like packets, individual transactions are separated into rows, labeled, numbered, and color-coded. The Display Options allows you to control the presentation of virtually every aspect of the data, including the colors, number formats, fonts, and visibility of specific fields. Many of these options can also be configured via the Trace pop-up menus.
The Trace pop-up menus provide access to many display commands, as well as special dialogs that contain more detailed information about field contents. Additional information can also be gleaned from the display’s tooltips.
Finally, FireInspector’s search capabilities help you to pinpoint exactly what you're looking for, even in a large Trace file.
Figure 5-1: CATC Trace display
41
CATC FIREINSPECTOR 2.01 CHAPTER 5
User’s Manual CATC Trace Files
5.1 Display OptionsThe Display Options dialog box in FireInspector allows you to customize the way that Trace view elements are displayed. The display of almost everything in a Trace can be defined, from the fonts and colors to the number formats and types of packets and transactions to show. These settings can then be saved to a display options (.opt) file. You can load saved settings and apply them to any Trace file.
There are three ways to access the Display Options dialog:
• Click the Display Options icon on the toolbar.
• Select Setup > Display Options from the menu bar.
• Right-click anywhere in the display background of an active Trace file window and select Display Options from the pop-up Trace View menu.
There are three tabs in the Display Options dialog:
• General: the General tab contains options for the zoom level, tooltips, wrapping, fonts, and view levels.
• Color/Format/Hiding: the Color/Format/Hiding tab is used to customize the color set-tings for individual fields, configure the way that numeric values are displayed, and to show or hide fields.
• Level Hiding: the Level Hiding tab is used to set the visibility of specific packets.
5.1.1 General Display Options
Use the General tab of the Display Options dialog to define generic display settings.
To set general display options:
Step 1 Open the Display Options dialog.
The General tab (shown in Figure 5-2) is displayed by default.
Step 2 Configure the following elements to your liking:• Zoom Level: Use this to set the magnification of the display. Can be set
from 10-200%, in increments of ten.
• Enable Tips: Check this if you want tooltips to be shown when the mouse passes over any header cell that contains a tooltip.
• Wrap: Check this if you want the packets to wrap to the width of the display window.
• Right click cell context menu: Check this if you want the cell context menus to pop up when you right-click on a cell. By default, the cell context menus are accessed by left-clicking on a cell.
• Fonts: Use the Fields drop-down list to choose a font for the field text. Use the Data drop-down list to choose a font for data.
42
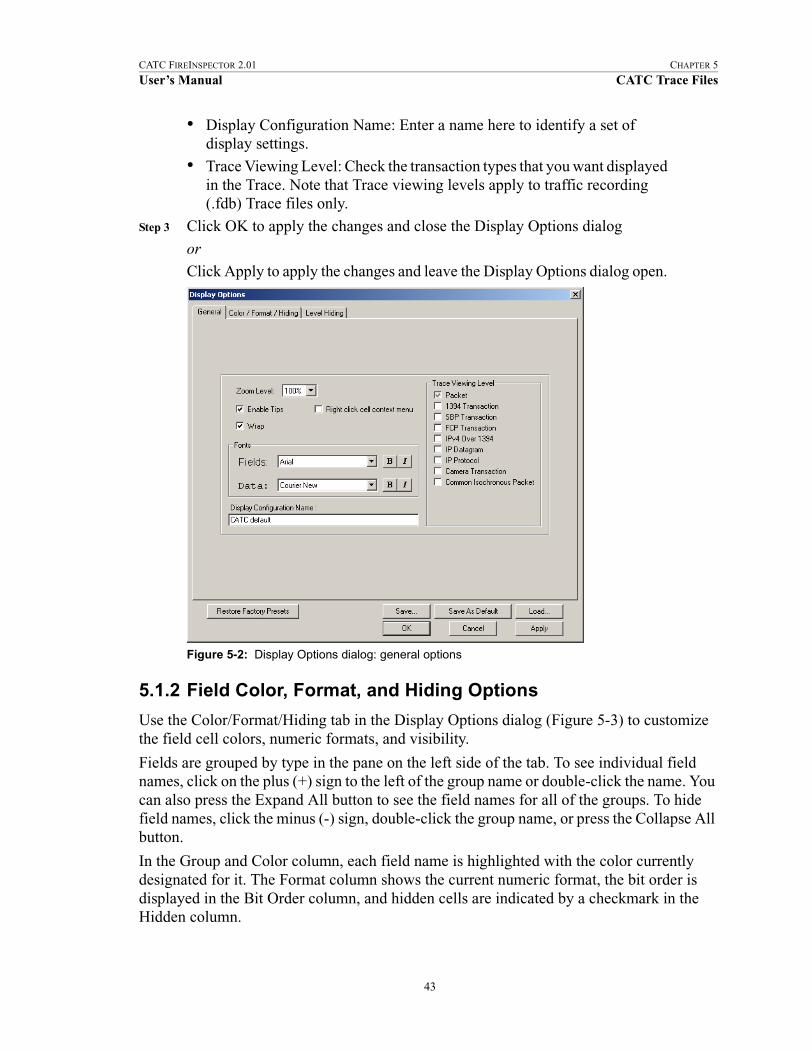
CATC FIREINSPECTOR 2.01 CHAPTER 5
User’s Manual CATC Trace Files
• Display Configuration Name: Enter a name here to identify a set of display settings.
• Trace Viewing Level: Check the transaction types that you want displayed in the Trace. Note that Trace viewing levels apply to traffic recording (.fdb) Trace files only.
Step 3 Click OK to apply the changes and close the Display Options dialog
or
Click Apply to apply the changes and leave the Display Options dialog open.
5.1.2 Field Color, Format, and Hiding Options
Use the Color/Format/Hiding tab in the Display Options dialog (Figure 5-3) to customize the field cell colors, numeric formats, and visibility.
Fields are grouped by type in the pane on the left side of the tab. To see individual field names, click on the plus (+) sign to the left of the group name or double-click the name. You can also press the Expand All button to see the field names for all of the groups. To hide field names, click the minus (-) sign, double-click the group name, or press the Collapse All button.
In the Group and Color column, each field name is highlighted with the color currently designated for it. The Format column shows the current numeric format, the bit order is displayed in the Bit Order column, and hidden cells are indicated by a checkmark in the Hidden column.
Figure 5-2: Display Options dialog: general options
43

CATC FIREINSPECTOR 2.01 CHAPTER 5
User’s Manual CATC Trace Files
Set Field Colors
To change a field's color:
Step 1 Open the Display Options dialog.Step 2 Select the Color/Format/Hiding tab (shown in Figure 5-3).
Step 3 Click on the name of a field for which you want to set the color.
Step 4 Choose a standard color or customize your own color in the Color tool.For details about using the Color tool, see “Color Tool/Colors Dialog” on page 44.
Step 5 Click OK to apply the changes and close the Display Options dialog.or
Click Apply to apply the changes and leave the Display Options dialog open.
Color Tool/Colors Dialog
The Color tool and the Colors dialog both allow you to customize color settings. The Color tool is found on the Color/Format/Hiding tab of the Display Options dialog, and the Colors dialog is accessed via the Color command (described on page 78) on the Trace file cell context menu.
Standard Tab
The Standard tab (Figure 5-4) of the Color tool and the Colors dialog contains a palette of predefined colors. Left-click on a color in the palette to choose that color.
Figure 5-3: Display Options dialog: color, format, and field hiding options
44

CATC FIREINSPECTOR 2.01 CHAPTER 5
User’s Manual CATC Trace Files
Custom Tab
The Custom tab (Figure 5-4) of the Color tool and the Colors dialog contains various controls for creating custom colors.
• Colors box — use the mouse pointer to select a color from the spectrum in the Colors box.
• Slider — use the slider to the right of the color box to adjust the current color's red, green, blue, and luminance values.
• Hue, Saturation, and Luminance values — adjust these values by typing in new values or by using the controls.
• Red, Green and Blue values — adjust these values by typing in new values or by using the controls.
Set Field Formats
Use the Color/Format/Hiding tab in the Display Options dialog to customize the presentation of numeric values in a Trace file.
Each field’s current number formatting is shown in the Format column, and, when the field name is selected, in the Format section above the Color tool. Number formatting options are available only for certain fields.
Possible formats are: hexadecimal, decimal, binary, and ASCII. Not all formats are available for all fields.
To change a field's number format:
Step 1 Open the Display Options dialog.
Step 2 Select the Color/Format/Hiding tab (shown in Figure 5-3).
Step 3 Click on the name of a field for which you want to set the number format.
Step 4 Use one of the following methods to change the field’s number format:
Figure 5-4: Standard and Custom tabs, as they appear in the Colors dialog
45
CATC FIREINSPECTOR 2.01 CHAPTER 5
User’s Manual CATC Trace Files
• Click the radio button for the desired format in the Format section.• Click the format name in the Format column and select a new format from
the drop-down menu that appears.
Step 5 Click OK to apply the changes and close the Display Options dialogor
Click Apply to apply the changes and leave the Display Options dialog open.
Set Field Bit or Byte Order
Use the Color/Format/Hiding tab in the Display Options dialog to set the bit or byte order for numeric values in a Trace file. This option is available only for certain fields.
The bit/byte order can be set to MSB -> LSB (Most Significant Bit/Byte to Least Significant Bit/Byte) or LSB -> MSB (Least Significant Bit/Byte to Most Significant Bit/Byte).
To change a field's bit or byte order:
Step 1 Open the Display Options dialog.
Step 2 Select the Color/Format/Hiding tab (shown in Figure 5-3).
Step 3 Click on the name of a field for which you want to set the order.
Step 4 Use one of the following methods to change the field’s bit or byte order:
• Click the radio button for the desired format in the Bit Order section.
• Click the format name in the Bit Order column and select a new format from the drop down menu that appears.
Step 5 Click OK to apply the changes and close the Display Options dialog
or
Click Apply to apply the changes and leave the Display Options dialog open.
Set Field Hiding
Use the Color/Format/Hiding tab in the Display Options dialog to set the visibility of field groups in a Trace file. This option is available only for certain fields.
Fields can be hidden or visible.
To hide or show field groups:
Step 1 Open the Display Options dialog.
Step 2 Select the Color/Format/Hiding tab (shown in Figure 5-3).
Step 3 Click on the name of a field that you want to show or hide.Step 4 Use one of the following methods to change the field’s visibility:
• Check or uncheck the Hidden box in the Hiding section.
• Check or uncheck the box in the Hidden column.Fields are hidden if the Hidden box is checked, and they are visible if it’s unchecked.
46

CATC FIREINSPECTOR 2.01 CHAPTER 5
User’s Manual CATC Trace Files
Step 5 Click OK to apply the changes and close the Display Options dialogor
Click Apply to apply the changes and leave the Display Options dialog open.
5.1.3 Level Hiding Options
Use the Level Hiding tab in the Display Options dialog to prevent certain packets from being displayed in Trace view. This tab is also used to unhide the hidden packets.
To hide or unhide packets:
Step 1 Open the Display Options dialog.
Step 2 Select the Level Hiding tab (shown in Figure 5-5).
Step 3 Select the packets that you want to hide or unhide:
• Check or uncheck the Hide Cycle Start Packets and/or Hide Isochronous Data Block Packets checkboxes to suppress or show them in Trace display.
• Select packets to hide or reveal by clicking the Define Packets to Hide button.
The Define Packets to Hide dialog will open. See “Define Packets to Hide Dialog” on page 48 for details about using this dialog.
Step 4 Click OK to apply the changes and close the Display Options dialogor
Figure 5-5: Display Options dialog: level hiding options
47
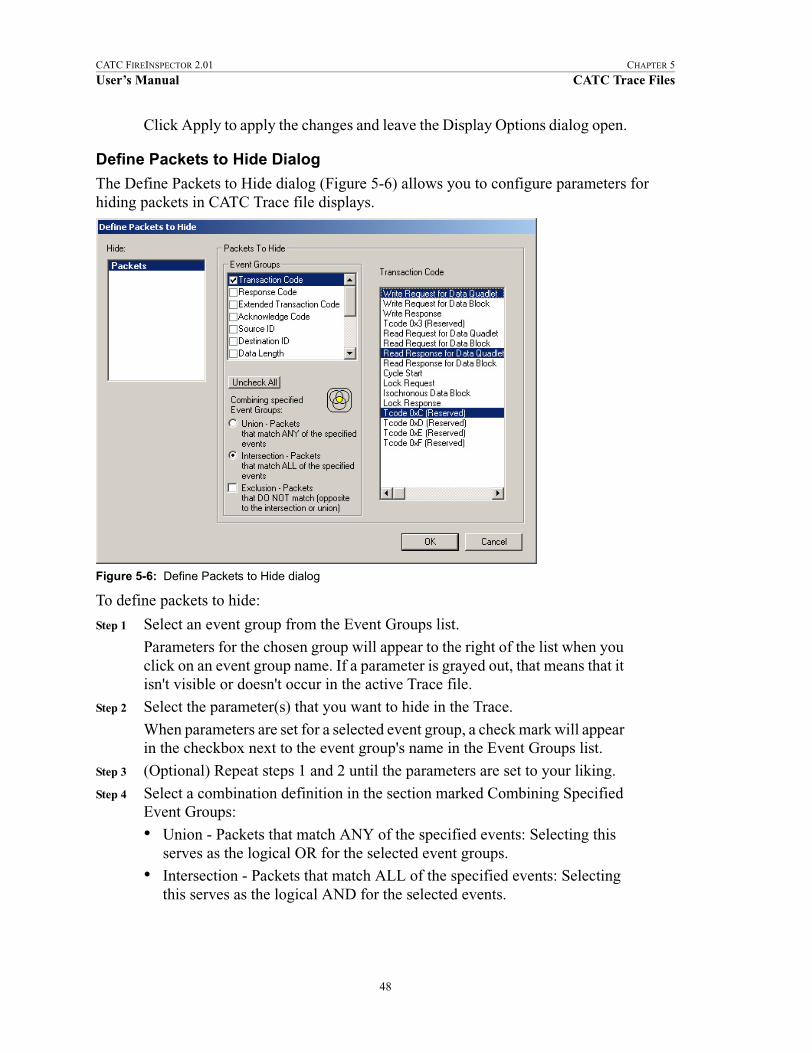
CATC FIREINSPECTOR 2.01 CHAPTER 5
User’s Manual CATC Trace Files
Click Apply to apply the changes and leave the Display Options dialog open.
Define Packets to Hide Dialog
The Define Packets to Hide dialog (Figure 5-6) allows you to configure parameters for hiding packets in CATC Trace file displays.
To define packets to hide:
Step 1 Select an event group from the Event Groups list.
Parameters for the chosen group will appear to the right of the list when you click on an event group name. If a parameter is grayed out, that means that it isn't visible or doesn't occur in the active Trace file.
Step 2 Select the parameter(s) that you want to hide in the Trace.
When parameters are set for a selected event group, a check mark will appear in the checkbox next to the event group's name in the Event Groups list.
Step 3 (Optional) Repeat steps 1 and 2 until the parameters are set to your liking.
Step 4 Select a combination definition in the section marked Combining Specified Event Groups:
• Union - Packets that match ANY of the specified events: Selecting this serves as the logical OR for the selected event groups.
• Intersection - Packets that match ALL of the specified events: Selecting this serves as the logical AND for the selected events.
Figure 5-6: Define Packets to Hide dialog
48
CATC FIREINSPECTOR 2.01 CHAPTER 5
User’s Manual CATC Trace Files
• Exclusion - Packets that DO NOT match (opposite to the intersection or union): Selecting this finds all the packets that DO NOT match the specified search criteria. It must be used in conjunction with either the Union or Intersection option.
Step 5 Click OK.
5.1.4 Restore Factory Presets
You can reset the display options to the factory preset definitions by clicking the Restore Factory Presets button on the bottom left of the Display Options dialog.
5.1.5 Saving Display Options
Once you have set display options using the Display Options dialog, you can save the settings in a Display Options (.opt) file.
• Use the Save... button to access the Save As dialog and save the settings with a unique name.
• Use the Save As Default button to save the settings and designate them to be automati-cally loaded the next time the FireInspector software is started. Then, the settings will automatically be applied when Trace files are opened, as long as no other display options file is loaded in the meantime. The settings will be saved with the name default.opt. If you save another set of display options as default, the file default.opt will be overwritten.
5.1.6 Loading Display Options
Display options (.opt) files can be loaded and applied via the Display Options dialog. Display options files are created by saving display settings.
To load a display options file:
Step 1 Open the Display Options dialog.
The General tab is displayed by default.Step 2 From any tab, click the Load... button.
The Open dialog will appear.
Step 3 Navigate to the file that you want to use, then click Open.The Open dialog will close and you'll be returned to the Display Options dialog. The settings in the dialog will reflect the settings from the file you chose.
Step 4 Click OK to apply the settings and close the Display Options dialog
or
Click Apply to apply the settings and leave the Display Options dialog open.
49
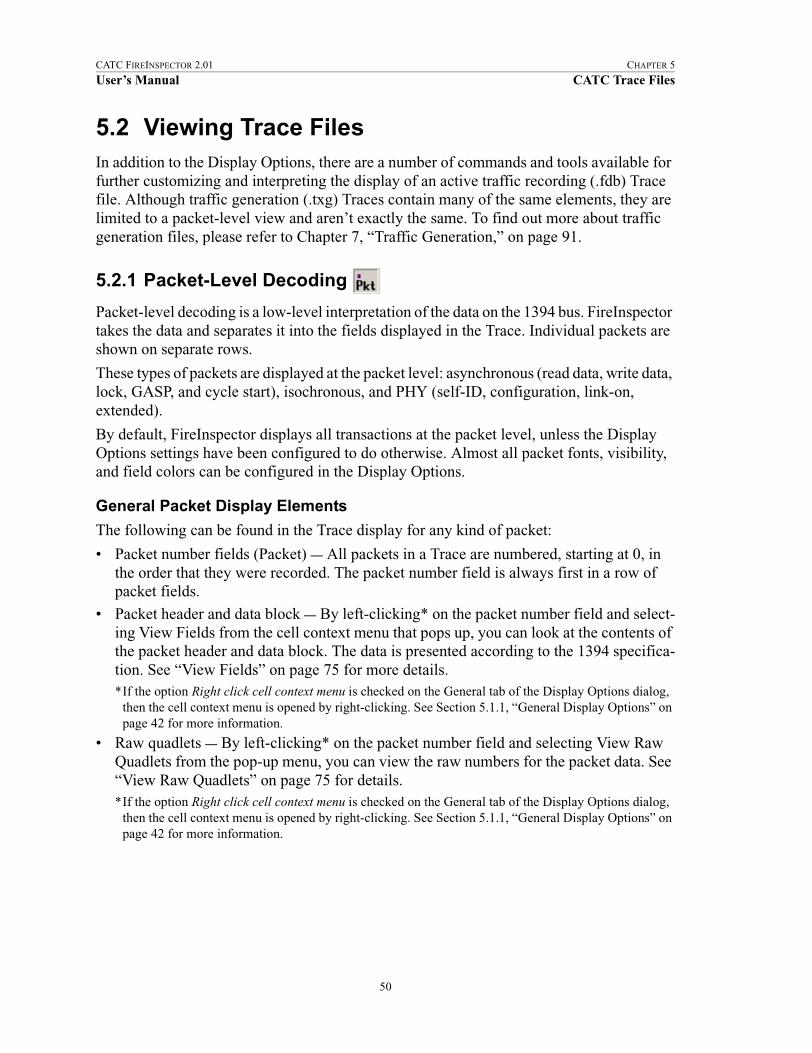
CATC FIREINSPECTOR 2.01 CHAPTER 5
User’s Manual CATC Trace Files
5.2 Viewing Trace FilesIn addition to the Display Options, there are a number of commands and tools available for further customizing and interpreting the display of an active traffic recording (.fdb) Trace file. Although traffic generation (.txg) Traces contain many of the same elements, they are limited to a packet-level view and aren’t exactly the same. To find out more about traffic generation files, please refer to Chapter 7, “Traffic Generation,” on page 91.
5.2.1 Packet-Level Decoding
Packet-level decoding is a low-level interpretation of the data on the 1394 bus. FireInspector takes the data and separates it into the fields displayed in the Trace. Individual packets are shown on separate rows.
These types of packets are displayed at the packet level: asynchronous (read data, write data, lock, GASP, and cycle start), isochronous, and PHY (self-ID, configuration, link-on, extended).
By default, FireInspector displays all transactions at the packet level, unless the Display Options settings have been configured to do otherwise. Almost all packet fonts, visibility, and field colors can be configured in the Display Options.
General Packet Display Elements
The following can be found in the Trace display for any kind of packet:
• Packet number fields (Packet) — All packets in a Trace are numbered, starting at 0, in the order that they were recorded. The packet number field is always first in a row of packet fields.
• Packet header and data block — By left-clicking* on the packet number field and select-ing View Fields from the cell context menu that pops up, you can look at the contents of the packet header and data block. The data is presented according to the 1394 specifica-tion. See “View Fields” on page 75 for more details.*If the option Right click cell context menu is checked on the General tab of the Display Options dialog,
then the cell context menu is opened by right-clicking. See Section 5.1.1, “General Display Options” on page 42 for more information.
• Raw quadlets — By left-clicking* on the packet number field and selecting View Raw Quadlets from the pop-up menu, you can view the raw numbers for the packet data. See “View Raw Quadlets” on page 75 for details.*If the option Right click cell context menu is checked on the General tab of the Display Options dialog,
then the cell context menu is opened by right-clicking. See Section 5.1.1, “General Display Options” on page 42 for more information.
50
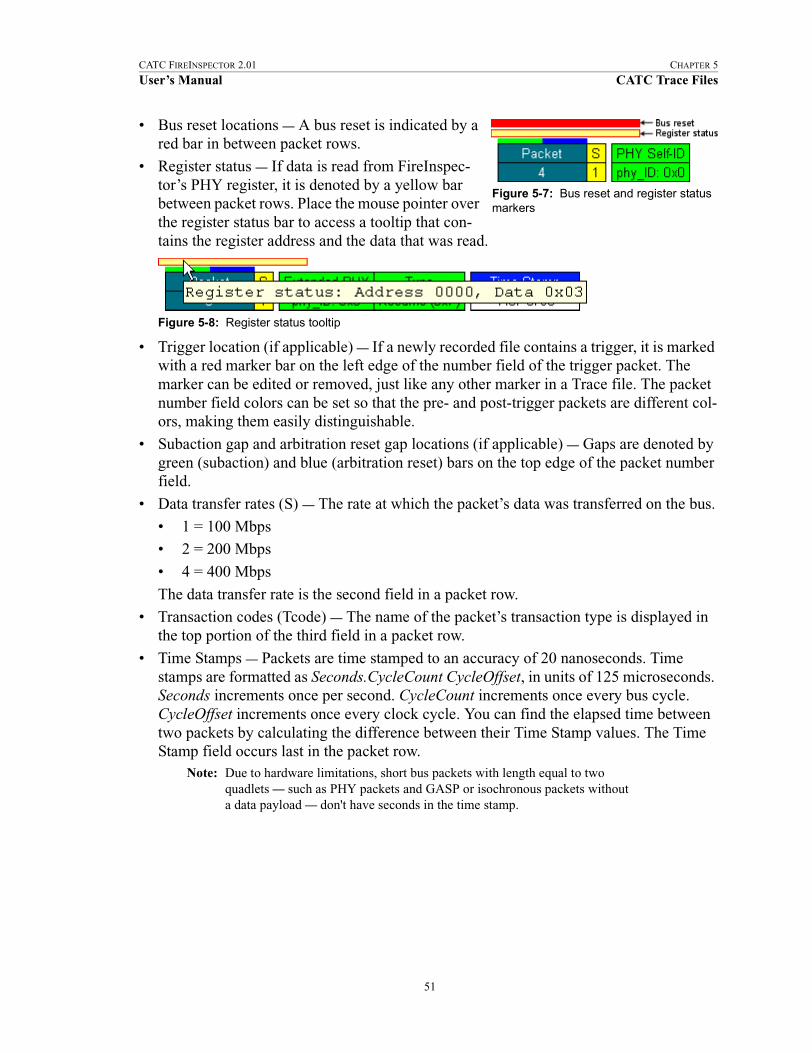
CATC FIREINSPECTOR 2.01 CHAPTER 5
User’s Manual CATC Trace Files
• Bus reset locations — A bus reset is indicated by a red bar in between packet rows.
• Register status — If data is read from FireInspec-tor’s PHY register, it is denoted by a yellow bar between packet rows. Place the mouse pointer over the register status bar to access a tooltip that con-tains the register address and the data that was read.
• Trigger location (if applicable) — If a newly recorded file contains a trigger, it is marked with a red marker bar on the left edge of the number field of the trigger packet. The marker can be edited or removed, just like any other marker in a Trace file. The packet number field colors can be set so that the pre- and post-trigger packets are different col-ors, making them easily distinguishable.
• Subaction gap and arbitration reset gap locations (if applicable) — Gaps are denoted by green (subaction) and blue (arbitration reset) bars on the top edge of the packet number field.
• Data transfer rates (S) — The rate at which the packet’s data was transferred on the bus.
• 1 = 100 Mbps
• 2 = 200 Mbps
• 4 = 400 Mbps
The data transfer rate is the second field in a packet row.
• Transaction codes (Tcode) — The name of the packet’s transaction type is displayed in the top portion of the third field in a packet row.
• Time Stamps — Packets are time stamped to an accuracy of 20 nanoseconds. Time stamps are formatted as Seconds.CycleCount CycleOffset, in units of 125 microseconds. Seconds increments once per second. CycleCount increments once every bus cycle. CycleOffset increments once every clock cycle. You can find the elapsed time between two packets by calculating the difference between their Time Stamp values. The Time Stamp field occurs last in the packet row.
Note: Due to hardware limitations, short bus packets with length equal to two quadlets — such as PHY packets and GASP or isochronous packets without a data payload — don't have seconds in the time stamp.
Figure 5-8: Register status tooltip
Figure 5-7: Bus reset and register status markers
51
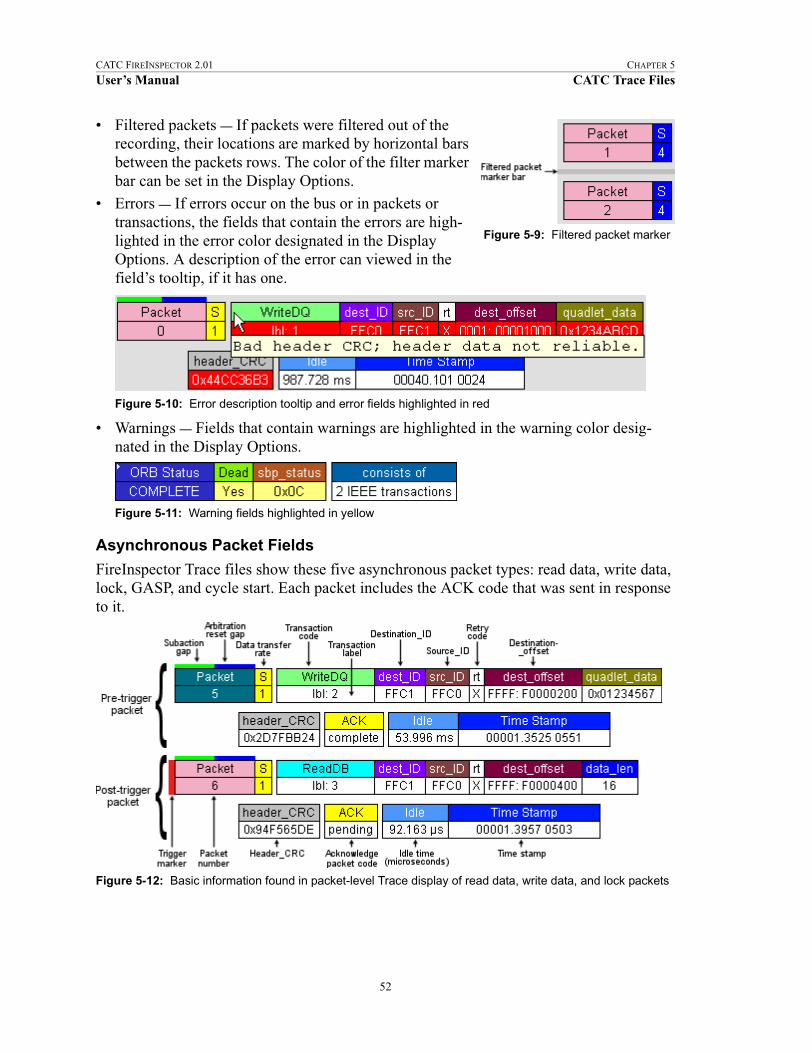
CATC FIREINSPECTOR 2.01 CHAPTER 5
User’s Manual CATC Trace Files
• Filtered packets — If packets were filtered out of the recording, their locations are marked by horizontal bars between the packets rows. The color of the filter marker bar can be set in the Display Options.
• Errors — If errors occur on the bus or in packets or transactions, the fields that contain the errors are high-lighted in the error color designated in the Display Options. A description of the error can viewed in the field’s tooltip, if it has one.
• Warnings — Fields that contain warnings are highlighted in the warning color desig-nated in the Display Options.
Asynchronous Packet Fields
FireInspector Trace files show these five asynchronous packet types: read data, write data, lock, GASP, and cycle start. Each packet includes the ACK code that was sent in response to it.
Figure 5-10: Error description tooltip and error fields highlighted in red
Figure 5-11: Warning fields highlighted in yellow
Figure 5-12: Basic information found in packet-level Trace display of read data, write data, and lock packets
Figure 5-9: Filtered packet marker
52

CATC FIREINSPECTOR 2.01 CHAPTER 5
User’s Manual CATC Trace Files
Read Data, Write Data, and Lock Packets
In addition to the general packet display elements listed on page 50, the following information may be found in the display for read, write, and lock packets:
• Transaction labels (lbl) — This value is taken from the packet’s tl field. The label is dis-played in the bottom half of the field that contains the transaction code.
• Destination_IDs (dest_ID) — The value of the packet’s destination_ID field.• Source_IDs (src_ID) — The value of the packet’s source_ID field.
• Retry Codes (rt) — The value of the packet’s rt field.
• Response code (rcode) — The packet’s rcode field value.• Destination_offsets (dest_offset) — The value of the packet’s destination_offset field.
Not present in response packets.
• Data length (data_len) — The value of the packet’s data_length field.
• Extended Tcodes (ext_tcode) — The value of the packet’s extended_tcode field.
• Quadlet data (quadlet_data) — The value of the packet’s quadlet_data field.
• Header CRCs (header_CRC) — The value of the packet’s header_CRC field.
• Data (Data) — The Data field can be expanded and collapsed. By default, it is collapsed, and the value shown is the number of quadlets contained in the packet’s data block field. When expanded, the actual quadlet data from the data block field is shown.
• Acknowledge packet (ACK) codes — The value of the ACK code that was sent in response to the packet.
• User Data — The value in this field represents the state of the breakout board signals. Present only when the option “Save External Interface Signals” is selected on the Gen-eral tab of the Recording Options dialog.
• Argument value (arg_value) — The value of the packet’s arg_value field.
• Data value (data_value) — The value of the packet’s data_value field.
• Data CRC (data_CRC) — The value of the packet’s data_CRC field.
• Old value (old_value) — The value of the packet’s old_value field.• Idle times (Idle) — The Idle field displays the time between the end of the packet and the
beginning of the next packet.
Figure 5-12 points out the all of the information that can generally be viewed in read data, write data, and lock packets. It also contains all of the general packet display elements.
Table 5-1 summarizes which fields can be found in the display for specific read, write, and lock packets.
Table 5-1: Trace fields found in read data, write data, and lock packets
Write request for
data quadlet
Write request for data block
Write response
Read request for
data quadlet
Read request for data block
Read response for data quadlet
Read response for data block
Lock request
Lock response
ext_tcode X X
lbl X X X X X X X X X
53

CATC FIREINSPECTOR 2.01 CHAPTER 5
User’s Manual CATC Trace Files
Global Asynchronous Stream Packets (GASPs)
Packet rows for GASPs contain these fields in addition to the general packet display elements listed on page 50:
• Channel Number (ch) — The value of the packet’s channel field. The channel number is displayed in the bottom half of the field that contains the transaction code.
• Synchronization code (sy) — The value of the packet’s sy field.
• Data Length (data_len) — The value of the packet’s data_length field.
• Header CRC (header_CRC) — The value of the packet’s header_CRC field.
• Data Block Payload (Data) — The Data field can be expanded and collapsed. By default, it is collapsed, and the value shown is the number of quadlets contained in the packet’s data block field. When expanded, the actual quadlet data from the data block field is shown.
• Source Identifier (source_ID) — The value of the packet’s source_ID field.• Specifier Identifier (specifier_ID) — The value is a concatenation of the packet’s
specifier_ID_hi and specifier_ID_lo field values.
• Version (version) — The value of the packet’s version field.• Data Block CRC (data_CRC) — The value of the packet’s data_CRC field.
• Idle times (Idle) — The Idle field displays the time between the end of the packet and the beginning of the next packet.
dest_ID X X X X X X X X X
src_ID X X X X X X X X X
rt X X X X X X X X X
dest_offset X X X X X
header_CRC X X X X X X X X X
ACK X X X X X X X X X
Idle X X X X X X X X X
quadlet_data X X
data_len X X X X X
Data X X
data_CRC X X X X
rcode X X X X
User Data X X X X X X X X X
arg_value X
data_value X
old_value X
Table 5-1: Trace fields found in read data, write data, and lock packets (Continued)
Write request for
data quadlet
Write request for data block
Write response
Read request for
data quadlet
Read request for data block
Read response for data quadlet
Read response for data block
Lock request
Lock response
54

CATC FIREINSPECTOR 2.01 CHAPTER 5
User’s Manual CATC Trace Files
Cycle Start (CycleSt) Packets
Packet rows for cycle start packets contain these fields in addition to the general packet display elements listed on page 50:
• Transaction labels (lbl) — This value is taken from the packet’s tl field. The label is dis-played in the bottom half of the field that contains the transaction code.
• Destination_IDs (dest_ID) — The value of the packet’s destination_ID field.• Source_IDs (src_ID) — The value of the packet’s source_ID field.
• Destination_offsets (dest_offset) — The value of the packet’s destination_offset field. Not present in response packets.
• Quadlet data (quadlet_data) — The value of the packet’s quadlet_data field.
• Header CRCs (header_CRC) — The value of the packet’s header_CRC field.
• User Data — The value in this field represents the state of the breakout board signals. Present only when the option “Save External Interface Signals” is selected on the Gen-eral tab of the Recording Options dialog.
• Idle times (Idle) — The Idle field displays the time between the end of the packet and the beginning of the next packet.
Hide or Show Cycle Start Packets
Cycle Start packets can easily be hidden or shown by pressing the Hide Cycle Starts button on the Frequently Used toolbar.
Isochronous Data Block (IsoDB) Packets
Packet rows for isochronous data blocks contain these fields in addition to the general packet display elements listed on page 50:
• Channel Number (ch) — The value of the packet’s channel field. The channel number is displayed in the bottom half of the field that contains the transaction code.
• Synchronization code (sy) — The value of the packet’s sy field.
• Data Length (data_len) — The value of the packet’s data_length field.
• Header CRC (header_CRC) — The value of the packet’s header_CRC field.• Data Block Payload (Data) — The Data field can be expanded and collapsed. By default,
it is collapsed, and the value shown is the number of quadlets contained in the packet’s data block field. When expanded, the actual quadlet data from the data block field is shown.
• Data Block CRC (data_CRC) — The value of the packet’s data_CRC field.
• User Data — The value in this field represents the state of the breakout board signals. Present only when the option “Save External Interface Signals” is selected on the Gen-eral tab of the Recording Options dialog.
• Idle times (Idle) — The Idle field displays the time between the end of the packet and the beginning of the next packet.
55

CATC FIREINSPECTOR 2.01 CHAPTER 5
User’s Manual CATC Trace Files
Hide or Show Isochronous Data Block Packets
Isochronous Data Block packets can easily be hidden or shown by pressing the Hide Iso DBs button on the Frequently Used toolbar.
PHY Packets
FireInspector displays all four types of PHY packets: self-ID, link-on, configuration, and extended.
PHY Self-ID Packets
PHY Self-ID packet rows for self-ID packet zero contain these fields in addition to the general packet display elements listed on page 50:
• Physical ID (phy_ID) — The value of the packet’s phy_ID field. The physical ID is dis-played in the bottom half of the field that contains the transaction code.
• PHY packet number (#) — The value of the packet number field.
• Gap count (gap_cnt) — The value of the packet’s gap_cnt field.
• PHY speed (S) — The value of the packet’s sp field.
• Contender (c) — The value of the packet’s c field.
• Power class (pwr) — The value of the packet’s pwr field.
• Port numbers (p0...p2) — The devices’ port numbers.
• Port status (Prnt, Child, -, n/a) — The values of the packet’s port number fields. The port status is displayed in the bottom half of the port number field.
• Prnt = Connected to parent node
• Child = Connected to child node
• - = Port not present
• n/a = Not active; no connection to other node.
• Initiated reset (i) — The value of the packet’s i field.
• More packets (m) — The value of the packet’s m field.
PHY Self-ID packet rows for self-ID packets one, two and three contain these fields in addition to the general packet display elements listed on page 50:
• Physical ID (phy_ID) — The value of the packet’s phy_ID field. The physical ID is dis-played in the bottom half of the field that contains the transaction code.
• PHY packet number (#) — The value of the packet number field.
• Port numbers (p3...p26) — The values of the packet’s port number fields.
PHY Link-On Packets
PHY link-on packet rows contain this field in addition to the general packet display elements listed on page 50:
56

CATC FIREINSPECTOR 2.01 CHAPTER 5
User’s Manual CATC Trace Files
• Physical ID (phy_ID) — The value of the packet’s phy_ID field. The physical ID is dis-played in the bottom half of the field that contains the packet type.
PHY Configuration Packets
PHY configuration packet rows contain these fields in addition to the general packet display elements listed on page 50.
• Root ID (phy_ID) — The value of the packet’s root_ID field. The root ID is displayed in the bottom half of the field that contains the transaction code. This value is displayed only if the “R” bit is set.
• “R” bit (R) — The value of the packet’s R field. This field is displayed only if the “R” bit is set.
• “T” bit (T) — The value of the packet’s T field. This field is displayed only if the “T” bit is set.
• Gap count (gap_cnt) — The value of the packet’s gap_count field. This field is displayed only if the “T” bit is set.
Extended PHY Packets
Extended PHY packet rows contain these fields in addition to the general packet display elements listed on page 50.
• Physical ID (phy_ID) — The value of the packet’s phy_ID field. The physical ID is dis-played in the bottom half of the field that contains the transaction code.
• Extended packet type (Type) — The value of the packet’s type field.
The rest of the fields in extended PHY packet rows vary depending on the packet type.
Ping Packet Fields (Type = Ping)
Ping packet rows contain no additional fields.
Remote Access Packet Fields (Type = Access base or Access paged)
• Selected page (Page) — The value of the packet’s page field.
• Selected port (Port) — The value of the packet’s port field.• Selected register (Reg) — The value of the packet’s reg field.
Remote Reply Packet Fields (Type = Reply base or Reply paged)
• Selected page (Page) — The value of the packet’s page field.
• Selected port (Port) — The value of the packet’s port field.• Selected register (Reg) — The value of the packet’s reg field.
• Read data (Data) — The value of the packet’s data field.
Remote Command Packet (Type = Command)
• Selected port (Port) — The value of the packet’s port field.
57

CATC FIREINSPECTOR 2.01 CHAPTER 5
User’s Manual CATC Trace Files
• Issued command (Command) — The value of the packet’s command field.
Remote Confirmation Packet (Type = Confirm)
• Selected port (Port) — The value of the packet’s port field.
• Fault, Connected, Bias, Disabled, OK (f, c, b, d, ok) — The values from the packet’s f, c, b, d, and ok fields.
• Confirmed command (Command) — The value of the packet’s command field.
Resume Packet (Type = Resume)
Resume packet rows contain no additional fields.
5.2.2 Transaction-Level Decoding
Transaction-level decoding presents a higher-level analysis of 1394 data. There are several ways to activate transaction-level decoding in FireInspector:
• Click on the button for the desired decoding level on the View Level toolbar.
• Use the General tab of the Display Options dialog to set the Trace Viewing Level.
• Select the desired transaction decoding level from the View menu.
• Use the Trace View menu (described on page 79) to set the view level.
Selecting a transaction decoding level causes FireInspector to look for the selected type of transaction in the Trace. If any are found, they are decoded and displayed.
Transactions are made of one or more packets. FireInspector displays transactions in order of initiation, meaning that the transaction that begins first in a recording is shown nearest the top of the Trace. The transaction that begins second is next, then the one that begins third, and so on. The order is determined by the position of the transaction's starting packet; the position of the transaction's last packet is irrelevant to the order. Therefore, the packets, or subactions, that make up a transaction will not necessarily be numbered consecutively.
Transaction Number Field
The first field for all transaction-level rows in a Trace is the transaction number field. It contains the transaction protocol name and the transaction number.
Expanding and Collapsing Transaction Rows
Transaction rows can be expanded and collapsed in order to show or hide lower transaction levels and packets. Rows are initially collapsed by default. There are several ways to expand and collapse the rows:
• Left-click the arrow in the upper left-hand corner of the transaction number field for the row you want to expand or collapse. You can expand or collapse all transactions of the same protocol by left-clicking on the arrow and long-clicking — holding down the mouse button for about 1 second.
58
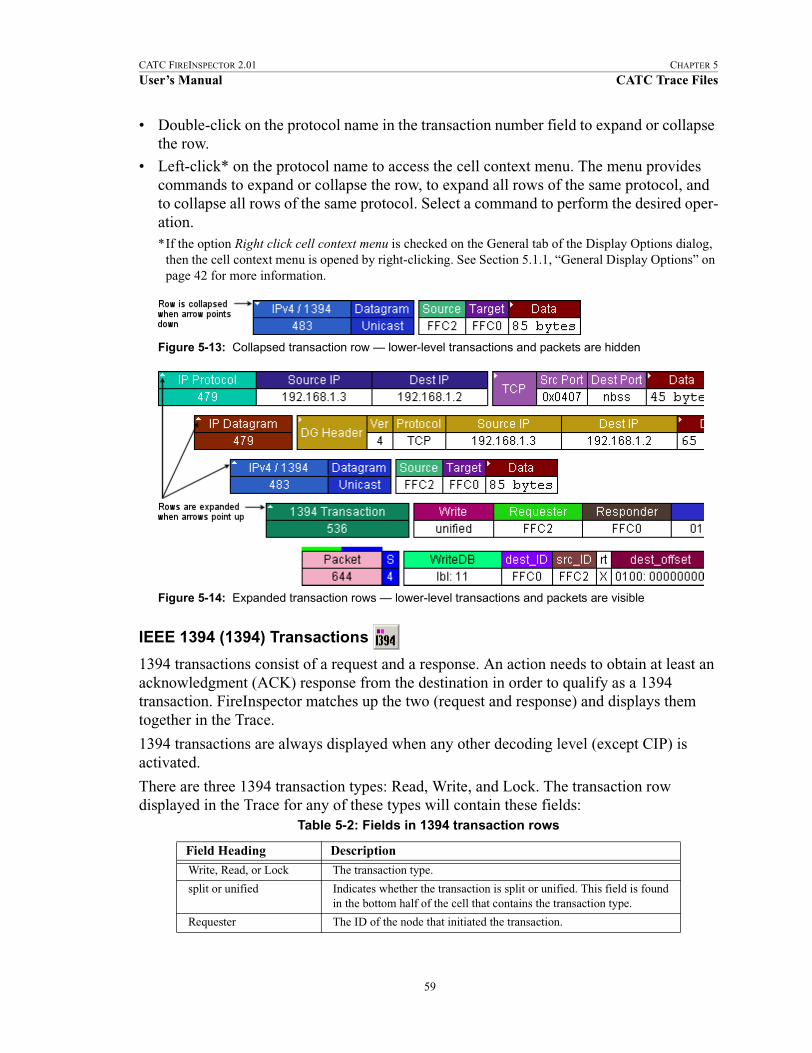
CATC FIREINSPECTOR 2.01 CHAPTER 5
User’s Manual CATC Trace Files
• Double-click on the protocol name in the transaction number field to expand or collapse the row.
• Left-click* on the protocol name to access the cell context menu. The menu provides commands to expand or collapse the row, to expand all rows of the same protocol, and to collapse all rows of the same protocol. Select a command to perform the desired oper-ation.*If the option Right click cell context menu is checked on the General tab of the Display Options dialog,
then the cell context menu is opened by right-clicking. See Section 5.1.1, “General Display Options” on page 42 for more information.
IEEE 1394 (1394) Transactions
1394 transactions consist of a request and a response. An action needs to obtain at least an acknowledgment (ACK) response from the destination in order to qualify as a 1394 transaction. FireInspector matches up the two (request and response) and displays them together in the Trace.
1394 transactions are always displayed when any other decoding level (except CIP) is activated.
There are three 1394 transaction types: Read, Write, and Lock. The transaction row displayed in the Trace for any of these types will contain these fields:
Figure 5-13: Collapsed transaction row — lower-level transactions and packets are hidden
Figure 5-14: Expanded transaction rows — lower-level transactions and packets are visible
Table 5-2: Fields in 1394 transaction rows
Field Heading Description
Write, Read, or Lock The transaction type.
split or unified Indicates whether the transaction is split or unified. This field is found in the bottom half of the cell that contains the transaction type.
Requester The ID of the node that initiated the transaction.
59
CATC FIREINSPECTOR 2.01 CHAPTER 5
User’s Manual CATC Trace Files
View Type Fields in 1394 Transaction Rows
There are no View Type Fields in 1394 transaction rows.
Serial Bus Protocol (SBP) Transactions
There are two types of SBP transactions: management agent transactions and command block (fetch) agent transactions.
Management agent transactions consist of a management agent initiating the transfer of a management operation request block (ORB), a response to the ORB, and finally Status. Management agent transaction rows may contain any or all of the fields in Table 5-3.
Command block agent transactions are made of an initiator writing to one of the agent's registers, and the agent's resulting activity. Command block agent transaction rows may contain the fields listed in Table 5-4.
Responder The ID of the target node.
address The destination offset of the responder.
data_len The amount of data, in bytes, returned to the responder.
response The terminal response for the transaction.
# of packets The number of packets that make up the transaction.
Time Stamp The Time Stamp value of the first packet in the transaction.
Table 5-3: Fields in SBP management agent transaction rows
Field Heading Description
Initiator The ID of the node that initiated the transaction.
Target The ID of the target node.
LUN The logical unit number (LUN) to which the transaction applies.
Management The value of the function field of the management ORB.
Response The ORB to which the response is returned.
Login ID The value of the login_ID field.
ORB Status The value of the resp field of the ORB status block. This field is expandable and collapsible.
Dead The value of the d (dead) field of the ORB status block.
sbp_status The value of the sbp_status field of the ORB status block.
consists of The number of IEEE 1394 transactions that make up the SBP transaction.
Table 5-4: Fields in SBP command block (fetch) agent transaction rows
Field Heading Description
Initiator The value is the ID of the node that initiated the transaction.
Target The value is the ID of the target node.
LUN The value is the logical unit number (LUN) that the transaction applies to.
Table 5-2: Fields in 1394 transaction rows (Continued)
Field Heading Description
60
CATC FIREINSPECTOR 2.01 CHAPTER 5
User’s Manual CATC Trace Files
View Type Fields in SBP Transaction Rows
Several of the fields in SBP transaction rows contain a View Fields command that allows you to see the contents of the data structures.
Left-click* on the field header to access the cell context menu, which contains the View Fields commands. Selecting the command opens a View Fields dialog, which contains the data laid out according to the SBP-3 specification. In some cases, fields (data_descriptor and login_response, for example) are further broken down as defined by the standard.
*If the option Right click cell context menu is checked on the General tab of the Display Options dialog, then the cell context menu is opened by right-clicking. See Section 5.1.1, “General Display Options” on page 42 for more information.
For more information about the View Fields dialog, please see “View Fields Dialog” on page 75.
Initiation The value is the method that was used to initiate the ORB transfer.
Agent Reset Indicates that the initiator wrote to the AGENT_RESET register.
Unsol. Status Indicates that the initiator wrote to the UNSOLICITED_STATUS_ENABLE register.
Agent State Indicates that the initiator wrote to the AGENT_STATE register.
ORB The value of the rq_fmt field of the ORB.
This field is expandable and collapsible.
spd The value of the spd field of the ORB.
max_payload The value of the max_payload field of the ORB.
page_size The value of the page_size field of the ORB.
Data The Data field can be expanded and collapsed. By default, it is collapsed, and the value shown is the amount of data contained in the command_block field of the ORB. When expanded, the actual data from the field is shown.
SCSI Command The value of the first byte of the command_block of the ORB, interpreted as a SCSI operation code.
page table Value is the number of elements in the page table.
data buffer The value of the data_size field of the ORB.
d The direction of data transfer, taken from the d field of the ORB.
T = Target; I = InitiatorT>>I = Target uses WRITE transactions to transmit data.I>>T = Target uses READ transactions to transmit data.
transferred The value is the actual number of bytes transferred.
ORB Status The value of the resp field of the ORB status block.
This field is expandable and collapsible.
Dead The value of the d (dead) field of the ORB status block.
sbp_status The value of the sbp_status field of the ORB status block.
consists of The number of IEEE 1394 transactions that make up the SBP transaction.
Table 5-4: Fields in SBP command block (fetch) agent transaction rows (Continued)
Field Heading Description
61
CATC FIREINSPECTOR 2.01 CHAPTER 5
User’s Manual CATC Trace Files
These are the fields that contain View Fields options:
• Management: contains the fields of the Management ORB.• Response: contains the fields of the Management ORB Response.
• ORB: contains the fields of a non-management ORB.
• Status: contains the fields of the Status Block.• Initiation: contains the fields of the Fast-Start (SBP-3) datablock. Only available for
Fast-Start transactions.
• Page Table: contains the fields of the page table.
Decode SBP Transactions Dialog
Decoding SBP transactions requires information that's not necessarily included in the Trace files. SBP2 is very dependent upon the management agent and command block addresses. These addresses are needed in order to identify the SBP transactions. The address is in the device’s Configuration ROM and is chosen by the device manufacturer. Therefore, the FireInspector application can't always find the address. The Decode SBP Transactions dialog (Figure 5-15) is used to supply the missing information so that the transactions can be decoded and displayed in FireInspector. When decoding SBP, FireInspector first tries to find Configuration ROM data in the Trace. If there is none, it then checks to see if it can use the set of SBP decoding parameters that was last used. If not, it then loads and uses the file default.sbp, which is the default SBP settings file.
To set up decoding parameters for SBP transactions:
Step 1 Select Setup > Decoding Parameters > SBP Decoding Parameters from the menu bar.
Step 2 The Decode SBP Transactions dialog will open. If FireInspector found any Configuration ROM data in the Trace, the dialog will be seeded with that data.
Step 3 To add Management Agent Offsets: Enter the Base Address of the management agent register and click Add. Repeat the procedure until you have entered all of the base addresses that you need. The address(es) will be displayed in the scroll box.To add Command Block (Fetch) Agents: Enter any, all, or some of the following information: the base address of the fetch agent register; the LUN (Logical Unit Number) of the logical unit implemented by the target; the Fast Start Offset (for SBP3 only). Click Add. Repeat the procedure until you have entered all of the information that is needed. The information will be displayed in the scroll box. Note: Fast Start Offsets should be given in quadlets from the base address.
All parameters should be entered in hexadecimal.
Step 4 Click OK to apply the settings.
62

CATC FIREINSPECTOR 2.01 CHAPTER 5
User’s Manual CATC Trace Files
Note: This set of parameters is now associated with the Trace file, so, unless they are reconfigured, these settings will always be used for SBP decoding of the file.
Other options in the Decode SBP Transactions dialog:
• Reset to Default — loads the default SBP settings (.sbp) file.
• Load... — brings up an Open dialog so that you can browse for an SBP settings file to use.
• Save as Default — saves the current settings as default.sbp. The default settings are auto-matically loaded if no other settings can be located for the current file.
• Save As... — brings up a Save As dialog so that you can save the settings as an SBP set-tings file with a unique name.
• Cancel — closes the dialog without applying or saving changes.
Function Control Protocol (FCP) Transactions
Function Control Protocol is used to transport various device commands over 1394. These commands are encapsulated in FCP frames.
The only FCP command/transaction sets (CTSs) that FireInspector will fully decode are Audio/Video Control (AV/C) and Home Audio Video interoperability (HAVi) transactions. If FireInspector's FCP decoder doesn't recognize the command/transaction set as being AV/C or HAVi, then it will display only generic cells such as Controller, Target, and FrameType.
Figure 5-15: Decode SBP Transactions dialog
63

CATC FIREINSPECTOR 2.01 CHAPTER 5
User’s Manual CATC Trace Files
Note: HAVi protocol recording and decoding is an optional licensed feature that must be purchased from CATC.
Audio/Video Control (AV/C) Transactions
Some AV/C transaction row fields are listed in the following table.
View Type Fields in AV/C Transaction Rows
Several of the fields in AV/C transaction rows contain a View Fields command that allows you to see the contents of the data structures.
Left-click* on the field header to access the cell context menu, which contains the View Fields commands. Selecting the command opens a View Fields dialog, which contains the data laid out according to the AV/C specification.
*If the option Right click cell context menu is checked on the General tab of the Display Options dialog, then the cell context menu is opened by right-clicking. See Section 5.1.1, “General Display Options” on page 42 for more information.
For more information about the View Fields dialog, please see “View Fields Dialog” on page 75.
These are the fields that contain View Fields options:
• Command: contains the fields of the AV/C command frame.
• Response: contains the fields of the AV/C response frame.
Table 5-5: Fields in AV/C transaction rows*
Field Heading Description
CTS The value of the CTS field (0 = AV/C) of the AV/C frame.
Controller The value of the source_id field in the first packet of the transaction.
Target The value of the destination_id field in the first packet of the transaction.
su_type The value of the subunit_type (su_type) field of the AV/C frame.
su_id The value of the subunit_ID (su_id) field of the AV/C frame.
Command The value of the ctype field of the AV/C frame.
Opcode The value of the opcode field of the AV/C frame. When the response frame opcode matches the command frame opcode, then only the command opcode is displayed in the Trace.
Response The value of the response field of the AV/C frame.
Consists of The number of IEEE 1394 transactions that make up the AV/C transaction.
*Not all possible fields are listed. The remaining AV/C fields are determined by the opcode and may vary widely.
64
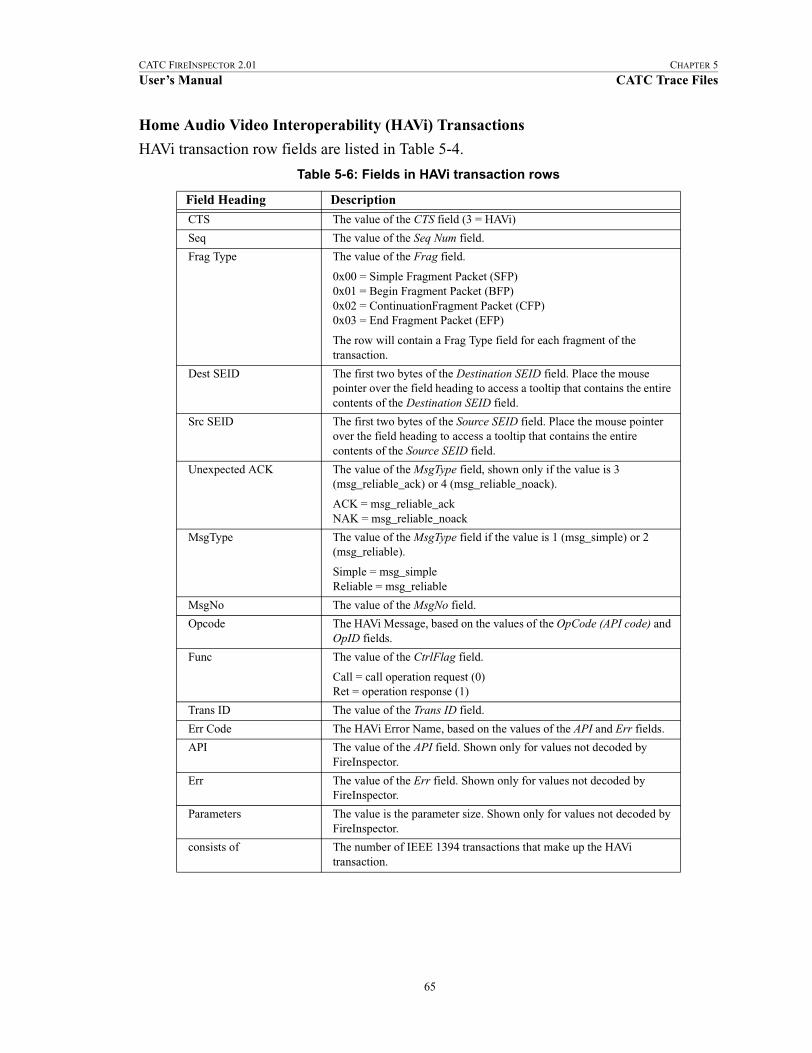
CATC FIREINSPECTOR 2.01 CHAPTER 5
User’s Manual CATC Trace Files
Home Audio Video Interoperability (HAVi) Transactions
HAVi transaction row fields are listed in Table 5-4.
Table 5-6: Fields in HAVi transaction rows
Field Heading Description
CTS The value of the CTS field (3 = HAVi)
Seq The value of the Seq Num field.
Frag Type The value of the Frag field.
0x00 = Simple Fragment Packet (SFP)0x01 = Begin Fragment Packet (BFP)0x02 = ContinuationFragment Packet (CFP)0x03 = End Fragment Packet (EFP)
The row will contain a Frag Type field for each fragment of the transaction.
Dest SEID The first two bytes of the Destination SEID field. Place the mouse pointer over the field heading to access a tooltip that contains the entire contents of the Destination SEID field.
Src SEID The first two bytes of the Source SEID field. Place the mouse pointer over the field heading to access a tooltip that contains the entire contents of the Source SEID field.
Unexpected ACK The value of the MsgType field, shown only if the value is 3 (msg_reliable_ack) or 4 (msg_reliable_noack).
ACK = msg_reliable_ackNAK = msg_reliable_noack
MsgType The value of the MsgType field if the value is 1 (msg_simple) or 2 (msg_reliable).
Simple = msg_simpleReliable = msg_reliable
MsgNo The value of the MsgNo field.
Opcode The HAVi Message, based on the values of the OpCode (API code) and OpID fields.
Func The value of the CtrlFlag field.
Call = call operation request (0)Ret = operation response (1)
Trans ID The value of the Trans ID field.
Err Code The HAVi Error Name, based on the values of the API and Err fields.
API The value of the API field. Shown only for values not decoded by FireInspector.
Err The value of the Err field. Shown only for values not decoded by FireInspector.
Parameters The value is the parameter size. Shown only for values not decoded by FireInspector.
consists of The number of IEEE 1394 transactions that make up the HAVi transaction.
65
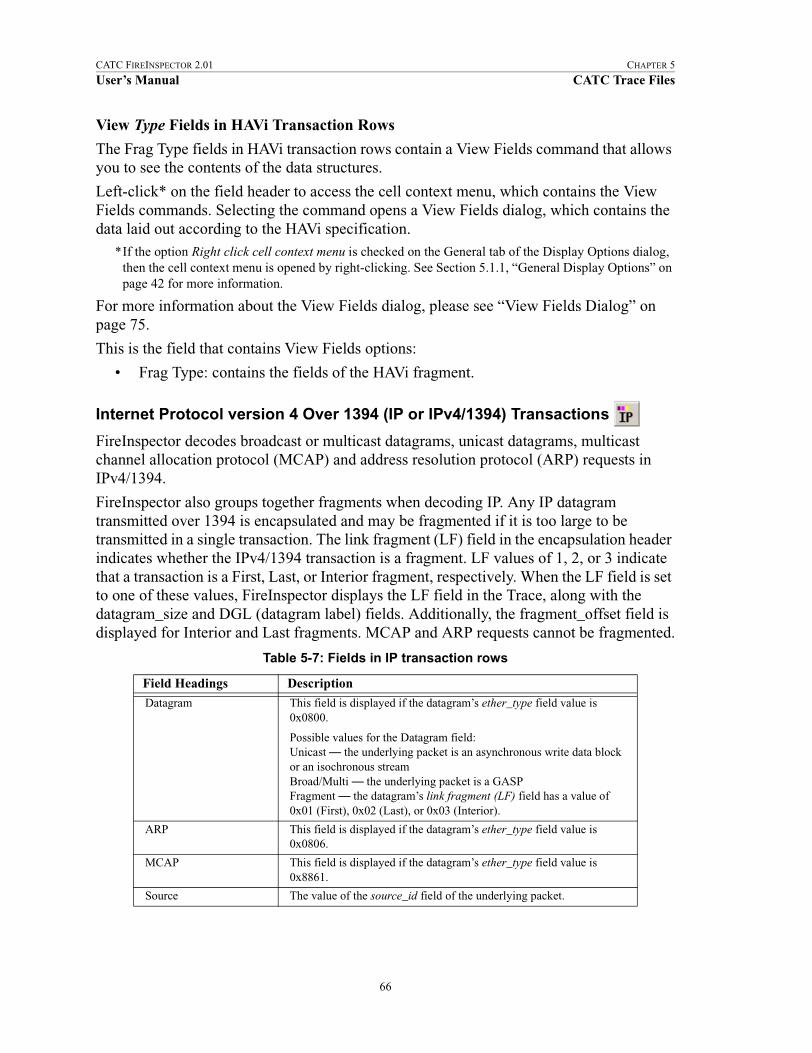
CATC FIREINSPECTOR 2.01 CHAPTER 5
User’s Manual CATC Trace Files
View Type Fields in HAVi Transaction Rows
The Frag Type fields in HAVi transaction rows contain a View Fields command that allows you to see the contents of the data structures.
Left-click* on the field header to access the cell context menu, which contains the View Fields commands. Selecting the command opens a View Fields dialog, which contains the data laid out according to the HAVi specification.
*If the option Right click cell context menu is checked on the General tab of the Display Options dialog, then the cell context menu is opened by right-clicking. See Section 5.1.1, “General Display Options” on page 42 for more information.
For more information about the View Fields dialog, please see “View Fields Dialog” on page 75.
This is the field that contains View Fields options:
• Frag Type: contains the fields of the HAVi fragment.
Internet Protocol version 4 Over 1394 (IP or IPv4/1394) Transactions
FireInspector decodes broadcast or multicast datagrams, unicast datagrams, multicast channel allocation protocol (MCAP) and address resolution protocol (ARP) requests in IPv4/1394.
FireInspector also groups together fragments when decoding IP. Any IP datagram transmitted over 1394 is encapsulated and may be fragmented if it is too large to be transmitted in a single transaction. The link fragment (LF) field in the encapsulation header indicates whether the IPv4/1394 transaction is a fragment. LF values of 1, 2, or 3 indicate that a transaction is a First, Last, or Interior fragment, respectively. When the LF field is set to one of these values, FireInspector displays the LF field in the Trace, along with the datagram_size and DGL (datagram label) fields. Additionally, the fragment_offset field is displayed for Interior and Last fragments. MCAP and ARP requests cannot be fragmented.
Table 5-7: Fields in IP transaction rows
Field Headings Description
Datagram This field is displayed if the datagram’s ether_type field value is 0x0800.
Possible values for the Datagram field:Unicast — the underlying packet is an asynchronous write data block or an isochronous streamBroad/Multi — the underlying packet is a GASPFragment — the datagram’s link fragment (LF) field has a value of 0x01 (First), 0x02 (Last), or 0x03 (Interior).
ARP This field is displayed if the datagram’s ether_type field value is 0x0806.
MCAP This field is displayed if the datagram’s ether_type field value is 0x8861.
Source The value of the source_id field of the underlying packet.
66

CATC FIREINSPECTOR 2.01 CHAPTER 5
User’s Manual CATC Trace Files
View Type Fields in IPv4/1394 Transaction Rows
Some fields in IPv4/1394 transaction rows contain a View Fields command that allows you to see the contents of the data structures.
Left-click* on the field header to access the cell context menu, which contains the View Fields commands. Selecting the command opens a View Fields dialog, which contains the data laid out according to the IPv4/1394 specification.
*If the option Right click cell context menu is checked on the General tab of the Display Options dialog, then the cell context menu is opened by right-clicking. See Section 5.1.1, “General Display Options” on page 42 for more information.
For more information about the View Fields dialog, please see “View Fields Dialog” on page 75.
These are the fields that contain View Fields options:
Target If the underlying packet is a Write with a dest_id value other than 0xFFFF, then this field contains the value of the packet’s dest_id field.
If the underlying packet is a Write with a dest_id value of 0xFFFF or a GASP, then the value of this field is Broadcast.
Data The Data field can be expanded and collapsed. By default, it is collapsed, and the value shown is the amount of data contained in the datagram. When expanded, the actual data from the field is shown.
LF The link fragment type from the lf field of the datagram. Shown only for fragmented datagrams.
datagram size The value of the datagram_size field of the datagram. The value is the size of the entire datagram — the sum of all the fragments. Shown only for fragmented datagrams.
fragment offset The value of the datagram’s fragment_offset field. Shown only for interior and last fragments.
DGL The value of the datagram’s dgl (datagram label) field. Shown only for fragmented datagrams.
Sender IP Address The value of the sender_ip_address field. Shown only for ARP.
Target IP Address The value of the target_ip_address field. Shown only for ARP.
opcode The value of the datagram’s opcode field. Shown only for ARP.
sspd The value of the datagram’s sspd field. Shown only for ARP.
sender_max_rec The value of the datagram’s sender_max_rec field. Shown only for ARP.
sender_unicast_FIFO The value of the datagram’s sender_unicast_FIFO field. Shown only for ARP.
sender_unique_ID The value of the datagram’s sender_unique_ID. Shown only for ARP.
total length The value of the datagram’s length field. Shown only for MCAP.
MCAP opcode The value of the datagram’s opcode field. Shown only for MCAP.
0 = Advertise1 = Solicit
Table 5-7: Fields in IP transaction rows (Continued)
Field Headings Description
67
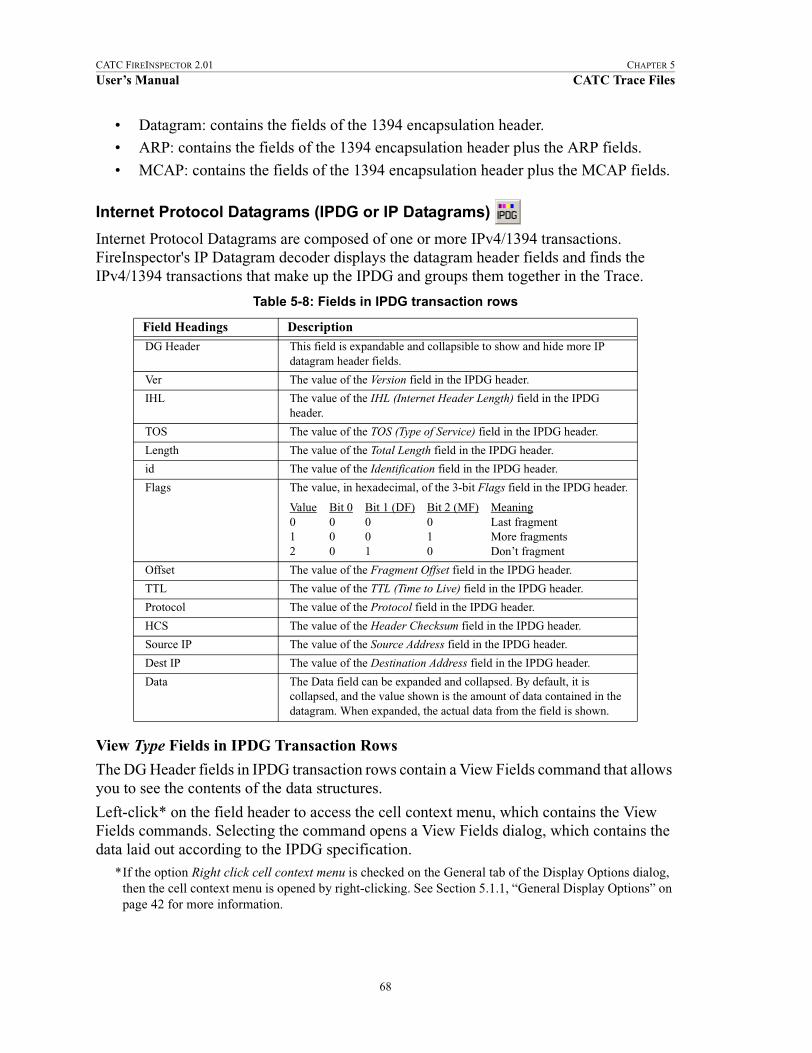
CATC FIREINSPECTOR 2.01 CHAPTER 5
User’s Manual CATC Trace Files
• Datagram: contains the fields of the 1394 encapsulation header.• ARP: contains the fields of the 1394 encapsulation header plus the ARP fields.
• MCAP: contains the fields of the 1394 encapsulation header plus the MCAP fields.
Internet Protocol Datagrams (IPDG or IP Datagrams)
Internet Protocol Datagrams are composed of one or more IPv4/1394 transactions. FireInspector's IP Datagram decoder displays the datagram header fields and finds the IPv4/1394 transactions that make up the IPDG and groups them together in the Trace.
View Type Fields in IPDG Transaction Rows
The DG Header fields in IPDG transaction rows contain a View Fields command that allows you to see the contents of the data structures.
Left-click* on the field header to access the cell context menu, which contains the View Fields commands. Selecting the command opens a View Fields dialog, which contains the data laid out according to the IPDG specification.
*If the option Right click cell context menu is checked on the General tab of the Display Options dialog, then the cell context menu is opened by right-clicking. See Section 5.1.1, “General Display Options” on page 42 for more information.
Table 5-8: Fields in IPDG transaction rows
Field Headings Description
DG Header This field is expandable and collapsible to show and hide more IP datagram header fields.
Ver The value of the Version field in the IPDG header.
IHL The value of the IHL (Internet Header Length) field in the IPDG header.
TOS The value of the TOS (Type of Service) field in the IPDG header.
Length The value of the Total Length field in the IPDG header.
id The value of the Identification field in the IPDG header.
Flags The value, in hexadecimal, of the 3-bit Flags field in the IPDG header.
Value Bit 0 Bit 1 (DF) Bit 2 (MF) Meaning0 0 0 0 Last fragment1 0 0 1 More fragments2 0 1 0 Don’t fragment
Offset The value of the Fragment Offset field in the IPDG header.
TTL The value of the TTL (Time to Live) field in the IPDG header.
Protocol The value of the Protocol field in the IPDG header.
HCS The value of the Header Checksum field in the IPDG header.
Source IP The value of the Source Address field in the IPDG header.
Dest IP The value of the Destination Address field in the IPDG header.
Data The Data field can be expanded and collapsed. By default, it is collapsed, and the value shown is the amount of data contained in the datagram. When expanded, the actual data from the field is shown.
68
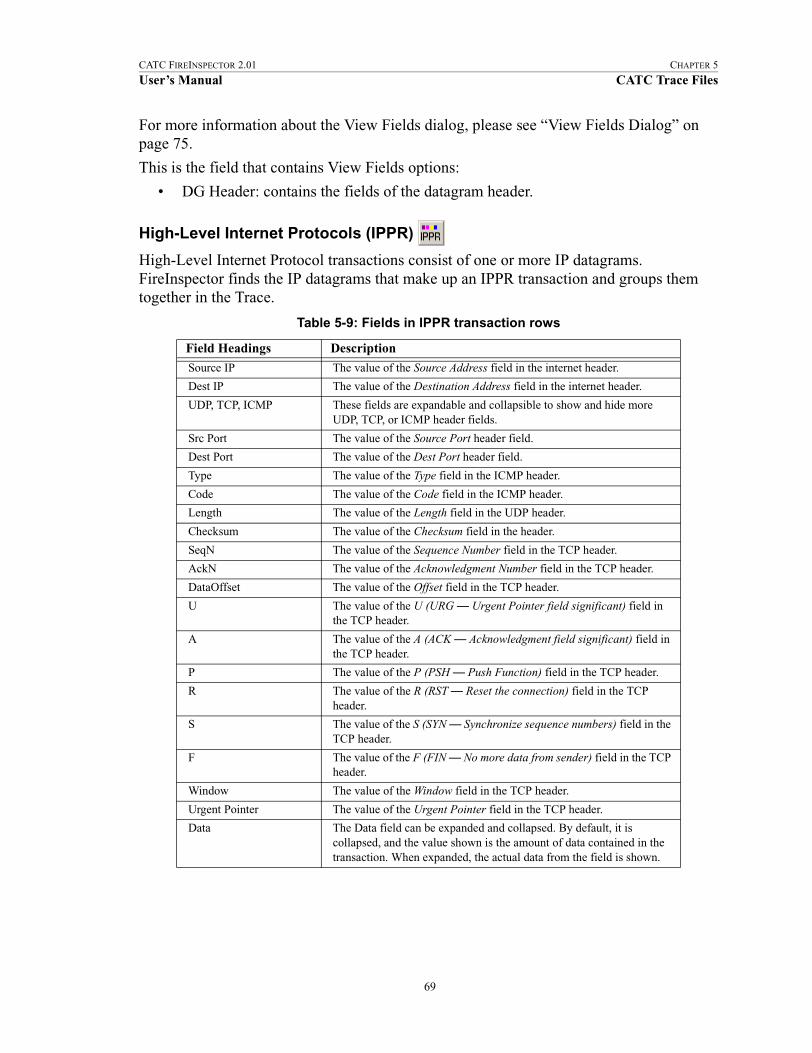
CATC FIREINSPECTOR 2.01 CHAPTER 5
User’s Manual CATC Trace Files
For more information about the View Fields dialog, please see “View Fields Dialog” on page 75.
This is the field that contains View Fields options:
• DG Header: contains the fields of the datagram header.
High-Level Internet Protocols (IPPR)
High-Level Internet Protocol transactions consist of one or more IP datagrams. FireInspector finds the IP datagrams that make up an IPPR transaction and groups them together in the Trace.
Table 5-9: Fields in IPPR transaction rows
Field Headings Description
Source IP The value of the Source Address field in the internet header.
Dest IP The value of the Destination Address field in the internet header.
UDP, TCP, ICMP These fields are expandable and collapsible to show and hide more UDP, TCP, or ICMP header fields.
Src Port The value of the Source Port header field.
Dest Port The value of the Dest Port header field.
Type The value of the Type field in the ICMP header.
Code The value of the Code field in the ICMP header.
Length The value of the Length field in the UDP header.
Checksum The value of the Checksum field in the header.
SeqN The value of the Sequence Number field in the TCP header.
AckN The value of the Acknowledgment Number field in the TCP header.
DataOffset The value of the Offset field in the TCP header.
U The value of the U (URG — Urgent Pointer field significant) field in the TCP header.
A The value of the A (ACK — Acknowledgment field significant) field in the TCP header.
P The value of the P (PSH — Push Function) field in the TCP header.
R The value of the R (RST — Reset the connection) field in the TCP header.
S The value of the S (SYN — Synchronize sequence numbers) field in the TCP header.
F The value of the F (FIN — No more data from sender) field in the TCP header.
Window The value of the Window field in the TCP header.
Urgent Pointer The value of the Urgent Pointer field in the TCP header.
Data The Data field can be expanded and collapsed. By default, it is collapsed, and the value shown is the amount of data contained in the transaction. When expanded, the actual data from the field is shown.
69

CATC FIREINSPECTOR 2.01 CHAPTER 5
User’s Manual CATC Trace Files
View Type Fields in IPPR Transaction Rows
Some fields in IPPR transaction rows contain a View Fields command that allows you to see the contents of the data structures.
Left-click* on the field header to access the cell context menu, which contains the View Fields commands. Selecting the command opens a View Fields dialog, which contains the data laid out according to the IPPR specification.
*If the option Right click cell context menu is checked on the General tab of the Display Options dialog, then the cell context menu is opened by right-clicking. See Section 5.1.1, “General Display Options” on page 42 for more information.
For more information about the View Fields dialog, please see “View Fields Dialog” on page 75.
These are the fields that contain View Fields options:
• TCP: contains the fields of the TCP header.
• UDP: contains the fields of the UDP header.
• ICMP: contains the fields of the ICMP header.
Digital Camera 1.30 (DC) Transactions
Digital camera transactions are composed of 1394 Read and Write transactions. Based on the address offset value, FireInspector identifies the register that the values were written to or read from. It then supplies an interpretation of the information from the register, such as Mode, Frame Rate, etc.
View Type Fields in DC Transaction Rows
The Type fields in DC transaction rows contain a View Fields command that allows you to see the contents of the data structures.
Left-click* on the field header to access the cell context menu, which contains the View Fields commands. Selecting the command opens a View Fields dialog, which contains the data laid out according to the DC specification.
*If the option Right click cell context menu is checked on the General tab of the Display Options dialog, then the cell context menu is opened by right-clicking. See Section 5.1.1, “General Display Options” on page 42 for more information.
Table 5-10: Fields in digital camera transaction rows*
Field Headings Description
Type The type of 1394 transaction (Read or Write).
Offset The address offset from the base address, in hex.
Name The name of the register identified by the address offset.
Mode The Format Video 7 mode. Only displayed if Format Video 7 addresses were entered in the Decode Camera Transactions dialog.
*Not all possible fields are listed. The remaining DC transaction fields are determined by the register and may vary widely.
70

CATC FIREINSPECTOR 2.01 CHAPTER 5
User’s Manual CATC Trace Files
For more information about the View Fields dialog, please see “View Fields Dialog” on page 75.
This is the field that contains View Fields options:
• Type: contains the decoded bit fields of the quadlet that is read/written.
Decode Camera Transactions Dialog
Decoding digital camera transactions requires information that's not necessarily included in the Trace files. Each camera device has a base address that is unknown to FireInspector, so that address must be supplied manually. If the device supports Video Format 7 modes, then it has another bank of registers that FireInspector can decode when supplied with the Video Format 7 address(es).
The Decode Camera Transactions dialog (Figure 5-16) is used to supply the missing information so that the transactions can be decoded and displayed in FireInspector.
To set up decoding parameters for digital camera transactions:
Step 1 Select Setup > Decoding Parameters > Digital Camera Decoding Parameters from the menu bar.
Step 2 The Decode Camera Transactions dialog will open.
Step 3 Command Register Base Address: Enter the last 28 bits of a Base Address. By default, the address 0xFFFF:F0F00000 is entered.Video Format 7 Addresses: Enter up to 8 Mode addresses for cameras that support Video 7 format. If these are left blank, no Video 7 format decoding will happen.All parameters should be entered in hexadecimal.
Step 4 Click OK to apply the settings.
Other options in the Decode Digital Camera Transactions dialog:
Figure 5-16: Decode Camera Transactions dialog
71

CATC FIREINSPECTOR 2.01 CHAPTER 5
User’s Manual CATC Trace Files
• Restore Default — loads the default camera settings (.cam) file.• Save as Default — saves the current settings as default.cam.
• Save As... — brings up a Save As dialog so that you can save the settings as a camera settings file with a unique name.
• Load... — brings up an Open dialog so that you can browse for a camera settings file to use.
• Cancel — closes the dialog without applying or saving changes.
61883 Common Isochronous Packets (CIP)
CIP transactions take isochronous datablock packets as input. Each packet has a header, which is decoded by FireInspector. The remaining packet data can be viewed in the Data field in the Trace.
View Type Fields in CIP Transaction Rows
The Type fields in DC transaction rows contain a View Fields command that allows you to see the contents of the data structures.
Left-click* on the field header to access the cell context menu, which contains the View Fields commands. Selecting the command opens a View Fields dialog, which contains the data laid out according to the DC specification.
*If the option Right click cell context menu is checked on the General tab of the Display Options dialog, then the cell context menu is opened by right-clicking. See Section 5.1.1, “General Display Options” on page 42 for more information.
For more information about the View Fields dialog, please see “View Fields Dialog” on page 75.
This is the field that contains View Fields options:
• Type: contains the fields of the CIP header.
Table 5-11: Fields in CIP transaction rows
Field Headings Description
Type The type of CIP transaction, identified by the value of the FMT (Format ID) field in the CIP header.
Source ID The value of the SID (Source node ID) field in the CIP header.
DBC The value of the DBC (Data Block Counter) field in the CIP header.
SYT The value of the SYT field in the CIP header.
Time Stamp The value of the Time Stamp field in the source packet header.
Data The Data field can be expanded and collapsed. By default, it is collapsed, and the value shown is the amount of data contained in the transaction. When expanded, the actual data from the field is shown.
72
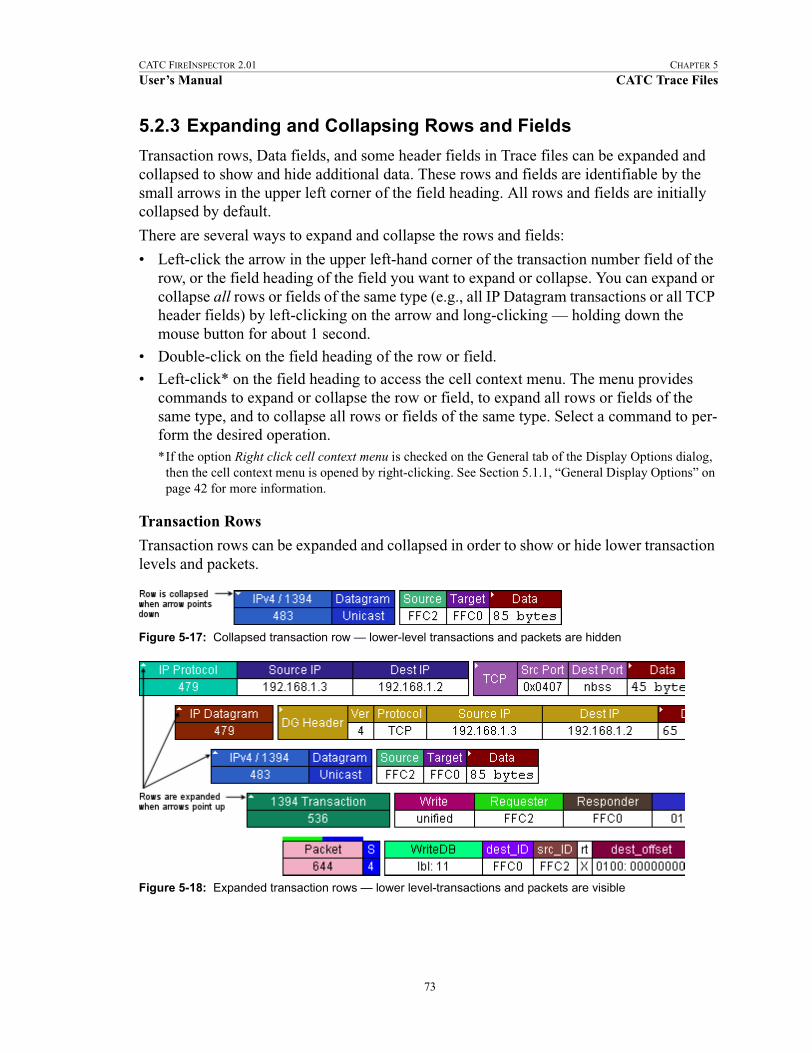
CATC FIREINSPECTOR 2.01 CHAPTER 5
User’s Manual CATC Trace Files
5.2.3 Expanding and Collapsing Rows and Fields
Transaction rows, Data fields, and some header fields in Trace files can be expanded and collapsed to show and hide additional data. These rows and fields are identifiable by the small arrows in the upper left corner of the field heading. All rows and fields are initially collapsed by default.
There are several ways to expand and collapse the rows and fields:
• Left-click the arrow in the upper left-hand corner of the transaction number field of the row, or the field heading of the field you want to expand or collapse. You can expand or collapse all rows or fields of the same type (e.g., all IP Datagram transactions or all TCP header fields) by left-clicking on the arrow and long-clicking — holding down the mouse button for about 1 second.
• Double-click on the field heading of the row or field.
• Left-click* on the field heading to access the cell context menu. The menu provides commands to expand or collapse the row or field, to expand all rows or fields of the same type, and to collapse all rows or fields of the same type. Select a command to per-form the desired operation.*If the option Right click cell context menu is checked on the General tab of the Display Options dialog,
then the cell context menu is opened by right-clicking. See Section 5.1.1, “General Display Options” on page 42 for more information.
Transaction Rows
Transaction rows can be expanded and collapsed in order to show or hide lower transaction levels and packets.
Figure 5-17: Collapsed transaction row — lower-level transactions and packets are hidden
Figure 5-18: Expanded transaction rows — lower level-transactions and packets are visible
73

CATC FIREINSPECTOR 2.01 CHAPTER 5
User’s Manual CATC Trace Files
Data Fields
When Data fields are collapsed, the value shown is the amount of data that is contained in the field. When Data fields are expanded, the actual data from the field is revealed.
Header Fields
Header fields can be expanded and collapsed to show or hide additional header data.
5.2.4 Cell Context Menus
The Trace file cell context menu contains frequently used packet- and transaction-specific commands. The menu may change, depending upon what packet or transaction field it is accessed from. Not every packet and transaction field contains a cell context menu.
To access the cell context menu in a Trace file:
• Left-click* on a field header. The cell context menu will pop up, if available.*If the option Right click cell context menu is checked on the General tab of the Display Options dialog,
then the cell context menu is opened by right-clicking on a packet header. See Section 5.1.1, “General Display Options” on page 42 for more information.
The Trace file cell context menu may provide any of the following commands for both .fdb and .txg Trace files:
Figure 5-19: Collapsed data field — amount of data is shown
Figure 5-20: Expanded data field — actual data is displayed
Figure 5-21: Collapsed header field — some header data is hidden
Figure 5-22: Expanded header field — additional header data is displayed
74
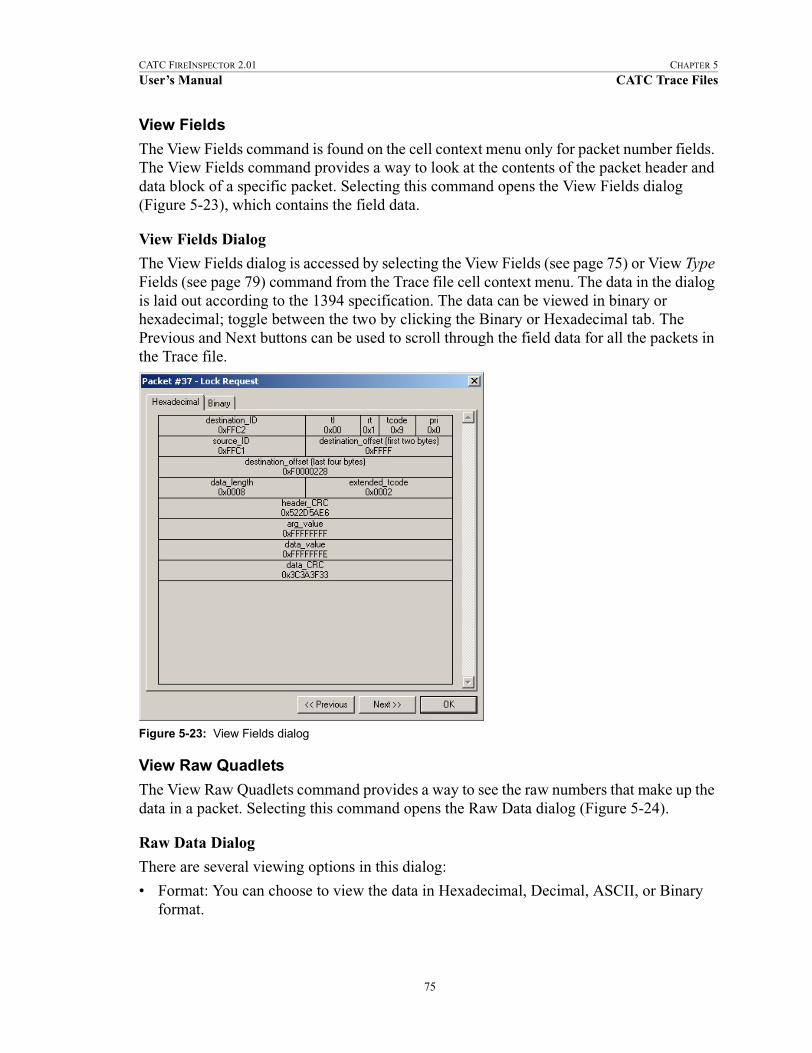
CATC FIREINSPECTOR 2.01 CHAPTER 5
User’s Manual CATC Trace Files
View Fields
The View Fields command is found on the cell context menu only for packet number fields. The View Fields command provides a way to look at the contents of the packet header and data block of a specific packet. Selecting this command opens the View Fields dialog (Figure 5-23), which contains the field data.
View Fields Dialog
The View Fields dialog is accessed by selecting the View Fields (see page 75) or View Type Fields (see page 79) command from the Trace file cell context menu. The data in the dialog is laid out according to the 1394 specification. The data can be viewed in binary or hexadecimal; toggle between the two by clicking the Binary or Hexadecimal tab. The Previous and Next buttons can be used to scroll through the field data for all the packets in the Trace file.
View Raw Quadlets
The View Raw Quadlets command provides a way to see the raw numbers that make up the data in a packet. Selecting this command opens the Raw Data dialog (Figure 5-24).
Raw Data Dialog
There are several viewing options in this dialog:
• Format: You can choose to view the data in Hexadecimal, Decimal, ASCII, or Binary format.
Figure 5-23: View Fields dialog
75

CATC FIREINSPECTOR 2.01 CHAPTER 5
User’s Manual CATC Trace Files
• Show per one line: Enter a number in the box and choose bytes, words, or dwords from the drop-down list to change the way the data is displayed. Checking “Space out” causes the numbers to be grouped, with spaces between the groups. If unchecked, all the num-bers on one line will run together.
• Bit Order: Choose from Most Significant Bit (MSB) or Least Significant Bit (LSB).
• Prev/Next buttons: Click Prev or Next to scroll through the raw quadlet data for all the packets in the Trace file.
To save the data:
Step 1 Click the Save Data Block... button.The Save Data Block As dialog opens.
Step 2 Enter a filename.
Step 3 Choose a mode for saving the file:
• Text saves the data as a text (.txt) file.
• Binary saves the data as a binary (.dat) file.
Step 4 (Optional) Navigate to a new directory in which to save the file.
Step 5 Click Save.
Set Marker
A marker is a unique label for a packet. Markers are especially useful as a way of navigating directly to a specific packet by using the Go to Marker command on the Search menu. Setting a marker also allows you to associate a comment with the packet. Marked packets can be identified by the red bar on the left edge of the packet number field.
Figure 5-24: Raw Data dialog
76

CATC FIREINSPECTOR 2.01 CHAPTER 5
User’s Manual CATC Trace Files
To set a marker:
Step 1 Left-click in the Packet number field of the packet you want to mark.The Trace file cell context menu will open.
Step 2 Select Set Marker.
The Packet # dialog will open.Step 3 (Optional) Enter a comment in the dialog. The comment can consist of up to
100 characters.Note: Marker comments can be viewed by positioning the mouse pointer over the
red marker bar on the left edge of the Packet number field.
Step 4 Click OK to set the marker.
Edit Marker
Allows you to edit the packet's marker comment.
To edit a marker:
Step 1 Left-click in the Packet number field that contains the marker, or left-click the marker bar itself.
The Trace file cell context menu or marker menu will open.Step 2 Select Edit Marker.
The Packet # dialog will open.
Step 3 Edit the comment.
Step 4 Click OK to save the comment.
Clear Marker
Clears the packet's marker.
To clear (delete) a marker:
Step 1 Left-click in the Packet number field that contains the marker, or left-click the marker bar itself.The Trace file cell context menu or marker menu will open.
Step 2 Select Clear Marker.
The marker will be deleted, and the red marker bar will be removed.
Time From Trigger
Opens the Timing and Bus Usage calculator and displays the total time between the trigger and the packet used to access the command. For details about using this tool, please see “Timing and Bus Usage Calculator” on page 113.
77
CATC FIREINSPECTOR 2.01 CHAPTER 5
User’s Manual CATC Trace Files
Time From Marker
Opens the All Markers dialog (see page 84). Select a marker and then press the Go To button. The Timing and Bus Usage calculator opens and displays the total time between the chosen marker and the packet used to access the command.
Format > Numeric Format
Allows you to change the format of the numbers in the Trace. Possible format choices are Hexadecimal, Decimal, Binary, ASCII, and Most Significant Bit (MSB) to Least Significant Bit (LSB) or LSB to MSB.
Color > Color Chart
Allows you to change the field color. Selecting Other at the bottom of the chart opens the Colors dialog. For more information about using the dialog, please reference “Color Tool/Colors Dialog” on page 44.
Hide
Hides all occurrences of the field. Note that hidden cells can be revealed using the Trace view menu.
Search for the next Type
Goes to the next occurrence of the packet type.
Reconstruct Topology Tree
Generates a topology tree from the packets. Please see “Reconstructing Bus Topology” on page 106 for more information.
Reconstruct Configuration ROM
Reconstructs the Configuration ROM data and displays it in the Configuration ROM dialog. Please reference “Reconstructing Configuration ROM” on page 108 for more information about this operation.
Find response
Goes to the response packet for the current packet. This command is available only for Read Request packets.
View Data Block
Opens the Raw Data dialog. For details about this dialog, please see “Raw Data Dialog” on page 75.
Expand/Collapse Field or Transaction
Expands or collapses the field or transaction.
78
CATC FIREINSPECTOR 2.01 CHAPTER 5
User’s Manual CATC Trace Files
Expand All Fields or Transactions
Expands all fields or transactions of the current type.
Collapse All Fields or Transactions
Collapses all fields or transactions of the current type.
Export Data
Opens the Export Data dialog. For more information, see “Exporting Trace Files” on page 87.
View Type Fields
Opens the View Fields dialog, which is described on page 75. Please refer to specific protocols in Section 5.2.2 “Transaction-Level Decoding” to find out which transaction row fields contain the View Type Fields command.
5.2.5 Cell Context Menu Commands for Traffic Generation Files
These additional commands may be available for traffic generation (.txg) files only. Please see “Editing Tools in FireInspector” on page 96 for details about these commands.
Edit Packet
Opens an Edit Packet dialog that allows you to edit the packet data.
Delete Packet
Deletes the packet.
Insert Packet
Opens the Insert Packet dialog.
Change all...Dest_IDs
Opens the Change Destination ID Throughout File dialog.
5.2.6 Trace View Menus
The Trace view pop-up menu contains commands for general display and viewing options. This makes it easy to make changes to the display and quickly find the information you are looking for.
To access the Trace view menu in a Trace file:
• Right-click on the background of the Trace display. The Trace view menu will pop up.
The Trace view pop-up menu provides the following commands:
79

CATC FIREINSPECTOR 2.01 CHAPTER 5
User’s Manual CATC Trace Files
Display Options
Opens the Display Options dialog. Please see “Display Options” on page 42 for details about this dialog.
Edit As Text
Opens the source file in Notepad (for traffic generation (.txg) files only).
Unhide Cells > Field name
Presents a list of the names of fields that are currently hidden. Selecting a field name from the list will reveal all ocurrences of that field. Selecting Unhide All reveals all hidden cells. Note that cells are hidden via the Hide command on the cell context menu or via the Level Hiding tab in the Display Options dialog.
Zoom In
Increases the size of the displayed transaction or tree.
Zoom Out
Decreases the size of the displayed transaction or tree.
Wrap
Toggles on or off wrapping of displayed packets to fit in the window.
View Packets Only
Hides all visible transactions and displays just the packets in an active Trace file.
View 1394 Transactions
Shows or hides 1394 transactions in an active Trace file.
View Serial Bus Protocol (SBP) Transactions
Opens the Decode SBP Transactions dialog to set SBP decoding parameters and then display the decoded transactions in an active Trace file. For more information about this dialog, please reference “Decode SBP Transactions Dialog” on page 62.
Note: 1394 transactions are automatically displayed when SBP transactions are shown.
View Function Control Protocol (FCP) Transactions
Decodes and displays FCP transactions in an active Trace file.
Note: 1394 transactions are automatically displayed when FCP transactions are shown.
View IPv4 over 1394 Transactions
Shows or hides IPv4/1394 transactions in an active Trace file
Note: 1394 transactions are automatically displayed when IPv4/1394 transactions are shown
80

CATC FIREINSPECTOR 2.01 CHAPTER 5
User’s Manual CATC Trace Files
View Internet Protocol (IP) Datagrams
Shows or hides IP Datagram transactions in an active Trace file.
Note: 1394 transactions are automatically displayed when IP Datagram transactions are shown.
View High Level Internet Protocols
Shows or hides IP Protocol transactions in an active Trace file.
Note: 1394 transactions are automatically displayed when IP Protocol transactions are shown.
View Digital Camera 1.30 Transactions
Opens the Decode Camera Transactions dialog to set Digital Camera decoding parameters and then display the decoded transactions in an active Trace file. Please see “Decode Camera Transactions Dialog” on page 71 for details about this dialog.
Note: 1394 transactions are automatically displayed when Digital Camera transactions are shown.
View 61883 Common Isochronous Packets (CIPs)
Shows or hides CIP transactions in an active Trace file.
View User Defined Transactions > Transaction(s)
Shows or hides transactions defined in customized decoders. To learn more about custom decoders, please reference “Custom Decoder Scripts” on page 89.
5.3 Saving Trace FilesBoth traffic generation (.txg) Trace files and traffic recording (.fdb) Trace files can be saved in FireInspector.
5.3.1 Saving Traffic Generation (.txg) Trace Files
You can use the Save or Save As command to save traffic generation files.
To overwrite the current version of the file:
Step 1 Choose File > Save from the menu bar.
If the file has not been previously saved, the Save As dialog will open. In this case, continue with Step 2 below.
To save the file in a different location or with a different filename:
Step 1 Choose File > Save As from the menu bar or click the Save As button on the toolbar.
The Save As dialog will open.Step 2 Enter a new location and/or filename for the file, then click Save.
81
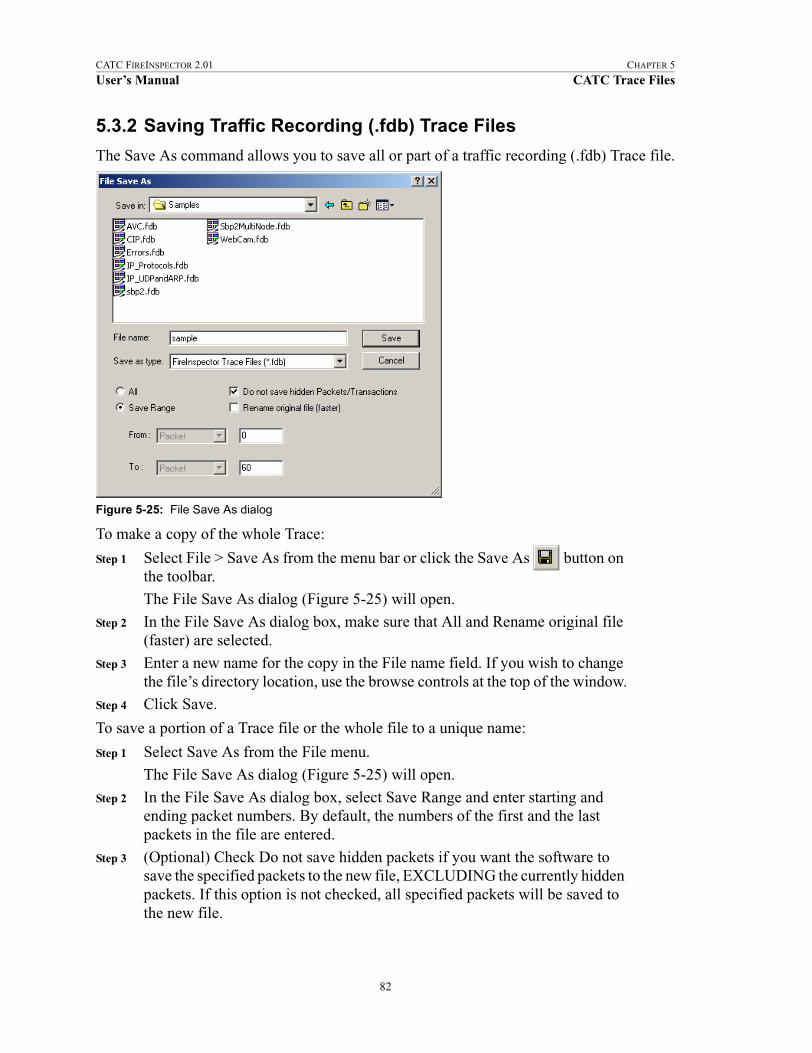
CATC FIREINSPECTOR 2.01 CHAPTER 5
User’s Manual CATC Trace Files
5.3.2 Saving Traffic Recording (.fdb) Trace Files
The Save As command allows you to save all or part of a traffic recording (.fdb) Trace file.
To make a copy of the whole Trace:
Step 1 Select File > Save As from the menu bar or click the Save As button on the toolbar.
The File Save As dialog (Figure 5-25) will open.
Step 2 In the File Save As dialog box, make sure that All and Rename original file (faster) are selected.
Step 3 Enter a new name for the copy in the File name field. If you wish to change the file’s directory location, use the browse controls at the top of the window.
Step 4 Click Save.
To save a portion of a Trace file or the whole file to a unique name:
Step 1 Select Save As from the File menu.
The File Save As dialog (Figure 5-25) will open.
Step 2 In the File Save As dialog box, select Save Range and enter starting and ending packet numbers. By default, the numbers of the first and the last packets in the file are entered.
Step 3 (Optional) Check Do not save hidden packets if you want the software to save the specified packets to the new file, EXCLUDING the currently hidden packets. If this option is not checked, all specified packets will be saved to the new file.
Figure 5-25: File Save As dialog
82
CATC FIREINSPECTOR 2.01 CHAPTER 5
User’s Manual CATC Trace Files
Step 4 Enter a new file name in the File name field. If you wish to change the file’s directory location, use the browse controls at the top of the window.
Step 5 Click Save.
5.4 Trace File CommentsA comment of up to 100 characters can be associated with a Trace file. Comments are included in the File Information report (see “File Information” on page 111 for details).
To create, view, or edit a Trace file comment:
Step 1 Select File > Edit Comment.The Edit Trace File Comment dialog appears.
Step 2 You may now create a new comment or edit the existing comment.
Press OK to save a new comment or any changes, or press Cancel to exit the dialog without saving.
5.5 Searching Trace FilesThe Search menu in FireInspector offers several ways to efficiently search large quantities of transaction data. This makes it easy to quickly locate specific information in a Trace file.
5.5.1 Go to Trigger
This command repositions the Trace file so that the packet immediately preceding the trigger event is on the first line of the display.
To go directly to the trigger packet:
• Select Search > Go to Trigger from the menu bar.
5.5.2 Go to Packet/Transaction
This command allows you to navigate directly to a specified packet. The chosen packet will be positioned on the first line of the display.
To go directly to a packet:
Step 1 Select Search > Go to Packet from the menu bar.
The Go to Packet/Transaction dialog appears.
Step 2 Enter a packet number or choose a marker from the drop-down list.Step 3 Click OK.
5.5.3 Go to Marker
Use this command to go directly to a specific marked packet. The packet will be positioned on the first line of the display.
83

CATC FIREINSPECTOR 2.01 CHAPTER 5
User’s Manual CATC Trace Files
To go to a marker:
Step 1 Select Search > Go To Marker from menu bar.Step 2 Select a marker from the fly-out menu
or
Select All Markers... to open the All Markers dialog.Note: If you open the All Markers dialog, you should select a marker from the list,
then click Go To in order to go to the marker.
All Markers Dialog
The All Markers dialog (Figure 5-26) lists all markers in the active Trace file. Marker comments are also provided.
The All Markers dialog allows you to edit, delete, or go to a marker in the Trace file.
5.5.4 Go to
Use the Go To command to navigate directly to a specific event in the Trace. This will position the event on the first line of the display.
To go to an event:
Step 1 Select Search > Go To from the menu bar.
A list of event types will pop up.Step 2 Choose an event group from the list.
All occurrences of events from that event group in the Trace are listed.
Step 3 Choose an event from the list.The display will be repositioned so that the selected event is on the first line of the display.
Figure 5-26: All Markers dialog
84
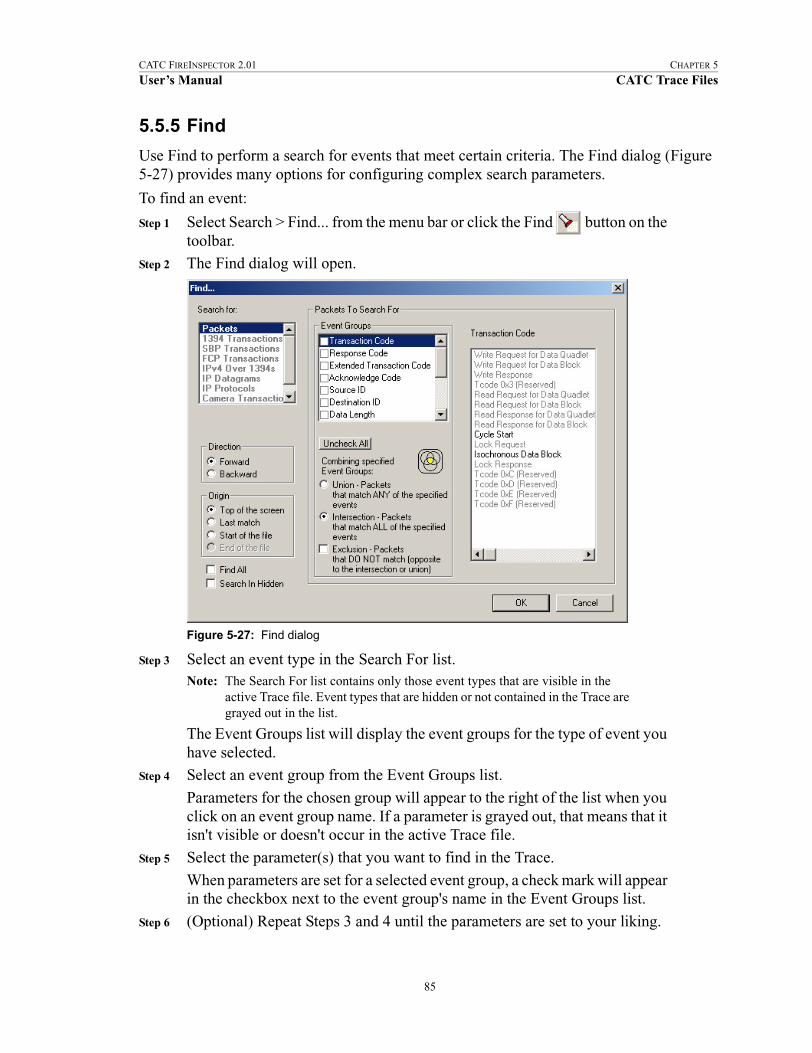
CATC FIREINSPECTOR 2.01 CHAPTER 5
User’s Manual CATC Trace Files
5.5.5 Find
Use Find to perform a search for events that meet certain criteria. The Find dialog (Figure 5-27) provides many options for configuring complex search parameters.
To find an event:
Step 1 Select Search > Find... from the menu bar or click the Find button on the toolbar.
Step 2 The Find dialog will open.
Step 3 Select an event type in the Search For list.Note: The Search For list contains only those event types that are visible in the
active Trace file. Event types that are hidden or not contained in the Trace are grayed out in the list.
The Event Groups list will display the event groups for the type of event you have selected.
Step 4 Select an event group from the Event Groups list.
Parameters for the chosen group will appear to the right of the list when you click on an event group name. If a parameter is grayed out, that means that it isn't visible or doesn't occur in the active Trace file.
Step 5 Select the parameter(s) that you want to find in the Trace.
When parameters are set for a selected event group, a check mark will appear in the checkbox next to the event group's name in the Event Groups list.
Step 6 (Optional) Repeat Steps 3 and 4 until the parameters are set to your liking.
Figure 5-27: Find dialog
85

CATC FIREINSPECTOR 2.01 CHAPTER 5
User’s Manual CATC Trace Files
Step 7 Choose a direction for the search:• Forward: The search will move forward through the file from the point of
origin.
• Backward: The search will move backward through the file from the point of origin.
Step 8 Set the origin for the search:
• Top of the screen: The search will begin with the packet or transaction currently at the top of the display.
• Last match: The search will begin at the location of the last match of the last search operation.
• Start of the file: The search will start at the beginning of the file (only available when search direction is set to Forward).
• End of the file: The search will start at the end of the file (only available when search direction is set to Backward).
Step 9 (Optional) Check Find All to find all matches for the search. This causes FireInspector to create a new Trace file and display the matches in there.
Step 10 (Optional) Check Search In Hidden to include hidden packets and transactions in the search.
Step 11 Select a combination definition in the section marked Combining Specified Event Groups:
• Union - Packets that match ANY of the specified events: Selecting this serves as the logical OR for the selected event groups.
• Intersection - Packets that match ALL of the specified events: Selecting this serves as the logical AND for the selected events.
• Exclusion - Packets that DO NOT match (opposite to the intersection or union): Selecting this finds all the packets that DO NOT match the specified search criteria. It must be used in conjunction with either the Union or Intersection option.
Step 12 Click OK to perform the search.
5.5.6 Search Direction
Use this command to toggle the search direction between backward and forward. The current search direction is always the one listed on the menu. Selecting it reverses the direction.
To change the search direction:
• Select Search > Search Direction Forward/Backward from the menu bar.
The new search direction will be listed on the menu. It will also be shown on the right end of the status bar.
86

CATC FIREINSPECTOR 2.01 CHAPTER 5
User’s Manual CATC Trace Files
5.6 Exporting Trace FilesFireInspector can export the contents of a traffic recording Trace (.fdb) file to four different formats:
• Packet (Trace) view format (.txt) • Traffic generation file format (.txg)
• Comma separated value format (.csv)
• Data format (.txt or .dat)
For details about exporting Trace files, please reference “Exporting Files” on page 125.
87

CATC FIREINSPECTOR 2.01 CHAPTER 5
User’s Manual CATC Trace Files
88

CATC FIREINSPECTOR 2.01 CHAPTER 6
User’s Manual Decoder Scripts
CHAPTER 6: DECODER SCRIPTSSeveral CATC Decoder Scripting files are included with the FireInspector software installation. These script-based decoders are tools to decode and display transactions. They can be used as-is or modified by the user. Additionally, you may create custom decoders. The decoder scripts are written in CATC Scripting Language (CSL). For more information about CSL, please consult CATC Scripting Language (CSL) Reference Manual for FireInspector, available on the CATC website at http://www.catc.com.
6.1 CATC Decoder Scripting FilesDecoder scripts for FireInspector are distributed in the \Scripts folder in the FireInspector installation directory. They are identifiable by the .dec extension. FireInspector looks in the \Scripts directory and automatically loads all of the .dec files that it finds. To prevent a particular decoder from being loaded, change its extension to something other than .dec or move it out of the \Scripts directory.
Note: If you plan to modify any of the scripts that come with FireInspector, it's a good idea to make backups of the original scripts before making changes.
For additional information about transaction-level decoding, please see Section 5.2.2, “Transaction-Level Decoding” on page 58.
6.2 Custom Decoder ScriptsCustom decoders can be created for FireInspector using CATC Scripting Language (CSL). This allows you to add specialized decoders to suit your own, specific development needs. CSL is used to write and edit the decoder scripts, which should then be placed in FireInspector's \Scripts directory. For your convenience, the \Scripts directory contains a folder labeled User Defined, into which you may place your custom decoders.
When FireInspector finds custom decoders in its \Scripts directory, it automatically loads them. It also adds the decoders' icons to the View Level toolbar, and lists the decoders under View > View User Defined Transactions on the menu bar. If an icon is not defined in a decoder script, FireInspector uses the default User-Defined icon.
89

CATC FIREINSPECTOR 2.01 CHAPTER 6
User’s Manual Decoder Scripts
90

CATC FIREINSPECTOR 2.01 CHAPTER 7
User’s Manual Traffic Generation
CHAPTER 7: TRAFFIC GENERATIONFireInspector uses traffic generation (.txg) files to generate traffic on the 1394 bus. Traffic generation files are text files that can be created by hand using traffic generation keys to define packet fields, or by exporting a traffic recording (.fdb) file to generator text (.txg) file format. Additionally, you can access several convenient editing utilities via the Trace file pop-up menus.
Several sample traffic generation files are included with the FireInspector software installation.
7.1 Traffic Generation KeysTraffic generation keys are used to define packets in a traffic generation (.txg) text file.
Each packet definition consists of a set of assignments like this:
key = value
White space is permitted around the equal sign.
It is not necessary to define each packet on a separate line; however, it is not recommended to have the end of one packet and the beginning of another both on the same line, as the editing of the packets will not work properly in this case.
The hash mark (#) and semicolon (;) characters indicate end-of-line comments, and anything to the right of these characters is ignored.
All keys and values are case insensitive.
Each packet definition starts with one of the following assignments:
• tcode=N (where N is a valid tcode value as defined by the 1394 standard)
• phy_packet=N (where N is a quadlet written in hexadecimal, e.g., 0x12345678)
• control=N (where N is a control packet type)
Subsequent assignments define the values of particular fields within the packet. If a field is not defined, it is assumed to have a value of zero. If a field is not valid for a packet, the error is displayed and file loading is aborted.
Values are assumed to be in decimal unless they are prefixed by '0x', in which case they are interpreted as hexadecimal. Values within a data block assignment are always assumed to be hexadecimal and should not be prefixed by '0x'.
Each packet can have a marker key with a text string value. For example:
marker=This packet starts movie transfer over the bus.
Packets containing this key are marked in the Trace file by a red bar on the left edge of the packet number field. When the mouse pointer is positioned over the bar, the marker text is shown as a tool tip.
91
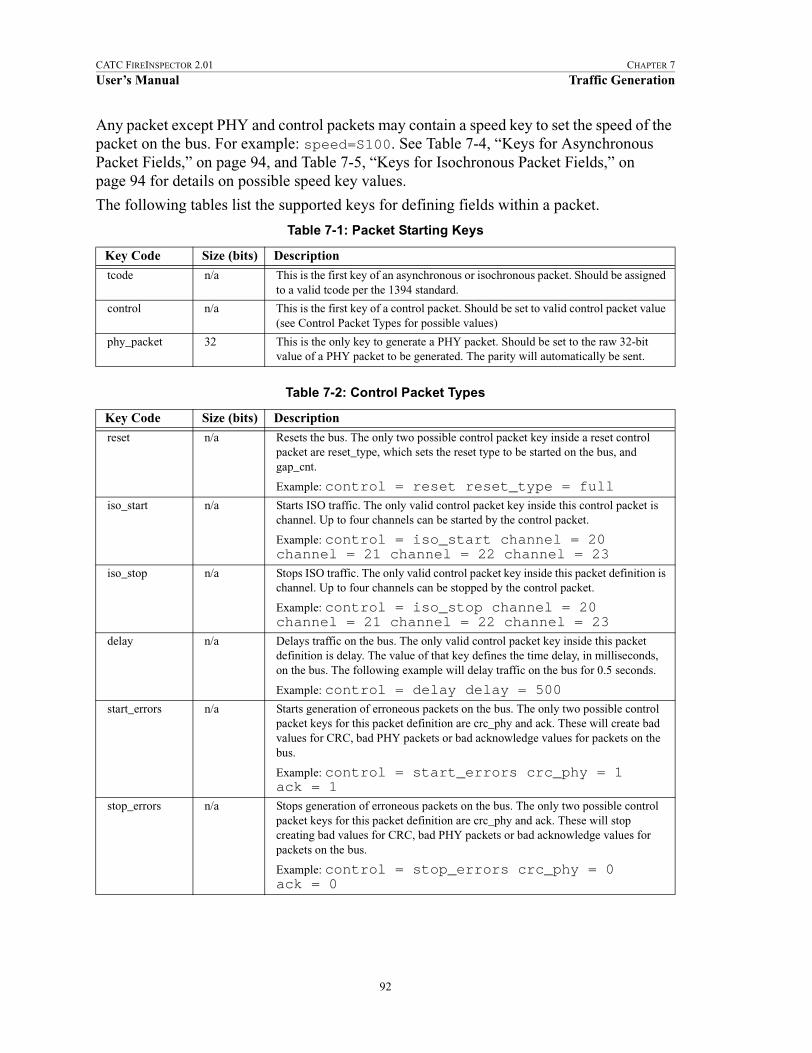
CATC FIREINSPECTOR 2.01 CHAPTER 7
User’s Manual Traffic Generation
Any packet except PHY and control packets may contain a speed key to set the speed of the packet on the bus. For example: speed=S100. See Table 7-4, “Keys for Asynchronous Packet Fields,” on page 94, and Table 7-5, “Keys for Isochronous Packet Fields,” on page 94 for details on possible speed key values.
The following tables list the supported keys for defining fields within a packet.
Table 7-1: Packet Starting Keys
Key Code Size (bits) Description
tcode n/a This is the first key of an asynchronous or isochronous packet. Should be assigned to a valid tcode per the 1394 standard.
control n/a This is the first key of a control packet. Should be set to valid control packet value (see Control Packet Types for possible values)
phy_packet 32 This is the only key to generate a PHY packet. Should be set to the raw 32-bit value of a PHY packet to be generated. The parity will automatically be sent.
Table 7-2: Control Packet Types
Key Code Size (bits) Description
reset n/a Resets the bus. The only two possible control packet key inside a reset control packet are reset_type, which sets the reset type to be started on the bus, and gap_cnt.
Example: control = reset reset_type = fulliso_start n/a Starts ISO traffic. The only valid control packet key inside this control packet is
channel. Up to four channels can be started by the control packet.
Example: control = iso_start channel = 20 channel = 21 channel = 22 channel = 23
iso_stop n/a Stops ISO traffic. The only valid control packet key inside this packet definition is channel. Up to four channels can be stopped by the control packet.
Example: control = iso_stop channel = 20channel = 21 channel = 22 channel = 23
delay n/a Delays traffic on the bus. The only valid control packet key inside this packet definition is delay. The value of that key defines the time delay, in milliseconds, on the bus. The following example will delay traffic on the bus for 0.5 seconds.
Example: control = delay delay = 500start_errors n/a Starts generation of erroneous packets on the bus. The only two possible control
packet keys for this packet definition are crc_phy and ack. These will create bad values for CRC, bad PHY packets or bad acknowledge values for packets on the bus.
Example: control = start_errors crc_phy = 1ack = 1
stop_errors n/a Stops generation of erroneous packets on the bus. The only two possible control packet keys for this packet definition are crc_phy and ack. These will stop creating bad values for CRC, bad PHY packets or bad acknowledge values for packets on the bus.
Example: control = stop_errors crc_phy = 0ack = 0
92
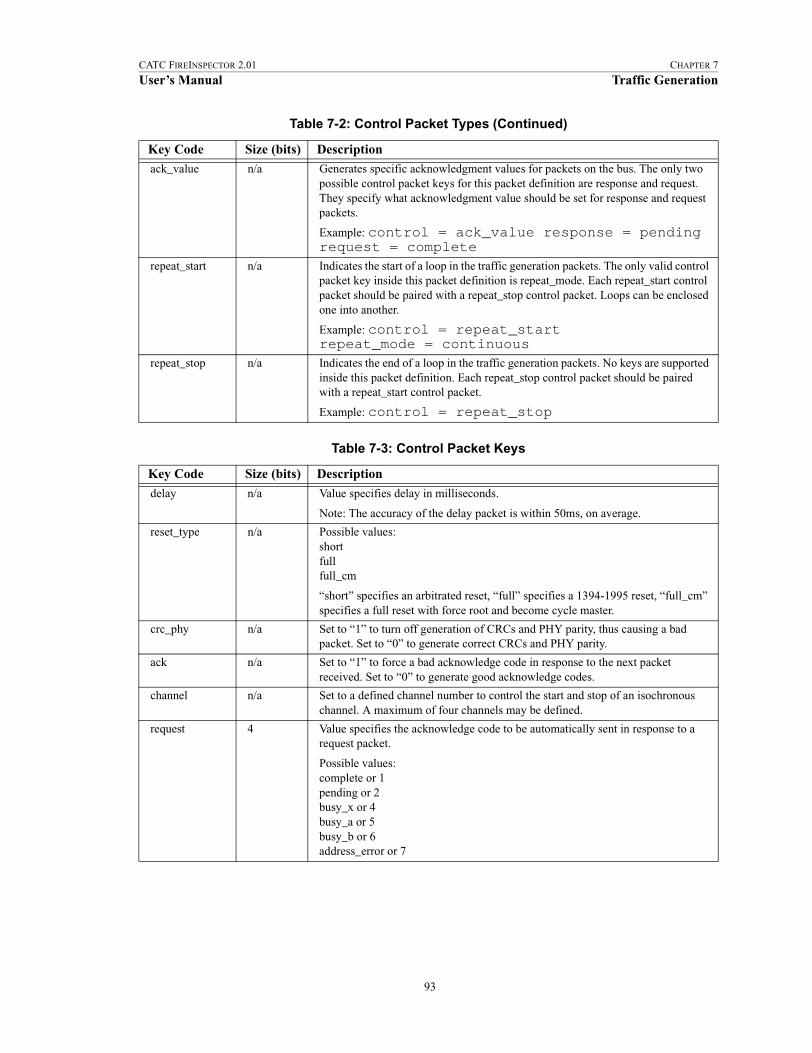
CATC FIREINSPECTOR 2.01 CHAPTER 7
User’s Manual Traffic Generation
ack_value n/a Generates specific acknowledgment values for packets on the bus. The only two possible control packet keys for this packet definition are response and request. They specify what acknowledgment value should be set for response and request packets.
Example: control = ack_value response = pending request = complete
repeat_start n/a Indicates the start of a loop in the traffic generation packets. The only valid control packet key inside this packet definition is repeat_mode. Each repeat_start control packet should be paired with a repeat_stop control packet. Loops can be enclosed one into another.
Example: control = repeat_startrepeat_mode = continuous
repeat_stop n/a Indicates the end of a loop in the traffic generation packets. No keys are supported inside this packet definition. Each repeat_stop control packet should be paired with a repeat_start control packet.
Example: control = repeat_stop
Table 7-3: Control Packet Keys
Key Code Size (bits) Description
delay n/a Value specifies delay in milliseconds.
Note: The accuracy of the delay packet is within 50ms, on average.
reset_type n/a Possible values:shortfullfull_cm
“short” specifies an arbitrated reset, “full” specifies a 1394-1995 reset, “full_cm” specifies a full reset with force root and become cycle master.
crc_phy n/a Set to “1” to turn off generation of CRCs and PHY parity, thus causing a bad packet. Set to “0” to generate correct CRCs and PHY parity.
ack n/a Set to “1” to force a bad acknowledge code in response to the next packet received. Set to “0” to generate good acknowledge codes.
channel n/a Set to a defined channel number to control the start and stop of an isochronous channel. A maximum of four channels may be defined.
request 4 Value specifies the acknowledge code to be automatically sent in response to a request packet.
Possible values:complete or 1pending or 2busy_x or 4busy_a or 5busy_b or 6address_error or 7
Table 7-2: Control Packet Types (Continued)
Key Code Size (bits) Description
93

CATC FIREINSPECTOR 2.01 CHAPTER 7
User’s Manual Traffic Generation
response 4 Value specifies the acknowledge code to be automatically sent in response to a response packet.
Possible values:complete or 1pending or 2busy_x or 4busy_a or 5busy_b or 6address_error or 7
repeat_mode 16 Possible values:continuous or 0Any number to define how many repetitions to make for the packets following this control packet, up to the end of the repeat_stop packet.
gap_cnt or gap_count
6 Value (0-63) sets gap count on the bus during bus reset.
Table 7-4: Keys for Asynchronous Packet Fields
Key Code Size (bits) Description
speed n/a Possible values:0 or S100 (100 Mbit/s)2 or S200 (200 Mbit/s)4 or S400 (400 Mbit/s)
dest_id or dst_id 16 Destination identifier
tl 6 Transaction label
rt 2 Retry code
pri 4 Priority
dest_off1 16 Destination offset (high word in second quadlet)
dest_off2 32 Destination offset (low double word in third quadlet)
quadlet or quadlet_data
32 Quadlet data
data_len or datalen
16 Data length (in bytes)
ext_tcode 16 Extended tcode
rcode 4 Response code
res1 12 Reserved field (in second quadlet)
res2 32 Reserved field (in third quadlet)
Table 7-5: Keys for Isochronous Packet Fields
Key Code Size (bits) Description
speed n/a Possible values:0 or S100 (100 Mbit/s)2 or S200 (200 Mbit/s)4 or S400 (400 Mbit/s)
tag 2 Isochronous data format tag (isochronous data block packet only)
Table 7-3: Control Packet Keys (Continued)
Key Code Size (bits) Description
94
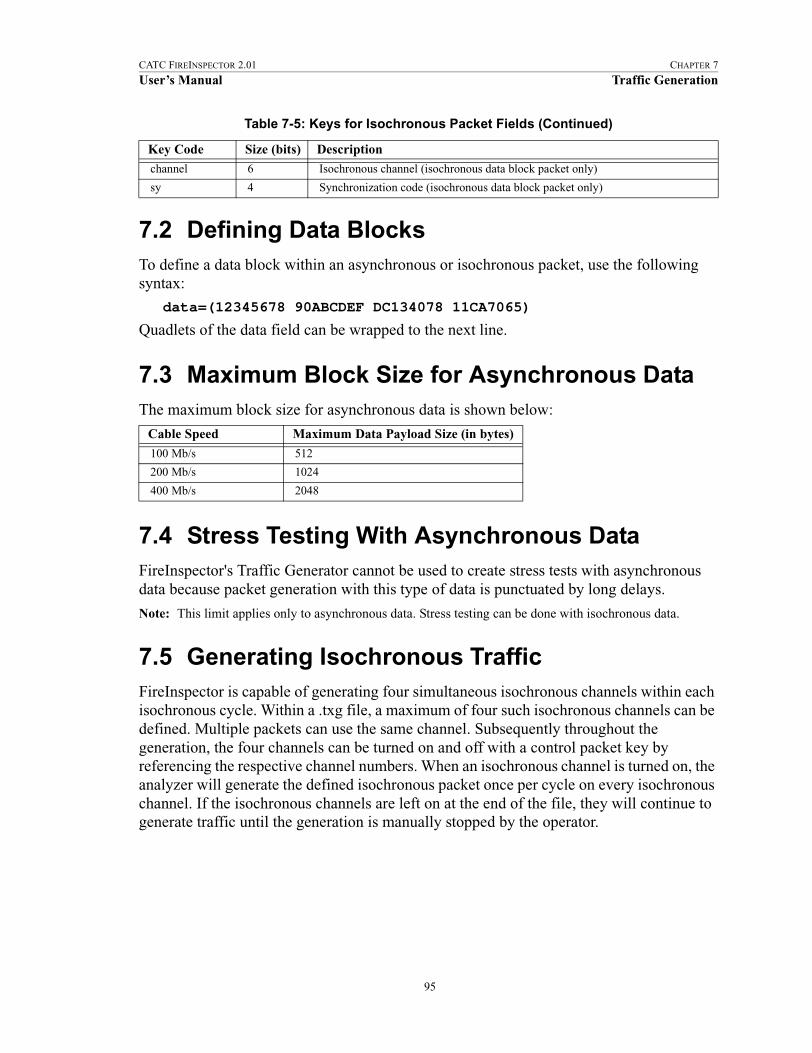
CATC FIREINSPECTOR 2.01 CHAPTER 7
User’s Manual Traffic Generation
7.2 Defining Data BlocksTo define a data block within an asynchronous or isochronous packet, use the following syntax:
data=(12345678 90ABCDEF DC134078 11CA7065)
Quadlets of the data field can be wrapped to the next line.
7.3 Maximum Block Size for Asynchronous DataThe maximum block size for asynchronous data is shown below:
7.4 Stress Testing With Asynchronous DataFireInspector's Traffic Generator cannot be used to create stress tests with asynchronous data because packet generation with this type of data is punctuated by long delays.
Note: This limit applies only to asynchronous data. Stress testing can be done with isochronous data.
7.5 Generating Isochronous TrafficFireInspector is capable of generating four simultaneous isochronous channels within each isochronous cycle. Within a .txg file, a maximum of four such isochronous channels can be defined. Multiple packets can use the same channel. Subsequently throughout the generation, the four channels can be turned on and off with a control packet key by referencing the respective channel numbers. When an isochronous channel is turned on, the analyzer will generate the defined isochronous packet once per cycle on every isochronous channel. If the isochronous channels are left on at the end of the file, they will continue to generate traffic until the generation is manually stopped by the operator.
channel 6 Isochronous channel (isochronous data block packet only)
sy 4 Synchronization code (isochronous data block packet only)
Cable Speed Maximum Data Payload Size (in bytes)
100 Mb/s 512
200 Mb/s 1024
400 Mb/s 2048
Table 7-5: Keys for Isochronous Packet Fields (Continued)
Key Code Size (bits) Description
95

CATC FIREINSPECTOR 2.01 CHAPTER 7
User’s Manual Traffic Generation
7.6 Maximum Block Size for Isochronous DataThe maximum block size for isochronous data is shown below:
7.7 Creating Different Traffic Patterns With Isochronous Data
You can create different types of traffic patterns by setting the data length (datalen) to a value equal to or less than the size of the data block that you are loading into the buffer. For example, if you set the data length to 8 bytes and then load a 32-byte data block into the buffer, FireInspector will read the first 8 bytes of the block and send them out as a packet, then read the next 8 bytes and send them out as a second packet, and so on, until all 32 bytes have been sent. Then the cycle repeats. If, however, you set the data length value to be equal to the buffer size, FireInspector sends a stream of identical packets made up of the entire data block. Thus, if you set the data length to 32 bytes and load a 32-byte data block into the buffer, FireInspector will then send out the entire data block in each packet.
Maximum buffer size: 16K per channel
Maximum number of channels: 4
Maximum data length size: 4K-1 or 4095 bytes
7.8 Editing Tools in FireInspectorSeveral editing tools for traffic generation files can be accessed via the Trace file pop-up menus. For more information about the menus, please see “Cell Context Menus” on page 74.
7.8.1 Edit Packet
The Edit Packet command is found on the Trace file cell context menu. It opens an Edit Packet dialog, which allows you to edit the packet data.
Cable Speed Maximum Data Payload Size (in bytes)
100 Mb/s 1024
200 Mb/s 2048
400 Mb/s 4095
Note: the 1394 specification allows for a maximum of 4096; however, this is not possible with FireInspector, due to a hardware limitation.
96

CATC FIREINSPECTOR 2.01 CHAPTER 7
User’s Manual Traffic Generation
Edit Packet Dialogs
The Edit Packet dialogs allow you to edit packet data. There are several different kinds of Edit Packet dialogs, for editing different types of packets: Force Reset, Delay, Set Acknowledge Values, Repeat Start/Stop, Start/Stop ISO Transmission, Start/Stop Errors, and Packet field editor.
Force Reset Dialog
To edit a Force Reset control packet:
Step 1 Choose a reset type from the drop-down list.
Step 2 Enter a gap value.
Step 3 Click OK.
Delay Dialog
To edit a Delay control packet:
Step 1 Enter a value for the delay in milliseconds.
Step 2 Click OK.
Figure 7-1: Force Reset dialog
Figure 7-2: Delay dialog
97
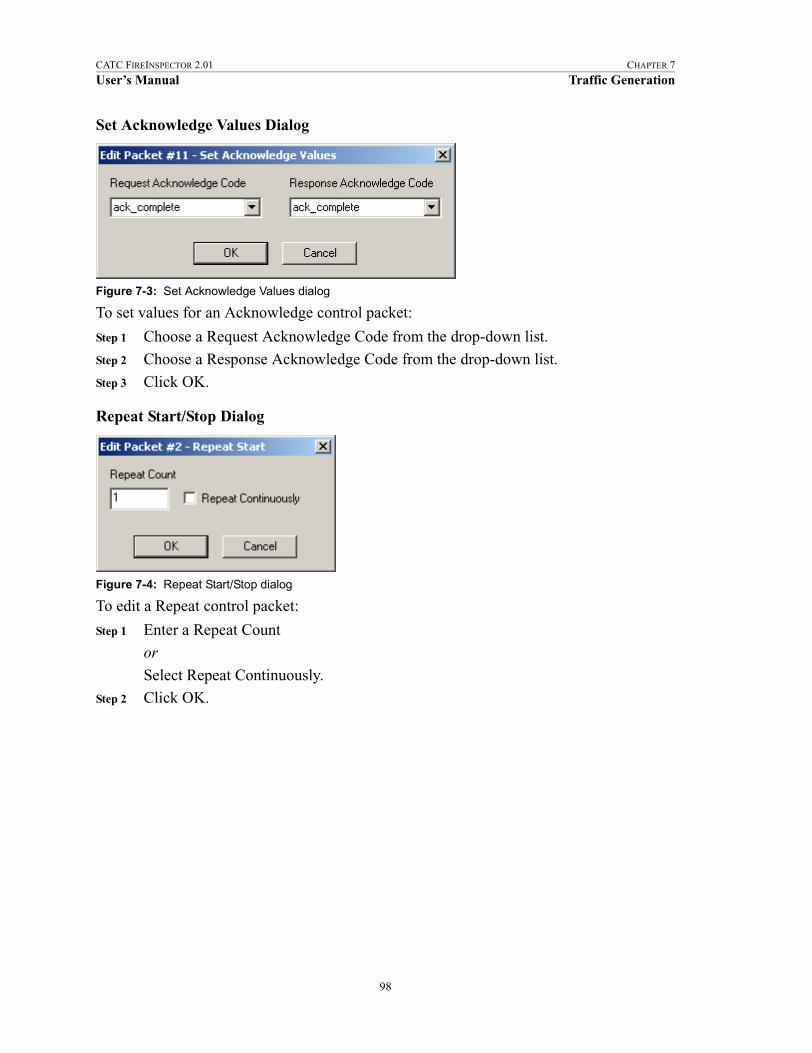
CATC FIREINSPECTOR 2.01 CHAPTER 7
User’s Manual Traffic Generation
Set Acknowledge Values Dialog
To set values for an Acknowledge control packet:
Step 1 Choose a Request Acknowledge Code from the drop-down list.
Step 2 Choose a Response Acknowledge Code from the drop-down list.
Step 3 Click OK.
Repeat Start/Stop Dialog
To edit a Repeat control packet:
Step 1 Enter a Repeat Count
or
Select Repeat Continuously.Step 2 Click OK.
Figure 7-3: Set Acknowledge Values dialog
Figure 7-4: Repeat Start/Stop dialog
98
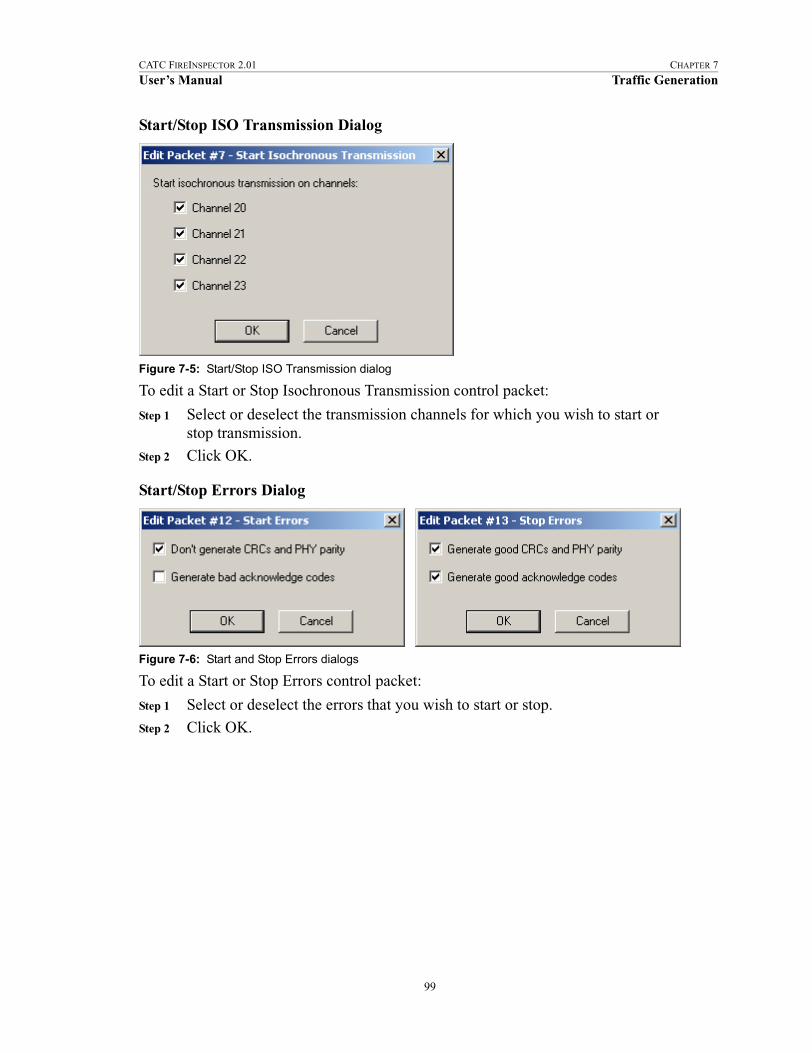
CATC FIREINSPECTOR 2.01 CHAPTER 7
User’s Manual Traffic Generation
Start/Stop ISO Transmission Dialog
To edit a Start or Stop Isochronous Transmission control packet:
Step 1 Select or deselect the transmission channels for which you wish to start or stop transmission.
Step 2 Click OK.
Start/Stop Errors Dialog
To edit a Start or Stop Errors control packet:
Step 1 Select or deselect the errors that you wish to start or stop.
Step 2 Click OK.
Figure 7-5: Start/Stop ISO Transmission dialog
Figure 7-6: Start and Stop Errors dialogs
99
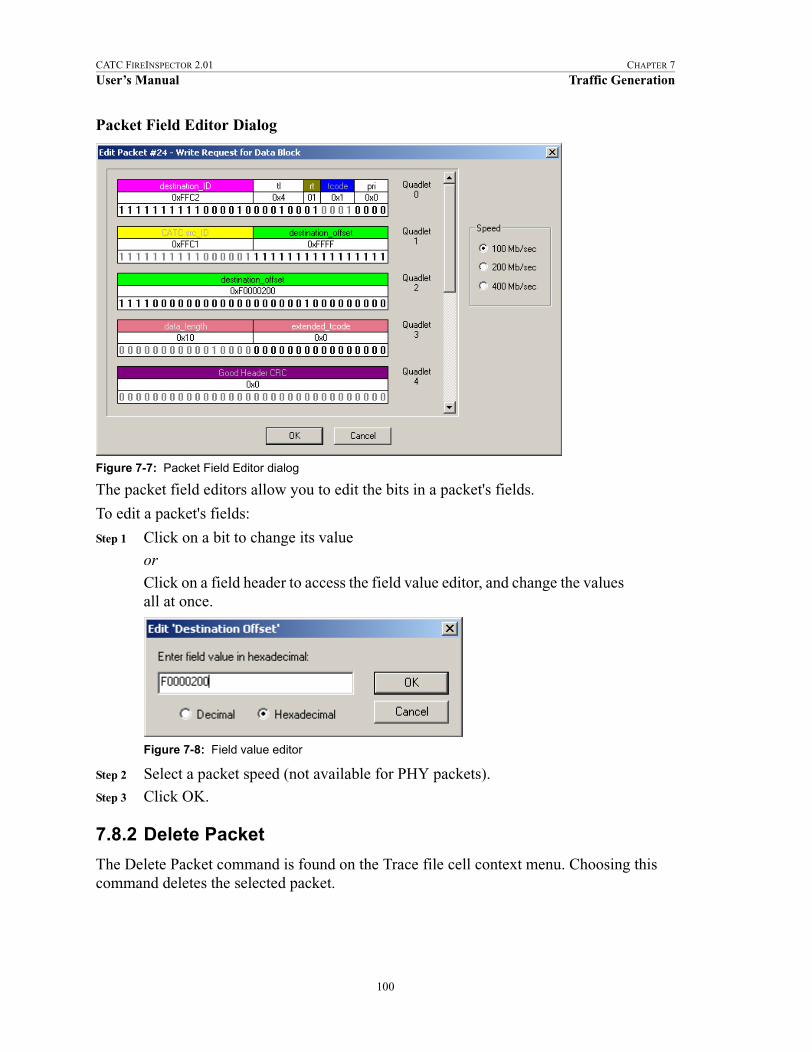
CATC FIREINSPECTOR 2.01 CHAPTER 7
User’s Manual Traffic Generation
Packet Field Editor Dialog
The packet field editors allow you to edit the bits in a packet's fields.
To edit a packet's fields:
Step 1 Click on a bit to change its value
or
Click on a field header to access the field value editor, and change the values all at once.
Step 2 Select a packet speed (not available for PHY packets).
Step 3 Click OK.
7.8.2 Delete Packet
The Delete Packet command is found on the Trace file cell context menu. Choosing this command deletes the selected packet.
Figure 7-7: Packet Field Editor dialog
Figure 7-8: Field value editor
100

CATC FIREINSPECTOR 2.01 CHAPTER 7
User’s Manual Traffic Generation
7.8.3 Insert Packet
The Insert Packet command is found on the Trace file cell context pop-up menu. The Insert Packet dialog allows you to put new packets into a traffic generation trace file.
To insert packets:
Step 1 Select a Packet Type.
For each packet type, different packet names appear in the packet list on the right.
Step 2 Select a packet from the packet list.
Step 3 If desired, set the data length, in bytes, for asynchronous and isochronous packets.
Step 4 Set the position for the new packet.
Step 5 Click OK.
The Packet Field Editor dialog will appear so that you can further edit the packet. For more information about editing packets, please refer to “Packet Field Editor Dialog” on page 100.
7.8.4 Change all...Dest_IDs
The Change all...Dest_IDs command is found on the Trace file cell context menu. The Change Destination ID Throughout File dialog allows you to change all occurrences of a
Figure 7-9: Insert Packet dialog
101
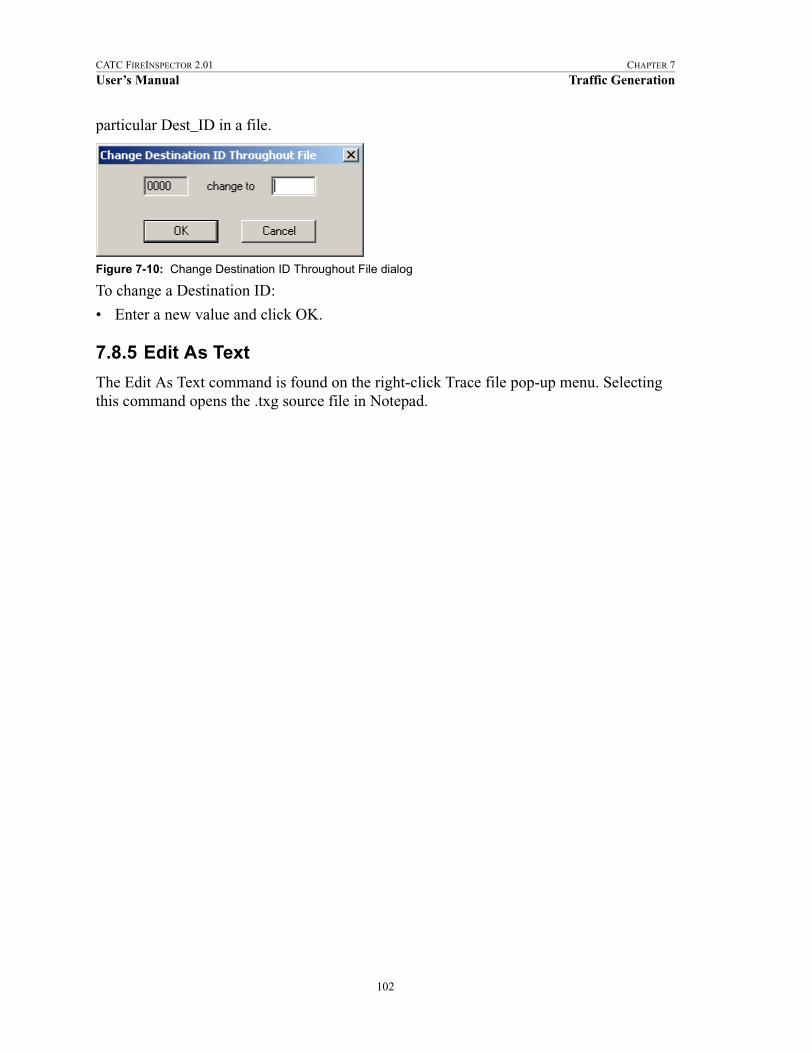
CATC FIREINSPECTOR 2.01 CHAPTER 7
User’s Manual Traffic Generation
particular Dest_ID in a file.
To change a Destination ID:
• Enter a new value and click OK.
7.8.5 Edit As Text
The Edit As Text command is found on the right-click Trace file pop-up menu. Selecting this command opens the .txg source file in Notepad.
Figure 7-10: Change Destination ID Throughout File dialog
102
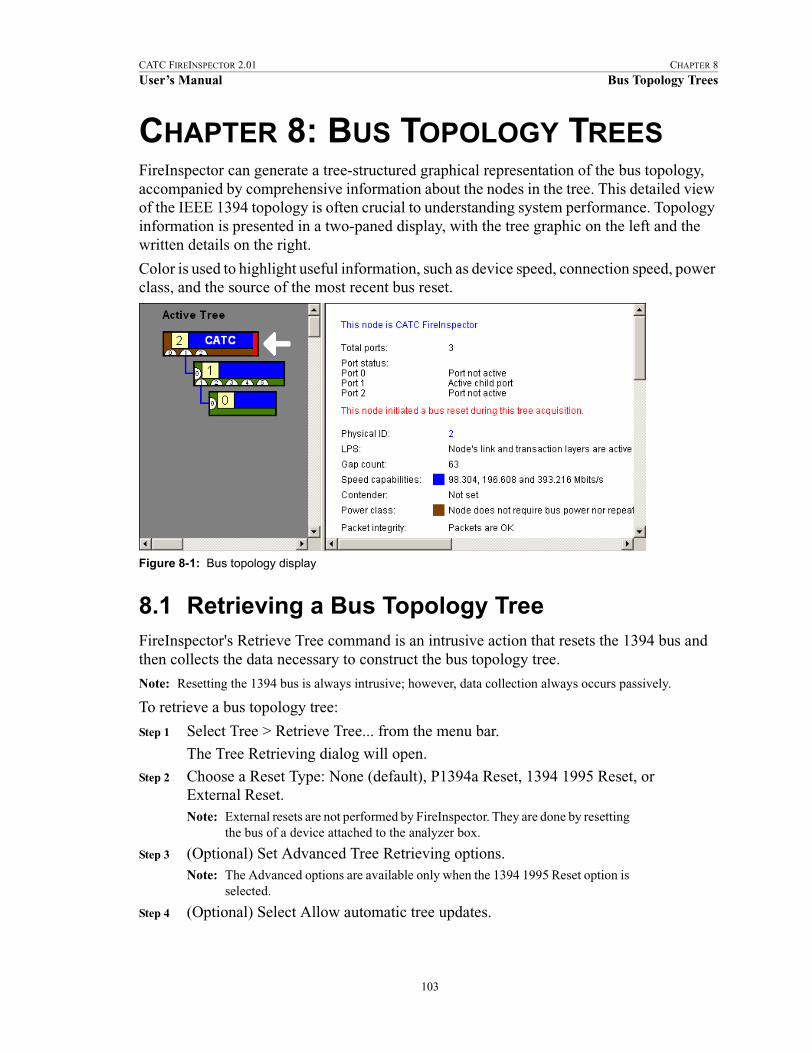
CATC FIREINSPECTOR 2.01 CHAPTER 8
User’s Manual Bus Topology Trees
CHAPTER 8: BUS TOPOLOGY TREESFireInspector can generate a tree-structured graphical representation of the bus topology, accompanied by comprehensive information about the nodes in the tree. This detailed view of the IEEE 1394 topology is often crucial to understanding system performance. Topology information is presented in a two-paned display, with the tree graphic on the left and the written details on the right.
Color is used to highlight useful information, such as device speed, connection speed, power class, and the source of the most recent bus reset.
8.1 Retrieving a Bus Topology TreeFireInspector's Retrieve Tree command is an intrusive action that resets the 1394 bus and then collects the data necessary to construct the bus topology tree.
Note: Resetting the 1394 bus is always intrusive; however, data collection always occurs passively.
To retrieve a bus topology tree:
Step 1 Select Tree > Retrieve Tree... from the menu bar.
The Tree Retrieving dialog will open.
Step 2 Choose a Reset Type: None (default), P1394a Reset, 1394 1995 Reset, or External Reset.Note: External resets are not performed by FireInspector. They are done by resetting
the bus of a device attached to the analyzer box.
Step 3 (Optional) Set Advanced Tree Retrieving options.Note: The Advanced options are available only when the 1394 1995 Reset option is
selected.
Step 4 (Optional) Select Allow automatic tree updates.
Figure 8-1: Bus topology display
103

CATC FIREINSPECTOR 2.01 CHAPTER 8
User’s Manual Bus Topology Trees
Selecting this option enables live updates of the topology display as devices are added to and removed from the bus.
Step 5 Click OK.
The topology information will be collected and presented in the topology display.Note: The topology information is written to a default file named tree.tsf. This file
is overwritten each time a topology tree is retrieved. To keep the information for future reference, you need to save the data to a new file.
8.1.1 Advanced Tree Retrieving Options
Selecting 1394 1995 Reset in the Tree Retrieving dialog grants you access to these Advanced Tree Retrieving options:
• First send PHY configuration packet with gap count equal to:
This option allows you to specify a gap count for a PHY configuration packet that will be sent before the bus reset occurs.
• Force Analyzer to become the root, cycle master, and IRM
This option causes FireInspector to become the root node, cycle master, and IRM when the bus is reset.
Note: Once the analyzer becomes cycle master, it will remain cycle master through a normal 1394 bus reset. However, if a bus reset is forced via the Retrieve Tree dialog or by manually resetting the analyzer, it will no longer assume the role of cycle master.
• Force Analyzer to become Bus manager
This option causes FireInspector to assume the role of bus manager when the bus is reset.
8.2 Viewing Bus TopologyWhen the Retrieve Tree command is used to collect topology information, the data is presented in a two-paned display, with the tree graphic on the left and the written details on the right.
Color is used to highlight useful information, such as device speed, connection speed, power class, and the source of the most recent bus reset. The colors in the tree correspond to colors in the right-hand pane. Nodes in the tree can be expanded and collapsed by clicking on the branch lines.
Clicking on a node in the tree causes its information to be displayed in the right-hand pane, while a white arrow points to the selected node.
The following information is contained in the topology tree:
• Node ID — The node ID is found in the yellow square.
• Port numbers — Port numbers are contained in the white half moons.
104

CATC FIREINSPECTOR 2.01 CHAPTER 8
User’s Manual Bus Topology Trees
• Vendor information — Vendor information, if available, can be displayed in the block to the right of the node ID. FireInspector always identifies itself as “CATC.”
• Speed capabilities — The maximum or active speed is represented by the color of the branches and the vendor information block color. This color can be set via the Color/Format/Hiding tab of the Display Options dialog.
• Power class — The power class is represented by the color along the left and bottom edges of each node.
• Source of the most recent bus reset — The node that most recently reset the bus is indi-cated by a red bar on the right end of the node.
• Tree source — There are four possible sources for the information in a topology tree. They are indicated by a label at the top of the tree display pane. They are:
• Active Tree: This is the topology tree that is currently active on the bus. This means that what is displayed is the tree that was sent after the last bus reset.
• Stale Tree: This is a topology tree that was the active tree at some earlier time and may or may not currently be the active tree. When the tree is stale, you cannot use any of the menus to read config ROM, ping, or do anything else to the remote devices because the device numbers that are displayed may no longer be correct. A stale tree is most often caused by a bus reset that is performed without automatic tree updating enabled.
• Tree saved in tsf file: This is a topology tree that was loaded from a saved tree file.
• Tree reconstructed from Trace file: This is a topology tree that was reconstructed from the self-ID packets in a Trace file.
• Other information — additional information may be represented by colored bars on the right end of the node. You'll find the information in the right-hand pane, color-coded to match the bars.
Bus Topology Tree Menus can be accessed by right- or left-clicking on a node or port number, or by right-clicking anywhere within the topology display.
8.3 Bus Topology Tree MenusThere are two pop-up menus available when working with bus topology trees. One is accessed by left-clicking on a node or a port number on the node, the other by right-clicking anywhere within the topology display.
8.3.1 Topology Context Menu
The topology context menu provides access to node- and port-specific commands. Access the topology context menu by left-clicking on a node or a port number on the node. When it is accessed by left-clicking on a port number, only the port-specific commands are available, and they will be executed for that port.
105

CATC FIREINSPECTOR 2.01 CHAPTER 8
User’s Manual Bus Topology Trees
• Name the node: If Vendor Information has been collected for the node, this command opens the Node Name dialog. Type a name or description for the node and press OK. The information that you entered will be displayed on the node. This information is also appended to the file VendorId.ini (see “Vendor Information” on page 110 for more information about this file).
• Force the node to be the next Root: Sends a force root packet to tell the node to set its force root bit. The node will become root after the next bus reset.
• Get node vendor info: Reads the Node_Vendor_ID from the configuration ROM. For more information, please see “Vendor Information” on page 110.
• Ping this Node: Sends a ping packet to the node.• Read Configuration ROM: Opens the Configuration ROM dialog.
• Read Port Status > Port #: Reads the port status register page for the specified port.
• Suspend Port > Port #: Sends a suspend command packet to the specified port.
• Resume Port > Port #: Sends a resume port command packet to the specified port.
• Disable Port > Port #: Sends a disable port command packet to the specified port.
• Enable Port > Port #: Sends an enable port command packet to the specified port.
• Clear Port's fault bit > Port #: Sends a clear the port's Fault bit to zero command packet to the specified port.
8.3.2 Tree View Menu
The Tree view pop-up menu is accessed by right-clicking anywhere within the topology display. It provides access to these general tree commands:
• Retrieve tree: Opens the Tree Retrieving dialog.
• Read Configuration ROM: Opens the Configuration ROM dialog.
• Resume All Ports: Sends a resume command packet to all ports.
• Gather All Vendor Info: Reads the Node_Vendor_ID for all of the nodes on the tree.
8.4 Reconstructing Bus TopologyFireInspector can reconstruct bus topology from the data in a Trace file and show the information in the topology display.
To reconstruct bus topology from a Trace:
Step 1 Left-click on the PHY Self-ID field of a packet.
A menu will pop up.
Step 2 Select Reconstruct Topology Tree from the menu.The bus topology information derived from the data in the Trace will be displayed.
106
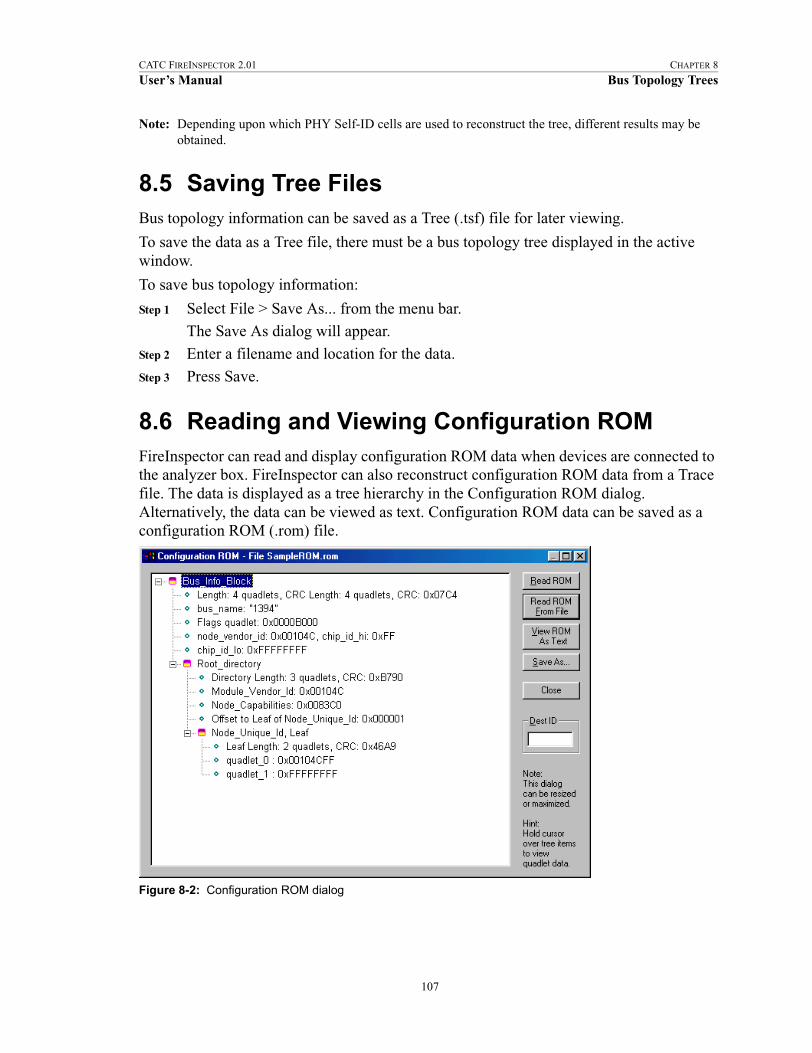
CATC FIREINSPECTOR 2.01 CHAPTER 8
User’s Manual Bus Topology Trees
Note: Depending upon which PHY Self-ID cells are used to reconstruct the tree, different results may be obtained.
8.5 Saving Tree FilesBus topology information can be saved as a Tree (.tsf) file for later viewing.
To save the data as a Tree file, there must be a bus topology tree displayed in the active window.
To save bus topology information:
Step 1 Select File > Save As... from the menu bar.The Save As dialog will appear.
Step 2 Enter a filename and location for the data.
Step 3 Press Save.
8.6 Reading and Viewing Configuration ROMFireInspector can read and display configuration ROM data when devices are connected to the analyzer box. FireInspector can also reconstruct configuration ROM data from a Trace file. The data is displayed as a tree hierarchy in the Configuration ROM dialog. Alternatively, the data can be viewed as text. Configuration ROM data can be saved as a configuration ROM (.rom) file.
Figure 8-2: Configuration ROM dialog
107

CATC FIREINSPECTOR 2.01 CHAPTER 8
User’s Manual Bus Topology Trees
8.6.1 Reading Configuration ROM From a Device
To read configuration ROM from a device:
Step 1 Connect a device to a port on the analyzer box.
Step 2 Select Tree > Read Configuration ROM... from the menu bar.
The Configuration ROM dialog will open, displaying the config ROM data for the device.Note: If there is more than one device on the bus, you'll need to enter the node ID
for a specific device in the Destination ID box in order to read its configuration ROM.
Configuration ROM data can also be read from a specific node in a bus topology tree.
To read configuration ROM from a bus topology tree:
Step 1 Right-click on a node in the tree.
A menu will pop up.
Step 2 Select Read Configuration ROM... from the menu.
The Configuration ROM dialog will open, displaying the configuration ROM data for the selected node.
8.6.2 Reading Configuration ROM From a File
You can open and display a Config ROM (.rom) file in the Configuration ROM dialog.
To read configuration ROM from a file:
Step 1 Select Tree > Read Configuration ROM from the menu bar.
The Configuration ROM dialog will open.
Step 2 Click the Read ROM From File button.
The Open dialog will appear.
Step 3 Navigate to the file you wish to view and click Open.Step 4 FireInspector will read the data from the file and display it in the
Configuration ROM dialog.
8.6.3 Reconstructing Configuration ROM
If a Trace file contains configuration ROM data, FireInspector can read the data, reconstruct it, and display it in the Configuration ROM dialog.
To reconstruct configuration ROM from a Trace:
Step 1 Left-click on the dest_offset field of a ReadDQ packet.A menu will pop up.
Step 2 Select Reconstruct Configuration ROM from the menu.
The Configuration ROM dialog will open, displaying the configuration ROM derived from the packets in the Trace.
108
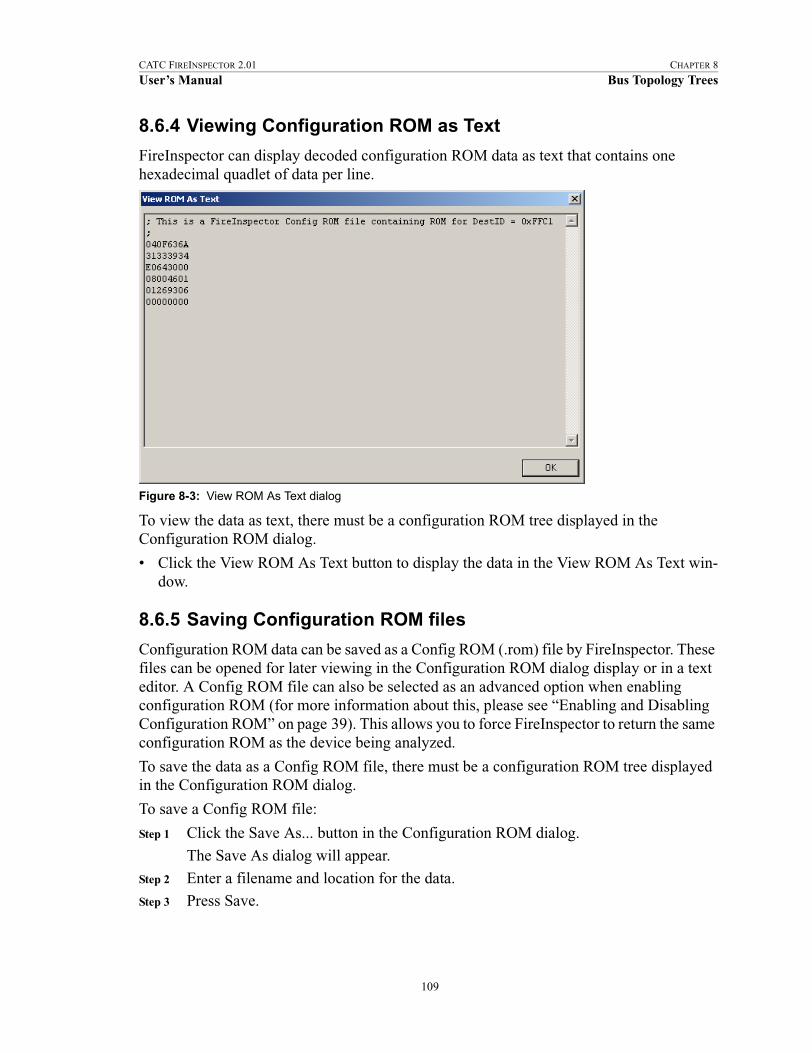
CATC FIREINSPECTOR 2.01 CHAPTER 8
User’s Manual Bus Topology Trees
8.6.4 Viewing Configuration ROM as Text
FireInspector can display decoded configuration ROM data as text that contains one hexadecimal quadlet of data per line.
To view the data as text, there must be a configuration ROM tree displayed in the Configuration ROM dialog.
• Click the View ROM As Text button to display the data in the View ROM As Text win-dow.
8.6.5 Saving Configuration ROM files
Configuration ROM data can be saved as a Config ROM (.rom) file by FireInspector. These files can be opened for later viewing in the Configuration ROM dialog display or in a text editor. A Config ROM file can also be selected as an advanced option when enabling configuration ROM (for more information about this, please see “Enabling and Disabling Configuration ROM” on page 39). This allows you to force FireInspector to return the same configuration ROM as the device being analyzed.
To save the data as a Config ROM file, there must be a configuration ROM tree displayed in the Configuration ROM dialog.
To save a Config ROM file:
Step 1 Click the Save As... button in the Configuration ROM dialog.
The Save As dialog will appear.
Step 2 Enter a filename and location for the data.
Step 3 Press Save.
Figure 8-3: View ROM As Text dialog
109
CATC FIREINSPECTOR 2.01 CHAPTER 8
User’s Manual Bus Topology Trees
8.7 Vendor InformationA device's vendor information is stored in the file VendorId.ini, which is located in the directory that contains the FireInspector executable. Information can be added to the file manually, or FireInspector can add it automatically when a name is assigned to a node in a bus topology tree.
VendorId.ini contains data in standard Windows configuration file format. Vendor ID data is in the [VendorID] section of the file. The following instructions tell how to format data in the file.
This is an example Node_Vendor_Id table that is used by FireInspector to match a node's vendor ID to a user-chosen text string (node name).
Format:
111111:22:33333333=description
Description:
• 111111 represents node_vendor_id. It should be in hexadecimal and is case insensitive.
• 22 represents chip_id_hi. It should be in hexadecimal and is case insensitive.
• 33333333 represents chip_id_lo. It should be in hexadecimal and is case insensitive.
• 'description' represents the node name. It is displayed in a bus topology tree node when the command to gather vendor information is issued. Everything to the right of the equal sign (=) is considered part of the description. If present, leading and trailing quotation marks are stripped from the description.
Any digit in node_vendor_id can be replaced with an 'x' or 'X' wildcard. Those nybbles will not be considered when FireInspector looks for a node's description. FireInspector sorts the lines internally so that the most specific records are examined first, followed by increasingly generic records.
Comments in the file are delimited by a semicolon (;) character. Everything to the right of a ';' character is considered a comment and is ignored. If a ';' appears in a description, everything to its right is considered a comment, but if the description is changed from within FireInspector, the comment won't be written back to the file.
FireInspector previously used a different file format for the Vendor ID file. If a Vendor ID file in the old format is present in the directory, it will be automatically converted to the new format at program start. The old file will be renamed as “VendorID.000” (or “VendorID.001,” etc., if other old files exist).
110

CATC FIREINSPECTOR 2.01 CHAPTER 9
User’s Manual Reports
CHAPTER 9: REPORTSFireInspector offers several tools for compiling specific information from Trace files.
9.1 File InformationThe File Information report provides basic information about the active file. Included in the report for traffic recording (.fdb) Traces are the file's name, Trace file comment, recording channel, number of packets recorded, trigger packet, application and analyzer details, number of markers, recording options settings, and licensing information for the FireInspector unit that was used to make the recording. The report may also include, if applicable, details about whether the file was saved as a portion of another file, and whether the file was converted from an older file format. Reports for converted files don’t contain recording options information.
File Information reports for traffic generation (.txg) Traces include the filename, comment, number of packets, and number of markers.
To access the File Information report:
Step 1 Select Report > File Information from the menu bar or click the File Information icon on the toolbar.
Figure 9-1: File Information report
111
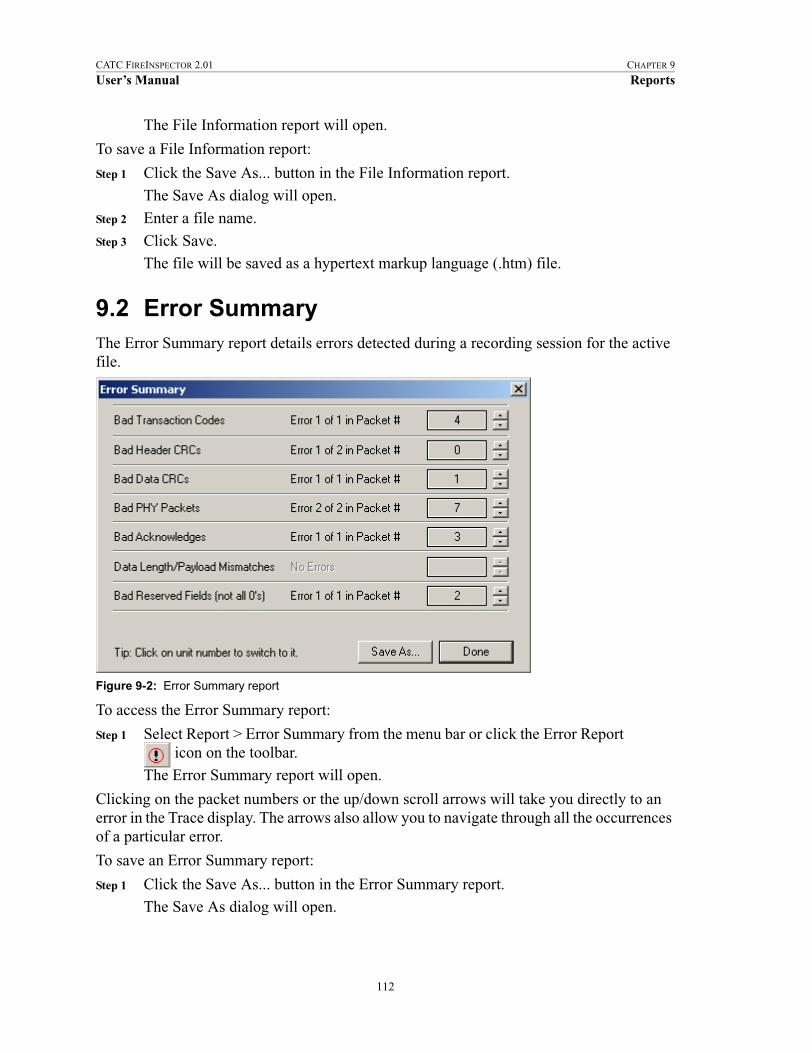
CATC FIREINSPECTOR 2.01 CHAPTER 9
User’s Manual Reports
The File Information report will open.
To save a File Information report:
Step 1 Click the Save As... button in the File Information report.The Save As dialog will open.
Step 2 Enter a file name.
Step 3 Click Save.The file will be saved as a hypertext markup language (.htm) file.
9.2 Error SummaryThe Error Summary report details errors detected during a recording session for the active file.
To access the Error Summary report:
Step 1 Select Report > Error Summary from the menu bar or click the Error Report icon on the toolbar.
The Error Summary report will open.
Clicking on the packet numbers or the up/down scroll arrows will take you directly to an error in the Trace display. The arrows also allow you to navigate through all the occurrences of a particular error.
To save an Error Summary report:
Step 1 Click the Save As... button in the Error Summary report.The Save As dialog will open.
Figure 9-2: Error Summary report
112
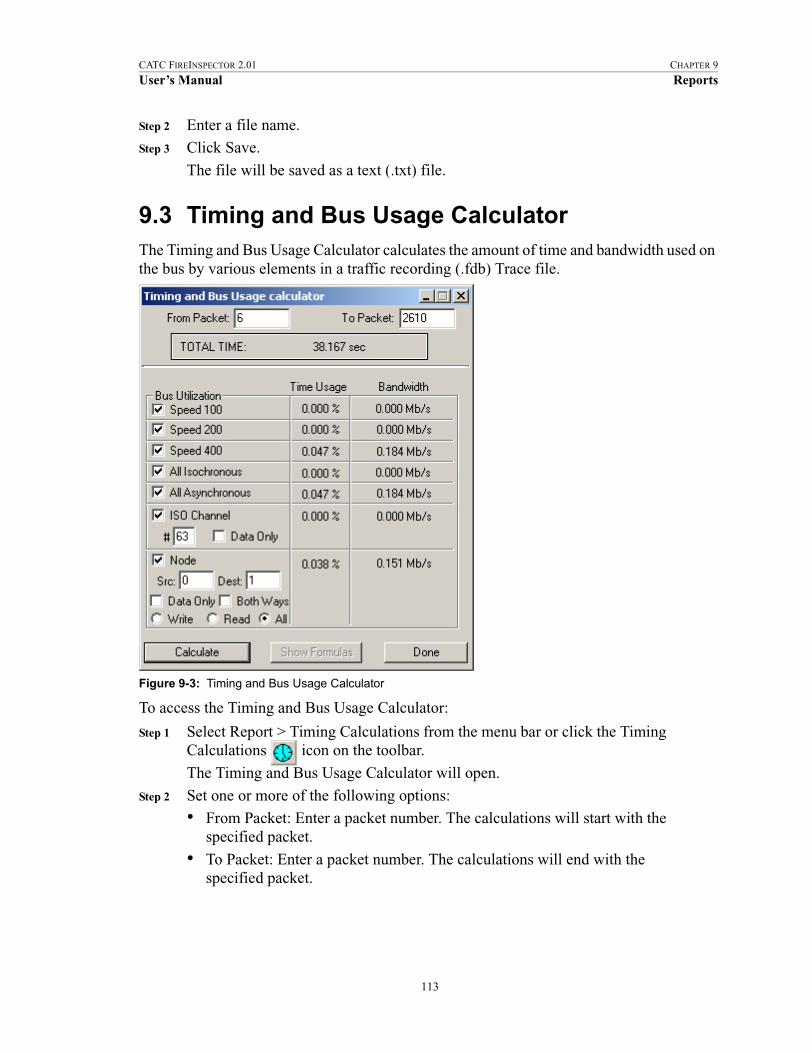
CATC FIREINSPECTOR 2.01 CHAPTER 9
User’s Manual Reports
Step 2 Enter a file name.Step 3 Click Save.
The file will be saved as a text (.txt) file.
9.3 Timing and Bus Usage CalculatorThe Timing and Bus Usage Calculator calculates the amount of time and bandwidth used on the bus by various elements in a traffic recording (.fdb) Trace file.
To access the Timing and Bus Usage Calculator:
Step 1 Select Report > Timing Calculations from the menu bar or click the Timing Calculations icon on the toolbar.
The Timing and Bus Usage Calculator will open.
Step 2 Set one or more of the following options:• From Packet: Enter a packet number. The calculations will start with the
specified packet.
• To Packet: Enter a packet number. The calculations will end with the specified packet.
Figure 9-3: Timing and Bus Usage Calculator
113
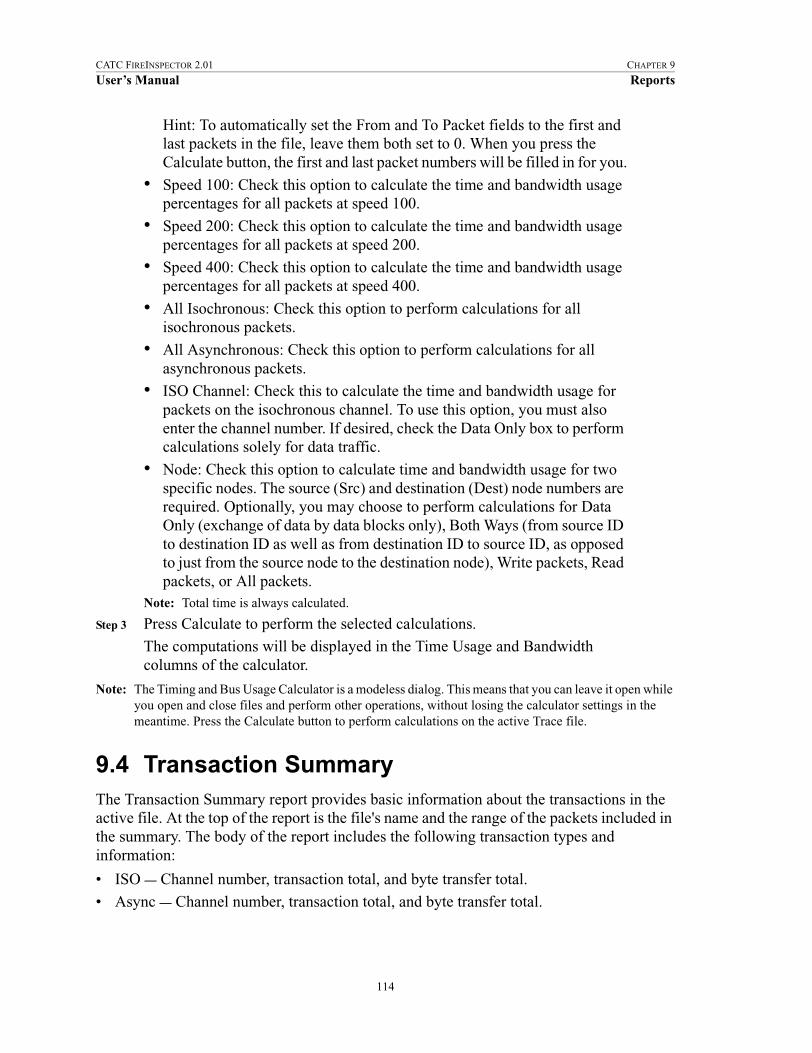
CATC FIREINSPECTOR 2.01 CHAPTER 9
User’s Manual Reports
Hint: To automatically set the From and To Packet fields to the first and last packets in the file, leave them both set to 0. When you press the Calculate button, the first and last packet numbers will be filled in for you.
• Speed 100: Check this option to calculate the time and bandwidth usage percentages for all packets at speed 100.
• Speed 200: Check this option to calculate the time and bandwidth usage percentages for all packets at speed 200.
• Speed 400: Check this option to calculate the time and bandwidth usage percentages for all packets at speed 400.
• All Isochronous: Check this option to perform calculations for all isochronous packets.
• All Asynchronous: Check this option to perform calculations for all asynchronous packets.
• ISO Channel: Check this to calculate the time and bandwidth usage for packets on the isochronous channel. To use this option, you must also enter the channel number. If desired, check the Data Only box to perform calculations solely for data traffic.
• Node: Check this option to calculate time and bandwidth usage for two specific nodes. The source (Src) and destination (Dest) node numbers are required. Optionally, you may choose to perform calculations for Data Only (exchange of data by data blocks only), Both Ways (from source ID to destination ID as well as from destination ID to source ID, as opposed to just from the source node to the destination node), Write packets, Read packets, or All packets.
Note: Total time is always calculated.
Step 3 Press Calculate to perform the selected calculations.
The computations will be displayed in the Time Usage and Bandwidth columns of the calculator.
Note: The Timing and Bus Usage Calculator is a modeless dialog. This means that you can leave it open while you open and close files and perform other operations, without losing the calculator settings in the meantime. Press the Calculate button to perform calculations on the active Trace file.
9.4 Transaction SummaryThe Transaction Summary report provides basic information about the transactions in the active file. At the top of the report is the file's name and the range of the packets included in the summary. The body of the report includes the following transaction types and information:
• ISO — Channel number, transaction total, and byte transfer total.• Async — Channel number, transaction total, and byte transfer total.
114
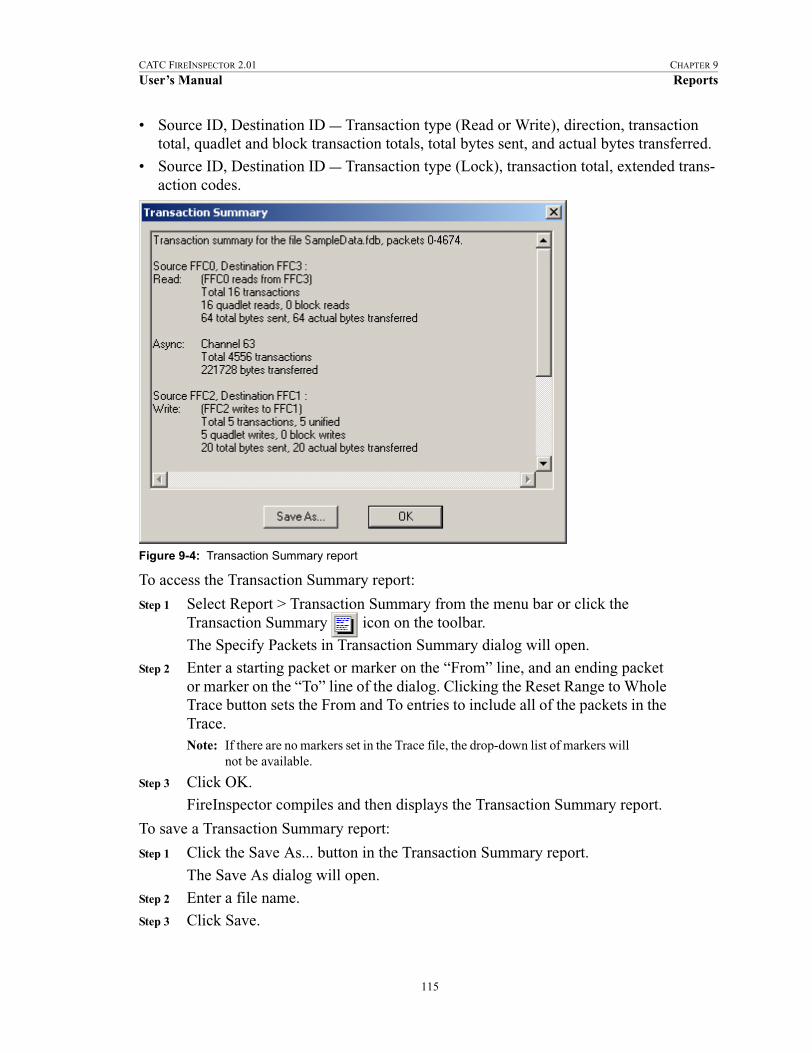
CATC FIREINSPECTOR 2.01 CHAPTER 9
User’s Manual Reports
• Source ID, Destination ID — Transaction type (Read or Write), direction, transaction total, quadlet and block transaction totals, total bytes sent, and actual bytes transferred.
• Source ID, Destination ID — Transaction type (Lock), transaction total, extended trans-action codes.
To access the Transaction Summary report:
Step 1 Select Report > Transaction Summary from the menu bar or click the Transaction Summary icon on the toolbar.
The Specify Packets in Transaction Summary dialog will open.
Step 2 Enter a starting packet or marker on the “From” line, and an ending packet or marker on the “To” line of the dialog. Clicking the Reset Range to Whole Trace button sets the From and To entries to include all of the packets in the Trace.Note: If there are no markers set in the Trace file, the drop-down list of markers will
not be available.
Step 3 Click OK.
FireInspector compiles and then displays the Transaction Summary report.
To save a Transaction Summary report:
Step 1 Click the Save As... button in the Transaction Summary report.
The Save As dialog will open.
Step 2 Enter a file name.
Step 3 Click Save.
Figure 9-4: Transaction Summary report
115
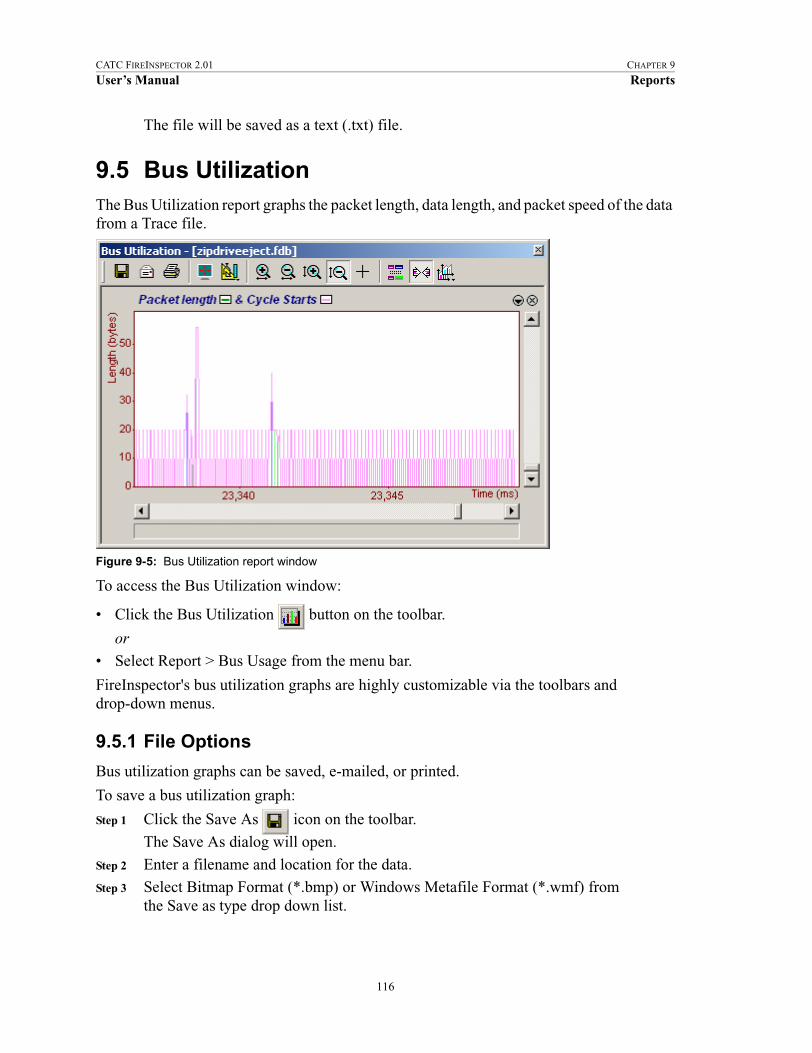
CATC FIREINSPECTOR 2.01 CHAPTER 9
User’s Manual Reports
The file will be saved as a text (.txt) file.
9.5 Bus UtilizationThe Bus Utilization report graphs the packet length, data length, and packet speed of the data from a Trace file.
To access the Bus Utilization window:
• Click the Bus Utilization button on the toolbar.
or
• Select Report > Bus Usage from the menu bar.
FireInspector's bus utilization graphs are highly customizable via the toolbars and drop-down menus.
9.5.1 File Options
Bus utilization graphs can be saved, e-mailed, or printed.
To save a bus utilization graph:
Step 1 Click the Save As icon on the toolbar.
The Save As dialog will open.
Step 2 Enter a filename and location for the data.Step 3 Select Bitmap Format (*.bmp) or Windows Metafile Format (*.wmf) from
the Save as type drop down list.
Figure 9-5: Bus Utilization report window
116

CATC FIREINSPECTOR 2.01 CHAPTER 9
User’s Manual Reports
Step 4 Press Save.
Note: The visible portion of the bus utilization graph will be saved. If there is more than one graph open in the Bus Utilization window, the visible portion of each graph will be saved in the file.
To e-mail a bus utilization graph:
Step 1 Click the E-mail icon on the toolbar.FireInspector makes the graph(s) into a bitmap file named Bus utilization.bmp and attaches it to an e-mail message in the default e-mail program. The message subject is filled in as “Bus utilization for Trace file 'source file name'.”
Step 2 Fill in message recipient information and send the message.
To print a bus utilization graph:
Step 1 Click the Print icon on the toolbar.
The visible portion of the graph(s) will be printed. If there is more than one graph open, the visible portion of each graph will printed on its own page.
9.5.2 Display Settings
Bus utilization graph display can be customized using the toolbar commands and the Graph Area Menu.
Toolbar Commands
View Settings Menu
The Bus Utilization View Settings menu contains settings to configure the display of all graphs within the display window. The view settings are associated with the active Trace file, allowing you to create different settings for individual files.
Button Action
Maximizes or restores original size of the Bus Utilization window.
Opens the View Settings menu.
Zooms in the display horizontally.
Zooms out the display horizontally.
Zooms in the display vertically.
Zooms out the display vertically.
Zooms a selected vertical or horizontal portion of the display.
117

CATC FIREINSPECTOR 2.01 CHAPTER 9
User’s Manual Reports
To access the menu, click the View Settings icon on the Bus Utilization toolbar.
View Options
The View options dialog in the Bus Utilization window is used to customize the font and color settings of the graphs.
Table 9-1: View Settings Menu
Command Descripton
Orient horizontally/vertically
Positions the Time axis of the graphs horizontally or vertically.
Tile horizontally/vertically
Positions the graph displays side by side or one atop another.
Show markers Displays or hides the position of markers in the graph. Markers are shown as a red dashed line in a graph. At the top of the dashed line is a small options arrow. Placing the mouse pointer over the arrow will display a tooltip that contains the text of the marker comment, if any.
Show plumb line Shows or hides the perpendicular plumb line that is visible when dragging the mouse pointer over the graph area.
Status > Bar, Tooltip, or None
Displays status information in the status bar, as a tooltip, or not at all. When enabled, you can view status information by positioning the mouse pointer anywhere in the graph area. Information associated with that point on the graph will be displayed on the status bar or as a tooltip.
Grid lines > Both Axes, X Axis, Y Axis, or No Grid
Defines the display of grid lines in the graphs.
Grid on top When enabled, grid lines will overlay the bars/lines of the graphs.
Fonts and Colors Opens the View Options dialog.
Figure 9-6: View Options dialog
118
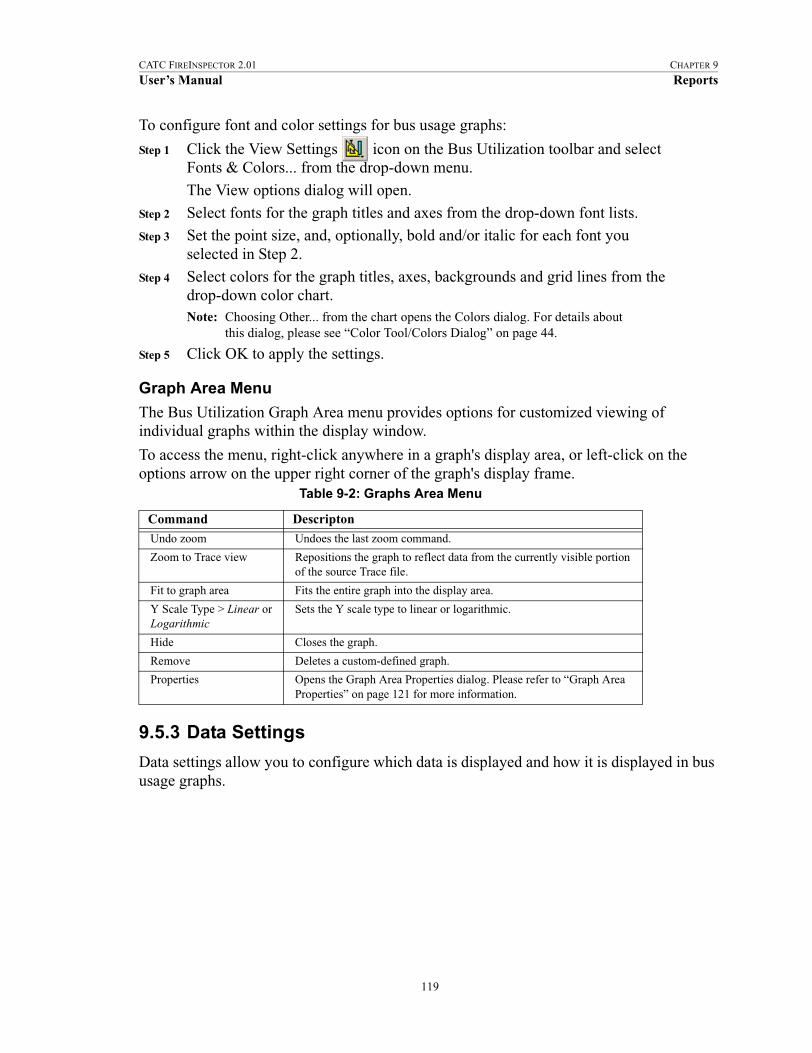
CATC FIREINSPECTOR 2.01 CHAPTER 9
User’s Manual Reports
To configure font and color settings for bus usage graphs:
Step 1 Click the View Settings icon on the Bus Utilization toolbar and select Fonts & Colors... from the drop-down menu.
The View options dialog will open.
Step 2 Select fonts for the graph titles and axes from the drop-down font lists.Step 3 Set the point size, and, optionally, bold and/or italic for each font you
selected in Step 2.
Step 4 Select colors for the graph titles, axes, backgrounds and grid lines from the drop-down color chart.Note: Choosing Other... from the chart opens the Colors dialog. For details about
this dialog, please see “Color Tool/Colors Dialog” on page 44.
Step 5 Click OK to apply the settings.
Graph Area Menu
The Bus Utilization Graph Area menu provides options for customized viewing of individual graphs within the display window.
To access the menu, right-click anywhere in a graph's display area, or left-click on the options arrow on the upper right corner of the graph's display frame.
9.5.3 Data Settings
Data settings allow you to configure which data is displayed and how it is displayed in bus usage graphs.
Table 9-2: Graphs Area Menu
Command Descripton
Undo zoom Undoes the last zoom command.
Zoom to Trace view Repositions the graph to reflect data from the currently visible portion of the source Trace file.
Fit to graph area Fits the entire graph into the display area.
Y Scale Type > Linear or Logarithmic
Sets the Y scale type to linear or logarithmic.
Hide Closes the graph.
Remove Deletes a custom-defined graph.
Properties Opens the Graph Area Properties dialog. Please refer to “Graph Area Properties” on page 121 for more information.
119
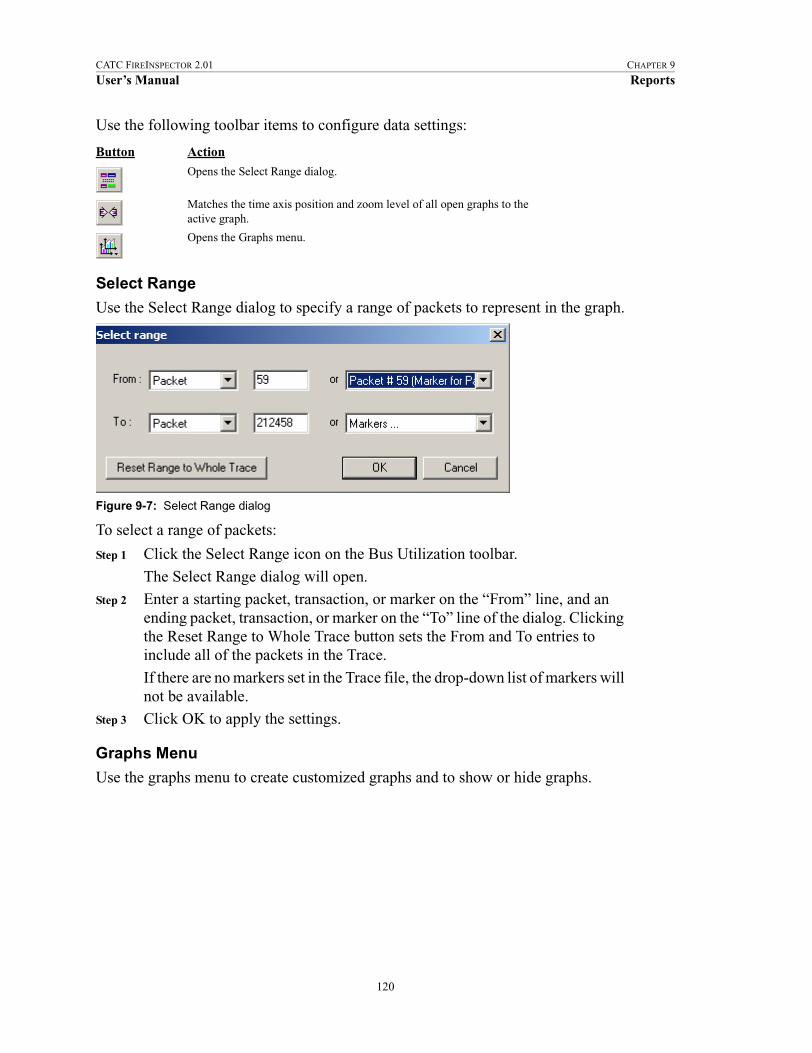
CATC FIREINSPECTOR 2.01 CHAPTER 9
User’s Manual Reports
Use the following toolbar items to configure data settings:
Select Range
Use the Select Range dialog to specify a range of packets to represent in the graph.
To select a range of packets:
Step 1 Click the Select Range icon on the Bus Utilization toolbar.
The Select Range dialog will open.Step 2 Enter a starting packet, transaction, or marker on the “From” line, and an
ending packet, transaction, or marker on the “To” line of the dialog. Clicking the Reset Range to Whole Trace button sets the From and To entries to include all of the packets in the Trace.
If there are no markers set in the Trace file, the drop-down list of markers will not be available.
Step 3 Click OK to apply the settings.
Graphs Menu
Use the graphs menu to create customized graphs and to show or hide graphs.
Button Action
Opens the Select Range dialog.
Matches the time axis position and zoom level of all open graphs to the active graph.
Opens the Graphs menu.
Figure 9-7: Select Range dialog
120
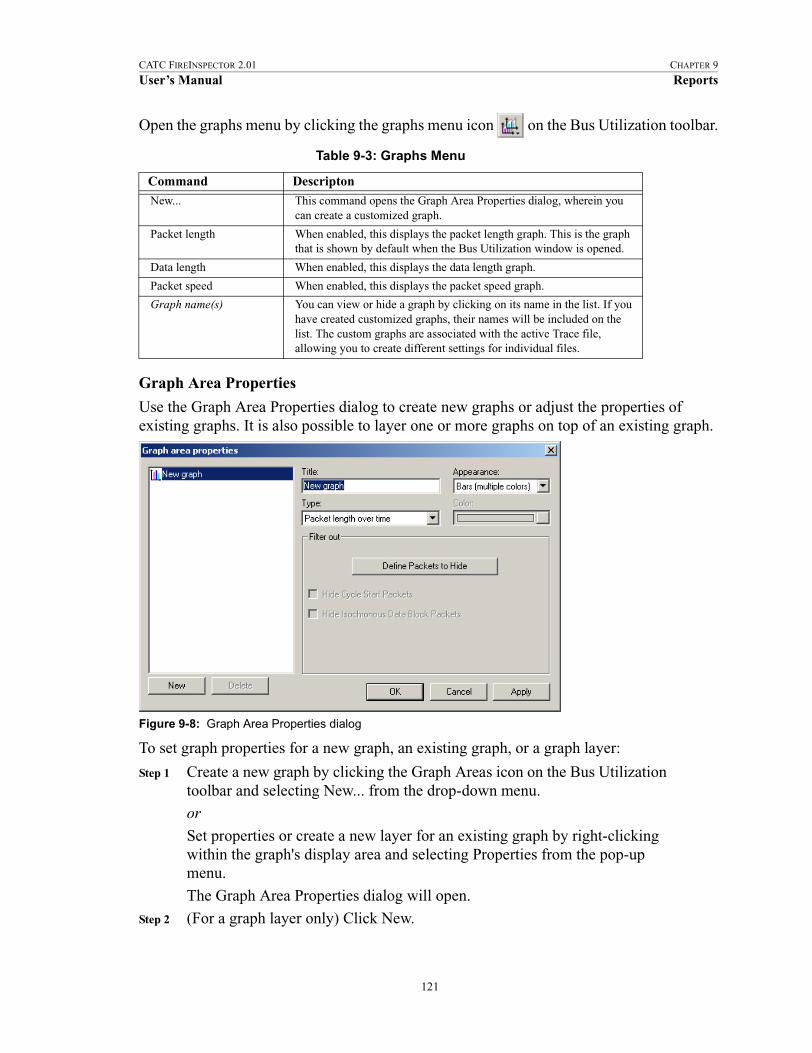
CATC FIREINSPECTOR 2.01 CHAPTER 9
User’s Manual Reports
Open the graphs menu by clicking the graphs menu icon on the Bus Utilization toolbar.
Graph Area Properties
Use the Graph Area Properties dialog to create new graphs or adjust the properties of existing graphs. It is also possible to layer one or more graphs on top of an existing graph.
To set graph properties for a new graph, an existing graph, or a graph layer:
Step 1 Create a new graph by clicking the Graph Areas icon on the Bus Utilization toolbar and selecting New... from the drop-down menu.
or
Set properties or create a new layer for an existing graph by right-clicking within the graph's display area and selecting Properties from the pop-up menu.
The Graph Area Properties dialog will open.
Step 2 (For a graph layer only) Click New.
Table 9-3: Graphs Menu
Command Descripton
New... This command opens the Graph Area Properties dialog, wherein you can create a customized graph.
Packet length When enabled, this displays the packet length graph. This is the graph that is shown by default when the Bus Utilization window is opened.
Data length When enabled, this displays the data length graph.
Packet speed When enabled, this displays the packet speed graph.
Graph name(s) You can view or hide a graph by clicking on its name in the list. If you have created customized graphs, their names will be included on the list. The custom graphs are associated with the active Trace file, allowing you to create different settings for individual files.
Figure 9-8: Graph Area Properties dialog
121

CATC FIREINSPECTOR 2.01 CHAPTER 9
User’s Manual Reports
A new graph icon will appear in the list of graphs on the left side of the dialog.
Step 3 Enter or edit the graph's name in the Title box.
Step 4 (For new graphs only) Select a graph type from the Type drop-down list.Step 5 Choose an appearance setting from the Appearance drop-down list:
• Bars (multiple colors): A bar graph with multiple colors uses the color definitions from the Trace file, so that the colors in the graph correspond to the colors in the Trace.
• Bars (single color): A bar graph with a single color uses the color selected in the Color chart.
• Line: A line graph uses the color selected in the Color chart.
Step 6 (For single color bar graphs and line graphs only) Select a color from the drop-down color chart.Note: Choosing Other... from the chart opens the Colors dialog. For details about
this dialog, please see “Color Tool/Colors Dialog” on page 44.
Step 7 (Optional) Configure filtering options in the Filter Out section of the dialog.
• Define Packets to Hide: Opens the Define Packets to Hide dialog.
• Hide Cycle Start Packets: When this option is checked, cycle start packets will be omitted from the graph.
• Hide Isochronous Data Block Packets: When this option is checked, isochronous data block packets will be omitted from the graph.
Step 8 Click OK to apply the changes and close the Graph Area Properties dialog
or
Click Apply to apply the changes and leave the Graph Area Properties dialog open.
Define Packets to Hide
Use the Define Packets to Hide dialog to specify packets to exclude from a bus usage graph.
To define packets:
Step 1 Click Define Packets to Hide in the Graph Area Properties dialog.
The Define Packets to Hide dialog will open.Step 2 Select an event type in the Hide list.
Note: The Hide list contains only those event types that are visible in the active Trace file. Event types that are hidden or not contained in the Trace are grayed out in the list.
The Event Groups list will display the event groups for the type of event you have selected.
Step 3 Select an event group from the Event Groups list.
122
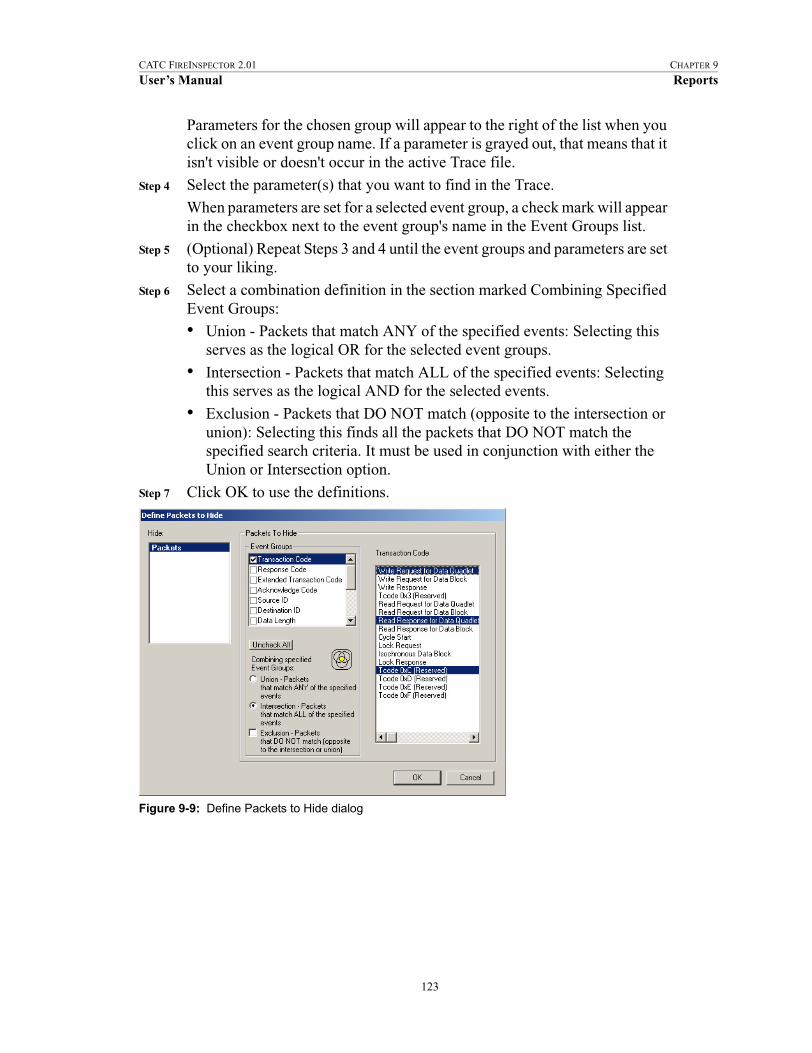
CATC FIREINSPECTOR 2.01 CHAPTER 9
User’s Manual Reports
Parameters for the chosen group will appear to the right of the list when you click on an event group name. If a parameter is grayed out, that means that it isn't visible or doesn't occur in the active Trace file.
Step 4 Select the parameter(s) that you want to find in the Trace. When parameters are set for a selected event group, a check mark will appear in the checkbox next to the event group's name in the Event Groups list.
Step 5 (Optional) Repeat Steps 3 and 4 until the event groups and parameters are set to your liking.
Step 6 Select a combination definition in the section marked Combining Specified Event Groups:• Union - Packets that match ANY of the specified events: Selecting this
serves as the logical OR for the selected event groups.
• Intersection - Packets that match ALL of the specified events: Selecting this serves as the logical AND for the selected events.
• Exclusion - Packets that DO NOT match (opposite to the intersection or union): Selecting this finds all the packets that DO NOT match the specified search criteria. It must be used in conjunction with either the Union or Intersection option.
Step 7 Click OK to use the definitions.
Figure 9-9: Define Packets to Hide dialog
123

CATC FIREINSPECTOR 2.01 CHAPTER 9
User’s Manual Reports
124
CATC FIREINSPECTOR 2.01 CHAPTER 10
User’s Manual Printing and Exporting Files
CHAPTER 10: PRINTING AND EXPORTING FILESFireInspector can print Trace (.fdb and .txg) files, tree (.tsf) files, and bus utilization graph (.bmp) files, and can export the contents of Trace files.
10.1 Printing FilesThe following file types can be printed from FireInspector: Trace files, bus topology tree files, and bus utilization graphs.
10.1.1 Print a Trace file
Step 1 Select File > Print from the menu bar or click the Print icon on the toolbar.
The Print Packets/Transaction dialog will open.
Step 2 Enter a starting packet or transaction on the “From” line, and an ending packet or transaction on the “To” line of the dialog. Clicking the Reset Range to Whole Trace button sets the From and To entries to include all of the packets in the Trace.Note: If there are no transactions in the Trace file, the drop-down list of transactions
will not be available.
Step 3 Click OK to print specified range.
10.1.2 Print a tree file
Step 1 Select File > Print from the menu bar or click the Print icon on the toolbar.
The Print Topology Tree dialog will appear.
Step 2 Click Yes to print the file.
10.1.3 Print a bus utilization graph
Step 1 Click the Print icon on the bus utilization toolbar.
The visible portion of the graph(s) will be printed. If there is more than one graph open, the visible portion of each graph will printed on its own page.
10.2 Exporting FilesFireInspector can export the contents of traffic recording Trace (.fdb) files to four different formats:
• Packet (Trace) view format (.txt)
125

CATC FIREINSPECTOR 2.01 CHAPTER 10
User’s Manual Printing and Exporting Files
• Traffic generation file format (.txg) • Comma separated value format (.csv)
• Data format (.txt or .dat)
10.2.1 Export to Packet View Format
This option saves a Trace (.fdb) file as a text (.txt) file in packet view format. This means that the file will contain the text from the fields in the Trace file.
To export a Trace file to packet view format:
Step 1 Select File > Export > Packets to Text (Packet View Format).The Export Packets/Transactions to text dialog will appear.
Step 2 Define the range of packets that you want to export by entering packet numbers or by selecting starting and ending markers from the drop down lists.
Step 3 Click OK.
The Save Packets/Transactions in Text Format... dialog will appear.
Step 4 Enter a file name. You may also browse to a new directory, if desired.
Step 5 Click Save to save the data.
10.2.2 Export to Generator Text File Format
This option saves a Trace (.fdb) file as a traffic generation (.txg) file.
To export a Trace file to generator text file format:
Step 1 Select File > Export > Packets to Text (Generator Text File Format).
The Export Packets/Transactions to generation format dialog will appear.
Step 2 Define the range of packets that you want to export by entering packet numbers or by selecting starting and ending markers from the drop down lists.
Step 3 Click OK.
The Save in TXG Format... dialog will appear.
Step 4 Enter a file name. You may also browse to a new directory, if desired.Step 5 Click Save to save the data.
10.2.3 Export to Comma Separated Value Format
This option saves a Trace (.fdb) file as a comma separated value (.csv) file.
To export a Trace file to comma separated value format:
Step 1 Select File > Export > Packets to Text (Comma Separated Values).
The Export Packets/Transactions to csv-text dialog will appear.
126
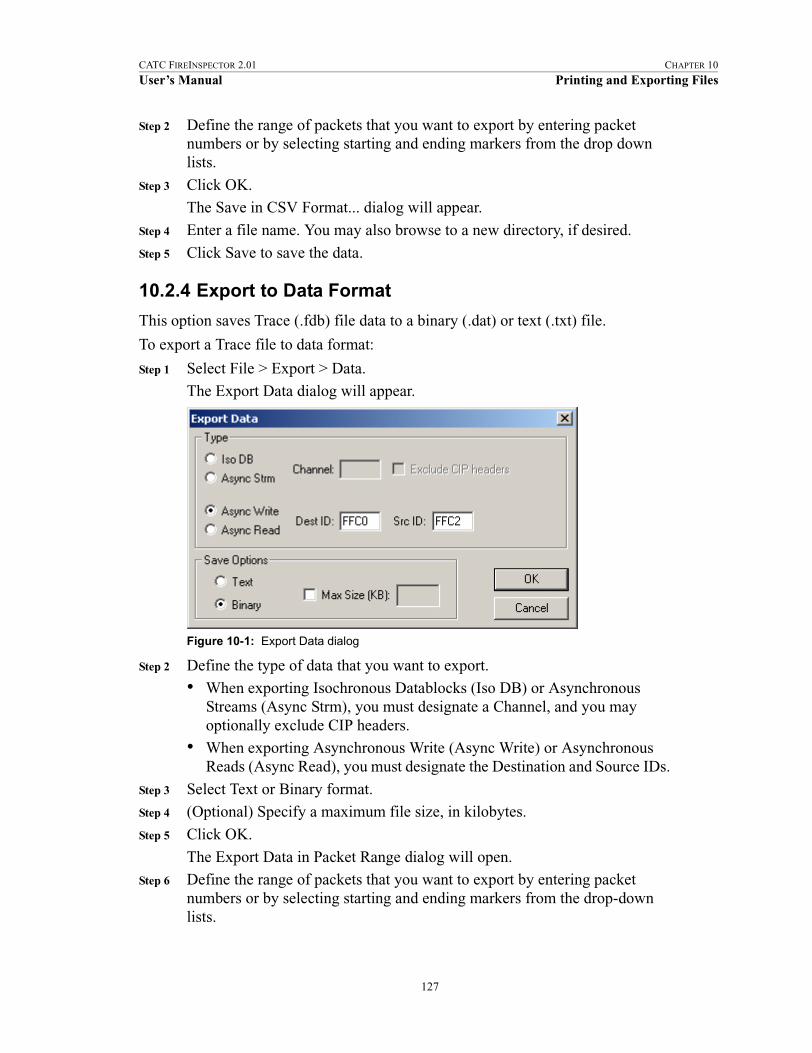
CATC FIREINSPECTOR 2.01 CHAPTER 10
User’s Manual Printing and Exporting Files
Step 2 Define the range of packets that you want to export by entering packet numbers or by selecting starting and ending markers from the drop down lists.
Step 3 Click OK.The Save in CSV Format... dialog will appear.
Step 4 Enter a file name. You may also browse to a new directory, if desired.
Step 5 Click Save to save the data.
10.2.4 Export to Data Format
This option saves Trace (.fdb) file data to a binary (.dat) or text (.txt) file.
To export a Trace file to data format:
Step 1 Select File > Export > Data.
The Export Data dialog will appear.
Step 2 Define the type of data that you want to export.• When exporting Isochronous Datablocks (Iso DB) or Asynchronous
Streams (Async Strm), you must designate a Channel, and you may optionally exclude CIP headers.
• When exporting Asynchronous Write (Async Write) or Asynchronous Reads (Async Read), you must designate the Destination and Source IDs.
Step 3 Select Text or Binary format.Step 4 (Optional) Specify a maximum file size, in kilobytes.
Step 5 Click OK.
The Export Data in Packet Range dialog will open.Step 6 Define the range of packets that you want to export by entering packet
numbers or by selecting starting and ending markers from the drop-down lists.
Figure 10-1: Export Data dialog
127

CATC FIREINSPECTOR 2.01 CHAPTER 10
User’s Manual Printing and Exporting Files
Step 7 Click OK.The Export Data to File dialog will appear.
Step 8 Enter a file name. You may also browse to a new directory, if desired.
Step 9 Click Save to save the data.
128

CATC FIREINSPECTOR 2.01 CHAPTER 11
User’s Manual Contact and Warranty Information
CHAPTER 11: CONTACT AND WARRANTY INFORMATION
11.1 Contact InformationMailing address
Computer Access Technology CorporationCustomer Support2403 Walsh AvenueSanta Clara, CA 95051-1302USA
Online support
http://www.catc.com/
E-mail address
Telephone support
+1/800.909.2282 (USA and Canada)+1/408.727.6600 (worldwide)
Fax
+1/408.727.6622 (worldwide)
Sales information
11.2 Warranty and LicenseComputer Access Technology Corporation (hereafter CATC) warrants this product to be free from defects in material, content, and workmanship, and agrees to repair or replace any part of the enclosed unit that proves defective under these terms and conditions. Parts and labor are warranted for one year from the date of first purchase.
The CATC software is licensed for use on a single personal computer. The software may be copied for backup purposes only.
This warranty covers all defects in material or workmanship. It does not cover accidents, misuse, neglect, unauthorized product modification, or acts of nature. Except as expressly provided above, CATC makes no warranties or conditions, express, implied, or statutory, including without limitation the implied warranties of merchantability and fitness for a particular purpose.
129

CATC FIREINSPECTOR 2.01 CHAPTER 11
User’s Manual Contact and Warranty Information
CATC shall not be liable for damage to other property caused by any defects in this product, damages based upon inconvenience, loss of use of the product, loss of time or data, commercial loss, or any other damages, whether special, incidental, consequential, or otherwise, whether under theory of contract, tort (including negligence), indemnity, product liability, or otherwise. In no event shall CATC's liability exceed the total amount paid to CATC for this product.
CATC reserves the right to revise these specifications without notice or penalty.
130

INDEX
A
address resolution protocol, 66All Markers dialog, 84application help, 12application layout, 19arbitration reset gaps, 51ARP, 66asynchronous packet fields, 52–55AV/C transactions, 64
view type fields, 64
B
base address, 71.bmp files, 116breakout board, 6, 29, 31, 34–35broadcast datagrams, 66buffer size, 29bus engine, 13bus resets, 38, 51bus topology
reconstructing, 78, 106bus topology trees, 103–110
menus, 105–106topology context menu, 105tree view menu, 106
reconstructing bus topology, 78, 106retrieving trees, 103
advanced options, 104saving tree files, 107vendor information, 110viewing, 104
bus traffic recording (.fdb) files, 41–87bus usage graph
See bus utilization reportbus usage, calculating, 113–114bus utilization report, 116–123
data settings, 119display settings, 117–119e-mail graph, 117graph area properties dialog, 121menus
graph area menu, 119graphs menu, 120view settings menu, 117
print graph, 117save graph, 116toolbar commands, 117view options dialog, 118
C
.cam files, 71camera settings files, 71CATC contact information, 129CATC Decoder Scripting files, 89CATC Scripting Language, 89CATC Trace files, 41–87cell context menus, 74–79
commands for traffic generation files only, 79change all...dest_IDs, 79CIP transactions, 72
view type fields, 72clear marker, 77collapse
all fields or transactions, 79field or transaction, 78
collapse rows and fields, 73–74data fields, 74header fields, 74transaction rows, 73
color tool/dialog, 44color, changing in fields, 78command block agent transactions, 60, 62command register base address, 71
131

CATC FIREINSPECTOR 2.01 INDEX
common isochronous packetsSee CIP transactions
configuration ROM, 39, 107–109files, 39reading,
from a device, 108from a file, 108
reconstructing, 78, 108saving configuration ROM files, 109viewing as text, 109
CSL, 89.csv files, 126custom decoder scripts, 89cycle start packets, 55
D
.dat files, 127data blocks, in packets, 50, 75data in/out connector, 5data pattern editors, 32data transfer rates, 51data.fdb, 29DB-37 connector, 2DC transactions
See Digital camera transactions.dec files, 89Decode Camera Transactions dialog, 71Decode SBP Transactions dialog, 62decoder scripts, 89decoding
packets, 50–58asynchronous packet fields, 52–55cycle start packets, 55display elements, 50GASP packets, 54isochronous data block packets, 55–56lock packets, 53PHY packets, 56–58read data packets, 53write data packets, 53
transactions, 58–721394 transactions, 59–60AV/C transactions, 64CIP transactions, 72Digital camera transactions, 70–72FCP transactions, 63–66HAVi transactions, 65–66High-level IP, 69–70IP Datagrams, 68–69IPv4/1394 transactions, 66–68
SBP transactions, 60–63transaction number field, 58
Define Packets to Hide dialog, 48delete packet, 79Digital camera transactions, 70–72
Decode Camera Transactions dialog, 71load camera settings file, 72save camera settings file, 72view type fields, 70
display options (.opt) files, 42Display Options, 42–49, 80
dialog, opening, 42field color, format, and hiding, 43–47
set field bit or byte order, 46set field colors, 44set field formats, 45set field hiding, 46
files, 42general, 42–43level hiding, 47–49
define packets to hide, 48loading, 49restore factory presets, 49saving, 49
driver, updating, 13on Windows 2000, 14on Windows 98 SE, 14on Windows Me, 15on Windows XP, 16
E
edit as text, 80edit marker, 77edit packet, 79encapsulated, 66error summary report, 112–113
saving, 112errors, 52, 112–113event groups, 30event trigger recording, 28expand
all fields or transactions, 79field or transaction, 78
expand rows and fields, 73–74data fields, 74header fields, 74transactions rows, 73
export data, 79export Trace file
as traffic generation (.txg) file, 126
132

CATC FIREINSPECTOR 2.01 INDEX
in comma separated value (.csv) format, 126in data (.dat or .txt) format, 127in packet view format (.txt) 126
extended PHY packets, 57ping packet fields, 57remote access packet fields 57remote command packet fields, 57remote confirmation packet fields, 58remote reply packet fields 57resume packet fields, 58
external interface breakout board, 6, 29, 31,34–35
external trigger sources, 31
F
FCP transactions, 63–66See also AV/C transactions and HAVi transac-
tions.fdb files, 29, 41–87, 91fetch agent transactions, 60, 62field bit or byte order, setting, 46field color, format, and hiding Display Options,
43–47field colors, setting, 44, 78field formats, setting, 45field hiding, setting, 46, 78field hiding, unhiding, 80file information report, 111–112
saving, 112files
bus traffic recording (.fdb) files, 41–87, 91bus utilization graph (.bmp or .wmf) files, 116camera settings (.cam) files, 71comma separated value (.csv) files, 126configuration ROM (.rom) files, 39, 108data (.dat or .txt) files, 127decoder script (.dec) files, 89display options (.opt) files, 42error summary report (.txt) files, 112exporting, 125file information report (.htm) files, 112generator text (.txg) files, 91packet view format (.txt) files, 126printing, 125recording options (.rec) files, 35SBP settings (.sbp) files, 63Trace (.fdb and .txg) files, 41–87traffic generation (.txg) files, 41–87, 91, 126transaction summary report (.txt) files, 115tree (.tsf) files, 107
Vendor ID data (.ini) files, 110filtered packets, 33, 52find response, 78Find, 85–86FireInspector
analyzer unit, 3application help, 12application layout, 19back panel, 4exiting the application, 12features, 8front panel, 3installing
hardware, 11software, 11
keyboard shortcuts, 26license information, 17license keys, 16license, updating, 17menus, 20resetting the analyzer, 12shutting down the analyzer box, 12specifications, 7starting the analyzer box, 12starting the application, 11system components, 3system requirements, 8toolbars, 23updating the bus engine, 13updating the driver, 13updating the firmware, 13user interface, 19–26
FireWire, 1firmware, 13format, numeric, 78fragmented, 66
G
GASP packets, 54general Display Options, 42–43generating 1394 traffic
See traffic generationglobal asynchronous stream packets, 54
H
HAVi transactions, 65–66view type fields, 66
hide cycle starts, 55hide fields, 78
133

CATC FIREINSPECTOR 2.01 INDEX
hide packets, 47–49High-level IP, 69–70
view type fields, 70.htm files, 112
I
I/O connectivity, 2IEEE 1394 bus version, 2IEEE 1394 specification, 3IEEE 1394 transactions, 59–60
view type fields, 60i.LINK, 1.ini files, 110insert packet, 79Internet Protocol Datagrams
See IP DatagramsInternet Protocol version 4 Over 1394
See IPv4/1394 transactionsIP Datagrams, 68–69
view type fields, 68IPPR
See High-level IPIPv4/1394 transactions, 66–68
view type fields, 67isochronous data block packets, 55–56
K
keyboard shortcuts, 26
L
level hiding Display Options, 47–49license information, 17license keys, 16license, 129license, updating, 17load
camera settings file, 72display options, 49recording options, 35SBP settings, 63
lock packets, 53
M
management agent offsets, 62management agent transactions, 60manual trigger recording, 28markers, 76, 77, 83
All Markers dialog, 84MCAP, 66menus, 20
bus utilization report menus, 117, 119, 120file menu, 20generate menu, 22help menu, 23record menu, 21report menu, 21search menu, 21setup menu, 20topology tree pop-menus, 105–106Trace file cell context menus
See cell context menusTrace view menus
See Trace view menustree menu, 21view menu, 22window menu, 22
multicast channel allocation protocol, 66multicast datagrams, 66
N
number formats, 78
O
.opt files, 42
P
packet-level decodingSee decoding, packets
packetsasynchronous, 52–55cycle start packets, 55data blocks, 50, 75display elements, 50
arbitration reset gaps, 51bus resets, 51data blocks, 50, 75data transfer rates, 51errors, 52filtered packets, 52packet headers, 50, 75packet numbers, 50raw quadlets, 50register status, 51subaction gaps, 51time stamps, 51
134

CATC FIREINSPECTOR 2.01 INDEX
transaction codes, 51trigger location, 51view fields, 50warnings, 52
errors, 52filtered, 52GASP packets, 54headers, 50, 75isochronous data blocks, 55–56lock packets, 53numbers, 50PHY packets, 56–58raw quadlets, 50read data packets, 53warnings, 52write data packets, 53
PHY packets, 56–58configuration, 57extended, 57
ping packet fields, 57remote access packet fields, 57remote command packet fields, 57remote confirmation packet fields, 58remote reply packet fields, 57resume packet fields, 58
link-on, 56self-ID, 56
ping packet fields, 57print
bus utilization graph, 117, 125Trace file, 125tree file, 125
R
Raw Data dialog, 75raw quadlets, 50read data packets, 53.rec files, 35reconstruct configuration ROM, 78reconstruct topology tree, 78, 106recording 1394 traffic, 27–39
making a recording, 36–38recording status, 37start recording, 36stop recording, 36uploading data, 37
Recording Options, 27–36Recording Options, 27–36
actions, 32–35counter, 33
external output, 34–35filter, 33restart, 33sequencing, 34trigger, 33
dialog, opening, 27events, 29–32
data pattern editors, 32event groups, 30
files, 35general, 28–29
buffer size, 29options filename, 29options, 28recording type, 28Trace filename & path, 29trigger position, 29
loading, 35saving, 35
register status, 51remote access packet fields, 57remote command packet fields, 57remote confirmation packet fields, 58remote reply packet fields, 57reports, 111–123
bus utilization report, 116–123error summary, 112–113file information, 111–112timing and bus usage calculator, 113–114transaction summary report, 114–116
reset analyzer, 12resetting the 1394 bus, 38restore factory presets, 49resume packet fields, 58.rom files, 39, 108
S
savebus utilization graph, 116camera settings file, 72configuration ROM files, 109data block, 76display options, 49error summary report, 112.fdb file, 81–83file information report, 112recording options, 35SBP settings, 63Trace file, 81–83transaction summary report, 115
135

CATC FIREINSPECTOR 2.01 INDEX
tree files, 107.txg file, 81–83
.sbp settings file, 63SBP transactions, 60–63
command block agent transactions, 60Decode SBP Transactions dialog, 62Fast Start Offset, 62fetch agent transactions, 60load SBP settings file, 63management agent transactions, 60save SBP settings, 63view type fields, 61
scripts, 89search
direction, 86for the next packet, 78Trace files, 83–86
serial bus protocol transactions, 60–63set field bit or byte order, 46set field colors, 44set field formats, 45set field hiding, 46set marker, 76show cycle starts, 5561883 common isochronous packets
See CIP transactionssnapshot recording, 28subaction gaps, 51subactions, 41
T
tcodes, 511394 bus, resetting, 381394 traffic, generating
See traffic generation1394 traffic, recording
See recording 1394 traffic1394 transactions
See IEEE 1394 transactionstime from marker, 78time from trigger, 77time stamps, 51timing and bus usage calculator, 113–114toolbars, 23
analysis, 24bus utilization, 117frequently used, 24generator, 25standard, 23view level, 25
topologySee bus topology trees
Trace file cell context menusSee cell context menus
Trace files, 41–87comments, 83Display Options, 42–49exporting, 87saving, 81–83searching, 83–86viewing, 50–81
Trace view menus, 79–81traffic generation (.txg) files, 41–87, 91traffic generation, 91–102
change destination IDs, 101creating different traffic patterns with isochro-
nous data, 96defining data blocks, 95delete packets, 100edit as text, 102edit packets, 96
delay, 97force reset, 97packet field editor, 100repeat start/stop, 98set acknowledge values, 98start/stop errors, 99start/stop ISO transmission, 99
editing in FireInspector, 96–102generating isochronous traffic, 95insert packets, 101keys, 91–95
control packet keys, 93control packet types, 92keys for asynchronous packet fields, 94keys for isochronous packet fields, 94packet starting keys, 92
maximum block size for asynchronous data, 95maximum block size for isochronous data, 96stress testing with asynchronous data, 95
traffic recording files, 91transaction codes, 51transaction number field, 58transaction summary report, 114–116
saving, 115transaction-level decoding
See decoding, transactionstransfer rates, data, 51trees, topology
See bus topology treestrigger location, 51
136

CATC FIREINSPECTOR 2.01 INDEX
trigger, 28, 29, 31, 33, 36, 83.tsf files, 107TTL signals, 6.txg files, 41–87, 91, 126.txt files, 112, 115, 126, 127
U
unhide cells, 80unicast datagrams, 66user interface, 19–26user-defined decoders, 89
V
vendor information, 110VendorID.ini, 110Video Format 7, 71view data block, 78View Fields dialog, 75view fields, in packets, 50, 75view raw quadlets, 75view type fields
in 1394 transaction rows, 60in AV/C transaction rows, 64in CIP transaction rows, 72in digital camera transaction rows, 70in HAVi transaction rows, 66in High-level IP transaction rows, 70in IP Datagram transaction rows, 68in IPv4/1394 transaction rows, 67in SBP transaction rows, 61
view type fields command, 79viewing Trace files, 50–81
W
warnings, 52warranty, 129.wmf files, 116wrap, 80write data packets, 53
Z
zoom in, 80zoom out, 80
137