first abu dhabi bank vs global banks - nbad uae · pdf filewelcome to our “first abu...
TRANSCRIPT

First Abu Dhabi Bank vs Global Banks
07 June 2017

2
Disclaimer
The information contained herein has been prepared by First Abu Dhabi Bank P.J.S.C (“FAB”). FAB relies on information
obtained from sources believed to be reliable but does not guarantee its accuracy or completeness.
This presentation has been prepared for information purposes only and is not and does not form part of any offer for sale
or solicitation of any offer to subscribe for or purchase or sell any securities nor shall it or any part of it form the basis of or
be relied on in connection with any contract or commitment whatsoever.
Some of the information in this presentation may contain projections or other forward-looking statements regarding future
events or the future financial performance of FAB. These forward-looking statements include all matters that are not
historical facts. The inclusion of such forward-looking information shall not be regarded as a representation by FAB or any
other person that the objectives or plans of FAB will be achieved. FAB undertakes no obligation to publicly update or
publicly revise any forward-looking statement, whether as a result of new information, future events or otherwise.
3
Foreword
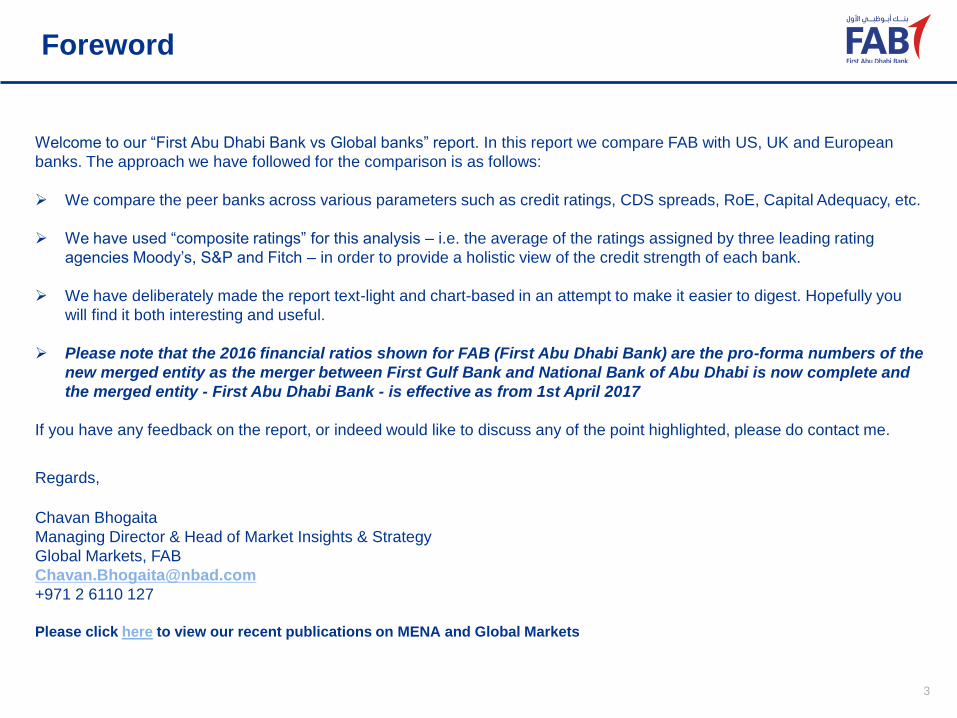
Welcome to our “First Abu Dhabi Bank vs Global banks” report. In this report we compare FAB with US, UK and European
banks. The approach we have followed for the comparison is as follows:
We compare the peer banks across various parameters such as credit ratings, CDS spreads, RoE, Capital Adequacy, etc.
We have used “composite ratings” for this analysis – i.e. the average of the ratings assigned by three leading rating
agencies Moody’s, S&P and Fitch – in order to provide a holistic view of the credit strength of each bank.
We have deliberately made the report text-light and chart-based in an attempt to make it easier to digest. Hopefully you
will find it both interesting and useful.
Please note that the 2016 financial ratios shown for FAB (First Abu Dhabi Bank) are the pro-forma numbers of the
new merged entity as the merger between First Gulf Bank and National Bank of Abu Dhabi is now complete and
the merged entity - First Abu Dhabi Bank - is effective as from 1st April 2017
If you have any feedback on the report, or indeed would like to discuss any of the point highlighted, please do contact me.
Regards,
Chavan Bhogaita
Managing Director & Head of Market Insights & Strategy
Global Markets, FAB
+971 2 6110 127
Please click here to view our recent publications on MENA and Global Markets

4
Rating comparison – FAB vs Global banks
Moody's S&P FitchComposite
Rating
Composite
Score
5-yr CDS
level**Rating Outlook Score* Rating Outlook Score* Rating Outlook Score*
First Abu Dhabi Bank (FAB) * Aa3 Stable 4 AA- Stable 4 AA- Stable 4 AA- 4 82
U.K. Banks
HSBC A1 Negative 5 A Negative 6 AA- Stable 4 A+ 5 53
Standard Chartered A2 Stable 6 BBB+ Stable 8 A+ Stable 5 A 6 77
Barclays Baa2 Negative 9 BBB Negative 9 A Stable 6 BBB+ 8 67
RBS Ba1 Positive 11 BBB- Stable 10 BBB+ Stable 8 BBB- 10 77
European Banks
BNP Paribas A1 Stable 5 A Stable 6 A+ Stable 5 A+ 5 51
Deutsche Bank A3 Stable 7 A- Negative 7 A- Negative 7 A- 7 102
Societe Generale A2 Stable 6 A Stable 6 A Stable 6 A 6 52
Credit Suisse Baa2 Stable 9 BBB+ Stable 8 A- Stable 7 BBB+ 8 77
UBS AG Aa3 Stable 4 A+ Stable 5 A+ Stable 5 A+ 5 44
Credit Agricole A1 Stable 5 A Stable 6 A+ Stable 5 A+ 5 51
ING Groep NV Baa1 Stable 8 A- Stable 7 A+ Stable 5 A- 7 45
Commerzbank AG A2 Stable 6 A- Negative 7 BBB+ Stable 8 A- 7 80
UniCredit SpA Baa1 Stable 8 BBB- Stable 10 BBB Stable 9 BBB 9 146
U.S. Banks
JP Morgan Chase A3 Stable 7 A- Stable 7 A+ Stable 5 A 6 53
Goldman Sachs A3 Stable 7 BBB+ Stable 8 A Stable 6 A- 7 75
Morgan Stanley A3 Stable 7 BBB+ Stable 8 A Stable 6 A- 7 70
Citigroup Inc Baa1 Stable 8 BBB+ Stable 8 A Stable 6 A- 7 60
Bank of America Baa1 Positive 8 BBB+ Stable 8 A Stable 6 A- 7 56
Notes: * The credit ratings of FAB are for of the new merged entity, as assigned by the rating agencies, following the completion of the merger between First Gulf Bank and National
Bank of Abu Dhabi and the merged entity - First Abu Dhabi Bank - is effective as from 1st April 2017; Scoring is derived based on the rating assigned by the rating agencies. AAA or
equivalent being the best with rank “1”, followed by AA+ or equivalent as “2”, AA or equivalent as “3” and so on; ** CDS for 06-Jun-17 & in basis points; Source: Bloomberg

5
FAB
HSBC
StanChart
Barclays
RBS
Lloyds
BNP Paribas
Deutsche Bank
SocGen
Credit Suisse
UBS
Credit Agricole
ING Groep
Commerzbank
UniCredit
JP Morgan Chase
Goldman Sachs
Morgan Stanley
Citigroup
BofA
35
45
55
65
75
85
95
105
115
125
CD
S (
bp
s)
AA- A+ A A- BBB+AA BBB BBB-
150
FAB vs Global banks (cont’d)
Banks’ composite credit rating vs 5-year CDS spread
Notes: * The credit ratings of FAB are for of the new merged entity, as assigned by the rating agencies, following the completion of the merger between First Gulf Bank and National
Bank of Abu Dhabi and the merged entity - First Abu Dhabi Bank - is effective as from 1st April 2017; X-axis represents the composite rating. The ratings have been arranged from
higher to lower starting from ‘AA’, followed by ‘AA-’ and so on; CDS levels are for 06-Jun-17; Source: Bloomberg
FAB is the only bank within the selected
peer group here to be rated in the double-A
category by all three major agencies.

6
Common equity tier 1 ratio – CET1
FAB
LloydsStanChart
HSBC
Barclays
RBS
UBS
Credit SuisseDeutsche
ING
BNP
Commerz
SocGen
CreditAgri
UniCredit
MS
GS
Citigroup
BofA
JPMC
7%
8%
9%
10%
11%
12%
13%
14%
15%
16%
17%
18%
AA AA- A+ A A- BBB+ BBB BBB-
Common equity tier 1 ratio vs Composite rating
Notes: * Please note that the 2016 financial ratios shown for FAB (First Abu Dhabi Bank) are the pro-forma numbers of the new merged entity as the merger between First Gulf Bank
and National Bank of Abu Dhabi is now complete and the merged entity - First Abu Dhabi Bank - is effective as from 1st April 2017; The ratios prior to 2016 – i.e. from 2012 to 2015 –
are the standalone ratios of NBAD before the merger; FAB’s ratios are as per Central Bank of UAE’s Basel II guidelines; Source: Bloomberg, Annual reports
FY 2016 Common equity tier 1 ratio
First Abu Dhabi bank (FAB) * 14.2%
U.K. Banks
Lloyds 13.6%
HSBC 13.6%
Standard Chartered 13.6%
RBS 13.4%
Barclays 12.4%
European Banks
UBS AG 16.8%
ING Groep NV 14.2%
Commerzbank AG 13.9%
Credit Suisse 13.6%
Deutsche Bank 13.4%
Credit Agricole 12.1%
BNP Paribas 11.6%
Societe Generale 11.5%
UniCredit SpA 8.2%
U.S. Banks
Morgan Stanley 16.9%
Citigroup Inc 14.9%
Goldman Sachs 13.1%
JP Morgan Chase 12.5%
Bank of America 12.1%
Strongest combination of
CET1 ratio & credit rating

7
Common equity tier 1 ratio – CET1 (cont’d)
Notes: * Please note that the 2016 financial ratios shown for FAB (First Abu Dhabi Bank) are the pro-forma numbers of the new merged entity as the merger between First Gulf Bank
and National Bank of Abu Dhabi is now complete and the merged entity - First Abu Dhabi Bank - is effective as from 1st April 2017; The ratios prior to 2016 – i.e. from 2012 to 2015 –
are the standalone ratios of NBAD before the merger; FAB’s ratios are as per Central Bank of UAE’s Basel II guidelines; Source: Bloomberg, Annual reports
FY 2016 Common equity tier 1 ratio
First Abu Dhabi bank (FAB) * 14.2%
U.K. Banks
Lloyds 13.6%
HSBC 13.6%
Standard Chartered 13.6%
RBS 13.4%
Barclays 12.4%
European Banks
UBS AG 16.8%
ING Groep NV 14.2%
Commerzbank AG 13.9%
Credit Suisse 13.6%
Deutsche Bank 13.4%
Credit Agricole 12.1%
BNP Paribas 11.6%
Societe Generale 11.5%
UniCredit SpA 8.2%
U.S. Banks
Morgan Stanley 16.9%
Citigroup Inc 14.9%
Goldman Sachs 13.1%
JP Morgan Chase 12.5%
Bank of America 12.1%
Common equity tier 1 ratio vs Comp. rating Common equity tier 1 ratio trend
FAB
StanChart
Barclays
LloydsHSBCRBS
12.0%
12.5%
13.0%
13.5%
14.0%
14.5%
AA AA- A+ A A- BBB+ BBB
FAB vs U.K. Banks
BBB-
FAB vs U.K. Banks
8%
10%
12%
14%
16%
2012 2013 2014 2015 2016
FAB
HSBC
StanChart
Barclays
Lloyds
RBS
FAB
UBS
Credit SuisseDeutsche
ING
BNP
Commerz
SocGenCreditAgri
UniCredit
7%
9%
11%
13%
15%
17%
AA AA- A+ A A- BBB+
FAB vs European Banks
BBB BBB-
FAB vs European Banks
7%
9%
11%
13%
15%
17%
19%
21%
2012 2013 2014 2015 2016
FAB
CS
UBS
DB
BNP
SocGen
Credit Agri
ING
Commerz
UniCredit
FAB
MS
GS
Citigroup
BofAJPMC
11%
12%
13%
14%
15%
16%
17%
AA AA- A+ A
FAB vs U.S. Banks
A- BBB+
FAB vs U.S. Banks
10%
11%
12%
13%
14%
15%
16%
17%
2012 2013 2014 2015 2016
FAB
MS
Citigroup
GS
BofA
JP Morgan

8
Tier 1 capital adequacy ratio
FAB
Lloyds
StanChart
HSBC
Barclays
RBS
UBS
Credit Suisse
Deutsche
ING
BNP
Commerz
SocGen
CreditAgri
UniCredit
MS
GS
Citigroup
BofA
JPMC
8%
9%
10%
11%
12%
13%
14%
15%
16%
17%
18%
19%
20%
AA AA- A+ A A- BBB+ BBB BBB-
Tier 1 capital adequacy ratio vs Composite ratingFY 2016 Tier 1 capital adequacy ratio
First Abu Dhabi bank (FAB) * 16.5%
U.K. Banks
RBS 17.7%
Lloyds 17.0%
HSBC 16.1%
Standard Chartered 15.7%
Barclays 15.6%
European Banks
UBS AG 19.7%
Credit Suisse 18.0%
ING Groep NV 16.3%
Deutsche Bank 15.6%
Credit Agricole 15.1%
Societe Generale 14.5%
Commerzbank AG 13.9%
BNP Paribas 12.9%
UniCredit SpA 9.0%
U.S. Banks
Morgan Stanley 19.0%
Citigroup Inc 15.8%
Goldman Sachs 15.0%
JP Morgan Chase 14.2%
Bank of America 13.6%
Strongest combination of
Tier 1 CAR & credit rating
Notes: * Please note that the 2016 financial ratios shown for FAB (First Abu Dhabi Bank) are the pro-forma numbers of the new merged entity as the merger between First Gulf Bank
and National Bank of Abu Dhabi is now complete and the merged entity - First Abu Dhabi Bank - is effective as from 1st April 2017; The ratios prior to 2016 – i.e. from 2012 to 2015 –
are the standalone ratios of NBAD before the merger; FAB’s ratios are as per Central Bank of UAE’s Basel II guidelines; Source: Bloomberg, Annual reports

9
Tier 1 capital adequacy ratio vs Comp. rating Tier 1 capital adequacy ratio trend
FAB
StanChart Barclays
Lloyds
HSBC
RBS
15%
16%
17%
18%
AA AA- A+ A A- BBB+ BBB
FAB vs U.K. Banks
BBB-
FAB vs U.K. Banks
10%
12%
14%
16%
18%
20%
2012 2013 2014 2015 2016
FAB
HSBC
StanChart
Barclays
Lloyds
RBS
FAB
UBS
Credit Suisse
DeutscheING
BNPCommerzSocGen
CreditAgri
UniCredit8%
10%
12%
14%
16%
18%
20%
AA AA- A+ A A- BBB+
FAB vs European Banks
BBB BBB-
FAB vs European Banks
8%
10%
12%
14%
16%
18%
20%
22%
2012 2013 2014 2015 2016
FAB
CS
UBS
DB
BNP
SocGen
Credit Agri
ING
Commerz
UniCredit
FAB
MS
GS
Citigroup
BofAJPMC
13%
14%
15%
16%
17%
18%
19%
AA AA- A+ A
FAB vs U.S. Banks
A- BBB+
FAB vs U.S. Banks
11%
13%
15%
17%
19%
2012 2013 2014 2015 2016
FAB
MS
Citigroup
GS
BofA
JP Morgan
Tier 1 capital adequacy ratio (cont’d)
Notes: * Please note that the 2016 financial ratios shown for FAB (First Abu Dhabi Bank) are the pro-forma numbers of the new merged entity as the merger between First Gulf Bank
and National Bank of Abu Dhabi is now complete and the merged entity - First Abu Dhabi Bank - is effective as from 1st April 2017; The ratios prior to 2016 – i.e. from 2012 to 2015 –
are the standalone ratios of NBAD before the merger; FAB’s ratios are as per Central Bank of UAE’s Basel II guidelines; Source: Bloomberg, Annual reports
FY 2016 Tier 1 capital adequacy ratio
First Abu Dhabi bank (FAB) * 16.5%
U.K. Banks
RBS 17.7%
Lloyds 17.0%
HSBC 16.1%
Standard Chartered 15.7%
Barclays 15.6%
European Banks
UBS AG 19.7%
Credit Suisse 18.0%
ING Groep NV 16.3%
Deutsche Bank 15.6%
Credit Agricole 15.1%
Societe Generale 14.5%
Commerzbank AG 13.9%
BNP Paribas 12.9%
UniCredit SpA 9.0%
U.S. Banks
Morgan Stanley 19.0%
Citigroup Inc 15.8%
Goldman Sachs 15.0%
JP Morgan Chase 14.2%
Bank of America 13.6%
10
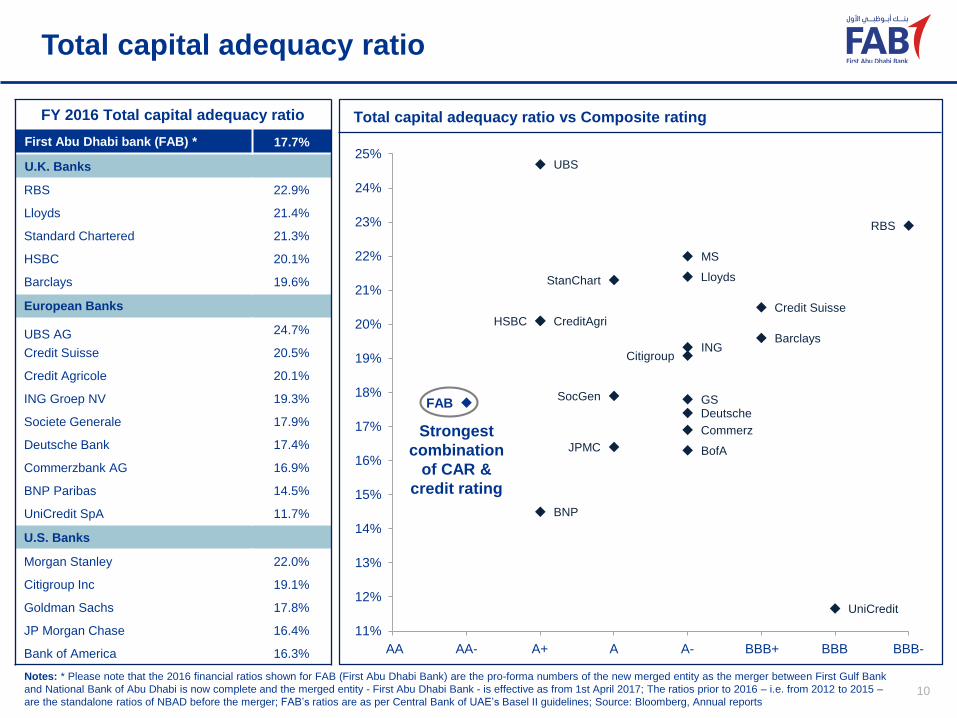
Total capital adequacy ratio
FY 2016 Total capital adequacy ratio
First Abu Dhabi bank (FAB) * 17.7%
U.K. Banks
RBS 22.9%
Lloyds 21.4%
Standard Chartered 21.3%
HSBC 20.1%
Barclays 19.6%
European Banks
UBS AG 24.7%
Credit Suisse 20.5%
Credit Agricole 20.1%
ING Groep NV 19.3%
Societe Generale 17.9%
Deutsche Bank 17.4%
Commerzbank AG 16.9%
BNP Paribas 14.5%
UniCredit SpA 11.7%
U.S. Banks
Morgan Stanley 22.0%
Citigroup Inc 19.1%
Goldman Sachs 17.8%
JP Morgan Chase 16.4%
Bank of America 16.3%
Notes: * Please note that the 2016 financial ratios shown for FAB (First Abu Dhabi Bank) are the pro-forma numbers of the new merged entity as the merger between First Gulf Bank
and National Bank of Abu Dhabi is now complete and the merged entity - First Abu Dhabi Bank - is effective as from 1st April 2017; The ratios prior to 2016 – i.e. from 2012 to 2015 –
are the standalone ratios of NBAD before the merger; FAB’s ratios are as per Central Bank of UAE’s Basel II guidelines; Source: Bloomberg, Annual reports
FAB
StanChart Lloyds
Barclays
HSBC
RBS
UBS
Credit Suisse
Commerz
Deutsche
ING
BNP
UniCredit
CreditAgri
SocGen GS
MS
Citigroup
BofAJPMC
11%
12%
13%
14%
15%
16%
17%
18%
19%
20%
21%
22%
23%
24%
25%
AA AA- A+ A A- BBB+ BBB BBB-
Total capital adequacy ratio vs Composite rating
Strongest
combination
of CAR &
credit rating

11
Total capital adequacy ratio (cont’d)
Notes: * Please note that the 2016 financial ratios shown for FAB (First Abu Dhabi Bank) are the pro-forma numbers of the new merged entity as the merger between First Gulf Bank
and National Bank of Abu Dhabi is now complete and the merged entity - First Abu Dhabi Bank - is effective as from 1st April 2017; The ratios prior to 2016 – i.e. from 2012 to 2015 –
are the standalone ratios of NBAD before the merger; FAB’s ratios are as per Central Bank of UAE’s Basel II guidelines; Source: Bloomberg, Annual reports
Total capital adequacy ratio vs Comp. rating Total capital adequacy ratio trend
FAB
StanChart
Barclays
Lloyds
HSBC
RBS
16%
17%
18%
19%
20%
21%
22%
23%
AA AA- A+ A A- BBB+ BBB
FAB vs U.K. Banks
BBB-
FAB vs U.K. Banks
13%
15%
17%
19%
21%
23%
25%
2012 2013 2014 2015 2016
FAB
HSBC
StanChart
Barclays
Lloyds
RBS
FAB
UBS
Credit Suisse
Commerz
Deutsche
ING
BNP
UniCredit
CreditAgri
SocGen
11%
13%
15%
17%
19%
21%
23%
25%
AA AA- A+ A A- BBB+
FAB vs European Banks
BBB BBB-
FAB vs European Banks
11%
13%
15%
17%
19%
21%
23%
25%
27%
2012 2013 2014 2015 2016
FAB
CS
UBS
DB
BNP
SocGen
Credit Agri
ING
Commerz
UniCredit
FAB GS
MS
Citigroup
BofAJPMC16%
17%
18%
19%
20%
21%
22%
AA AA- A+ A
FAB vs U.S. Banks
A- BBB+
FAB vs U.S. Banks
12%
14%
16%
18%
20%
22%
2012 2013 2014 2015 2016
FAB
MS
Citigroup
GS
BofA
JP Morgan
FY 2016 Total capital adequacy ratio
First Abu Dhabi bank (FAB) * 17.7%
U.K. Banks
RBS 22.9%
Lloyds 21.4%
Standard Chartered 21.3%
HSBC 20.1%
Barclays 19.6%
European Banks
UBS AG 24.7%
Credit Suisse 20.5%
Credit Agricole 20.1%
ING Groep NV 19.3%
Societe Generale 17.9%
Deutsche Bank 17.4%
Commerzbank AG 16.9%
BNP Paribas 14.5%
UniCredit SpA 11.7%
U.S. Banks
Morgan Stanley 22.0%
Citigroup Inc 19.1%
Goldman Sachs 17.8%
JP Morgan Chase 16.4%
Bank of America 16.3%

12
FAB
StanChart
HSBC
Barclays
Lloyds
RBS
BNP
ING
Credit Suisse
SocGen
UniCredit
Deutsche
Commerz
UBSCreditAgri
JPMCGS
CitigroupBofAMS
-28%
-26%
-24%
-22%
-20%
-18%
-16%
-14%
-12%
-10%
-8%
-6%
-4%
-2%
0%
2%
4%
6%
8%
10%
12%
14%
16%
AA AA- A+ A A- BBB+ BBB BBB-
Return on equity vs Composite rating
Return on equity
Notes: * Please note that the 2016 financial ratios shown for FAB (First Abu Dhabi Bank) are the pro-forma numbers of the new merged entity as the merger between First Gulf Bank
and National Bank of Abu Dhabi is now complete and the merged entity - First Abu Dhabi Bank - is effective as from 1st April 2017; The ratios prior to 2016 – i.e. from 2012 to 2015 –
are the standalone ratios of NBAD before the merger; FAB’s ratios are as per Central Bank of UAE’s Basel II guidelines; Return on equity is calculated as: [Net income available to
shareholders for latest financial year / (Total equity for latest financial year + Total equity for previous financial year) / 2]*100; Source: Bloomberg, Annual reports
FY 2016 Return on equity
First Abu Dhabi bank (FAB) * 15.6%
U.K. Banks
Lloyds 4.7%
Barclays 2.9%
HSBC 0.7%
Standard Chartered -1.0%
RBS -13.6%
European Banks
ING Groep NV 9.5%
BNP Paribas 8.3%
Credit Agricole 5.9%
UBS AG 5.9%
Societe Generale 5.6%
Commerzbank AG 1.0%
Deutsche Bank -2.7%
Credit Suisse -6.3%
UniCredit SpA -26.4%
U.S. Banks
JP Morgan Chase 10.0%
Goldman Sachs 9.4%
Morgan Stanley 8.1%
Bank of America 6.8%
Citigroup Inc 6.6%
A combination of highest RoE & highest credit rating

13
Return on equity vs Comp. rating Return on equity trend
FAB
Lloyds
StanChart
HSBC Barclays
RBS-16%
-8%
0%
8%
16%
AA AA- A+ A A- BBB+ BBB
FAB vs U.K. Banks
BBB-
FAB vs U.K. Banks
-15%
-10%
-5%
0%
5%
10%
15%
20%
2012 2013 2014 2015 2016
FAB
HSBC
StanChart
Barclays
Lloyds
RBS
FAB
BNP ING
Credit Suisse
SocGen
UniCredit
Deutsche
CommerzUBSCreditAgri
-30%
-24%
-18%
-12%
-6%
0%
6%
12%
18%
AA AA- A+ A A- BBB+
FAB vs European Banks
BBB BBB-
FAB vs European Banks
-30%
-25%
-20%
-15%
-10%
-5%
0%
5%
10%
15%
20%
2012 2013 2014 2015 2016
FAB
CS
UBS
DB
BNP
SocGen
Credit Agri
ING
Commerz
UniCredit
FAB
MS
GS
Citigroup BofA
JPMC
6%
8%
10%
12%
14%
16%
AA AA- A+ A
FAB vs U.S. Banks
A- BBB+
FAB vs U.S. Banks
-3%
0%
3%
6%
9%
12%
15%
18%
2012 2013 2014 2015 2016
FAB
MS
Citigroup
GS
BofA
JP Morgan
Return on equity (cont’d)
Notes: * Please note that the 2016 financial ratios shown for FAB (First Abu Dhabi Bank) are the pro-forma numbers of the new merged entity as the merger between First Gulf Bank
and National Bank of Abu Dhabi is now complete and the merged entity - First Abu Dhabi Bank - is effective as from 1st April 2017; The ratios prior to 2016 – i.e. from 2012 to 2015 –
are the standalone ratios of NBAD before the merger; FAB’s ratios are as per Central Bank of UAE’s Basel II guidelines; Return on equity is calculated as: [Net income available to
shareholders for latest financial year / (Total equity for latest financial year + Total equity for previous financial year) / 2]*100; Source: Bloomberg, Annual reports
FY 2016 Return on equity
First Abu Dhabi bank (FAB) * 15.6%
U.K. Banks
Lloyds 4.7%
Barclays 2.9%
HSBC 0.7%
Standard Chartered -1.0%
RBS -13.6%
European Banks
ING Groep NV 9.5%
BNP Paribas 8.3%
Credit Agricole 5.9%
UBS AG 5.9%
Societe Generale 5.6%
Commerzbank AG 1.0%
Deutsche Bank -2.7%
Credit Suisse -6.3%
UniCredit SpA -26.4%
U.S. Banks
JP Morgan Chase 10.0%
Goldman Sachs 9.4%
Morgan Stanley 8.1%
Bank of America 6.8%
Citigroup Inc 6.6%

14
FAB
StanChart
HSBCBarclays
Lloyds
RBS
BNPING
Credit Suisse
UniCredit
SocGen
Deutsche
Commerz
UBS
CreditAgri
JPMCGS
CitigroupBofAMS
-1.6%
-1.4%
-1.2%
-1.0%
-0.8%
-0.6%
-0.4%
-0.2%
0.0%
0.2%
0.4%
0.6%
0.8%
1.0%
1.2%
1.4%
1.6%
1.8%
AA AA- A+ A A- BBB+ BBB BBB-
Return on assets vs Composite rating
Return on assets
Notes: * Please note that the 2016 financial ratios shown for FAB (First Abu Dhabi Bank) are the pro-forma numbers of the new merged entity as the merger between First Gulf Bank
and National Bank of Abu Dhabi is now complete and the merged entity - First Abu Dhabi Bank - is effective as from 1st April 2017; The ratios prior to 2016 – i.e. from 2012 to 2015 –
are the standalone ratios of NBAD before the merger; FAB’s ratios are as per Central Bank of UAE’s Basel II guidelines; Return on assets is calculated as: [Net income available to
shareholders for latest financial year / (Total assets for latest financial year + Total assets for previous financial year) / 2]*100; Source: Bloomberg, Annual reports
FY 2016 Return on assets
First Abu Dhabi bank (FAB) * 1.7%
U.K. Banks
Lloyds 0.3%
Barclays 0.2%
HSBC 0.1%
Standard Chartered 0.0%
RBS -0.7%
European Banks
ING Groep NV 0.5%
BNP Paribas 0.4%
UBS AG 0.3%
Societe Generale 0.3%
Credit Agricole 0.2%
Commerzbank AG 0.1%
Deutsche Bank -0.1%
Credit Suisse -0.3%
UniCredit SpA -1.4%
U.S. Banks
JP Morgan Chase 1.0%
Goldman Sachs 0.9%
Citigroup Inc 0.8%
Bank of America 0.8%
Morgan Stanley 0.7%
A combination of highest RoA & highest credit rating

15
Return on assets vs Comp. rating Return on assets trend
FAB
Lloyds
StanChart
HSBC Barclays
RBS
-1.2%
-0.6%
0.0%
0.6%
1.2%
1.8%
AA AA- A+ A A- BBB+ BBB
FAB vs U.K. Banks
BBB-
FAB vs U.K. Banks
-1.2%
-0.6%
0.0%
0.6%
1.2%
1.8%
2012 2013 2014 2015 2016
FAB
HSBC
StanChart
Barclays
Lloyds
RBS
FAB
Credit Suisse
INGUBS
BNP SocGen
CreditAgri Deutsche
Commerz
UniCredit-1.6%
-1.2%
-0.8%
-0.4%
0.0%
0.4%
0.8%
1.2%
1.6%
2.0%
AA AA- A+ A A- BBB+
FAB vs European Banks
BBB BBB-
FAB vs European Banks
-1.8%
-1.4%
-1.0%
-0.6%
-0.2%
0.2%
0.6%
1.0%
1.4%
1.8%
2012 2013 2014 2015 2016
FAB
CS
UBS
DB
BNP
SocGen
Credit Agri
ING
Commerz
UniCredit
FAB
GSJPMC
CitigroupBofAMS0.7%
0.9%
1.1%
1.3%
1.5%
1.7%
1.9%
AA AA- A+ A
FAB vs U.S. Banks
A- BBB+
FAB vs U.S. Banks
0.0%
0.3%
0.6%
0.9%
1.2%
1.5%
1.8%
2012 2013 2014 2015 2016
FAB
MS
Citigroup
GS
BofA
JP Morgan
Return on assets
Notes: * Please note that the 2016 financial ratios shown for FAB (First Abu Dhabi Bank) are the pro-forma numbers of the new merged entity as the merger between First Gulf Bank
and National Bank of Abu Dhabi is now complete and the merged entity - First Abu Dhabi Bank - is effective as from 1st April 2017; The ratios prior to 2016 – i.e. from 2012 to 2015 –
are the standalone ratios of NBAD before the merger; FAB’s ratios are as per Central Bank of UAE’s Basel II guidelines; Return on assets is calculated as: [Net income available to
shareholders for latest financial year / (Total assets for latest financial year + Total assets for previous financial year) / 2]*100; Source: Bloomberg, Annual reports
FY 2016 Return on assets
First Abu Dhabi bank (FAB) * 1.7%
U.K. Banks
Lloyds 0.3%
Barclays 0.2%
HSBC 0.1%
Standard Chartered 0.0%
RBS -0.7%
European Banks
ING Groep NV 0.5%
BNP Paribas 0.4%
UBS AG 0.3%
Societe Generale 0.3%
Credit Agricole 0.2%
Commerzbank AG 0.1%
Deutsche Bank -0.1%
Credit Suisse -0.3%
UniCredit SpA -1.4%
U.S. Banks
JP Morgan Chase 1.0%
Goldman Sachs 0.9%
Citigroup Inc 0.8%
Bank of America 0.8%
Morgan Stanley 0.7%

16
FAB has a strong international footprint
Country International footprint outside local operation
First Abu Dhabi Bank * UAE 19 countries
Union National Bank UAE 4 countries (Qatar, Kuwait, Egypt & China)
Abu Dhabi Commercial Bank UAE 4 countries (India, Jersey, UK & Singapore)
Emirates NBD UAE9 countries (Saudi Arabia, Qatar, UK, Singapore, China,
Jersey, India, Iran & Egypt)
Mashreqbank UAE11 countries (Bahrain, Egypt, Kuwait, Qatar, Hong Kong,
India, UK, US, Bangladesh, Nepal & Pakistan)
Banque Saudi FransiSaudi
ArabiaLocal presence only
Samba Financial GroupSaudi
Arabia4 countries (UK, UAE, Qatar, & Pakistan)
National Commercial BankSaudi
Arabia
5 countries (Bahrain, Beirut, Singapore, South Korea &
China)
Qatar National Bank Qatar
25 countries (Kuwait, Oman, UAE, Iran, Iraq, Jordan,
Lebanon, Syria, Yemen, Egypt, Libya, Mauritania, South
Sudan, Sudan, Togo, Tunisia, China, Indonesia, India,
Singapore, Vietnam, France, Switzerland, UK & Turkey)
Commercial Bank of Qatar Qatar Local presence only
Doha Bank Qatar
15 countries (Kuwait, UAE, India, Japan, China,
Singapore, South Korea, Australia, Turkey, UK, Germany,
Hong Kong, Canada, South Africa & Bangladesh)
National Bank of Kuwait Kuwait
14 countries (Bahrain, Egypt, Iraq, Jordan, Lebanon,
Saudi Arabia, UAE, France, Switzerland, Turkey, UK,
USA, China & Singapore)
Commercial Bank of Kuwait Kuwait Local presence only
Arab banking Corporation Bahrain
17 countries (Manama, Algeria, Brazil, Egypt, France,
Germany, Iran, Italy, Jordan, Libya, Russia, Singapore,
Sweden, Tunisia, Turkey, UK & US)
National Bank of Bahrain Bahrain 2 countries (UAE & Saudi Arabia)
Bank Muscat SOAG Oman 4 countries (Saudi Arabia, Kuwait, UAE & Singapore)
National Bank of Oman Oman 2 countries (UAE & Egypt)
FAB has one of the largest international
networks amongst the Middle East banks
and is also governed by some of the key
regulators around the world – including
PRA/FCA (U.K.), OCC (U.S.), HKMA (Hong
Kong), APCR (France), FINMA (Switzerland),
and Bank Negara (Malaysia) – in addition to
the U.A.E. Central Bank.
19
Countries
(ex UAE)
39
Branches
outside UAE
5
Rep
offices
UAE
Washington, D.C.
Sao Paulo
London
Paris Geneva
Libya Egypt
Sudan
Lebanon
Jordan
Oman
KuwaitBahrain
India
Malaysia
Singapore
Hong Kong
China
South KoreaQatar
Note: * FAB’s international footprint shows the combined international presence of National Bank of Abu Dhabi
& First Gulf Bank; International branches include representative offices; Source: Bank websites; Zawya

17
FAB – The safest name you can bank upon
Safest Banks in the Middle East & Africa: 2016
1. National Bank of Abu Dhabi (UAE)*
2. Qatar National Bank (Qatar)
3. National Bank of Kuwait (Kuwait)
4. Abu Dhabi Commercial Bank (UAE)
5. Union National Bank (UAE)
6. Al Hilal Bank (UAE)
7. First Gulf Bank (UAE)*
8. Kuwait Finance House (Kuwait)
9. Abu Dhabi Islamic Banks (UAE)
10. Al Ahli Bank of Kuwait (Kuwait)
Global Finance magazine, based on its exclusive survey published in the November 2016 issue, named National Bank of
Abu Dhabi (NBAD) as the “Safest Bank in the Middle East & Africa”. In the same issue, the magazine ranked First
Gulf Bank (FGB) as the 7th Safest Bank in the Middle East & Africa. The banks were selected through an evaluation of
long-term credit ratings – from Moody’s, Standard & Poor’s and Fitch – and total assets of the 500 largest banks
worldwide.
As the merger between FGB and NBAD is now complete and the merged entity - First Abu Dhabi Bank - is effective as
from 1st April 2017, FAB has now a larger and stronger balance sheet. Furthermore Moody’s, S&P and Fitch have
affirmed FAB’s credit ratings at Aa3/AA-/AA- following the completion of merger.
NBAD was ranked 4th in the “Safest Bank in the Emerging Markets” category, a survey conducted by Global Finance
during the same period.
NBAD also secured 32nd position in the “World’s 50 Safest Banks” survey conducted by Global Finance during the
same period. FAB is proud to have been ranked in the World’s 50 Safest Banks since 2009.
Safest Banks in the EM: 2016
1. Korea Development Bank (South Korea)
2. Export-Import Bank of Korea (South Korea)
3. Industrial Bank of Korea (South Korea)
4. National Bank of Abu Dhabi (UAE)*
5. China Development Bank (China)
6. Agricultural Development Bank of China (China)
7. Export-Import Bank of China (China)
8. Qatar National Bank (Qatar)
9. National Bank of Kuwait (Kuwait)
10. Banco del Estado de Chile (Chile)
Note: * The ranking of National Bank of Abu Dhabi and First Gulf Bank are standalone ranking assigned by Global Finance magazine before the merger of two banks.

18
Appendix
As mentioned at the start of this report, we have used “composite ratings” for this analysis – i.e. the average
of the ratings assigned by three leading rating agencies Moody’s, S&P and Fitch – in order to provide a more
representative view of the credit strength of each bank.
The composite rating is calculated as follows:
A score is assigned to the rating from each rating agency: AAA or equivalent being the best with a score
of “1”, followed by AA+ or equivalent as “2”, AA or equivalent as “3”, AA- or equivalent as “4” and so on;
For example FAB is rated Aa3/AA-/AA- by Moody’s/S&P/Fitch. So the scores are 4/4/4;
Hence the average of the scores is “4” which indicates a composite rating of “AA-” for FAB;
In case the average score is not an absolute number – e.g. 4.33 (average of 4, 5, & 4 ) – the final score
is derived by rounding off the average score to the nearest whole number. In this case “4”.

Thank You
Contact:
Chavan Bhogaita / Rakesh Sahu
Market Insights & Strategy
Global Markets
First Abu Dhabi Bank
Tel: +971 2 6110 127
Market Insights & Strategy, FAB Global Markets
Please click here to view our recent publications
on MENA and Global Markets