first assessment of wef- nexus in bolivia - … · first assessment of wef- nexus in bolivia ......
TRANSCRIPT
Página 1
First Assessment of WEF- Nexus
in Bolivia
Franz Rojas-Ortuste y Michael Heiland
June 9, 2015
Página 2
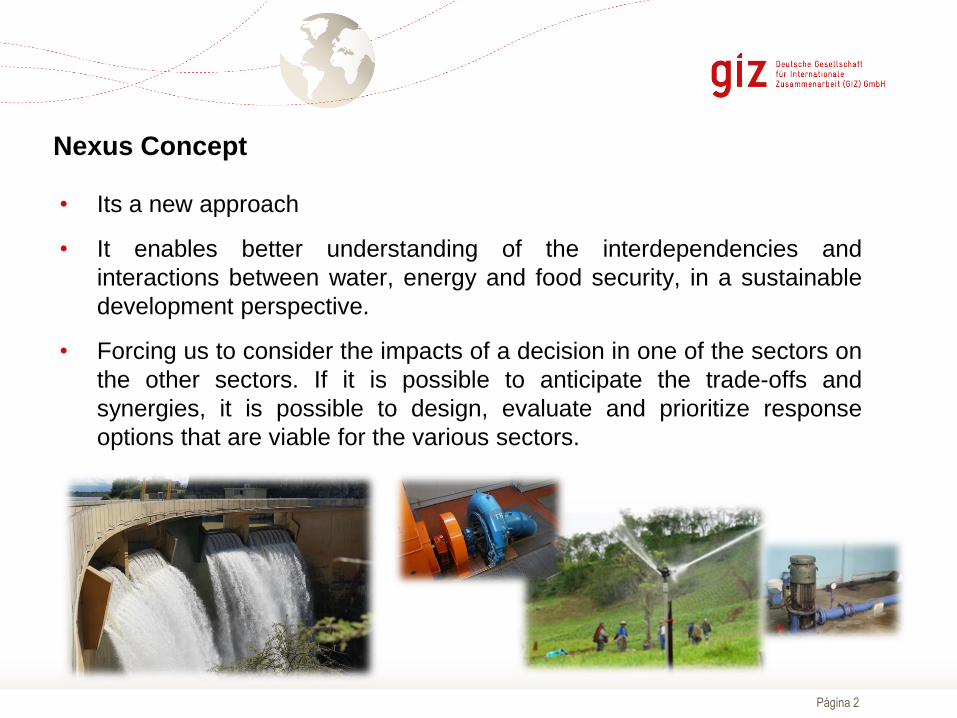
Nexus Concept
• Its a new approach
• It enables better understanding of the interdependencies and
interactions between water, energy and food security, in a sustainable
development perspective.
• Forcing us to consider the impacts of a decision in one of the sectors on
the other sectors. If it is possible to anticipate the trade-offs and
synergies, it is possible to design, evaluate and prioritize response
options that are viable for the various sectors.
Página 3
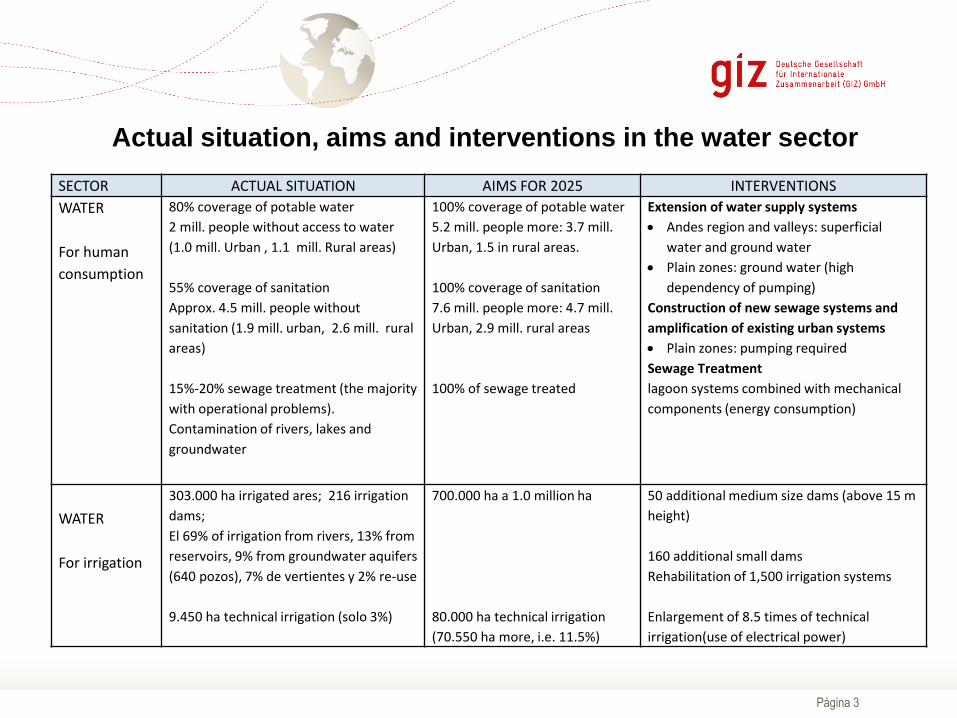
Actual situation, aims and interventions in the water sector
SECTOR ACTUAL SITUATION AIMS FOR 2025 INTERVENTIONS
WATER
For human
consumption
80% coverage of potable water
2 mill. people without access to water
(1.0 mill. Urban , 1.1 mill. Rural areas)
55% coverage of sanitation
Approx. 4.5 mill. people without
sanitation (1.9 mill. urban, 2.6 mill. rural
areas)
15%-20% sewage treatment (the majority
with operational problems).
Contamination of rivers, lakes and
groundwater
100% coverage of potable water
5.2 mill. people more: 3.7 mill.
Urban, 1.5 in rural areas.
100% coverage of sanitation
7.6 mill. people more: 4.7 mill.
Urban, 2.9 mill. rural areas
100% of sewage treated
Extension of water supply systems
Andes region and valleys: superficial
water and ground water
Plain zones: ground water (high
dependency of pumping)
Construction of new sewage systems and
amplification of existing urban systems
Plain zones: pumping required
Sewage Treatment
lagoon systems combined with mechanical
components (energy consumption)
WATER
For irrigation
303.000 ha irrigated ares; 216 irrigation
dams;
El 69% of irrigation from rivers, 13% from
reservoirs, 9% from groundwater aquifers
(640 pozos), 7% de vertientes y 2% re-use
9.450 ha technical irrigation (solo 3%)
700.000 ha a 1.0 million ha
80.000 ha technical irrigation
(70.550 ha more, i.e. 11.5%)
50 additional medium size dams (above 15 m
height)
160 additional small dams
Rehabilitation of 1,500 irrigation systems
Enlargement of 8.5 times of technical
irrigation(use of electrical power)

Página 4
Water sources for irrigation
Fountains
Reservoirs Wells
Re-use
Rivers

Página 5
Actual situation, aims and interventions in the food sector
SECTOR ACTUAL SITUATION AIMS FOR 2025 INTERVENTIONS
FOOD
SECURITY
15 mill. tons of food : 2 mill. tons under
irrigation
Cereals: 2.0 million tons
Tubercles: 975.000 tons
Trigo: 226.000 Tn (IBCE)
Oleaginosas and industrial products
11.3 million tons
Fruits: 1.0 million tons
Unsatisfied Demand
Trigo, unsatisfied demand 42%
Potato from October to Dicember
Hortalizas, unsatisfied demand 31%.
Cereals: 3.5 million tons
Tubercles: 1.1 million tons
Trigo: 1.0 million tons
Recovered soils for agricultural production:
150.000 ha
Conserved soils for agricultural production:
150.000 ha
Amplification of irrigated area

Página 6
Energy Mix in Bolivia 2012
Natural Gas 63 %
Diesel 6 %
Biomass 1 % Hydropower (storage)
11 %
Hydropower (run-of-river) 19 %
Página 7
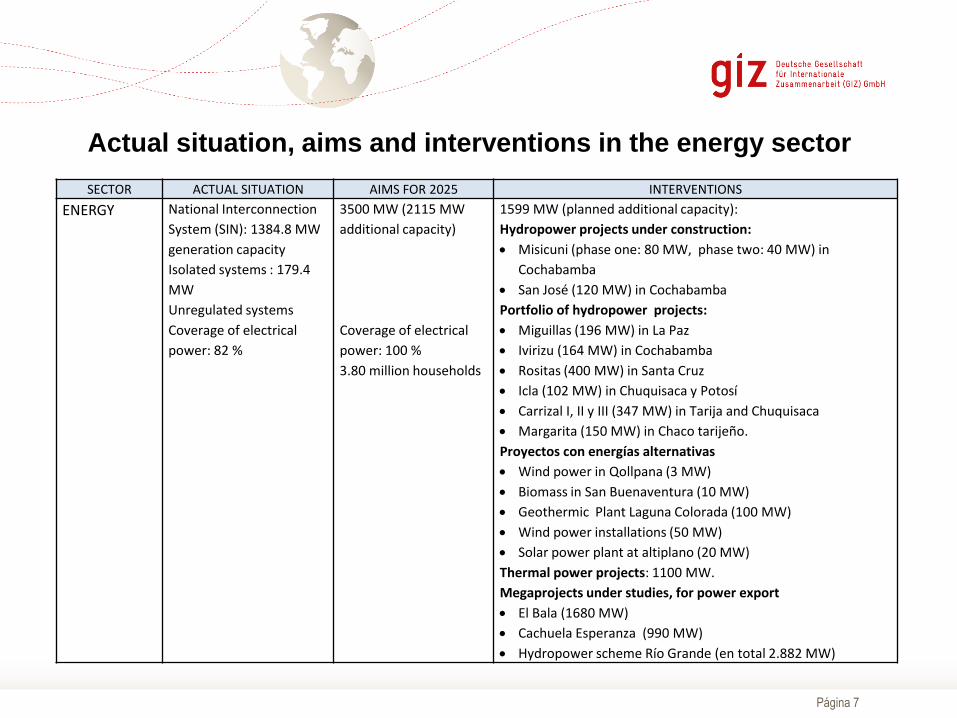
Actual situation, aims and interventions in the energy sector
SECTOR ACTUAL SITUATION AIMS FOR 2025 INTERVENTIONS
ENERGY
National Interconnection
System (SIN): 1384.8 MW
generation capacity
Isolated systems : 179.4
MW
Unregulated systems
Coverage of electrical
power: 82 %
3500 MW (2115 MW
additional capacity)
Coverage of electrical
power: 100 %
3.80 million households
1599 MW (planned additional capacity):
Hydropower projects under construction:
Misicuni (phase one: 80 MW, phase two: 40 MW) in
Cochabamba
San José (120 MW) in Cochabamba
Portfolio of hydropower projects:
Miguillas (196 MW) in La Paz
Ivirizu (164 MW) in Cochabamba
Rositas (400 MW) in Santa Cruz
Icla (102 MW) in Chuquisaca y Potosí
Carrizal I, II y III (347 MW) in Tarija and Chuquisaca
Margarita (150 MW) in Chaco tarijeño.
Proyectos con energías alternativas
Wind power in Qollpana (3 MW)
Biomass in San Buenaventura (10 MW)
Geothermic Plant Laguna Colorada (100 MW)
Wind power installations (50 MW)
Solar power plant at altiplano (20 MW)
Thermal power projects: 1100 MW.
Megaprojects under studies, for power export
El Bala (1680 MW)
Cachuela Esperanza (990 MW)
Hydropower scheme Río Grande (en total 2.882 MW)

Página 8
Interconnections Water - Energy - Food Security WATER
Requires : ENERGY
Requires : FOOD SECURITY
Requires :
WATER
At least 8 large hydropower
projects with total capacity
1599 MW
9 more hydropower projects for
power exportation (Cachuela
Esperanza, El Bala and others)
Significant amount of water to
increase from 303.000 ha to
700.000 ha or 1.0 million ha
(Reference 8000 m3/ha).
Possibility to use treated
residual water
ENERGY
Operational cost of energy
represent 34% total costs of
supply companies in Bolivia
Power for technical irrigation
(possibility of use of local
renewable energy sources)
FOOD (land)
Efficient use of water for
irrigation (avoid losses)
Amplification of technical
irrigation (drop, aspersion) which
uses much less water than gravity
systems
Reduction of use of pesticides
that contaminate rivers,
reservoirs and others
Pilot areas destined for bio-
combustible production

Página 9
Coordination of national policies
It is necessary to consider various aspects, such as the following:
• Surface irrigation. They are 500 thousand or 700 thousand hectares, will
involve a significant increase in the amount of irrigated land, with strong
investment requirements, implementation capacity and pressure on water
resources;
• Energy Plan does not explicitly show the electricity demand of the potable
water and sanitation systems (possibly its included in the projected demand
of the distribution companies).
• Energy demand of the EPSA is not linear, due to the energy implications of
the new sewer systems and wastewater treatment plants;
• Necessary to incorporate the energy potential that may exist through the
capture of biogas from sewage treatment plants.
7/27/2016
Página 10
Coordination of national level with sub-national governments
• Framework Law on Decentralization creates Sectoral Coordination Councils as
consultative bodies, for proposal and consultation between the government of
the central State level and the competent sector authority of the autonomous
governments.
• The structures of the governorates are different from the central level, that may
hinder the proper coordination:
• while the Secretariats of Environment and Sustainable Development of
Santa Cruz and Tarija integrate the functions of the environment and basic
sanitation, the functions of irrigation are in another Secretariat.
• In Cochabamba, the Secretariat of the Mother Earth of the governorate has
functions in the environment, watershed management and governance of
the water, while the functions of irrigation can be found in the Secretariat of
Productive Development and Economy and the plural of drinking water and
sanitation are in a third Secretariat (Works and Services).
7/27/2016
identify interlinkages water-energy-food
context sustainability diagramme
prepare interlinkage matrix
verify key interlinkages, their synergies and trade-offs
define country typology
select context sustainability indicators
Data Collection
calculate score of context sustainability indicators
define interventions and key performance indicators
calculate score of performance indicators
performance radar diagramme
performance/sustainability diagramme
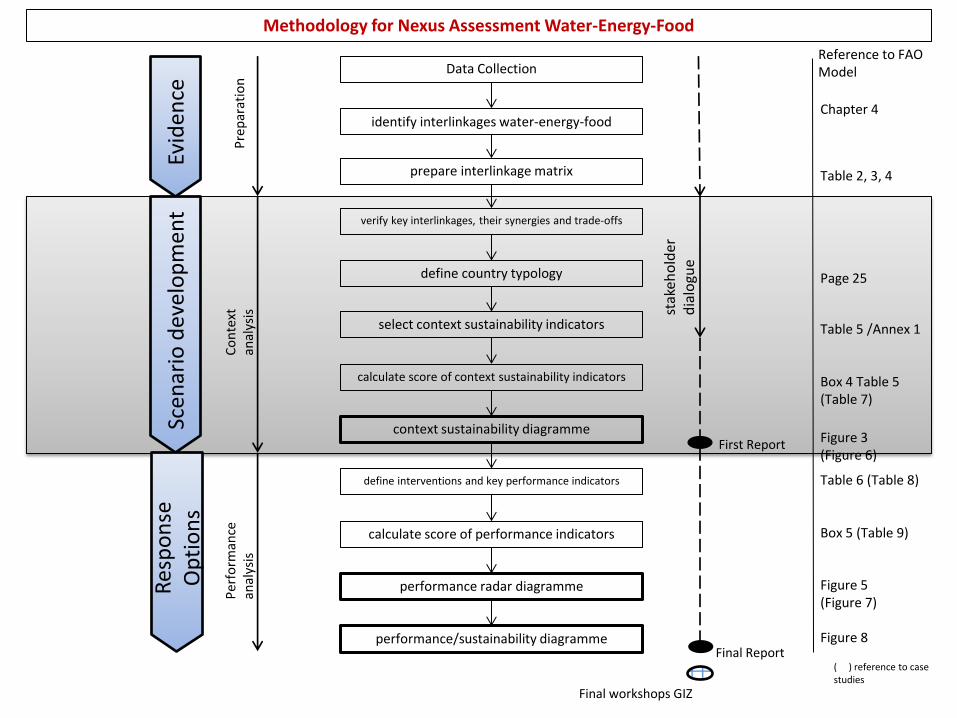
Methodology for Nexus Assessment Water-Energy-Food
Evid
ence
Sc
enar
io d
evel
op
men
t R
esp
on
se
Op
tio
ns
Pre
par
atio
n
Co
nte
xt
anal
ysis
P
erfo
rman
ce
anal
ysis
Final workshops GIZ
Final Report
First Report
stak
eho
lder
d
ialo
gue
Reference to FAO Model
Chapter 4
Table 2, 3, 4
Page 25
Table 5 /Annex 1
Box 4 Table 5 (Table 7)
Figure 3 (Figure 6)
Table 6 (Table 8)
Box 5 (Table 9)
Figure 5 (Figure 7)
Figure 8
( ) reference to case studies
Página 12
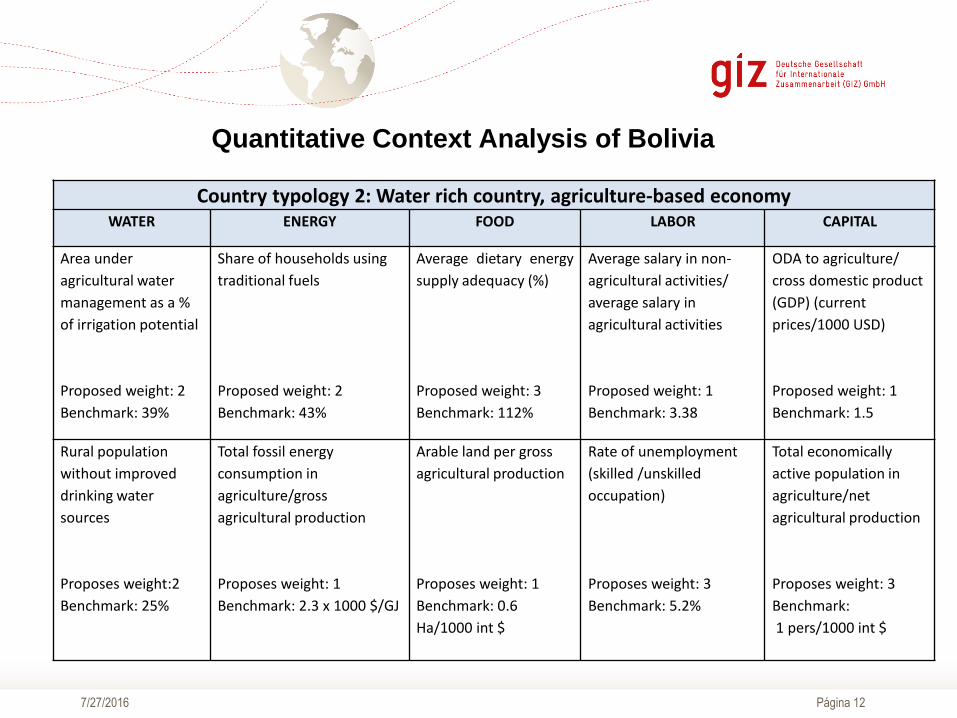
Quantitative Context Analysis of Bolivia
7/27/2016
Country typology 2: Water rich country, agriculture-based economy WATER ENERGY FOOD LABOR CAPITAL
Area under
agricultural water
management as a %
of irrigation potential
Proposed weight: 2
Benchmark: 39%
Share of households using
traditional fuels
Proposed weight: 2
Benchmark: 43%
Average dietary energy
supply adequacy (%)
Proposed weight: 3
Benchmark: 112%
Average salary in non-
agricultural activities/
average salary in
agricultural activities
Proposed weight: 1
Benchmark: 3.38
ODA to agriculture/
cross domestic product
(GDP) (current
prices/1000 USD)
Proposed weight: 1
Benchmark: 1.5
Rural population
without improved
drinking water
sources
Proposes weight:2
Benchmark: 25%
Total fossil energy
consumption in
agriculture/gross
agricultural production
Proposes weight: 1
Benchmark: 2.3 x 1000 $/GJ
Arable land per gross
agricultural production
Proposes weight: 1
Benchmark: 0.6
Ha/1000 int $
Rate of unemployment
(skilled /unskilled
occupation)
Proposes weight: 3
Benchmark: 5.2%
Total economically
active population in
agriculture/net
agricultural production
Proposes weight: 3
Benchmark:
1 pers/1000 int $
Página 13
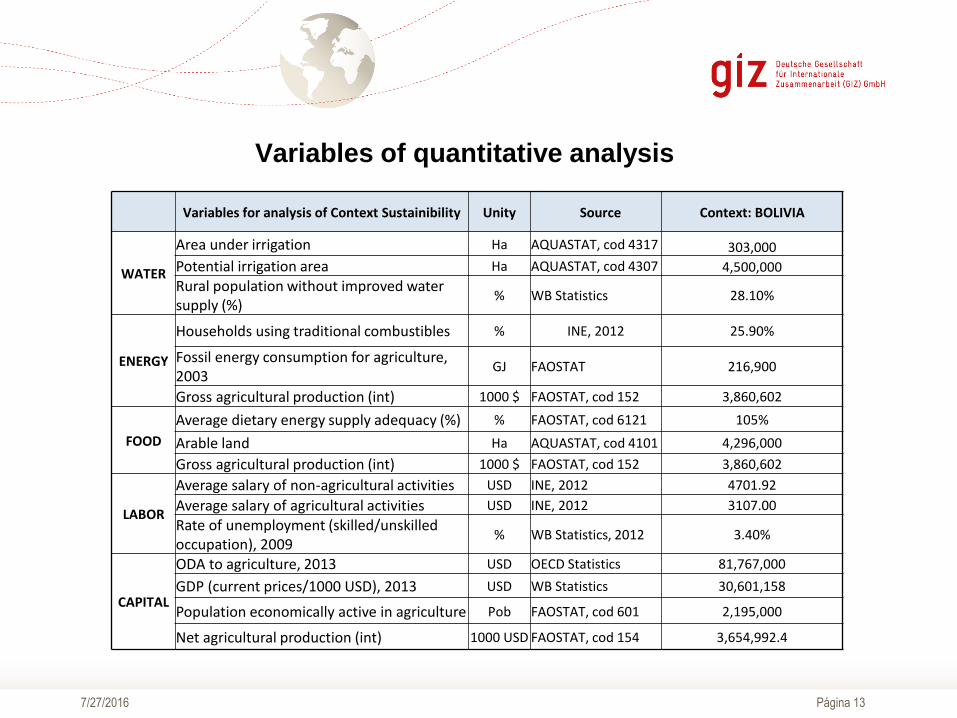
Variables of quantitative analysis
7/27/2016
Variables for analysis of Context Sustainibility Unity Source Context: BOLIVIA
WATER
Area under irrigation Ha AQUASTAT, cod 4317 303,000
Potential irrigation area Ha AQUASTAT, cod 4307 4,500,000
Rural population without improved water supply (%)
% WB Statistics 28.10%
ENERGY
Households using traditional combustibles % INE, 2012 25.90%
Fossil energy consumption for agriculture, 2003
GJ FAOSTAT 216,900
Gross agricultural production (int) 1000 $ FAOSTAT, cod 152 3,860,602
FOOD
Average dietary energy supply adequacy (%) % FAOSTAT, cod 6121 105%
Arable land Ha AQUASTAT, cod 4101 4,296,000
Gross agricultural production (int) 1000 $ FAOSTAT, cod 152 3,860,602
LABOR
Average salary of non-agricultural activities USD INE, 2012 4701.92
Average salary of agricultural activities USD INE, 2012 3107.00
Rate of unemployment (skilled/unskilled occupation), 2009
% WB Statistics, 2012 3.40%
CAPITAL
ODA to agriculture, 2013 USD OECD Statistics 81,767,000
GDP (current prices/1000 USD), 2013 USD WB Statistics 30,601,158
Population economically active in agriculture Pob FAOSTAT, cod 601 2,195,000
Net agricultural production (int) 1000 USD FAOSTAT, cod 154 3,654,992.4

Página 14
Quantitative Context Analysis of Bolivia
7/27/2016
Página 15
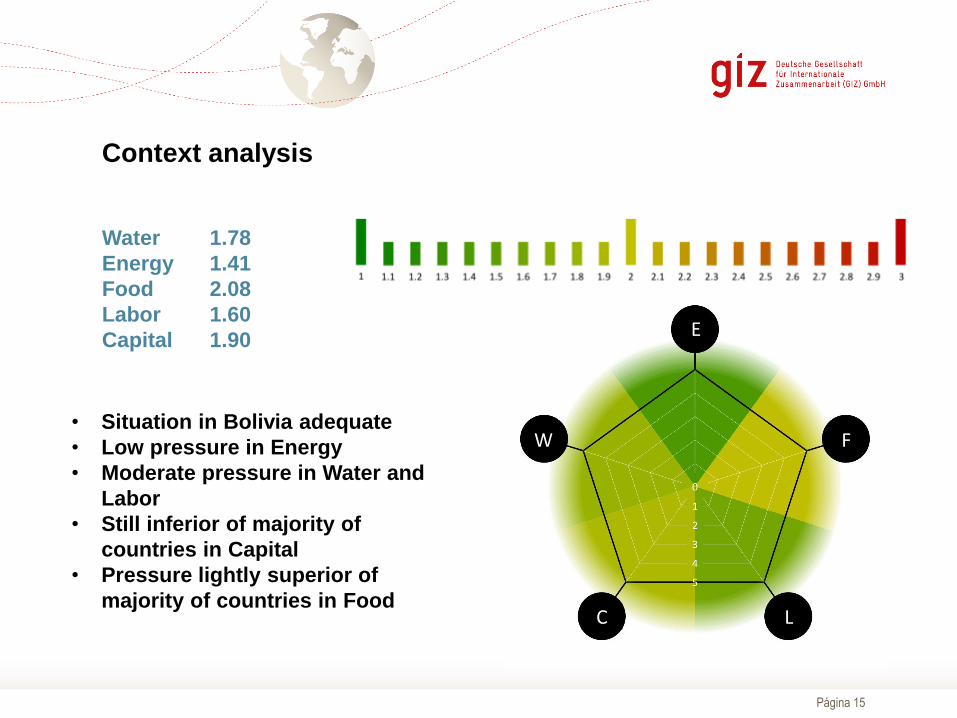
Water 1.78
Energy 1.41
Food 2.08
Labor 1.60
Capital 1.90
• Situation in Bolivia adequate
• Low pressure in Energy
• Moderate pressure in Water and
Labor
• Still inferior of majority of
countries in Capital
• Pressure lightly superior of
majority of countries in Food
Context analysis
E
F
L C
W

Página 16
Variables for analysis of specific project
7/27/2016
Variables para análisis de la
Sostenibilidad del ContextoUnidad
Proyecto: Presa San
Jacinto
Referencia nacional de
Bolivia
Volumen de riego por bombeo Hm3/año 0.77 141.60
Volumen utilizado en riego Hm3/año 7.00 1,920
Energía utilizada en el riego GW-H-año 3.1 82.7778
Superficie de riego ha 1,350 303,200
Producción agricola con riego Tn 9,864 1,800,000
Ingresos generados en agricultura por
riegomiles USD 5,603 1,657,427
Generacion hidroeléctrica GW-H-año 17.97 1,981.2
Area de cuenca/Volumen embalse Km2/Hm3 8.40 13.47
Producción piscicola Tn 70.0 6,585
Precio de energía Miles USD/año 503.06 569,310
Familias beneficiarias de riego
proveniente de presa261.00 283,000
Página 17
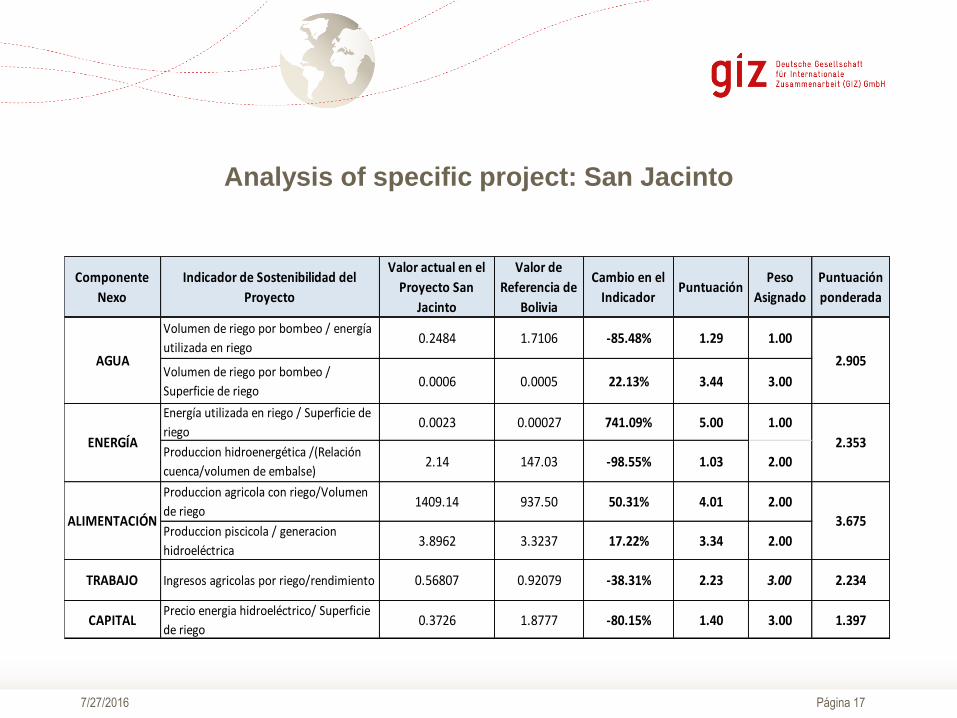
Analysis of specific project: San Jacinto
7/27/2016
Componente
Nexo
Indicador de Sostenibilidad del
Proyecto
Valor actual en el
Proyecto San
Jacinto
Valor de
Referencia de
Bolivia
Cambio en el
IndicadorPuntuación
Peso
Asignado
Puntuación
ponderada
Volumen de riego por bombeo / energía
utilizada en riego0.2484 1.7106 -85.48% 1.29 1.00
Volumen de riego por bombeo /
Superficie de riego0.0006 0.0005 22.13% 3.44 3.00
Energía utilizada en riego / Superficie de
riego0.0023 0.00027 741.09% 5.00 1.00
Produccion hidroenergética /(Relación
cuenca/volumen de embalse)2.14 147.03 -98.55% 1.03 2.00
Produccion agricola con riego/Volumen
de riego1409.14 937.50 50.31% 4.01 2.00
Produccion piscicola / generacion
hidroeléctrica3.8962 3.3237 17.22% 3.34 2.00
TRABAJO Ingresos agricolas por riego/rendimiento 0.56807 0.92079 -38.31% 2.23 3.00 2.234
CAPITALPrecio energia hidroeléctrico/ Superficie
de riego0.3726 1.8777 -80.15% 1.40 3.00 1.397
AGUA
ENERGÍA
ALIMENTACIÓN
2.905
2.353
3.675

Página 18
• Major pressure in Food Due to
productivity lower than the
average (Priority more to quality
of the vid)
• Moderate pressure in Water still
inferior of the average
• Light pressure in Energy and
Labor
• Low pressure in Capital
Analysis of specific project: San Jacinto
Value of the comparison of
indicators Scale of
specific project
>= +100 % 5
+ 50 % 4
0 % 3
- 50 % 2
=< -100 % 1
Water 2.91
Energy 2.35
Food 3.68
Labor 2.23
Capital 1.40
E
F
L C
W
Página 19
Multipurpose Projects
• San Jacinto
Energy generation dependent of other users
• Misicuni and Huacata
Irrigation and Water Supply after energy generation
Drinking water and irrigation have priority!
7/27/2016
Página 20
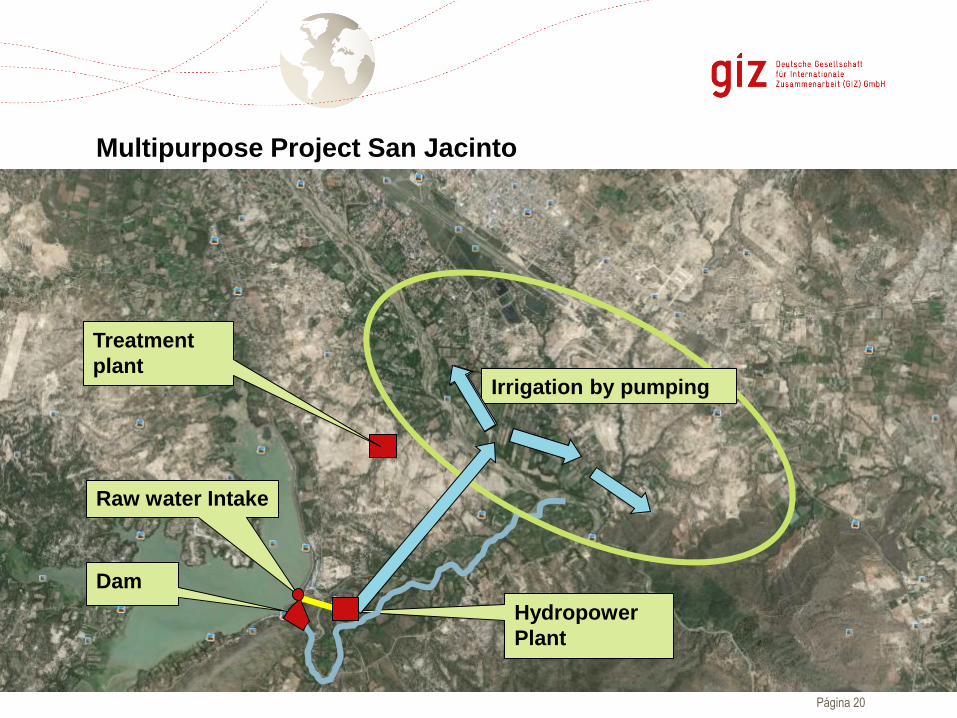
Multipurpose Project San Jacinto
Dam
Raw water Intake
Hydropower
Plant
Irrigation by pumping
Treatment
plant

Página 21
Embalse San Jacinto
Agricultural
areas
Dam
Multipurpose Project San Jacinto
Página 22
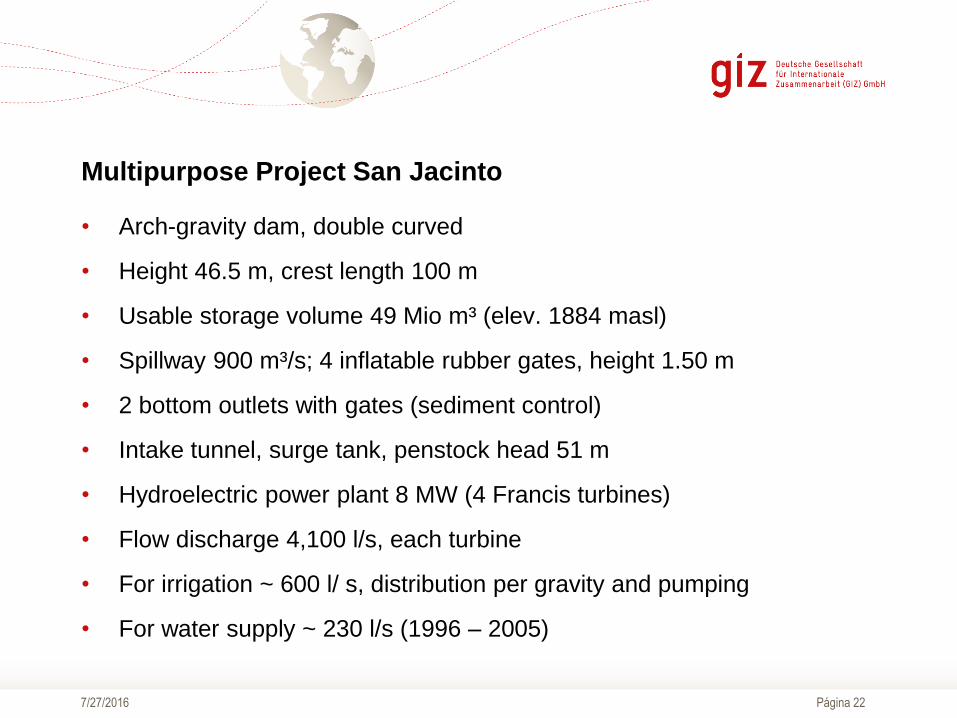
Multipurpose Project San Jacinto
• Arch-gravity dam, double curved
• Height 46.5 m, crest length 100 m
• Usable storage volume 49 Mio m³ (elev. 1884 masl)
• Spillway 900 m³/s; 4 inflatable rubber gates, height 1.50 m
• 2 bottom outlets with gates (sediment control)
• Intake tunnel, surge tank, penstock head 51 m
• Hydroelectric power plant 8 MW (4 Francis turbines)
• Flow discharge 4,100 l/s, each turbine
• For irrigation ~ 600 l/ s, distribution per gravity and pumping
• For water supply ~ 230 l/s (1996 – 2005)
7/27/2016

Página 23
Multipurpose Project San Jacinto
Arch-
gravity dam
Página 24 7/27/2016
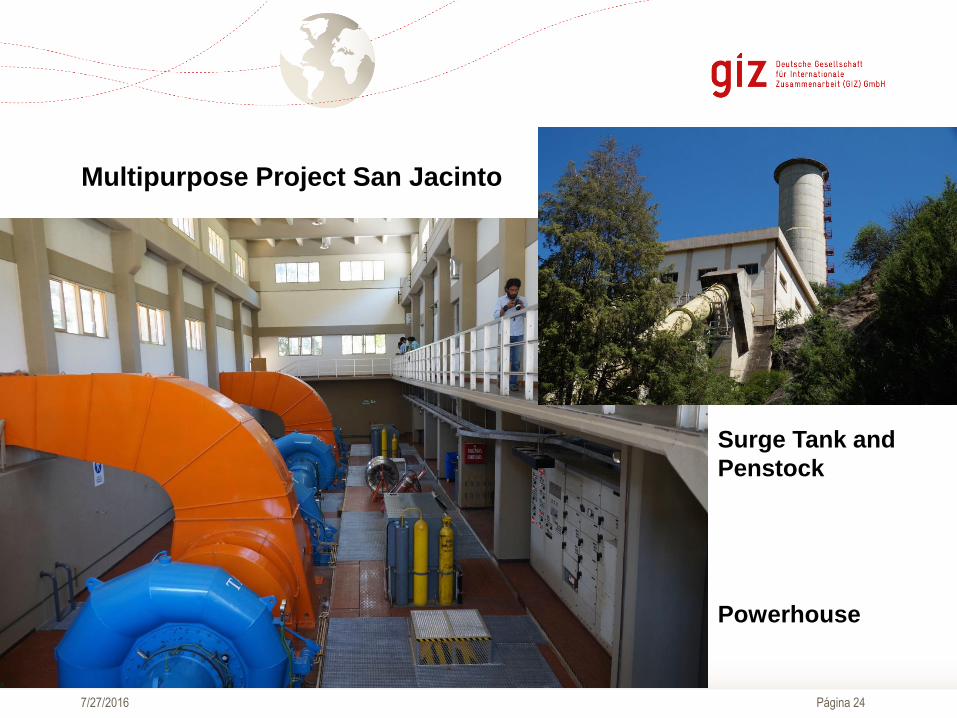
Multipurpose Project San Jacinto
Powerhouse
Surge Tank and
Penstock
Página 25 7/27/2016
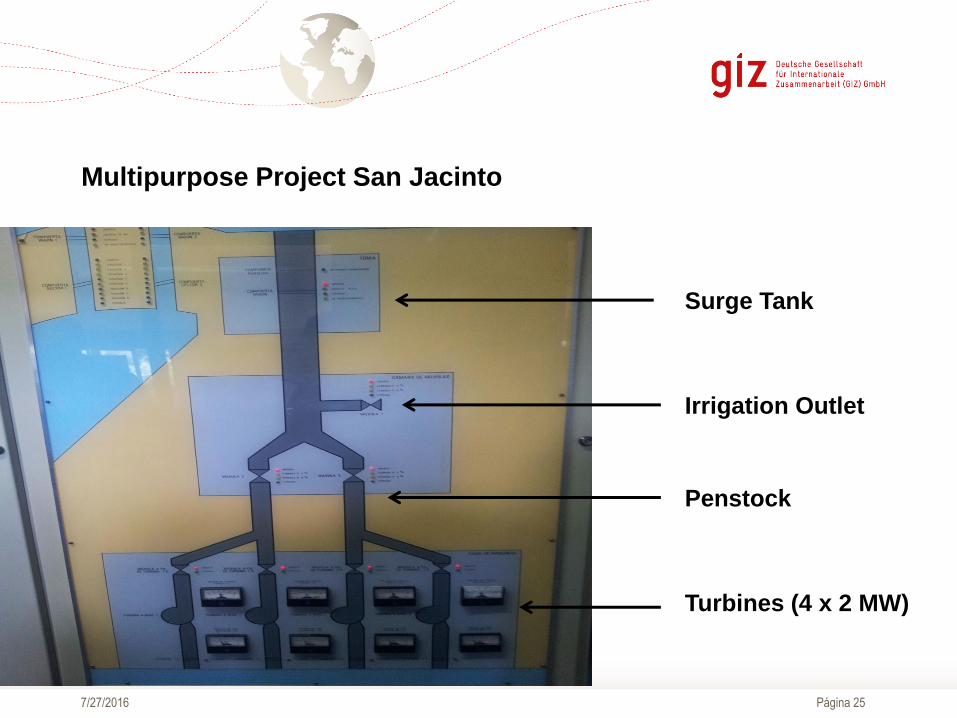
Multipurpose Project San Jacinto
Irrigation Outlet
Penstock
Turbines (4 x 2 MW)
Surge Tank

Página 26
Multipurpose Project San Jacinto
7/27/2016
Treatment Plant
Flocculation
Sedimentation
Página 27
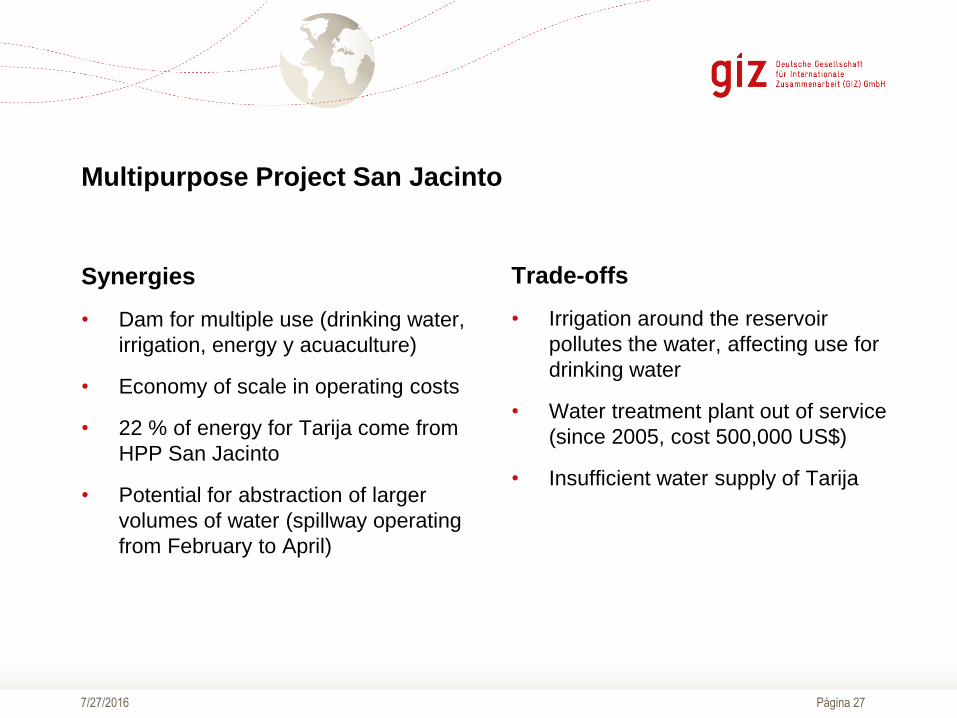
Multipurpose Project San Jacinto
Synergies
• Dam for multiple use (drinking water,
irrigation, energy y acuaculture)
• Economy of scale in operating costs
• 22 % of energy for Tarija come from
HPP San Jacinto
• Potential for abstraction of larger
volumes of water (spillway operating
from February to April)
7/27/2016
Trade-offs
• Irrigation around the reservoir
pollutes the water, affecting use for
drinking water
• Water treatment plant out of service
(since 2005, cost 500,000 US$)
• Insufficient water supply of Tarija

Página 28
Proyecto Multipropósito Misicuni
Dam
Transfer
Tunnel
Penstock
Powerhouse
Reservoir
Surge Tank

Página 29
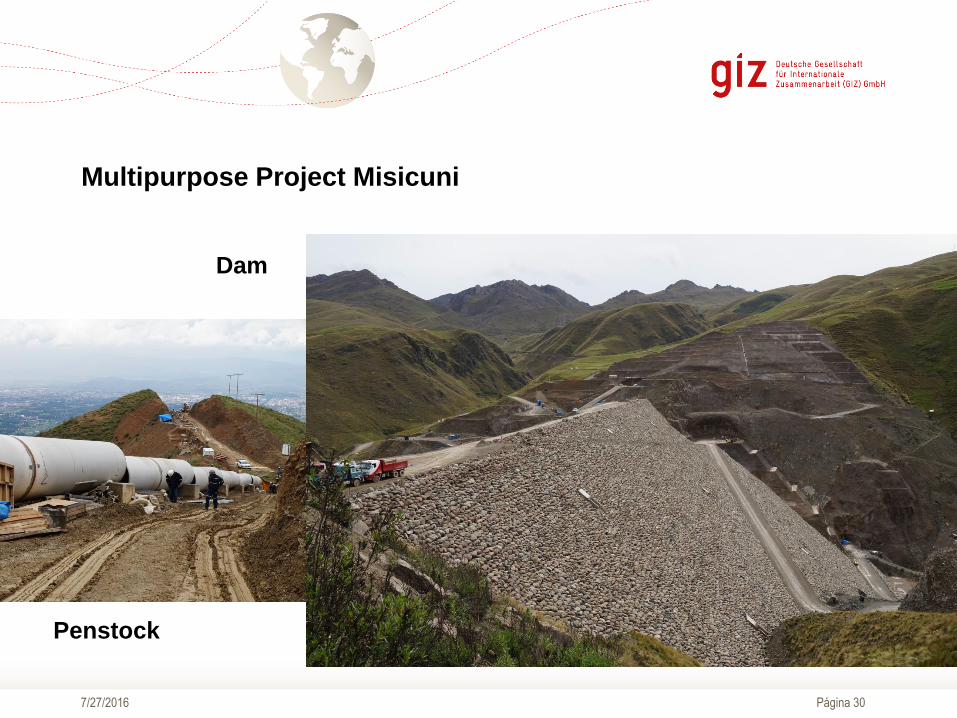
Proyecto Multipropósito Misicuni
• Concrete Faced Rockfill Dam (CFRD)
• Height 120 m, crest length 434 m (elev. 3784 masl)
• Spillway, capacity1200 m³/s (PMF)
• Total storage volume 185 Mio m³, active storage volume 154 Mio m³
• Storage area 4.6 km² (elev. 3774 masl)
• Transfer tunnel 19 km
• Penstock length 3.8 km, with surge tank
• Total head 1020 m
• Hydropower Plant 80 MW (120 MW),
• Annual generation 217 GWh
• Total discharge 3 m³/s, 2 m³ for water supply, 1m³ for irrigation of 4000 Ha
Página 30
Multipurpose Project Misicuni
7/27/2016
Dam
Penstock
Página 31
Proyecto multipropósito Huacata
• Presa derivadora sobre Rio Huacata
• Canal de trasvase de 4 Km, caudal 860 l/s
• Presa de enrocamiento con cara de hormigón, altura 27.5 m
• Vertedero 18 m³/s (tipo bico de pato)
• Volumen útil de embalse 13.8 Mio m³, Area 154 Ha
• Tunel de trasvase 900 m, caida 550 m (por quebrada natural)
• Canal de salida de 10 Km, area de riego 1000 Ha
• Caudal para riego 600 l/s, agua potable 260 l/s
• Planta Hidroeléctrica 5.5 MW Pelton (a construir)
7/27/2016

Página 32
Multipurpose Project Huacata
7/27/2016
Diversion Dam
Huacata Reservoir
Página 33
Preliminary Reflections
• Management Model to ensure its sustainability
• Define policies for operation of the dam (rules and priorities)
• Improve irrigation efficiency (encouraging
• Renewable Energy through sustainable tariffs
• Business Model for different multipurpose projects
• Ensure protection strip around the reservoir
• Sediment control
• Concept of use for multiple uses (San Jacinto generation of independent
energy; Misicuni Huacata using turbined water)
• Prohibit the change of land use in the basin
• Integrated Management of the River basin (MIC)
7/27/2016

Página 34 7/27/2016
Thanks for your attention!

Página 35
ANEXOS
7/27/2016
Página 36
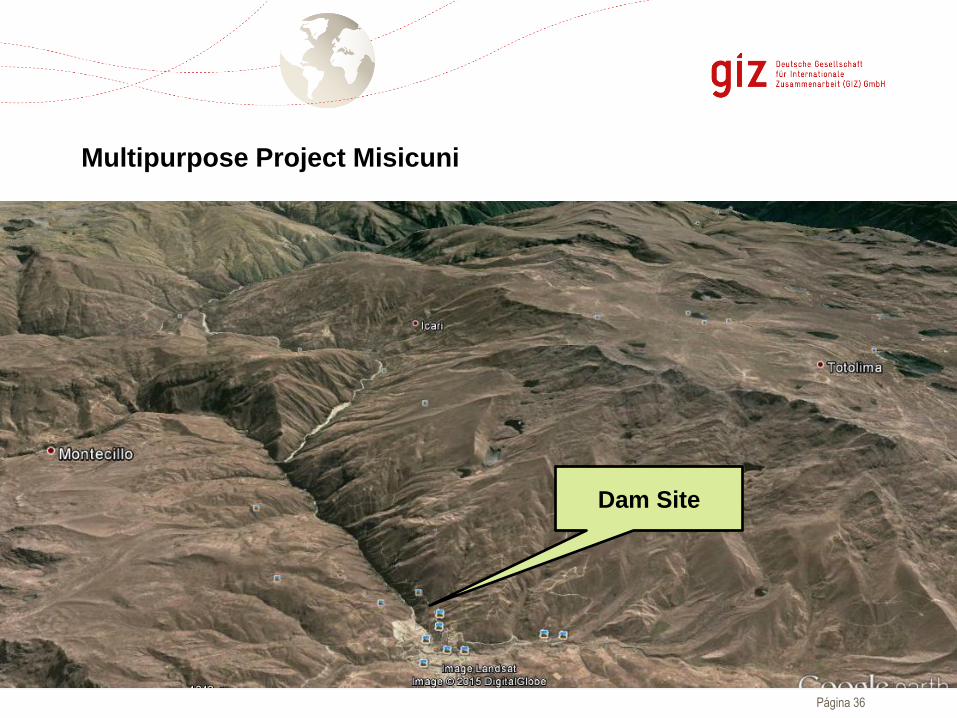
Multipurpose Project Misicuni
Dam Site
Página 37
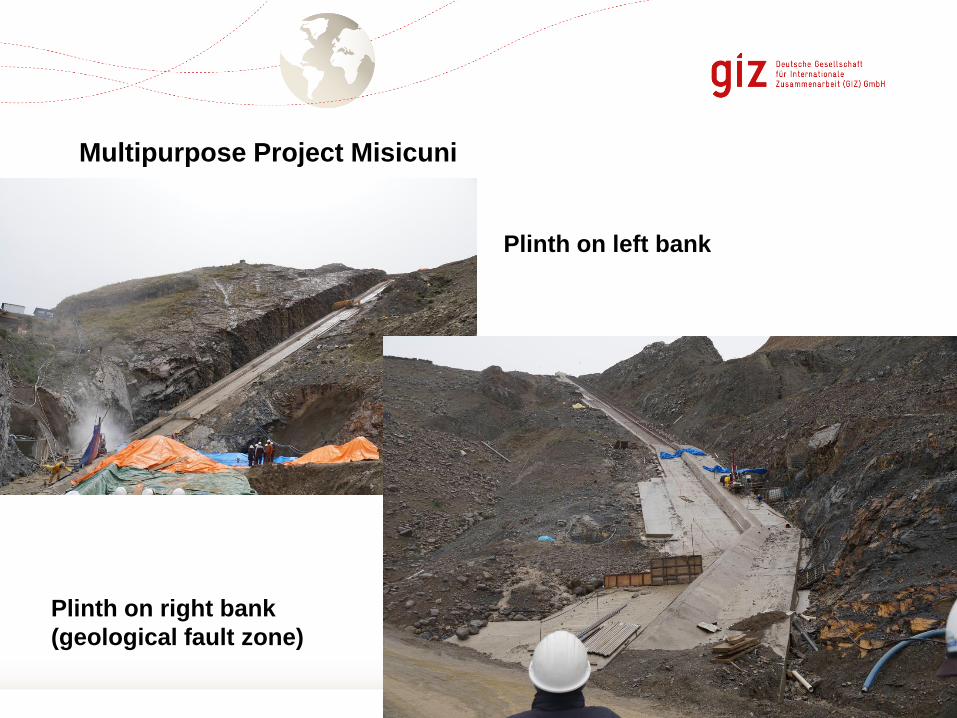
Multipurpose Project Misicuni
Plinth on left bank
Plinth on right bank
(geological fault zone)

Página 38
Multipurpose Project Misicuni
Dam site
Entrance of
Transfer Tunnel
Site camp
Página 39
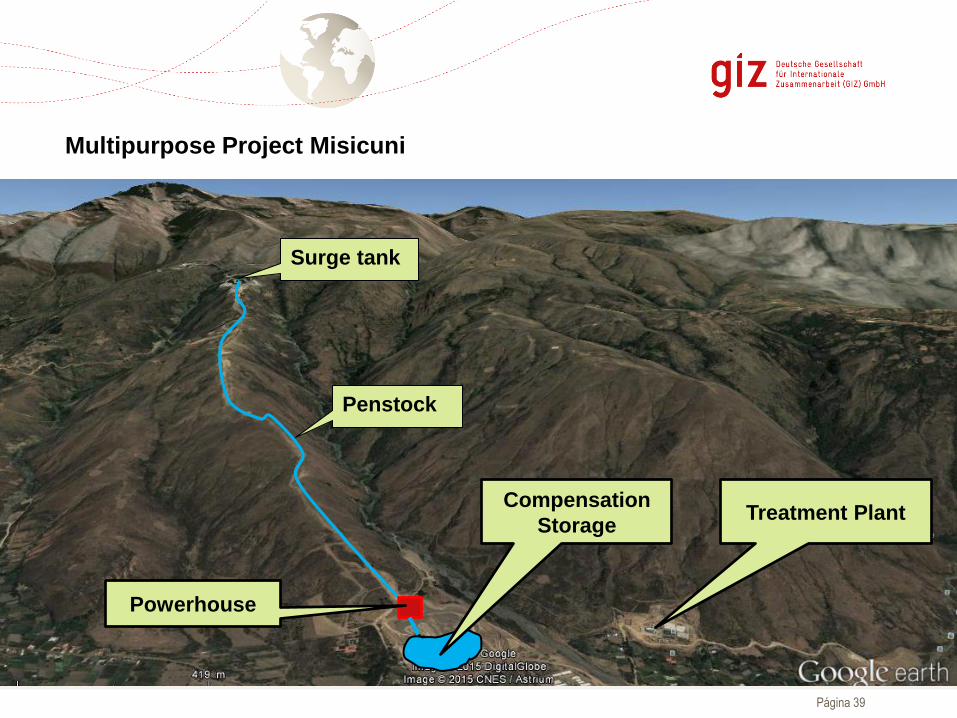
Multipurpose Project Misicuni
Powerhouse
Treatment Plant Compensation
Storage
Surge tank
Penstock
Página 40
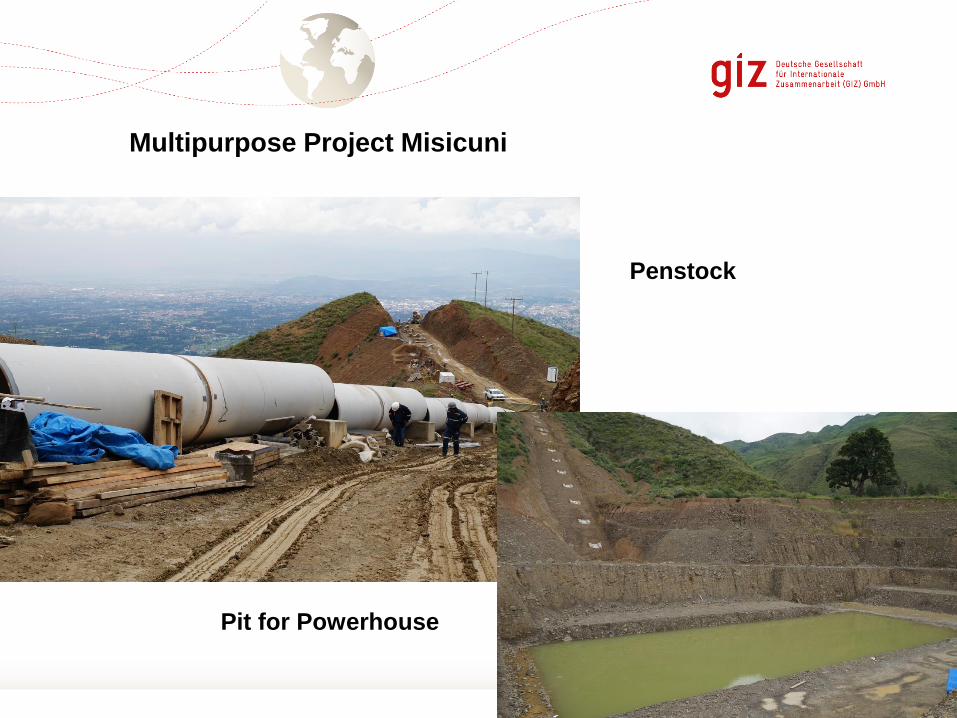
Penstock
Pit for Powerhouse
Multipurpose Project Misicuni

Página 41
Compensatioon
Storage
Treatment Plant
Multipurpose Project Misicuni
Página 42
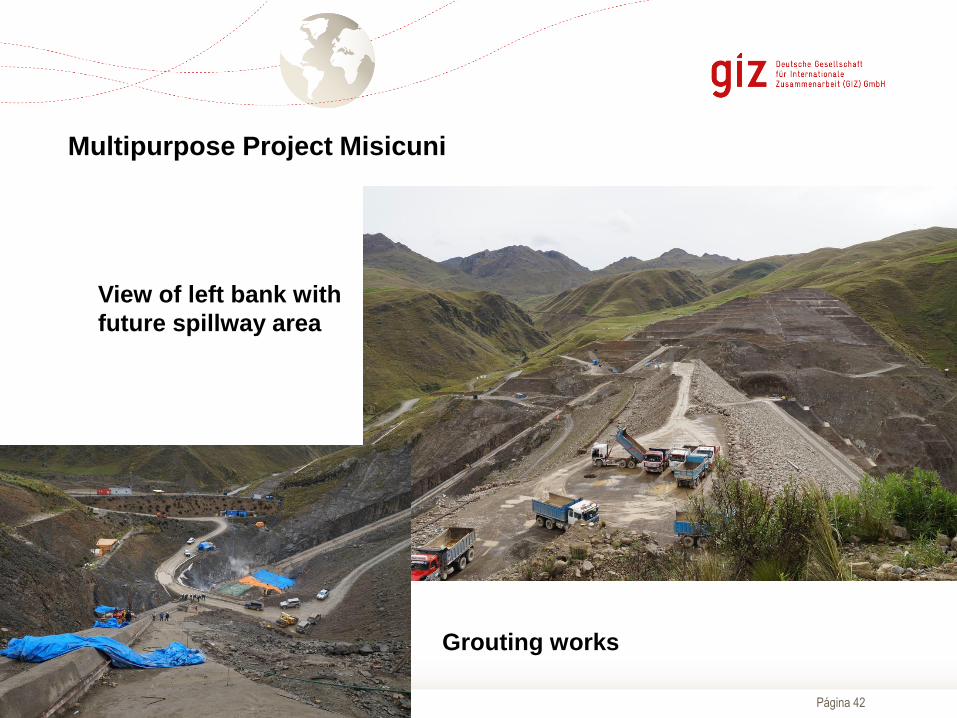
Multipurpose Project Misicuni
View of left bank with
future spillway area
Grouting works