first farmer survey results_final
TRANSCRIPT

1
REPORT
Smallholder Farmers’ Attitudes on
Improved Storage Based on
Exposure to New Technology and
Information
AflaSTOP: Storage and Drying
For Aflatoxin Prevention
January 2016

2

3
Prepared by: Bryn Davies Sophie Walker In collaboration with: Danya International
The AflaSTOP: Storage and Drying for Aflatoxin Prevention (AflaSTOP) project is identifying the most promising storage options to arrest the growth of aflatoxin and designing viable drying options that will allow smallholder farmers to dry their grain to safe storage levels. The project works to ensure that businesses operating in Africa are able to provide these devices to smallholder farmers. It is jointly implemented by ACDI/VOCA and its affiliate Agribusiness Systems International (ASI) under the direction of Meridian Institute. For more information on AflaSTOP and other key reports and resources, visit: www.acdivoca.org/aflastop-publications. This work was carried out as a partnership between Danya International and Agribusiness Systems International (ASI) through the AflaSTOP project to identify potential drying technology suited to support post-harvest handling devices for maize smallholder farmers.

4
Contents Executive Summary ................................................................................................................. 5
1.0 Background Information ................................................................................................. 8
1.1 AflaSTOP Program Background .................................................................................. 8
1.2 Study Design ............................................................................................................... 8
1.3 AflaSTOP Project Phase 2 Implementation Steps ....................................................... 9
2.0 Pre-Test Survey Findings ..............................................................................................11
2.1 Respondent Background Information ..........................................................................11
2.2 Study Participants’ Demographics ..............................................................................11
2.3 Land Tenure and Maize Cultivation ............................................................................12
2.4 Management of Maize from the Farm .........................................................................15
2.4.1 Maize Drying ..........................................................................................................15
2.4.2 Maize Shelling ........................................................................................................15
2.4.3 Treatment of Shelled Maize ....................................................................................16
2.4.4 Maize Storage ........................................................................................................18
2.4.5 Maize Sales............................................................................................................19
2.4.6 Maize Consumption ................................................................................................21
2.4.7 Storage Issues & Willingness to Pay for Storage Containers ..................................22
2.5 Aflatoxin Awareness ........................................................................................................25
3.0 Discussions and Conclusion ...........................................................................................27
Study Limitations ....................................................................................................................28
Other recommendations ........................................................................................................28
ANNEXES ................................................................................................................................29
Annex Analysis Table 1: Land ownership in control versus intervention study participants ....29
Annex Analysis Table 2: Land ownership versus gender .......................................................29
Annex Analysis Table 3: Average yield per acre versus type of maize seed planted .............30
Annex Analysis Table 4: Willingness to pay versus acreage of land owned ...........................30
Annex Analyss Table 5: Willingness to pay versus occupation of household head and education ...............................................................................................................................31

5
Executive Summary
The AflaSTOP: Storage and Drying for Aflatoxin Prevention (AflaSTOP) project is identifying the most promising storage options to arrest the growth of aflatoxin during storage and designing viable drying options that will allow smallholder farmers to dry their grain to safe storage levels. The project works to ensure that businesses operating in Africa are able to provide these devices to smallholder farmers. It is jointly implemented by ACDI/VOCA and its affiliate Agribusiness Systems International under the direction of Meridian Institute. For more information on AflaSTOP and other key reports and resources, visit: www.acdivoca.org/aflastop-publications.
Aflatoxin is a naturally occurring, highly toxic residue from strains of the aspergillus fungus found in soil. Aflatoxin has many serious long-term health implications and is a significant concern in the maize and groundnut industries. The invisible toxin is linked to liver disease and cancer and is associated with immune-system suppression, growth retardation, and death in both humans and domestic animals. Maize in Kenya and many other parts of Africa is already contaminated when it is harvested, and the fungus continues to grow despite farmers’ attempts to dry their maize.
Linking scientifically rigorous research with human-centric design and grounded in marketplace realities, the project consists of three core components:
Storage: scientific testing of storage devices in controlled conditions and field testing with smallholder farmers
Drying: research, design, testing, fabrication, and adaptation of potential drying solutions
Commercialization strategy development: tailored investigation and validation of the commercial viability of each storage and drying product
The analysis in this report covers the first component – Storage. There will be three rounds of surveys covering a 12-month period, as described below:
Round 1: Explores the baseline attitudes and practices of smallholder farmers
Round 2: Gauges smallholder farmers’ attitudes after using one of three devices
Round 3: Determines if smallholder farmers’ attitudes and practices are influenced once they are told the aflatoxin status of their maize (i.e. the level of contamination)
This report contains the findings of Round 1 surveys.
AflaSTOP began its storage work by researching whether any storage devices then
available in the Kenyan market had the ability to arrest the increase of aflatoxin levels
during storage. AflaSTOP conducted off-farm testing of six storage devices, three of
which were found to be very effective1 at limiting the growth of aflatoxin during storage.2
The three devices (PICS 90 Kg bags, 180-3000 Kg artisan metal silos, and a 1,000 Kg
GrainPro Grain Safe) are currently being tested further in on-farm environments with
smallholder farmers.
Once the effective devices were identified, the AflaSTOP project conducted a pre-test
survey to collect data from smallholder farmers in Machakos and Makueni Counties,
Kenya that would help to establish baseline behavior, as well as attitudes and
willingness to pay for different maize storage devices. Eight enumerators from the local
communities conducted the data collection, and 175 farmers (125 from intervention and
50 from control) were sampled. The purpose of the control group was to verify that the 1 Very effective was defined as limiting monthly growth to below 5%. 2 The full report, entitled “The Comparative Effects of Hermetic and Traditional Storage Devices on Grain: Key Findings from AflaSTOP’s “Off-Farm” Controlled Tests in Eastern Kenya,” can be found at http://acdivoca.org/sites/default/files/images/aflastop/Kenya-AflaSTOP-Off-Farm-Hermetic-Storage-Key%20Findings%20Report_final.pdf

6
intervention farmers were not statistically different from general smallholder farmers in
the area, and to see whether the aflatoxin awareness meetings changed any responses
significantly. Analysis of the data showed that the intervention farmers were not
statistically different in terms of their characteristics, behavior, or opinions with the
general farming population.
With this background in mind, this report details the AflaSTOP project, outlines the
study design, and presents the pre-test survey findings. In terms of AflaSTOP's agenda
at promoting storage that arrests aflatoxin, farmers’ cash expenditure around their crops
is an interesting indicator of where they might be willing to spend limited resources.
The Round 1 Baseline Survey highlighted the following:
83% of farmers store maize for consumption and later sales
90.3% pay for actellic insecticide
97% of farmers have invested in some form of dedicated storage structure
85% of farmers spent money on hybrid seeds, either using a single hybrid
variety, a combination of hybrids, or a mix of hybrids and traditional varieties
66% of farmers had invested in some type of tarpaulin to dry their crops on
Approximately 60% of farmers indicated that they would be willing to pay
between Kshs 50-200 per bag more to protect their maize from insects (Ksh100
was the most often indicated price), however, the least expensive device being
tested costs Ksh250 per bag
Considering this and what farmers spend towards farm inputs, AflaSTOP will review
whether the farmers willingness to pay increases as they become aware of the
effectiveness of the device and the actual price of the device that they are using.
It is also important to note that farmers appear to have a potentially weak understanding
of the actual size of their land, their yields per acre, and the amount they consume. That
said, questions related to the total number of bags on a specific issue appear to be
more accurate than bags per acre, or kilograms of maize consumption per person per
week, etc.
The following are other highlights from our Baseline Survey:
Most of the land for maize farming is owned by individuals with an average
estimated land ownership of 4.26 acres, of which an estimated 60% was planted
with maize during the September/October 2014 planting season.
Of farmers surveyed, the average yield of maize is approximately 3.29 bags of 90
Profile of the Average AflaSTOP Survey Farmer
Owns 4.26 acres of land
Completed secondary school
Main occupation is farming
Harvested 9.44 bags (90 kgs each) in February 2015
Sells approximately 4 bags of maize at harvest for cash needs
Buys hybrid seed and uses local varieties
Weevils are biggest post-harvest problem
Stores maize in separate silo near house
Willing to pay an additional Ksh 100 per bag to stop insect problem
Aware of aflatoxin

7
kg per acre, however, this did not match the estimated yield per acre figure
provided by the farmers.
Of the total farmers, 78.3% reported that they sell part of their maize after
shelling (12% selling earlier), while about 33.7% of the farmers later purchase
some maize from the market for household consumption.
In 2015, an average of 6.14 bags per person were sold immediately after harvest
with the average family saving 4.66 bags for household consumption (again, the
numbers did not match with yield numbers).
Over 90% of farmers sold maize at harvest to meet household expenditure
needs, including costs related to farming.
Insects, especially weevils, cause most of the storage maize problems, however
only 8.5% of farmers sold maize at harvest because they were concerned about
insects.
Of the study participants, 99.4% claim to be aware of aflatoxin.
These findings highlight a number of interesting issues. First, the reasons for sale at
harvest are not necessarily related to storage, insect, or rat concerns, but rather more
likely attributed to farmers' cash needs. Farmers understand that prices normally go up
through the year. However, the assumption that sales of improved storage will be driven
by farmers’ previous lack of access to and awareness of such devices may effectively
be false. While it was hoped that with improved storage farmers would sell more later in
the season and make higher profits or have more stable access to grain stores to eat for
more months of the year, they appear to be more constrained by their limited cash
liquidity at harvest, with food security and profit motivation being secondary
considerations. Therefore, encouraging farmers to invest in better storage might not
necessarily motivate them to keep their maize longer – they may still sell maize at
harvest to address their cash liquidity, leading to the same potential food insecurity
when their homegrown maize stocks are depleted. However, the quality of their food
should be better through the use of improved storage and we will gauge their
appreciation for this through the next stages of our study.
That said, these farmers have seemingly adopted low-risk, low growth strategies when it
comes to maize cultivation and production. For example, they pay for hybrid seed but
very few pay for fertilizer. This may indicate that their willingness to pay or “gamble” on
a new storage method might be much lower than we previously anticipated

8
1.0 Background Information and Introduction
1.1 AflaSTOP Program Background
The AflaSTOP project aims to develop and commercialize new technologies for post-
harvest storage and drying of staple crops to help prevent and control the spread of
aflatoxin. AflaSTOP uses a market-led approach, coordinating closely with the
Partnership for Aflatoxin Control in Africa (PACA). The project, funded by the Bill &
Melinda Gates Foundation (BMGF) and the United States Agency for International
Development (USAID), and awarded to Meridian Institute in March 2012, is co-
implemented by ACDI/VOCA and ASI.
AflaSTOP is not only identifying the most promising storage options and dryers that will
arrest the growth of aflatoxin, but also ensuring that the storage options are accessible
to smallholder farmers through African businesses. Beginning 2014, the project was to
select, test, and deploy low-cost storage and drying options for maize and other staple
grains in Kenya.
Phase 1 of the project involved off-farm testing of six storage devices, out of which three
were found to be very effective3 at limiting the growth of aflatoxin during storage. The
three devices—a PICS 90 Kg bags, 180–1000 Kg artisan metal silos, and a 1,000 Kg
GrainPro bulk bag plus frame—are to be tested further in on-farm environments.
The activities are being carried out in Kenya, but the intent is that the innovations
generated can be scaled up and applied elsewhere. On-farm testing of the three
storage devices was initiated in Kenya in early 2015.
1.2 Study Design
A matched pair design was used to test the effect of storage training on the efficacy of
the devices to control aflatoxin levels. One hundred and fifty farming families were
selected and split into three groups of 50. Each group of 50 families received one of the
three storage devices based on the volume of grain they store. Each group of 50
families was split further into two groups of 25. Each farming family was paired with a
similar farming family to achieve parity between the trained and non-trained farmer for
each device, as much as possible. One group of 25 received training on how to use the
device they were loaned, and the other group of 25 was loaned the device and the
manufacturer’s instructions supplied without further training. The devices were provided
on loan for use during the study period, with the option to purchase them at the
conclusion of testing.
Respondents were selected purposively based on maize acreage and volumes of maize
available to store.
The trained and non-trained farmers were deliberately located about 10–20 km away
from each other to prevent training knowledge transfer by the farmers.
3 Very effective was defined as limiting monthly growth to below 10%.

9
Location 1
Location 2
To test the effects that training has on adoption attitudes and willingness to pay \, we
sampled a group of 50 farmers that does not use any of the three devices to act as a
control. Due to logistics, the control group of farmers was selected within the same
project region, but from a different sub-county to avoid any contamination. Data was
collected from this group twice: at the beginning4 and the end of the study. Unlike the
150-paired farmers, grain was not sampled from the 50 farmers who were not provided
with the storage devices in control.
1.3 AflaSTOP Project Phase 2 Implementation Steps
To date, the following activities have been implemented as part of AflaSTOP Phase 2 of
the project:
Recruitment and training of field data collection assistants in March 2014
Finalization of study design, including development of data collection tools in
February 2015
Translation and pre-testing of the data collection tools in February 2015
Conducting pre-test survey field data collection in March 2015
Distribution of storage devices to the project study team in March 2015
Monthly household sampling of stored maize and household interviews since
April 2015
The following are some of the Phase 2 project activities that are continuing or pending:
Monthly household interviews, data analysis, and brief monthly reports
Round 2 household field data collection summarizing any changes in attitudes of
farmers toward storage issues after receiving the devices
Summary report of any changes in attitudes of farmers toward storage issues
after using the devices (disaggregated by treatment group)
Summary report of any changes in attitude of farmers toward storage issues after
receiving information on the aflatoxin level of the maize they stored
4 Already done during the pre-test survey.
Storage Device 1
25 trained farmers
Storage Device 2
25 trained farmers
Storage Device 3
25 trained farmers
Storage Device 1
25 non-trained farmers
Storage Device 2
25 non-trained farmers
Storage Device 3
25 non-trained farmers
Farmer Pairing
Storage Device 1
25 trained farmers
25 non-trained farmers
Storage Device 2
25 trained farmers
25 non-trained farmers
Storage Device 3
25 trained farmers
25 non-trained farmers

10
Summary report of findings from all rounds of data collection sessions
This is the round 1 report for the pre-test survey, which will form part of a series of
reports within AflaSTOP Phase 2 project activities.

11
2.0 Pre-Test Survey Findings
The pre-test survey was conducted in March 2015. The overall objective was to
document key characteristics of the farmers participating in Phase 2 trials with special
attention on attitudes toward storage practices and to assess any significant differences
between the intervention and control farmers.
2.1 Respondent Background Information
The pre-test survey covered 175 respondents drawn from 14 locations, 3 divisions, and
2 sub-counties within Machakos and Makueni counties. More than three quarters
(77.1%) of the respondents were sampled from Makueni, while the remaining 22.9%
were from Machakos (Table 1). Of the respondents, 71.4% were intervention
participants, with the remaining 28.6% sampled from control sites. Although the
proportion of females (55.4%) was slightly higher than males (44.6%) among all study
respondents, the number of men and women in the control arm was split 50/50.
However, slightly more females (57.6%) were interviewed from the intervention group
compared to males (42.4%).
Table 1: Distribution of Study Participants by County
Intervention
Category
Number Interviewed by County Total
Control Intervention
Machakos 27 13 40
Makueni 23 112 135
Total 50 125 175
2.2 Study Participants’ Demographics
In terms of the level of education attained, 9.7% of the respondents had
college/university education, 49.2% had secondary, while 38.3% had a primary level of
education. 1.7% of all the respondents reported having no level of education at all.
Details of the education level attained are presented in Table 2.
Table 2: Percentage of Respondents by Level of Education by Study Category
Level of Education
Attained
Percent who Attained Level (N=175)
Control Intervention Median
College/University 12.0% 8.8% 9.7%
Secondary 50.0% 48.8% 49.2%
Primary 32.0% 40.8% 38.3%
Adult Literacy Classes 2.0% 0.8% 1.1%
No Education 4.0% 0.8% 1.7%
Of all the respondents, 81.2% were married, with most of them (74.9%) married and
living together with their spouses at the time of this survey. A small group among the
married respondents (6.3%) reported that their spouses were living away from the
family.
Of the total respondents, 16.6% were either widows or widowers, while only a small
proportion (2.3%) of all the respondents were single. The average family size of those
living at the house during the survey period was 6.6, with a median of 6. Details of the
median family size living in the study households during this assessment are presented
in Table 3.

12
Table 3. Median Family Size Across All Categories*
Age Median Number in Family
Male Female Total
Adults (18+) 2.0 2.0 4.0
Children (<18) 1.0 1.0 2.0
Total 3.0 3.0 6.0
*Negligible variation between Control/Intervention Groups
Of all the respondents, 84% were the heads of their households. In addition, 74.9% of
the heads of the households were reported to be males, compared to 25.1% females. In
terms of decision-making, 100% of the respondents reported that they make decisions
in their households, including those who were not the heads of their households.
Farming is the main occupation of most of the respondents (80.6%) followed by off-farm
self-employment (9.7%) and salaried employment (6.9%), as outlined in Table 4.
Business or petty trade formed part of the “Others” category as their main occupation. It
is relevant to note that while the intervention group reported levels of salaried and off-
farm employment, the control group had much lower levels of income from sources
other than farming.
Table 4: Main Occupation of the Respondents
Main Occupation Control Intervention All
Farming/crop production 94% 75.2% 80.6%
Salaried employment 0% 9.6% 6.9%
Farming + Salaried Employment 0% 2.4% 1.7%
Self-employed off farm 6% 11.2% 9.7%
Others 0% 1.6% 1.1%
2.3 Land Tenure and Maize Cultivation
Although the study area has two maize planting seasons in a year, the pre-test study
focused on the main maize-harvesting season. Planting for the main harvest is done
around September/October. Therefore, respondents were asked whether they had
planted maize during the September/October 2014 farming season. One hundred
percent (100%) of the study participants from both control and intervention groups
planted maize during that season.
4.3 4.16 4.26
2.75 2.72 2.74
2.21
1.51.13
0
1
2
3
4
5
Project Control All
Figure 1: Average acres of land by Category
Individual
Family
Rented

13
Land was either individually owned, family owned, or rented; 85.7% of the respondents
owned land under an individual tenure system with land sizes ranging from 0.25–30
acres, 36.0% owned family land with sizes ranging from 0.5–13.0 acres, while 10.9% of
the study team reported renting land with sizes ranging from 0.5–13 acres (Table 5).
Table 5: Land Ownership During September/October 2014 Farming Season
Acres # Respondents % Total (175)
Individual
75.2%
None 25 0.14
.01 – 1 22 0.13
1.01 – 2 35 0.20
2.01 – 5 63 0.36
5.01 – 10 22 0.13
10+ 8 0.05
Family
20.4%
Acres # Respondents % Total (175)
None 112 0.64
.01 – 1 21 0.12
1.01 – 2 19 0.11
2.01 – 5 18 0.10
5.01 – 10 4 0.02
10+ 1 0.01
Rented
4.4%
Acres # Respondents % Total (175)
None 156 0.89
.01 – 1 11 0.06
1.01 – 2 5 0.03
2.01 – 5 1 0.01
5.01 – 10 2 0.01
10+ 0 0.00
Although there was no difference in average land ownership acreage between
intervention and control study groups (p = 0.2925, ref., Annex Analysis Table 1),
differences in average land sizes owned was noted by gender. On average, men owned
larger tracks of land; 5.3 acres compared with women who owned an average of 3.17
acres (p = 0.0057, ref., Annex Analysis Table 2). Furthermore, there was no
relationship between renting the land and the income source of the head of household,
whether farming, salaried, or self-employed off-farm. Additional analysis did not show
education as an indicator of the ability to earn or renting the land.
Of the total land owned during the September/October 2014 farming season,
approximately 59% was used for maize cultivation. It is interesting to note that 88% of
rented land was under maize cultivation versus family land being 50.5% dedicated to
maize and individual land at 60%. This is further detailed in Table 6.
Table 6: Percentage of Land Planted with Maize
Control Intervention All
Individual 67% 57% 60%
Family 58% 49% 51%
Rented 100% 83% 88%
Of the land planted with maize, the average total yields for February 2015 harvests was 9.44 bags, with a median of 7 bags. This was harvested from an average of 2.87 acres planted with maize out of a total average land size of 4.84 acres used by the study

14
participants, for an average yield per acres of 3.29 bags. Interestingly, when farmers were asked to estimate their yield, they reported an estimated yield per acre of 2.66 bags during that season. The higher number is more likely to be correct. Both the estimated and actual yields are low due to poor use of inputs, such as fertilizer, and poor growing conditions, which are normal in this area.
A total of six hybrid maize varieties besides the traditional/local seeds were planted by
the farmers during the September/October 2014 farming season. Many of the farmers
reported planting a combination of seed varieties, either in one plot or in separate plots.
However, when considered individually, the Duma variety of seeds was the most
popular, planted by 17.7% of all respondents, closely followed by Pioneer (14.9%) and
DK (5.1%). Meanwhile, 15.4% of the study population only planted local/traditional
maize during the season (Table 7); 66.2% of all the study farmers planted hybrid maize
seeds, either single varieties (42.2%) or a combination of hybrid varieties (24.0%).
Table 7: Maize Varieties Planted During the September/October 2014 Season
Type Control Intervention All
Hybrids
Duma 8.0% 21.6% 17.7%
Pioneer 4.0% 19.2% 14.9%
DK 16.0% 0.8% 5.1%
DH 04/02 2.0% 3.2% 2.9%
KDVE 0% 0.8% 0.6%
Panar 4.0% 0% 1.1%
Local Local/Traditional 18.0% 14.4% 15.4%
Combinations
Local/Traditional + Hybrids
20.0% 17.6% 18.3%
Hybrid Combinations 28.0% 22.4% 24.0%
Although there was no association between use of certified seeds (hybrids) and acreage owned, a weak association was noted between acreage owned and total harvest. Furthermore, there was no association between average yield per acre and use of certified seed. While 16.0% of control farmers planted the DK variety against 0.8% in the intervention area, 21.6% of intervention farmers used the Duma variety against 8.0% among control farmers. This could be attributed to zoning by seed companies that promote certain seeds in specific geographical areas based on climatic and other agro-ecological factors.
Table 8: Perception of February 2015 Maize Harvests with Other Seasons
Control Intervention All
Same as normal 46.0% 20.0% 27.4%
More than normal 24.0% 27.2% 26.3%
Less than normal 24.0% 46.4% 40.0%
Much less than normal 6.0% 6.4% 6.3%
Table 8 above examines farmer perceptions of their harvests. The February/March
2015 maize harvest was perceived as less than normal by 40% of the respondents
across the study area, with more farmers in the intervention area (46.4%) reporting that
the harvest was low compared to those in the control area (24.0%). Cumulatively,
46.3% of all respondents reported that the 2015 harvests were either less than normal
or much less than normal.
Only 6.9% of the respondents of the intervention population, reported that they had
either sold, or were planning to sell, part of their February 2015 maize cobs, while
79.4% of all respondents (80% control versus 79.2% intervention) reported that they
had already eaten, or were planning to eat, some of the maize cobs harvested directly
from the farm at the time of this study in March 2015, implying only 20% still had some
maize left over from the previous year.

15
2.4 Management of Maize from the Farm
2.4.1 Maize Drying
One hundred percent (100%) of farmers surveyed reported that they dried their maize
prior to storage. Use of a tarpaulin was the preferred method for ”active” maize drying
before storage (Figure 2). This method was followed by spreading maize directly on the
ground and a combination of the two. “Other” methods cited included spreading of
maize on suspended wire mesh or chicken net suspended above the ground (2.3%).
Very few farmers (1.1%) reported that they take their maize harvest directly to the
stores from the fields. What is unclear is how many farmers practice ”passive drying”
which is when the maize is placed in storage on the cob for a period of time – This is
very prevalent with nearly all farmers practicing this for different lengths of time.
A majority of farmers take their time to dry their maize, with 45% drying their maize in
batches or only dry as much as will fit on their tarpaulin (28%). The remaining 27.4% of
all the farmers (26.0% control versus 28.0% intervention) reported that they dried all
their maize at the same time.
Shaking (59.4%), biting (18.3%), and observation of the maize top or apex for dryness
(10.9%) were the three most common methods used by farmers when determining if
their maize was dry enough and ready to store. Other methods used included a
combination of shaking and biting (5.7%). Three farmers used of a moisture meter
(1.7%).
2.4.2 Maize Shelling
Nearly all maize in the study area is shelled by hand either directly (6.9%), by hitting it
with a stick while enclosed in a bag (85.7%), or a combination of the two (6.3%). Two
respondents reported using a mechanical sheller
In both the control and intervention
groups, shelling of maize at the
household level is a task that the entire
family is responsible for and all family
members participated. Paying someone
outside your family to help shell your
maize is also observed, as shown in
Figure 3.
Of the respondents, 56% (50.0% control,
65.7%
21.7%
3.4% 2.3%6.3%
0.6%0.0%
10.0%
20.0%
30.0%
40.0%
50.0%
60.0%
70.0%
Ontarpaulin
Directly onthe ground
Other Ontraditional
mats
Tarpaulinand
directly onthe ground
On tarmac
Figure 2: Main Maize Drying Methods Used by Study Farmers
23%
77%
Figure 3: Who shells your maize?
Paid Labor
FamilyLabor

16
58.4% intervention) shell all their maize immediately after harvest, while 42% do not
shell their maize at the same time immediately after harvest. Among those who did not
shell their maize immediately after harvest, a shortage of labor (30.4%), preference to
shell in batches (26.1%), and lack of time (23.2%) were the top three reasons given.
Other reasons given were related to the size of their harvest (10.1%) and issues related
to storage (4.3%).
2.4.3 Treatment of Shelled Maize
90.9% of all study farmers used some form of insecticides on their shelled maize to
control weevils and insects prior to storage. Treatment of shelled maize using actellic,
an organophosphate insecticide was the most common; 90.3% of study participants
reported use. This was followed by a few farmers treating their shelled maize with wood
ash (2.3%), and two farmers using a combination of actellic and wood ash (1.1%).
There was a small difference in the numbers of control farmers (86.0%) and intervention
farmers (92.8%) who reported using actellic in preparation for their maize storage.
Among the farmers who used insecticides for maize treatment prior to storage, 90.0%
used actellic super. The other chemicals used were scaner super (8.1%), a combination
of actellic and scaner super (1.3%) and Sumicob (0.6%).
Thirteen different packet sizes of insecticides were bought, with the sizes ranging from
50 to 2000. One thousand gram packets were the most sold, followed by 500 gram
packets (Table 9). Therefore, based on the number of study participants who used
some insecticides, it can be assumed that the average farmer reportedly used about
950 grams of insecticide to treat their maize, which amounts to approximately 87 grams
per bag - the recommended dosage is about 51 grams per bag. This is further
discussed in Table 11.
Table 9: Sizes and Number of Packets of Maize Storage Insecticides Packets Bought
Size of Packet (Grams)
Number of Packets Bought Total Grams
1 2 3 4 5 6 7 10
50 1 5 3 2 1 1 2,550
100 3 3 2 2 1 3,300
150 2 1 600
200 4 1 1,200
250 8 7 2 1 8,250
300 2 1,200
400 1 800
450 1 450
500 34 7 1 1 1 35,000
600 1 600
750 1 750
1000 44 9 1 1 75,000
2000 1 4 2 30,000
TOTAL 159,700

17
The number of packets of actellic bought for use during the season ranged from one to
ten. However, more than 90% of the study participants who bought insecticides bought
three packets or less.
Despite their reported use of insecticides, 18% of farmers reported using packet sizes
that do not exist, and only 26% of farmers reported paying prices that are within +/-
20Ksh of actual prices. This could mean that farmers either are not using insecticide,
are purchasing counterfeit products, or do not closely track what they spend on farm
related items. In Table 10, we have provided what was available on the market from
two suppliers in the area.
Table 10: Actual Cost by Available Packet Size
Price (Kshs) – Company #1 Price (Kshs) – Company #2
Size Packet Price of
insecticide
Price per 100
gms
Price of
insecticide
Price per 100
gms
50 grams 100 200 80 160
100 grams 150 150 120 120
200 grams 280 140 220 110
500 grams 680 136 400 80
1000 grams 1050 105 Not Available Not Available
Furthermore, based on the grams the farmer said that they purchased and the total
bags that they said they stored, farmers on average used 863 grams of insecticide on
15.4 bags of maize – the recommended dosage for 15 bags is 770 grams, so they are
not extremely far off, but Table 11 attempts to breakdown how farmers are using
insecticide.
Table 11: Usage of Insecticide
Number of
Farmers (N=125)
% Respondents
Used LESS THAN the recommended dosage 30 24%
Used 50gms or more but less than 100gms 52 41.6%
Used over twice as much as the recommended
dosage
43 34.4%
*N=125 due to inconsistent farmer answers.

18
Of those who used chemical treatments, 68.1% reported that chemical treatments were
efficient for three months. A minority, 7.5%, reported that the insecticide is usually
efficacious as long as they store their maize, and a larger group, 19%, stated that their
insecticide lasted 6 months.
2.4.4 Maize Storage
An average of 54.9% of respondents reported using a granary or crib for storage of
shelled maize. Other shelled maize storage sites were a separate room in a house
(29.7%), in purposely-built storage (9.1%), and in the main house (5.1%), while 1.1%
stored in both granary/crib and a separate room in the house. Details of storage of
choice between control and intervention are presented in Table 12.
Second-hand polypropylene (PP) bags were used by most respondents (53.7%) for
storage of shelled maize. Others were special type 90kg bag (20%), sisal bags (25.1%),
and metal silos (1.1%).
There was no significant difference between the control and intervention participants in terms of storage choice. It is further noted that most of the respondents (82.9%) store maize for both household consumption and for later sales in the same place.
Table 12: Containers or Sites Used to Store Shelled Maize by Study Area
Storage Container/Site % Using Container/Site (N=175)
Control Intervention All
Granary/crib 56.0% 54.4% 54.9%
Purposely built store 12.0% 8.0% 9.1%
In house where we live and sleep 6.0% 4.8% 5.1%
Separate room in house 26.0% 31.2% 29.7%
Granary/crib and separate room 0% 1.6% 1.1%
TOTAL 100% 100% 100%
Only 8% of the farmers reported that they keep other crops separate from shelled
maize, with no difference between control and intervention farmers.
The full capacity of the farmers’ maize storage ranged from 1 to 300 of the 90 kg bags,
even if maize is stored on cobs (Table 13). Eighty-two point nine percentof the maize
storage was reported to have been constructed less than 20 years ago, with 33.7%
having been built in the past 5 years. Sixteen percent of storage was built over 21 years
ago.

19
Table 13: Maize Storage Capacity
Storage Capacity in
90kg bags
# Farmers Average Cost of
Construction (Kshs)
%
(N=174)
1 – 5 bags 4 15,750 2.3%
6 – 10 bags 35 13,000 20%
11 – 20 bags 48 17,490 27.4%
21 – 30 bags 33 23,078 18.3%
31 – 50 bags 22 21,136 12.6%
51+ bags 32 35,593 18.3%
Farmers reported a range of construction costs from Kshs 500 to Kshs 150,000 over 30
years. The following are some generalizations:
The average construction cost of storage was Kshs 21,436.
44% spent Kshs 10,000 or less.
22% spent between Kshs 10,000 – 20,000.
24% spent between Kshs 20,000 – 50,000.
43% of farmers confirmed that the extra rooms in their house used for storage
were specifically built to store grain.
Decisions on maize storage expenses are mostly done jointly between husband and
wife, as reported by 44.6% of the respondents across the area of coverage (48.0%
control, 45.2% study). Wives (29.1%) were the second largest group of decision
makers, followed closely by husbands (25.1%). The few single respondents reported
that they make such decisions on their own.
2.4.5 Maize Sales
Most of the farmers interviewed (78.3%) reported that they normally sell part of their
maize after shelling. There was no difference between farmers in control (78.0%) and
intervention (78.4%) sites.
Maize sales pick up from March immediately after the February-March main harvests.
The trend increases steadily in April and peaks May and July (Figure 4) before
declining and later picking up again in October after the second harvest. Of all the
respondents, 12.6% did not sell any of their maize, while 10.9% reported that there was
no specific month in which they sold their maize.

20
0.00%
5.00%
10.00%
15.00%
20.00%
25.00%
30.00%
35.00%
Jan Feb Mar April May June July Aug Sept Oct Nov Dec
Pe
rce
nt
wh
o f
inis
h t
he
ir s
tock
d
uri
ng
th
e m
on
th
Month of the Year
1.10%1.70%
4.60%
7.40%
10.90%
7.40%
12.60%
5.10%
7.40%
10.30%
3.40%4.60%
0.00%
2.00%
4.00%
6.00%
8.00%
10.00%
12.00%
14.00%P
erc
en
t o
f fa
rme
rs s
ell
ing
(N
=1
75
)
Month/Time when maize is sold
Figure 4: Monthly Trend and Timing of Maize Sales
August is the last month of the year when many farmers (31.4%) exhaust their February
harvests. By September, the number of households with stored maize reduced to 4.6%
and then down further to 3.4% in October/November. Although 15.4% of the farmers
reported that they still have maize in December, this could have been confusion with the
second crop harvests (Figure 5).
Figure 5: Percent of Farmers Finishing Their Maize Stock by Month
The sale peaks in the month of May could be linked to school fee payments as the
second school term is usually in May; the October peak could be associated with the
beginning of the second harvesting season, when farmers dispose of the remaining
season one harvests or sell part of the second season’s harvests, mostly at farm-gate.
Of the total respondents, 68.6% reported that besides home consumption and sale, they
normally remove maize from storage for other purposes. Donations to their local church
as a tithe was the most common “other” usage of maize, reported by 56.1% of all the
respondents. Donations to neighbors or relatives (12.0%) and giving to schools in-kind,
as part of school fee payments (4.0%), were also cited as the other uses of maize from
household stores.
When selling their maize, 93% of all respondents reported that their maize had never
been rejected by buyers. The remaining 7% (12% control, 4.8% project) reported that
their maize had been rejected by buyers when presented for sale due to the maize
21
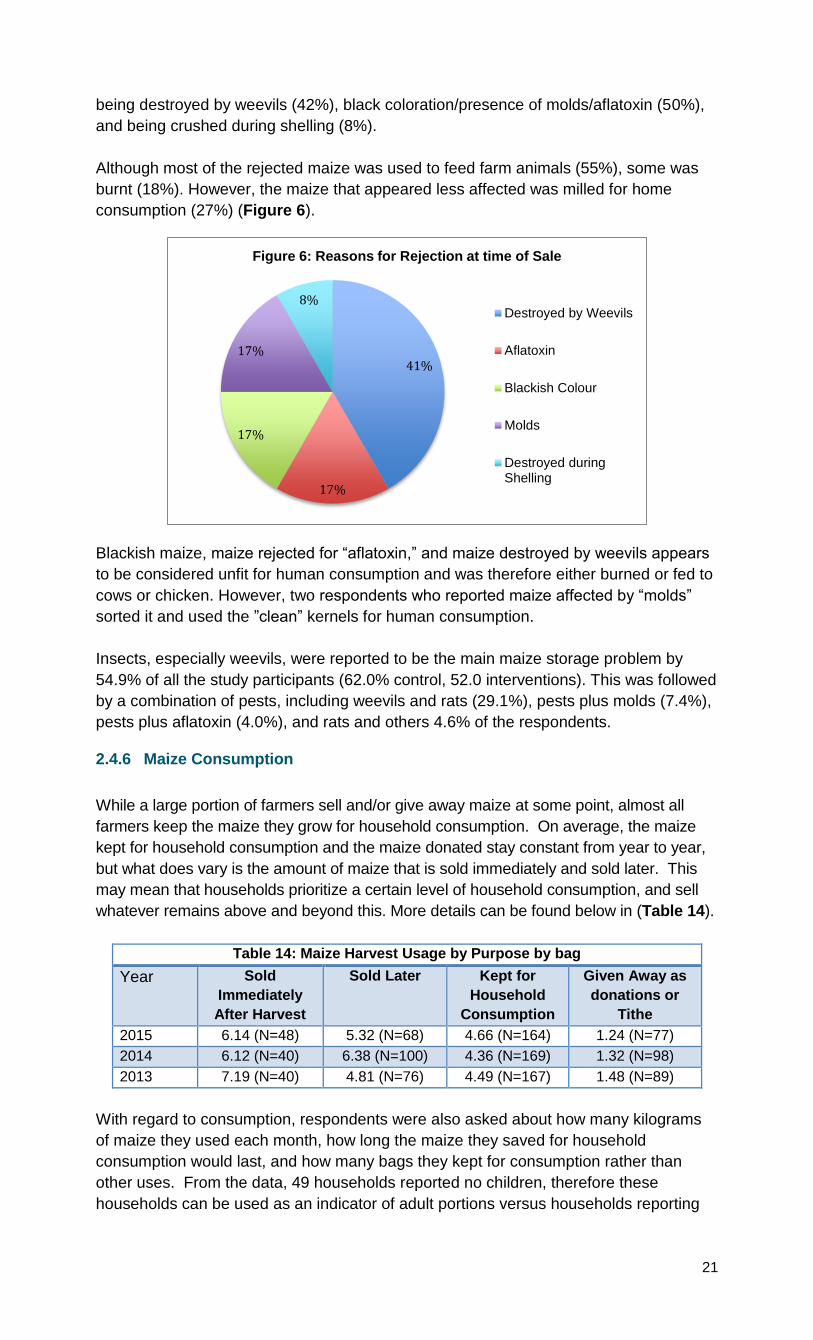
being destroyed by weevils (42%), black coloration/presence of molds/aflatoxin (50%),
and being crushed during shelling (8%).
Although most of the rejected maize was used to feed farm animals (55%), some was
burnt (18%). However, the maize that appeared less affected was milled for home
consumption (27%) (Figure 6).
Blackish maize, maize rejected for “aflatoxin,” and maize destroyed by weevils appears
to be considered unfit for human consumption and was therefore either burned or fed to
cows or chicken. However, two respondents who reported maize affected by “molds”
sorted it and used the ”clean” kernels for human consumption.
Insects, especially weevils, were reported to be the main maize storage problem by
54.9% of all the study participants (62.0% control, 52.0 interventions). This was followed
by a combination of pests, including weevils and rats (29.1%), pests plus molds (7.4%),
pests plus aflatoxin (4.0%), and rats and others 4.6% of the respondents.
2.4.6 Maize Consumption
While a large portion of farmers sell and/or give away maize at some point, almost all
farmers keep the maize they grow for household consumption. On average, the maize
kept for household consumption and the maize donated stay constant from year to year,
but what does vary is the amount of maize that is sold immediately and sold later. This
may mean that households prioritize a certain level of household consumption, and sell
whatever remains above and beyond this. More details can be found below in (Table 14).
Table 14: Maize Harvest Usage by Purpose by bag
Year Sold
Immediately
After Harvest
Sold Later Kept for
Household
Consumption
Given Away as
donations or
Tithe
2015 6.14 (N=48) 5.32 (N=68) 4.66 (N=164) 1.24 (N=77)
2014 6.12 (N=40) 6.38 (N=100) 4.36 (N=169) 1.32 (N=98)
2013 7.19 (N=40) 4.81 (N=76) 4.49 (N=167) 1.48 (N=89)
With regard to consumption, respondents were also asked about how many kilograms
of maize they used each month, how long the maize they saved for household
consumption would last, and how many bags they kept for consumption rather than
other uses. From the data, 49 households reported no children, therefore these
households can be used as an indicator of adult portions versus households reporting
41%
17%
17%
17%
8%
Figure 6: Reasons for Rejection at time of Sale
Destroyed by Weevils
Aflatoxin
Blackish Colour
Molds
Destroyed duringShelling

22
large numbers of children. While there was a large degree of variation in the data,
approximate consumption is broken down in Table 15.
Table 15: Approximate Adult vs. Child Consumption per week
Average Consumption Median Consumption
Adult 2.79 kg 2.3 kg
Child 1.83 kg 1.5 kg
Considering this consumption analysis, we compared what respondents said they would
eat per week with the median estimate of food consumption in Table 15. Out of 103
data points (others were discarded due to inconsistency), almost half seem to have a
very poor idea about their consumption needs and/or had trouble quantifying it
accurately. More details on this can be found in Figure 7.
When we compared a family’s average consumption with the estimated date of when
food stocks would run out, out of 129 farmers, 54 respondents were within 65 days of
their estimated date when they would finish their maize stock, while 40 farmers were
between 66 to 120 days from their estimate of maize stock depletion.
2.4.7 Storage Issues & Willingness to Pay for Storage Containers
The study assessed the perception of farmers on their vulnerability to maize storage
problems. Table 16 presents vulnerability perception levels for all respondents.
Table 16: Perception of Susceptibility to Maize Storage Problems
Very Susceptible
Control (N=50) Intervention (N=125) All
Insects (Weevils)* 48.0% 34.4% 38%
Rats 18.0% 18.4% 18%
Molds 6.0% 7.2% 7%
Aflatoxin 2.0% 4.0% 3%
Others (Theft) 2.0% 0% 0%
*Each category shows the % out of respondents reporting by category. The control/intervention/all columns
will not add to 100%.
Of the maize storage problems listed above, insects, especially weevils, were reported
to cause the most maize losses with 91.4% of the study population (100% control, 88%
intervention). Other losses were caused by aflatoxin (3.4%), mold (2.3%), rats (2.3%),
30%
24%
46%
Figure 7: How well do farmers' estimate their consumption?
between 80-120% ofestimated consumption
within 20%
very poor Idea

23
and a combination of insects, including weevils and molds (0.6%). No farmers felt that
they are very susceptible to loss due to theft.
Of the reliable data received, 124 farmers were willing to pay for a container that
controls insects, while 27 were not willing to pay anything (balance of farmers rejected
for inconsistent responses). Of the 124, 28% were willing to pay Kshs 100, 21% would
consider paying Kshs 50, and 16% would pay Kshs 200. Of the 27 unwilling to pay
anything per bag, 23 would pay for a device that last 10 years. More specific willingness
to pay data can be found below in Table 17. Cell(s) highlighted in yellow show a
convergence of farmers around the price points of 50 to 200 kHz.
Table 17: Price Willing to Pay per Bag to Control Insects
Price willing to
pay (kshs)
0 <10 20 30 40 50 100 150 200 250 300 400 500
Number of
farmers
27 3 12 2 2 26 35 11 20 3 4 4 2
% of farmers 18 2 8 1 1 17 23 7 13 2 3 3 1
While Table 17 compares the price a respondent was willing to pay for a device that
prevented insects, Table 18 asks those farmers who were in fact willing to pay, if they
would they pay more or less for a device that prevented something else besides insects,
such as rats, mold, aflatoxin, etc. A positive (black) number means that they would pay
more as compared to what they were willing to pay for a device that controlled insects.
Conversely, a negative (red) number means that they would be willing to pay less for a
device that controlled for some other issue versus the one that controlled insects.
Cell(s) highlighted in yellow show the highest premium that farmers would be willing to
pay if a container controlled for insects, aflatoxin, and rats, as opposed to solely
controlling for insects. While they would pay more, the price they are willing to pay
remains in the 50 kshs range.
Table 18: Percentage of Respondents Willing to Pay that Would Pay More for a Container That
Controls Other Issues compared to the price in Table 17
Price
willing to
pay (kshs) 0 <10 20 30 40 50 100 150 200 250 300 400 500
Rats 0 .40 -.31 0 0 .45 -.08 -.50 -.60 -.62 -.56 -.75 -.80
Mold 0 .40 .50 0 -.13 .65 .04 -.50 -.46 -.70 -.78 -.75 -.60
Aflatoxin 0 .40 .63 -.33 -.13 1.35 .21 -.38 -.02 -.40 -.78 -.47 .20
Insects +
Aflatoxin
0 .20 .88 -.33 -.38 1.77 .64 -.04 .52 -.40 -.39 -.13 1.20
Insects +
Aflatoxin +
Rats
0 .40 1.63 -.33 -.38 3.20 1.39 .38 .73 -.60 -.22 .13 1.40
Reviewing the above data, there appears to be a convergence of farmers who are
willing to pay more for a container that resolves their insect, aflatoxin, and rat issues as
opposed to containers that only solve part of their maize storage worries, and the price
that they are willing to pay is around Kshs 50/bag.
Following in this line of questioning, we then asked farmers what they would be willing
to pay for a container that lasts longer and stores all of their maize. We compared what
they were willing to pay for this versus what they were willing to pay for a bag, and
found a convergence around the Kshs 100 price point, which is highlighted in yellow.

24
Table 19: Price Farmers are Willing to Pay for a Longer Lasting Container
Price Point (Kshs) Times more than original price # Respondent
20 6.67 10
50 4 13
100 2 27
150 1.33 6
200 1.5 0
Tables 18 and 19 point to a much lower price threshold than all of the
devices tested. For instance, the bulk bag plus the frame costs about
Kshs 28,000, but 90% of all respondents were only willing to pay 20%
or less of the actual value of the bulk bag. A single farmer indicated a
willingness to pay over 50% of the value of the device, but there were
no bids within 10% of the cost for a bulk bag plus the frame.
In terms of the metal silo, 22% of respondents
were willing to pay the same for it as for the bulk
bag, while 36% were willing to pay more for a
metal silo (the metal silo price depends on the size, for our
purposes Kshs 6,400 to Kshs 17,900 and the farmer was told a
silo price which matched his total storage needs). In terms of cost,
88% of respondents were only willing to pay 40% or less of the
actual value of the silo per bag, while 8 farmers indicated a price
per bag that they would pay that was within 25% of the actual
value of the device.
Lastly, PICs bags are sold at price of Kshs 250 per bag, farmers were
told the total cost for bags to cover their entire storage needs.
16.67% of respondents were willing to pay 50% or more of the value
of the device, but the majority (83.33%) were only willing to pay 2-
40% of the cost.
Of the total study participants, 69.7% (50% control, 77.6%
interventions) reported to be willing to pay more for the containers if
payments could be spread over a longer period of time, however
farmers do not want debt very long; 57% want to repay the price they are willing to pay
over a period of 6 months as seen in Table 20. Among the 30.3% who were not willing
to spread payments over a longer period, the following were some of the reasons given
for their refusal:
Price should be fixed despite duration of payment (10.3%).
Cost of installment payments are normally higher (9.2%).
I cannot talk about what I have not seen or tried (2.3%).
There is no need for installments if prices are affordable (2.9%).
25
Table 20: Preferred repayment period by device & Price WTP
Months Bulk Bag Metal Silo PICs %
6 69 65 67 57.55
12 40 37 11 21.75
18 20 20 1 9.37
24 12 11 5.14
35 9 6 1 3.75
45 4 5 1 2.43
*Number of respondents per category varies based on data consistency. All
farmers were asked by device their WTP
Further analysis revealed that willingness to pay is associated with the occupation of the
head of the household. Study participants whose main source of income was salaried
employment had the highest proportion of willing to pay (83.33%). This was followed by
those whose main source of income was farming, with 72.34% willingness to pay
toward improvement of their storage. However, neither the level of education nor the
acreage of land owned had any association with willingness to pay.
2.5 Aflatoxin Awareness
The awareness level of aflatoxin in the study area is very high, with nearly all study
participants (99.4%) reporting that they were aware of it, with only 0.6% of control
respondents reporting lack of awareness. When asked to mention some of the
characteristics of maize affected by aflatoxin: 56% (54% control, 56.8 interventions)
reported black coloration or spots, black color/spots, yellowish color, among others.
When asked about their sources of aflatoxin information, agricultural institutions
(34.3%), radio programs (27.4%), this study (14.9%), private companies and
nongovernmental organizations (NGOs) (9.1%), and extension agents (7.4%) were
cited as the five top information sources.
Many of the respondents reported that they normally see mold on their stored maize
when it starts raining (46.9%),at the beginning of storage of the shelled maize (21.1%),
and when the maize is nearly finished (1.7%), while others reported presence
throughout the year (2.9%). Finding mold on stored maize when it starts raining and the
humidity levels go up (approximately 5 months after harvest) also reflects what the
AflaSTOP Team has witnessed on the ground.
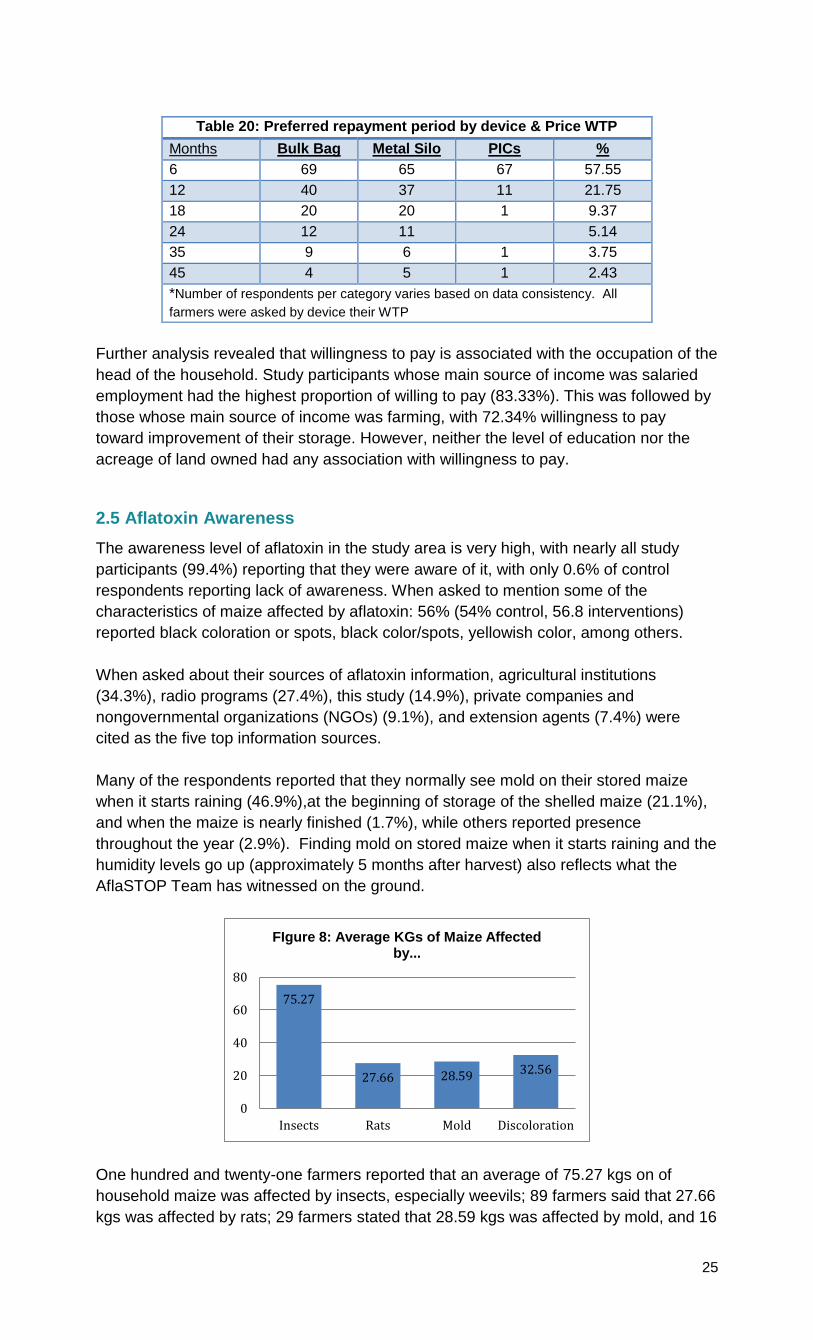
One hundred and twenty-one farmers reported that an average of 75.27 kgs on of
household maize was affected by insects, especially weevils; 89 farmers said that 27.66
kgs was affected by rats; 29 farmers stated that 28.59 kgs was affected by mold, and 16
75.27
27.66 28.59 32.56
0
20
40
60
80
Insects Rats Mold Discoloration
FIgure 8: Average KGs of Maize Affected by...

26
farmers found 32.56 kgs was discolored. Of the study group participants, 51.4%
reported that molds are associated with high moisture content of maize, which they
linked to poor storage, harvesting maize that is not completely dry, and harvesting
maize when it is raining. Poor storage was also cited by 9.1% of participants as
potential cause of molds. Fifty-seven point seven percent(control 32%, interventions
68%) reported that seeing mold in their stored maize would be a concern to them
although they did not associate molds with aflatoxin.
Of the study team participants, 35.4% reported to have received maize in their
households last year, with most of it purchased from the market. Most farmers also
reported that they eat their own maize first before they start buying from the market. The
main reasons given for selling maize at or just immediately after harvest time were:
Need for cash to pay for other household expenses and/or for planting and
harvesting costs (91.5%)
Sold due to fears about rats and/or pest infestation later on (8.5%)

27
3.0 Discussions and Conclusion
The AflaSTOP Phase 2 Project should benefit from the demographic indicators of
participants, given that they are a fairly well educated study population, with over 45%
having either completed secondary school or having a university or college education.
Additionally, 100% of the respondents reported that they could make decisions in their
households reported that farming was the main occupation and the main source of
income.
In most of the indicators assessed, minimal differences were observed between the
intervention and control groups, including land ownership, where there was no statistical
significant difference between the two groups. Lastly, the fact that most of the
intervention farmer pre-testing survey data collection was conducted before the
intervention group received storage containers means that very few in the study groups
had any comparative advantage. Therefore, any changes in attitudes toward maize
storage practices noted among the intervention group during the next round of the
survey may be attributed to the containers and their interactions with the AflaSTOP
project team.
Most of the land (85.7%) belonged to individuals, with acreage ranging from 0.25–30
acres. However, the majority of landowners (80.0%) owned 5 acres or less and
therefore are small-scale farmers mainly growing maize for home consumption.
Although farmer use of hybrid seed was high, yields are very low in this area, on
average producing 3.3 bags per acre compared to farmers in high potential maize areas
whose yield ranges from 15 - 25 bags per acre. The bulk of the maize produce is kept
for household consumption, and the balance is sold to address cash needs.
The majority of farmers (78.3%) sold part of their harvest immediately after shelling with
the main reason being the need to meet household cash requirements and pay for
inputs for the next seasons’ planting. Thirty percent of farmers bought maize for home
consumption at some point later in the season at higher prices. The reasons for sale at
harvest were not necessarily related to storage, insect, or rat concerns, but rather could
be attributed to farmers cash needs. Therefore, pushing farmers to invest in better
storage would not necessarily motivate them to keep their maize longer – They would
still sell maize at harvest to address their cash liquidity, leading to the same potential
food insecurity when their homegrown maize stocks are depleted.
A very high number of study participants (90.9%) used some form of insecticides for
preservation of their maize prior to storage with insects (weevils), considered to be the
most important reason warranting the purchase and use of insecticides. This is an
indication of the extent to which the farmers may be willing to keep their maize safe..
However, there was a general feeling that insecticide was not providing long lasting
solutions to the insect problem.
A sizeable portion of farmers (71%) are willing to pay for storage devices that would
eradicate their insect-related, maize storage problems, and they are willing to pay more
for a device that will control multiple storage challenges. Sixty percent of farmers
claimed they would consider paying between Kshs 50 - 200 per bag for a device which
would stop insects and 23% were willing to pay Kshs 100 per bag (a PICS bag costs
Kshs 250 but should last 2 years). That said, their fairly low willingness to pay price
point makes the grain safe and the metal silo inaccessible even if a longer payment
period is permitted.

28
Study Limitations
The preparation and actual field data collection for this pre-test survey had several
limitations that should be improved during the next survey. Some of these challenges
include:
Data collection was done over a 2-month period. The initial set of intervention
farmers was interviewed from March 13–16, 2015, while others, mainly from the
control group, were interviewed 2 months later from May 11–14, 2015.
Respondents were asked “willingness to pay” questions despite having not seen
the storage devices.
In addition, the questionnaire did not have some data elements and inconsistencies
were also noted with some responses, a potential pointer at the quality of interviewing.
The following recommendations should be observed during the follow-up surveys.
First, there should be a review of the pre-test data collection questionnaire to ensure
that it adequately captures data in the following areas:
Willingness to pay details, willingness to pay more than currently paying for storage, etc.;
Frequency of eating maize;
Quantity of maize eaten by household per week;
Whether part of the maize harvest is sold and how much;
Whether some maize is purchased for house use and how much;
Duration and methods of drying maize, whether on cobs before shelling in the sun or granary;
Purchase prices for insecticides used before storage of maize;
Costs for construction of a maize store;
Costs per bag, or total costs per total need.
Other recommendations
Recruit enumerators with basic college level of education to ensure quality data,
or limit data collection to one or two well-trained and well-informed enumerators.
Enumerator training should be more intensive to include detailed review of the
tools, roles, and pre-testing.
Field data collection should be supervised closely, especially the first 2 days, and
ensure timely feedback to all the enumerators.

29
ANNEXES
Annex Analysis Table 1: Land ownership in control versus intervention study
participants
There was no difference in acreage in in intervention or control groups, p= 0.2925.
Annex Analysis Table 2: Land ownership versus gender
There is a difference on acreage by gender. Men had higher land ownership p=0.0057, owning
a mean of 5.3 acres compared to women who owned a mean of 3.17 acres.
P r ( T < t ) = 0 . 1 4 6 2 P r ( | T | > | t | ) = 0 . 2 9 2 5 P r ( T > t ) = 0 . 8 5 3 8 H a : d I f f < 0 H a : d i f f ! = 0 H a : d i f f > 0
H o : d i f f = 0 d e g r e e s o f f r e e d o m = 1 7 3 d i f f = m e a n ( C o n t r o l ) - m e a n ( P r o j e c t ) t = - 1 . 0 5 5 9 d i f f - . 7 9 3 6 . 7 5 1 5 9 5 3 - 2 . 2 7 7 0 7 7 . 6 8 9 8 7 7 2
c o m b i n e d 1 7 5 4 . 7 8 6 8 5 7 . 3 3 9 6 4 8 2 4 . 4 9 3 1 2 4 4 . 1 1 6 4 9 6 5 . 4 5 7 2 1 8 P r o j e c t 1 2 5 5 . 0 1 3 6 . 3 9 2 4 8 3 2 4 . 3 8 8 0 9 5 4 . 2 3 6 7 6 6 5 . 7 9 0 4 3 4 C o n t r o l 5 0 4 . 2 2 . 6 7 0 8 4 4 7 4 . 7 4 3 5 8 9 2 . 8 7 1 8 8 7 5 . 5 6 8 1 1 3 G r o u p O b s M e a n S t d . E r r . S t d . D e v . [ 9 5 % C o n f . I n t e r v a l ]
T w o - s a m p l e t t e s t w i t h e q u a l v a r i a n c e s
. t t e s t t o t a l c u m u l a t i v e a c r e s , b y ( i n t e r v a t i o n c a t e g o r y )
Pr(T < t) = 0.0028 Pr(|T| > |t|) = 0.0057 Pr(T > t) = 0.9972
Ha: diff < 0 Ha: diff != 0 Ha: diff > 0
Ho: diff = 0 degrees of freedom = 173
diff = mean(Female) - mean(Male) t = -2.8020
diff -2.151726 .767926 -3.667436 -.636016
combined 175 4.786857 .3396482 4.493124 4.116496 5.457218
Male 131 5.327863 .4186665 4.791857 4.499581 6.156144
Female 44 3.176136 .4453171 2.953899 2.278069 4.074204
Group Obs Mean Std. Err. Std. Dev. [95% Conf. Interval]
Two-sample t test with equal variances
. ttest totalcumulativeacres, by(genderofhouseholdhead)

30
Annex Analysis Table 3: Average yield per acre versus type of maize seed planted
There was no relationship between average yield per acre and use of certified seed, p=0.4633.
Annex Analysis Table 4: Willingness to pay versus acreage of land owned
Willingness to pay was not associated with acreage of land owned (p=0.4836).
Pr(T < t) = 0.2316 Pr(|T| > |t|) = 0.4633 Pr(T > t) = 0.7684
Ha: diff < 0 Ha: diff != 0 Ha: diff > 0
Ho: diff = 0 degrees of freedom = 173
diff = mean(At least) - mean(Traditio) t = -0.7351
diff -.9707773 1.320594 -3.577327 1.635773
combined 175 8.051429 .6234646 8.247662 6.820902 9.281955
Traditio 59 8.694915 1.583725 12.16482 5.524745 11.86509
At least 116 7.724138 .4910211 5.288459 6.75152 8.696756
Group Obs Mean Std. Err. Std. Dev. [95% Conf. Interval]
Two-sample t test with equal variances
. ttest cumulativeaverageyiedacres, by(certified)
Pr(T < t) = 0.2418 Pr(|T| > |t|) = 0.4836 Pr(T > t) = 0.7582
Ha: diff < 0 Ha: diff != 0 Ha: diff > 0
Ho: diff = 0 degrees of freedom = 173
diff = mean(No) - mean(Yes) t = -0.7021
diff -.519734 .7402583 -1.980835 .9413665
combined 175 4.786857 .3396482 4.493124 4.116496 5.457218
Yes 122 4.944262 .371623 4.10471 4.208537 5.679988
No 53 4.424528 .7288561 5.306152 2.961972 5.887085
Group Obs Mean Std. Err. Std. Dev. [95% Conf. Interval]
Two-sample t test with equal variances
. ttest totalcumulativeacre, by(willingpaystorage)

31
Annex Analysis Table 5: Willingness to pay versus occupation of household head
and education
Willingness to pay is associated to occupation of HH head (p=0.002) but not with education (p=0.282).
.
end of do-file
.
Pearson chi2(4) = 16.7653 Pr = 0.002
30.29 69.71 100.00
Total 53 122 175
70.59 29.41 100.00
Self-employed off f.. 12 5 17
16.67 83.33 100.00
Salaried employment 2 10 12
0.00 100.00 100.00
Others 0 2 2
0.00 100.00 100.00
Farming,Salaried em.. 0 3 3
27.66 72.34 100.00
Farming 39 102 141
HH head occupation No Yes Total
storage container
Willing to pay for
row percentage
frequency
Key
. tab mainoccuption willingpaystorage, row chi
Pearson chi2(6) = 7.4406 Pr = 0.282
30.29 69.71 100.00
Total 53 122 175
29.17 70.83 100.00
Secondary not compl.. 7 17 24
38.71 61.29 100.00
Secondary completed 24 38 62
30.00 70.00 100.00
Primary not completed 6 14 20
21.28 78.72 100.00
Primary completed 10 37 47
66.67 33.33 100.00
None 2 1 3
17.65 82.35 100.00
College/University 3 14 17
50.00 50.00 100.00
Adult literacy clas.. 1 1 2
Education No Yes Total
storage container
Willing to pay for
row percentage
frequency
Key
. tab levelofeducation willingpaystorage, row chi