first half 2017 revenues - actusnews.com€¦ · first half 2017 revenues ... ericsson video...
TRANSCRIPT

First Half 2017 revenues
July 27, 2017

2ATEME © 1991-2017
Disclaimer
This presentation does not constitute or form part of and should not be construed as any offer for sale of or solicitation of any offerto buy any securities of ATEME, nor should it, or any part of it, form the basis of or be relied on in connection with any contract orcommitment whatsoever concerning ATEME’s assets, activities or shares.
All statements other than historical facts included in this presentation, including without limitations, those regarding ATEME’sposition, business strategy, plans and objectives are forward-looking statements.
The forward-looking statements included herein are for illustrative purposes only and are based on management’s current views andassumptions. Such forward-looking statements involve known and unknown risks. For illustrative purposes only, such risks includebut are not limited to impact of external events on customers and suppliers; the effects of competing technologies competitiongenerally in main markets; profitability of the expansion strategy; litigation; ability to establish and maintain strategic relationshipsin major businesses; and the effect of future acquisitions and investments.
ATEME expressly disclaims any obligation or undertaking to update or revise any projections, forecasts or estimates contained in thispresentation to reflect any change in events, conditions, assumptions or circumstances on which any such statements are based,unless so required by applicable law. These materials are supplied to you solely for your information and may not be copied ordistributed to any other person (whether in or outside your organization) or published, in whole or in part, for any purpose.

3ATEME © 1991-2017
Presenters
Michel ArtièresFounder & Chief Executive Officer
Degree in Engineering from Supelec, Paris, with a specialization in signal processing and telecommunications
R&D in Image Processing and Compression for the French Ministry of Defense
Fabrice Sana Chief Financial Officer
Degrees from the European Business School and ESSEC
Management Control Director for KaravelFinance Controller for AlstomManager at Arthur Andersen / BearingPoint

4ATEME © 1991-2017
1.ATEME2. Market Trends
3. Financial Performance
4. Strategy

5ATEME © 1991-2017
ATEME Factsheet
22 Patents
200 people in 14 countries
700 clients in 100 countries
Public since 2014
Sales & Support Los Angeles
America Ops CenterDenver
Sales & Support NYC
Support Miami
LATAM Ops CenterSão Paulo
Sales & SupportMexico City
SupportBuenos Aires
HQ, Paris
R&D centerRennes
Sales & SupportDubai
Sales & SupportNew Delhi
APAC Ops CenterSingapore
Sales & SupportSeoul
Sales & SupportShenzhen
37.5 M€ in 2016 (+31%)
ATEME designs software video compression solutions to enable innovative live or on demand video delivery
services, while preserving picture quality.
Headquarters
Offices
Sales & SupportSydney
Sales & SupportHô-Chi-Minh

6ATEME © 1991-2017
Over a Century of Combined Domain Leadership
CTO Pierre Larbier• 20+ years of compression innovation. 10 compression patents • DVB, ASTC, SMPTE, AOM Committees & Standards
R&D Thierry Marre• 20+ years of telecom & video engineering • Led +100p SW agile teams
APAC Sales Yoann Poizeau• 10+ years supporting tier-1 service providers• Led Dalet APAC sales
Product Remi Beaudouin• 10+ years in video compression exec management• Lead WW Product Management/Marketing teams
Strategy Yossi Aloni• 20+ years of exec positions with operators. system
vendors and technology providers
Latin America Sales Ezio Sanchez• 20+ years supporting tier-1 service providers• Led NDS, Thomson & Conax Latam sales
North America Sales Chad Hassler• 20+ years supporting tier-1 service providers• Led Scopus & Harmonic sales
EMEA Sales Emmanuel Boureau• 20+ years supporting tier-1 service providers• Led Ericsson & Harmonic sales

7ATEME © 1991-2017
What is Video Compression and Why it Matters
• Compression is a Must. Video is 80% of the internet traffic*.
• The encoding technology is key
• ITU (Geneva) defines international standards MPEG-2 (1994), MPEG-4 (2003), HEVC (2013).
• An intelligent encoder (eg. including objects tracking algorithms) requires less bitrate for the same video quality (or generates a better video quality at a given bitrate).
• The decoder is passive (2 decoders would always display the same video). No innovation there.
Whatever the network (cable, internet, satellite, terrestrial), digital video has to be compressed 500x typically
Uncompressed HD Video
~ 2 Gbits/s Encoder
CompressedHD Video
~ 4 Mbits/s
Decoder
* Cisco Visual Networking Index

8ATEME © 1991-2017
ATEME member of Alliance for Open Media
Internet leaders partnering to standardize AV1 in 2017, a royalty-free alternative to HEVC
Technology Leadership through Standardization Activities
Television Formats
Co-Chairmanship of 2 working groups at ITU for HEVC
Final Performance of the HEVC Standard
ATEME involvement in the standardization activities is unique amongst video compression vendors
9ATEME © 1991-2017
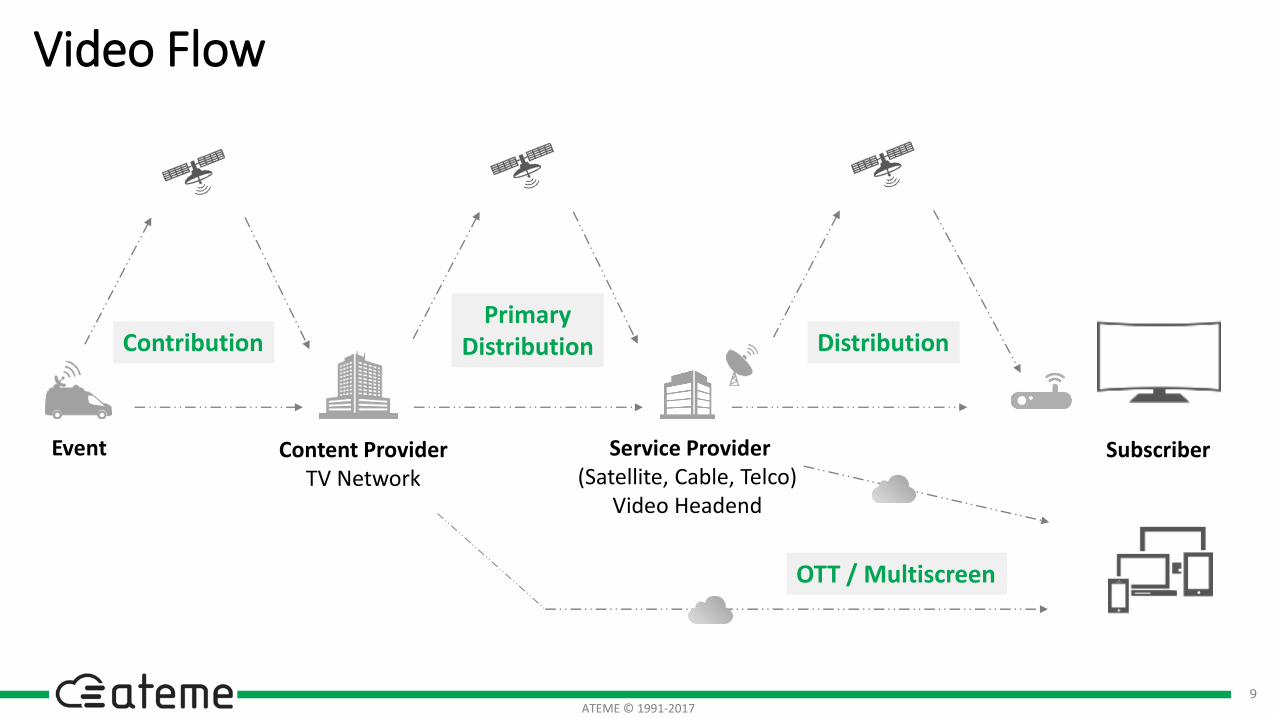
Video Flow
Service Provider(Satellite, Cable, Telco)
Video Headend
Content ProviderTV Network
Event
ContributionPrimary
Distribution Distribution
OTT / Multiscreen
Subscriber

10ATEME © 1991-2017
TV StationEventKyrion encoders in the trucks and decoders at the TV station
Launched in 2007, used for the most prestigious events embeds ATEME
compression software on a FPGA
processor
CLIENTS broadcasters and service providers (direct), truck operators (indirect)
CAPEX (refresh cycle ~ 4 years) + Annual Support &
Maintenance
Ericsson Video Quality, Upgradable (Software)
TECHNOLOGY BUSINESS MODEL COMPETITION USPs
ATEME’s Kyrion Leading the Contribution Market
CLIENTS

11ATEME © 1991-2017
Service Provider (Cable, Telco, Satellite)
Video Headend
Subscribers
TITAN is a virtualized Video Headend software covering all Live and File needs
Launched in 2009 (VOD) and 2011
(Live)
100% ATEME software
Recurring revenues despite perpetual
licenses model+ Annual Support &
Maintenance
Video Quality, Speed / Density,
100% Home Grown Software, Flexibility
Harmonic, Ericsson,
Cisco
TECHNOLOGY BUSINESS MODEL COMPETITION USPs
CLIENTS
ATEME’s TITAN the Distribution and OTT Challenger

12ATEME © 1991-2017
Strategic Partners
Enabling access to Service Providers datacenters
Better exposure, lower cost solution
Enabling transition of Service Providers to datacenters
Better performance (video quality / density)

13ATEME © 1991-2017
1. ATEME
2.Market Trends3. Financial Performance
4. Strategy

14ATEME © 1991-2017
Growing Access to €1B Video Infrastructure Market 2017
€250mPrimary Distribution
€100mContribution
€300mMultiscreen
€350mDistribution
ATEME core segment IPO enabled, Winning now
Segment
Access
ATEMEProduct
Sources : Frost & Sullivan (2014), Company
SW Shift in Progress

15ATEME © 1991-2017
Video Growth DriversContinued Demand for High Efficiency Compression
More Screen Time
TV declines but overall screen time is increasing
Content Explosion
DelinearizationMore channels, more content
Monetization Opportunities
Multiplication of distribution formats
New Distribution Models
Multiscreen, OTT
Ultra HD Television
4K, HDR, WCG, HFR
+13%Daily screen time
from 2011 to 2015
source: eMarketer, Apr. 2015

16ATEME © 1991-2017
Industry Shift to Software, the Revolution in Progress
Today, Service Providers deploy Software Converged Video Headends (Live + VOD, Box + Multiscreen), in a virtualized environment
Legacy Video Headendfor the linear distribution to the box
VOD and Multiscreenseparated infrastructure
Software Virtualized Video Headendrunning on a private cloud
=Software
Virtualized Headend
Running on
Private cloud
+ + Multi-Screen
VOD
10 years ago,Video Head Ends consisted in heterogeneous specialized hardware for each operation
Then,VOD and multiscreen were added and managed as separate operations
Legacy VHE

17ATEME © 1991-2017
Sept 2015
$300-500M (5-7x)
acquires
Sept 2015
$125M (4x)
acquires
Dec 2015
€69M (1x)
acquires
Consolidation Clearing the Way for ATEME
Essentially down from 7 to 4 Players
• US service providers running away from their competitor (Amazon Prime Video)
• Envivio partners are Ericsson competitors
• Redundant employees (Sales worldwide)
• Products end of life confusing clients
• Redundant employees (Rennes R&D)
Ideal
Scenario
for ATEME
March 2017
$1 Bn sales in 2016
to sell its Media Business

18ATEME © 1991-2017
1. ATEME
2. Market Trends
3.Financial Performance4. Strategy

19ATEME © 1991-2017
7 436 10 646
7 544
10 291
2011 2012 2013 2014 2015 2016 2017
Q1 Q2 Q3 Q4
H1 2017 Revenue Acceleration : +40%
€37.5m
€28.6m
€12.3m
€17.9m
€20.6m
€24.8m
+31%
CAGR : +23%
IPO
H1 2017 : +40%

20ATEME © 1991-2017
H1 2017 Regional Performance
+46%
+147%
-3%
+175%
37% of H1 2017
16%of H1 17
EMEA
• Q2 performance almost compensated for the slow start in Q1
• Recent ramp-up of TITAN software with leading European service providers is gaining traction and should drive growth over the coming quarters
USA/Canada
• Continuous Investment• Stronger presence
(Denver office and lab, NYC next)
• Tier1 operators won
Latin America
• Investments made in 2016 to increase market share and footprint are paying off
• Leading service providers deploying TITAN based software solutions to power their video head ends
• Stronger presence (Mexico, Argentina, Peru next)
APAC
• Continuous investment• Reorganized sales and
operations (Singapore, China, Korea)
• New projects with a major global system integrator
17%of H1 17
30%of H1 2017
revenue

21ATEME © 1991-2017
2016 P&LConsolidated data – IFRS –in thousands of euros
2015 2016 % change
Revenue 28,584 37,462 +31.1%
Gross profit 14,987 22,031 +47.0%
Gross margin 52.4% 58.8%
R&D expenses (5,497) (5,661) +3.0%
Sales & marketing expenses (11,054) (12,776) +15.6%
Other G&A expenses (1,464) (1,433) -2.1%
Operating profit (3,028) 2,162 ns
Operating margin -10.6% 5.8%
Financial loss (82) (207) +152.4%
Financial profit 67 10 -85.1%
Exchange effect 579 247 -57.3%
Net profit (2,465) 2,212 ns
Net margin -6.8% 5.9%
+6.4 points increase in gross margin notably thanks to the growth in software sales
Operating expenses contained:
• Slight increase in R&D expenses
• S&M expenses grew not as fast as the topline
€2.2m operating profit
€2.2m net profit : profitable year for the 1st time since the IPO

22ATEME © 1991-2017
IPO July 2014
201620152014
Successful Strategy Since the IPO
2017
Phase 1: 30 hires in 6 months (opened Rennes R&D office)
€12.3m
€-2.5m
€15.0m
€-1.6m
€16.3m
€0.0m
€22.5m
€12.9m
€-1.1m
€11.9m
€-0.9m
Phase 2:Design of TITAN 4 and reorganization of international offices
Phase 3: Commercial launch
165
135
170
€3.8m
Revenues
Net Loss/Profit
Growth acceleration in H2 2016: a 2 years ROI since the IPO

23ATEME © 1991-2017
2016/12/31 Balance Sheet
Consolidated data - IFRS – in thousands of euros
2015 2016A
SSET
SNon-current assets 4,811 5,312
Current assets 20,362 23,156
- o/w stocks 3,366 3,094
- o/w trade receivables 9,436 13,052
Cash and cash equivalents 4,225 4,096
25,173 28,468
LIA
BIL
ITIE
S
Shareholders’ equity 11,749 14,089
Non-current liabilities 4,616 4,300
- o/w non-current financial debt 4,229 3,782
Current liabilities 8,808 10,079
- o/w current financial debt 939 957
- o/w trade payables 3,754 4,20125,173 28,468

24ATEME © 1991-2017
2016 FCFConsolidated data - IFRS – in thousands of euros
2015 2016
Net Profit (Loss) (2,465) 2,212
(-) Elimination of non-cash elements (1,531) (1,841)
Gross cash flow (934) 4,053
(-) Change in Working Capital 2,151 1,690
Cash flow from operations (3,086) 2,363
Cash flow from investing activities (1,994) (1,635)
Cash flow from operating activities and after investment (5,080) 728
New loans and contingent advances 3,535 0
Interest expense (14) (13)
Repayment of loans and contingent advances (795) (907)
Repayment of financial leases (70) (122)
Other financial flows (including factoring) (121) 247
Cash flow from financing activities 2,536 (795)
Currency effect (117) (61)
Net Change in Cash (2,661) (128)
Opening Cash position 6,884 4,222
Closing Cash position 4,222 4,094
Positive Operating Cash Flow : €2.4m
Positive Free Cash Flow : €0.7m
Cash position end of the year : €4.1m
Increase in self-financing capacity
No new loan in 2016

25ATEME © 1991-2017
1. ATEME
2. Market Trends
3. Financial Performance
4.Strategy

26ATEME © 1991-2017
• TITAN Video Head End software components can be reused in the Network to enable new video delivery schemes.
• Clients benefit: huge network infrastructure CAPEX and OPEX savings.
• ATEME benefit: huge TAM expansion ($25 Billion) with limited R&D and Sales costs (same clients).
• Similar strategy applied to firewalls proved very successful at Palo Alto Networks.
Win The Video Headend, Expand to Video Networking
à
Continued Network Investment Not Meeting Video Demand Growth
Video Is Clogging The Networks ATEME Metro Network Video Processing
Video Grows 3-fold 26% CAGR Unveils $14 Billion Infrastructure Plan Enabling Video Growth Using
Existing Network Infrastructure

27ATEME © 1991-2017
20182017Win the Video
Head End market and prepareexpanding to Network
Gross Margin expected up(shift to software)
Targeting double digit operating profit by 2018
Toplineexpected to keep growing in the 30% range (all regions will contribute)
2017-2018 Plan
S&M investments to
win the Video Head End market and prepare expanding
to Network, but
will not grow as fast as the topline
R&D investments to
prepare expanding
to Network, but
will not grow as fast as the topline

28ATEME © 1991-2017
Investors Relations
Next investor dates
Sept. 28, 2017 : 2017 Half-Year Results
Sept. 29,2017 : Investors presentation (Paris)
Nov. 9, 2017 : 2017 Q3 Revenues
Market data
ISIN: FR0011992700 - Ticker: ATEME
Stock price: €18.03 (as of 25 July 2017)
Market cap: €181.7 m (as of 25 July 2017)
Shareholder structureNumber of shares: 10,169,883Potential dilution : up to 441,900 shares
9,1%
12,0%
62,4%
16,5%
ELIGIBLE PEA PME
Business angels
Free float
Founders and management
VCs
Liquidity contract: Gilbert Dupont
0
100 000
200 000
300 000
400 000
500 000
600 000
700 000
3,00 €
5,00 €
7,00 €
9,00 €
11,00 €
13,00 €
15,00 €
17,00 €
19,00 €
21,00 €
Stock price Volume