first half results for r fy 2015/2016 - compagnie · pdf fileactions designed to increase the...
TRANSCRIPT

©P
h.R
oye
r ©
C_h
._C
uss
ot
FIRST HALF RESULTS FOR
FY 2015/2016
May 24, 2016

©JL
Au
dy,
D L
amin
g
CONTENTS
1. First half operating
highlights
2. First half results
3. Outlook & Strategy
2 2015/2016 half year results

3
1ST HALF OF FY 2015 / 2016
(En M€)
1er
Sem
15/161
er Sem
14/15 pro forma Var. %
1er
Sem
14/15
Comptable
Var. %
Comptable
Chiffre d’affaires 443,7 417,9 6,20% 421 5,40%
EBO Métier* 165,0 151,1 9,20% 147,4 11,90%
EBOM/CA 37,20% 36,10% +110bp 35,0% +BP220
Résultat Net part du
groupe54,5 50,5 7,80%
Free Cash-Flow
Opérationnels**62,5 70,7 -11,60%
* Divisional EBITDA = Cumulative EBITDA for Ski Areas, Leisure Destinations, and International Development
** Free Cash Flow before taxes and debt servicing
Further growth in earnings confirms rising strength of model
2015/2016 half year results

Operating highlights
4
1ST HALF OF FY 2015/2016
Sustained increase in Ski Area revenues: +5.6%
Double-digit revenue growth in Leisure Destination sales during the period for the 3rd year in a row
Projects underway in China and discussions on the Jardin d’acclimatation
Tighter organization, an improved operating margin
Success of the two prior FYs is confirmed and reinforcement of the credibility of our objectives
for 2018/2019
Results illustrate that our model is robust and our strategy well thought out
2015/2016 half year results

©N
.Laf
ay
1 First half operating
highlights
Ski Areas
Leisure Destinations
International Development
5 2015/2016 half year results

Growth in skier days and greater resilience
6
SKI AREAS
Staff expertise and continuous development of
differentiating know-how
Sustained investment efforts
Initiatives aimed at boosting accommodation
and distribution
Increase in the number of beds available at
resorts
Actions designed to increase the appeal of
destinations
Resort size Location
050
100150200250300350400450
Change in sales at end of period
+ 3%
2015/2016 half year results
-3%
0%
1%
0%
-4%
> 1%
-0,05
-0,04
-0,03
-0,02
-0,01
0
0,01
0,02
Total Savoie HteSavoie
TrèsGrandesStations
GrandesStations
CDA
2015/2016 ticket sales
Source: DSF – May 2016

Steady and spectacular growth for the 3rd year in a row
7
LEISURE DESTINATIONS
3 principal drivers:
Development of growth levers Yield management
Events
In-park sales
Targeted and relevant investments
supporting future growth, boosted by
increased capacity for partnerships
and concept creation
VHS as support for return visits and
word of mouth
0
10
20
30
40
50
60
70
0
20
40
60
80
100
120
140
160
180
200
2013/14
2014/15
2015/16
2015/2016 first half results
+10.1%
+10.9 %
+12.5 %

A credible and recognized player
2015/2016 first half results
8
INTERNATIONAL DEVELOPMENT
Operation Concept elaboration
Site positioning Construction
assistance Launch
preparation Operating assistance
Eastern Europe
Master plan and design of an indoor and
outdoor park in Moscow
Management contract, Rosa Khutor resort
(2011-2014)
Several contracts with NCR for the Elbrus,
Arkhys, and Veduchi sites
Grévin Prague
Master plan for the Kokhta-Mitarbi resort in Georgia
Technical assistance for MRDC
China, Japan and South Korea
Ski Dome and indoor park (Shanghai)
Assistance for the opening of the Thaiwoo resort
Japan: Partnership with MacEarth
Opening of Chaplin’s World by Grévin on April 17, 2016
South Korea: 2018 Olympic
Games

2 First half results
Presentation by business unit
Focus on park disposals
Update on the financial
structure
9 2015/2016 first half results

Ski Areas
10
INCOME STATEMENT
Lift ticket sales: +5.4% (volume effect: +2.4% including 0.9% calendar effect)
Accommodation: Increase in the number of beds and occupancy rate
EBITDA growth surpasses sales growth: operating costs contained despite difficult exogenous conditions
Capex under control (including additional 10M€ announced)
Impact of the difference in Easter weekend and Belgian and British holidays in H1
(En M€)1
er Sem
15/16
1er
Sem
14/15 Var. %
Chiffre d’affaires 363,7 344,4 5,60%
Journées skieurs (en M) 12,41 12,12 2,40%
EBO 187,3 169,9 10,20%
EBO/CA 51,50% 49,30% +220 bps
Investissements nets 55,0 50,0 10,10%
A highly seasonal
business: 90% of annual sales on average but
70% of costs
2015/2016 first half results

Leisure Destinations
11
INCOME STATEMENT
SALES: +10.1% (after H1 2015 of +10.9% and H1 2014 of +12.5%)
Volume effect: +4.9%; Price effect: +5.2%
Very good performance over Halloween and for Futuroscope throughout H1, offsetting decline in sales for
Grévin Paris
EBITDA unchanged despite the early Spring vacation, changing the timetable for some operating expenses: Facility maintenance, hiring and training of seasonal personnel; Marketing expenditures for launch of new attractions
Higher capex, resulting in investments to increase the appeal of attractions, the residual increase resulting from a programming effect between the 1st and 2nd half year, which will be corrected at the end of the year
(En M€)
1er Sem
15/16
1er Sem
14/15
pro forma
Var. %
pro forma
1er Sem
14/15
Comptable
Var. %
Comptable
Chiffre d’affaires 77,4 70,3 10,10% 73,4 5,40%
Visiteurs (en M) 2,051 1,953 4,90% 1,953 4,90%
EBO -17,7 -17,9 1,20% -21,6
EBO/CA -22,90% -25,50% -29,40%
Inv. Nets 33,7 17,1 97,50% 17,3
A seasonal business: 20% of annual sales
on average, but 40% of
costs
2015/2016 first half results

International Development
12
INCOME STATEMENT
Sales:
Positive contribution from Grévin international
Consulting business down; contract timing
EBITDA: Start-up costs for Chaplin’s World by Grévin
Higher CAPEX due to the opening of Chaplin’s World by Grévin
Ramp-up of Grévin museums abroad slower than anticipated.
Operationally, this division reports to the LD division since January
Special action plans
Extension of the initial phase of the J curve
(En M€)1er Sem
15/16
1er Sem
14/15 Var. %
Chiffre d’affaires 2,58 3,06 -15,50%
EBO -4,59 -0,9 NA
Investissements nets 6,23 4,47 +1,76 M
2015/2016 first half results
Group
13
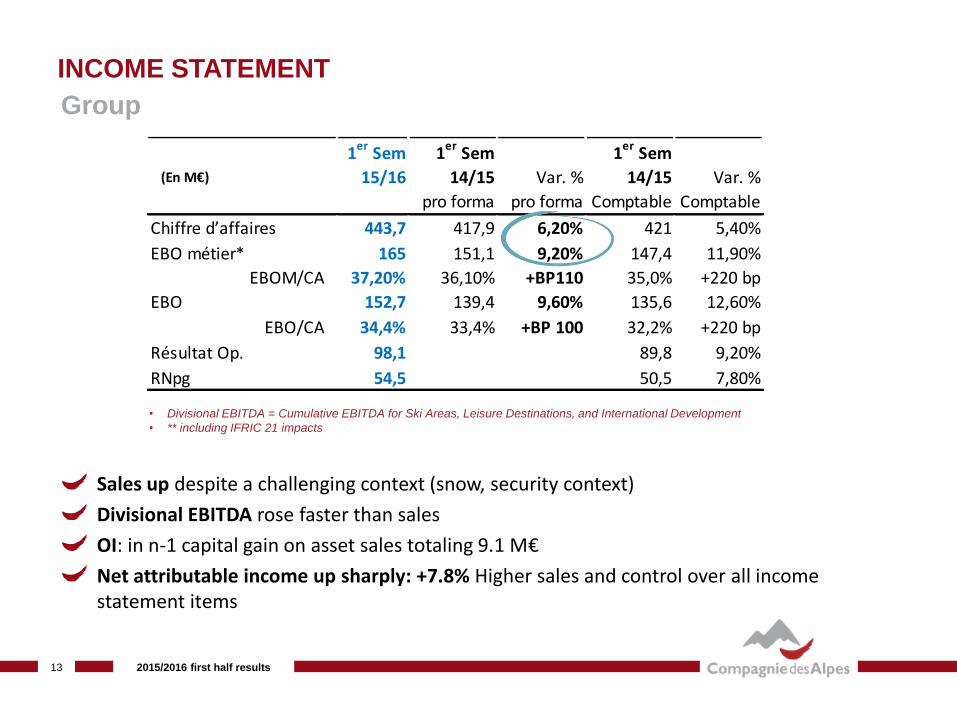
INCOME STATEMENT
Sales up despite a challenging context (snow, security context)
Divisional EBITDA rose faster than sales
OI: in n-1 capital gain on asset sales totaling 9.1 M€
Net attributable income up sharply: +7.8% Higher sales and control over all income statement items
(En M€)
1er
Sem
15/16
1er
Sem
14/15
pro forma
Var. %
pro forma
1er
Sem
14/15
Comptable
Var. %
Comptable
Chiffre d’affaires 443,7 417,9 6,20% 421 5,40%
EBO métier* 165 151,1 9,20% 147,4 11,90%
EBOM/CA 37,20% 36,10% +BP110 35,0% +220 bp
EBO 152,7 139,4 9,60% 135,6 12,60%
EBO/CA 34,4% 33,4% +BP 100 32,2% +220 bp
Résultat Op. 98,1 89,8 9,20%
RNpg 54,5 50,5 7,80%
• Divisional EBITDA = Cumulative EBITDA for Ski Areas, Leisure Destinations, and International Development
• ** including IFRIC 21 impacts
2015/2016 first half results

Financial structure
14
INCOME STATEMENT
Reduction in net debt despite CAPEX increase of 24 M€ (of which 20M€ announced increase for the period and 4M€ attributable to a programming effect between H1 and H2 that will be corrected at the end of the year)
Improvement in financial leverage and banking covenants honored
(En M€)
1er Sem
15/16
1er Sem
14/15
Comptable
Var. %
Comptable
Capacité
d’autofinancement115,2 103,7 11,04%
Investissements
industriels nets-96,16 -72,12 33,30%
Autofinancement
disponible19,04 31,58 -39,70%
FCF Op.* 62,5 70,7 -11,66%
Dette nette 265,0 272,2 -2,40%
Dette Nette / EBO 1,42 1,57 NA
2015/2016 first half results

© Y
ann
Der
et
3 Outlook
& Strategy
2015/2016 outlook
Strategic challenges
15 2015/2016 first half results

FY 2015/2016
16
OUTLOOK
SKI AREAS
– Annual sales growth of more than 3% vs. 2014/2015 expected
– EBITDA margin in line, percentage-wise, with 2014/2015
INTERNATIONAL DEVELOPMENT
– Enthusiastic reception for Chaplin’s World by Grévin
– Advanced discussions on several projects that could lead to the
operation of new facilities
LEISURE DESTINATIONS
– At this stage, second half is positively trending
– Investments in every park to increase appeal
– EBITDA and ROCE guidance confirmed, despite costs linked to
security
2015/2016 first half results

A reaffirmed ambition
17
STRATEGY
Continue and expand development in our historic businesses
– A growth oriented business model
Proven growth potential at historic leisure facilities (+ accommodation)
In ski area facilities, a solid cash generating base
Our priority: step up the pace of international development
– A necessity for the group
Most growth in France and Benelux
Locate in higher growth regions and capture new client segments for our existing sites
– The group has numerous strengths
Standard-setting facilities in Europe and worldwide o 10 sites welcome more than 1M visitors/skiers
o From educative entertainment (Asterix, Walibi) and science (Futuroscope) to sports (Tignes, Val d’Isère) and history (Chaplin’s World)
A very broad spectrum of formats, from the great outdoors (skiing) to urban indoors (Grévin), not to mention short stays (Parc Astérix, Futuroscope)
Developing the capacity for concept and content creation
2015/2016 first half results

18
UPCOMING PRESS RELEASES
July 21, 2016 FY 2015/2016 9-month sales
October 20, 2016 FY 2015/2016 annual sales
2015/2016 half year results

©an
dyp
aran
t.co
m
QUESTIONS
19 Résultats 1er semestre
2015/2016