first national bank presentation at the chief analytics officer, africa 2016
TRANSCRIPT

Attaching Value to Data through Experimental Work
including Looking at the Big Data & Analytics
Phenomenon to Build Use Cases
Dr. Mark Nasila
Head of Advanced
Analytics
First National Bank
Presenter Background
PHD (Mathematical Statistics) 2014, NMMU
MSc. Cum Laude (Mathematical Statistics) 2008, NMMU
BSc. Hons (Mathematical Statistics) 2007, NMMU
Chair - First National Bank Advanced Analytics Committee.
FirstRand Group Assets and Liabilities analytics committee
First National Bank Data Executive committee
Fraud analytics committee (Chair)
Financial Crime Risk Model Validation Committee
First National Bank Non Credit Risk Model Validation Committee
Design and facilitate the data science lab
Head of Advanced Analytics, First National Bank : 2015 –Present
Head of Advanced Analytics, Financial Risk Management, First National Bank : 2014 –2015
Quantitative Analyst, Premium and Core Banking, First National Bank : 2012 –2014
Quantitative Analyst, Core Banking Solutions, First National Bank : 2010 –2012
Associate Lecturer, Statistics Department, Nelson Mandela Metropolitan University: 2008 –2010
• Nasila, M.W. and Sharp, G.D. (2011) The Power of Statistical Methods in Detecting and Preventing Card Fraud,
Proceedings of the International Banking Conference (IBC) held in Durban and On board On the MSC Sinfonia
Ocean Liner, South Africa.
• Chair of a session, “Statistics and the web” at the ISI (International Statistics Institute) Conference, 2009.
• Nasila, M.W. and Litvine, I.N. (2009) Statistical models for pricing weather derivatives for major South African
Coastal areas, Proceedings of the European simulation and modelling conference held in Leicester, London.
• Co-Author of Conference paper: The Determination of an Environmental Service for a Contingent Valuation Study –
Using R to Compute Estimates. Gary Sharp, David Friskin, Stephen Hosking, Catherine Logie, Mark Nasila, Henri
van der Westhuizen.

Outline
Analytics for decision making: Business Value through Use Cases
Deriving value while in the analytics journey: from infancy to maturity
Creating a balance between Descriptive, Predictive and Prescriptive Analytics
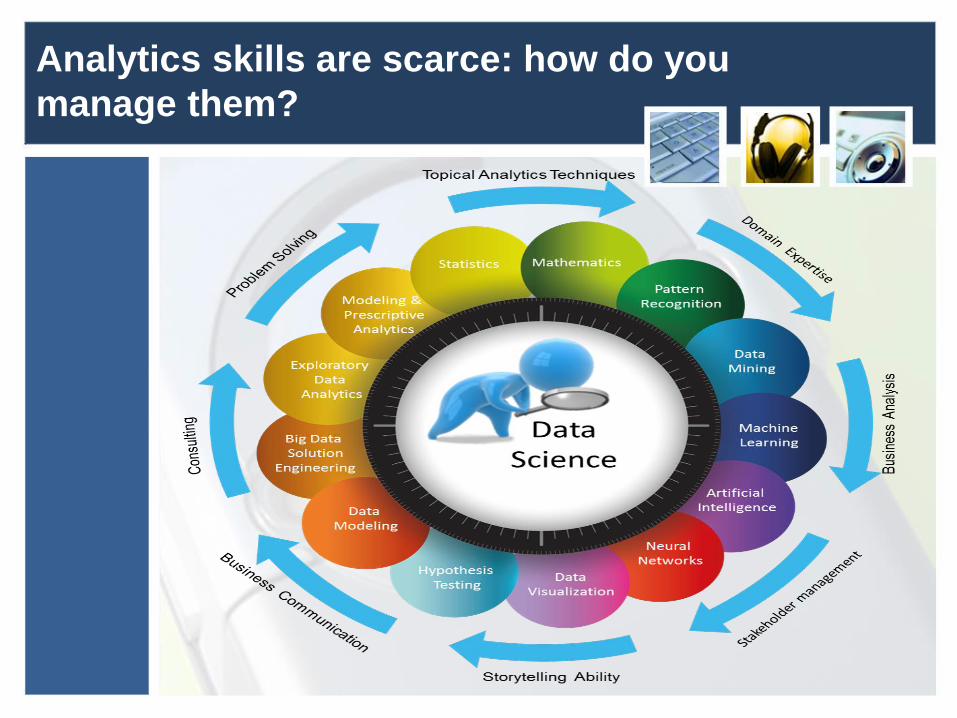
Analytics skills are scarce: how do you manage them?
The role of a Chief Analytics Officer/Head of Advanced Analytics in business

Analytics for decision making: Business Value
through Use Cases
Deriving Value Using Big Data and
Analytics
Data Storage Systems
Structured and
Unstructured Data
Data Engineers
and Scientists
Analytical Platforms

Analytics for decision making: Business Value
through Use Cases
What do you really want to achieve?
Increased customer loyalty? Better customer engagement?
A greater share of wallet via cross-sell? New customers?
Lower attrition?
In other words, what is the use case? What exactly are the types of
business problems big data analytics likely to solve?
“For this you need a mini-MBA in Big Data Use Cases”
(worldpress.com).
Analytics for decision making: Business Value
through Use Cases
Industry specific vs. Process specific Use Cases
Use cases vs. Use case Enablers
Use case Enablers
Data Mining Techniques (descriptive statistics)
Analytical platforms e.g. SAS, R, Python
Predictive and Machine learning models
(Inferential Statistics)
Specialised datasets e.g. geo location, contact
ability data, call Centre agent data

Big Data Use Cases in Telecommunications

Insurance fraud detection
Campaign and sales program optimisation
Brand management
Care Management
Patient care quality and program analysis
Medical Device and Pharma Supply-chain management
Drug discovery and development analysis
Clinical trail optimisation
Patient Engagement
Health Behavior Modification
Prescription Adherence
Prescription Fulfillment
Big Data Use Cases in the Health Care Industry

Financial crime management
Card Fraud, application fraud, money laundering analytics, investigations
Internal fraud, false claims etc.….
Marketing
Campaign and sales program optimisation
Risk Management and Profiling
Credit risk management e.g. Intelligent Credit default risk models
Compliance and regulatory reporting
Regulatory compliance e.g. Market Conduct Risk etc.
Customer Segmentation
Customer analytics, Call center interaction analytics (including Demand
Prediction)
Customer sentiment analytics
Customer Churn prediction and management
Attrition prediction, Designing loyalty and rewarding programs
Big Data Use Cases in Banking

Deriving value while on the analytics journey:
from infancy to maturity
The Old Way of Analytics
Business Idea Business case Executive Approval –
(Budget Approval)
1.Identify People
2.Select Resources
3. Infrastructure
Explore Data Develop Analytics
Implement Analytics
Derive NPV

The New Way of Analytics
Business Idea Business case Executive Approval –
(Budget Approval)
1.Identify People
2.Select Resources
3. Infrastructure
Explore Data Experimental Environment
Develop Analytics
(POC)
Implement Analytics
(POC)
Derive NPV
Deriving value while on the analytics journey:
from infancy to maturity

Deriving value while on the analytics journey:
from infancy to maturity
Experimental Environment/Innovation Lab
BIG DATA
Structured
Unstructured
INNOVATION LAB
SAS
R
Python
Claudera
IBM
STATISTICA
DATA- DRIVEN USE
CASES
Deriving value while on the analytics journey:
from infancy to maturity
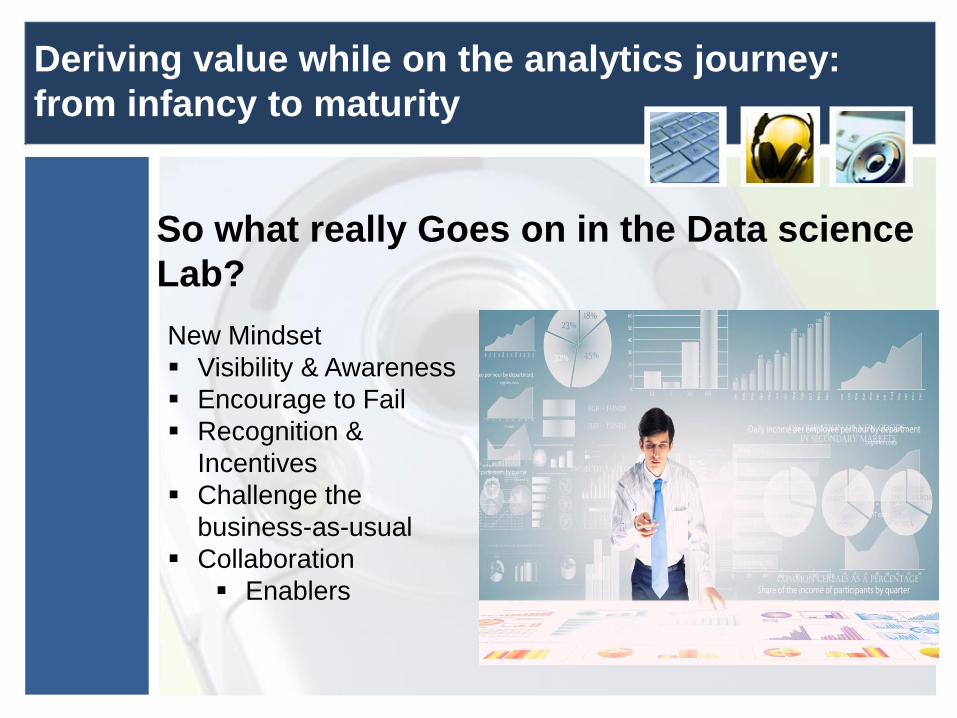
So what really Goes on in the Data science
Lab?
New Mindset
Visibility & Awareness
Encourage to Fail
Recognition &
Incentives
Challenge the
business-as-usual
Collaboration
Enablers

Big Data Use Cases for Telcos

Creating a balance between Descriptive,
Predictive and Prescriptive Analytics
Descriptive Analytics Describe, show or summarise data in a meaningful
way such that, for example, patterns might emerge from the data.
Does not allow to make conclusions regarding any hypotheses we might have made.
Measures of central tendency Mode, Median, and Mean
Measures of spread Range, Quartiles, Absolute Deviation, Variance and
Standard Deviation.
Normally presented using Graphical and tabulation techniques or even plain commentary.
Creating a balance between Descriptive,
Predictive and Prescriptive Analytics
Predictive Analytics ( a subset of inferential
analytics)
Inferential analytics ~ are techniques that allow
to make generalisations about the populations.
Estimation inferential techniques Forecasting (demand)
Predictive modelling of events e.g. Product take-up, fraud
Hypothèses testing e.g. Effect of interest rate increase on credit defult risk and profit
margins
Effect of personalised marketing on customer loyalty

Prescriptive Analytics Analytics dedicated to finding the best course of action for a
given descriptive and inferential analytics insights.
Explores all possible scenarios (outcomes)
Incorporates real life operational factors in decision making e.g. real time capability, available analytics deployment platforms.
May play a role of recommending the best strategy to follow given the available insights
E.g. Given the number of transactions processed daily, the accuracy of the fraud model and the complexity of the fraud model, we should have real time fraud declines
Creating a balance between Descriptive,
Predictive and Prescriptive Analytics

Descriptive Analytics Understand at an aggregate level what is going on.
Summarize and describe different business aspects.
Predictive Analytics Need to know something about the future
Fill in the information that you do not have.
Prescriptive Analytics Need to provide users with advice on what action to
take.
Creating a balance between Descriptive,
Predictive and Prescriptive Analytics
Analytics skills are scarce: how do you
manage them?
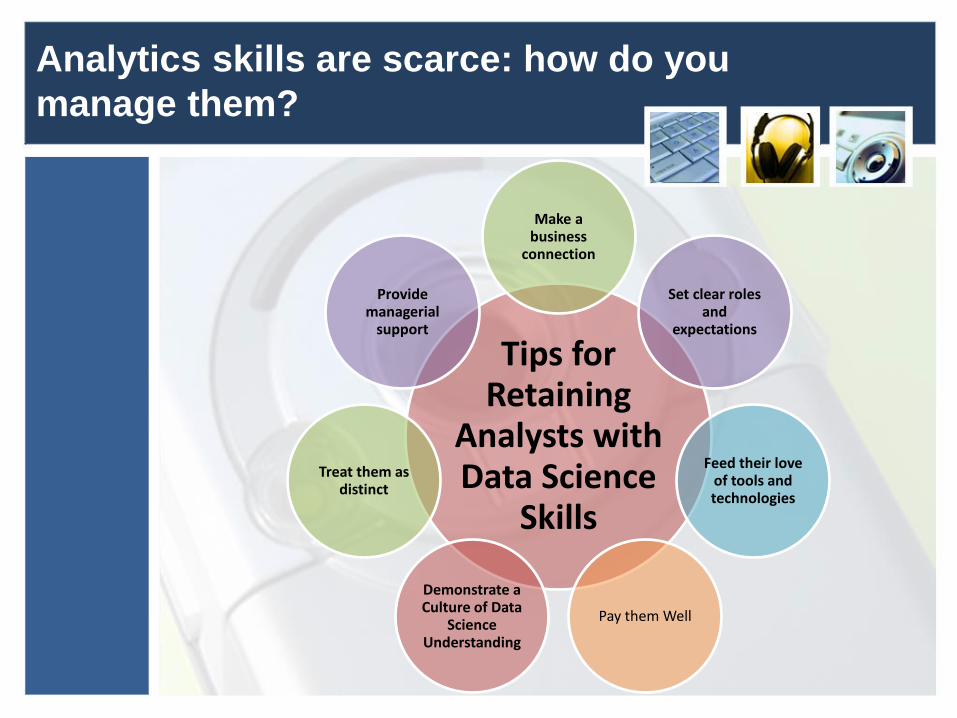
Analytics skills are scarce: how do you
manage them?
Tips for Retaining
Analysts with Data Science
Skills
Make a business
connection
Set clear roles and
expectations
Feed their love of tools and technologies
Pay them Well
Demonstrate a Culture of Data
Science Understanding
Treat them as distinct
Provide managerial
support

The role of a Chief Analytics Officer in the Data
and Analytics Strategy
“It's Time To Welcome The Chief Analytics Officer To The C-suite”, Frank Bien - CEO of Looker.
• Chief Analytics Officer (CAO) – Deriving business value using big data and analytics
within an organisation
– New C-Level position Driven by organisations desire to turn big data into a strategic asset
– Few Organisations have the role of CAO defined within their existing c-suite, but have the “Advanced analytics head” at a lower level
– Owns the resulting ROI/NPV on both top line and bottom line numbers
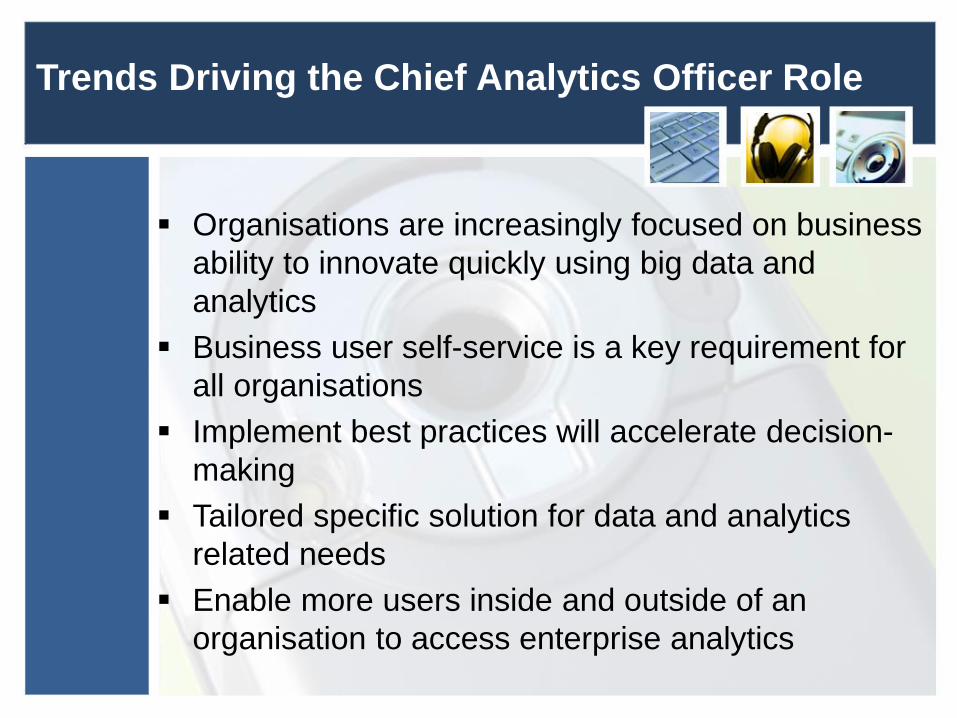
Trends Driving the Chief Analytics Officer Role
Organisations are increasingly focused on business
ability to innovate quickly using big data and
analytics
Business user self-service is a key requirement for
all organisations
Implement best practices will accelerate decision-
making
Tailored specific solution for data and analytics
related needs
Enable more users inside and outside of an
organisation to access enterprise analytics

The role of a Chief Analytics Officer in the Data
and Analytics Strategy
Attributes of a chief analytics
officer
bridge builder
analytics, technology
and business disciplines
Encourages Fail fast --
within reason
Be a change leader,
operationally and culturally
Connected and Keeps abreast of analytical
developments
Identify opportunities
to gain advantage
Data Science and Statistical
Expertise
Embraces Outcome
based analytics

Thank You