first order analysis of nitrate loading in the upper elbe
TRANSCRIPT

Brigham Young University Brigham Young University
BYU ScholarsArchive BYU ScholarsArchive
Theses and Dissertations
2010-12-10
First Order Analysis of Nitrate Loading in the Upper Elbe River First Order Analysis of Nitrate Loading in the Upper Elbe River
Basin, Czech Republic Basin, Czech Republic
Daniel J. Ritter Brigham Young University - Provo
Follow this and additional works at: https://scholarsarchive.byu.edu/etd
Part of the Geology Commons
BYU ScholarsArchive Citation BYU ScholarsArchive Citation Ritter, Daniel J., "First Order Analysis of Nitrate Loading in the Upper Elbe River Basin, Czech Republic" (2010). Theses and Dissertations. 2872. https://scholarsarchive.byu.edu/etd/2872
This Thesis is brought to you for free and open access by BYU ScholarsArchive. It has been accepted for inclusion in Theses and Dissertations by an authorized administrator of BYU ScholarsArchive. For more information, please contact [email protected], [email protected].

First Order Analysis of Nitrate Loading in the
Upper Elbe River Basin, Czech Republic
Daniel J. Ritter
A thesis submitted to the faculty of
Brigham Young University
in partial fulfillment of the requirements for the degree of
Master of Science
Alan L. Mayo, Chair
Stephen T. Nelson
Barry R. Bickmore
Department of Geological Sciences
Brigham Young University
April 2011
Copyright © 2011 Daniel J. Ritter
All Rights Reserved
ABSTRACT
First Order Analysis of Nitrate Loading in the
Upper Elbe River Basin, Czech Republic
Daniel J. Ritter
Department of Geological Sciences
Master of Science
Nitrate contamination of water is a worldwide issue. Nitrate is especially dangerous for
young children, and may result in potentially fatal blue baby syndrome when concentration in
drinking water is > 10 mg/L N-NO3. Nitrate in surface water may also lead to eutrophication.
Sources of NO3- contamination include nitrate fertilizers, wastewater treatment plants, individual
domestic septic systems, runoff from animal feedlots, and natural soil nitrogen. Nitrate
contamination in the Elbe River drainage, covering 148,270 km2
in Germany and the Czech
Republic, has been a long-term issue. This study examines the upper one-third of the basin,
located almost entirely in the Czech Republic. In the Czech Republic, NO3- concentrations,
which in some river reaches exceed the European Union (EU) standard of 50 mg/L, have
decreased only slightly or remained constant since monitoring began in the 1960’s.
At the German border the calculated average 2000-2008 Elbe discharge is 9.4 x 10⁹ m
3/yr
and annual NO3- loading is 37.4 x 10
6 kg/yr. The upper Elbe has four major tributaries: the Labe
(Elbe), Berounka, Ohře, and Vltava whose percentages of total discharge and NO3- loading are
10.3/10.4, 28.0/33.3, 12.6/8.9, and 49.1/47.4 percent, respectively. Flow and NO3- concentrations
for 138 locations were obtained from the Czech Hydrometeorological Institute. δ15
N
compositions, determined for 57 locations, were used to create a map showing the estimated
spatial distribution of nitrate sources within the basin. Nitrate loading for each sample site was
calculated using historical concentration and flow data for 2000-2008. Preliminary calculations
suggest that ~ 76 percent of the nitrate load is from human/animal waste. Given that large
feedlot operations are rare, the major source of nitrate in the region is likely small wastewater
treatment plants and rural septic systems.
Keywords: Nitrate, Nitrogen Isotopes, Czech Republic, Elbe River

iii
TABLE OF CONTENTS
TABLE OF CONTENTS ............................................................................................................... iii
LIST OF FIGURES ....................................................................................................................... iv
LIST OF TABLES .......................................................................................................................... v
INTRODUCTION .......................................................................................................................... 1
Purpose and objectives ................................................................................................................ 2
UPPER ELBE RIVER BASIN SETTING ..................................................................................... 3
METHODS OF INVESTIGATION ............................................................................................... 5
NITROGEN COMPOUNDS AND NITROGEN ISOTOPES IN WATER SYSTEMS ................ 7
NITRATE IN THE UPPER ELBE RIVER BASIN ....................................................................... 9
DISCUSSION ............................................................................................................................... 12
CONCLUSIONS........................................................................................................................... 17
FIGURES ...................................................................................................................................... 19
TABLES ....................................................................................................................................... 32
REFERENCES ............................................................................................................................. 43

iv
LIST OF FIGURES
Figure 1. The Elbe River and its major tributaries in the Czech Republic. .................................. 19
Figure 2. Sub-basins of major tributaries to the Elbe in the Czech Republic. .............................. 20
Figure 3. Median monthly flow rates for the upper Elbe basin and each tributary sub-basin. ..... 21
Figure 4. Land use in the upper Elbe basin and in each tributary sub-basin. ............................... 21
Figure 5. Percent of population living in various sized cities and villages. .................................. 22
Figure 6. Location of ČHMÚ sampling sites. ............................................................................... 23
Figure 7. Sites where nitrogen isotope samples were collected.................................................... 24
Figure 8. Median annual nitrate loading for the upper Elbe basin and tributary sub-basins. ....... 25
Figure 9. Median annual nitrate load by km2 in the upper Elbe basin and tributary sub-basins.. 25
Figure 10. Percentage of annual nitrate loading by quarter. ......................................................... 26
Figure 11. Median annual nitrate load per capita in upper Elbe basin and tributary sub-basins.. 26
Figure 12. Relationship between city size and per capita loading in the Czech Republic. .......... 27
Figure 13. Sampled δ15
N value versus concentration, with source divisions and trendlines. ...... 27
Figure 14. Size of European and North American river basins. ................................................... 28
Figure 15. Annual nitrogen loading in European and North American river basins per km2. ...... 28
Figure 16. Annual per capita nitrogen loading for European and North American river basins. . 29
Figure 17. Relationship between population density and annual nitrogen loading per km2......... 29
Figure 18. Population density of European and North American river basins. ............................ 30
Figure 19. Sampled sites contoured to assign sources to tributaries............................................. 31
v
LIST OF TABLES
Table 1. Summary of loading, flow, concentration, and measured isotopes. ............................... 32
Table 2. Chemistry data for sampled ČHMÚ sites. ...................................................................... 37
Table 3. Summary of nitrate loading in the upper Elbe basin ...................................................... 41
Table 4. Selected livestock numbers by year. ............................................................................... 41
Table 5. Selected Wastewater Treatment Plant Data .................................................................... 42
Table 6. Percent loading by source ............................................................................................... 42
1
INTRODUCTION
Nitrate contamination of water supplies is a worldwide issue, as it can be detrimental to
health of individuals and harmful to the environment. Elevated nitrate concentration in water is
especially dangerous for young children, and may result in potentially fatal methemoglobinemia
(also known as blue baby syndrome) if nitrate levels are > 10 mg/L N-NO3 or ~50 mg/L NO3
(Vigil et al., 1965; Feth, 1966; Kreitler et al., 1978; Zaporozec, 1983; Fan and Steinberg, 1996).
Excess nitrate in surface water may also lead to eutrophication, which can result in low dissolved
oxygen in lakes and estuaries (Lancelot et al., 1987; Hickel et al., 1993). Sources of
contamination include the overuse of nitrate fertilizers, discharge from wastewater treatment
plants, individual domestic septic systems, runoff from animal feedlots, and natural
mineralization of soil nitrogen (Feth, 1966; Delwiche, 1970).
Nitrate contamination in the Elbe River drainage has been a long-time issue of concern.
The Elbe River and its tributaries (Figure 1) are a major water resource for people in the Czech
Republic and downstream in Germany. The Elbe River basin is the fourth largest in Europe,
covering 148,270 km2
(Langaas et al., 2002). The upper one-third Elbe River basin is located
almost entirely in the Czech Republic. Nearly 7 million people live in the Czech Republic
drainage area and 18.7 million live in the basin in Germany. The Czech government has
monitored water quality in the Elbe River basin (known in the Czech Republic as the Labe
River) and its tributaries since the 1960s. Although concentrations of other pollutants have
decreased significantly since monitoring began, nitrate concentrations, which in some reaches
exceed the European Union (EU) and World Health Organization (WHO) standard of 50 mg/L,
have decreased only slightly or remained constant. Nitrate concentrations occasionally exceed
levels that would lead to infant methemoglobinemia. It has been shown that eutrophication in

2
the German Bight area is due in part to anthropogenic nitrate input from the Elbe River (Lancelot
et al., 1987; Hickel et al., 1993). Lakes and reservoirs in the in the upper Elbe River basin are
also vulnerable to eutrophication (Hejzlar et al., 2000; Judová and Janský, 2005). Determining
the major source of nitrate and the nitrate loading from each source in the upper Elbe river
system is key to managing nitrate concentrations in the Czech Republic to ensure future
improvement in water quality.
Purpose and objectives
This investigation is a first order quantification of nitrate contributions from each source in
the upper Elbe River basin. Nitrogen isotopic compositions, used in conjunction with nitrate
loading data, have been used to identify and quantify nitrate loading from commercial fertilizer,
soil mineralization, and human and animal waste. Specific objectives of this study are:
1. obtain historical flow and nitrate concentration data for the upper Elbe River basin,
2. collect and analyze samples for nitrogen isotopes from key locations along major and
minor tributaries, and from end member contributors such as wastewater treatment plants
and streams with little anthropogenic nitrate input;
3. calculate average nitrate loading at each sampling site, major tributary and river reaches,
and the entire upper Elbe basin, using historical nitrate concentration and flow data;
4. determine the relationship between nitrogen isotope compositions and nitrate
concentrations; and
5. calculate the nitrate loading of the major tributaries from agricultural, wastewater, and
natural sources.

3
UPPER ELBE RIVER BASIN HYDROLOGIC SETTING
The upper Elbe basin contains four major river systems that contribute to the Elbe (Figure 2).
Major tributaries include:
1) the Labe, which originates in the northeast and enters Germany near the
town of Decín. In Germany the Labe is called the Elbe,
2) the Ohře, which joins the Labe at Litoměřice about 20 km south of the
German border,
3) the Vltava, which originates in the central Czech Republic, flows through
the capitol city Praha (Prague) and joins the Labe at Mělník about 30 km
south of the German border,
4) the Berounka, which joins the Vltava about 1 km south of Praha. The
Berounka originates at Plzeň where the Mţe, Radbuza, Úhlava, and Úslava
rivers join.
The upper Elbe River basin drains 61% of the Czech Republic (Dvorak, 1996). In the late
1980’s and early 1990’s much of the drainage was classified as class 4 and class 5 (heavily
polluted and very heavily polluted; Blue Report, 2008). Steps were taken in the 1990’s to
improve water quality (Schumann and Simon 1996). Despite better water quality practices,
nitrate concentration in the river and its tributaries has remained high (Blue Report, 2008; Table
1). In some areas, especially during low flow, nitrate levels exceed the EU and WHO nitrate
drinking water standard (Appendix A).
Surface water contributions to the upper Elbe drainage from other countries are
negligible, so precipitation is the major source of river water through surface runoff and
groundwater infiltration (Dvorak, 1996). The upper Elbe River basin receives about 700 mm of

4
precipitation annually (Dvorak, 1996). About 62% of the annual precipitation is lost to
evaporation and transpiration, whereas the remaining 32% contributes to total runoff, with direct
surface runoff counting for 14% and baseflow accounting for 18% (Dvorak, 1996). Most of the
precipitation falls during the summer months, between June and August (Dvorak, 1996; Blue
Report, 2008).
River flow in the upper Elbe basin is generally highest in March, likely due to spring
runoff of winter snowmelt (Figure 3). During July and August sampling, flows are generally
low, except during extreme storm events. The largest tributaries have average flow rates ~250
m3/sec, whereas the smallest tributaries average < 1 m
3/sec.
Most of the Elbe River drainage in the Czech Republic is used for agriculture (54%) or is
forested (34%; Figure 4). The distribution of land use varies between sub-basins. The Labe sub-
basin has a slightly higher percentage of agriculture, with 57% of the area of the sub-basin being
used for that purpose. Land use in the Berounka and the Vltava sub-basins were similar to the
entire upper Elbe basin, with 50.5% and 54% respectively. The Ohře sub-basin has a lower
agricultural land usage at 44%. The Berounka has the highest percentage of forested land at
39%. The Ohře is next at 36%, followed by the Vltava at 34% and the Labe at 31%.
Of the roughly 7 million inhabitants in the upper Elbe River basin, 18% live in or near the
capital city of Praha, with the rest living in smaller cities and villages that are spread throughout
the countryside (Figure 5). Almost all cities and villages are located along a perennial river or
stream.
5
METHODS OF INVESTIGATION
Monthly nitrate and river flow data for 138 monitoring locations in the upper Elbe basin
were obtained from the Czech Hydrometeorological Institute (ČHMÚ) for the years 2000-2008
(Figure 6). Monitoring locations are designed with a ČHMÚ ID number. Historical data
contained nitrate concentrations reported as nitrate in nitrogen and flow reported in m3/s
(Appendix A). Land use and population data were obtained from the Czech Statistical Office
(CZSO, 2010).
Nitrogen isotope samples were collected during low flow conditions in July and August
2008 and 2009 (Table 2; Figure 7). Sites for isotopic sampling were selected where median
monthly N-NO3- concentrations were influenced by either contributions from tributaries and
population centers. Two samples were collected from wastewater treatment plant discharges and
three samples collected from headwater sites that have minimal anthropogenic nitrogen input.
Samples were collected and analyzed using a modified version of the method developed
by Silva et al. (2000). Samples were collected from the middle of the water column using a
bottom sampler or direct filling of a 4L collapsible container. When NO3- concentrations were
low, two collapsible containers were used. The NO3- was captured in resin columns using
gravity methods. The resin columns were filled with 6 mL of Bio-Rad 200-400 AG1-X8 (200-
400 mesh) chloride form resin. Ends of the columns were packed with Pyrex wool, which held
the resin in place and served as filter material. The columns were stored in the dark at 3.5 oC.
Nitrate was stripped from the columns by pumping approximately 40 mL of 3M HCl
through the column using a Dionex gradient pump. The solution was passed through a column
containing silver oxide (Ag2O) to remove chloride. Ag2O was washed with distilled DI water to
remove any residual nitrate. The rinsed solution was collected, filtered, and neutralized using

6
10M NaOH. Samples were then brought to dryness at 60oC, as described by Fukada, et al.
(2003). After drying, 1.5 to 15 mg samples (as AgNO3) were transferred to tin capsules for
isotopic analysis. Sample size was based on a trial and error process. Sample size varied widely
because other anions were not removed from the sample solution, and so the nitrogen content of
samples varied depending on the amount of precipitates of other anions present. Samples were
analyzed in replicate and mean values reported in Table 2. If replicates did not agree within
10%, results were discarded and the samples were reanalyzed. Sugar (0.2 mg) was added to each
capsule to help promote pyrolysis. The samples were analyzed at Brigham Young University
(BYU) facilities for 15
N values with a Costech 4010 Elemental Analyzer attached to a Thermo
Delta V Advantage mass spectrometer in a process similar to that described by Stickrod and
Marshall (2000). Analytical error of samples is 0.1‰. For each sample run, 5 replicates of three
standards (Albacore, Bovine Liver, and ASP-1) were analyzed. The laboratory values for
standards used are 1) Albacore, 11.13‰ 2) Bovine Liver, 7.5‰ 3) ASP-1, -5.27‰. The standard
deviation of corrected standard values between runs is ~0.2‰.
Monthly nitrate loading (2000-2008) was calculated for each ČHMÚ site using median
flow and concentrations values for each month. Median values were used to diminish the impact
of unusually high or low flows and concentrations. Annual loading for each site was determined
by summing monthly loading values. Total annual flow was calculated by converting median
monthly flows to L/month and summing them together. Median concentration was then
calculated by dividing median loading by median flow and converting. The 15
N data were used
to create a map showing the estimated spatial distribution of nitrate sources within the basin.
Water samples collected at each site were analyzed for major anions using a Dionex ICS-
90 Ion chromatograph, with bicarbonate concentration being determined using a Mettler Toledo

7
DL50 Graphix titrator. Major cation data for each water sample was obtained by running
samples on a Perkin Elmer 5100 PC Atomic Absorption Spectrophotometer. Water samples
were also analyzed for 18
O and D on a ThermoQuest Finnigan Delta Plus mass spectrometer.
Although these data were not subsequently used in this analysis the results are included in Table
2 for completeness.
NITROGEN COMPOUNDS AND NITROGEN ISOTOPES IN WATER SYSTEMS
Nitrate (NO3-) is highly soluble and enters easily into groundwater and surface water
systems (Zaporozec, 1983; Buzek et al., 2006), and migrates quickly away from other tracers that
might help to identify nitrate sources (Krietler and Jones, 1975; Buzek et al., 2006).
In soil zone and aqueous systems nitrogen occurs in several forms (Heaton, 1986), the
most important are organic nitrogen, ammonium (NH4+), nitrite (NO2
-), and nitrate (NO3
-).
These compounds are inter-converted through bacterial processes. In reducing environments,
denitrifying bacteria, such as Psudomonas denitrificans, convert organic nitrogen to NH4+
(Delwiche, 1970). In oxidizing environments, such as most soil zones, bacteria (e.g.,
Nitrosomonas and Nitrobacter) convert NH4+ into NO3
- (Feth, 1966). In soil, the production of
NO3- by mineralization occurs as follows (Heaton, 1986):
organic N NH4 NO2 NO3
This study focuses on nitrate because nitrate is the endmember of the oxidation chain of nitrogen
(Feth, 1966) and oxidizing conditions are assumed in the river system.
Nitrogen isotopes have commonly been used to identify the source of nitrate in surface
and ground water (Kreitler and Jones, 1975; Kreitler et al., 1978; Lindau et al., 1989; Aravena et
al., 1993; Moore et al., 2006). Several difficulties have been identified for using nitrogen

8
isotopes to distinguish nitrate sources. One of the most significant is denitrification.
Denitrification typically results in isotope fractionation, leading to more enriched δ15
N
compositions (Cook et al., 1970; Focht, 1973), but is likely absent in the water column
(Chesterikoff et al., 1992). Therefore the potential effects of denitrification on the measured
isotopic compositions are considered minimal and are not further addressed below.
It is also often difficult to distinguish between the three potential sources using nitrogen
isotope data alone. For this reason, it has been suggested that nitrogen isotopes should be used
for semi-quantitative analysis (Heaton, 1986). Coupled with other information, however, useful
source information can be gained from nitrogen isotopes.
Despite these limitations, the δ15
N compositions of commercial fertilizer, mineralized
soil, and animal and human waste typically have different compositional ranges (Kreitler and
Jones, 1975; Krietler et al., 1978; Kreitler and Browning, 1983; Heaton, 1984; Flipse and
Bonner, 1985; Moore et al., 2006). δ15
N compositions of -4 to +4‰ are generally considered to
represent commercial fertilizer sources, although forest soils may produce similar compositions
(Shearer et al., 1973; Freyer and Aly, 1974; Freyer and Aly, 1975; Heaton, 1986; Moore et al.,
2006). δ15
N compositions of +3 to +8‰ are considered representative of mineralized soil nitrate.
Although natural soil nitrogen may contribute to nitrate concentrations, it typically occurs in
concentrations less that 3 mg/L (Choi et al., 2003). Several studies examining nitrogen isotope
composition on a regional scale find that the vast majority of samples have isotopic compositions
similar to soil organic nitrogen, but in most cases high levels of mineralization result from the
increased cultivation of soils in agriculturally productive countries (Reinhorn and Avnimelech,
1974; Young, 1983; Heaton, 1985). δ15
N compositions of about +10‰ or greater represent
nitrate from animal or human waste, either directly or from wastewater treatment facilities

9
(Cheng et al., 1964; Krietler and Jones, 1975; Kreitler and Browning, 1983; Brenner et al., 2001;
Karr et al., 2001; Choi et al., 2003; Moore et al., 2006).
NITRATE IN THE UPPER ELBE RIVER BASIN
Agricultural activity has often been cited as a major source of nitrate contamination
(Carpenter et al., 1998; Langaas et al., 2002), and is a potential source of nitrate loading in the
upper Elbe basin due to heavy agricultural use (Figure 4). Commercial wastewater treatment
plants, which serve 81% of the population in the upper Elbe River basin, and individual domestic
septic systems, are also potential sources of nitrate (Feth, 1966; Bernhard et al., 1992, Blue
Report, 2008).
The 2000 -2008 median annual nitrate loading of the upper Elbe basin was 37.4 106 kg
(Figure 8; Table 3). The Labe sub-basin contributed almost one half of the total nitrate load,
18.0 x 10⁶
kg annually, or about 48%. The Vltava sub-basin contributed, 12.7 x 10⁶ kg annually,
or about 34% of the total nitrate load. The Berounka sub-basin only contributed 3.6 x 10⁶ kg or
about 10% of the annual load, and the Ohře sub-basin only contributed 3.1x 10⁶
kg or about 8%
of the total annual load. Several sub-tributaries had average annual nitrate loads > 106 kg. In the
Labe sub-basin the Orlice and Jizera rivers had average annual nitrate loads of 2.0 x 10⁶ kg
(Table 3). Vltava tributaries, the Sázava, Otava, and Luţnice, had average annual loads of 2.9,
1.3 and 1.5 x 10⁶ kg. No tributaries in the Berounka or the Ohře river system had average annual
loads > 106 kg.
When normalized for drainage basin size, nitrate contributions from the Labe sub-basin
remain disproportionately high (Figure 9). Average annual nitrate loading for the entire upper
Elbe basin was 706 kg/km2. The Labe sub-basin had an average annual loading of 1078 kg/km
2,

10
which is about 50% more that the upper Elbe basin average. The Vltava, Ohře and Berounka
sub-basins all had lower loading rates of 579, 487 and 449 kg/km
2, respectively. When the
contribution from the city of Praha is removed, the upper Vltava sub-basin loading (447 kg/km2)
is similar to the Ohře and Berounka sub-basins.
Nitrate loading in the upper Elbe River basin varies seasonally. Quarterly loading data
shows that 43% of annual nitrate loading occurred during the three high flow months March to
May, and 32% occurred between December and February (Figure 10). Only 13% occurred
between September and November, and 12% occurred between June and August. Seasonal
loading percentages vary somewhat by tributary sub-basin. The Ohře had significantly less
loading in March to May (33%), and significantly higher loading from December to February
(39%). The Berounka and the Labe quarterly loading were close to the overall average, whereas
the Vltava had higher loading during March to May (50%), and lower loading during December
to February (26%).
Using nitrate loading at each ČHMÚ site, it is possible to estimate the nitrate load
contributed by Praha, which has a population of ~1.2 x 10⁶. The reach of the Vltava that passes
through Praha is located between the confluence of the Berounka with the Vltava (ČHMÚ 1044)
and site ČHMÚ 1046 (Figure 6). The median annual nitrate loading between these two
monitoring locations, which are only ~ 30 km apart, was 1.9 x 10⁶ kg. Between ČHMÚ 1044
and ČHMÚ 105, which includes the entire capital region, the median annual loading is 3.1 x 10⁶
kg per year. This loading is more than the loading than the entire Ohře river system, which is 60
km long.
The median nitrate loading per capita was calculated for the entire Elbe River basin and
each sub-basin (Figure 11). Median annual per capita nitrate loading for the entire upper Elbe

11
River basin was 5.73 kg. The Labe has a much higher per capita loading, with 8.23 kg per
person per year. The Berounka is around the overall sub-basin number, at 5.53 kg per person per
year, while the Vltava and the Ohře were lower at 4.36 and 3.99 kg per person per year,
respectively. If the influence of the capital region is removed and the calculation for just the
upper Vltava sub-basin is made, per capita loading is 5.69 kg per person per year, which is much
closer to the overall basin average.
Per capita loading was also calculated for cities where ČHMÚ sampling locations occur
immediately up and down gradient of the city. Eight cities fit the criteria: Praha, Plzeň, Liberec,
České Budějovice, Mladá Boleslav, Tábor, Havlíčův Brod, and Klatovy. Even with this small
sample size, it is clear that per capita loading is lower than the average for the upper Elbe basin
for large cities (population > 50,000) and higher than average for smaller cities (Figure 12).
As noted above the relationship between δ15
N and nitrate concentration was evaluated
(Figure 13). Although the data are somewhat scattered the best fit trendline is described by the
equation:
4958.5)(4491.4 xLny (1)
The coefficient of determination (R2) for this line with the data is .4929. Trendlines generated
for the samples collected in 2008 and 2009 separately were nearly identical, showing that this
relationship was persistent through both sampling periods.
Samples were collected from several sites in an attempt to establish end member δ15
N
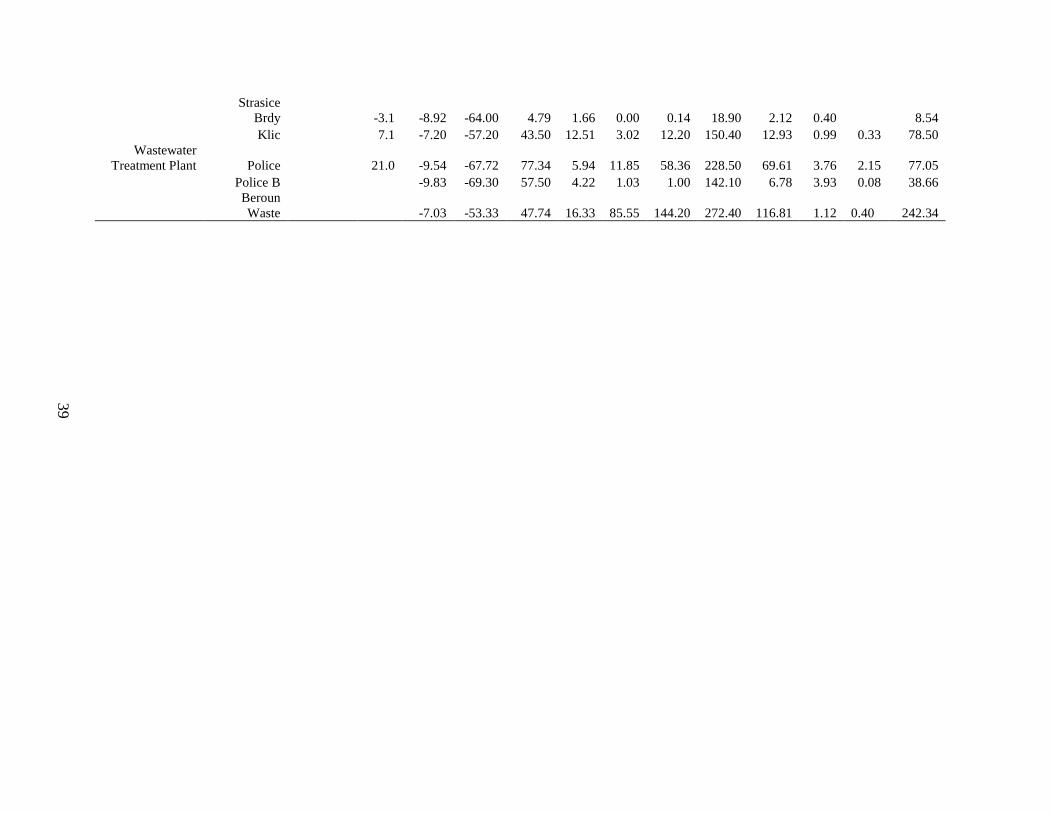
compositions. To establish mineralized soil nitrate compositions, samples were collected from
streams that have little to no anthropogenic nitrate at Adrspach, Klic, and Strasice Brdy. All
three samples had isotope compositions that fell within the range for mineralized soil nitrate

12
(Table 2). As expected, the Police wastewater facility discharges water with a δ15
N composition
of ~20‰ (Table 2).
DISCUSSION
In order to understand how nitrate loading in the upper Elbe basin compares to loading in
similar drainages in industrialized countries, loading and population data were obtained for
several North American and European river basins (Goolsby et al., 1997; Tockner et al., 2009;
EPA 2010). River basins were selected based the following criteria: 1) the basin is as large as or
larger than the upper Elbe basin (~ 45,000 km2), 2) the basin has a similar climate (temperate to
subtropical humid), and 3) the basin population has similar standards of living. Selected river
basins include the Columbia and Mississippi in North America, and the Volga, Rhine, Rhone,
and Danube in Western and Central Europe.
The size of the river basins varies greatly. In Europe, the Volga is the largest and the
upper Elbe is the smallest (Figure 14). The size of the Columbia drainage is similar to the
Danube and the Mississippi total drainage area is as large as the combined area of the European
rivers investigated. The total annual nitrogen loading per km2 also varies greatly, ranging from
~230 kg/km2 in the Volga to ~2058 kg/km
2 in the Rhine (Figure 15: Tockner et al., 2009).
Upper Elbe annual loading of ~ 830 kg/km2 is similar to the Danube (~832 kg/km
2). For
comparison the Mississippi River drainage has an average annual loading of only ~235 kg/km2,
whereas the Columbia River drainage has an average annual loading of only ~91 kg/km2 (EPA,
2010).
Annual per capita nitrogen loading varies between 5.2 to 10.13 kg/person (Figure 16).
Population density was calculated for each of the European and North American river basins
(Tockner et al., 2009; EPA 2010). In Europe, the Volga has a similar per capita loading rate to

13
the upper Elbe basin, with a value of 5.20 kg/person. The Rhine, Rhone and Danube have
slightly higher loading, at 7.61, 7.68 and 8.50 kg/person, respectively. For comparison, the
North American river basins have higher per capita loading values, with the Mississippi and
Columbia having 10.01 and 10.13 kg/person, respectively (Figure 16).
Loading per km2 takes on added meaning when evaluated relative to population density.
There is a strong correlation (R2 = 0.9451) between population density and loading per km
2
(Figure 17). When the calculation is performed assuming the nitrogen load from nitrate in the
upper Elbe is about 70% of the total nitrogen load (Tockner et al., 2009), the correlation
coefficient is R2 = 0.9742.
Although the Mississippi River drainage has the largest total annual nitrogen load, the
relative low loading/km2 vs. population density ratio of the drainage is attributed the combined
factors of low population density (Figure 18) and large contributions from commercial fertilizer
(51%) and livestock manure (30%). Organic nitrate and atmospheric deposition contributes
10%, and domestic, municipal and industrial waste sources only contribute 9% of the total
nitrogen load (Goolsby et al., 2009). The relatively high ratio of loading/km2 vs. population
density for the Rhine is attributed to the high population density of the river basin (Figure 18).
The upper Elbe River basin loading/km2 vs. population density is similar to the other
central European rivers (i.e., Rhone and Danube; Figure 17) and all of these drainages have
similar population densities (~ 100 to 150 people/km2; Figure 18). The high correlation between
basin loading/km2 vs. population density suggests causation. The nitrogen isotope data in the
upper Elbe drainage provides further insight into the impact of population on nitrate loading.
ČHMÚ site 3021, located on the Labe just north of Decín and not far from where the
river enters Germany, was analyzed for δ15
N. Because this site is the most downstream site

14
sampled, its δ15
N composition of 10.7‰ is assumed to be average δ15
N composition of the entire
upper Elbe basin (Figure 7). This value suggests that contamination in the basin has a large
contribution from animal or human waste sources.
The major goal of this study was a first order quantification of the percentage of nitrate
loading from each major nitrate source for the entire upper Elbe basin and for each tributary sub-
basin. Time and budget limitations did not allow for the sampling of every major river reach in
the basin, and in many cases, ČHMÚ sites were located only near the four major tributaries, so
historical concentration and flow data was not available for many sub-tributaries. A sufficient
number of samples were collected to make an initial assessment of the primary source of nitrate
in most major sub-tributaries as either contaminated agriculturally (through direct fertilizer
runoff or increased soil mineralization) or through human or animal waste.
Within each sub-basin, the distribution of δ15
N compositions was mapped (Figure 19).
δ15
N compositions < 9.5 ‰ were assigned as mostly derived from agriculture/soil nitrate and
compositions >9.5 ‰ were assigned as mostly derived from human/animal waste. Loading
values were then used to calculate the percentage of contamination from each nitrate source for
the entire upper Elbe basin and each tributary sub-basin. In the entire upper Elbe basin
approximately 24% of nitrate is agriculture/soil sourced, whereas 76% is sourced from human
and animal waste.
With the majority of samples from high nitrate concentration sites having isotope
compositions δ15
N compositions > 9.5 ‰, the major source of nitrates in the river system were
likely a combination of animal waste, wastewater treatment effluent, and small septic systems.
Although animal waste from livestock production may contribute some nitrates to river
contamination, it is important to note that there are not many commercial feedlots in the Czech

15
Republic. Livestock numbers have decreased since 1990. In 1990, there were 3.5x10⁶ head of
cattle. By 2010, that number had decreased to 1.4x10⁶ head (Table 4; CZSO, 2010). The
number of pigs declined even more, from 4.8x10⁶ head in 1990 to 1.9x10
6 head in 2010. Sheep
and rams fell from 0.4x10⁶ head in 1990 to 0.2 x10
6 head in 2010, and poultry, which had the
least significant change, fell from 32.0x10⁶ head in 1990 to 24.8x10
6 head in 2010 (Table 4).
Between 2000 and 2010 numbers of livestock have remained relatively constant with slight
declines in most areas. Because nitrate concentrations in most waterways have remained
relatively constant since 1990, contamination from runoff from livestock is likely not the primary
source of contamination.
In contrast to livestock numbers, the number of wastewater treatment plants in the Czech
Republic doubled between 2000 and 2009, from 1,055 to 2,158 (CZSO, 2010). In spite of this
increase, total capacity has not increased, likely because most of the added wastewater treatment
plants are located in small villages where only low capacity plants are needed. Of the 1,597
wastewater treatment plants in operation in 2009 in the upper Elbe basin, 635 are designed to
remove nitrogen (Table 5).
About 16.5% of the wastewater treatment capacity in the country is located in the capital
city of Praha, by far the most concentrated capacity in the country. Most of the Praha treatment
plants (i.e., 20 of the 25; Table 5) are designed to remove nitrogen, and contribute about half the
per capita load of rural facilities, with the capital region having a per capita load of 2.51
kg/person annually, compared to 5.73 kg/person for the entire upper Elbe basin. Samples
collected immediately downstream of Praha have nitrogen isotope compositions generally >
11‰. Sample 1045, collected just upstream of the city, has an isotope composition of 9.11,
whereas samples 105, 1096 and 3449, located downstream from the city, all have isotope

16
compositions in excess of 11 and have some of the highest observed isotope compositions
(Figure 7). Unfortunately, data on the size and location of the treatment plants that are equipped
to remove nitrogen is not available, making it difficult to pinpoint major point sources of nitrate
contamination.
Despite the majority of δ15
N compositions falling in the animal/human waste range,
agriculture may still play a role in nitrate contamination in the upper Elbe basin, especially in the
upper reaches of tributary sub-basins. The use of nitrogen fertilizer in the Czech Republic
increased slightly between 2000 and 2008, from 2.13x10⁵ metric tons in 2000 to 2.38x10
5 metric
tons in 2008 (CZSO, 2010). However, only 7 of the 57 samples analyzed had isotope
compositions that fell clearly in the fertilizer range. Direct contamination for agricultural
fertilizer is therefore not likely a major contributor to nitrate contamination in the Elbe River
Drainage.
Although agriculture is not a direct contributor through fertilizer use, other agricultural
activities still may play a role in nitrate contamination in the Czech Republic. Previous studies
have indicated that cultivation of land may lead to an increase in mineralization of soil nitrogen
to nitrate (Heaton, 1985; Dolezal et al., 2000). In particular, Dolezal et al. (2000) found that the
use of agricultural drainage tiles in the Czech Republic led to increased movement of nitrate
from soil nitrogen into nearby river systems, explaining higher than expected loading at sites
with δ15
N values in the soil nitrate range.
In tributary sub-basins, the Berounka, Ohře, and Vltava all have similar nitrate loading
when normalized by sub-basin area. The Labe has much higher loading per km2 (Figure 9).
Although the relatively higher population in the Labe sub-basin could be a cause in higher
loading, when loading is normalized for population the Labe sub-basin has higher loading than

17
other sub-basins (Figure 11). City and village size in the basin might provide some mechanism
for higher loading, but the distribution of small villages and large cities is similar to other sub-
basins (Figure 5).
Source distribution between tributary sub-basins also varied. In the Labe sub-basin,
which had the highest nitrate loading, ~84% of the nitrate is from animal or human waste sources
and ~16% is from agriculture sources. The Vltava also had a high percentage from animal and
human waste, with ~75% from those sources and ~25% from agricultural sources. The
Berounka and the Ohře had much higher percentages from agricultural activities, with ~36% and
~48% derived from this source respectively (Table 6).
Nitrogen isotope compositions from individual sampling sites may give further insight
into contamination sources. Samples taken from Labe sub-basin sites 1035 and 1035B (Figure
6) are especially interesting. Sample 1035 is from the main river, and sample 1035B is from a
ditch that drains a small village and agricultural fields and discharges into the river. Discharge
from the ditch was ~ 0.1 m3/s, whereas the flow in the river was ~ 10 m
3/s. Sample 1035 had a
δ15
N composition of 6.84‰ and a nitrate concentration of 1.47 mg/l. The drainage ditch sample
(1035B) had almost 9 times the nitrate concentration (12.83 mg/l) and an isotope composition
(9.05‰) that is closer to the value assigned as indicative of animal or human waste.
CONCLUSIONS
Nitrate contamination in river systems is a worldwide issue. Investigation of nitrate
sources in the upper Elbe basin using nitrogen isotopes provides insights into nitrate loading
mechanisms. Results of this study include:
1. Nitrate loading in the upper Elbe basin is comparable to other river basins in Europe
when normalized by land area and population.

18
2. There is a strong relationship between nitrate loading per km2 and population density in
river basins in North America and Europe, suggesting a link between population and
nitrate pollution.
3. Overall, nitrate loading in the upper Elbe basin comes primarily from human waste
sources. Approximately 76% of the nitrate load in the basin has δ15
N compositions that
fall in this source range, with the remaining 24% likely representing loading from
agriculture and soil sources.
4. Most of the nitrates with δ15
N compositions >10‰ likely come from small wastewater
treatment plants and domestic septic systems.
5. Nitrate sources in tributary sub-basins in the Czech Republic vary significantly. In the
Labe sub-basin, 84% of the nitrate load comes from human waste sources, and 16% is
from agriculture or soil sources. The Vltava sub-basin also has high loading from human
waste sources, with 75%, compared to 25% coming from agriculture and soil sources. In
contrast, the Ohře and Berounka sub-basins have only 52% and 64% from human waste
sources, and 48% and 36% from agriculture and soil sources, respectively.
6. The Labe sub-basin contributes nearly half of the nitrate load of the upper Elbe basin.
Preliminary analysis does not provide a clear explanation as to why loading in this sub-
basin is so much higher than other sub-basins.

19
FIGURES
Figure 1. The Elbe River and its major tributaries in the Czech Republic.

20
Figure 2. Sub-basins of major tributaries to the Elbe in the Czech Republic (Labe, Ohře, Vltava,
and Berounka), along with cities with populations of greater than 20,000 people located in these
basins.

21
Figure 3. Median monthly flow rates for the upper Elbe basin and each tributary sub-basin.
Figure 4. Land use in the upper Elbe basin and in each tributary sub-basin. Pie charts for
tributary sub-basins are sized proportional to sub-basin size.
0
500
1000
1500
2000
2500
3000
Janu
ary
Mar
chM
ayJu
ly
Sep
tem
ber
Nov
embe
rMe
dia
n F
low
Ra
te (
10
9 m
3/s
)
Upper Elbe Basin
Berounka
Ohre
Vltava
Labe

22
Figure 5. Percent of population living in various sized cities and villages in the upper Elbe basin
and each tributary sub-basin. Sub-basin charts are proportional to the percentage of population
of the upper Elbe basin living in the sub-basin.
8%

23
Figure 6. Location of ČHMÚ sampling sites.

24
Figure 7. Sites where nitrogen isotope samples were collected labeled with sampling date and
measured δ15
N (‰).

25
0
5
10
15
20
25
30
35
40
Upper Elbe
Basin
Labe Ohře Vltava Berounka
Med
ian
An
nu
al
Nit
rate
Lo
ad
ing
(10
6 k
g)
Figure 8. Median annual nitrate loading for the upper Elbe basin and each tributary sub-basin.
0
200
400
600
800
1000
1200
Upper Elbe
Basin
Labe Ohře Vltava Upper Vltava Berounka
kg
/km
2
Figure 9. Median annual nitrate load by km
2 for the upper Elbe basin and each tributary sub-
basin. Upper Vltava removes the influence of Praha.

26
0.00%
10.00%
20.00%
30.00%
40.00%
50.00%
60.00%
March-May June-August September-
November
December-
February
Upper Elbe Basin
Labe
Ohře
Vltava
Berounka
Figure 10. Percentage of annual nitrate loading for upper Elbe basin and each tributary sub-basin
by quarter.
0
1
2
3
4
5
6
7
8
9
Upper Elbe
Basin
Labe Ohře Vltava Upper Vltava Berounka
an
nu
al
kg
/pers
on
Figure 11. Median annual nitrate load per capita for the upper Elbe basin and each tributary sub-
basin. Upper Vltava excludes contributions from Praha.

27
0
5
10
15
20
25
0 200000 400000 600000 800000 1000000 1200000 1400000
City Population
Per
cap
ita l
oad
ing
(kg
/pers
on
/year)
Figure 12. Relationship between city size and annual per capita loading for 7 cities in the Czech
Republic.
Figure 13. Sampled δ15
N value versus concentration, with source divisions and trendlines.

28
0
500000
1000000
1500000
2000000
2500000
3000000
3500000
Uppe
r Elbe
Elbe
Rhon
e
Volga
Rhin
e
Danu
be
Colu
mia
Mississ
ippi
Basin
Siz
e (
km
2)
Figure 14. Size of major European and North American river basins.
0
500
1000
1500
2000
2500
Upper Elbe Elbe Rhone Volga Rhine Danube Columia Mississippi
Nit
rog
en
Lo
ad
ing
(kg
/km
2)
Figure 15. Annual nitrogen loading in major European and North American river basins
normalized by area (km2).

29
0
2
4
6
8
10
12
Uppe
r Elbe
Elbe
Rhon
e
Volga
Rhin
e
Danu
be
Colu
mia
Mississ
ippi
An
nu
al
Per
Cap
ita L
oad
(kg
/pers
on
)
Figure 16. Annual per capita nitrogen loading for major European and North American river
basins.
Figure 17. Relationship between population density and annual nitrogen loading per km
2 for
major European and North American river basins.

30
0
50
100
150
200
250
300
Upper Elbe Elbe Rhone Volga Rhine Danube Columia Mississippi
Po
pu
lati
on
Den
sit
y (
peo
ple
/km
2)
Figure 18. Population density of major European and North American river basins.

31
Figure 19. Sampled sites contoured to assign tributaries to either agriculture/soil nitrate (< 9.50
‰) or animal/human nitrate (> 9.50‰). Sample sites used for contouring labeled with δ15
N (‰).

32
TABLES
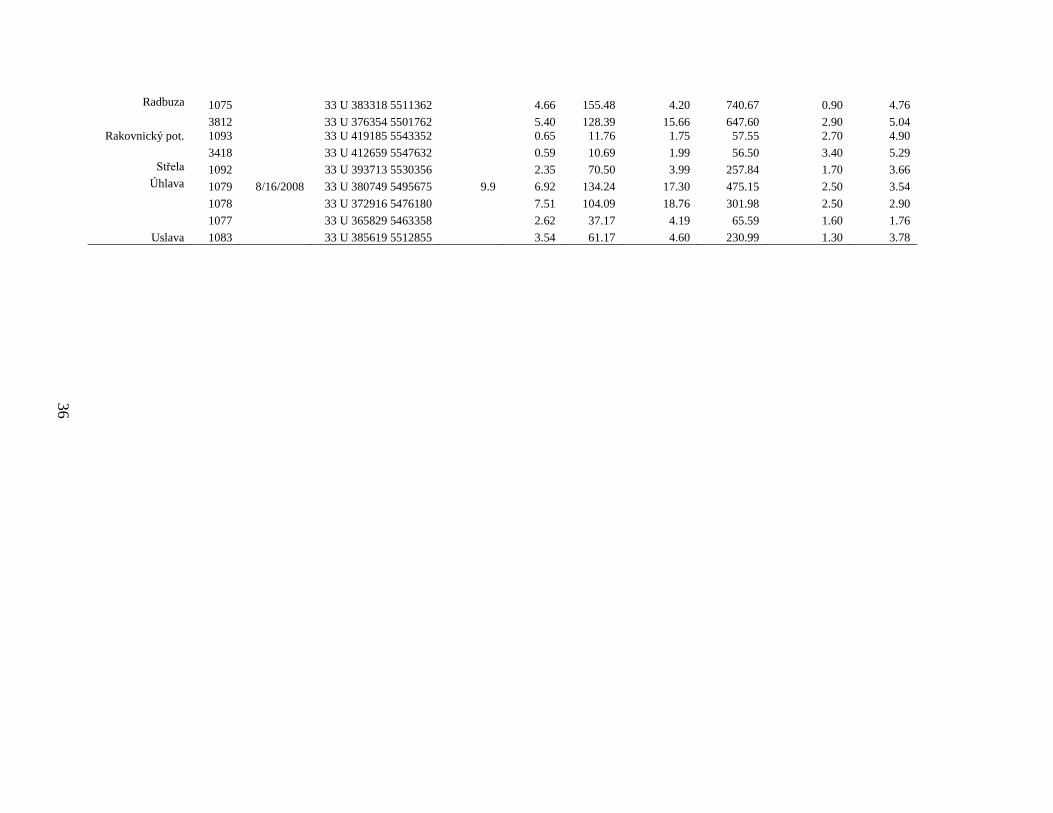
Table 1. Summary of loading, flow, concentration, and measured isotopes for each ČHMÚ sample site.
River
Tributary
ČHM
Ú Site
#
Collection
Date Location (UTM)
Measured
∂15N (‰)
August
flow rate
(109
L/month)
Total
annual
flow (109
L/year)
Calculated
August N-
NO3 loading
(103 kg)
Calculated
annual
loading
(103 kg)
Average
Measured
August N-
NO3
concentration
(mg/L)
Calculated
average
annual
concentrat
ion (mg/L
N-NO3)
Labe
Bystřice 3145 33 U 539070 5558437 1.49 29.71 6.24 172.99 4.20 5.82
Chrudimka 1028 8/19/2008 33 U 556007 5543163 12.7 6.66 129.13 26.64 609.04 4.00 4.72
3797 33 U 557053 5540619 6.63 128.49 27.83 616.03 4.20 4.79
Cidlina 4002 8/20/2008 33 U 517501 5552672 6.6 0.95 80.74 0.38 364.00 0.40 4.51
Dědina 3092 33 U 570017 5561137 2.85 55.50 7.98 257.79 2.80 4.65
Divoká Orlice 1024 33 U 581663 5552851 16.42 278.16 37.76 853.76 2.30 3.07
Doubrava 1029 33 U 525085 5540896 3.60 70.33 11.15 357.00 3.10 5.08
Jizera 4003 8/23/2009 33 U 483953 5566571 8.3 35.50 686.63 81.65 1970.49 2.30 2.87
1037 33 U 491197 5582743 34.71 671.31 76.36 1846.74 2.20 2.75
1036 33 U 494905 5592394 32.64 631.28 68.54 1685.51 2.10 2.67
1035 8/19/2009 33 U 504521 5602192 6.8 30.22 504.78 57.41 1130.73 1.90 2.24
1034 33 U 521242 5609190 18.67 311.92 28.01 616.64 1.50 1.98
1033 8/20/2008 33 U 532765 5609003 5.6 10.64 182.67 8.51 179.58 0.80 0.98
Kamenice 1039 8/19/2009 33 U 521215 5609254 1.4 6.91 95.85 10.36 167.91 1.50 1.75
Labe 201 33 U 446405 5636048 484.45 8277.83 1453.36 31717.22 3.00 3.83
3021 8/20/2008 33 U 444159 5625783 10.7 525.95 9430.26 1577.85 37414.29 3.00 3.97
104 33 U 444159 5625783 468.58 8416.66 1452.61 34067.74 3.10 4.04
1016 8/20/2009 33 U 438667 5597919 9.4 423.15 8021.16 1227.13 33312.30 2.90 4.15
1014 33 U 460579 5584038 419.09 7944.28 1299.18 33493.53 3.10 4.22
103 33 U 464180 5571148 188.16 2640.24 620.94 12099.41 3.30 4.54
1012 33 U 468765 5564884 150.89 2657.03 520.58 12014.68 3.45 4.52
102 33 U 489658 5558350 144.65 1930.12 549.68 9214.69 3.80 4.74
1010 8/20/2008 33 U 521891 5541685 13.5 101.25 1546.80 405.00 7693.85 4.00 4.97
1008 33 U 557712 5549529 72.84 1101.86 182.11 3740.57 2.50 3.39
1007 33 U 557023 5555151 62.78 1130.63 169.51 3884.60 2.70 3.44

33
1006 8/19/2008 33 U 559111 5562295 11.5 32.16 633.85 73.97 1971.32 2.30 3.11
1005 33 U 564814 5579772 18.01 410.63 41.43 1159.52 2.30 2.82
1003 33 U 555772 5588521 9.24 190.10 14.79 415.48 1.60 2.19
1002 33 U 552455 5594048 11.65 193.60 22.13 435.78 1.90 2.25
1001 8/20/2008 33 U 546401 5601679 8.4 4.81 85.36 5.77 136.21 1.20 1.60
Struha 101 33 U 544183 5542506 131.49 1452.26 8.42 92.84 0.06 0.06
Loučná 4001 8/24/2009 33 U 564908 5543091 10.3 9.07 94.36 63.51 782.55 7.00 8.29
Luţická Nisa 1130 33 U 489051 5633123 12.23 127.86 36.68 430.31 3.00 3.37
1128 33 U 508051 5619587 2.02 31.50 4.24 74.84 2.10 2.38
Metuje 1023 8/24/2009 33 U 565868 5577035 11.5 14.23 200.39 41.26 695.04 2.90 3.47
3045 33 U 582756 5585023 7.42 108.67 24.47 385.82 3.30 3.55
Mrlina 1032 8/20/2008 33 U 504786 5559094 4.0 0.52 28.18 0.62 156.69 1.20 5.56
Orlice 1026 33 U 568159 5562091 28.38 533.81 79.46 2000.90 2.80 3.75
Smědá 1131 8/19/2009 33 U 502263 5651528 6.1 7.19 88.25 17.26 239.16 2.40 2.71
Stěnava 3056 8/20/2008 33 U 599595 5600658 5.7 3.16 54.17 11.04 215.16 3.50 3.97
Tichá Orlice 1025 8/19/2008 33 U 576856 5552968 13.1 13.35 183.59 52.07 824.93 3.90 4.49
Úpa 1022 8/24/2009 33 U 566175 5578647 9.7 11.49 154.54 34.47 478.11 3.00 3.09
Vlkava 3167 33 U 496814 5561259 0.17 6.03 0.75 42.83 4.40 7.10
Výrovka 3159 33 U 500676 5556426 1.54 33.81 5.38 170.99 3.50 5.06
Ohře
Bílina 1123 8/2/2008 33 U 432053 5612008 9.2 12.57 222.34 54.67 1147.95 4.35 5.16
1122 33 U 421628 5606626 9.43 172.90 46.21 851.90 4.90 4.93
1119 33 U 402262 5598360 1.42 20.26 2.13 65.07 1.50 3.21
Bílý Halštrov 3493 33 U 303280 5571275 0.36 8.10 1.64 35.01 4.50 4.32
Blšanka 1116 33 U 400475 5574801 0.70 20.61 1.40 70.96 2.00 3.44
Bystřice 1114 8/16/2008 33 U 354467 5574128 8.0 1.92 35.55 2.68 55.01 1.40 1.55
Chodovský pot. 3468 33 U 345680 5566125 0.94 17.44 2.64 55.63 2.80 3.19
Chomutovka 1117 33 U 407657 5579339 0.92 19.63 2.90 61.42 3.15 3.13
Kamenice 1127 33 U 446301 5636133 4.52 62.89 8.13 115.21 1.80 1.83
Liboc 1115 33 U 394413 5576755 1.02 30.21 2.03 68.07 2.00 2.25
Mandava 3538 33 U 475497 5639411 0.57 16.57 2.45 69.83 4.30 4.21
Ohře 1109 9/16/2008 33 U 440156 5595922 13.9 46.49 1135.63 106.92 3070.01 2.30 2.70
3456 33 U 440194 5589780 46.49 1141.27 102.27 2973.02 2.20 2.61
1108 33 U 433971 5584363 44.21 1117.02 99.47 2903.69 2.25 2.60
1107 33 U 417715 5579549 43.17 1090.86 97.14 2748.14 2.25 2.52

34
4006 8/20/2009 33 U 414251 5579313 12.2 44.44 1069.25 102.22 2731.17 2.30 2.55
1105 33 U 399540 5577386 41.66 793.10 87.48 1926.08 2.10 2.43
1104 8/20/2008 33 U 389916 5580655 9.6 38.56 724.45 77.13 1649.63 2.00 2.28
3454 33 U 378541 5580636 39.52 840.64 67.19 2034.30 1.70 2.42
1103 33 U 377380 5581540 39.26 815.62 66.75 1913.88 1.70 2.35
3453 8/17/2009 33 U 357127 5571223 10.4 39.60 736.32 79.20 1820.65 2.00 2.47
1212 33 U 329679 5559213 19.28 379.88 32.77 1083.80 1.70 2.85
1098 33 U 313855 5553684 6.47 152.90 9.70 547.49 1.50 3.58
1097 8/16/2008 33 U 305251 5551927 9.5 9.50 152.01 14.24 543.34 1.50 3.57
Ploučnice 4007 33 U 450898 5621264 13.72 242.71 38.42 687.66 2.80 2.83
Rolava 1112 8/17/2009 33 U 346471 5566831 5.7 3.10 56.98 4.34 64.99 1.40 1.14
Svatava 1111 8/17/2009 33 U 331322 5561654 2.2 3.63 100.63 4.35 131.39 1.20 1.31
Teplá 1113 8/16/2008 33 U 348156 5566784 -3.4 2.28 62.51 1.59 83.36 0.70 1.33
Teplický pot. 1124 8/20/2008 33 U 421140 5607483 8.2 No Data No Data No Data No Data 4.25 No Data
Vltava
Bakovský potok 3449 8/20/2008 33 U 451840 5573356 14.0 0.87 22.25 2.25 93.36 2.60 4.20
Blanice (Sázava) 1066 8/19/2008 33 U 495102 5515151 8.5 1.71 51.20 5.22 384.36 3.05 7.51
Blanice (Otava) 1058 8/18/2009 33 U 437126 5453681 4.42 94.28 6.49 235.72 1.47 2.50
Kamenice 3267 33 U 504642 5448428 1.18 25.57 2.51 123.58 2.13 4.83
Lomnice 1059 33 U 435968 5474384 0.78 32.14 0.48 105.01 0.62 3.27
Luţnice 4004 8/18/2008 33 U 461420 5460024 5.6 42.86 602.21 42.86 1486.40 1.00 2.47
3258 33 U 478135 5458764 23.71 456.96 21.34 1008.56 0.90 2.21
1049 8/18/2009 33 U 478051 5447642 0.9 6.01 131.80 2.40 144.47 0.40 1.10
3252 33 U 491747 5416003 5.48 107.98 4.93 233.20 0.90 2.16
3251 8/18/2008 33 U 495423 5406097 11.2 5.00 98.51 6.50 226.39 1.30 2.30
Malše 1048 33 U 462744 5420297 9.49 143.43 11.72 332.71 1.24 2.32
Neţárka 1051 33 U 478373 5448120 16.18 242.80 14.56 622.14 0.90 2.56
Otava 4005 8/17/2008 33 U 438352 5465900 10.8 31.82 600.37 35.00 1251.35 1.10 2.08
3288 8/18/2009 33 U 414919 5458216 5.0 24.43 354.57 24.43 542.41 1.00 1.53
1054 33 U 409453 5461273 23.75 344.64 23.75 543.55 1.00 1.58
3286 33 U 402817 5461836 23.40 339.67 21.06 493.27 0.90 1.45
1053 33 U 397538 5458107 23.15 317.58 18.52 400.59 0.80 1.26
1052 8/17/2008 33 U 392344 5454045 4.0 18.05 247.63 14.44 226.80 0.80 0.92
Sázava 1064 8/21/2008 33 U 458906 5525290 14.5 32.96 458.49 148.30 2931.11 4.50 6.39
3324 33 U 476600 5520995 26.31 451.12 80.25 2956.25 3.05 6.55
1063 33 U 492629 5524540 27.86 404.52 97.50 2640.65 3.50 6.53

35
1062 33 U 507323 5509814 20.35 267.69 69.17 1799.70 3.40 6.72
3319 33 U 519999 5504857 22.52 241.26 103.59 1627.62 4.60 6.75
3316 8/27/2009 33 U 541879 5494777 10.8 8.71 86.94 34.40 553.37 3.95 6.37
3311 8/19/2008 33 U 567355 5490217 2.2 0.84 9.13 0.29 16.69 0.35 1.83
Šlapanka 3329 33 U 541879 5494777 4.00 36.69 5.20 220.81 1.30 6.02
Vltava 105 8/20/2008 33 U 459537 5575427 11.5 206.04 4435.46 515.10 16305.32 2.50 3.68
1046 33 U 454565 5561418 177.87 4130.78 444.66 15069.61 2.50 3.65
1045 8/21/2008 33 U 457894 5547843 9.1 176.18 4076.02 361.16 14437.99 2.05 3.54
1044 8/21/2009 33 U 456186 5532262 13.0 133.20 2845.91 313.01 9581.45 2.35 3.37
3213 8/18/2009 33 U 440892 5495181 11.1 102.85 2222.36 185.14 5620.76 1.80 2.53
3793 8/17/2008 33 U 441861 5476515 -3.5 103.13 1511.45 87.66 3139.25 0.85 2.08
1042 33 U 459453 5433580 44.63 743.04 44.63 1131.27 1.00 1.52
1211 8/18/2008 33 U 460934 5425116 8.0 41.02 682.94 41.02 894.33 1.00 1.31
1041 33 U 458211 5418464 29.45 457.33 26.51 467.84 0.90 1.02
3209 8/16/2008 33 U 420812 5411463 5.2 11.28 200.29 9.03 140.01 0.80 0.70
Volyňka 1057 33 U 418810 5449996 4.12 59.60 9.07 184.42 2.20 3.09
Zákolanský pot. 1096 8/20/2008 33 U 450734 5565755 14.4 1.07 27.75 5.31 177.45 4.95 6.39
Ţelivka 1065 8/19/2008 33 U 503754 5508197 9.3 2.88 62.12 17.70 400.60 6.15 6.45
Ţirovnice 3270 8/18/2008 33 U 504963 5448505 9.9 0.88 19.04 1.84 99.82 2.10 5.24
Berounka
Berounka 3814 8/21/2009 33 U 448051 5530609 3.9 37.60 932.81 39.48 3594.14 1.05 3.85
1089 33 U 437869 5531817 40.38 911.89 52.49 3491.38 1.30 3.83
1088 33 U 431672 5537611 33.67 831.38 43.77 3148.29 1.30 3.79
1087 33 U 418724 5542474 29.38 764.29 47.00 2850.66 1.60 3.73
1086 33 U 412072 5536044 29.19 759.53 46.71 2894.41 1.60 3.81
1085 8/16/2008 33 U 395634 5530662 11.0 27.97 727.79 50.35 2780.30 1.80 3.82
3398 33 U 394166 5519822 22.12 588.15 44.24 2271.95 2.00 3.86
1084 33 U 387820 5514594 20.20 536.71 42.41 2051.00 2.10 3.82
3813 8/16/2008 33 U 386173 5514399 12.1 17.01 447.21 34.03 1670.27 2.00 3.73
Klabava 1091 33 U 392322 5517562 4.94 41.14 4.94 123.19 1.00 2.99
Litavka 1094 33 U 433382 5535108 2.80 56.47 6.72 242.17 2.40 4.29
Mţe 1072 8/16/2008 33 U 383252 5512193 10.0 8.29 192.04 16.58 565.12 2.00 2.94
1071 33 U 380156 5513188 8.23 190.55 14.81 550.68 1.80 2.89
1069 33 U 351586 5512573 3.94 140.30 6.31 437.85 1.60 3.12
1068 33 U 332119 5518307 2.39 45.44 3.59 95.19 1.50 2.09
1067 8/18/2008 33 U 326582 5519744 2.0 1.68 31.95 1.51 45.09 0.90 1.41
36
Radbuza 1075 33 U 383318 5511362 4.66 155.48 4.20 740.67 0.90 4.76
3812 33 U 376354 5501762 5.40 128.39 15.66 647.60 2.90 5.04
Rakovnický pot. 1093 33 U 419185 5543352 0.65 11.76 1.75 57.55 2.70 4.90
3418 33 U 412659 5547632 0.59 10.69 1.99 56.50 3.40 5.29
Střela 1092 33 U 393713 5530356 2.35 70.50 3.99 257.84 1.70 3.66
Úhlava 1079 8/16/2008 33 U 380749 5495675 9.9 6.92 134.24 17.30 475.15 2.50 3.54
1078 33 U 372916 5476180 7.51 104.09 18.76 301.98 2.50 2.90
1077 33 U 365829 5463358 2.62 37.17 4.19 65.59 1.60 1.76
Uslava 1083 33 U 385619 5512855 3.54 61.17 4.60 230.99 1.30 3.78

37
Table 2. Chemistry data for sampled ČHMÚ sites.
(mg/L)
River Tributary
ČHMÚ site
#
Collection
Date ∂15
N ∂18
O ∂D Ca2+
Mg2+
K+ Na
+ HCO3
- Cl
- NO3
- PO4
3- SO4
2-
Labe
Chrudimka 1028 8/19/2008 12.7 -7.85 -53.90 57.76 5.805 10.73 12.92 267.7 23.362 3.368 0.107 53.615
Cidlina 4002 8/20/2008 6.6 -6.53 -49.10 84.91 15.47 8.365 26.64 372.6 38.958 2.076 0.375 75.158
Jizera 4003 8/23/2009 8.3 -8.86 -60.10 46.49 4.467 2.002 11.75 217.3 14.934 1.662 0.041 26.828
1035 8/19/2009 6.8 -9.43 -62.70 11.83 2.49 0.00 6.05 53.30 10.42 1.47 0.04 18.85
1035B 8/19/2009 9.1 -8.85 -63.85 73.66 6.10 9.67 105.10 314.30 200.85 12.83 1.70 81.16
1033 8/20/2008 5.6 -9.67 -64.50 10.99 1.87 6.849 5.73 72.6 6.825 0.813 11.593
Kamenice 1039 8/19/2009 1.4 -9.20 -61.90 4.21 1.43 0.00 5.04 26.20 7.44 1.25 0.02 15.21
Labe 3021 8/20/2008 10.7 -8.50 -61.20 50.91 9.445 7.674 28.86 226.2 42.257 3.158 0.062 70.571
1016 8/20/2009 9.4 -8.34 -59.10 10.62 5.75 3.94 13.65 33.20 17.83 2.24 0.08 42.34
1010 8/20/2008 13.5 -8.41 -58.20 68.47 6.79 9.145 18.86 228.1 22.27 3.726 0.098 60.167
1006 8/19/2008 11.5 -9.27 -63.20 43.77 7.84 8.618 14.81 257 14.904 2.106 0.112 35.241
1001 8/20/2008 8.4 -9.42 -63.00 14.6 2.366 6.357 9.511 110.4 4.188 0.662 9.724
Loučná 4001 8/24/2009 10.3 -8.90 -64.50 115.10 5.66 3.48 9.09 222.60 24.71 8.51 0.11 73.67
Metuje 1023 8/24/2009 11.5 -9.65 -62.00 8.92 5.62 1.30 8.62 33.40 11.98 1.85 0.12 33.29
Mrlina 1032 8/20/2008 4.0 -6.09 -49.20 97.59 15.54 14.23 28.1 414.3 43.653 1.652 0.201 116.432
Smědá 1131 8/19/2009 6.1 -8.45 -58.20 8.48 3.26 1.42 6.85 28.90 6.98 1.76 0.02 36.95
Stěnava 3056 8/20/2008 5.7 -9.40 -66.70 48.05 13.78 9.776 28.6 367.7 15.692 3.02 0.188 49.167
Tichá Orlice 1025 8/19/2008 13.1 -8.67 -59.10 61.88 3.821 8.991 11.14 304.6 13.085 3.197 0.051 36.111
Úpa 1022 8/24/2009 9.7 -8.76 -66.50 31.15 10.26 2.29 13.29 107.70 20.28 2.29 0.10 51.03
Ohře
Bílina 1123 8/2/2008 9.2 -7.28 -53.70 103.9 40.59 14.67 111.8 232.7 76.907 4.684 0.264 275.955
Bystřice 1114 8/16/2008 8.0 -9.41 -64.70 28.89 8.633 0.496 18.39 159.4 17.121 1.182 0.103 42.261
Ohře 1109 9/16/2008 13.9 -8.37 -58.00 36.43 12.67 3.266 29.37 180.7 23.212 2.233 0.05 91.832
4006 8/20/2009 12.2 -8.62 -61.00 22.78 9.26 3.97 27.71 60.80 20.38 1.28 85.73
1104 8/20/2008 9.6 -8.89 -60.80 28.75 9.561 9.943 29.15 147.7 19.383 1.859 85.574
3453 8/17/2009 10.4 -8.16 -59.70 24.53 11.39 4.63 45.92 81.30 29.44 1.43 0.02 117.50
1097 8/16/2008 9.5 -8.02 -55.00 31.66 5.628 3.427 20.11 128.3 29.88 2.954 29.168
A 8/17/2009 12.0 -8.03 -57.64 22.40 5.12 2.83 15.69 43.60 32.15 2.85 0.07 25.95
Rolava 1112 8/17/2009 5.7 -9.30 -62.90 7.83 1.86 0.36 7.20 16.60 8.29 0.58 0.02 23.17

38
Svatava 1111 8/17/2009 2.2 -9.01 -62.10 30.84 18.23 1.34 36.99 52.30 13.87 1.07 174.49
Teplá 1113 8/16/2008 -3.4 -7.98 -56.60 23.99 11.02 4.876 68.02 320.3 34.595 0.67 84.241
Teplický pot. 1124 8/20/2008 8.2 -8.61 -60.70 77.7 18.33 12.03 65.7 185 62.465 6.097 0.342 142.641
Vltava
Bakovský potok 3449 8/20/2008 14.0 -6.26 -49.80 143.1 43.87 24.01 67.45 365.1 0 2.671 0.551 279.278
Blanice 1066 8/19/2008 8.5 -7.17 -56.70 35.84 8.559 2.744 22.14 244 30.045 1.448 0.025 34.781
1058 8/18/2009 11.2 -8.2 -60.00 11.30 4.89 1.63 7.13 51.50 12.84 1.33 0.03 25.90
Luţnice 4004 8/18/2008 5.6 -6.89 -53.90 21.84 5.823 6.549 21.8 172.8 27.489 1.113 0.038 22.16
1049 8/18/2009 0.9 -5.51 -44.40 8.61 4.26 4.17 8.56 32.80 12.69 1.72 0.15 17.24
3251 8/18/2008 11.2 -8.63 -61.90 19.3 3.33 12.37 17.19 98.6 17.674 1.338 18.202
Otava 4005 8/17/2008 10.8 -7.75 -62.00 15.9 4.437 7.224 9.14 113.3 19.998 1.968 0.299 36.247
3288 8/18/2009 5.0 -9.39 -65.90 10.86 2.84 0.79 3.37 38.90 5.76 1.26 0.02 12.73
1052 8/17/2008 4.0 -8.99 -60.90 5.998 1.392 7.077 3.411 39.5 3.156 0.562 21.846
Sázava 1064 8/21/2008 14.5 -7.89 -58.60 38.91 8.175 3.084 25.93 201.7 33.09 2.681 0.142 42.223
3316 8/27/2009 10.8 -7.76 -56.90 21.49 5.53 4.56 13.11 49.70 19.31 5.31 0.18 36.00
3311 8/19/2008 2.2 -6.88 -52.40 16.49 3.811 1.389 9.142 97.6 9.531 0.819 19.424
Vltava 105 8/20/2008 11.5 -8.54 -60.60 35.16 7.36 12.76 100.5 157.2 24.936 2.257 41.64
1045 8/21/2008 9.1 -9.12 -63.90 24.7 6.28 9.14 14.07 149.7 10.228 1.546 0 82.593
1044 8/21/2009 13.0 -8.35 -59.30 7.65 4.95 2.36 7.84 32.60 10.43 1.79 0.00 23.98
3213 8/18/2009 11.1 -8.08 -58.30 16.53 4.40 3.44 6.61 49.30 9.59 1.46 0.06 22.94
3793 8/17/2008 -3.5 -8.71 -61.50 15.71 4.509 0.64 11.44 123.3 13.064 1.033 0.021 20.772
1211 8/18/2008 8.0 -8.83 -62.60 15.38 4.007 4.986 8.178 99.7 8.358 1.487 17.672
3209 8/16/2008 5.2 -9.19 -61.20 4.513 1.407 9.02 3.51 10.8 4.424 0.338 0.024 6.107
Zákolanský pot. 1096 8/20/2008 14.4 -7.82 -55.60 126.1 20.78 17.1 52.76 282.7 0 5.068 0.402 120.876
Ţelivka 1065 8/19/2008 9.3 -6.46 -66.30 30.62 7.873 0 14.68 134.1 17.61 4.652 34.75
Ţirovnice 3270 8/18/2008 9.9 -7.03 -54.30 27.87 7.099 5.164 22.09 180.2 26.391 2.724 0.397 22.886
Berounka
Berounka 3814 8/21/2009 3.9 -7.76 -56.90 26.47 8.07 4.78 16.77 97.30 21.77 1.28 0.10 46.18
1085 8/16/2008 11.0 -8.46 -57.90 26.87 7.266 0 19.72 185.2 23.004 2.088 0.322 38.36
3813 8/16/2008 12.1 -7.88 -57.20 29.05 8.926 2.68 19.25 205.6 21.126 2.765 0.346 35.42
Mţe 1072 8/16/2008 10.0 -8.67 -58.30 28.07 7.254 0 16.33 179.9 17.837 2.265 0.298 34.988
1067 8/18/2008 2.0 -8.63 -61.20 7.725 2.87 0 6.23 63.7 5.371 0.847 34.911
Úhlava 1079 8/16/2008 9.9 -8.90 -61.80 25.48 5.726 0 14.8 143.4 12.041 1.52 21.069
End Member
Naural soil
nitrogen Adrspach -1.2 -9.61 -66.28 28.96 0.98 0.47 0.00 42.40 2.26 1.51 38.59
39
Strasice
Brdy -3.1 -8.92 -64.00 4.79 1.66 0.00 0.14 18.90 2.12 0.40 8.54
Klic 7.1 -7.20 -57.20 43.50 12.51 3.02 12.20 150.40 12.93 0.99 0.33 78.50
Wastewater
Treatment Plant Police 21.0 -9.54 -67.72 77.34 5.94 11.85 58.36 228.50 69.61 3.76 2.15 77.05
Police B -9.83 -69.30 57.50 4.22 1.03 1.00 142.10 6.78 3.93 0.08 38.66
Beroun
Waste -7.03 -53.33 47.74 16.33 85.55 144.20 272.40 116.81 1.12 0.40 242.34

40
Table 3. Summary of nitrate loading in the upper
Elbe basin, major tributary sub-basins, and smaller
tributaries and cities with loading >106 kg/year.
River Basin
Tributary or City
Median Annual
Nitrate loading
(106 kg)
Upper Elbe Basin 37.4
Labe 18
Orlice 2
Jizera 2
Ohře 3.6
Vltava 12.7
Sázava 2.9
Otava 1.3
Luţnice 1.5
Praha 1.9
Berounka 3.1
Table 4. Selected livestock numbers by year.
Year
Cattle
Pigs
Sheep and
rams
Poultry
1990 3.5x10⁶ 4.8 x10
6 .4 x10
6 32.0 x10
6
1995 2.0 x10⁶ 3.9 x10
6 .2 x10
6 26.7 x10
6
2000 1.5 x10⁶ 3.7 x10
6 .08 x10
6 30.8 x10
6
2005 1.4 x10⁶ 2.9 x10
6 .1 x10
6 25.3 x10
6
2010 1.3 x10⁶ 1.9 x10
6 .2 x10
6 24.8 x10
6

41
Table 5. Selected Wastewater Treatment Plant Data
Region Total
Wastewater
Treatment
Plants
Wastewater
Treatment
plants
removing
Nitrogen
Total
Wastewater
Treatment
Plant Capacity
Upper Elbe Basin 1597 635 2,556,187
Hl. město Praha 25 20 593,702
Středočeský 415 223 328,881
Jihočeský 268 89 266,805
Plzeňský 174 57 181,425
Karlovarský 91 29 117,639
Ústecký 179 34 261,738
Liberecký 79 17 171,825
Královéhradecký 124 50 232,308
Pardubický 94 42 182,822
Vysočina 148 74 219,042
Table 6. Percent loading by source
River Basin
Percent
Agriculture/Soil Percent Animal/Human Waste
Upper Elbe 24% 76%
Labe 16% 84%
Ohře 48% 52%
Vltava 25% 75%
Berounka 36% 64%
42
REFERENCES
Aravena, R., Evans, M.L., and Cherry, J.A., 1993, Stable Isotopes of Oxygen and Nitrogen in
Source Identification of Nitrate from Septic Systems: Ground Water, v. 31, no. 2, p. 180-
186.
Barnes, C.J., Jacobson, G., and Smith, G.D., 1992, The origin of high-nitrate ground waters in
the Australian arid zone: Journal of Hydrology, v. 137, no. 1-4, p. 181-197.
Benes, V., Pĕkný, V., Skorepa, J., and Vrba, J., 1989, Impact of diffuse nitrate pollution sources
on groundwater quality--some examples from Czechoslovakia.: Environmental Health
Perspectives, v. 83, p. 5-24.
Bernhard, C., Carbiener, R., Cloots, A.R., Froehlicher, R., Schenck, C., and Zilliox, L., 1992,
Nitrate pollution of groundwater in the alsatian plain (France)—A multidisciplinary study
of an agricultural area: The Central Ried of the ill river: Environmental Geology, v. 20,
no. 2, p. 125-137.
Blue Report, Report on Water Management in the Czech Republic, 2008, Ministry of Agriculture
of the Czech Republic: http://eagri.cz/public/eagri/en/water/publications/blue-report/ .
Data retrieved August 2009.
Bremner, J.M., and Tabatabai, M.A., 1973, Nitrogen-15 Enrichment of Soils and Soil-Derived
Nitrate: Journal of Environmental Quality, v. 2, no. 3, p. 363-365.
Brenner, D.L., Amundson, R., Baisden, W.T., Kendall, C., and Harden, J., 2001, Soil N and 15N
variation with time in a California annual grassland ecosystem: Geochimica et
Cosmochimica Acta, v. 65, no. 22, p. 4171-4186.
Broadbent, F.E., Rauschkolb, R.S., Lewis, K.A., and Chang, G.Y., 1980, Spatial Variability of
Nitrogen-15 and Total Nitrogen in Some Virgin and Cultivated Soils: Soil Science
Society of America Journal, v. 44, no. 3, p. 524-527.
Buzek, F., Černý, J., and Pačes, T., 1998, The Behavior of Nitrogen Isotopes in Acidified Forest
Soils in the Czech Republic: Water, Air, & Soil Pollution, v. 105, no. 1, p. 155-164.
Buzek, F., Kadlecova, R., and Knezek, M., 2006, Model reconstruction of nitrate pollution of
riverbank filtration using 15N and 18O data, Karany, Czech Republic: Applied
Geochemistry, v. 21, no. 4, p. 656-674.
Carey, M.A., and Lloyd, J.W., 1985, Modelling non-point sources of nitrate pollution of
groundwater in the Great Ouse Chalk, U.K.: Journal of Hydrology, v. 78, no. 1-2, p. 83-
106.

43
Carpenter, S.R., Caraco, N.F., Correll, D.L., Howarth, R.W., Sharpley, A.N., and Smith, V.H.,
1998, Nonpoint Pollution of Surface Waters with Phosphorus and Nitrogen: Ecological
Applications, v. 8, no. 3, p. 559-568.
Cheng, H.H., Bremner, J.M., and Edwards, A.P., 1964, Variations of Nitrogen-15 Abundance in
Soils: Science, v. 146, no. 3651, p. 1574-1575.
Chesterikoff, A., Garban, B., Billen, G., and Poulin, M., 1992, Inorganic Nitrogen Dynamics in
the River Seine Downstream from Paris (France): Biogeochemistry, v. 17, no. 3, p. 147-
164.
Choi, W., Lee, S., and Ro, H., 2003, Evaluation of contamination sources of groundwater NO3−
using nitrogen isotope data: A review: Geosciences Journal, v. 7, no. 1, p. 81-87.
Cook, F., Wellman, R., and Krouse, H., 1970, Nitrogen isotope fractionation in the nitrogen
cycle: International Symposim on Hydrogeochemistry and Biochemistry, Tokyo.
Czech Statistical Office (CZSO), 2010, Statistical Yearbook of the Czech Republic:
http://www.czso.cz/csu/2009edicniplan.nsf/engp/0001-09. Data retrieved August 2010.
Dähnke, K., Bahlmann, E., and Emeis, K., 2008, A nitrate sink in estuaries? An assessment by
means of stable nitrate isotopes in the Elbe estuary: Limnology and Oceanography, v. 53,
no. 4, p. 1504–1511.
Delwiche, C.C., 1970, The nitrogen cycle: Scientific American, v. 223, no. 3, p. 137-146.
Deutsch, B., Voss, M., and Fischer, H., 2009, Nitrogen transformation processes in the Elbe
River: Distinguishing between assimilation and denitrification by means of stable isotope
ratios in nitrate: Aquatic Sciences, v. 71, no. 2, p. 228-237.
de Wit, M., Behrendt, H., Bendoricchio, G., Bleuten, W., and van Gaans, P., 2002, The
contribution of agriculture to nutrient pollution in three European rivers, with reference to
the European Nitrates Directive: European Water Management Online, p. 1-19.
Dolezal, F., Kulhavy, Z., Kvitek, y., Peterkova, J., Soukup, M., and Tippl, M., 2000, Influence of
drained lands on water quantity and quality in foothill agricultural basins of Bohemia:
Conference on Monitoring and Modelling Catchment Water Quantity and Quality, Ghent,
Belgium.
Dvorak, V., 1996, Climate Change Hydrology and Water Resources Impacts and Adaptation for
Selected River Basins in the Czech Republic: International Journal of Water Resources
Development, v. 12, no. 2, p. 181.

44
Environmental Protection Agency (EPA), 2010, Nitrogen and Phosphorus Loads in Large
Rivers:
http://cfpub.epa.gov/eroe/index.cfm?fuseaction=detail.viewInd&lv=list.listByAlpha&r=2
16594&subtop=315. Data accessed November 2010.
European Union, 2010, Implementation of nitrates Directive:
http://ec.europa.eu/environment/water/water-nitrates/index_en.html . Data retrieved June
2010.
Fan, A.M., and Steinberg, V.E., 1996, Health Implications of Nitrate and Nitrite in Drinking
Water: An Update on Methemoglobinemia Occurrence and Reproductive and
Developmental Toxicity: Regulatory Toxicology and Pharmacology, v. 23, no. 1, p. 35-
43.
Feigin, A., Kohl, D.H., Shearer, G., and Commoner, B., 1974, Variation in the Natural Nitrogen-
15 Abundance in Nitrate Mineralized During Incubation of Several Illinois Soils: Soil
Science Society of America Journal, v. 38, no. 1, p. 90-95.
Feth, J.H., 1966, Nitrogen compounds in natural water: a review: Water Resources Research, v.
2, no. 1, p. 41-57.
Flipse, W.J., and Bonner, F.T., 1985, Nitrogen-Isotope Ratios of Nitrate in Ground Water Under
Fertilized Fields, Long Island, New York: Ground Water, v. 23, no. 1, p. 59-67.
Focht, D.D., 1973, Isotope Fractionation of 15N and 14N in Microbiological Nitrogen
Transformations: a Theoretical Model: Journal of Environmental Quality, v. 2, no. 2, p.
247-252.
Freyer, H.D., and Aly, A.I., 1975, Nitrogen-15 studies on identifying fertilizer excess in
environmental systems: Symposium on isotope ratios as pollutant source and behavior
indicators, IAEA, Vienna, p. 21-33.
Freyer, H.D., and Aly, A.I.M., 1974, Nitrogen-15 Variations in Fertilizer Nitrogen: Journal of
Environmental Quality, v. 3, no. 4, p. 405-406.
Fukada, T., Hiscock, K.M., Dennis, P.F., and Grischek, T., 2003, A dual isotope approach to
identify denitrification in groundwater at a river-bank infiltration site: Water Research, v.
37, no. 13, p. 3070-3078.
Gambrell, R.P., Gilliam, J.W., and Weed, S.B., 1975, Denitrification in Subsoils of the North
Carolina Coastal Plain as Affected by Soil Drainage: Journal of Environmental Quality,
v. 4, no. 3, p. 311-316.
Goolsby, D.A., Battaglin, W.A., and Hooper, R.P., 1997, Sources and Transport of Nitrogen in
the Mississippi River Basin: American Farm Bureau Federation Workshop, St. Louis,
Missouri.

45
Gormly, J.R., and Spalding, R.F., 1979, Sources and Concentrations of Nitrate-Nitrogen in
Ground Water of the Central Platte Region, Nebraska: Ground Water, v. 17, no. 3, p.
291-301.
Hauck, R.D., Bartholomew, W.V., Bremner, J.M., Broadbent, F.E., Cheng, H.H., Edwards, A.P.,
Keeney, D.R., Legg, J.O., Olsen, S.R., Porter, L.K., Kohl, D.H., Shearer, G.B., and
Commoner, B., 1972, Use of Variations in Natural Nitrogen Isotope Abundance for
Environmental Studies: A Questionable Approach: Science, v. 177, no. 4047, p. 453-456.
Heaton, T., 1984, Sources of the nitrate in phreatic groundwater in the western Kalahari: Journal
of Hydrology, v. 67, no. 1-4, p. 249-259.
Heaton, T., 1985, Isotopic and chemical aspects of nitrate in the groundwater of the Sprinbok
Flats: Water S. Africa, v. 11, p. 199-208.
Heaton, T., 1986, Isotopic studies of nitrogen pollution in the hydrosphere and atmosphere: A
review: Chemical Geology, v. 59, p. 87-102.
Hejzlar, J., V. Vyhnálek, J. Kopáček, L. Procházková and J. Komárková, 2000: Eutrophication
trends in the Vltava catchment area, Czech Republic. – In: 12th Regional Central
European Conference IUAPPA and 4th International Conference on Environmental
Impact Assessment, September 11–14, 2000. pp. 223–227. CA-IUAPPA, Czech
Republic.
Hickel, W., Mangelsdorf, P., and Berg, J., 1993, The human impact in the German Bight:
Eutrophication during three decades (1962–1991): Helgoland Marine Research, v. 47, no.
3, p. 243-263.
Hoering, T., 1955, Variations of Nitrogen-15 Abundance in Naturally Occurring Substances:
Science, v. 122, no. 3182, p. 1233-1234.
Jacks, G., and Sharma, V., 1983, Nitrogen circulation and nitrate in groundwater in an
agricultural catchment in Southern India: Environmental Geology, v. 5, no. 2, p. 61-64.
Johannsen, A., Dähnke, K., and Emeis, K., 2008, Isotopic composition of nitrate in five German
rivers discharging into the North Sea: Organic Geochemistry, v. 39, no. 12, p. 1678-1689.
Judová, P., and Janský, B., 2005, Water quality in rural areas of the Czech Republic: Key study
Slapanka River catchment: Limnologica - Ecology and Management of Inland Waters, v.
35, no. 3, p. 160-168.
Junk, G., and Svec, H.J., 1958, The absolute abundance of the nitrogen isotopes in the
atmosphere and compressed gas from various sources: Geochimica et Cosmochimica
Acta, v. 14, no. 3, p. 234-243.
46
Karr, J.D., Showers, W.J., Gilliam, J., and Andres, A., 2001, Tracing Nitrate Transport and
Environmental Impact from Intensive Swine Farming using Delta Nitrogen-15: Journal of
Environmental Quality, v. 30, no. 4, p. 1163-1175.
Kohl, D.H., Shearer, G.B., and Commoner, B., 1971, Fertilizer Nitrogen: Contribution to Nitrate
in Surface Water in a Corn Belt Watershed: Science, v. 174, no. 4016, p. 1331-1334.
Kopácek, J., Veselỳ, J., and Stuchlík, E., 2001, Sulphur and nitrogen fluxes and budgets in the
Bohemian Forest and Tatra Mountains during the Industrial Revolution (1850-2000):
Hydrology and Earth System Sciences, v. 5, no. 3, p. 391–406.
Kreitler, C.W., 1979, Nitrogen-isotope ratio studies of soils and groundwater nitrate from
alluvial fan aquifers in Texas: Journal of Hydrology, v. 42, no. 1-2, p. 147-170.
Kreitler, C.W., and Browning, L.A., 1983, Nitrogen-isotope analysis of groundwater nitrate in
carbonate aquifers: Natural sources versus human pollution: Journal of Hydrology, v. 61,
no. 1-3, p. 285-301.
Kreitler, C.W., and Jones, D.C., 1975, Natural Soil Nitrate: The Cause of the Nitrate
Contamination of Ground Water in Runnels County, Texas: Ground Water, v. 13, no. 1,
p. 53-62.
Kreitler, C.W., Ragone, S.E., and Katz, B.G., 1978, N15
/N14
Ratios of Ground-Water Nitrate,
Long Island, New York: Ground Water, v. 16, no. 6, p. 404-409.
Langass, S., Aliakseyeva, N., Gooch, G., Lopman, E., Nilsson, S., and Timmerman, J., 2002,
Working Paper-Environmental information in transboundary river basin policy-making
and management: Selected European case studies.
Lancelot, C., Billen, G., Sournia, A., WEisse, T., Coljin, F., Veldhuis, M., Danvie, A., and
Wassman, P., 1987, Phaeocystis Blooms and Nutrient Enrichment in the Continental
Coastal Zones of the North Sea: Ambio, v. 16, no. 1, p. 38-46.
Lindau, C.W., Delaune, R.D., Patrick, W.H., and Lambremont, E.N., 1989, Assessment of stable
nitrogen isotopes in fingerprinting surface water inorganic nitrogen sources: Water, Air,
& Soil Pollution, v. 48, no. 3, p. 489-496.
Meints, V.W., Boone, L.V., and Kurtz, L.T., 1975, Natural 15N Abundance in Soil, Leaves, and
Grain as Influenced by Long Term Additions of Fertilizer N at Several Rates: Journal of
Environmental Quality, v. 4, no. 4, p. 486-490.
Moore, K.B., Ekwurzel, B., Esser, B.K., Hudson, G.B., and Moran, J.E., 2006, Sources of
groundwater nitrate revealed using residence time and isotope methods: Applied
Geochemistry, v. 21, no. 6, p. 1016-1029.

47
Pieterse, N.M., Bleuten, W., and Jørgensen, S.E., 2003, Contribution of point sources and diffuse
sources to nitrogen and phosphorus loads in lowland river tributaries: Journal of
Hydrology, v. 271, no. 1-4, p. 213-225.
Reinhorn, T., and Avnimelech, Y., 1974, Nitrogen release associated with the decrease in soil
organic matter in newly cultivated soils: Journal of Environmental Quality, v. 3, no. 2, p.
118-121.
Rennie, D., Paul, E., and Johns, L., 1976, Natural Nitrogen-15 abundance of soil and plant
samples: Canadian Journal of Soil Science, v. 56, p. 43-50.
Schumann, A. H., and M. Simon, 1996, A Transboundary Water Management Organization: The
International Commission for the Protection of the Elbe River. In Transboundary Water
Resources Management Institutional and Engineering Approaches. Springer, Berlin
Heidelberg, 47-58.
Shearer, G., Kohl, D., and Commoner, B., 1973, The precision of determinations of the natural
abundance of Nitrogen-15 in soils, fertilizers, and shelf chemicals: Soil Science, v. 118,
no. 5, p. 308-316.
Silva, S.R., Kendall, C., Wilkison, D.H., Ziegler, A.C., Chang, C.C.Y., and Avanzino, R.J.,
2000, A new method for collection of nitrate from fresh water and the analysis of
nitrogen and oxygen isotope ratios: Journal of Hydrology, v. 228, no. 1-2, p. 22-36.
Stickrod II, R., and Marshall, J., 2000, On-line nitrate-δ15
N extracted from groundwater
determined by continuous-flow elemental analyzer/isotope ratio mass spectrometry:
Rapid Communications in Mass Spectrometry, v. 14, p. 1266-1268.
Tockner, K., Robinson, C.T., and Uehlinger, U., eds., 2009, Rivers of Europe: London, Elsevier,
700 p.
Vigil, J., Warburton, S., Haynes, W.S., and Kaiser, L.R., 1965, Nitrates in municipal water
supply cause methemoglobinemia in infants: Public Health Reports, v. 80, no. 12, p.
1119-1121.
Wada, E., Kadonaga, T., and Maysuo, S., 1975, 15N abundance in nitrogen of naturally
occurring substances and global assessment of denitrification from isotopic viewpoint:
Geochemical Journal, v. 9, p. 139-148.
World Health Organization (WHO), 2010, Chemical Hazards in Drinking Water -
nitrates/nitrites:
http://www.who.int/water_sanitation_health/dwq/chemicals/nitratesnitrite/en/index.html .
Data retrieved June 2010.
Young, C., Data acquisition and evaluation of groundwater pollution by nitrates, pesticides, and
disease-producing bacteria: Environmental Geology, v. 5, no. 1, p. 11-18.

48
Zaporozec, A., 1983, Nitrate concentrations under irrigated agriculture: Environmental Geology,
v. 5, no. 1, p. 35-38.