first-principles study of piezoelectric (ba, ca)tio3-ba(ti
TRANSCRIPT

HAL Id: tel-02087297https://tel.archives-ouvertes.fr/tel-02087297
Submitted on 2 Apr 2019
HAL is a multi-disciplinary open accessarchive for the deposit and dissemination of sci-entific research documents, whether they are pub-lished or not. The documents may come fromteaching and research institutions in France orabroad, or from public or private research centers.
L’archive ouverte pluridisciplinaire HAL, estdestinée au dépôt et à la diffusion de documentsscientifiques de niveau recherche, publiés ou non,émanant des établissements d’enseignement et derecherche français ou étrangers, des laboratoirespublics ou privés.
Distributed under a Creative Commons Attribution - NonCommercial - NoDerivatives| 4.0International License
First-principles study of piezoelectric(Ba,Ca)TiO3-Ba(Ti,Zr)O3 solid solutions
Danila Amoroso
To cite this version:Danila Amoroso. First-principles study of piezoelectric (Ba,Ca)TiO3-Ba(Ti,Zr)O3 solid solutions. Ma-terial chemistry. Université de Bordeaux; Université de Liège, 2018. English. NNT : 2018BORD0163.tel-02087297

FIRST-PRINCIPLES STUDY OF
PIEZOELECTRIC (Ba,Ca)TiO3-Ba(Ti,Zr)O3 SOLID SOLUTIONS
Thesis presented to obtain the academic grade of
Doctor in SciencesUniversite de Liege
Doctor in Physics-Chemistry of Condensed MatterUniversite de Bordeaux
by
Danila AMOROSO
Jury committee:
Prof. Philippe GHOSEZ (Supervisor) Universite de Liege
Dr. Antoine VILLESUZANNE (Supervisor) Universite de Bordeaux
Prof. Javier JUNQUERA (President) Universidad de Cantabria
Dr. Eric BOUSQUET (Secretary) Universite de Liege
Dr. Andres CANO Institut NEEL
Dr. Mario MAGLIONE Universite de Bordeaux
Prof. Jens KREISEL University of Luxembourg
Dr. Gregory GENESTE Commiss. energie atomique et energies alternatives
26th September 2018

First-principles study of
piezoelectric (Ba,Ca)TiO3-Ba(Ti,Zr)O3 solid solutions
Abstract. High-performance piezoelectrics are key components of various smart devices
and, recently, it has been discovered that (Ba,Ca)(Ti,Zr)O3 (BCTZ) solid solutions show ap-
pealing electromechanical properties. Nevertheless, the microscopic mechanisms leading to such
features are still unclear and theoretical investigations of BCTZ remain very limited. Accord-
ingly, this thesis analyzes the properties of various compositions of (Ba,Ca)TiO3-Ba(Ti,Zr)O3
solid solutions by means of first-principles calculations, with a focus on the lattice dynamics
and the competition between different ferroelectric phases. We first analyze the four parent
compounds BaTiO3, CaTiO3, BaZrO3 and CaZrO3 in order to compare their properties and
their different tendency towards ferroelectricity. Then, the core of our study is a systematic
characterization of the binary systems (Ba,Ca)TiO3 and Ba(Ti,Zr)O3 within both the virtual
crystal approximation (VCA) and direct supercell calculations. When going from BaTiO3 to
CaTiO3 in (Ba,Ca)TiO3, the main feature is a gradual transformation from B-type to A-type
ferroelectricity due to steric effects that largely determine the behavior of the system. In par-
ticular, for low Ca-concentration we found out an overall weakened B-driven ferroelectricity
that produces the vanishing of the energy barrier between different polar states and results
in a quasi-isotropic polarization. A sizable enhancement of the piezoelectric response results
from these features. When going from BaTiO3 to BaZrO3 in Ba(Ti,Zr)O3, in contrast, the
behavior is dominated by cooperative Zr-Ti motions and the local electrostatics. In particular,
low Zr-concentration produces the further stabilization of the R3m-phase. Then, the system
shows the tendency to globally reduce the polar distortion with increasing Zr-concentration.
Nevertheless, ferroelectricity can be locally preserved in Ti-rich regions. We also found out an
unexpected polar activation of Zr as a function of specific atomic ordering explained via a basic
electrostatic model based on BaZrO3/mBaTiO3 superlattice. A microscopic factor behind the
enhanced piezoelectric response in BCTZ, at low concentration of Ca and Zr, can thus be the
interplay between weakened Ti-driven and emerging Ca-driven ferroelectricity, which produces
minimal anisotropy for the polarization. In addition, our comparative study reveals that the
specific microscopic physics of these solid solutions sets severe limits to the applicability of the
virtual crystal approximation (VCA) for these systems.
Keywords: lead-free compounds, piezoelectricity, ferroelectricity, lattice dynamics, ab-
initio calculations
Etude ab-initio de
solutions solides piezoelectriques (Ba,Ca)TiO3-Ba(Ti,Zr)O3
Resume. Les piezoelectriques a haute performance sont des composants cles pour les dis-
positifs agiles. Il a ete demontre recemment que les solutions solides (Ba,Ca)(Ti,Zr)O3 (BCTZ)
presentent des proprietes electromecaniques prometteuses. Cependant, les mecanismes mi-
croscopiques conduisant a de telles caracteristiques restent a eclaircir, et les investigations
theoriques de BCTZ demeurent tres limitees a ce jour. En consequence, cette these pro-
pose d’etudier les proprietes de differentes compositions de solutions solides (Ba,Ca)TiO3-
Ba(Ti,Zr)O3 au moyen de calculs de premiers principes, en mettant l’accent sur la dynamique
du reseau et sur la competition entre differentes phases ferroelectriques . Nous nous interessons
d’abord aux quatre composes parents BaTiO3, CaTiO3, BaZrO3 et CaZrO3, afin de comparer
leurs proprietes et leurs differentes tendances a la ferroelectricite. Ensuite, le cœur de notre
etude est une caracterisation systematique des systemes binaires (Ba,Ca)TiO3 et Ba(Ti,Zr)O3
en utilisant a la fois l’approximation du cristal virtuel (VCA) et des calculs directs sur supercel-
lules. Lorsqu’on passe continument de BaTiO3 a CaTiO3 dans (Ba,Ca)TiO3, la caracteristique
principale est une transformation progressive de la ferroelectricite de type B en type A en
raison d’effets steriques, lesquels determinent en grande partie le comportement du systeme.
En particulier, pour les petites concentrations en calcium, nous avons mis en evidence que la
ferroelectricite guidee par le site B est globalement affaiblie, conduisant a la disparition de
la barriere d’energie entre differents etats polaires et a une polarisation quasi-isotrope. Une
amelioration considerable de la reponse piezoelectrique resulte de ces caracteristiques. En pas-
sant de BaTiO3 a BaZrO3 dans Ba(Ti,Zr)O3, en revanche, le comportement est domine par
les mouvements cooperatifs Zr-Ti et l’electrostatique locale. En particulier, la phase R3m est
stabilisee significativement pour les faibles concentrations en zirconium. Sous l’effet d’une aug-
mentation de la concentration en zirconium, le systeme montre une tendance a la reduction de la
distorsion polaire; neanmoins, la ferroelectricite peut etre preservee localement dans les regions
riches en titane. Grace a un modele electrostatique base sur un super-reseau BaZrO3/mBaTiO3,
nous avons egalement decouvert un’activation polaire inattendue pour Zr, en fonction d’un or-
dre atomique specifique. Un facteur microscopique expliquant la reponse piezoelectrique exaltee
dans BCTZ, pour de faibles concentrations en Ca et Zr, peut donc resider dans l’interaction
entre la ferroelectricite affaiblie induite par Ti et la ferroelectricite emergente induite par Ca,
interaction produisant une anisotropie minimale pour la polarisation. En outre, notre etude
comparative revele que la physique microscopique specifique de ces solutions solides limite
severement l’applicabilite de l’approximation du cristal virtuel (VCA) a ces systemes.
Mots-cles: composes sans plomb, piezoelectricite, ferroelectricite, dynamique du reseau,
calcul ab-initio

Acknowledgements
“Dum loquimur fugerit invida
aetas: carpe diem, quam minimum credula postero.”
(Horatius, Odi, I, 11, 7-8)
Transl.
IT. Mentre parliamo, il tempo invidioso sara fuggito:
cogli l’attimo, quanto meno possibile fiduciosa nel futuro.
EN. While we are talking, the envious time will have escaped:
enjoy the day, trusting as little as possible in the future.
FR. Pendant que nous parlons, le temps jaloux aura fui:
saisis le moment, sans te soucier du lendemain.
Thinking about this period of my life, called “PhD”, that famous poetic verse by the Roman
poet Horatius suddenly has jumped to my mind, thus giving me causes of reflection. These
three years, in fact, have passed so fast, that it still seems yesterday I was leaving, for the first
time, my beloved family and region, Abruzzo, towards a totally new and unknown experience.
The only, vague awareness I had was strictly related to the study-work field with the certainity
that I was leaving to learn and try to lay the foundations for a career. Actually, it was totally
unexpected to me that, beyond the professional growth, the greatest realization has been the
personal growth, accompanied by a “disillusioned confidence” in the future.
In line with Horatius’ words, I have started, step-by-step, to realize the time fugacity, and
so to appreciate and enjoy the more various moments of life. Nevertheless, differently from
what he then says, I have also started to be confident in the future because all of today’s
achievements were exactly the unknown future of yesterday.
However, all this would not have happened, if I had not met on this path or if they had not
been there to support me, some reference persons. Therefore, I just want to truly say “thank
you Sophia, Veronique, Zeila, Matthieu, Angela, Chiara, Domenico, Giulia, Simone, Silvia”.
Then, I want to thank very much Philippe, for his continuous support and trust in me,
allowing me to never give up. And I also thank Andres for reminding any time the importance
of not underestimating even small details, eventually leading me to new interesting insights and
discussions. Besides, I want to warmly thank all my colleagues “of the corridor”, in particular,
Eric, Sebastien, Alain, Alex, Marcus, and Fabio, not only for the technical and logistic help,
but, above all, for having endured me despite my continuous critical speaking.

5
Then, I would like to say an extended thanks to the people of the “ferroelectric community”
I have met in various conferences and schools, and with whom, beyond interesting scientific
discussions, I have also spent nice and funny time. A special thanks to Mael and Constance for
their availability to answer any question of mine at any time, and to Hania for her kindness.
Finally, I would like to share the satisfaction of this specific PhD achievement with the other
“EJD-FunMat” PhD students, Francesco, Bruno, Catarina, Cong, Prya, Philip, Kenny, Sara,
Yannick, Raphael, Guillaume, Getnet and Mirasbek, as we have all faced tough and peculiar
challenges.
At last, I would like to acknowledge the European project EJD-FunMat 2015, program
H2020-MSCA-ITN-2014, which has supported this doctoral research work under the Marie
Sklodowska-Curie grant agreement n. 641640. Additionally, also the Ceci facilities funded by
F.R.S-FNRS (Grant No 2.5020.1) and the Tier-1 supercomputer of the Federation Wallonie-
Bruxelles funded by the Walloon Region (Grant No 1117545) on which the calculations have
been performed.

Contents
INTRODUCTION . . . . . . . . . . . . . . . . . . . . . . . . . . . . . . . . . . . . . 7
Part I - Scientific Background 9
1 PIEZOELECTRICITY 10
1.1 Applications . . . . . . . . . . . . . . . . . . . . . . . . . . . . . . . . . . . . . . 11
1.2 Materials . . . . . . . . . . . . . . . . . . . . . . . . . . . . . . . . . . . . . . . 15
1.2.1 Inorganic piezoeletric materials . . . . . . . . . . . . . . . . . . . . . . . 15
1.3 Aim of the thesis . . . . . . . . . . . . . . . . . . . . . . . . . . . . . . . . . . . 18
2 FUNDAMENTALS OF PEROVSKITE OXIDES 20
2.1 ABO3 perovskites: generalities . . . . . . . . . . . . . . . . . . . . . . . . . . . . 21
2.2 Ginzburg-Landau-Devonshire theory . . . . . . . . . . . . . . . . . . . . . . . . 22
2.3 Lattice dynamics . . . . . . . . . . . . . . . . . . . . . . . . . . . . . . . . . . . 26
2.3.1 The dynamical equation . . . . . . . . . . . . . . . . . . . . . . . . . . . 28
2.3.2 Ferroelectric and Antiferrodistortive distortions . . . . . . . . . . . . . . 30
2.3.3 LO-TO splitting and Born effective charges . . . . . . . . . . . . . . . . . 32
2.3.4 Interatomic Force Constants . . . . . . . . . . . . . . . . . . . . . . . . . 34
2.4 Functional properties . . . . . . . . . . . . . . . . . . . . . . . . . . . . . . . . . 35
2.4.1 Dielectric permittivity . . . . . . . . . . . . . . . . . . . . . . . . . . . . 35
2.4.2 Piezoelectricity . . . . . . . . . . . . . . . . . . . . . . . . . . . . . . . . 36
2.5 Conclusions . . . . . . . . . . . . . . . . . . . . . . . . . . . . . . . . . . . . . . 38
Part II - Method 40
3 DENSITY FUNCTIONAL THEORY 41
3.1 Many-body Schrodinger equation and the adiabatic approximation . . . . . . . . 41
3.2 The Hohenberg-Kohn theorem . . . . . . . . . . . . . . . . . . . . . . . . . . . . 43
3.3 The Kohn-Sham equations . . . . . . . . . . . . . . . . . . . . . . . . . . . . . . 43
3.4 Exchange-Correlation Functionals . . . . . . . . . . . . . . . . . . . . . . . . . . 45
3.4.1 LDA . . . . . . . . . . . . . . . . . . . . . . . . . . . . . . . . . . . . . . 45
3.4.2 GGA . . . . . . . . . . . . . . . . . . . . . . . . . . . . . . . . . . . . . . 47
3.5 Practical Implementation . . . . . . . . . . . . . . . . . . . . . . . . . . . . . . . 48
6

CONTENTS 7
3.5.1 Bloch’s Theorem and Plane wave basis set . . . . . . . . . . . . . . . . . 49
3.5.2 Pseudopotential approximation . . . . . . . . . . . . . . . . . . . . . . . 49
3.6 Merging DFT and Perturbation Theory . . . . . . . . . . . . . . . . . . . . . . . 51
3.6.1 Perturbative development . . . . . . . . . . . . . . . . . . . . . . . . . . 52
3.6.2 Density Functional Perturbation Theory . . . . . . . . . . . . . . . . . . 54
3.6.3 Accessible ground-state quantities . . . . . . . . . . . . . . . . . . . . . . 55
3.7 Conclusions . . . . . . . . . . . . . . . . . . . . . . . . . . . . . . . . . . . . . . 58
Part III - Computational Results and Analysis 60
4 TECHNICAL DETAILS 61
4.1 Computational Details . . . . . . . . . . . . . . . . . . . . . . . . . . . . . . . . 61
4.2 Structure of the parent compounds . . . . . . . . . . . . . . . . . . . . . . . . . 62
4.3 Supercell structures . . . . . . . . . . . . . . . . . . . . . . . . . . . . . . . . . . 62
5 PARENT COMPOUNDS 65
5.1 Dynamical properties . . . . . . . . . . . . . . . . . . . . . . . . . . . . . . . . . 66
5.1.1 BaTiO3 . . . . . . . . . . . . . . . . . . . . . . . . . . . . . . . . . . . . 66
5.1.2 CaTiO3 . . . . . . . . . . . . . . . . . . . . . . . . . . . . . . . . . . . . 67
5.1.3 CaZrO3 . . . . . . . . . . . . . . . . . . . . . . . . . . . . . . . . . . . . 68
5.1.4 BaZrO3 . . . . . . . . . . . . . . . . . . . . . . . . . . . . . . . . . . . . 69
5.2 Energetics of metastable phases . . . . . . . . . . . . . . . . . . . . . . . . . . . 74
5.2.1 BaTiO3 . . . . . . . . . . . . . . . . . . . . . . . . . . . . . . . . . . . . 74
5.2.2 CaTiO3 . . . . . . . . . . . . . . . . . . . . . . . . . . . . . . . . . . . . 75
5.2.3 CaZrO3 . . . . . . . . . . . . . . . . . . . . . . . . . . . . . . . . . . . . 76
5.2.4 BaZrO3 . . . . . . . . . . . . . . . . . . . . . . . . . . . . . . . . . . . . 76
5.2.5 Polar modes and ferroelectric phases . . . . . . . . . . . . . . . . . . . . 76
5.3 Conclusions . . . . . . . . . . . . . . . . . . . . . . . . . . . . . . . . . . . . . . 76
6 (Ba,Ca)TiO3 SOLID SOLUTIONS 78
6.1 VCA approach . . . . . . . . . . . . . . . . . . . . . . . . . . . . . . . . . . . . 78
6.1.1 Lattice parameter . . . . . . . . . . . . . . . . . . . . . . . . . . . . . . . 78
6.1.2 Dynamical properties . . . . . . . . . . . . . . . . . . . . . . . . . . . . . 80
6.1.3 Energy landscape . . . . . . . . . . . . . . . . . . . . . . . . . . . . . . . 81
6.1.4 Polarization and piezoelectric response . . . . . . . . . . . . . . . . . . . 82
6.2 Supercell approach . . . . . . . . . . . . . . . . . . . . . . . . . . . . . . . . . . 84
6.2.1 Ba0.875Ca0.125TiO3 . . . . . . . . . . . . . . . . . . . . . . . . . . . . . . 84
6.2.2 Ba0.5Ca0.5TiO3 . . . . . . . . . . . . . . . . . . . . . . . . . . . . . . . . 88
6.3 VCA vs SUPERCELL approaches . . . . . . . . . . . . . . . . . . . . . . . . . . 92

CONTENTS 8
7 Ba(Ti,Zr)O3 SOLID SOLUTIONS 94
7.1 VCA approach . . . . . . . . . . . . . . . . . . . . . . . . . . . . . . . . . . . . 95
7.1.1 Lattice parameters . . . . . . . . . . . . . . . . . . . . . . . . . . . . . . 95
7.1.2 Dynamical properties . . . . . . . . . . . . . . . . . . . . . . . . . . . . . 95
7.1.3 Energy landscape . . . . . . . . . . . . . . . . . . . . . . . . . . . . . . . 96
7.1.4 Polarization and piezoelectric response . . . . . . . . . . . . . . . . . . . 96
7.2 Supercell approach . . . . . . . . . . . . . . . . . . . . . . . . . . . . . . . . . . 98
7.2.1 BaTi0.875Zr0.125O3 . . . . . . . . . . . . . . . . . . . . . . . . . . . . . . . 98
7.2.2 BaTi0.50Zr0.50O3 . . . . . . . . . . . . . . . . . . . . . . . . . . . . . . . . 101
7.3 VCA vs SUPERCELL approaches . . . . . . . . . . . . . . . . . . . . . . . . . . 103
7.4 Role of cation arrangement . . . . . . . . . . . . . . . . . . . . . . . . . . . . . . 104
8 DISCUSSION & CONCLUSIONS 112
APPENDICES 115
A Distorted phases of BaZrO3 116
B Resume 120
BIBLIOGRAPHY . . . . . . . . . . . . . . . . . . . . . . . . . . . . . . . . . . . . 135

Introduction
Piezoelectric devices have successfully relied on lead zirconate titanate (PZT) materials for
several decades. Since 2003, the European Union has restricted the use of certain hazardous
substances [40], such as Pb, which has driven the search for alternative lead-free piezoelectric
compounds. In this respect, BaTiO3-based solid solutions appear as interesting candidates,
whose potential for piezoelectric applications has been known since the sixties [26, 31, 160].
Among possible combinations, the partial homovalent substitution of Ba by Ca and Ti by Zr at
the A- and B- sites of BaTiO3 (Ba1−xCaxTi1−yZryO3 hereafter BCTZ) is of special interest. In
their seminal paper, Liu and Ren [44] reported a high piezoelectric coefficient of 620 pC/N for
the ceramic system (Ba0.7Ca0.3)TiO3-Ba(Ti0.8Zr0.2)O3. This has been ascribed to the presence
of a special point in the phase diagram in which the tetragonal and rhombohedral ferroelectric
phases meet the paraelectric cubic one. Subsequently, Keeble et al. [51] revisited this phase
diagram and observed an intermediate ferroelectric orthorhombic phase that also meets the
three previous ones.
As in the case of Pb-based systems, the achievement of high piezoelectric response in BCTZ
is believed to be linked to the existence of a so-called phase convergence region, in which the
lack of energy barriers between different ferroelectric states makes the landscape isotropic and
the polarization free to rotate [52]. However, no theoretical confirmation of this picture has
been provided yet for this system. In fact, although a large number of experimental studies have
been reported [44, 51, 106, 161], the number of theoretical investigations of BCTZ compounds
remain comparatively very limited and, to the best of our knowledge, no comprehensive study
based on direct Density Functional Theory (DFT) has been carried out so far.
In order to fill in this gap, here we report a systematic first-principles DFT study of
(Ba,Ca)(Ti,Zr)O3-type compounds with the intent to clarify the evolution with composition
of their ferroelectric, piezoelectric and related properties. We proceed step-by-step. Thus, we
first address carefully the four parent compounds. Then, starting from BaTiO3, we investigate
separately the evolution of the properties in (Ba,Ca)TiO3 and Ba(Ti,Zr)O3 solid solutions in
order to disentangle the role of individual atomic substitutions at the A- and B-sites. We
use both the Virtual Crystal Approximation (VCA) and explicit ordered supercells of differ-
ent compositions. In each case, starting from the reference high-symmetry paraelectric phase,
we identify and characterize the existing phonon instabilities. Then, comparing the energy of
various possible distorted phases obtained from the condensation of unstable modes, we search
and characterize the structural ground state. All along this work, a special emphasis is put on
the analysis of the real-space interatomic force constants in order to rationalize the evolution of
the properties with composition. Through such quantitative analysis and comparisons of prop-
erties between the parent compounds and their related solid solutions, our work reveals the
distinct underlying microscopic mechanisms activated by A- and B-sites atomic substitutions.
At the same time, it points out and explains strong limitations of the VCA approach for the
9

CONTENTS 10
(Ba,Ca)TiO3 and Ba(Ti,Zr)O3 systems.
The thesis is organized as follows. In Chap. 1, we introduce the concept of piezoelectricity
and related functionalities. In Chap. 2, we present an overview on the fundamental properties
of ABO3 perovskites, being the class of compounds of interest all along our study, and in the
following Chap. 3 we present the basic of the Density Functional Theory, being the method
used for our theoretical investigation. In Chap. 4, then, specific technical details of our DFT
calculations are presented. The description of the obtained results thus follows. In detail, in
Chap. 5, we carefully analyze the four parent compounds. Next, in Chap. 6 and Chap. 7,
we address separately (Ba,Ca)TiO3 and Ba(Ti,Zr)O3 solid solutions of different compositions.
Finally, Chap. 8 is devoted to a global discussion and conclusions.
Contents of Chap. 4, Chap. 5, part of Chap. 6, and Chap. 7 are published in D. Amoroso,
A. Cano, and Ph. Ghosez, Phys. Rev. B, 97, 174108 (2018).

Part I
Scientific Background

Chapter 1
Piezoelectricity
In one sentence, a piezoelectric device can be thought as a “translator” between mechanical
and electrical energy [1]. Piezoelectricity, in fact, is the manifestation of a linear coupling
between electrical and mechanical fields [2], namely production of electric charges on the surface
as a consequence of exerted mechanical stress. The induced charges are proportional to the
mechanical stress. Such property has been thus named according to its phenomenon; in fact,
the word piezoelectricity is composed by the Greek verb πιεζειν (piezein), that means to press,
and the word electricity, that is related to the Greek word ηλεκτρoν (electron), which means
amber. In fact, ancient Greeks where the first to notice the manifestation of electricity in the
attraction of small objects by rubbed amber.
The discovery of piezoelectricity dates back to 1880 by the French brothers Pierre and
Jacques Curie. Specifically, they found this property in quartz crystal observing the develop-
ment of an electric polarization after the compression of such material. This is what is called
“direct piezoelectric effect”. Later in 1881 Gabriel Lippmann hypothesized the “inverse piezo-
electric effect”, then demonstrated by the Curie brothers. In this case the opposite phenomenon
is observed, that is the occurrence of expansion or contraction of the material, i.e. geometric
strain, proportional to an applied electric field [3, 4]. Therefore, piezoelectric materials exhibit
both the direct and inverse phenomena: the polarity associated to the generated surface charges
depends on the direction of the exerted stress, that is compressive or tensile; conversely, de-
pending on the direction of the applied electric field, the material either contracts or expands
[2].
The linear relationships between the induced electric polarization P ind along the direction
i and the exerted stress σ, and, conversely, the strain ξ to the applied electric field E are
P indi = dijσj
ξj = dijEi (1.1)
where the stress σj and piezoelectric dij coefficients are expressed in Voigt notation, with i =
1, 2, 3 and j = 1, 2, 3, 4, 5, 6, being a second-rank and third-rank tensor respectively. Actually,
12

CHAPTER 1. PIEZOELECTRICITY 13
the link between the electrical and mechanical properties in piezoelectric materials can be
represented via various parameters, including the piezoelectric charge or strain coefficient (dij),
piezoelectric voltage or strain coefficients (gij), electromechanical coupling coefficient (kij) and
mechanical qualify factor (Qm). All of them are represented in Voigt notation, being the
piezoelectric response represented by a third rank tensor as it relates the second rank mechanical
and first rank electrical variables. Depending on the type of applications of interest, one
can focus on the behavior of one parameter than the others. These key material parameters
are referred as figures of merit for piezoelectric devices. Nevertheless, the primary parameter
considered by experimentalists is the piezoelectric coefficient dij, which gives access directly
to the intrinsic piezoelectric response of the material ([dij ] = [pC/N ] = [pm/V ] for the direct
and inverse effect respectively). Detailed descriptions of all such interlocked parameters are
provided in Refs. [3, 1], while an explicit formulation of the linear response between the stress
and induced polarization will be given in Sec. 2.4.2.
From the symmetry point of view, a material can exhibit piezoelectricity only if its structure
is non-centrosymmetric, that is it does not have an inversion center. This is directly linked to the
fact that piezoelectricity represents the linear coupling between stress and electric polarization
as well between as electric field and strain 1.1. In a centrosymmetric structure, in fact, dij has
to be equal to −dij . Therefore, the only solution is that the piezoelectric coefficient is zero. This
does not apply to structure lacking inversion symmetry. Therefore, of the 32 crystal classes,
21 are non-centrosymmetric, but 20 of these exhibit piezoelectricity. The non-centrosymmetric
point group O(432) makes an exception due combinations of associated symmetry operations.
Among these, 10 are polar crystal classes, which show a spontaneous dipole moment and ex-
hibit pyroelectricity, i.e. change in the polarization proportional to change in temperature.
Switchability of such spontaneous polarization via an external electric field makes the material
also ferroelectric. Therefore, ferroelectrics form a subgroup of the pyroelectric materials [5, 6].
1.1 Applications
The capability offered by the piezoelectric materials to couple mechanical and electrical prop-
erties, such as mechanical output in response to a voltage input, and alternatively, a voltage
output in response to a mechanical input, is widely exploited in various so-called piezo-devices.
They can be grouped in three main kinds of application: actuators, sensors and energy harvest-
ing. The first being mostly related to the “inverse piezoelectric effect”, while the latter ones
to the “direct piezoelectric effect”. Nevertheless, devices which rely concurrently on both the
effects have been also widely developed. Out of these, there are also piezo- lighters and injec-
tors. It is worth noting that together with the geometric deformation of the material related
to the indirect effect, an other exploited effect is the associated generation of vibrations prop-
agating as mechanical waves with specific frequencies. Therefore, certain piezoelectric crystals
or ceramics can be used as source of sonic and ultrasonic waves. As a result, in a reverse way,

CHAPTER 1. PIEZOELECTRICITY 14
piezoelectrics can also behave as detector of external mechanical vibrations.
A huge number of works about piezoelectric materials and their transferring into applications
exist. In the following a few examples of the well-established and impending applications have
been extracted and listed. Reviews of reference among others are [3, 1, 5, 16, 17, 18, 19].
Daily life uses
Maybe we do not think about this, but we experience piezoelectricity everyday in our daily life
at home, in the office and even in the path to the working place, and as well as in our free time
when attending for instance a concert, a public manifestation or simply listening music etc. In
fact, piezoelectricity is the working functionality in
• quartz clock: a quartz crystal (SiO2) is used as resonator, producing oscillations of very
precise frequency after being distorted by the applied voltage through an electrode, which
in turn detects the produced electric signal;
• lighters: a spark is created by pressing a piezoelectric crystal, which generates an electric
arc, igniting a flammable fluid or gas;
• fuel injectors: in direct injection engine, the fuel is injected into the combustion chamber
via piezoelectric valves, which allows for fine electronic control over the fuel injection time
and quantity;
• inkjet printing: a piezoelectric material behind each nozzle in a ink-filled chamber
causes the stream of liquid into droplets at regular time intervals by means of the induced
mechanical vibration. Such printing method is called “drop-on-demand”;
• microphones: basically they convert sound into an electric signal in order to be recorded
and/or reproduced; therefore, a piezoelectric material is used in the piezo-microphone,
relying on its detection of acoustic waves, i.e. sound vibration, which in turn produce the
voltage output. This functionality is the opposite of loudspeakers, which convert an
electrical signal into sound. Therefore, piezoelectric materials, now working in the inverse
regime, can be still used.
Laboratory apparatus
Piezoelectricity is also at the basis of the operation of some instrumental techniques thanks to
the possibility to move and drive object with high accuracy via the strain effect induced by
applied voltage.
• AFM (Atomic Force Microscopy): it is used for force measurement, imaging, and ma-
nipulation of different specimens thanks to the direct forces interacting between sample
and tip. The precise movements of sample and tip are driven in x, y and z directions

CHAPTER 1. PIEZOELECTRICITY 15
by the so-called piezo-scanner, exploiting the reverse piezoelectric effect. The cantilever,
which sustains the tip, can also be composed by a small piezoelectric element in order to
oscillate around its resonance frequency, in the tapping-mode regime. It is worth to note
that a variant functionality of the AFM is the PFM (Piezoresponse Force Microscopy)
which allows imaging and manipulation of piezoelectric materials. Such characterization
is achieved by using a conductive probe tip, which thus applies a current to the sample
causing strain deformations of it.
• STM (Scanning Tunneling Microscopy): it is used for imaging surface at atomistic scale.
It is based on the quantum tunneling effect, which occurs between the tip and the sample
surface via an applied bias. As in the AFM, the surface scanning by the tip is driven by
a piezoelectric;
• ultrasonic cleaners: they are used to clean many different type of objects going from
samples, medical instruments to mechanical components via propagating ultrasonic waves
in an appropriate cleaning solvent. The source of such ultrasound is thus a piezoelectric
crystal or ceramic, which vibrates in response to the applied AC voltage.
Biomedical devices
The rising interest in developing noninvasive, biocompatible techniques in medical procedures
makes piezoelectric materials good candidates for applications used for the real-time monitoring
and adjustments of the health status of patients. Piezoelectrics thus result helpful in various
steps of medical diagnosis procedures and treatment. Some examples are:
• ultrasonography: this technique includes all medical instruments using ultrasound for
diagnostic imaging, generally named ecography. In this case a piezo-transducer, included
in a probe, behaves both as source and detector of mechanical vibrations. The basic and
general operation is that the waves generated by the piezo in response to the electrical
input propagate into the body, being a probe in contact with the patients skin. Then, the
echo caused by tissues and other body’s parts are received by the same piezo-transducer,
which converts it in electrical signals, in turns converted in images. It is noteworthy that
the ultrasound themselves with varying frequencies can be used as medical treatment
especially in orthopedics and traumatology;
• biosensors: they typically rely on the change of the initial vibration frequency of the
piezoelectric material with the changing of the surrounding physiological parameters, in
particular via the binding of any mass to the piezo-element. Therefore, sensitivity in
micrograms is necessary to appreciate measurable change in oscillations. In the specific
case of biodetectors, proteins, enzymes, cells or other organic structures chosen to act as
bio-recognition components are attached to the piezo-transducer in order to interact/bind

CHAPTER 1. PIEZOELECTRICITY 16
with the specific chemical constituent (analyte) of interest to be detected. This interaction
is so measured by the transducer, affecting the vibration of the piezo-element. The piezo-
platform used for the biosensor construction is thus the so-called microbalance, which
can be also used to detect microgram quantities in other fields than biomedical;
• drug delivery: via combined piezo-micropumps and microneedles drugs can enter the
body via transdermal way at therapeutically useful rates.
Other applications
Basically, the piezo-based devices and instrumentations, like the ones previously presented, rely
on the capability of the piezoelectric materials to behave like transducers, and so to be used
as detectors and sensors. Therefore, a quite widespread range of other possible applications
exist, going from piezo-motors, vibration reductors to sensors monitoring and assessing civil
infrastructures etc.
Energy Harvesting
Mechanical vibrations source of mechanical energy that could be converted into electricity are
everywhere around us: voluntary and involuntary human body motion/activity, vehicles in
motion, working machines and instruments in mechanical industries, natural phenomena like
wind, ocean/sea waves, earthquakes and so on. Actually, the scavenging of such wasted energy
is quite challenging. Nevertheless, feasible solutions relying on the use of piezoelectric materials
have begun to arise from different fields.
The biggest challenge in recent years is exploiting the human motion to power both portable
devices and those which involve integration with the human body itself such as drug delivery,
artificial/electronic tissues for robotics, health monitors etc. With respect to the latter, for
instance, researches aimed to develop biocompatible nanogenerators for in-vivo self-powered
devices avoiding surgical procedures to replace depleted batteries are running. Examples of
various working small applications, are shoes based on piezo-soles, e-textiles based on piezo-
yarns, nanogenerators and so on.
Large-scale applications of piezoelectricity for energy harvesting is then even more challeng-
ing. Nevertheless, since last decade, different interesting projects have been successfully led
from collaborations between Universities and companies to develop “smart” floors and roads
[20, 21, 22]. In the first case, the mechanical energy produced by substantial number of human
steps in crowed places is reused to produce electricity, and so to illuminate the surrounding
area itself. Such technology of energy floors has been adopted, for instance, in a dance club in
Rotterdam and the subways in London and Tokyo as well as in occasion of the Olympic Games
2012. In the second case, instead, the idea is to make a piezo-asphalt in order to harvest energy
from the motion of vehicles.

CHAPTER 1. PIEZOELECTRICITY 17
1.2 Materials
We have previously seen that the human body activity can be source of reusable energy by
the help of piezo-transducers. Amazingly, the body reaction to human emotion can be a direct
source of unexpected piezoelectric materials. People, in fact, usually manifest the reaction
both to happiness and sadness by crying, and tears have been found to be piezoelectric. Such a
feature, actually, has to be ascribed to a specific antibacterial enzyme, the lysozyme, contained
in tears as well as in other organic secretions, milk and egg white, that exhibit piezoelectricity
[7]. The discovery of lysozyme due to its bacteriolytic properties traces back to early 1900s (so
even well before the discovery of BaTiO3 as we will see later) by A. Flaming [8], the discoverer
of penicillin. Then, only recently, its piezoelectric properties have been demonstrated [9, 10].
Actually, the lysozyme is not the only case of piezoelectric of biological origin, but also other
proteins as elastin or collagen, the latter forming bones and tendons, or amino acids, forming
proteins, exhibit piezoelectricity [11, 12, 13, 14]. In particular, for instance, piezoelectricity
in bones was already known since the 1950s [15]. Nevertheless, the piezoelectric response
exhibited by these biological materials is generally low, and so limiting their use in technological
applications. Such a behavior is then opposite in a wide variety of inorganic materials among
which the most used quartz (SiO2), barium titanate (BTO), lead zirconate titanate (PZT) and
polyvinylidene fluoride (PVDF).
1.2.1 A brief overview on inorganic piezoeletric materials
As mentioned at the beginning, piezoelectricity was discovered in quartz single crystal in 1880,
but only the need of ultrasonic sonar and technologies for military purposes during the World
Wars boosted the search for other materials with enhanced dielectric, piezoelectric and ferro-
electric properties. Various titanates, including BaTiO3, CaTiO3, SrTiO3, PbTiO3 and PbZrO3
among others, have been thus synthesized between the 1940s and 1950s. In particular, BaTiO3
was discovered independently by US, Japan and Russia during the World War II for its high
permittivity. Only after few years, such high dielectric properties have been associated to its
ferroelectric nature [23]. Later on, different set of measurements accompanied by the phe-
nomenological theory approach of Devonshire shed light on its piezoelectric and related prop-
erties [24, 25, 26]. Nevertheless, in order to increase the Curie temperature of BTO, i.e. the
temperature of transition from the cubic to the ferroelectric tetragonal phase, to higher value
than 120 C and to lower the transition temperature to the orthorhombic ferroelectric phase,
various cations replacements were studied. The aim was thus to enlarge the range of operating
temperature. These trials led to the discovery of Pb(Zr,Ti)O3 system by Japanese researcher
groups [27, 28]. Then, the determination of its phase diagram [29] and superior piezoelectric
properties [30] followed. It is noteworthy to mention that, in the same period, McQuarrie and
Behnke were the first to synthesize the quaternary system (Ba,Ca)(Ti,Zr)O3 [31]; however,
the poor temperature stability of the associated piezoelectric properties and the breakthrough

CHAPTER 1. PIEZOELECTRICITY 18
of PZT threw shadow on this and related solid solutions until last decades. From the 1960s,
then, relying on the high performances provided by PZT, an extensive production and char-
acterization of Pb-based piezoelectric solid solutions followed, like Pb(Mg1/3Nb2/3)O3 (PMN),
Pb(Zn1/3Nb2/3)O3 (PZN), Pb(Sn1/2Nb1/2)O3 (PSN) among many others and, later on, more
complex associated solid solutions via the combination of PbTiO3 (PT), like PMN-PT, PZN-PT
and PSN-PT. An extensive comparative description of such Pb-based systems and associated
list of references are provided in Ref. [32].
In 1969, interesting piezoelectric properties were also found in a completely different system,
the polymer polyvinylidene fluoride (PVDF). This discovery has to be once again ascribed to
Japanese researchers [33, 34]. Later, it was been found to be also pyroelectric and ferroelectric
[35]. Over the last decades, therefore, PVDF is facing increasing interest especially for the
development of wearable e-textile functionalities [36, 37, 38]. Piezoceramic-polymer composites
based on PZT-PVDF have been also developed, obtaining an enhancement of the piezoelectric
performances of the PVDF alone [39].
In the 21st century, a new boost in the search for new high-performing piezoelectric materials
has been due to “environmental concerns”, which have widely restricted the use of Pb and led
researchers to the search for alternative lead-free piezoelectrics. In particular, the discussion
about the toxicity of lead-containing ceramics is mostly related to the recycling process of the
lead-containing components, being metallic Pb and lead oxide PbO known to be toxic, even if
at different level (see Ref. [1] and references therein). In this respect, therefore, the European
Union (EU) has promoted various regulations to restrict the use of Pb and Pb-containing
materials in order to reduce their impact on health and environment. The two main sets of
rules by the EU are the directive on the restriction of the use of certain hazardous substances in
electrical and electronic equipment [40], abbreviated as RoHS, and the REACH (Registration,
Evaluation, Authorisation and Restriction of Chemical Substances) regulation (explanation
and regulation can be found in the official website of the European Chemicals Agency (ECHA)
[41].)
In this respect, the inspiring precursor work was likely the publication by Takenake et al. in
1991 about the Ba-modified bismuth sodium titanate (Bi1/2Na1/2)1−xTiO3-BaxTiO3 (BNT-BT),
in which he referred to the BNT-based solid solutions as a new group of lead-free piezoelectric
ceramics. [42]. Therefore, a huge number of works with renewed interest in investigating and
improving BNT-based systems followed. Then, another more recent stimulating work by Saito
et al. in 2004 about the enhanced piezoelectric properties in complex modified systems based
on (K,Na)NbO3 (KNN) [43] has boosted the interest in the investigation and development of
KNN-based materials. Later on in 2009, the outstanding piezoelectric properties found in Ca-
and Zr-modified barium titanate (Ba,Ca)(Ti,Zr)O3 (BCTZ) by Liu and Ren [44] has widely
renewed the interest in BTO-based materials. Detailed reviews about various lead-free materials
including the aforementioned ones are Refs. [45, 46, 2].

CHAPTER 1. PIEZOELECTRICITY 19
Piezoelectricity and composition-induced phase boundaries
Figure 1.1: PTZ phase diagramfrom [50]. Authors report in open cir-cles data from B. Jaffe, W.R. Cook, andH. Jaffe, Piezoelectric Ceramics (AcademicPress, London, 1971) and in solid symbolsthe FT − FM and PC − FT transition tem-peratures [50].
The common factor in all the aforementioned devel-
oped piezoelectric materials is the presence of the
so-called morphotropic phase boundary (MPB), a
compositional region separating two competing fer-
roelectric phases in the composition-temperature (x-
T) phase diagram [47]. The achievement of such
composition-induced phase transition thus typically
relies on the design of solid solutions, which have
compounds with different polar ground-states, typ-
ically being rhombohedral (R), orthorhombic (O)
or tetragonal (T) with spontaneous polarization P
along [111], [011] or [001] directions respectively, lo-
cated as parent end members. After the first observa-
tion of this feature in the phase diagram of PZT and
the observed connection with the enhanced piezo-
electricity, the search for the improved piezoelectric
materials has been thus based on the achievement
of the MPB. The understanding of the remarkable
piezoelectric properties of PZT is, in fact, the “po-
larization rotation” between the adjacent rhombo-
hedral R- and T- phases through one (or more) in-
termediate monoclinic phases [48, 49, 50, 51]. More generally then, the composition-induced
ferro-ferro transition causes the instability of the polarization state at the MPB region so that
the polarization direction can be easily rotated by external stress or electric field, resulting in
high piezoelectricity [52, 44]. In other words, such regions of the (x-T) phase diagram provide
the condition for minimal anisotropy with respect to directions of the polarization, being the
minima of the free energy associated to different polar states, i.e. P oriented along different
directions in space, degenerate. Such isotropic energy landscape, corresponding to a rather flat
energy barrier between different polar states, gives rise to a rotational instability in the spon-
taneous polarization, which in turn results in the enhancement of the piezoelectric response. It
should be also point out that the elastic softening, i.e. a strong coupling between the internal
degrees of freedom and strain in the system, is another key factor to get giant piezoelectric re-
sponse [52, 46]. Therefore, if the presence of bridging monoclinic phases is a necessary condition
for a large piezoelectric response is still matter of debate [53, 46]. Nevertheless, its appearance
seems naturally favored by the almost isotropic free energy associated to the original polar
ground-states of the parent end-members of the solid solutions [46].
Another important feature, which determines the technological relevance of the various

CHAPTER 1. PIEZOELECTRICITY 20
(a) (b)
T
O
R
C
T (°C)
T c
T O-T
T R-O
Figure 1.2: (a) Phase diagram overlapped to the contour plot of the piezoelectric coefficient d33and (b) behavior of d33 as a function of temperature in BCTZ. In the latter graph, authors mark withdashed lines the peak positions indicating phase transitions. Adapted from Ref. [54].
piezoelectric materials, is the stability of the piezoelectric properties as a function of varying
temperature. With respect to the latter, it is the trend of the phase boundary line in the (x-T)
diagram to affect this feature, beyond the intrinsic change of the properties of the material
with temperature. PZT, for example, exhibits a nearly temperature-independent, i.e. vertical,
boundary line, as illustrated in Fig. 1.1 from Ref. [50]. In the ferroelectric community, such
nearly vertical transition line is the one properly termed morphotropic phase boundary (MPB),
while a phase boundary line showing substantial variation with temperature is termed instead
polymorphic phase boundary (PPB). The latter type results more typical of the BT-based
solid solution [46]. In particular, this is true for BCTZ, which appears a suitable candidate for
applications with usage temperature below 100 C [1, 106]. Phase diagram and trends of the
piezoelectric coefficient d33 in BCTZ reported in Ref. [54] are shown in Fig. 1.2. Moreover, a
particular and interesting characteristic of BCTZ is its biocompatibility, making it one of the
most promising piezoelectric materials to be used in the biomedical devices [55, 56, 57, 58].
A detailed review about piezoelectricity-MPB relationships is reported by Cordero [46].
1.3 Aim of the thesis
Among the BTO-based systems, BCTZ has appeared as the most attractive one, so that it
has been widely experimentally investigated. Several experimental works concerning synthesis,
structure, energetics and dielectric, piezoelectric, and elastic properties have been already car-
ried out and further works aimed at improving its properties are still ongoing. Nevertheless,
despite there are evidences of the fact that increasing Ca- and Zr- content deeply affects the
ferroelectric features of BTO, producing the (x-T) phase diagram and related properties of in-
terest, the physical mechanisms behind the occurrence of such quasi-isotropic energy landscape
remain still unclear. Up to now, in fact, theoretical characterizations of BCTZ are few and
mostly limited to reproduce the experimental evidences instead of understanding and discuss
the underlying physics. Results and details of the various experimental works on BCTZ are
reported in Acosta et al. [2] and references therein.

CHAPTER 1. PIEZOELECTRICITY 21
In this respect, in the present thesis, we try to unravel the microscopic mechanisms tuning
the ferroelectric and piezoelectric properties of these solid solutions by means of a step-by-
step analysis and systematic comparisons, focusing on the distinct effects arising from the end
members (Ba,Ca)TiO3 (BCT) and Ba(Ti,Zr)O3 (BTZ) and related pure parent compounds.
Accordingly, in the following, in order to guarantee a complete understanding of the work, an
introduction to the main physical concepts affecting these systems and to the used method
precedes the presentation of the specific results.

Chapter 2
Fundamentals of Perovskite Oxides: a
general overview
In the previous chapter the concept of ferroelectricity has been introduced in relationship with
piezoelectricity, being a fundamental properties of most of the good piezoelectric materials. In
particular, this is true for BCTZ perovskites and its parent end members BCT and BZT, as
well as the building block BTO.
Figure 2.1: Schematic illustrationof a typical hysteresis loop. FromRef. [59]. The spontaneous polariza-tion is defined as Ps = (PB −PA)/2,being a zero-field property [60].
Ferroelectric (FE) materials are insulating systems that
exhibit spontaneous macroscopic polarization, switchable
by an applied electric field. The concept of electric po-
larization is therefore the key to understand ferroelectricity.
At equilibrium, a FE material is characterized by sponta-
neous polar atomic distortion. In particular, ferroelectric
perovskites exhibit a high-temperature paraelectric refer-
ence, which undergoes ferroelectric distortion at decreasing
temperature. The symmetry breaking between the para-
electric and ferroelectric phases can be described as a first-
or second-order structural phase transition within the Lan-
dau theory, where the polar lattice distortion is the primary
order parameter. Systems in which the polarization is a
second order parameter linearly coupled to nonpolar lattice
distortions or to the magnetization are called “improper” ferroelectrics.
The absolute bulk macroscopic polarization P of materials is not directly accessible, rather
most measurements give information about changes of polarization (i.e. its derivatives), such
as spontaneous polarization, permittivity, pyroelectric coefficient, piezoelectric tensor and Born
charges. Usually, the switching process in a ferroelectric material is associated with a hysteresis
curve of the electric polarization P as a function of the field strength E between opposite po-
larities, as illustrated in Fig. 2.1. The critical electric field necessary to reverse the polarization
is known as coercive field. Such electric bi-stability, that is the presence of spontaneous, non-
22

CHAPTER 2. FUNDAMENTALS OF PEROVSKITE OXIDES 23
volatile and switchable polarization, can be used for data storage. Furthermore, the transition
from the paraelectric to the ferroelectric phase depends on temperature leading to the defini-
tion of the Curie temperature Tc. As this temperature is approached, the dielectric constant
ǫ, which in most cases obeys the Curie-Weiss law, reaches large values useful for capacitor ap-
plications. Other important properties from the technological point of view are pyroelectricity
and piezoelectricity earlier introduced. In pyroelectrics, for instance, a temperature dependence
of the spontaneous polarization generates an electric current when both ends of the polarized
ferroelectric are short-circuited. Below Tc the pyroelectric effect becomes large and this feature
is useful in a variety of thermal-image sensors and infrared detectors. In piezoelectrics, electric
and mechanical properties are coupled: an applied stress generates polarization, whereas the
electric field causes strain in the material. Such piezoelectric responses are employed in actu-
ators, transducers, ultrasonic motors and other electromechanical devices, as widely analyzed
in Chap. 1.
In the following we will focus on the ferroelectric and related properties of the most studied
family of compounds known as perovskite oxides. In addition to the intent to introduce the
context, this will allow to introduce the main concepts investigated in this thesis.
2.1 ABO3 perovskites: generalities
A widely studied class of oxides is that known as perovskite oxides with general ABO3 formula
unit, where A and B represent cation elements. Originally, the name of perovskite had been
assigned to the mineral of calcium titanate (CaTiO3) discovered in the Ural Mountains in 1839
by Gustave Rose and named in honor of the Russian mineralogist Lev A. von Perovski. Then,
this name has been lent to the class of compounds showing the same type of crystal structure.
Although CaTiO3 shows as orthorhombic ground state, the name perovskite is often given to
the high-symmetry reference containing 5 atoms with space-group Pm3m (Oh1 , No. 221). As
A B O
Figure 2.2: (Left) Schematic view of the 5 atoms unit cell of the ABO3 ideal cubic perovskitestructure: the B atom (green) sits at the center of corner-shared oxygen octahedra (blue), while Aatoms (red) occupies the enclosing holes. (Right) Schematic view of the simple cubic Brillouin zone[62].

CHAPTER 2. FUNDAMENTALS OF PEROVSKITE OXIDES 24
illustrated in Fig. 2.2, a possible description of such a structure is: the A atom sits at the
corner of the cube, the B atom sits at the center and each oxygen occupies the center of each
face. Therefore, in the perovskite structure, the B atom is surrounded by 6 equidistant first
neighbors oxygens, arranged at the corners of a regular octahedron. The octahedra are corner-
shared, enclosing holes which are occupied by A atoms. Each A atom has 12 equidistant O
atoms. Each O atom has 2 B-type and 4 A-type atoms as first neighbors [61]. An alternative
description is that with the B atom at the corner and the A atom at the center of the cube.
Despite their apparent similarities, distinct members of the family can exhibit different
physical properties depending on composition and cationic ordering. Starting from the high-
temperature cubic reference, the majority of these compounds undergo polar and/or non-polar
structural phase transitions when the temperature is lowered. This means that the cubic phase
is unstable with respect to energy-lowering distortions. Most of the appearing distortions are
related to a structural frustration of the cubic perovskite structure. An empirical criterion
for predicting the tendency of the ABO3 cubic perovskite to be distorted and related type
of distortion is the tolerance factor based on the Goldschmidt’s rules [63]: the anion-cation
distance is obtained as the sum of their ionic radii being a cation surrounded only by as many
anions as can touch it [61]. Accordingly, the relationship defining the ideal cubic perovskite
structure is
rA + rO =√2(rB + rO) (2.1)
and the tolerance factor t provides the deviation from the latter, being defined as
t =rA + rO√2(rB + rO)
(2.2)
where rA, rB and rO are the ionic radii of the A-type, B-type and O atoms 1. When t > 1,
the B cation is too small for its site so that it will off-center. Such motion eventually produces
a polar distortion leading to a so called B-driven ferrolectricity, as in the case of BaTiO3.
Conversely, when t < 1, the A cation is too small in comparison to the hole between the
oxygen octahedra. Therefore, both polar off-centering of the A-cation leading to A-driven
ferroelectricity or antipolar motions and/or oxygen rotations can take place, as in the case of
CaTiO3 and CaZrO3. The ideal condition t ≃ 1 is rarely satisfied except for BaZrO3.
We will present the specific structural properties of the aforementioned ABO3 systems in
the results part.
2.2 Ginzburg-Landau-Devonshire theory
As previously introduced, the main interesting feature of the ABO3 ferroelectric perovskites
is to undergo with temperature different sequences of structural phases transition. Therefore,
1Alternatively, one can use the bond-valence model to calculate the ideal A-O and B-O bond distances [64].

CHAPTER 2. FUNDAMENTALS OF PEROVSKITE OXIDES 25
theoretical predictions should take explicitly into account the temperature effect, omitted in
the ground-state theory. In this respect, the most popular approach to describe the temper-
ature behavior of ferroelectrics at the macroscopic level is the phenomenological Ginzburg-
Landau-Devonshire theory [25, 65], that is appropriate for bulk systems with spatially uniform
polarization.
In general, the thermodynamic state of bulk ferroelectrics, and so the associated thermody-
namic potential, the Gibbs free energy, can be specified by three independent quantities among
the conjugate pairs temperature-entropy (T, S), stress-strain (σ, ξ), and electric field-electric
displacement (E , D or eventually polarization P ), such as
G = U − TS − ξσ − ED (2.3)
where T is the temperature, S the entropy and U the internal energy. Then, according to the
second thermodynamic principle, the equilibrium (stable) state is determined by the values of
the corresponding variables which minimize such energy. For a phase transition in temperature
with no external pressure (σ = 0) and field (E = 0), the thermodynamic potential reduces to
the Helmholtz free energy, that is
F = U − TS (2.4)
The main idea behind the Landau theory is that, in the vicinity of a phase transition, the
free energy can be expressed as a power series of the order parameters. The minimization of
the Landau free energy then gives the Helmholtz free energy.
Specifically, in the so-called “proper” ferroelectrics, the polarization (or equivalently the
polar distortion) is taken as first order parameter of the expansion. In the specific case of
perovskite oxides, such expansion concerns the energy of the high-symmetry non-polar phase,
under the hypothesis that the expansion remains valid above and below the phase transition
temperature. This corresponds to the fact that non-centrosymmetric structure can be obtained
from the high-symmetry structure by means of small distortion.
Let us exemplify the approach considering that the strain is zero and the polarization is
directed along one of the cartesian direction. Then the Taylor expansion of the energy is
F =1
2αP 2 +
1
4βP 4 +
1
6γP 6 (2.5)
where α is a temperature dependent parameter defined as α = a0(T − T0) with a0 a positive
constant and T0 the temperature at which α changes sign; γ is also a positive coefficient, while
β can take values both positive and negative, determining the nature of the transition and the
trend of the polarization.
If β > 0, then a second-order transition occurs at T = T0, and the free energy and the
polarization evolve continuously as a function of decreasing temperature: for T > T0 the
quadratic term is positive and the thermodynamic functional is a single well with its minimum

CHAPTER 2. FUNDAMENTALS OF PEROVSKITE OXIDES 26
0
0
0
0T=
0 0
Figure 2.3: (a) Free energy as a function of polarization for the paraelectric phase. (b) Free energyas a function of polarization for a ferroelectric material in a second-order phase transition at T > T0,T = T0 and T < T0. (d) and (f) are respectively the spontaneous polarization P and the dielectricsusceptibility χ as a function of temperature for a second-order phase transition. (c) Free energy as afunction of polarization for a ferroelectric material in a first-order phase transition at T > Tc, T = Tc
and T < Tc . (e) and (g) are respectively the spontaneous polarization P and the susceptibility χ asa function of temperature for a first-order phase transition. Adapted from Refs. [66, 59].
corresponding to the non-polar P = 0 phase; for T < T0 the quadratic term is negative and the
curve displays the typical double well shape with two minima at P = ±P0 [Fig. 2.3(b)]. The
spontaneous polarization P0 is estimated by the minimization procedure of the free energy F ,
such as ∂F/∂P = 0, while the susceptibility χ from the relations 1/χ = ∂E/∂P = ∂2F/∂P 2.
Being γ positive, the sixth order term in the expansion (2.5) can be neglected. The results are
P0 = ±√
a0β(T0 − T ) (2.6)
χ =
[a0(T − T0)]−1 if T > T0
[−2a0(T − T0)]−1 if T < T0
(2.7)
If β < 0, then a first-order transition occurs at T = Tc. With the negative quartic coeffi-
cient, even when T > T0 the free energy may have two extra local minima at P 6= 0. When
the temperature decreases, the polar state will drop in energy below that of the non-polar
state, becoming the thermodynamically favored configuration. The temperature at which the
polar and non-polar states will be energetically degenerate is the Curie temperature Tc, i.e.
the transition temperature. Tc exceeds T0 defined in the case of second-order transitions. At
any temperature between Tc and T0 the non-polar phase exists as a local minimum of the free
energy [Fig. 2.3(c)]. The most important feature of this phase transition is that the order pa-
rameter jumps discontinuously to zero at Tc [66], so that the first-order transition is also called
discontinuous transition. The observable fingerprint of this type of transition is the occurrence

CHAPTER 2. FUNDAMENTALS OF PEROVSKITE OXIDES 27
of a temperature hysteresis ∆T , i.e. the difference between the transition temperatures upon
cooling and heating of the crystal [67]. Trends for the free energy as a function of polarization
and for the polarization and dielectric susceptibility as a function of temperature are schemat-
ically shown in Fig. 2.3 both for the second- and first- order transitions.
In the case of phase transitions related to oxygen rotations, the same expansion of the
free energy can be made, in which the first order parameter is now φ describing the rota-
tions. Interesting systems are those in which the primary order parameter φ couples linearly
with the parameter P of second order now, driving thus the system to exhibit spontaneous
polarization as secondary effect. Such a mechanism is referred as “improper ferroelectricity”
[69]. Specifically, systems in which P linearly couples with only one independent primary order
parameter, like same type of rotations φ, such as ∼ λφ3P with λ a coupling coefficient, are
properly termed “improper ferroelectrics” [70]; systems in which P couples linearly with two
independent primary order parameters, like the “in-phase” φ+ and “out-of-phase” φ− rotations,
such as ∼ λφ+φ−P , are termed “hybrid improper ferroelectrics” [71]. Systems in which the
coupling is bi-quadratic, such as ∼ λφ2P 2, are termed “triggered” [72].
In order to properly take into account the contribution to the energy due to modification
of the cell shape and size induced by the structural distortions, the strain effect can be also
included as a secondary order parameter ξ in the energy expansion [92]. In particular, in the
case of ferroelectrics, this allows to properly take into account the polarization-strain coupling,
which is eventually responsible for the piezoelectric response. Using a simplified notation and
considering uniaxial strain, the elastic interaction introduces the terms
Cξ2 +QξP 2 (2.8)
where C is the elastic stiffness of the material and Q is the coupling coefficient between polar-
ization and strain. The second term takes into account the modification of the strain induced
by the polar distortion, i.e. by the polarization, and Q is referred as the electrostriction co-
efficient. Therefore, minimizing the energy with respect to the strain to find the equilibrium
condition, such as ∂F/∂ξ = 0, the resulting strain is
ξ = −QCP 2 (2.9)
Being the piezoelectric coefficient d defined as the linear variation of the strain with respect
to the electric field (1.1), it thus results that d ∼ QχP . According to this expression, for
ferroelectrics whose paraelectric phase is centrosymmetric, piezoelectricity originates from the
electrostrictive effect, spontaneous polarization, and the dielectric response [46, 68].

CHAPTER 2. FUNDAMENTALS OF PEROVSKITE OXIDES 28
As mentioned at the beginning of this section, the Ginzburg-Landau-Devonshire theory is
suited to reproduce and describe the temperature-dependent behavior of ferroelectric properties
at the macroscopic level. Nevertheless, this approach cannot provide description of the under-
lying physics, relying on the final macroscopic manifestation of such properties. Conversely,
such a capability is supplied by the first-principles theory (that will be introduced in Chap. 3),
accessing the physics and microscopic mechanisms which determine the appearance of those
properties. In particular, this is due to the provided precise description of the lattice dynamics
and electronic properties of the materials. However, this is in practice restricted to zero Kelvin.
Implemented fist-principles molecular dynamics (MD) simulations are still restricted to small
systems and time scale, being computationally demanding. A valuable alternative approach
is the effective Hamiltonian approach based on first-principles [73, 74, 75]. Similarly to the
Landau theory, such approach relies on the identification of the most important degrees of free-
dom governing the phase transition and the subsequent expansion of the energy with respect
to these degrees of freedom with coefficients initialized from DFT calculations.
2.3 Lattice dynamics
As mentioned in the previous section, the Ginzburg-Landau-Devonshire theory is a macroscopic
approach able to describe the behavior of the macroscopic observables around the phase tran-
sition. In the specific case of ferroelectrics, this approach consists in expanding the energy in
terms of the spontaneous polarization, considered as order parameter. Nevertheless, no access
to the microscopic mechanisms, such as atomic distortions giving rise to such polarization, can
be provided, and so a direct connection with the crystal lattice dynamics is missing in such
phenomenological description. In fact, at microscopic level, the condition for a crystal to be
stable against small deformations is that all the vibrational modes should have real frequencies
ω. Therefore, imaginary frequencies are associated with atomic displacements with respect to
which the reference structure is unstable.
In this respect, Cochran has been the first2 to analyze the problem of structural phase
transitions in the framework of the lattice dynamics [89, 90]. Focusing on ferroelectric phase
transitions, he considered one of the lattice mode as the basic variable, introducing the notion
of “soft-mode”. In particular, he associated the para-ferro transition with the softening of a
zone-center transverse optic (TO) phonon, which “freezes-in” below the transition tempera-
ture, giving rise to a dipolar moment in each unit cell: in the high-temperature paraelectric
phase, there is a lattice (polar) mode for which the frequency goes to zero on decreasing the
temperature toward the transition temperature Tc to generate the ferroelectric crystal struc-
ture. On the other side of the phase transition, as the phase boundary is approached with
increasing temperature in the ferroelectric phase, the lowest-frequency polar phonon become
2It should be noted that, actually, the concept of “soft-mode” was already introduced by Ginzburg in 1949[88].

CHAPTER 2. FUNDAMENTALS OF PEROVSKITE OXIDES 29
softer decreasing to zero near the transition temperature. The atomic displacements associated
with the soft mode are the same as the deformation of the structure in the low-temperature
phase [91, 93]. Then, the “soft-mode theory” has been widely accepted as general description
of structural phase transitions, which thus arise from the progressive softening of a specific
phonon mode with temperature, which condenses into the structure at the phase transition
[94, 95, 96]. Such mechanism is the one generally characterizing the so-called displacive phase
transition.
Figure 2.4: Schematic representa-tion of the behavior of the soft-modeω2 ∝ (T − Tc): at low temperatureT < Tc the soft-mode in the referencestructure is unstable, thus the struc-ture of the high-temperature phase isunstable. On increasing temperatureT , the anharmonic interactions add apositive contribution to the negativevalue of ω2
0 (Eq. 2.10): first, the fre-quency reaches zero at Tc; then, thefrequency becomes real for higher T .Adapted from Ref. [91].
In particular, Cochran suggested a temperature de-
pendence of the soft mode of the type ω2 ∝ (T −Tc). Thesoft-mode model is illustrated schematically in Fig. 2.4:
at T < Tc the structure of the high-symmetry phase is un-
stable with respect to the distortion to the low-symmetry
phase, and the frequency of the soft mode has an imagi-
nary value [91]. At the atomistic level, in fact, it results
that the temperature dependence of the soft-mode arises
from the anharmonic coupling of the soft mode with other
modes, giving rise to a renormalization of the harmonic
frequency [97, 59], such as
ω2 = ω20 +
kBT
2
∑
i
α4i
ω2i
(2.10)
where ω0 is the harmonic frequency of the soft mode
(which is negative, being the unstable mode), kB is the
Boltzmann constant and αi is the anharmonic coupling
coefficient of the soft mode with the mode i of frequency
ωi. The transition temperature Tc, being that at which
the frequency of the soft mode ω reaches zero, results
Tc = − 2ω20
kBα, with α =
∑
iα4i
ω2i
. The temperature depen-
dence of ω can thus be rewritten as
ω2 = −ω20
Tc(T − Tc) = ω2
0 −ω20
TcT (2.11)
The result of (2.11) is that the square of the phonon frequencies vary approximately linearly
with temperature. The frequency at T = 0 K corresponds to the harmonic value ω0, which can
be determined by solving of the dynamical equation of the crystal lattice.
The “soft-mode theory” thus results a bridge linking the microscopic lattice dynamics and
the macroscopic Ginzburg-Landau-Devonshire theory. In fact, it is possible to recognize an
equivalence between the α parameter in the energy expansion (2.5) and the square of the har-
monic frequency, both linearly depending on temperature and determining the occurrence of the

CHAPTER 2. FUNDAMENTALS OF PEROVSKITE OXIDES 30
phase transition. For displacive phase transitions, therefore, the Ginzburg-Landau-Devonshire
theory is strictly related to the soft-mode theory, and although the expansion parameters may
be obtained empirically, they can also be related to fundamental quantities accessible, for ex-
ample, from first-principles calculations [91].
2.3.1 The dynamical equation
As previously mentioned, we are interested here in small atomic displacements τ from the
paraelectric reference around the equilibrium configuration. Supposing such displacements are
small with respect to the lattice constant, so that it remains possible to work in the harmonic
approximation, and within the adiabatic approximation, in which it is considered that the
electrons are in their ground-state for any instantaneous ionic configuration, the energy of a
periodic crystal can be expanded in Taylor series around the equilibrium position up to the
second order as
Ee+i(Rak) = E
(0)e+i +
∑
akα
∑
bk′β
1
2
( ∂2Ee+i
∂τakα∂τbk′β
)
τakατbk′β (2.12)
where labels a and b refer to the unit cell, k and k′ to the atoms and α and β to the spatial
directions. By substituting Eq. (2.12) in the classical equation of motion for the nuclei, we
obtain
Mk∂2τakα∂t2
= −∂Ee+i
∂τakα= −
∑
bk′β
( ∂2Ee+i
∂τakα∂τbk′β
)
τ bk′β (2.13)
from which we can identify the force constants terms associated to a classical 3N harmonic
oscillators system. Specifically, the matrix of the interatomic force constants (IFCs) in real
space is defined as
Ckα,k′β(a, b) =( ∂2Ee+i
∂τakα∂τbk′β
)
(2.14)
For each atom in the periodic crystal there are 3 equations of motion of the type (2.13) with
general solution of the form:
τakα(t) = ηmq(kα)eiq·Ra
eiωmt (2.15)
for which the vibrations or normal modes of the ions (phonons) are identified by the wave
vector q compatible with the Born-von Karman boundary conditions. Replacing (2.15) into
Eq. (2.13), we have
−Mkηmq(kα)ω2mq = −
∑
bk′β
Ckα,k′β(a, b)ηmq(k′β)e−iq·(Ra−Rb) (2.16)
where we can recognize the Fourier transform of the force constant matrix element as
Ckα,k′β(q) =∑
b
Ckα,k′β(a, b)e−iq·(Ra−Rb) (2.17)

CHAPTER 2. FUNDAMENTALS OF PEROVSKITE OXIDES 31
Therefore, the displacement of the ions is described by the following dynamical equation:
∑
k′β
Ckα,k′β(q)ηmq(k′β) =Mkω
2mqηmq(kα) (2.18)
Equivalently, the normal modes are solution of the following eigenvalue problem:
∑
k′β
Dkα,k′β(q)γmq(k′β) = ω2
mqγmq(kα) (2.19)
with quantities connected as
Dkα,k′β(q) = Ckα,k′β(q)/√
(MkMk′) (2.20)
This quantity is called the dynamical matrix.
The square root of the eigenvalues, ωmq, of the equation (2.19) are the phonon frequencies
of mode m at wave vector q with associated eigenvector γmq. The ηmq are usually referred to
as the phonon eigendisplacements. They are normalized such that < η|M |η >= 1, with mass
matrixM =Mδkk′. Accordingly, eigenvectors and eigendisplacements are related as γ =√Mη.
Notice that the phonon frequencies ω2 are the eigenvalues of the dynamical matrix and
are therefore directly related to the Hessian of the energetics (2.12). Accordingly, a positive
value of ω2 (real ω) produces a positive curvature of the energy surface meaning that the
considered atomic positions correspond to a minimum of energy. In this case, the reference
structure of interest is therefore stable. Conversely, if the reference structure is not stable (i.e.
it is not the ground-state), there are atomic distortions that allow to decrease the energy and
for which the energy curvature at the origin is negative. Such pattern of distortion therefore
formally yields a negative value of ω2 (imaginary ω) and corresponds to crystal instabilities. The
atomic displacements pattern associated to such unstable mode is thus the one that is expected
to bring the system to a lower energy configuration, as it produces a negative curvature in
the energy of the reference structure. However, the determination of the optimal distorted
structure is actually dependent on higher-order terms beyond the harmonic approximation.
The fourth-order term in the distortion determines the gain of energy in the resulting double-
well energy profile. Additionally, the coupling of the polar distortion to the strain must be
considered to reproduce the ground-state correctly. For instance, if the strain accompanying
the polar distortion is not taken into account in PbTiO3, the resulting lower energy polar
structure would be a rhombohedral phase with atomic displacements along the [111] direction
instead of the correct tetragonal phase with displacements along the [001] direction [84, 93].
Such important role of polarization-strain coupling is also played in CaTiO3 and (Ba,Ca)TiO3
compounds analyzed in this thesis.
The computation of phonons frequencies in the reference structure of interest, for instance
in the high-symmetry cubic phase of the ABO3 perovskites, is therefore a powerful tool to

CHAPTER 2. FUNDAMENTALS OF PEROVSKITE OXIDES 32
easily identify eventual structural instabilities.
2.3.2 Ferroelectric and Antiferrodistortive distortions
Referring to the simple cubic Brillouin zone (BZ) (Fig. 2.2), the most common instabilities
occurring in the ABO3 cubic perovskites are related to polar zone-center and non-polar zone-
boundary distortions. The first ones usually result in ferroelectricity (FE) like in BaTiO3,
while the latters involve antiferrodistortive (AFD) distortions that preserve inversion symmetry,
including in rotations and/or tilting of the oxygen octahedra and/or antiferroelectric (AFE)
distortion like in CaTiO3 and CaZrO3. The coupling between different such modes produces
additional distortions as allowed by symmetry consideration, like in the typical example of
BiFeO3 [76, 77, 78].
More in detail, the polar distortion is related to an unstable mode at the Γ point of the cubic
BZ (Fig. 2.2), giving rise to a dipole moment in each unit cell. The corresponding irreducible
representation (irrep) is Γ−4 (notation refers to a system with origin at the B-site). If such
distortion is described as a cooperative motion around the center of mass of the system taken
as reference, it appears as an uniform displacements of cations against the oxygen octahedra, as
illustrated in Fig. 2.5(a). The ferroelectric distortion usually helps to optimize the coordination
environment of the B-site cation mostly to improve the B-O bonding, like in the case of
BaTiO3 and KNbO3 [82]. However, the FE distortion can also optimize the A-site coordination
environment if it involved a significant A-site component [81], like in the prototypical case of
PbTiO3 [83, 84] or CaTiO3 and in solid solutions such as K0.50Li0.50NbO3 [85] and (Ba,Ca)TiO3.
The latter analyzed in this thesis along with its parent compound CaTiO3.
Differently, the non-polar antiferrodistortive distortions are related to unstable modes at the
X , M and R points of the cubic BZ. In particular, distortions associated to oxygens rotations
arise from specific instabilities at M and R, giving rise to tilting of the BO6 octahedra relative
to one another as rigid corner-linked units [80], as illustrated in Fig. 2.5(b,c). Such tilting pro-
duces greater flexibility in the coordination of the A cation, while leaving the environment of
the B cation essentially unchanged [80]. In 1972, Glazer described such octahedral rotations in
terms of component tilts around the pseudo-cubic axes: the rotation around one of these axes
determines the rotation in the direction perpendicular to this axis, but successive octahedra
along this axis can rotate in either the same or opposite sense [80], giving rise to the so-called
“in-phase” and “out-of-phase” rotations respectively [Fig. 2.5(b,c)]. The associated irreps are
M+3 and R+
4 respectively (notation refers to a system with origin at the B-site). Specifically,
“in-phase” rotations correspond to a phonon mode at the M point, while the “out-of-phase”
rotations to that at R. The symbolic description of these tilted systems is known as Glazer’s
notation and it is of the type a#b#c#, in which each letter refers in turn to rotations around the
[100], [010] and [001] direction of the pseudo-cubic reference. If the amplitude of the distortion
is the same around different axes, the same letter is repeated. The superscript # can take the

CHAPTER 2. FUNDAMENTALS OF PEROVSKITE OXIDES 33
z x
yz
yx
A B O
(a) (b) (c)
Figure 2.5: Schematic visualization of the two main distortions in the ABO3 perovskites: (a)polar distortion arising from the Γ point of the cubic BZ consisting in the opposite motion of cationswith respect to oxygens. (b) Antiferrodistortive distortion arising from the M point of the cubic BZconsisting in “in-phase” rotation of oxygen octahedra around the z pseudo-cubic axis (a0a0c+ in theGlazer’s notation [79]). (c) Antiferrodistortive distortion arising from the R point of the cubic BZconsisting in “out-of-phase” rotation of oxygen octahedra around the z pseudo-cubic axis (a0a0c− inthe Glazer’s notation [79]).
Figure 2.6: Schematic diagram indicating the group-subgroup relationships between 15 tilt systems.Adapted from Ref. [80].
value 0, + or − indicating no rotation or “in-phase” and “out-of-phase” rotations respectively.
Accordingly, supposing only one “in-phase” rotation around the [001] direction the applied no-
tation can be a0a0c+, while if such rotation is “out-of-phase” the notation changes to a0a0c−.
According to the group-theoretical analysis presented in Ref. [80], through the linear combi-
nation of such rotations taken separately around each axis, 15 possible perovskite structures
connected to the Pm3m-cubic reference can be obtained (including the cubic reference itself).
The diagram connecting the allowed subgroups to the Pm3m-group is shown in Fig. 2.6.
A quite general remark is the seeming incompatibility between ferroelectricity and octahe-

CHAPTER 2. FUNDAMENTALS OF PEROVSKITE OXIDES 34
dral rotations. Indeed, most ABO3 perovskites with t < 1 crystallize in non-polar structures
with octahedral rotations. The most common non-polar structure occurring is the Pnma.
Nevertheless, these perovskites are unstable to both ferroelectric and octahedral rotation dis-
tortions in their cubic phase at T = 0 K. As found out by Benedek and Fennie in Ref. [81], the
suppression of ferroelectricity is generally due to the rotations themselves. However, in certain
systems, like CaTiO3 and CaZrO3, the complementary A-site displacement is also necessary
Moreover, in the specific case of Pnma, together with the M+3 and R+
4 modes related to the
two rotation patterns, the X+5 involving the A-site cation anti-polar displacement appears al-
lowed by symmetry, although stable in the reference cubic phase . This mode only becomes
energetically favorable when both M+3 and R+
4 are present. Such behavior has been classified
as “hybrid” improper-type [86, 87].
Hence, A-site displacements play an important role in the ferroelectric mechanisms of ABO3
materials. Although BaTiO3 is considered a prototypical example of ferroelectric compound
as being B-site driven with t > 1, there is a very small number of perovskites with t > 1.
Therefore, most perovskites not involving chemical mechanisms, such as second-order Jahn-
Teller distortion or lone pair active cations, would be A-site driven geometric ferroelectrics, if
their ferroelectric phases could be stabilized [81].
2.3.3 LO-TO splitting and Born effective charges
Following the initial picture of Cochran, nowadays, it is widely accepted that ferroelectricity
in perovskites results from a delicate balance between short-range (SR) repulsions, which favor
the cubic phase, and long-range (LR) electrostatic forces, which favor a ferroelectric state: a
ferroelectric instability takes place when the Coulomb interaction is sufficiently large to com-
pensate the short-range forces [61]. In fact, in ionic crystals and heteropolar semiconductors the
crystal lattice can be described as composed of charged ions interacting both with short-range
forces and long-range Coulomb forces. The associated dynamical matrix is obtained by direct
summation of short-range terms and long-range Coulomb terms. Specifically, the interatomic
force constants associated to the Coulomb interaction exhibit a dependence on the distance of
the type 1/d3, which is typical of a classical dipole-dipole (DD) interaction [142].
Actually, the dynamical matrix for polar crystal has a “non-analyticity” for q → 0, which
is responsible of the transverse-longitudinal splitting of optical phonons. In fact, in ionic crys-
tal, long-wavelength longitudinal (LO) and transverse (TO) optical modes exhibit different
frequencies and interaction with the macroscopic electric field involving the creation of electric
dipoles: in LO modes, the local field acts to reduce the polarization, producing an additional
restoring force which produces a stiffening of the mode. Conversely, in TO modes, the local
field acts to support the polarization producing the softening of the mode responsible for the
ferroelectric state [61]. Accordingly, the so-called “proper” ferroelectrics, such as BaTiO3, are
characterized to exhibit a ferroelectric ground-state due to a polar distortion which lowers the

CHAPTER 2. FUNDAMENTALS OF PEROVSKITE OXIDES 35
the energy of the nonpolar reference structure in zero macroscopic electric field, corresponding
to the unstable transverse optical (TO) mode. In turn, the longitudinal optical (LO) modes
are stable. Nevertheless, it is noteworthy to mention that a new class of ferroelectrics termed
“hyperferroelectrics” has been recently discovered. This new class of proper ferroelectrics also
exhibits the instability of a LO mode in addition to the TO mode instability, allowing the
polarization to persist in the presence of a depolarizing field [98].
A fundamental quantity monitoring the LR Coulomb interaction is the Born dynamical
effective charge Z∗k,αβ, which is conventionally defined as the coefficient of proportionality at
the linear order between the macroscopic polarization per unit cell created in direction β and
the displacement of atoms k in direction α, times the unit cell volume Ω0 [99]:
Z∗k,αβ = Ω0
∂Pβ
∂τk,α(2.21)
In the cubic structure of the ABO3 perovskites (Fig. 2.2), the Z∗ tensors of the A and B
atoms are isotropic, as they sit in centers of cubic symmetry. The O atoms are located at the
face centers and the associated tensor thus has two inequivalent directions either parallel or
perpendicular to the cubic phase. These two independent elements are then labelled as O‖ and
O⊥ in reference to the change of polarization induced by an atomic displacement parallel or
perpendicular to the B-O bonds [61].
A general feature in perovskite oxides is that the Born effective charges can deviate substan-
tially from the value of the ionic atomic charge, revealing eventual mixed ionic and covalent
character of bonds and producing large spontaneous polarization even for small distortions.
Specifically, Z∗(B) and Z∗(O‖) are anomalously large, while Z∗(A) and Z∗(O⊥) are close to
their nominal ionic value. Exceptions concern A-cations having an active lone-pair like PbTiO3.
Moreover, a strong correlation occurs between Z∗(B) and Z∗(O‖) as well as Z∗(A) and Z∗(O⊥),
due to the fact that a displacement of the oxygen in the direction parallel to the B-O bond
modulates the character of the bond itself, while a displacement in the perpendicular direction
modulates the A-O bond [100]. Specifically, anomalous Z∗(B) and Z∗(O‖) indicates that a
strong dynamic charge transfer takes place along the B-O bond under atomic displacements.
This is, in turn, related to the dynamical changes of hybridization between O 2p and B d states,
which determines the highly covalent character of the B-O bond [99].
The Born effective charge tensor so reflects the Coulomb interaction effect and can quantify
the LO-TO splitting. In fact, the interatomic force constant matrix can be separated into
two parts: the first is the Fourier transform of the IFC matrix previously introduced, but for
the specific case of q = 0, from which the interaction with the macroscopic the macroscopic
electric field has been excluded; the second contribution is an additional term which treats the
interaction with the eventual macroscopic field and can be expressed by means of the Z∗k,αβ. It

CHAPTER 2. FUNDAMENTALS OF PEROVSKITE OXIDES 36
is shown in Ref. [61] that the IFC matrix takes finally the form
Ckα,k′β(q → 0) = CTOkα,k′β(q = 0) +
4π
Ω0
∑
β′(Z∗k,β′αqβ′)
∑
α′(Z∗k,α′βqα′)
∑
α′β′ qα′ǫ∞α′βqβ′
(2.22)
The difference between the LO and TO frequencies for an ionic crystal arises from the second
term in Eq. (2.22) and generally there is no correspondence between individual TO and LO
phonon modes.
A relevant quantity revealing the significant role of the soft TO mode in the ferroelectric
state is the mode effective charge defined as [142]
Z∗TO =
∣
∣
∣
∣
∣
∑
k,β Z∗k,αβη
TOk,β
√
< ηTO|ηTO >
∣
∣
∣
∣
∣
(2.23)
The Z∗ for the soft mode is usually the largest one, being originated essentially from the large
Born effective charges. This means that the soft mode will couple most strongly with the
electric field. This is the case for BaTiO3, CaTiO3 and CaZrO3 reported in Table 5.6 in the
results part. However, most compounds have a large Z∗ for more than one modes. Therefore,
these modes will be eventually mixed by the Coulomb interaction in determining the optimal
ferroelectric state [100].
2.3.4 Interatomic Force Constants
Ferroelectricity is a collective phenomenon. In fact, an isolated atomic displacement in bulk
cubic ABO3 perovskite does not lower the energy of the system and thus does not produce a
structural instability. When one atom is displaced, a restoring force is induced and brings it
back in its initial position. However, this atomic displacement simultaneously induces forces on
the other atoms. It is only the additional displacement of some other atoms in this force field
that can lower the total energy of the reference structure and produce therefore the structural
instability [61]. This feature can be understood in terms of the interatomic and “on-site” force
constants defining the force associated to the atomic displacements. In Sec. 2.3.1, we have seen
that the force F akα along the direction α acting on atom k in cell a due to a displacement τ bk′β
of atom k′ in cell b is defined trough the IFC matrix Ckα,k′β in real space as
F akα = −Ckα,k′β(a, b)τ
bk′β (2.24)
For a pair of distinct atoms, the IFC can be interpreted as minus the harmonic spring constant
between them, so that negative values correspond to stable interactions, while positive values
imply destabilizing interatomic interaction. For the case of one single atom displacement, on
the contrary, the “on-site” force constants cannot be directly interpreted as the harmonic spring
constant. However, positive values correspond to stable interactions, while negative values to

CHAPTER 2. FUNDAMENTALS OF PEROVSKITE OXIDES 37
destabilizing ones. In the specific case of most ABO3 perovskites, the “on-site” force constants
are all positive and, therefore, it is only the cooperative motion of different atoms that can
decrease the energy of the crystal and generate an instability.
Moreover, the specific role of the dipole-dipole (DD) interaction can be separated from the
one of the short-range (SR) forces, pointing out that ferroelectric instabilities are the results
of destabilizing DD long-range interactions, sufficiently large to compensate the SR forces as
previously discussed [188].
The analysis of the IFCs thus helps to identify the energetically favorable coupling in the
displacements and elucidate the origin of the unstable phonon branches [102]. In this way, the
access to the IFCs can be considered as an useful tool to identify at atomistic level the key
mechanisms responsible for the final manifestation of macroscopic properties, resulting thus
complementary to the Landau approach. In this regard, a systematic analysis and comparison
of the dynamical properties is reported in the results part for the pure ABO3 compounds and
related solid solutions studied in this thesis.
2.4 Functional properties:
the Dielectric and Piezoelectric response
The interest in ferroelectric oxides for technological applications is not only related to their
switchable spontaneous polarization, but also to their polarization-related properties, such as
large dielectric and piezoelectric responses. Such features can be directly related to the pres-
ence of low-frequency polar phonons, which dominate the properties, producing large lattice
responses with high sensitivity to mechanical and electrical boundary conditions. In fact, certain
responses can diverge near the phase boundary (i.e. around the phase transition temperature)
as the corresponding soft-mode frequency goes to zero [92, 93].
2.4.1 Dielectric permittivity
For insulators, the static dielectric permittivity tensor is the coefficient of proportionality be-
tween the macroscopic displacement and electric fields in the linear regime [142], such as
Dmac,α =∑
β
ǫαβEmac,β (2.25)
In general, ǫαβ includes both electronic ǫ∞αβ and ionic contributions taking the form [142]
ǫαβ = ǫ∞αβ +4π
Ω0
∑
m
Sm,αβ
ω2m
(2.26)

CHAPTER 2. FUNDAMENTALS OF PEROVSKITE OXIDES 38
where ωm is the phonon-frequency of the mode m and Sm,αβ is called mode-oscillator strength
tensor and defined as [142]
Sm,αβ =∑
kα′
Z∗k,αα′ηmq=0(kα
′)∑
k′β
Z∗k′,ββ′ηmq=0(k
′β ′) (2.27)
with Z∗ being the atomic Born effective charges and ηmq=0 the eigendisplacement associated
to the center-zone mode m. From 2.25 and 2.27, it is clear that compounds with TO modes
combining a high polarity, measured via the coupling of the dynamical charges Z∗ and TO
modes eigendisplacements, i.e. Z∗k,αα′ηmq=0, and low frequency will exhibit a large dielectric
response. As previously introduced via the notion of mode effective charge (2.23), in ABO3
cubic perovskites, in fact, the soft mode is highly polar. In the ferroelectric phase, this gives
rise to a highly polar mode of low frequency that can strongly couple with an electric field and
be responsible for a huge dielectric coefficients. This is expressed, via the twice appearance of
the dynamical charges in the dielectric response formula [92].
2.4.2 Piezoelectricity
As already seen in the introductory chapter, the piezoelectric effect is the manifestation of a
linear coupling between electrical and mechanical fields [2]. When a piezoelectric material is
subjected to external mechanical stress, electric charges generate at the surface. Nevertheless,
despite its manifestation appears as surface effect, piezoelectricity is a bulk property [60].
The polarity associated to the created electric dipole depends on the direction of the applied
stress, that is compressive or tensile. Such effect relying on the conversion of mechanical to
electrical energy is the direct piezoelectric effect. The relationship between the induced electric
polarization P ind along the direction α and the applied stress σ is
P indα = dαβσβ (2.28)
where dαβ is the third-rank piezoelectric tensor [103], using the Voigt notation. Conversely,
when the material is subjected to external electric field, it is strained. Depending on the
direction of the electric field, the resulting strain can produce contraction or expansion of the
material. This effect is the indirect or converse piezoelectric effect. The associated mathematical
formulation is
ξβ = dαβEα (2.29)
where ξ is the strain tensor and the piezoelectric coefficients dαβ are the same as those in
Eq. 2.28 [103].
Two other equations are also used to link polarization to strain (in the direct effect) and

CHAPTER 2. FUNDAMENTALS OF PEROVSKITE OXIDES 39
stress to the electric field (in the indirect effect). Specifically, these equations are:
P indα = eαβξβ (2.30)
σα = eαβEβ (2.31)
where eαβ are also elements of a third-rank tensor. However, the eαβ and dαβ have different
units: eαβ is expressed in C/m2, while dαβ in pC/N . These two parameters are related to each
other via the elastic compliance [46].
Focusing on the eαβ piezoelectric coefficients (2.30), it can be decomposed into “clamped-
ion” and “internal-strain” contributions as in the following [104]
eαβ =∂P ind
α
∂ξβ
∣
∣
∣
∣
η
+∑
k
∂P indα
∂ηk,α
∣
∣
∣
∣
ξ
∂ηk,αξβ
(2.32)
where the first term corresponds to the piezoelectric response where the ionic coordinates η stay
unchanged and the second term to the one from the ionic displacements (the internal strain).
The final explicit form highlighting the relationship with the phonon modes is then
eα,µν = e0α,µν −1
Ω0
∑
m
∑
k,β Z∗k,αβη
mkβ
∑
k,β gµνkβη
mkβ
ω2m
(2.33)
where gµνkβ are parameters related to the internal strain coupling [92]. Similarly to the dielectric
response, Eq. (2.33) shows that the ionic contribution to the piezoelectric response is large if
the mode involved combines high polarity, via the Z∗k,αβη
mkβ term, and low frequency, via the
1/ω2m contribution. Additionally, it can be larger if that mode in the ferroelectric state exhibits
strong coupling with strain, via the gµνkβηmkβ term.
Piezoelectricity being a property involving polar structures, all ferroelectric materials are
also piezoelectrics. In particular, perovskite oxide ferroelectrics, which exhibit high sensitivity
to changes in strain state, show highly-performing piezoelectric properties arousing big interest
for technological applications. As a main result obtained by Fu and Cohen [52], high piezoelec-
tric response in ferroelectric perovskites can be related to an easy rotation of polarization in
presence of applied electric field. In particular, the existence of intermediate polar phases in the
phase diagram, which link states with different orientations of the polarization and separated
by low energy barrier, appears as an important feature for the material to exhibit an enhanced
piezoelectric response.
A winning approach in optimizing and tuning the intrinsic piezoelectricity of the ABO3
perovskite structure is the mixing of different parent oxides via atomic substitution of the A
and/or B sites, leading to the formation of solid solutions of general formula (A,A′)(BB′)O3.
The most extensively studied and performing system at present is, in fact, the Pb(Ti,Zr)O3
solid solution: the first parent compound, PbTiO3, is ferroelectric with tetragonal phase, while
the second one, PbZrO3, exhibits an antiferroelectric (AFE) ground-state. However, the AFE

CHAPTER 2. FUNDAMENTALS OF PEROVSKITE OXIDES 40
is destabilized by the partial atomic substitution of Zr by Ti atoms, favoring a rhombohedral
phase for low concentration of Ti, and a tetragonal phase for higher Ti-concentration. At the
phase boundary, where the two phases meet (which occurs around 50%), an enhancement of
the piezoelectric response is observed. In fact, at that point in the phase diagram, an applied
electric field can easily induce a transition between the rhombohedral and tetragonal phases
going through monoclinic phases, with associated large strain response and rotation of polar-
ization [48, 49, 105]. A similar mechanism concerns BCTZ, of interest here. In fact the end
members in the compositional line of the phase diagram are (Ba,Ca)TiO3 and Ba(Ti,Zr)O3. In
(Ba,Ca)TiO3 the original rhombohedral ground-state of BaTiO3 is destabilized by the partial
atomic substitution of Ba by Ca, favoring a tetragonal phase, while Ba(Ti,Zr)O3 preserves the
rhombohedral ground-state for low Zr-concentration. At the proximity of the phase bound-
ary line of the ferro-ferro transition an outstanding piezoelectric response has been, indeed,
measured [44, 51, 106].
2.5 Conclusions
In this chapter we have had an excursus on the main features of bulk ABO3 perovskites with a
particular focus on the ferroelectric oxides. The aim was to provide all the necessary knowledge
and explanation of the main physical properties investigated in the results part for a clear
understanding of them. Necessary complementary explanations of the used method will be
introduced in the next chapter.
From such an overview, we can summarize a global background like in the following: the
perovskite structure adopted by this class of ABO3 compounds exhibits the tendency to struc-
tural distortions in order to improve the bonding properties between the cations and oxygens.
This behavior manifests in structural phase transitions as a function of temperature. Specif-
ically, polar and/or antiferrodistortive distortions are the ones producing the energy lowering
of the system with respect to the cubic reference structure, which is therefore unstable to such
pattern of distortions.
The microscopic origin of such instabilities relies on a delicate balance between short-range
and long-range interactions. In particular, most of these compounds are characterized by
peculiar charge transfers when the atoms are displaced because of the usual mixed ionic-covalent
character of their bonding, resulting in anomalous effective charges. Such behavior is responsible
for the important Coulomb interaction, able to compensate the stabilizing short-range forces
and to produce a structural ferroelectric instability.
The presence of an unstable phonon mode at the Γ point of the cubic Brillouin zone and
the associated negative curvature at the origin of the adiabatic energy surface for a given
pattern of polar atomic displacements are thus the fingerprint of the ferroelectric instability.
Similarly, instabilities at the edge points of the cubic BZ to anti-polar atomic displacements
and/or oxygens rotations are the fingerprint of the antiferrodistortive instabilities.

CHAPTER 2. FUNDAMENTALS OF PEROVSKITE OXIDES 41
Directly related to this ground-state behavior of ferroelectrics is the softening of the polar
mode with the temperature, which is responsible for the enhanced dielectric and piezoelectric
responses of these compounds. Additionally, ABO3 compounds allow it easily to tune and
optimize such functional properties by means of chemical modifications of the parent ABO3
system, such as via partial atomic substitutions at the A and/or B sites. Such kind of modifi-
cations of the physical properties when going from the parent ABO3 compound to (A,A′)BO3
and A(B,B′)O3 solid solutions will be analyzed in detail in the results part.

Part II
Method

Chapter 3
Density Functional Theory: a general
overview
In the previous chapter, we have seen that ABO3 ferroelectric perovskites are characterized
by complex mechanisms related to their specific structural and chemical properties leading to
competing interactions, which manifest in various functional properties. Therefore, accurate
and quantitative insight into such properties is essential for the understanding of the observed
behavior and optimization of properties. In this respect, first-principles calculations based on
Density Functional Theory (DFT) have yielded several breakthroughs in the understanding of
the underlying physics in such a systems.
DFT is likely the most commonly used approach for the study of the electronic structure,
as it determines the ground-state energy of the system by minimizing the one-body density
functional. The electronic charge density plays the central role. It succeeds in describing
structural and electronic properties for a wide class of materials. Additionally, complementary
implementations, like the calculation of the polarization via the Berry phase formalism and
the merging with the perturbation theory (DFPT), have expanded its range of application and
success. Moreover, DFT is computationally efficient and well implemented in many different
codes.
In the following we provide a general overwiev of DFT and related implementation used all
along the present thesis.
3.1 Many-body Schrodinger equation and the adiabatic
approximation
The peculiarity of density functional approach in its practical implementation is to rely on one-
electron Schrodinger equation with a local effective potential in the study of the ground-state
properties of the many-electron systems.
Considering a system of N electrons, the time-independent Schrodinger equation takes the
43

CHAPTER 3. DENSITY FUNCTIONAL THEORY 44
form
HΨ = EΨ (3.1)
where H is the Hamiltonian describing all the interactions of the system, E is the total energy
of the system and Ψ is the many-body wave function, which depends on the position of each
electron and each nucleus in the system. The full Hamiltonian for the system of electrons and
nuclei can be expressed as
H = − ~2
2me
∑
i
∇2i −
∑
I
~2
2MI∇2
I +1
2
∑
i 6=j
e2
| ri − rj |+
1
2
∑
I 6=J
ZIZJe2
| RI −RJ | −∑
iI
ZIe2
| ri −RI |=
= Te + TN + Vee + VNN + VeN (3.2)
where Te and TN refer to kinetic energies of electrons and nuclei respectively, and Vee, VNN ,
VeN are the interaction potential terms; indices i, j and I, J refer to the electrons and to the
nuclei respectively.
If we consider the mass of nuclei to be large in comparison to that of electrons, so that the
inverse term 1/MI can be regarded as “small”, then the nuclear kinetic operator can be ignored
in the total Hamiltonian (3.2) and the nuclei can be considered as fixed at the positions R.
Hereafter R is a shorthand notation indicating the set of nuclear coordinates RI. Similarly,
the shorthand notation r indicates the set of electrons coordinates ri. This is the so-called
Born-Oppenheimer or adiabatic approximation. Then, the kinetic energy of the nuclei can be
used to determine the lattice dynamics in the harmonic approximation.
Within the adiabatic approximation, the so-called electronic adiabatic Hamiltonian, He(R; r),
can be written as
He(R; r1, r2, . . . , rN) = Te + Vee + VNN + VeN = Te + V (R; r1, r2, . . . , rN) (3.3)
where the variable R appears as parameter, rather than as a quantum dynamical observable.
The Schrodinger equation within the adiabatic approximation becomes
He(R; r1, r2, . . . , rN)Ψn(R; r1, r2, . . . , rN) = En(R)Ψn(R; r1, r2, . . . , rN) (3.4)
where the electronic wave function Ψn(R; r1, r2, . . . , rN) and eigenvalues En(R) depend on the
parameter R and the subscript n summarizes the electronic quantum numbers. The eigenvalues
En(R) define the so-called adiabatic potential-energy surface.
In order to solve this many-body problem of electrons, that involves such a large number of
particles and the difficult electron-electron interaction, further approximations must be applied.

CHAPTER 3. DENSITY FUNCTIONAL THEORY 45
3.2 The Hohenberg-Kohn theorem
Let’s consider a system of N interacting electrons, without spin polarization for the moment.
Starting from previous Eq. 3.3, it is convenient to decompose He into the sum of an “internal”
and an “external” part, which refer to the kinetic energy of electrons plus the electron-electron
interactions and the electronic-nuclear Coulomb interactions respectively. The nucleus-nucleus
interaction VNN can be ignored as it is not relevant for the description of the electrons problem.
With rearrangement of notations, we have
He = Hint + Vext (3.5)
where Hint = Te + Vee and Vext = VeN . Vext is the only variable of such many-electrons prob-
lem. The Hohenberg-Kohn theorem state that there is a one-to-one correspondence between
the ground-state density of a N electron system and the external potential acting on it [107]:
the electronic density n(r) in the ground-state is a functional of the external potential, n[V (r)],
and, conversely, the external potential is a unique functional of n(r), V [n(r)] [108]. The demon-
stration of this theorem presented in their seminal paper [108].
A straightforward consequence of the Hohenberg-Kohn theorem is that the ground-state
energy is uniquely determined by the ground-state charge density, or, equivalently, the total
energy of the system can be written as a functional of the density:
E[n(r), Vext(r)] = T [n(r)] + Vee[n(r)] +
∫
dr n(r)Vext(r) =
= F [n(r)] +
∫
dr n(r)Vext(r) (3.6)
where F [n(r)] is a universal functional of n(r) containing the kinetic energy and the electron-
electron interactions, i.e. it does not depend on Vext. By applying the variational principle to
the energy functional (3.6), it result that the ground-state energy is minimized by the ground-
state charge density, and its minimum gives the exact ground-state energy of the many-body
electron system.
In this way, DFT exactly reduces the N interacting particles problem to the determination
of a function n(r) of three-coordinates. However, some approximations are required to estimate
the unknown functional F [n(r)].
3.3 The Kohn-Sham equations and the Effective one-
electron potential
In 1965 Kohn and Sham [109] developed an approximation scheme to exploit the Hohenberg-
Kohn theorem by including exchange and correlation effects. They proposed to replace the

CHAPTER 3. DENSITY FUNCTIONAL THEORY 46
many-body electron problem by an alternative fictitious independent-particles problem. The
concept is to map the system of interacting particles into a set of fictitious particles moving in
an effective potential, with the same ground-state electronic density.
Within this framework, the density of the system is defined by the one-electron wave function
ψi(r) as
n(r) =occ∑
i
|ψi(r)|2 (3.7)
The total electronic energy in term of the density n(r) is written
E[n] =
∫
dr n(r)Vext(r) +e2
2
∫ ∫
drdr′n(r)n(r′)
|r− r′| + Ts[n] + Exc[n] (3.8)
where the first integral represents the interaction between the electrons and the fixed ions,
the second integral term represents the Coulomb interaction energy of an electronic cloud of
density n(r) (Hartree energy EHartree[n]), Ts represents the kinetic energy of the non-interacting
electrons and Exc is the exchange and correlation energy, that contains all the electron-electron
interaction going beyond the classical Coulomb interaction.
For a given set of atomic positions, the ground-state is determined via the minimization of
Eq. (3.8) under the orthonormalization constraints
< ψi|ψj >= δij (3.9)
This provides the total energy of the system and the associated electronic density.
In practice, the variational calculation of the functional (3.8) with respect to n(r) leads to
the single-particle Schrodinger-like equation of the type
[
−~2∇2
2me+ Veff (r)
]
ψi(r) = ǫiψi(r) (3.10)
where ǫi and Ψi(r) are the so-called Kohn-Sham eigenvalues and eigenfunctions respectively.
Veff is the effective one-electron potential, also called self-consistent potential [141], associated
to the Hohenberg-Kohn ground-state charge density of the interacting many particles potential:
Veff(r) = e2∫
dr′n(r′)
|r− r′| + VeN(r) + Vxc(r) (3.11)
where the extra term Vxc(r) is called exchange-correlation potential and is given by the func-
tional derivate
Vxc(r) =∂Exc[n]
∂n(r)(3.12)
Equations (3.10), (3.11), (3.7) have to be solved in a self-consistent way: one starts by
guessing a certain n(r) in order to construct Veff(r), and then finds a new n(r) from (3.10)

CHAPTER 3. DENSITY FUNCTIONAL THEORY 47
and (3.7). The initial and final density are then mixed by means of appropriate converging
schemes, until self-consistency is reached (i.e. when the initial and final densities are different
by less than a certain threshold).
Once the Kohn-Sham orbitals and energies have been determined, the exact total ground-
state energy (3.8) of the interacting electronic system can be written as
E0[n] =
occ∑
i
ǫi −∫
dr n(r)Vxc(r)− EHartee[n] + Exc[n] (3.13)
The Kohn-Sham equations are standard differential equations with a local effective poten-
tial Veff(r). Any difficulty in the resolution has been confined to the choice of a reasonable
exchange-correlation functional Exc[n]. Conceptually, the Kohn-Sham equations determine the
electron density and the ground-state energy. However, the eigenvalues ǫi in (3.10) are formal
Lagrange multipliers within the variational principle and don’t have any physical meaning.
The identification of ǫi with occupied and unoccupied one-electron states is however often per-
formed and empirically found to give a good results in many cases for the occupied states. On
the contrary, as DFT is a ground-state theory, the description of excited states is rather poor.
Indeed, on the one hand, the general result of DFT calculations is to underestimate the energy
band gap in semiconductors and insulators, independently on the exchange-correlation func-
tional Vex used in (3.11). On the other hand, the dispersion curves of valence and conduction
bands are described with good accuracy in many cases. However, the accuracy and capability
of DFT vary strictly as a function of the investigated physical system.
3.4 Approximations for the
Exchange-Correlation energy
3.4.1 LDA
The crucial quantity in the Kohn-Sham approach is the exchange-correlation energy Exc[n],
which is expressed as a functional of the density. Even though the exact definition of the
functional Exc[n] is very complex, the first suggestion came from Kohn and Sham themselves
[109]. Their ansatz was that the exchange-correlation Exc[n] can be reasonably approximated
as a local or nearly local functional of the density. They proposed the so-called local density
approximation, better known as LDA, which is particularly justified in systems with reasonably
slowly varying spatial density n(r). They approximated the functional Exc[n] with a function
of the local density n(r) writing down
ELDAxc [n] =
∫
dr n(r)ǫxc(n(r)) (3.14)

CHAPTER 3. DENSITY FUNCTIONAL THEORY 48
where ǫxc(n(r)) is the exchange-correlation energy per particle for a homogeneous electron
gas with density n at the point r. The exchange part can be obtained analytically from the
Hartree-Fock technique and it scales like [109]
ǫx = −3
4e2(3π2)1/3[n(r)]1/3 (3.15)
The expression of correlation energy has been estimated by means of different numerical
parametrizations [110, 109, 111, 112, 113, 114, 115], all of which lead to very similar total-
energy results [116].
As mentioned before, the LDA appears to give a well defined global minimum for the energy
of a non-spin-polarized system of electrons in a fixed ionic potential. Therefore, subsequent
works reformulated density functional theory in the local density approximation for spin depen-
dent systems, [117, 118]. Such extension is known as Local Spin Density Approximation (LSDA).
Traditional DFT is based on two fundamental theorems, according to which the ground-state
wave function is a unique functional of the electronic charge density and the ground-state energy
functional is stationary with respect to variations in the charge density. LSDA formalism can
include all these results in spin dependent cases by replacing the scalar effective one-electron
potential Veff in equation (3.11) with the spin dependent effective single-particle potential
V effσ (r) = e2
∫
dr′n(r′)
|r− r′| + VeN(r) + V xcσ (r) (3.16)
Here, the charge density n(r) is intended as the sum of spin densities n↑(r) and n↓(r) with
nσ(r) =occ∑
i,σ
|Ψi,σ(r)|2 (3.17)
where Ψi,σ(r) are the spin dependent Kohn-Sham one electron orbitals and the sum runs over
all occupied states with spin σ. To obtain a reasonable approximation for V effσ (r), the external
potential VeN(r) is considered as slowly varying and the electronic system dived into small
boxes. Within the box centered at r, the electrons can be considered to form a spin polarized
homogeneous electron gas of local density n(r) and the spin dependent exchange-correlation
potential is given by
V xcσ (r) =
∂(n(r)ǫxc(n↑, n↓))
∂nσ(r)(3.18)
Accordingly, the exchange-correlation energy functional can be still written in the following
form
ELSDAxc [n↑, n↓] =
∫
dr n(r)ǫxc(n↑(r), n↓(r)) (3.19)
For weakly correlated materials, such as semiconductors and simple metals, the LDA ac-
curately describes structural and dynamical properties: the correct structure is usually found

CHAPTER 3. DENSITY FUNCTIONAL THEORY 49
to have the lowest energy, while bond lengths, bulk moduli, and phonon frequencies are accu-
rate to within a few percent [119]. However, such accuracy appears in some cases as a serious
limitation. In perovoskite oxides, for instance, the ferroelectric instability is very sensitive to
pressure, and thus to the structural parameters. Additionally, LDA tends to underestimate
energy band gap in semiconductors and insulators by about 40% [120], and to overestimate
cohesive energies and bond strengths. The latter and its inability to properly describe strongly
correlated systems are the LDA biggest limitations. Therefore, gradient corrections to the LDA
have been developed.
3.4.2 GGA
There have been several attempts to construct improved functionals in order to go beyond
the local density approximation. A first alternative, but connected approach, have been the
Generalized-gradient approximations, better known as GGAs. The physical ideas that are the
basis for the construction of GGAs is to build a “semi-local” functional depending both on
the density at r and on its gradient. Accordingly, starting from the LSD approximation, the
exchange-correlation functional Exc[n] within GGAs is approximated by the form [121, 122, 123]
EGGAxc [n↑, n↓] =
∫
dr f(n↑, n↓,∇n↑,∇n↓) (3.20)
where f is a parametrized analytic functions.
GGAs usually improve the accuracy of the local spin-density (LSD) approximation in elec-
tronic structure calculations, namely provide a better description of total energies, cohesive
energies, energy barriers and structural properties by correcting bond strengths and lengths
with respect the basic local density functionals. Different derivations and formal properties of
various GGAs have been developed. For detailed descriptions of different GGA and meta-GGA
functionals refer to Refs. [121],[124]-[130]. Among them, the most known and used is the
one designed by Perdew, Burke and Ernzerhof in 1996, the so-called PBE functional, in which
all parameters improving the LSD approximation are fundamental constants. Derivation and
properties of such functional are presented in their famous paper [122]. The general form for
the PBE exchange-correlation functional including nonlocality is
EGGAPBExc [n↑, n↓] =
∫
dr nǫunifx (n)Fxc(rs, ζ, s) (3.21)
where n is the electron density, ǫunifx is the exchange energy of a uniform electron gas (3.15) and
Fxc(rs, ζ, s) is the enhancement factor over local exchange [121], with rs the local Seitz radius
(n = 3/4πr3s), ζ = (n↑ − n↓)/n the relative spin polarization and s = |∇n|/[2(3π2)1/3n4/3] a
dimensionless density gradient [122].
However, cases in which GGAs, and so the PBE, overcorrect LSD predictions, such as lattice
constants, could occur [131]. As for the previous case of LDA, such inaccuracy can be dramatic

CHAPTER 3. DENSITY FUNCTIONAL THEORY 50
especially for ferroelectrics which are extremely sensitive to volume. The worst results concern
volume and strain of relaxed tetragonal PbTiO3 [132]. A considerable improvement for solid
systems has been achieved via the so-called “WC” functional constructed by Wu and Cohen in
2006. Using the PBE correlation functional, they reformulated the exchange part of the PBE
enhancement factor (3.21) relying on the fact that solid systems usually have valence electron
density varying more slowly than electron densities of atoms and molecules. In their work
[133], they show that WC predicts highly accurate volumes, strains, and atomic displacements,
whereas LSD and PBE underestimate and overestimate these values, respectively. In particular,
the recovered agreement with experiments for the case of PbTiO3 is surprising. Moreover, they
also show results for relaxed rhombohedral BaTiO3.
According to the high capability in reproducing properties of ferroelectric materials, we used
therefore the GGA-based WC functional for all our calculations.
3.5 Practical Implementation
Despite the Adiabatic Approximation and the Density Functional Theory reduces the many-
body problem to an equivalent effective single-electron problem in frozen-in configurations of
nuclei, there still remains the task of treating a huge number of non-interacting electrons within
the static potential of a huge number of nuclei. Two associated difficulties thus arise: a wave
function should be calculated for each electron; since each electronic wave function extends
over the entire solid, the basis set required to expand each wave function is infinite [116]. Such
difficulties are overcome in periodic systems, like the ones of interest here, satisfying the Bloch’s
theorem.
The ABINIT package
Various first-principles based on DFT have been implemented in different codes and softwares.
The one used to obtain all the results in this thesis is ABINIT, a package whose main pro-
gram allows to calculate the ground-state total energy, charge density and electronic structure
of electrons-ions systems within Density Functional Theory, using pseudopotentials (or PAW
atomic data) and a plane waves basis. Additionally, ABINIT also allows to perform optimization
of the geometry according to the definition of forces and stresses in the DFT; implementation
for molecular dynamics simulations are also available. Moreover, thanks to an advanced im-
plementation of the Density Functional Perturbation Theory DFPT, it is possible to calculate
phonons at every point within the Brillouin zone of the analysed structure as well as to calculate
Born effective charges, dielectric tensors, piezoelectric tensors, polarization. The latter quantity
is attainable with the implementation of the Berry phase theory. Many other properties are
achievable by means of other developments. In addition to the main ABINIT code, different
utility programs for post-processing treatment of data are provided. Detailed descriptions can

CHAPTER 3. DENSITY FUNCTIONAL THEORY 51
be found in Refs. [156, 157, 158, 159].
In the following basic descriptions of some practical implementations for the usage of DFT
as well as of DFPT as exploited by ABINIT are provided.
3.5.1 Bloch’s Theorem and Plane wave basis set
For infinite periodic solids obtained by imposing periodic boundary conditions, the electronic
wave functions ψn,k(r) can be related to the product of a plane wave function of wave vector
k and a cell periodic function un,k(r)
ψn,k(r) =1√NΩ0
eik·run,k(r) (3.22)
where N is the number of unit cells repeated in the Born-von Karman periodic box, and Ω0
is the volume of the unit cell. Specifically, un,k(r) satisfies the lattice periodicity condition:
un,k(r) = un,k(r + R) for any R belonging to the Bravais lattice. As a consequence, un,k(r)
can be expanded in terms of a discrete set of plane waves whose wave vectors G are vectors
belonging to the reciprocal lattice of the crystal and defined by G ·R = 2πm with m integer
(i.e. discrete Fourier transform). The electronic wave function thus can be expanded as
ψn,k(r) =1√NΩ0
∑
G
cn,k(G)ei(k+G)·r (3.23)
An infinite plane wave basis set is required to expand ψn,k(r). However, in practical calculations,
the expansion can be truncated to include only plane waves that have a kinetic energy smaller
that a chosen “cut-off energy”, namely ~2
2m|(k+G)|2 ≤ Ecut. Such truncation introduces a
computational error. However, the amplitude of such error can be reduced by increasing the
value of Ecut until the calculated total energy reaches a chosen convergence.
Similarly, the accuracy of calculations also rely on the sampling of the Brillouin zone as the
use of the Bloch functions is associated with integration over the periodic k-space. In principle,
electronic wave functions for an infinite number of k points should be calculated However,
electronic wave functions at k points that are close to each other are mostly identical, so that it
possible to represent ψn,k(r) over a region of k space by that at a single k point. In such a way
calculations are performed for a finite number of k points [116]. As a consequence, different
sampling methods have been developed among which the so-called “Monkhorst-Pack” is the
most used [134, 135, 136]. Of course, the total energy will converge as the density of the k
points increases, and the error due to such sampling then approached zero, like in the case of
the cuff-energy for the plane waves basis set expansion. Therefore, specific convergence tests
on the k point sampling and Ecut have to be performed for any compound of interest.
3.5.2 Pseudopotential approximation

CHAPTER 3. DENSITY FUNCTIONAL THEORY 52
Figure 3.1: Schematic illustration ofall-electron (solid lines) and pseudoelec-tron (dashed lines) potentials and theircorresponding wave functions. The ra-dius at which all-electrons and pseu-dopotential values match is designatedrc. From Ref. [116].
Despite the computational advantages associated to the
plane waves basis, two major difficulties, one related to
the description of tightly bounded core states and the
other to the rapid oscillations of the wave functions of
the valence electrons in the core region, have required the
development of a joint approximation: the pseudopoten-
tial.
At the basis of such approximation, there is a first
observation referred as “frozen-core” approximation, ac-
cording to which the physical and chemical properties
of solids are usually essentially dependent on the va-
lence electrons, while the core electrons, which do not
participate to the chemical bonding, are only slightly
affected by the atomic environment. The pseudopoten-
tial approximation exploits this by removing the core
electrons and by replacing them and the strong ionic
potential by a fictitious potential acting on valence elec-
trons only such that the valence wave functions remain
unchanged beyond a given cutoff radius rc and are re-
placed by smoothly varying function inside the core region [116, 61], as illustrated in Fig. (3.1).
In practice, in order to further validate the frozen-core and pseudopotential approximations,
electrons from deep energy levels can be treated as valence electrons. This is what has been
done for the study of BaTiO3, CaTiO3, CaZrO3, and BaZrO3 (see Sec. 4).
As seen before, the total energy of the electronic system is a function of the electron density
(3.7). Therefore, it is necessary that outside the core region the pseudo wave functions and real
wave functions are identical both in their spatial dependences and in their absolute magnitudes,
so that the two wave functions generate identical charge densities. Pseudopotentials preserving
the charge are termed norm conserving. A list of references related to different pseudopotential
developments can be found in the review of Payne et al. [116].
The typical method for generating an ionic pseudopotential is to perform at first all-electron
calculations for an isolated atom and then, an analytical pseudopotential is fitted in order to re-
produce the real potential and wave functions outside the cutoff radius. It is then expected that
such potential is transferable to the solid systems, within which the frozen-core approximation
remains valid. The most general form for a pseudopotential is
Vps =∑
lm
|lm > Vl < lm| (3.24)
where |lm > are the spherical harmonics and Vl is the pseudopotential for angular momentum l
[116]. Vps using the same potential for all the angular momentum is called local pseudopotential,

CHAPTER 3. DENSITY FUNCTIONAL THEORY 53
while angular momentum dependent Vps is called nonlocal pseudopotential. The “Optimized
Norm-Conserving” pseudopotentials [137] used for the calculations in this work belong to the
nonlocal type.
VCA
The application of first-principles calculations to the study of disordered alloys and solid so-
lutions generally requires the use of the supercell approximation, namely to study one or
more atomic configurations in large cells with imposed periodic boundary conditions within
the framework of Bloch’s theorem. Such calculations, however, tend to be computationally
very demanding. In this respect, a less expensive approach has been developed to treat such
complex systems, that is the virtual crystal approximation (VCA). Within this approximation,
one studies a crystal with the primitive periodicity, but composed of “fictitious virtual” atoms
that interpolate between the behavior of the real atoms occupying alternatively the same site
[138]. By its nature, VCA is closely related to the pseudopotential approximation. In its general
formulation, the VCA operator equation for any type of pseudopotential is formally defined by
averaging the pseudopotentials of the combined homovalent elements, i.e. C1−xDx, on a specific
atomic site I as [138, 139]
V Ips[x] = (1− x)V C
ps + xV Dps (3.25)
where V Cps and V D
ps are the pseudopotentials of the combined C and D atoms and x the mixing
concentration at the site I.
Pioneering works [138, 139, 140] have demonstrated good accuracy for the VCA in some fer-
roelectric perovskite solid solutions, such as Pb(Zr0.50Ti0.50)O3 and BaxSr1−xTiO3. Relying on
these observations, we performed first-principles calculations using the VCA on the solid solu-
tions of interest in this thesis, such as (Ba,Ca)TiO3 and Ba(Ti,Zr)O3. However, the comparison
with complementary calculations based on the use of supercells and available experiments have
revealed severe limits to the applicability of the VCA for these systems. Detailed results and
explanations will be provided in specific sections of the results part.
3.6 Merging DFT and Perturbation Theory
As seen so far, many of the properties of interest in crystalline solids are related to the derivative
of the total energy E(R) with respect to adiabatic perturbations (mainly atomic displacements,
electric field and strain) around the equilibrium configuration. Within DFT, the simplest
method is a direct approach, called finite differences, in which a finite amplitude perturbation
is frozen into the system and the perturbed system is then compared to the unperturbed one.
Despite being rather straightforward computationally, such approach suffers from limitations
mostly related to incommensurability of some perturbations with the periodic lattice and limited
size used cells [141, 142, 143]. The merging of the perturbation theory and DFT, instead, has

CHAPTER 3. DENSITY FUNCTIONAL THEORY 54
brought several advantages in the description and treatment of perturbations. Such a method,
known as density functional perturbation theory (DFPT) had been first reported by Baroni,
Giannozzi, and Testa [141] for linear response to atomic displacements and then generalized to
other perturbations [144, 145, 146, 147]. A different algorithm, based on a variational principle,
has been then proposed by Gonze et al, generalizing previous formulations by making use of
the 2n+1 theorem [148, 149, 150].
3.6.1 Perturbative development
Within the perturbation theory, the basic idea is that all quantitiesX (X = H,En, ψn(r), n(r), etc.)
can be expanded in terms of a small external perturbation λ around the unperturbed state X(0),
as follow [149, 150]
X(λ) = X(0) + λX(1) + λ2X(2) + λ3X(3) + . . . (3.26)
where
X(n) =1
n!
dnX
dλn
∣
∣
∣
λ=0(3.27)
Focusing on the change in the unperturbed Hamiltonian of the system H(0) due to an exter-
nal perturbative potential, namely H(λ) = H(0) + Vext(λ), the perturbed Schodinger equation
to be solved takes the form
H(λ) |ψn(λ)〉 = En(λ) |ψn(λ)〉 ∀λ (3.28)
with the normalization condition
〈ψn(λ)|ψm(λ)〉 = δnm (3.29)
Inserting in Eq. (3.28) the expansion (3.26) as a function of λ, i.e.
H(λ) = H(0) + λH(1) + λ2H(2) + λ3H(3) + . . .
|ψn(λ)〉 = |ψ(0)n 〉+ λ |ψ(1)
n 〉+ λ2 |ψ(2)n 〉+ λ3 |ψ(3)
n 〉+ . . .
En(λ) = E(0)n + λE(1)
n + λ2E(2)n + λ3E(3)
n + . . .
and grouping terms with the same power of λ result in a set of equations of the type
for λ0 H(0) |ψ(0)n 〉 = E
(0)n |ψ(0)
n 〉for λ1 H(0) |ψ(1)
n 〉+H(1) |ψ(0)n 〉 = E
(0)n |ψ(1)
n 〉+ E(1)n |ψ(0)
n 〉for λ2 H(0) |ψ(2)
n 〉+H(1) |ψ(1)n 〉+H(2) |ψ(0)
n 〉 = E(0)n |ψ(2)
n 〉+ E(1)n |ψ(1)
n 〉+ E(2)n |ψ(0)
n 〉· · ·
Similarly, introducing the perturbative expansion of |ψn(λ)〉 in the normalization condi-

CHAPTER 3. DENSITY FUNCTIONAL THEORY 55
tion (3.29), the orthonormality relationships for the perturbed wave functions are
for λ0 〈ψ(0)n |ψ(0)
n 〉 = 1
for λ1 〈ψ(0)n |ψ(1)
n 〉+ 〈ψ(1)n |ψ(0)
n 〉 = 0
for λ2 〈ψ(0)n |ψ(2)
n 〉+ 〈ψ(1)n |ψ(1)
n 〉+ 〈ψ(2)n |ψ(0)
n 〉 = 0
· · ·
Previous expansions for the Schodinger equation and normalization condition then become,
at generic order i [148]
i
i∑
j=0
(H −En)(j) |ψ(i−j)
n 〉 = 0 (3.30)
i∑
j=0
〈ψ(j)n |ψ(i−j)
n 〉 = 0, i 6= 0 (3.31)
In order to determine ith-order correction to the energies, it is necessary to project on
〈ψ(0)n | the Schodinger equation of the ith-order of interest and to make use of the associated
relationships between the perturbed wave functions obtained from the normalization condi-
tion. Moreover, it is worthy remembering that the Hamiltonian is Hermitian. Proceeding, for
instance, for the first- and second-order derivatives, we obtain
E(1)n = 〈ψ(0)
n |H(1) |ψ(0)n 〉
E(2)n = 〈ψ(0)
n |H(2) |ψ(0)n 〉+ 〈ψ(0)
n |H(1) −E(1)n |ψ(0)
n 〉
Therefore, it results that to obtain the 1st-order correction to the energy, only the knowledge
of the 0th-order wave function is required; to obtain the 2st-order correction to the energy, the
0th- and 1st-order wave functions are required.
Alternatively, it is possible to develop as a function of λ the following equation
〈ψn(λ)|H(λ)−En(λ) |ψn(λ)〉 = 0 ∀λ (3.32)
Developing (3.32) up to the second-order perturbative expansion, another expression for
E(2)n is obtained, that is
E(2)n = 〈ψ(0)
n |H(2) |ψ(0)n 〉+ 〈ψ(1)
n |H(0) − E(0)n |ψ(1)
n 〉+ (3.33)
+ 〈ψ(0)n |H(1) −E(1)
n |ψ(1)n 〉+ 〈ψ(1)
n |H(1) − E(1)n |ψ(0)
n 〉
The general expression of the perturbation expansion, which allows to isolate specific ith-

CHAPTER 3. DENSITY FUNCTIONAL THEORY 56
order corrections is [148]
i∑
j=0
i∑
k=0
〈ψ(j)n | (H − En)
(i−j−k) |ψ(k)n 〉 = 0 (3.34)
and the extension of the previous observation is the “2n + 1 theorem”, which states that the
(2n+1)-order derivative of the eigenenergies can be calculated from the knowledge of the wave
function and its derivatives up to order n [148, 149]. Specifically, from the wave functions up
to order n, it is possible to construct the derivatives of the energy up to order 2n + 1. The
search for the wave functions of order n can be achieved either by minimization of the energy
functional of order 2n under the orthonormality constraints (3.31) or by direct resolution of
Eqs. (3.30) [150].
3.6.2 Density Functional Perturbation Theory
Having defined the general expression of the equations within the perturbation theory, the
application to the DFT formalism is straightaway. In fact, in previous sections, we have seen
that within DFT the search for the ground-state of the electronic system can be achieved either
by the minimization of the electronic energy functional with respect to the Kohn-Sham wave
functions |ψn〉
Eelψ(0)n =
occ∑
n
〈ψ(0)n | (T + Vext)
(0) |ψ(0)n 〉+ E(0)
xc [n(0)] (3.35)
under the constraint 〈ψ(0)n |ψ(0)
m 〉 = δnm, or by the self-consistent solution of Eq. (3.10), which
can be rewritten in a compact formulation, as
H(0) |ψ(0)n 〉 = [−1
2∇2 + V
(0)ext + V (0)
xc ] |ψ(0)n 〉 = E(0)
n |ψ(0)n 〉 (3.36)
with the exchange-correlation potential V(0)xc (r) = δExc[n(0)]
δn(r), and n(r) =
∑
n ψ∗n(r)ψn(r).
Therefore, the perturbed electronic energy functional to be minimized is
Eelψn(λ) =
occ∑
n
〈ψn(λ)|T + Vext(λ) |ψn(λ)〉+ Exc(λ)[n(λ)] (3.37)
under the constraint (3.29), 〈ψn(λ)|ψm(λ)〉 = δnm, or, alternatively, the perturbed Schodinger
equation to be solved is
H(λ) |ψn(λ)〉 = [−1
2∇2 + Vext(λ) + Vxc(λ)] |ψn(λ)〉 = En(λ) |ψn(λ)〉 (3.38)
with Vxc(r;λ) =δExc[n(λ)]
δn(r).

CHAPTER 3. DENSITY FUNCTIONAL THEORY 57
Then, the obtained in DFPT for the 1st derivative of the electronic energy is
E(1)el =
occ∑
n
〈ψ(0)n | (T + Vext)
(1) |ψ(0)n 〉+ d
dλExc[n
(0)]∣
∣
∣
λ=0(3.39)
and the 2nd order derivative arises from the minimization with respect to |ψ(1)〉 of the followingexpression
E(2)el ψ(0);ψ(1) =
occ∑
n
[〈ψ(1)n | (T + Vext)
(1) |ψ(0)n 〉+ 〈ψ(0)
n | (T + Vext)(1) |ψ(1)
n 〉] + (3.40)
+
occ∑
n
[〈ψ(0)n | (T + Vext)
(2) |ψ(0)n 〉+ 〈ψ(1)
n | (H − En)(0) |ψ(1)
n 〉] +
+1
2
∫ ∫
δ2Exc[n(0)]
δn(r)δn(r′)n(1)(r)n(1)(r′)drdr′ +
+
∫
d
dλ
δExc[n(0)]
δn(r)
∣
∣
∣
λ=0n(1)(r)dr +
1
2
d2Exc[n(0)]
dλ2
∣
∣
∣
λ=0
Detailed descriptions, formulas, implementations and applications are provided in Refs. [141,
148, 149, 150, 142, 143, 152, 119, 151].
3.6.3 Accessible ground-state quantities
By focusing on quantities associated with first- and second- order derivatives of the total energy
E with respect to atomic positions Rk, homogeneous strain ξ and homogeneous electric field
E perturbations, all the functional properties of interest can be defined, namely forces F ,
polarization P , stress σ, dynamical Born effective charges Z∗, interatomic force constants C,
indirect clamped-ion piezoelectric tensor e0, optical dielectric tensor ǫ∞, clamped-ion elastic
constants c0 and the internal strain coupling parameter g. Such a correspondence between
quantities via successive derivatives is reported in Table 3.1.
E 1st-order 2nd-order∂/∂R ∂/∂ξ ∂/∂E
∂/∂R F C g Z∗
∂/∂ξ σ g c0 e0
∂/∂E P Z∗ e0 ǫ∞
Table 3.1: Physical quantities related to first- and second-order derivatives of the total energy E.Adapted from Ref. [92].
In the following, we focus on the specific description of the nuclear forces F and sponta-
neous polarization P , while other physical properties, such as interatomic force constants, Born
effective charges, and dielectric and piezoelectric responses have already been introduced in the
previous Chapter [see Secs. (2.3.1), (2.3.3), and (2.4)].

CHAPTER 3. DENSITY FUNCTIONAL THEORY 58
Optimization of Ionic Positions: the Hellmann-Feyman theorem
In all the discussions related to DFT, no comment has been made about ionic positions, which
have been assumed fixed, in turn leading to the correct electronic ground-state through the self-
consistent relaxation of the electronic configuration. Actually, the determination of the lowest
energy configuration for a given system also relies on the relaxation of the ionic positions and
the size and shape of the unit cell. In many cases, the atomic configurations are known from
experimental data, such as X-ray scattering or neutron diffraction, and they can be used as
initial guess to find the minimum of the total energy as a function of atomic positions.
The equilibrium geometry of the system is given by the condition that the forces acting on
individual ions I, given by differentiation of the adiabatic potential-energy surface E(R) (3.4)
with respect to the nuclear position RI , vanish:
FI = −∂E(R)
∂RI= 0 (3.41)
In practice, the calculation of the equilibrium geometry relies on computing the first derivative of
the Born-Oppenheimer energy surface. Such results arise from the application of the Hellmann-
Feyman theorem to the interacting electronic-nuclear system. This theorem states that the
gradient depending on a parameter λ along which to move to minimize the energy is obtained
from the expectation value of the derivative of the Hamiltonian, as
〈ψλ|∂Hλ
∂λ|ψλ〉 =
∂Eλ
λ(3.42)
It is worthy recognizing that such formulation corresponds to the first-order derivative of the
energy previously introduced.
In this specific case the parameters λ are the coordinates R of the nuclei in the electronic
adiabatic Hamiltonian (3.3). Therefore, derivation of both sides of Eq. (3.4) with respect to
RI reduces to the derivation of the electrons-nuclei VeN interaction potential and Coulomb
nuclei-nuclei ENN repulsion energy, obtaining
FI = −∇RIE = −
∫
dr n(r)∇RIVeN(r)−∇RI
ENN (3.43)
Thus, the force acting on a given nucleus I depends on the negative gradient of the elec-
trostatic potential energy originated from all the other nuclei and the unperturbed electronic
charge density. Therefore, the forces on the nuclei should not be calculated until the electronic
configuration is near at its ground-state: each time that the positions of the ions or the size and
shape of the cell are changed, the electrons must be brought close to the ground-state of the
new ionic configuration in order to calculate forces (and stresses) of the new ionic configuration
[116]. In practice, this means that for each step in the relaxation of the ionic configuration, the
relaxation of the electronic configuration to obtain the ground-state density must be performed.

CHAPTER 3. DENSITY FUNCTIONAL THEORY 59
The Hessian matrix of the Born-Oppenheimer energy surface is thus obtained by differen-
tiating FI with respect to nuclear coordinates,
∂2E(R)
∂RI∂RJ
= − ∂FI
∂RJ
=
∫
∂n(r)
∂RJ
∂VeN(r)
∂RI
dr +
∫
n(r)∂2VeN(r)
∂RI∂RJ
dr +∂2ENN
∂RI∂RJ
(3.44)
Eq. (3.44) therefore shows that the calculation of the Hessian matrix, which is referred as the
matrix of the interatomic force constants (IFCs), requires the calculation of the ground-state
electron charge density n(r) as well as of its linear response to a distortion of the lattice,
∂n(r)/∂RI [119].
Polarization
As already discussed in the previous Chapter, the electric polarization P is one of the essential
quantities in the physics of dielectric materials, being related to electric permittivity, ferro-
electricity, dynamical effective charges, piezoelectricity, pyroelectricity and other phenomena.
Specifically, the presence of a spontaneous and switchable macroscopic polarization is the sig-
nature of a ferroelectric material. A knowledge of the periodic electronic charge distribution
in a polarized crystalline solid, cannot be used to construct a meaningful definition of bulk
polarization. In this way P wrongly results being dependent on the shape and location of the
unit cell of the investigated system [60]. In real materials, in fact, it is not possible to localize
unambiguously the electronic charge, mainly in the ferroelectric ABO3 oxides, which displays
a mixed ionic/covalent character of the bondings.
Experimentally, the approach of measuring spontaneous polarization is through the polar-
ization difference ∆P rather than direct measurements of “polarization itself” exploiting its
switchability: in a typical experiment, application of a sufficiently strong electric field switches
the polarization from P to −P . The quantity measured then corresponds to the difference in
polarization between the two zero-field values of P in the hysteresis loop; one can then equate
this difference to twice the spontaneous polarization [60].
Proceeding from the ambiguity in defining P as a single-value equilibrium property of the
crystal in a given broken-symmetry state, the theoretical microscopic theory of polarization has
also relied on differences in polarization between two different states, as suggested by Resta
[153, 154]. Within the adiabatic approximation at zero temperature, the basic assumption of
such theory is the existence of a continuous adiabatic transformation of the Kohn-Sham Hamil-
tonian connecting the two crystal states, under the hypothesis that (i) the transformation is
performed at null electric field, and (ii) the system remains an insulator [154]. By parametriz-
ing the transformation with a variable λ assuming values 0 and 1 at the initial and final states
respectively, the change ∆P can be expressed as
∆P =
∫ 1
0
dλ∂P (λ)
∂λ(3.45)

CHAPTER 3. DENSITY FUNCTIONAL THEORY 60
As an example, λ could be an internal coordinate of the system representing the rela-
tive displacements of sublattices in the periodic crystal. Such a case is representative of the
polarization induced by the zone-center polar phonon modes described in Sec. (2.3.2). This
approach applies both to transformations that conserve volume and shape of the cell and to
“cell-conserving” transformations [154].
The polarization P (λ) after integration with respect to λ (3.45) can be decomposed into
ionic and electronic contributions:
P (λ) = Pion(λ) + Pel(λ) (3.46)
The ionic term can be directly computed as
Pion(λ) =e
V
∑
k
ZkRk (3.47)
where Rk and eZk are the position and charge of the atom k and V is the volume of the cell. The
electronic polarization, instead, can be formulated by making use of the periodic Kohn-Sham
orbitals ψn(k, r;λ) and results
Pel(λ) =e
(2π)3ℑ∑
n
∫
dk 〈un(k, r)|∇k |un(k, r)〉 (3.48)
where the sum n runs over the occupied states. The latter form is then related to the Berry
phase [60]. Formally, the central result of the modern theory of polarization is that P defined
via the summation of (3.47) and (3.48) is only well-defined mod eR/V, called quantum of
polarization [154, 60], because of the translational invariance of bulk macroscopic property.
A quantitative and reliable estimation of the spontaneous polarizations in ferroelectrics can
be achieved by the use of the Born Effective Charges (Sec. 2.3.3), which takes into account the
contribution from the charges of both nuclei and electrons, by means of the following relation
Pα =1
Ω0
∑
k,β
Z∗k,αβτk,β (3.49)
with Z∗k,αβ = Z ion
k δαβ + Zelk,αβ [99, 155]. Such method can be a useful hint to find out the final
value of P from direct Berry phase calculations.
3.7 Conclusions
In this chapter we have had an excursus over the first-principles technique based on the Density
Functional Theory. The main general equations and approximations have been reported in order
to introduce the general method used for the determination of the physical properties discussed
and analyzed all along this thesis.

CHAPTER 3. DENSITY FUNCTIONAL THEORY 61
The basic approximations behind the access to the properties of materials at the atomic scale
are the Born-Oppenheimer approximation and the Hohenberg-Kohn theorem, which via the
variational principle allow to determine the ground-state electronic charge density of interacting
particles. This reduces the problem to that of one-electron, defining an effective potential. The
capability of the DFT to properly reproduce properties depends strongly on the form of the
exchange-correlation energy introduced in such potential. The first formulation has relied on
the local density approximation (LDA), but characterized by considerable inaccuracy in the
determination of some electronic properties. An improvement has been then made by the semi-
local generalized gradient approximations (GGA). Further developments due to the addition
of perturbation theory within DFT have allowed the possibility to access directly properties
associated to variations of the total energy by various perturbations. Accordingly, DFT and
DFPT have become a standard and reliable methods for the investigation of the properties of
solids.

Part III
Computational Results and Analysis

Chapter 4
Technical Details
4.1 Computational Details
We use the general framework of the density functional theory (DFT) (Chap. 3) to compute the
structural properties and the electric polarization. Dynamical and piezoelectric properties have
been calculated using Density Functional Perturbation Theory (DFPT) [142], as implemented in
the ABINIT package [156, 157, 158]. The exchange-correlation potential was evaluated within
the generalized gradient approximation (GGA) using the Wu-Cohen (WC) functional [133]
for all simulations. Optimized Norm-Conserving Pseudopotentials [137] have been employed
with the following orbitals considered as the valence states: 5s, 5p and 6s for Ba, 3s, 3p
and 4s for Ca, 3s, 3p, 4s and 3d for Ti, 4s, 4p, 4d and 5s for Zr and 2s and 2p for O.
The energy cutoff for the expansion of the electronic wave functions has been fixed to 45 Ha.
Before performing computationally demanding calculations on ordered supercells by using a
standard DFT approach, a first investigation has been performed using the VCA, which relies
on virtual atoms obtained from combination of the reference atomic pseudopotentials [138, 139],
as introduced in Sec. 3.5.2. In order to make proper comparative analysis, calculations have
been performed with lattice parameters obtained by first-principles for all the studied systems,
as experimental values are not available for all them. Accordingly, for the optimization of
the cubic perovskite structures, phonons and polarization calculations within VCA, we used
a 6 × 6 × 6 k-points mesh for the Brillouin zone sampling for which energy is converged to
0.5 meV . For the optimization of the polar P4mm, R3m and Amm2 and piezoelectric response
calculations different sampling from 8 × 8× 8 to 8× 6 × 6 were used. For the optimization of
the supercells and for the associated phonons calculations we used the 8×8×8 k-mesh. For all
the tetragonal superlattices we used 8× 8× 6 k-mesh sampling. In order to allow comparison
between different structures, energy will be reported in meV /f.u. (i.e. per 5 atoms). The
q-points for the phonon dispersion curves and IFCs of the four pure compounds included Γ, X ,
M , R and the Λ point halfway from Γ to R of the simple cubic Brillouin zone.
63

CHAPTER 4. TECHNICAL DETAILS 64
4.2 Structure of the parent compounds
The optimized lattice parameters of the cubic structure of the four parent compounds are
reported in Table 4.1. There, the atoms in the ABO3 perovskite structure are labelled according
to Fig 4.1. These values are used in Sec. 5.1 for the calculation of the phonon dispersion
curves and interatomic force constants. The obtained values are in excellent agreement with
experimental data for BaTiO3 and BaZrO3 [162, 163] (within 1%), whereas for CaTiO3 the
underestimation is of about 2% [164]. The larger error for CaTiO3 can be assigned to the fact
that the 0 K DFT results are compared to measurements at 1720 K. For CaZrO3 the optimized
lattice parameter overestimates the experimental value [165] of about 2%.
BaTiO3 CaTiO3 BaZrO3 CaZrO3
Present 3.975 3.840 4.184 4.099
Exp. 4.003 [162] 3.897 [164] 4.191 [163] 4.020 [165]
Table 4.1: Relaxed lattice parameter acell (in A) of the cubic structure of the four parent compounds.Experimental values are also reported for comparison.
4.3 Supercell structures
We have considered different supercells describing the Ca and Zr atomic substitutions in BaTiO3
and performed DFPT calculations on the corresponding relaxed high-symmetry paraelectric
structures.
For Ba7/8Ca1/8TiO3 and BaTi7/8Zr1/8O3, we have used the smallest reference structure
which is the cubic Pm3m (Oh1 ) with 40 atoms. The GGA-WC optimized lattice constants are
7.917 A and 8.003 A respectively (Fig. 4.2).
For Ba0.50Ca0.50TiO3 and BaTi0.50Zr0.50O3 three distinct geometric arrangements of the
40-atom cell were considered: columns of same cations along the [001] direction, layers of
same cations parallel to the [110] planes and rocksalt configuration, Fig. 4.2. The paraelectric
Structure Ba0.50Ca0.50TiO3 BaTi0.50Zr0.50O3
columnar a = b = 5.535 a = b = 5.752P4/mmm [001] c = 3.899 c = 4.104
layered a = b = 3.911 a = b = 4.098[110] c = 7.803 c = 8.125
Fm3m a = b = c = 7.825 a = b = c = 8.150
Table 4.2: Optimized lattice parameters (in A) of the tetragonal-P4/mmm and the cubic-Fm3mstructures for Ba0.50Ca0.50TiO3 and BaTi0.50Zr0.50O3 solid solutions. For the tetragonal P4/mmm wereport values related to the reduced 10-atom cell. The relations with respect to the 2× 2× 2 supercellare: (columnar) a=b=a(2×2×2)/
√2 and c=c(2×2×2)/2; (layered) a=b=a(2×2×2)/2 and c=c(2×2×2).

CHAPTER 4. TECHNICAL DETAILS 65
reference of the two first “ordered” structures are characterized by a tetragonal symmetry
within the P4/mmm (D4h1 ) space-group and they can be reduced by symmetry to 10-atom cell,
whereas the rocksalt configuration has the cubic symmetry within the Fm3m (Oh5 ) space-group.
Structural relaxation have been done on the 2×2×2 supercells (40 atoms) for each geometrical
ordering, whereas DFPT calculations and structural relaxation of lower symmetry structures
have been performed on the reduced 10-atom cell for the P4/mmm structures and on the 40-
atom cell for the Fm3m one. The optimized lattice parameters of the high-symmetry references
are reported in Table 4.2. Figures have been produced by using the VESTA package [219].

CHAPTER 4. TECHNICAL DETAILS 66
Figure 4.1: (Top) Schematic 3D-view of atoms. (Bottom) Positions in reduced coordinates of theatoms in the perovskite structure.
(a) (b) (c) (d)
(e) (f) (g) (h)
Ca
Ca
CaCa
Ca
Ca
CaCa
CaCa
Ca
CaCa
Ca
CaCa
Ca
Ca
Ca
Ca
CaCa
Ca
Ca
Ca
CaCa
Ca
CaCa
CaCa
CaCa
Ca
CaCa
Ca
CaCa
CaCaCa
CaCaCa
Ca
x y
z
Ca
Ba Ca Ti Zr O
Zr Zr
ZrZr
Zr
ZrZr
ZrZr
Zr Zr
Zr Zr
Figure 4.2: Schematic representation of different atomic ordering in 2× 2× 2 supercells for the twoinvestigated solid solutions. (Top) Sublattice of A cations in Ba1−xCaxTiO3. (Bottom) Sublatticeof B cations and oxygens in BaTi1−yZryO3. Ca and Zr atoms are labelled to help the visualization.(a,e) x, y = 0.125. (b,f) rocksalt order, (c,g) columnar order along the z axis and (d,h) layered orderperpendicular to z axis for x, y = 0.50.

Chapter 5
Parent compounds
We start our study by considering individually the BaTiO3, CaTiO3, CaZrO3 and BaZrO3
parent compounds. The dynamics and the energetics of these systems is fundamental to un-
derstand the key features of the related solid solutions. Compared to other ab-initio studies
on these systems, we report a careful analysis of the interatomic interactions, which helps to
identify the key mechanisms driving their properties.
BaTiO3 is one of the most studied perovskite, both from the theoretical [25, 166, 167, 168,
169] and experimental [170, 171, 172] points of view. This perovskite is characterized by a
tolerance factor t greater than 1, t ≃ 1.06 [173], that allows to predict a polar distorted ground-
state [173]. In fact, while stable at high temperature in the centrosymmetric cubic (Pm3m)
phase, it undergoes [172] ferroelectric structural phase transitions to a tetragonal (P4mm)
structure at ≃ 393 K, to a orthorhombic (Amm2) phase at ≃ 278 K and to a rhombohedral
(R3m) ground-state at 183 K.
CaTiO3, on the contrary, has a tolerance factor t smaller than 1, t ≃ 0.97 [173]. Accordingly,
this compound displays a non-polar orthorhombic (Pnma) ground-state. It exhibits at least two
observed phase transitions at high temperatures: from a cubic (Pm3m) to a tetragonal phase
(I4/mcm) at ≃ 1634 K and from a tetragonal (I4/mcm) to the orthorhombic ground-state
(Pnma) at ∼ 1486 K [164, 174, 175].
CaZrO3, that has t ≃ 0.91, was observed only in two different structures: the high tem-
perature cubic (Pm3m) form and its orthorhombic (Pnma) ground-state with the transition
temperature at ≃ 2170 K [177, 176, 178].
BaZrO3, with t ≃ 1.00 [173], is experimentally not known to undergo any structural phase
transition and remains in the paraelectric cubic phase down to 2 K [163].
In Sec. 5.1, we provide a comparison of the dynamical properties (phonon dispersion curves
and interatomic force constants) of the parent compounds in their cubic phase. Then, in
Sec. 5.2, we compare the energetics of various metastable phases of lower symmetry arising
from the condensation of individual and combined distortions related to the unstable phonon
modes identified in Sec. 5.1.
67

CHAPTER 5. PARENT COMPOUNDS 68
5.1 Dynamical properties
As introduced in Sec. 2.3.1, the identification of imaginary phonon frequencies and the corre-
sponding displacement patterns allow us to pinpoint the main instabilities behind the structural
phase transitions in our systems. Thus, we considered the cubic reference structure and we com-
puted the phonon dispersion curves along selected high-symmetry lines in the simple Brillouin
zone (Fig 2.2). The results are shown in Fig. 5.1.
The presence of imaginary phonon frequencies (shown as negative values in Fig. 5.1) reveals
the structural instabilities of the cubic phase. The nature of the corresponding transition is
usually determined by the character of the main unstable modes, and the related eigendis-
placement vectors indicate the pattern of distortion, which spontaneously brings the system
to more stable configurations. Furthermore, we complement this analysis with the calculation
of the interatomic force constants in real space. As we have seen in the previous chapters,
these constants are defined as Ckα,k′β(l, l′) = ∂2Etot/∂τ
lkα∂τ
l′
k′β, where Etot is the total energy
of a periodic crystal and τ lkα is the displacement of the atom k in the cell l along direction α
from its equilibrium position. Their interpretation has been introduced in Sec. 2.3.4. In our
analysis, we further separate the distinct contributions of the dipole-dipole interaction (DD)
and short-range forces (SR) in order to identify the key mechanisms that lead the system to
exhibit or not specific phonon instabilities. For a more detailed description of the physical
meaning and its practical implementation see Refs. [142, 152, 101].
In the following we address a systematic description of the phonon dispersion curves repro-
duced in Fig. 5.1.
5.1.1 BaTiO3
Ferroelectricity in BaTiO3 is known to be related to the Ti off-centering driven by an unstable
polar mode at Γ [168, 102]. This ferroelectric (FE) instability is such that it expand over the
entire Γ−X−M planes of the simple cubic Brillouin zone, as can be seen in Fig. 5.1(a). While
each atom is at a position stable against individual displacements (Table 5.1), the origin of
this distortion has to be primarily ascribed to the destabilizing Ti-O interaction, reflected in
the positive value of the interatomic force constant along the bond’s direction (Table 5.3). An
additional contribution comes from the strong interaction of subsequent Ti-atoms along the B-
B′ chain direction compared to the small value in the transverse component. These anisotropic
couplings give rise to a branch of unstable modes almost flat in the Γ − X − M plane and
highly dispersive along Γ − R. This reflects the chain-like nature of the instability in real
space. The polar distortion requires cooperative atomic displacement along Ti-O chains [168].
Furthermore, the negligible contribution of Ba-atom to the ferroelectric distortion, has to be
ascribed to its sizeable on-site force constant and very weak Ba-O1 coupling.
In Table 5.2, we also compare the eigendisplacements associated to the unstable F1u(TO1)
mode to those of the stable F1u(TO2) and F1u(TO3) ones and we report the related mode

CHAPTER 5. PARENT COMPOUNDS 69F
requen
cy (
cm-1
)
-300
-150
0
150
300
450
600
750
900
Γ X M Γ R M
Fre
quen
cy (
cm-1
)
-300
-150
0
150
300
450
600
750
900
Γ X M Γ R M
Fre
quen
cy (
cm-1
)
-300
-150
0
150
300
450
600
750
900
Γ X M Γ R M
BaTiO3 CaTiO3
CaZrO3BaZrO3
(a) (b)
(c)(q)
Fre
quen
cy (
cm-1
)
-300
-150
0
150
300
450
600
750
900
Γ X M Γ R M
Figure 5.1: Calculated phonon dispersion curves of BaTiO3 (a), CaTiO3 (b), BaZrO3 (c) andCaZrO3 (d) along different high-symmetry lines in the simple cubic Brillouin zone. Negative values offrequencies refer to imaginary frequencies (ω are in cm−1). The different colors indicate the differentatomic contributions in the corresponding eigenvectors as in Ref. [102] (red for the A atom, green forB atom and blue for O atoms).
effective charges, as described in Ref. [142]. The mode effective charge is giant for the unstable
mode in comparison to the others [100, 101]. In fact, the very anomalous Born effective charges
on Ti and O‖ combined through the specific pattern of eigendisplacements associated to the
TO1 mode produce a large spontaneous polarization. For the TO2 and TO3 modes, the motions
are coupled so that Ti and O generate polarizations that partly compensate.
5.1.2 CaTiO3
CaTiO3 displays two main non-polar instabilities at the R and M points of the cubic Bril-
louin zone related to antiferrodistortive (AFD) motions (ω ≃ 209i cm−1 and ω ≃ 198i cm−1,
respectively). These correspond to cooperative rotations of oxygen octahedron, around the
B-atoms, with consecutive octahedron along the rotation axis being in-phase at M (a0a0c+ in
Glazer’s notation [79]) and anti-phase at R (a0a0c−). As such, the M-instability appearing in
the phonon spectrum is a continuation of the instability at R, while in BaTiO3 it is a continua-
tion of the polar instability at Γ. The description of such AFD instabilities has been introduced
in Sec. 2.3.2.
In addition, there is an unstable mode at the Γ-point that is also polar. This FE instabil-
ity is now restricted to a region around the Γ-point highlighting a larger and more isotropic

CHAPTER 5. PARENT COMPOUNDS 70
ferroelectric correlation volume. This mode enables the condensation of a polar distortion.
However, the character of the corresponding ferroelectricity is rather different compared to
that in BaTiO3 where it is dominated by the Ti displacements (B-site ferroelectricity). In
fact, in CaTiO3, this instability turns out to be dominated by the Ca displacements (A-type
ferroelectricity) as can be seen from the eigendisplacements displayed in Table 5.2 and the red
color of the corresponding phonon in Fig. 5.1(b). Despite this important involvement of the
A-cation in the polar distortion, its Born effective charge is not strongly anomalous. This has
to be ascribed to the fact that the polar distortion of Ca is driven by a steric effect. In fact,
we already mentioned that CaTiO3 has t < 1. Therefore, the small size of the Ca ionic radius
allows its distortion in the cubic perovskite structure. Consequently, the involvement of the
oxygens in the distortion is inverted with respect to the BaTiO3 case, as the O2/3 lying on the
plane perpendicular to the direction of the distortion are now more involved than the apical
oxygen (see Table 5.2).
These results can be rationalized by looking at the effect of the substitution of Ba by
Ca on the “on-site” and interatomic force constants. In fact, the “on-site” force constant of
Ca as well as the A-A′ interaction are significantly smaller than the corresponding ones in
BaTiO3, while the “on-site” force constant of Ti is increased. Additionally, the destabilizing
A-O1 interaction (xx′, Table 5.3) become significantly positive in agreement with the opposite
direction of the respective atomic eigendisplacements (Table 5.2), whereas along the Ti-O1
chain a stronger repulsive interaction prevents an important participation of the B-cation to
the polar distortion.
These previous observations can be also related to the concurrent appearance of AFD dis-
tortions in the system. Although the IFCs between the reported pairs of oxygen are remarkably
similar in BaTiO3 and CaTiO3 (and also in BaZrO3 and CaZrO3 as we will see below), the
oxygens tilting is favored by the fast decrease of the oxygen “on-site” forces (linked to the
destabilizing A-O1 interaction) in the directions perpendicular to the B-O chains and to the
increasing stiffness in the parallel direction (Table 5.1). Moreover, the phonon dispersion curves
appear substantially flat along R−M suggesting the absence of coupling between the oxygens
in different planes, but, as can be seen in Tables 5.3 and 5.4, the transverse interactions are
far to be negligible. As proposed in Ref. [102], this could be due to the joint action of the A-O
coupling with a compensation between different interplane interaction of the oxygens (see also
Ref. [179]).
5.1.3 CaZrO3
CaZrO3 exhibits much more intricate phonon branches than CaTiO3. However, the dynamical
properties of both compounds show some similarities. As in CaTiO3, the strongest instabilities
in cubic CaZrO3 are the one at the R and M points of the Brillouin zone associated to AFD
oxygen rotations (ω ≃ 238i cm−1 and ω ≃ 233i cm−1, respectively). Also, the dispersion curve

CHAPTER 5. PARENT COMPOUNDS 71
along R−M appears completely flat.
Nevertheless, the lowest polar instability is no more confined at Γ, but the polar-antipolar
instability extends all over the cubic Brillouin zone. This reflects a FE instability more localized
in real space.
In CaZrO3, the distortion is fully driven by the A-cation (Ca) and the O2/3 anions. In
fact, Zr at the B-site does not participate to the polar distortion with subsequent reduced
participation of the apical O1 [see Table 5.2-(TO1 mode)]. Finally, the dynamical effective
charges of both Zr and O‖ appear less anomalous than in the titanates, resulting in a lower
value of the mode effective charge.
As before, these dynamical properties can be understood in terms of IFCs. In fact, the
“on-site” force associated to Ca and the in-plane “on-site” force of O are drastically reduced
while for Zr it is strengthened. This reflects the fact that, with respect to their high-symmetry
positions, the A-cation and the O2/3 anions are highly unstable, while the B-cation remains
almost fixed. Accordingly, the Ca-O1 interatomic force constants are largely dominated by
the dipole-dipole interaction, while the Zr-O1 interaction is strongly repulsive. The interplay
between all these features allows the understanding of the strong A-site driven character of the
instabilities. In fact individual Ca displacements are nearly unstable (Table 5.1).
A proper comparison of CaZrO3 an CaTiO3 with respect to PbZrO3 and PbTiO3 respec-
tively, can be done via the lattice dynamics analysis presented in Ref. [102].
5.1.4 BaZrO3
Starting from the analyzed dynamics in BaTiO3 and CaZrO3, the dynamical properties of
BaZrO3 are fairly predictable. The substitution of the Ti atoms with Zr on the B-site joined
to the presence of Ba on the A-site leads to the “quasi”-stability of the cubic phase, also
confirmed by steric arguments, since the tolerance factor is close to 1. In fact, unlike the
previous perovskite systems, the phonon spectrum of BaZrO3 shows only a very weak instability
at the R-point with associated phonon frequency ω ≃ 60.2i cm−1 and no unstable polar modes.
By looking at the specific quantities reported in Table 5.2, the softest polar mode (TO1)
displays the smallest polarity (Z∗) with respect to the corresponding modes in the other com-
pounds. Moreover, unlike Ti in BaTiO3, a tendency of Zr to decrease the spontaneous polar-
ization results from the specific combination of the associated pattern of distortion with the
dynamical charges. Conversely, the second stable polar mode (TO2), even if stiffer, displays
bigger polarity because of the additive contribution of Zr and O.
This behaviour can be justified by means of the force constants. In fact, the B-cation
and O, along the transverse direction, experience now increased “on-site” terms with respect
to BaTiO3. The Zr-O1 is then strongly dominated by the short-range forces. The A-cation,
conversely, shows an “on-site” force constant in between BaTiO3 and CaTiO3, but the A-O
interaction is still too weak to destabilize Ba (see Tables 5.1 and 5.3).

CHAPTER 5. PARENT COMPOUNDS 72
For all the four compounds, the interatomic force constants associated to the A−B cations
and to the O-O interactions have the same sign and order of magnitude. This trend points out
the key role played by the on-site force constants in generating different kinds of instabilities
according to the environment, which each atom experiences in the different perovskites. In
fact, changes in the A-O and B-O interactions (Tables 5.1 and 5.3) are primarily associated to
changes of those values.

CHAPTER 5. PARENT COMPOUNDS 73
Atom Direction BaTiO3 CaTiO3 BaZrO3 CaZrO3
A xx = yy = zz +0.0893 +0.0269 +0.0550 +0.0099B xx = yy = zz +0.1635 +0.2236 +0.2198 +0.2510O xx = yy +0.0711 +0.0432 +0.0396 +0.0171
zz +0.1454 +0.2624 +0.2135 +0.2909
Table 5.1: “On-site” force constants (in Ha/bohr2) related to different atoms in the cubic phase ofthe four bulk compounds. A positive value means that the atomic position is stable against isolateddisplacement of the considered atom.
BaTiO3 CaTiO3 BaZrO∗∗3 CaZrO3
Atom Born effective charge Z∗
A(+2) 2.751 2.575 2.732 2.623
B(+4) 7.289 7.188 6.099 5.903
O(−2)‖ -5.756 -5.730 -4.808 -4.862
O(−2)⊥ -2.142 -2.017 -2.012 -1.832
F1u(TO1)
ω (cm−1) 183.45i 136.21i 96.39 179.91iZ∗ 9.113 6.453 3.954 4.455
Eigendisplacements
A +0.0012 +0.0950 +0.0561 +0.1120B +0.0978 +0.0298 -0.0337 +0.0002O1 -0.1480 -0.0763 -0.0687 -0.0390O2/3 -0.0774 -0.1254 -0.1103 -0.1215
F1u(TO2)
ω (cm−1) 176.91 181.36 193.26 202.42Z∗ 1.937 5.344 5.784 3.268
Eigendisplacements
A +0.0547 -0.0922 -0.0228 -0.0823B -0.0800 +0.1116 +0.0781 +0.0698O1 -0.0715 -0.0189 -0.0353 -0.0039O2/3 -0.0793 -0.0421 -0.1068 -0.0940
F1u(TO3)
ω (cm−1) 468.91 589.62 503.07 610.29Z∗ 1.281 4.269 3.777 4.601
Eigendisplacements
A -0.0012 +0.0083 +0.0024 -0.0065B +0.0253 +0.0135 +0.0140 -0.0225O1 +0.1767 -0.2213 -0.2315 +0.2353O2/3 -0.1212 +0.0801 +0.0653 -0.0454
∗∗ BaZrO3 has no instabilities at Γ, whereas the TO1 mode
is unstable for BaTiO3, CaTiO3 and CaZrO3.
Table 5.2: Born effective charges (in |e|) of individual atoms in each parent compound followed bythe frequencies, mode effective charges, and eigendisplacements (< η|M |η >= 1 with M in amu), ofF1u(TO) phonon modes at Γ on the optimized cubic phase (Table 4.1). The mode effective charge is
defined as in Ref. [142], Z∗TO =
∣
∣
∣
∑k,β Z∗
k,αβηTOk,β√
<ηTO |ηTO>
∣
∣
∣

CHAPTER
5.PARENT
COMPOUNDS
74
BaTiO3 CaTiO3 BaZrO3 CaZrO3
Atoms Total DD SR Total DD SR Total DD SR Total DD SR
A−A′ (‖) -0.0115 -0.0054 -0.0061 -0.0085 -0.0056 -0.0029 -0.0094 -0.0062 -0.0032 -0.0071 -0.0064 -0.0007(⊥) +0.0039 +0.0027 +0.0012 +0.0040 +0.00281 +0.0012 +0.0130 +0.0106 +0.0024 +0.0042 +0.0032 +0.0010
B −B′ (‖) -0.0693 -0.0379 -0.0314 -0.0788 -0.0438 -0.0350 -0.0564 -0.0308 -0.0256 -0.0593 -0.0323 -0.0270(⊥) +0.0078 +0.090 -0.0111 +0.0084 +0.0219 -0.0135 +0.0071 +0.0154 -0.0083 +0.0065 +0.0162 -0.0097
B −O1 (‖) +0.0037 +0.2394 -0.2357 -0.0382 +0.2794 -0.3176 -0.0409 +0.1940 -0.2349 -0.0719 +0.2129 -0.2847(⊥) -0.0203 -0.0445 +0.0243 -0.0184 -0.0492 +0.0308 -0.0166 -0.0406 +0.0240 -0.0148 -0.0401 +0.0253
A−B (‖) -0.0298 -0.0220 -0.0078 -0.0266 -0.0242 -0.0025 -0.0281 -0.0212 -0.0069 -0.0244 -0.0221 -0.0023(⊥) +0.0139 +0.0110 +0.0029 +0.0150 +0.0121 +0.0029 +0.0130 +0.0106 +0.0024 +0.0133 +0.0111 +0.0023
A−O1 (xx′) -0.0022 +0.0119 -0.0140 +0.0108 +0.0125 -0.0017 +0.0058 +0.0129 -0.0070 +0.0141 +0.0126 +0.0015(yy′) -0.0042 -0.0059 +0.0017 -0.0055 -0.0062 +0.0007 -0.0051 -0.0064 +0.0013 -0.0056 -0.0063 +0.0007(zz′) -0.0111 -0.0160 +0.0049 -0.0116 -0.0177 +0.0061 -0.0105 -0.0154 +0.0049 -0.0107 -0.0167 +0.0060
O1 −O4 (xx′) -0.0020 -0.0033 +0.0013 -0.0022 -0.0035 +0.0012 -0.0019 -0.0034 +0.0014 -0.0020 +0.0012 +0.0078(yy′) +0.0018 +0.0016 +0.0002 +0.0014 +0.0017 -0.0003 +0.0018 +0.0017 +0.0001 +0.0012 +0.0016 -0.0003(zz′) +0.0093 +0.0118 -0.0025 +0.0107 +0.0139 -0.0032 +0.0070 +0.0096 -0.0026 +0.0078 +0.0110 -0.0032
O1 −O5 (xx′) -0.0004 +0.0016 -0.0020 -0.0009 +0.0017 -0.0026 -0.0009 +0.0017 -0.0026 -0.0013 +0.0016 -0.0028(yy′) -0.0004 +0.0016 -0.0020 -0.0009 +0.0017 -0.0026 -0.0009 +0.0017 -0.0026 -0.0013 +0.0016 -0.0028(zz′) -0.0339 -0.0236 -0.0102 -0.0379 -0.0278 -0.0101 -0.0345 -0.0191 -0.0154 -0.0372 -0.0219 -0.0153
Table 5.3: Interatomic force constants in (Ha/bohr2) between different pairs of atoms in their local coordinates system, xx′ (‖), yy′ (⊥) andzz′ (⊥) for ABO3 bulk compounds. Transverse (⊥) directions for some atomic pairs are degenerate. The two different dipole-dipole (DD) andshort-range (SR) contributions also reported.

CHAPTER 5. PARENT COMPOUNDS 75
Atoms
BaTiO3 CaTiO3
+0.0038 0.0000 0.00000.0000 −0.0091 +0.02840.0000 +0.0126 −0.0091
+0.0057 0.0000 0.00000.0000 −0.0120 +0.03220.0000 +0.0177 −0.0120
O1 −O2
BaZrO3 CaZrO3
+0.0039 0.0000 0.00000.0000 −0.0060 +0.02340.0000 +0.0110 −0.0060
+0.0051 0.0000 0.00000.0000 −0.0071 +0.02490.0000 +0.0137 −0.0071
BaTiO3 CaTiO3
−0.0007 −0.0007 +0.0013−0.0013 +0.0014 +0.0025+0.0007 +0.0007 +0.0014
−0.0007 −0.0006 +0.0017−0.0017 +0.0015 +0.0029+0.0006 +0.0005 +0.0015
O1 −O6
BaZrO3 CaZrO3
−0.0077 −0.0007 +0.0013−0.0013 +0.0012 +0.0021+0.0007 +0.0006 +0.0012
−0.0007 −0.0005 +0.0016−0.0016 +0.0013 +0.0023+0.0005 +0.0004 +0.0013
Table 5.4: Interatomic force constant matrix in (Ha/bohr2) between other pairs of oxygen in theCartesian coordinates system. Rows and columns of the matrices correspond, respectively, to x, y andz directions.

CHAPTER 5. PARENT COMPOUNDS 76
5.2 Energetics of metastable phases
In the previous section we have seen that the parent compounds can develop two types of
instability: a FE instability associated to a polar mode at Γ and AFD instabilities associated
to unstable modes atM and R. In particular, now we quantify the energy difference associated
to the condensation of the corresponding polar distortions and oxygen rotations with respect
to the cubic phase. The results are shown in Fig. 5.2. A careful crystallographic explanation
of the symmetry changes associated to these distortions can be found in Ref. [81].
R3m P4mmAmm2 P4/mbm I4/mcm R-3c Imma PnmaPm-3m
1
10
100
1000
log
|∆
E| (m
eV
/f.u
.)
BaTiO3CaTiO3CaZrO3BaZrO3
Figure 5.2: Energy landscape (in log scale) for BaTiO3 (red closed circles), CaTiO3 (blue closedsquares), CaZrO3 (pink closed rhombus) and BaZrO3 (green closed triangle). For each ABO3 per-ovskite, we report the energy gain with respect to the corresponding simple cubic phase, for differentoptimized phases allowed by dynamical properties (phonon spectra Fig. 5.1). Polar distortions, char-acterizing ferroelectric structures, and oxygen rotations, characterizing non-polar distorted structures,have been taken into account separately. All the structures have been fully relaxed within GGA-WCfunctional. Main features for the different structures are reported in Table 5.5.
5.2.1 BaTiO3
In BaTiO3 the energy sequence of the polar phases arising from the condensation of the polar
mode is in line with the experimental sequence of phase transitions when lowering the tem-
perature (Pm3m → P4mm → Amm2 → R3m). To be noticed is that the energy landscape
is relatively flat. The R3m ground-state is only 20 meV /f.u. below the paraelectric Pm3m
phase and the energy difference between the polar phases is ≃ 5 meV /f.u. Interestingly, the
anisotropy of the energy landscape (as well as of the polarization) is linked to the corresponding
polar mode [168] and remain qualitatively unaffected by strain relaxation [see Figs. 6.5(a,d) in
next chapter (Sec. 6.2)]. This is the signature of a relatively weak polarization-strain coupling
in BaTiO3 [187]. Accordingly, the calculated c/a ratio in the tetragonal phase is only ∼ 1.02.

CHAPTER 5. PARENT COMPOUNDS 77
Polar structures
Space group Notation Modes
P4mm (99) a0a0a1 Γ−4
Amm2 (38) a0a1a1 Γ−4
R3m (160) a1a1a1 Γ−4
Antiferrodistortive structures
Space-group Notation Modes
P4/mbm (127) a0a0c+ M+3
I4/mcm (140) a0a0c− R+4
Imma (74) a0b−b− R+4
R3c (167) a−a−a− R+4
Pnma (62) a−b+a− R+4 , M
+3 , X
+5
Table 5.5: Space-group and main active modes in the two allowed classes of distortions. By referringto the simple cubic Brillouin zone: polar motion is due to instabilities at Γ (0,0,0), oxygen tilting toinstabilities at M (12 ,
12 , 0) and R (12 ,
12 ,
12), and anti-polar motion to instabilities at X (12 , 0, 0) or to the
trilinear coupling with the two latter instabilities [81, 87], as in CaTiO3. The polarization directionassociated to the ferroelectric structures and Glazer notation associated to the antiferrodistortivestructures are also reported.
5.2.2 CaTiO3
Interestingly, in CaTiO3 the energy sequence of the polar phases, arising from the condensation
of the unstable polar mode, is reversed. In addition, the relative energy difference is larger than
in BaTiO3. In fact, the tetragonal P4mm structure is the lowest energy configuration among
the polar ones with a relative energy gain of about 70 meV /f.u. Moreover, unlike in BaTiO3,
we note that the initial instability is relatively isotropic and the strain relaxation is now crucial
to obtain the eventual anisotropy [see Figs. 6.5(c,f) in Sec. 6.2]. Accordingly, the calculated c/a
ratio in the tetragonal phase becomes ∼ 1.06. It is noteworthy that such large strain coupling
was previously reported in compounds with stereochemically active lone pair at the A-site like
PbTiO3 [84, 180] and BiFeO3 [181, 182]. However, the above indicates that it is a more generic
feature related to strongly A-type ferroelectricity.
Additional non-polar structures arising from the condensation of the unstable AFD modes
at M and R also appear as metastable or eventually stable. As usual in perovskites with
t < 1 [81], in fact, the ground-state corresponds to the Pnma (a−b+a−) structure which is
≃ −350 meV per f.u. below the reference cubic phase. One-tilt structures, such as P4/mbm
(a0a0c+) or I4/mcm (a0a0c−), and the two-tilts Imma (a0b−b−) are intermediate metastable
structures that appear ≃ 100 meV and ≃ 50 meV per f.u. above the ground-state, respectively.

CHAPTER 5. PARENT COMPOUNDS 78
5.2.3 CaZrO3
In CaZrO3 the energy sequence of both the polar and AFD phases is the same as CaTiO3, but
they are shifted down in energy becoming very spread. The AFD-Pnma ground-state is lower
by about −1 eV /f.u. than the Pm3m phase. This is in tune with the very high transition
temperature experimentally observed for the sequence Pm3m → Pnma, even if the phonon
frequencies related to the unstable modes are close to the ones in CaTiO3.
5.2.4 BaZrO3
For BaZrO3 we found competitive stable R3c (a−a−a−), Imma (a0b−b−) and I4/mcm (a0a0c−)
antiferroditortive structures. From phonon calculations performed on the three distorted struc-
tures, in fact, no instabilities have been found. Further details are provided in Appx. A.
According to the very tiny value of the instability in the cubic phase then [Fig. 5.1(c)], the
condensation of the oxygen rotations provides an energy gain relative to the cubic phase of
about ≃ 2.5 meV per f.u., while the three distorted phases have an energy that differs by less
than 0.2 meV /f.u. In spite of the negligible energy gain, the amplitude of the AFD distortion
is significant. The biggest distortion is appearing in the tetragonal phase with an angle of
rotation of ∼ 4 about the [001] direction.
5.2.5 Polar modes and ferroelectric phases
In order to interlock the optimized polar structures with the lattice dynamics, we evaluated the
contribution of each polar mode to the condensed distortion. The overlap matrix is reported
in Table 5.6. It is interesting to notice, that the three ferroelectric states are mostly due to the
condensation of the unstable optical mode for all the three perovskites BaTiO3, CaTiO3 and
CaZrO3, so that it is possible to establish a nearly one-to-one correspondence with the pattern
of distortion associated to the unstable TO1 mode and the displacements as obtained from the
structural optimization, while the contribution of the TO2 and TO3 modes remains very small.
An important remark is the huge difference in the total distortion τ between BaTiO3 and
the Ca-based perovskites, that allow for possible bigger spontaneous polarization in the latter
compounds even if the A-cation at play is not either stereochemically active or involved in the
hybridization with the oxygens.
5.3 Conclusions
The previous analysis of the dynamics and energetics associated to the four parent compounds
has emphasized some similarities and differences. In particular through the analysis of the
“on-site” and interatomic force constants, we have identified some key interactions tuning the
different dynamical and related properties. This is helpful for a better understanding of prop-

CHAPTER 5. PARENT COMPOUNDS 79
BaTiO3
P4mm Amm2 R3m
|τ | 0.188 0.209 0.214F1u(TO1) 0.993 0.975 0.971F1u(TO2) 0.110 0.087 0.129F1u(TO3) 0.032 0.194 0.228
CaTiO3
P4mm Amm2 R3m
|τ | 0.601 0.478 0.435F1u(TO1) 0.985 0.970 0.970F1u(TO2) -0.171 -0.203 -0.199F1u(TO3) 0.033 0.129 -0.143
CaZrO3
P4mm Amm2 R3m
|τ | 0.903 0.886 0.868F1u(TO1) 0.976 0.910 0.897F1u(TO2) -0.060 0.202 -0.208F1u(TO3) -0.067 -0.336 -0.197
Table 5.6: Overlap matrix between the total distortion τ of the three optimized polar structures andthe eigendisplacements ηi associated to the F1u(TO) modes of the optimized cubic phase, 〈ηi|M |τ 〉 =αi. The distortion τ has been normalized such that 〈τ |M |τ 〉 = 1, with M in atomic mass units,and results to be defined as τ =
∑
i=1,2,3 αiηi, with |τ | =√
〈τ |M |τ 〉. Since BaZrO3 has no polarinstabilities we report results only for BaTiO3, CaTiO3 and CaZrO3.
erties arising while mixing cations at the A- and B-sites in (Ba,Ca)TiO3 and Ba(Ti,Zr)O3
solid solutions, respectively. Additionally, we note that the parent BaTiO3 and CaTiO3 com-
pounds display inverted sequence of polar phases. Then, for the (Ba,Ca)TiO3 solid solutions,
the emergence of a region with strong competition between these phases and a crossing point
in energetics can be expected. This will be confirmed in the next chapter.
We will now present results coming from a systematic characterization of the latter systems
by also testing and comparing two different approaches: the “virtual crystal approximation”
(VCA) and supercell-based calculations.

Chapter 6
(Ba,Ca)TiO3 solid solutions
In the last few years, Ba1−xCaxTiO3 (BCT) has started to arouse curiosity in the experimental
community as the Ca off-centering seems to play an important role in stabilizing ferroelectricity
against chemical pressure effects [183, 184, 185]. In particular, in Ref. [184], Fu and Itoh
have characterized single crystals of BCT in a temperature range from 2 K to 400 K and
for compositions ranging from x = 0.00 up to x = 0.34. They found that the Curie point
is nearly independent of the Ca-concentration for the Pm3m → P4mm transition, whereas
there is a shift of the P4mm → Amm2 and Amm2 → R3m phase transitions toward lower
temperatures. Accordingly, the effect of Ca-substitution is the stabilization of the tetragonal
ferroelectric phase.
Let us now analyze the dynamics and energetics as predicted by means of first-principles
calculations. We first report results from the VCA approach in Sec. 6.1, then from the use of
supercells in Sec. 6.2.
6.1 VCA approach
6.1.1 Lattice parameter
First, we report the evolution of the lattice parameter of the Pm3m-cubic phase as obtained
from the structural optimization within VCA. Because of the reduced volume of CaTiO3 with
respect to BaTiO3 (Table 4.1), the lattice parameter decreases monotonically with the Ca-
concentration, but the trend deviates from the linearity of the Vegard’s law, as shown in
Fig. 6.1(a).
As for the pure compounds, for solid solutions we can define the tolerance factor as t =
(rA+ rO)/√2(rB + rO), with rA = (1−x)rBa+(x)rCa. Values of the ionic radii, ri, for the pure
atoms have been taken from Ref. [186]. For increasing x, t decreases from 1.06 to 0.97 reaching
1 at x = 0.6, as reported on top of Fig. 6.1.
80

CHAPTER 6. (BA,CA)TIO3 SOLID SOLUTIONS 81
6.1.2 Dynamical properties
We analyze the evolution of the lowest phonon frequencies at the high symmetry points of the
Brillouin zone of the cubic reference. DFPT calculations have been performed on the optimized
structures. We find that, for increasing Ca-concentration, the original polar instabilities of
BaTiO3 changes character by becoming confined to the center of the Brillouin zone (AFE
instabilities at X and M disappear), while the AFD modes due to oxygen rotations become
unstable, as shown Fig. 6.1(b). Changes in the phonon instabilities are linked to the evolution
of t. In fact, the polar instability dominates until t becomes smaller than one at which the AFD
rotational modes become largely unstable. Specifically, the lattice dynamics is BaTiO3-like for
0 ≤ x ≤ 0.2. The unstable polar mode at Γ is mainly sustained by the destabilizing Ti-O
interaction, while the A-O interaction stays mostly repulsive, resulting in the inactivity of the
A-site, as reproduced in Fig. 6.1(c,d,e). Accordingly, the instabilities at the X- and M-points
are also due to Ti-O polar motion. For 0.3 ≤ x ≤ 0.6, the scenario starts to change. The polar
instability becomes weaker as it results from the important reduction in the amplitude of the
associated frequencies. Particularly, the polar distortion remains unstable at Γ, while it becomes
progressively stable at X and M . These smooth changes can be related to smooth changes in
the type of interaction between the cations and the oxygens. A change of sign is observed
along both the Ti-O and A-O interaction that corresponds to a strong competition between
attractive and repulsive forces in determining the nature and character of the polar instability:
a reduction of the amplitude of the Ti-motion corresponds to increasing negative value of the Ti-
O interaction, while an increasing contribution to the polar distortion of the A-site arises from
positive values of the A-O interaction, as shown in Fig. 6.1(c,d,e). Finally, for 0.7 ≤ x ≤ 1.0, the
lattice dynamics becomes CaTiO3-like. Accordingly, instabilities related to oxygen rotations
appear at the M- and R-points of the cubic Brillouin zone and are more unstable than the
polar one at Γ. This situation results from strong destabilizing A-O interactions and largely
repulsive Ti-O interactions. Accordingly, the character of the polar distortion also changes by
becoming largely driven by the motion of the A-site with respect to the B-one.
Moreover, changes in the phonon behavior also affect the dynamics of the oxygens. The
increasing contribution to the distortion from the A-site, i.e. increasing long-range forces be-
tween the A-cation and oxygens, favors the motion of the planar oxygens with respect to the
apical one (labelled O2/3 and O1 in Fig. 6.1(e), respectively). Specifically, the contribution is
reversed when going from t > 1 to t < 1.
The latter analysis of the evolution of the dynamical properties when going from the BaTiO3-
rich region to the CaTiO3-rich one in the Ba1−xCaxTiO3 “virtual-system” reveals the presence
of two parallel mechanisms: the progressive weakening of the long-range forces between Ti and
O atoms in favor of their strengthening between the A-atoms and oxygens. In terms of character
of the phonons instabilities, this change corresponds to a smooth evolution from the B-driven

CHAPTER 6. (BA,CA)TIO3 SOLID SOLUTIONS 82
1.06 1.05 1.04 1.03 1.02 1.01 1.00 0.99 0.99 0.98 0.97 tolerance
factor
(b)
(e)
-200
-150
-100
-50
0
50
100
150
200
ω(c
m-1
)
Γ
XRM AFEM AFD
3.840
3.855
3.870
3.885
3.900
3.915
3.930
3.945
3.960
3.975
a (
Å)
VCAVegard law
AFD
AFE
FE
(a)
0.15
0.1
0.05
0
0.05
0.1
0 0.1 0.2 0.3 0.4 0.5 0.6 0.7 0.8 0.9 1
ηat
Γ(a
. u.)
Ba/Ca
x
TiO1
O2/3
0.040
0.030
0.020
0.010
0.000
0.010
IFC
s (T
i
O) ||
0.003
0.000
0.003
0.006
0.009
0.012
IFC
s (A
O) ||
(d)
(c)
Figure 6.1: Evolution of different lattice properties as a function of x-composition in Ba1−xCaxTiO3
as obtained by the use of VCA. (a) Cubic lattice parameter acell (in A). Vegard’s law has beenbuilt on the theoretical values of the cubic BaTiO3 and CaTiO3 reported in Table 4.1: a(x) =(1 − x)aBTO + (x)aCTO. (b) Trend of the lowest phonon frequencies at the high-symmetry pointsof the simple cubic Brillouin zone. Evolution of the total Ti-O (c) and A-O (d) Interatomic ForceConstants (IFCs in Ha/bohr2). (e) Evolution of normalized eigendisplacements (in a.u.) associatedto the unstable polar mode at the Γ-point of the simple cubic Brillouin zone. Lines are guide for theeyes.

CHAPTER 6. (BA,CA)TIO3 SOLID SOLUTIONS 83
into the A-driven distortions associated to the parents BaTiO3 and CaTiO3, respectively. The
reasons behind these two phenomena are also different and complementary. In fact, Ca-doping
of the virtual A-site produces: (i) varying interatomic force constants between the A-O atomic
pair in favors of destabilizing long-range forces sustained by the progressive lowering of the
A-cation stiffness when going from BaTiO3 to CaTiO3 (see Table 5.1); (ii) reduction of the
volume, that can be considered as increasing isotropic pressure on the ATiO3 system and,
therefore, shortening of the Ti-O bond lengths. The latter effect produces increasing stiffness
of Ti-atoms, that results in the change of sign of the Ti-O interatomic force constants and
associated weakening of the B-type ferroelectricity. In fact, as investigated at the first-principle
level in Refs. [187, 188, 189] and as it turns out when comparing graphs (a) and (c) reported in
Fig. 6.1, the balance between short-range and long-range forces between the Ti and O atoms is
strongly sensitive to pressure. At variant, the varying composition does not affect significantly
the A-B interaction, that in fact remains almost the same as in the pure parent compounds
(see Tables 5.3 and 6.1).
6.1.3 Energy landscape
As we previously did for the pure parent compounds, now that the main instabilities of BCT
“virtual-system” have been identified, we look at the energy competition between different
phases arising from the condensation of the corresponding modes in order to obtain an overview
of the energetics as a function of concentration. As shown in Fig. 6.2, the main effect of
−350
−300
−250
−200
−150
−100
−50
0
0 0.1 0.2 0.3 0.4 0.5 0.6 0.7 0.8 0.9 1
∆E
(m
eV
/f.u
.)
x
P4mm
Amm2
R3m
I4/mcm
R−3c
Imma
Pnma−18
−16
−14
−12
−10
−8
−6
−4
−2
0
0.1 0.2 0.3 0.4 0.5 0.6 0.7 0.8 0.9
P4mm
Amm2
R3m
Figure 6.2: Energy gain with respect to the simple cubic phase for different optimized structuresallowed by dynamical properties within VCA as a function of x-composition in Ba1−xCaxTiO3. Struc-tures properties reported in Table 5.5. The inset shows a zoom on the energetics of the polar phasesfor 0.1 ≤ x ≤ 0.9.

CHAPTER 6. (BA,CA)TIO3 SOLID SOLUTIONS 84
the Ca-substitution is to reduce the energy gain both between the three ferroelectric phases
and with respect to the cubic phase by making them strongly competitive, while additional
antiferrodistortive structures appear as metastable in the CaTiO3-rich region by providing a
non-polar ground-state.
Such behaviour proceeds from the evolution of the dynamical properties previously ana-
lyzed. In fact, an important energy competition between polar phases starts at x = 0.3, that
corresponds to the concentration where we observe the change of sign of the Ti-O IFCs [see
Fig. 6.2(c)]. Then, the energies of the polar phases smoothly converge to that of the cubic one
in line with the progressive weakening of the polar instability. Noteworthy is that the inversion
in the energy sequence of the three polar phases happens at x = 0.9 where we observe the
inversion of the dominant character of the polar instability between virtual A-cation and Ti
[see Fig. 6.2(e)].
Additional structures with oxygen rotations appear with an higher energy gain from x = 0.7
proceeding from the appearance of the related phonons instabilities in the cubic phase [see
Figs. 6.1(b) and 6.2]. It is also noteworthy that the contribution to the polar distortion arising
from the apical and planar oxygens is inverted from this point, with the dominant motions of
the latter ones (see Fig. 6.1(e)).
6.1.4 Polarization and piezoelectric response
Proceeding from the previous observation that for 0.0 ≤ x ≤ 0.6 the BCT “virtual-system”
experiences a progressive weakening of the ferroelectric instability and that no other phonons
are unstable, we now evaluate the evolution of the spontaneous , Ps, and piezoelectric coef-
ficients, dij. According to the VCA results, we performed calculations on the lowest energy
rhombohedral-R3m structure (Fig 6.2). Values are normalized to the calculated ones of pure
R3m-BaTiO3, that are PBTOs ≃ 38 µC/cm2 and dBTO
11 ≃ 76 pC/N , dBTO15 ≃ 270 pC/N and
dBTO33 ≃ 15 pC/N .
Specifically, in Fig. 6.3, we report Ps as obtained both via first-principles calculations by
means of the Berry Phase Theory [191] (blue circles) and via the Born effective charges by means
of the approximation Ps,α = 1Ω
∑
k,β Z∗k,αβ∆τk,β [99] (green rhombus). It results that Ps decreases
as function of increasing Ca-composition in tune with the decreasing energy gain associated to
the polar phases in this range of composition, i.e. the weakening of the polar instability detected
within VCA (Figs. 6.1 and 6.2). In order to clarify if changes in the polarization are mostly due
to varying effective charges or atomic distortions, we disentangled the two contributions. In
the first case, we kept constant the atomic displacements of pure R3m-BaTiO3 and took into
account the different effective charges associated to each BCT compositions (orange triangles).
In the second case, we kept constant the Born effective charges of pure R3m-BaTiO3 and
considered the distortion arising from different compositions (red circles). It results that the
evolution of Ps has to be widely ascribed to changes in atomic distortion in BCT “virtual-

CHAPTER 6. (BA,CA)TIO3 SOLID SOLUTIONS 85
0.4
0.5
0.6
0.7
0.8
0.9
1
1.1
1.2
P/P
B
DPuPuPu
x
1
1.2
1.4
1.6
1.8
2
0 0.2 0.4 0.6
di/di
11
15
33
1
1.5
2
2.5
3
3.5
4
4.5
0 0.2 0.4 0.6
ε
/ ε
!
ε11=ε
22
ε33
Figure 6.3: Evolution of polarization, piezoelectric and stress-free dielectric coefficients in therhombohedral-R3m phase as a function of x-composition in Ba1−xCaxTiO3 within VCA. Values arenormalized to the ones of R3m-BaTiO3: P
BTOs ≃ 38 µC/cm2; dBTO
11 ≃ 76 pC/N , dBTO15 ≃ 270 pC/N
and dBTO33 ≃ 15 pC/N ; εBTO
11 ≃ 208 and εBTO33 ≃ 11. Upper panel: variation of the polarization as
directly computed by Berry-phase calculations (blue circles) and by Born effective charges approxima-tion to disentangle the contribution of varying atomic charges and displacements. Lower panel: trendof the dij coefficient and stress-free dielectric response εij .
system” in such range of composition, as shown in Fig. 6.3 (top). In fact, this behaviour is in
line with the evolution of the eigendisplacements associated to the unstable polar mode at Γ
with a pronounced reduction of the titanium and oxygens motion Fig. 6.1(e).
Despite the decrease of polarization, the piezoelectric response increases with the Ca-
concentration (Fig. 6.3 bottom). This trend is due to the fact that the stress-free dielectric
response, εij, remarkably increases as well, as shown in the inset of Fig. 6.3. By writing down
the piezoelectric coefficient as dik =des,idEk
∝ (χj,kPs,l + Ps,jχl,k) [46] (Sec. 2.2), it is easier to
understand such a trend: near a phase transition, where the lowest-frequency polar mode, i.e.
the soft mode, goes to zero, the dielectric response diverges [93]. Accordingly, the calculated
values of the lowest-frequency polar modes in the R3m-phase evolve like 169, 160, 124, 73 (in
cm−1) for 0.0, 0.2, 0.4 and 0.6 x-composition, respectively. Therefore, the softening of the polar
mode overcomes the reduction of Ps in the piezoelectric response within the VCA approach.

CHAPTER 6. (BA,CA)TIO3 SOLID SOLUTIONS 86
Ba0.875Ca0.125TiO3
VCA 2x2x2 CELL
Atoms Total DD SR Atoms Total DD SR
A−A′ Ba-Ba’ (‖) -0.012 -0.006 -0.006d=3.967 A (‖) -0.011 -0.005 -0.006 d=3.959 A (⊥) +0.004 +0.003 +0.001
(⊥) +0.004 +0.003 +0.001 Ca-Ba (‖) -0.009 -0.005 -0.004d=3.959 A (⊥) +0.004 +0.003 +0.001
B −B′ (‖) -0.070 -0.038 -0.032 Ti-Ti’ (xx′) -0.072 -0.040 -0.033d=3.967 A (⊥) +0.008 +0.019 -0.011 d=3.929 A (yy′) +0.008 +0.020 -0.012
(zz′) +0.009 +0.020 -0.011
A−B Ba-Ti (‖) -0.030 -0.022 -0.008d=3.436 A (‖) -0.030 -0.022 -0.008 d=3.437 A (⊥) +0.014 +0.011 +0.003
(⊥) +0.014 +0.011 +0.003 Ca-Ti (‖) -0.023 -0.022 -0.001d=3.403 A (⊥) +0.013 +0.011 +0.003
B −O1 Ti-O1 (‖) +0.005 +0.236 -0.231d=1.984 A (‖) +0.002 +0.242 -0.241 d=1.994 A (⊥) -0.020 -0.045 +0.025
(⊥) -0.020 -0.045 +0.025 Ti-O2 (‖) -0.007 +0.253 -0.260d=1.965 A (⊥) -0.020 -0.044 +0.024
A−O1 Ba’-O1 (xx′) -0.004 +0.012 -0.016d=2.805 A d=2.783 A (yy′) -0.011 -0.016 +0.005
(zz′) -0.004 -0.006 +0.002
(xx′) -0.001 +0.012 -0.013 Ba’-O2 (xx′) -0.003 +0.012 -0.015(yy′) -0.004 -0.006 +0.002 d=2.800 A (yy′) -0.005 -0.006 +0.001(zz′) -0.011 -0.016 +0.005 (zz′) -0.011 -0.016 +0.005
Ca-O2 (xx′) +0.011 +0.011 -0.000d=2.750 A (yy′) -0.005 -0.006 +0.001
(zz′) -0.011 -0.016 +0.005
Table 6.1: Interatomic force constants for Ba0.875Ca0.125TiO3 from VCA and super cell calculations.Units are in Ha/bohr2. Directions xx′ (‖), yy′ (⊥) and zz′ (⊥) refer to local coordinates system ofthe different pairs of atoms. Distances (in A) between the selected atoms are also reported. Atoms’notation in the second column is consistent with Fig. 6.6(a)
6.2 Supercell approach
In order to check the validity of VCA and to better characterize the impact of the (Ba,Ca)
substitution on the dynamics of the system we performed direct DFT calculations on the
Ba0.875Ca0.125TiO3 and Ba0.50Ca0.50TiO3 compositions by means of supercells. Details about
the atomic arrangements have been provided in Sec. 4.3.
6.2.1 Ba0.875Ca0.125TiO3
Phonons calculations performed at the Γ-point of the cubic Pm3m Ba0.875Ca0.125TiO3 supercell
[Fig. 4.2(a)] have revealed several instabilities related to polar modes. The most unstable one,

CHAPTER 6. (BA,CA)TIO3 SOLID SOLUTIONS 87
with ω ≃ 169i cm−1, is associated to a polar distortion driven by all the Ti-atoms and the single
Ca-atom against the oxygens. Ba-atoms are almost fixed as in the parent BaTiO3. Therefore,
Ca is polar active on the A-site already at low concentration. The different dynamics can be
analyzed in terms of interatomic force constants between the A-cations and oxygens in the
investigated solid solution. In fact, the A-O interaction results to be opposite if we focus on Ba
or Ca atoms in line with the dynamical properties of the respective pure compounds (Table 5.3).
As reported in Table 6.1, the Ba-O interaction remains dominated by repulsive forces, while the
Ca-O interaction is largely dominated by the destabilizing long-range interaction. Moreover, the
Ti-O interaction also appears to be indirectly affected by such atomic substitution at the A-site;
in fact, from values reported in Table 6.1 in relationship with the atomic structure illustrated
in Fig. 6.6(a), it is evident that interatomic force constants between the Ti cations and oxygens
change alternately sign, reflecting strong competition between long- and short-range forces.
Such behavior is the result of a steric effect induced by the Ca substitution. In fact, the
ionic radii of Ba and Ca are 1.61 A and 1.34 A respectively [186]. Thus, to accommodate the
difference in size introduced by the partial substitution of Ba by Ca, a structural relaxation
takes place, changing the Ti-O distances already in the reference cubic structure. Specifically,
Ti atoms experiences shorter and longer bonds with the corresponding apical oxygen [Table 6.1
and Fig. 6.6(a)]. Such structural relaxation in turn strongly affects the Ti-O interatomic in-
teraction and consequently, the dynamics behind the emergence of ferroelectricity in BaTiO3
[102, 168]. In BaTiO3, in fact, ferroelectricity is quickly suppressed by decreasing Ti-O distance
as revealed under hydrostatic pressure [189]. In Fig. 6.4(a), in fact, we see that the overall fer-
roelectric instability in the cubic phase rapidly evolves as a function of the Ti-O distance and
becomes localized at the Γ point before it disappears. This happens below dT i−O ∼ 1.979 A,
which is shorter by only a 0.4% of the optimal Ti-O distance in cubic BaTiO3. At the same
time, the longitudinal Ti-O interatomic force constant changes sign, and so the nature of the
interaction transforms from destabilizing into stabilizing, as can be seen Fig. 6.4(c). Together
with this weakening of the polar instability, the relative energy difference between the two polar
states with polarization along the [100] and [111] directions abruptly decreases [Fig. 6.4(b)].
In CaTiO3, on the contrary, the increase of the Ti-O distance, which is now analogous to
volume expansion with respect to its ideal cubic phase, keeps the overall behavior qualita-
tively unchanged. The corresponding Ca-O IFCs are, in fact, always positive, as we can see
in Fig. 6.4(d), whereas, the Ti-O IFCs change sign also in this case, as shown in Fig. 6.4(c).
However, in Sec. 5.1.2 we have seen that in CaTiO3 the key interatomic interaction for the
ferroelectric instability is the Ca-O one, leading to the A-site driven character of the associated
polar distortion. Therefore, the persistence of this destabilizing Ca-O interaction is another
key feature of the Ca substitution in the solid solution.
The intriguing manifestation of such an interplay between weakened Ti-driven ferroelectric-
ity and emergent Ca-driven one in Ba0.875Ca0.125TiO3 is the achievement of a quasi-degeneracy
between different polar states. In fact, we analyzed five different polar states corresponding

CHAPTER 6. (BA,CA)TIO3 SOLID SOLUTIONS 88
"200"150
"100
"50
0
50
100ω
(#$
%
1)
Γ p&'*+X ,-.01234,5M ,-.01234,5
612
610
68
66
64
62
0
1.955 1.960 1.965 1.970 1.975 1.980 1.985 1.990 1.995
∆
E789T:;<>?@ACFCG
HIJKO Å( )
0.011
0.012
LNQRSQUVWY||
1.955 1.960 1.965 1.970 1.975 1.980 1.985 1.990 1.995
BaTiO3
BaTiO3
BaTiO3CaTiO3
CaTiO3
(a)
(c)
(b)
(d)
BTO
volume
Z0.018
Z0.012
Z0.006
0.000
0.006
[\]^_`abce ff
Figure 6.4: Evolution with Ti-O distance, i.e. different volume, of the dynamical properties ofBaTiO3 and CaTiO3 in the cubic phase. (a) Phonon frequencies (in cm−1) at the high-symmetryQ-points of the cubic Brillouin zone of BaTiO3. (b) Relative energy difference (in meV/f.u.) between[111]-R and [001]-T distortions in BaTiO3 constrained to the cubic unit cell. (c) Total InteratomicForce constants (in Ha/bohr2) along the Ti-O coupling in BaTiO3 and CaTiO3. (d) Total InteratomicForce constants (in Ha/bohr2) along the Ca-O coupling in CaTiO3.
to the tetragonal, orthorhombic, rhombohedral, monoclinic and triclinic phases with P4mm,
Amm2, R3m, Pm and P1 space-group symmetry, respectively, obtained by fully relaxing lat-
tice vectors and atomic positions. Specifically, the average gain in energy with respect to the
Pm3m-cubic phase is about −20 meV/f.u. as for the parent BaTiO3 [Fig. 6.5(a), Sec. 5.2].
Nevertheless, the maximum energy difference between the different polar phases is of about
0.5 meV/f.u. In particular, the energy of the tetragonal phase is lower than in BaTiO3. This
is likely because of the larger lattice-strain coupling effect [187, 180, 190] brought by the Ca
substitution, as evident from Figs. 6.5(a,d) and Figs. 6.5(c,f). The evolution of the energy
landscape when going from pure BaTiO3 to CaTiO3 passing through Ba0.875Ca0.125TiO3 as

CHAPTER 6. (BA,CA)TIO3 SOLID SOLUTIONS 89
P000 P001 P011 P111P0bc
P (
µC
/cm
2)
BaTiOg hj0.875Ca0.125TiO3 CaTiO3
0 00
∆E
(m
eV
/f.u
.)(a) (b) (c)
(d)
(g)
(e)
(h)
(f)
(i)
k80
k60
k40
k20
0
40
20
40
20
20
40
60
80
l0.02
0
0.02
0.04
mno
k0.02
0
0.02
0.04
qr
k20
k10
0
Pm-3m P4mm Amm2 R3m Pm-3m P4mm Amm2 R3mPm-3m P4mm Amm2 R3mPm P1
k0.06
k0.04
k0.02
0
0.02
0.04
0.06
0.08stBa
v20
v10
0
P000 P001 P011 P111 P000 P001 P011 P111Pwxy
Figure 6.5: Comparison of the energetics, spontaneous polarization and atomic displacements for(a,d,g) BaTiO3, (b,e,h) Ba0.875Ca0.125TiO3 and (c,f,i) CaTiO3. (Top) Energy gain (in meV/f.u.)relative to the cubic reference for states with different orientation of polarization. Closed circlesrepresent structures relaxed both in the atomic positions and volume. In (a) and (c) open circlesreproduce the energy-lowering associated to the polar distortion within fixed cubic unit cell (i.e. nostrain relaxation) for BaTiO3 and CaTiO3 respectively. For Ba0.875Ca0.125TiO3 (b) closed squaresreproduce the energetics as obtained from Eq. 6.1. (Center) Trend of spontaneous polarization (inµC/cm2) calculated by means of computed atomic displacements and Born effective charges, Ps,α =1Ω
∑
k,β Z∗k,αβ∆τk,β [99], for different polar states. In (d) and (f) open rhombus reproduce polarization
constrained to the cubic unit cell for BaTiO3 and CaTiO3 respectively. For Ba0.875Ca0.125TiO3 (e)closed triangles reproduce the polarization as obtained from Eq. 6.2. (Bottom) Evolution of averageatomic displacements (in internal coordinates) relative to the center of mass of corresponding cells.
well as the effect of the strain relaxation on the energetics of the two parent compounds are
reproduced in Fig. 6.5.
Interestingly, this degeneracy can be reproduced via a simple heuristic model in which the
relative energy of each ferroelectric phase (Ei) and their spontaneous polarization (P i) are
expressed as a linear combination of the corresponding quantities of the parent compounds:
Ei(x) = (1− x)EiBTO + xEi
CTO (6.1)
P i(x) = (1− x)P iBTO + xP i
CTO (6.2)
where x is the Ca concentration. This simple model exploits the reversed sequence of ferro-
electric states displayed by the two parent compounds. Noteworthy, the strain effect has to

CHAPTER 6. (BA,CA)TIO3 SOLID SOLUTIONS 90
be included to properly reproduce the degeneracy of phases. The obtained from this model is
shown in Fig. 6.5(b,e).
Going back to the specific results from supercell calculations for x = 0.125, it is worthy
to emphasize the emergence of the triclinic and monoclinic structures absent in the energet-
ics of the parent compounds. Specifically, the triclinic-P1(C1) phase displays polarization
Pabc nearly between the [001]-[111] direction of the original cubic structure (Pa/Pc ≃ 0.53,
Pb/Pc ≃ 0.48) and the monoclinic-Pm(Cs1) phase displays polarization P0bc in between the
[001]-[011] direction (Pb/Pc ≃ 0.53) [Figs. 6.5(b,e)]. Furthermore, the spontaneous polarization
and related atomic distortions are essentially the same for all the ferroelectric phases as we
show in Figs. 6.5(e,h) (P ∼ 39µC/cm2 as computed via the Berry phase [191]). Together with
the the quasi-degeneracy of the energies, these results disclose a remarkably isotropic energy
landscape. We also note that, compared to the parent BaTiO3, the relative displacements of
both Ti and O atoms are reduced for x = 0.125, which is more pronounced for the Ti atoms,
while the current distortion also contains a sizable displacement of Ca [see Fig. 6.5(h)]. Such
behavior has been actually observed experimentally in Refs. [193, 194]. This reduction of the Ti
and O displacements contributes to reduce the overall anisotropy of the system. Therefore, the
specific dynamics in Ba0.875Ca0.125TiO3 is a clear manifestation of the appearance of a A-driven
character of the distortion accompanied by the reduction of the B-driven one.
Additionally, we calculated the dij coefficients of the piezoelectric tensor in the stable R3m-
phase. The d33 component, parallel to the polarization direction, remains unchanged with
respect to BaTiO3, while the d11 and d15 components, transversal to the polar axis, are con-
siderably enhanced. Specifically they are: d33 ≃ 15, d11 ≃ 344 and d15 ≃ 1458 in pC/N . This
behavior can be related to the increase of the stress-free dielectric response along the corre-
sponding directions due to the softening of the polar modes. In fact, the lowest-frequency polar
mode in the stable R3m-phase is of about 61 cm−1 instead of 169 cm−1 in BaTiO3.
6.2.2 Ba0.5Ca0.5TiO3
First result in Ba0.5Ca0.5TiO3 [Fig. 4.2(b-d)] is the preference of an ordered configuration com-
posed by alternating layers of the same type of A-cations with respect to a columnar and
rocksalt ordering. The relative energy gain of the high-symmetry columnar and layered con-
figurations with respect to the rocksalt one is about −35.5 meV/f.u. and −81.4 meV/f.u.,
respectively.
Then, as previously, we performed DFPT calculations on the three high-symmetry refer-
ence supercells. All three configurations display several instabilities. In all of them the most
unstable mode corresponds to a polar distortion driven by both the Ti and Ca atoms like in
Ba0.875Ca0.125TiO3, but with an average major contribution from calcium. The phonon fre-
quency associated to that mode is ω ≃ 141i cm−1 in all three cases. Additionally, AFD modes
related to oxygen rotations become unstable. However, the energy gain carried to the system

CHAPTER 6. (BA,CA)TIO3 SOLID SOLUTIONS 91
Ba0.50Ca0.50TiO3
VCA 1x1x2 CELL
Atoms Total Atoms Total
B −O1 Ti-O1 (‖) -0.009d=1.960 A d=1.956 A (⊥) -0.019
(‖) -0.011 Ti-O2 (‖) -0.047(⊥) -0.020 d=1.890 A (⊥) -0.017
Ti-O3 (‖) +0.010d=2.011 A (⊥) -0.019
A−O1 Ba-O1 (xx′) -0.001d=2.772 A d=2.837 A (yy′) -0.005
(zz′) -0.011
Ba-O3 (xx′) -0.005(xx′) +0.002 d=2.765 A (yy′) -0.005(yy′) -0.005 (zz′) -0.011
(zz′) -0.011 Ca-O1 (xx′) +0.010d=2.690 A (yy′) -0.006
(zz′) -0.012
Ca-O2 (xx′) +0.011d=2.765 A (yy′) -0.005
(zz′) -0.012
Table 6.2: Interatomic force constants for Ba0.50Ca0.50TiO3 within VCA and the layered supercell. Unitsare in Ha/bohr2. Directions xx′ (‖), yy′ (⊥) and zz′ (⊥) refer to local coordinates system of the different pairsof atoms. Distances (in A) between the selected atoms are also reported. Atoms’ notation in the second columnis consistent with Fig. 6.6(b)
by the condensation of the latter distortions alone is lower than the one coming from the polar
distortions, that determine the ground-state.
Accordingly, the most stable polar phase results to be the P2mm-structure with the po-
larization along the [100] direction of the layered atomic arrangement. The associated Ps is
of about 51 µC/cm2 and it is considerably greater than the one calculated in P4mm-BaTiO3,
that is Ps ≃ 34 µC/cm2. Moreover, in order to see eventual effects of the atomic configuration
on the energy competition between different polar states, we condensed different patterns of
polar distortions in the three arrangements. The associated energy landscape is quite spread
as reported in Fig. 6.6(c). It results that, for x = 0.50, the system prefers a state with only
“one-component” polarization independently of the atomic configuration. The R3m-like state
with polarization along the [111] pseudo-cubic direction is largely penalized.
Also in this case, changes in the dynamical properties (i.e. substantial contribution from
Ca-atoms to the polar distortion and the appearance of unstable AFD modes) and in the
energetics of the polar phases can be analyzed in term of interatomic force constants. As made
clear in Table 6.1 and Table 6.2, the main features are the same as the ones described for the
x = 0.125 Ca-concentration. However, the higher concentration of calcium induces shorter Ti-O

CHAPTER 6. (BA,CA)TIO3 SOLID SOLUTIONS 92
z7/8Ca1/8TiO3 Ba1/2Ca1/2TiO3
LAYERED(a) (b)
P000 P001 P100 P110 P111
LAYERED
COLUMNAR
ROCKSALT
Ba0.50Ca0.50TiO3
40
20
0
20
40
60
80
∆E
(m
eV
/f.u
.)
(c)
z
xy
Ti Ti~
O1
O2
O2O1
a
a~ Ca
Ca
Ti
O2
O3
O1 O1
Ba
Figure 6.6: Schematic representation of the atomic arrangement in Ba0.875Ca0.125TiO3 (a) andin layered-Ba0.5Ca0.5TiO3(b). Direction along y is equivalent to the x-one. Labels help the visu-alization of the main atomic pair analyzed in Tables 6.1 and 6.2. (c): Energy gain (in meV/f.u.)with respect to the highy-symmetry P4mmm-layered structure for different optimized polar statesin the Ba0.5Ca0.5TiO3 supercells. The x-axis notation refers to the direction of the components ofpolarization.
distances, i.e. more contracted [TiO6]-octahedra. On the one hand, this produces the overall
weakening of the long-range interaction between Ti and O atoms in favor of repulsive forces
hindering the B-driven polar distortion. Therefore, the polar instability remains mostly Ca-
driven, promoting “tetragonal-like” polar states. Accordingly, the result of such unbalanced
competition between Ti- and Ca-driven polar distortion is that the quasi-degeneracy of the
ferroelectric phases found out in the low Ca-concentration case is lost and the energy landscape
becomes highly anisotropic again, CaTiO3-like. On the other hand, the stiffness of oxygens is
reduced in the direction perpendicular to the Ti-O bonds favoring the appearance of oxygen
rotations. In fact, the values of the “on-site” oxygens force constants in the solid solution are
in between the ones of pure BaTiO3 and CaTiO3 (Table 5.1).

CHAPTER 6. (BA,CA)TIO3 SOLID SOLUTIONS 93
Comparison with experimental phase diagram
It is worth noting that our calculations reproduce qualitatively the T = 0 K experimental
phase diagram reported by Fu et al. in Refs. [184, 195] [Fig. 6.7(b)]. Specifically, at T = 0 K,
Ba1−xCaxTiO3 is experimentally found to be in the rhombohedral R3m phase for x ∼ 0.18
and in the tetragonal P4mm phase for x ∼ 0.23. The orthorhombic Amm2 phase has been
assigned to the intermediate 0.18 . x . 0.23 interval which, in our calculations, appears
to be virtually zero [see Figs. 6.5(a)-(c)]. However, we note that in the measurements of the
dielectric constant reported in Ref. [195] [Fig. 6.7(a)], it is observed very broad low-temperature
features for x = 0.18 that can perfectly result from the overlap of the two hysteretic anomalies,
having thus still three peaks in total. Additionally, the authors have obtained the critical
concentrations xc(T=0 K) by invoking a “quantum” scaling, of the type T ∝ (x− xc)1/2, and
fitting the data to this scaling over all the temperature interval from 0 to 300 K of the phase
diagram [Fig. 6.7(b)]. This scaling, however, is an asymptotic scaling that can be expected to
be valid in the ultra low-temperature limit only, and not above ∼ 100 K [197, 198]. Moreover,
they ignore the hysteretic behavior of the experimental data (see the temperature dependence
of the dielectric constant ǫ′ in Fig. 6.7(a)), revealing the first-order character of the transition,
that does not allow an universal scaling.
To test the trend T ∝ (x− xc)1/2, we have plotted T 2 ∝ (x− xc) as function of x by taking
into account in the fit only the data below ∼ 100 K. The result shown in Fig.6.7(c) is that
such a trend is not representative of all the data. Then, if we simply extrapolate their results
without assuming any specific scaling, we find that these results are also compatible with the
three polar phases meeting together at T = 0 K, as shown in Fig. 6.7(d). The fit has been done
on data extracted from the phase diagram reported in Ref. [184] by excluding the last point at
T < 5 K. Consequently, on the one hand the quasi-degeneracy of the ferroelectric phases found
out by our first-principles calculations is compatible with the direct extrapolation of this data
to T = 0 K. On the other hand, the disagreement in the quantitative prediction of the specific
concentration, at which such a convergence occurs, is likely due to the relative small size of our
2×2×2 supercells, not considering explicitly the effect of disorder. Additionally, the energetics
obtained by our specific calculations for the case x = 0.50 based on such supercells [Fig. 6.6], are
again fully compatible with the experimentally observed stabilization of the tetragonal phase
over the orthorhombic and rhombohedral ones for greater Ca-concentration. Nevertheless, the
quantitative reproduction of the experimental data, as well as the discussion of quantum critical
effects, was not the scope of our study aimed instead to the identification of the microscopic
mechanisms leading to this quasi-degeneracy.

CHAPTER 6. (BA,CA)TIO3 SOLID SOLUTIONS 94
0
100
200
300
400
500
0 0.05 0.1 0.15 0.2 0.25 0.3 0.35
Ba1x
x
3
T T
T = a(x-xc)
T = b(x-xc) + c(x-xc)2
0
100
200
300
400
500
600
700
800
0 0.05 0.1 0.15 0.2 0.25 0.3
T2
Ba1xx ¡3
T2 = a(x-xc)
¢£¤ ¥¦§¨¥©§Tª« ¥¦§¨¥©§
[x 10^2]
(a) (b)
(c) (d)
T ~ (x-xc)1/2
T ~ (x-xc)
0.35
Figure 6.7: (a) Temperature dependence of the dielectric constant (ǫ′) of Ba1−xCaxTiO3 crystals.(b) Phase diagram of Ba1−xCaxTiO3 derived from dielectric measurements. Blue rhombus and redcircles indicate the cooling and heating processes, respectively. From Refs. [184, 195]. (c) and (d)fit of the trend of the transition temperature T as a function of the concentration x: (c) plot of T 2
fitted via the linear behavior a(x − xc) to test the trend T ∝ (x − xc)1/2 as assumed by Fu et al. in
Refs. [184, 195] for the T-O and O-R phase transitions; (d) fitting of T via the classic trend (x− xc)for the C-T transition, while via a generic trend a(x−xc)+b(x−xc)
2 for the T-O and O-R transitionsto extrapolate xc(T=0 K). a and b are fitting parameters. Data for fitting have been extracted fromthe phase diagram (b) reported in Ref. [184].
6.3 VCA vs SUPERCELL approaches
By comparing results from supercell-based calculations with the ones from VCA, it seems that
the latter approach is successful to provide an average and qualitative identification of the main
changes occurring in the (Ba,Ca)TiO3 solid solutions. However, it cannot provide a proper de-
scription of the microscopic mechanism behind properties. The reason of such a limitation is
that, by construction, VCA considers all A atoms as equivalent and forces them to behave simi-
larly while, in fact, Ba and Ca want to adopt different behaviors. The importance of considering
the actual local cations is clear by comparing the quantities reported in Tables 6.1 and 6.2,
where we clearly see that different results are obtained depending on the method. In fact, as
discussed above, evolutions in the dynamics as well as in the energy landscape are strongly
related to the presence of calcium that directly interacts with the oxygens and, indirectly, af-
fects the Ti-O interaction via local changes of the structure. These effects have a purely steric
nature related to the presence of Ca atoms. Strong changes in the dynamical properties as

CHAPTER 6. (BA,CA)TIO3 SOLID SOLUTIONS 95
steric effects induced by the addition of Ca have also been found in (Ba,Ca)ZrO3 [192].
However, the progressive weakening of ferroelectricity, within VCA, is not representative
of the real behaviour: the actual weakening of the Ti-driven ferroelectricity due to decreasing
volume is progressively compensated by the Ca-driven ferroelectricity. In fact, the inversion in
the sequence of polar phases when going from BaTiO3 to CaTiO3 appears already at x = 0.50
within the supercell, while it is expected for x ≥ 0.9 within VCA. Additionally, an opposite
trend of the spontaneous polarization is also obtained within the two approaches: decreasing
values for larger x within VCA, while increasing ones within the supercells.
As a global result, the partial success of VCA in detecting changes in the dynamical prop-
erties when progressively substituting Ba by Ca is due to two main factors: (i) the volume
contraction induced by increasing Ca concentration allows to detect the weakening of the B-
driven ferrolectricity; (ii) possible inaccuracies in reproducing the orbital hybridization within
VCA are not primary here, as the most relevant hybridization mechanism is only related to the
O p and Ti d states, that are not concerned by the VCA mixing procedure. Nevertheless, the
trends and microscopic mechanisms involved as predicted by means of supercells calculations
are better in line with experimental observations [184, 193]. This remark confirms that, in order
to provide a proper first-principles characterization of (Ba,Ca)TiO3, VCA-based approaches can
provide some trend, but are not appropriate to explain the underlying physics; for the latter,
supercells-based calculations taking explicitly into account the different nature of the cations
are more suitable.

Chapter 7
Ba(Ti,Zr)O3 solid solutions
Ba(Ti,Zr)O3 (BTZ) solid solutions involve the homovalent substitution between Ti4+ and Zr4+,
that are nevertheless quite different atoms both for the ionic radii (0.605 A and 0.72 A re-
spectively [186]) and the electronic configuration (Ti 4s2 3d2 and Zr 4d2 5s2), which enters the
hybridization mechanism responsible of the ferroelectricity in BaTiO3.
The first experimental investigation of the phase diagram of the BaTiO3-BaZrO3 binary
system dates back to the 1956 with the work of Kell and Hellicar [160], reporting the abrupt
effect of Zr-concentration on the decreasing of the Curie point for the three ferroelectric phases
of BaTiO3. Subsequently, other solid experimental investigations came out in the late ’90s,
when Ravez et al. in Refs. [199, 200] provided a clear distinction of phases in the BaTi1−yZryO3
ceramics diagram: classical ferroelectric BaTiO3-like for 0.00 ≤ y ≤ 0.10, only one ferroelectric-
paralectric transition observed in the range 0.10 ≤ y ≤ 0.27 and relaxor ferroelectric behavior
for 0.27 < y ≤ 0.42. Then, in 2004, Simon et al. also investigated the crossover from a fer-
roelectric to a relaxor state in lead-free solid solutions in Ref. [201], confirming that beyond a
definite concentration y, BTZ ceramics show relaxor properties. For BaTi0.80Zr0.20O3 only one
resonance of the permittivity at the ferroelectric-paraelectric TC of about 315 K is observed,
whereas for y = 0.35 the dielectric anomaly is broad and frequency-dependent as a function
of temperature. Moreover in Ref. [202], they provide an EXAFS study of BTZ systems and
conclude that BTZ is relaxor and the average crystal structure is cubic (Pm3m space group)
in the range 0.25 ≤ y ≤ 0.50. In addition, in a complementary work on BCTZ [203], the X-ray
diffraction has revealed (110) peaks in BaTi0.80Zr0.20O3 ceramic but a weak tetragonality (i.e.
a/c ∼ 1), that means closeness to the cubic phase. However, no experimental data on single
crystal samples are available for direct comparison with ab-initio results.
As for the previous case of (Ba,Ca)TiO3, we first investigate the Ba(Ti,Zr)O3 system by
means of the virtual crystal approximation. Then, we go beyond by using supercells-based
calculations.
96

CHAPTER 7. BA(TI,ZR)O3 SOLID SOLUTIONS 97
7.1 VCA approach
7.1.1 Lattice parameters
We first report the trend of the lattice parameter of the Pm3m-cubic phase as a function of
Zr-composition. Because of the bigger volume of BaZrO3 with respect to BaTiO3 (Table 4.1),
the trend is monotonically increasing with the amount of zirconium and the agreement with
the linearity of the Vegard’s law is quite satisfactory [Fig. 7.1(a)]. Contrariwise, because of the
bigger ionic radius of Zr than Ti, the tolerance factor1 decreases without going below 1, that is
the value for pure BaZrO3, as reported on top of Fig. 7.1.
7.1.2 Dynamical properties
We focus on the dynamics by looking at the evolution of the lowest phonon frequencies at the
high-symmetry points of the cubic Brillouin zone. Calculations have been performed on the
VCA-optimized Pm3m structure. It results that the main effect of the Zr-doping is to abruptly
stabilize the cubic phase, as clear from Fig. 7.1(b). In fact, already in the Ti-rich region, i.e.
y > 0.10, the original polar instability vanishes and an AFD unstable mode BaZrO3-like appears
at the R-point only for y ≥ 0.90. The reason behind such abrupt weakening of ferroelectricity
in the BTZ “virtual-system” at low y-concentration can be traced back to abrupt changes in
the type of interaction between the virtual cation at the B-site and the oxygens. In fact, the
total IFC along the B-O direction is of about −0.001 Ha/bohr2 at y ≥ 0.05. Therefore, the
change of sign with respect to the corresponding interaction in pure BaTiO3 (Tables 5.3) means
that the Zr-substitution strongly favors short-range repulsive forces.
Differently from BCT systems, it is not possible to relate such behaviour to the evolution of
the tolerance factor or to simple volumetric reasons. In fact, in line with the properties of the
two parent compounds, t remains larger than one and the volume increases for each intermediate
composition. The main mechanism involved here is the weakening of the Ti-O interaction when
“virtually” introducing Zr on the same B-site. This corresponds to either direct changes in the
O 2p and B d hybridization mechanism from the electronic perspective or breaking correlated
Ti-O chains necessary to sustain ferroelectricity in BaTiO3 from the lattice dynamics. In fact,
we have already seen in Sec.5.1.4, that the Zr-O interaction in BaZrO3 is strongly repulsive.
Moreover, differently than the role played by CaTiO3 in BCT, no contribution from the A-site
is observed, as the Ba-O interaction is too weak to sustain alone a polar instability in BTZ.
As a consequence, it is finally not surprising that the “virtual”-BTZ system does not display
any instabilities for a very large range of composition.
1also in this case, we defined an average radius for the B-cation as rB = (1− y)rTi + (y)rZr

CHAPTER 7. BA(TI,ZR)O3 SOLID SOLUTIONS 98
1.06 1.06 1.05 1.04 1.04 1.03 1.03 1.02 1.01 1.01 1.00
tolerance
factor
(a)
(b)
¬
3.980
4.000
4.020
4.040
4.060
4.080
4.100
4.120
4.140
4.160
4.180
a (
Å)
-200
-150
-100
-50
0
50
100
150
200
0 0.1 0.2 0.3 0.4 0.5 0.6 0.7 0.8 0.9 1
ω(c
m-1
)
Γ
XRM AFEM AFD
VCAVegard law
AFE
AFD
FE
Figure 7.1: (a) Evolution as a function of y-composition in BaTi1−yZryO3 of the cubic latticeparameter acell (in A) relaxed within VCA. Vegard’s law has been built on the theoretical values ofthe cubic BaTiO3 and BaZrO3 reported in Table 4.1: a(y) = (1 − y)aBTO + (y)aBZO. (b) Trend ofthe lowest phonon frequencies (in cm−1) at the high-symmetry points of the simple cubic Brillouinzone as a function of different y-compositions.
7.1.3 Energy landscape
In line with the drastic changes of the dynamical properties in BTZ predicted by VCA, the
energy difference both between the three polar phases and with respect to the cubic one is
abruptly reduced, as shown in Fig. 7.2. In fact, the energy competition is within 0.1 meV/f.u.
at y = 0.10 and beyond this concentration no stable or metastable polar phases are allowed
within VCA.
7.1.4 Polarization and piezoelectric response
After identifying the abrupt weakening of ferroelectricity in the BTZ “virtual-system”, we
now evaluate the associated effect on the piezoelectric response. Therefore, we calculate the
spontaneous polarization Ps and the piezoelectric coefficients dij for the stable phase, that is
the R3m-phase for y = 0.05 and 0.10 (Fig.7.2). Also in this case, as we are mostly interested in
the qualitative trend of these properties as a function of Zr-doping, we report values normalized

CHAPTER 7. BA(TI,ZR)O3 SOLID SOLUTIONS 99
to those of R3m-BaTiO3.
In Fig. 7.3 we report values of Ps calculated both via Berry phase (blue circles) and Born
20
15
10
5
0
0 0.05 0.1 0.15 0.2
∆E
(m
eV
/f.u
.)
®
¯°±±Amm2
R3m
Figure 7.2: Zoom on the evolution of the energy gain (in meV/formula unit) of the three polarstructures relative to the cubic phase as a function of y-composition in the Ti-rich region within VCA.
²
1
1.2
1.4
1.6
1.8
2
2.2
2.4
2.6
0 0.05 0.1
d
³´µ¶³´ ·¸¹
º11
º15
º33
0.2
0.4
0.6
0.8
1
1.2
P/P
»¼½
Berry Phase¾DFT
P=Z* uBTZOBTZO
P=Z*BTOuBTZO
P=Z*BTZOuBTO
0
1
2
3
4
5
6
7
8
0 0.05 0.1
εij/
εij B
TO
ε11=ε22ε33
Figure 7.3: Evolution of polarization, stress-free dielectric and piezoelectric coefficients in therhombohedral-R3m phase as a function of y-composition in BaTi1−yZryO3 within VCA. Values arenormalized to the ones of R3m-BaTiO3: PBTO
s ≃ 38 µC/cm−2; dBTO11 ≃ 76, dBTO
15 ≃ 270 anddBTO33 ≃ 15 pC/N ; εBTO
11 ≃ 208 and εBTO33 ≃ 11. Upper panel: variation of the polarization as
directly computed via Berry-phase calculations (blue closed circles) and via Born effective charges todisentangle the contribution of varying atomic charges and displacements. Lower panel: trend of thedij coefficients and stress-free dielectric response εij .

CHAPTER 7. BA(TI,ZR)O3 SOLID SOLUTIONS 100
effective charges (green rhombus). This is to be compared with the same calculations for BCT
in Fig 6.3. In line with the strong weakening of the polar instability, Ps is drastically reduced
by the Zr-doping. Similarly to BCT, from the further analysis of the distinguished contribution
from effective charge variation and atomic displacements, it results that the evolution of Ps has
to be widely ascribed to largely reduced atomic motions. However, by looking at y = 0.10, it is
important to note that there is a disagreement between the value of polarization by fixing the
Born effective charges to that of pure R3m-BaTiO3 (red circles) or to the ones of R3m-BTZ
“virtual-system” (green rhombus) as the Zr-doping also affects the Born effective charges. In
fact, we have already shown that the Z∗ associated to Zr is less anomalous than the one of Ti
(Table 5.2). Therefore, the average effective charge associated to the “virtual” B-cation is also
reduced with increasing Zr-concentration. This is an important warning about the ability of
VCA in describing the properties arising from the mixing of Zr and Ti on the B-site, as they
have quite different electronic properties (see Sec.7.3 below).
Such decrease of Ps remains compatible with an increase of piezoelectricity. In fact, the
huge increase of dielectric response, εij, associated to the drastic softening of the polar mode,
largely compensates the decrease of Ps. This results in the enhancement of the piezoelectric
response with respect to pure BaTiO3, as reported in Fig. 7.3. Accordingly, the values of the
lowest-frequency polar mode in the stable R3m-phase evolve like 169, 146, 69 (in cm−1) for
y = 0.00, 0.05 and 0.10, respectively.
As we see, the trends obtained from VCA are in reasonable agreement with the experimental
observations. However, to understand the actual impact of the partial substitution of Ti with
Zr on the dynamics of the system at the local level, supercells-based calculations are necessary.
7.2 Supercell approach
In this Section, we investigate the dynamical properties of BaTi0.875Zr0.125O3 and BaTi0.50Zr0.50O3
supercells. Structural details are provided in Sec. 4.3
7.2.1 BaTi0.875Zr0.125O3
BaTi0.875Zr0.125O3 supercell [Fig. 4.2(e)] hosts several instabilities in the cubic Pm3m phase,
all related to ferroelectric and antiferroelectric distortions. The most unstable, with ω ≃214i cm−1, is a polar mode mostly related to the opposite motion of Ti and O, while the Zr
atom slightly moves in the same direction as the oxygens. The difference in these relative dis-
placements affects the neighboring atom lying on the polar direction, that slightly moves with
the oxygens as well. This means that, according to the labels indicated in Fig. 7.4(a), if the po-
lar distortion is, for instance, along the x direction, Ti1 slightly off-centers with Zr in the same
direction as the oxygens, but opposite to the other Ti-atoms. Ba-atoms are almost fixed as in

CHAPTER 7. BA(TI,ZR)O3 SOLID SOLUTIONS 101
¿ÀÁÂ7/8ÃÄ1/8O3 BaTi1/2ÆÇ1/2TiO3
ROCKSALT
(a) (b)
LAYERED
COLUMNAR
ROCKSALT
∆E
(m
eV
/f.u
.)
BaTi0.875ÈÉ0.125O3 BaTi0.50ÊË0.50O3
P000 P001 P011 P111 P000 P001 P100 P110
Ì30
Ì20
Ì10
0
0
15
30
45
60
75
90
(c) (d)
z
xy
ÍÎ
ÍÎÏ
O1
O1 O1
O1
O2
O2
O2O2
Ti1Zr
Ti2
Zr Ti
O
O O
O
O
O
Ba
Figure 7.4: Schematic representation of the atomic arrangement in BaTi0.875Zr0.125O3 (a) andin rocksalt-BaTi0.50Zr0.50O3(b). Labels help the visualization of the main atomic pair analyzed inTables 7.1 and 7.3. Energy lowering (in meV/f.u.) with respect to the high-symmetry Pm3mphase for BaTi0.875Zr0.125O3 (c) and with respect to high-symmetry rocksalt-Fm3m configurationfor BaTi0.50Zr0.50O3 (d) as a function of different optimized polar states by means of supercells. Thex-axis notation refers to the direction of the components of polarization.
the parent BaTiO3. Such different dynamics is made clear when looking at the interatomic force
constants reported in Table 7.1. In fact, the original destabilizing Ti-O interaction of BaTiO3
is not preserved for each direction in the system. The Ti-atoms having Zr as first-neighbors
experience a strong repulsive Ti-O interaction along the O-Zr-O-Ti-O chain direction, while the
long-range forces remain the major ones along the other directions as well as for the other Ti-
atoms. This is strongly ascribed to the “chain-like” character of the polar instability of BaTiO3,
as discussed in Sec. 5.1.1: the polar instability requires a minimum number of correlated Ti-O
displacements [168] that, however, are prevented along the chain containing Zr. In fact, accord-
ing to the properties of BaZrO3 described in Sec. 5.1.4, the Zr-O interaction remains strongly
repulsive also in this Ti-rich solid solution. However, along the preserved O-Ti-O-Ti-O chains,
the long-range interaction is even indirectly strengthened by the Zr-presence. In fact, the bigger
size of Zr (i.e. of the [ZrO6]-octahedral volume) makes the Ti-O bond’s length perpendicular

CHAPTER 7. BA(TI,ZR)O3 SOLID SOLUTIONS 102
BaTi0.875Zr0.125O3
VCA 2x2x2 CELL
Atoms Total DD SR Atoms Total DD SR
A−A′ (‖) -0.011 -0.006 -0.005 Ba-Ba’ (‖) -0.012 -0.006 -0.0061d=3.997 A (⊥) +0.004 +0.003 +0.001 d=4.043 A (⊥) +0.004 +0.003 +0.001
B −B′ Ti1-Ti2 (xx′) -0.068 -0.038 -0.029d=3.997 A (‖) -0.067 -0.037 -0.030 d=4.002 A (yy′) +0.008 +0.018 -0.010
(⊥) +0.009 +0.018 -0.011 (zz′) +0.008 +0.019 -0.011
Ti1-Zr (xx′) -0.069 -0.034 -0.034d=4.002 A (yy′) +0.008 +0.019 -0.011
(zz′) +0.008 +0.019 -0.011
A−B Ba-Ti1 (xx′) -0.028 -0.022 -0.007d=3.461 A (‖) -0.030 -0.023 -0.008 d=3.478 A (yy′) +0.014 +0.010 +0.003
(⊥) +0.014 +0.011 +0.003 (zz′) +0.013 +0.011 +0.002
Ba-Zr (xx′) -0.031 -0.020 -0.011d=3.502 A (yy′) +0.013 +0.011 +0.002
(zz′) +0.013 +0.011 +0.002
B −O1 Ti1-O1 (‖) -0.032 +0.239 -0.271
d=1.998 A d=1.929 A (⊥) -0.015 -0.052 +0.037
Zr-O1 (‖) -0.039 +0.199 -0.238(‖) -0.009 +0.229 -0.238 d=2.073 A (⊥) -0.013 -0.040 +0.027
(⊥) -0.020 -0.045 +0.025 Ti1-O2 (xx′) +0.013 +0.239 -0.226d=2.012 A (yy′) -0.023 -0.039 +0.016
(zz′) -0.021 -0.046 +0.025
Ti2-O2 (‖) +0.003 +0.244 -0.241d=1.990 A (⊥) -0.021 -0.043 +0.022
A−O1 (xx′) -0.001 +0.013 -0.014 Ba-O1 (xx′) +0.000 +0.012 -0.0113d=2.826 A (yy′) -0.005 -0.006 +0.002 d=2.860 A (yy′) -0.010 -0.015 +0.005
(zz′) -0.011 -0.016 +0.005 (zz′) -0.004 -0.006 +0.002
Table 7.1: Interatomic force constants from VCA and supercell-based calculations forBaTi0.875Zr0.125O3. Units are in Ha/bohr2. Directions xx′ (‖), yy′ (⊥) and zz′ (⊥) refer to localcoordinates system of the different pairs of atoms. Distances (in A) between the selected atoms arealso reported. Atoms’ notation in the second column is consistent with Fig. 7.4(a).
to the O-Zr-O-Ti-O chain direction longer than in pure BaTiO3. This mechanism locally fa-
vors the long-range interaction. Accordingly, the “on-site” force constants tensor associated to
the Ti-atoms adjacent to Zr are anisotropic: by referring to Ti1 of Fig. 7.4(a), the “on-site”
terms are (+0.247,+0.132,+0.132) Ha/bohr2. Therefore, they are much more stiffer along the
Zr-direction, while softer along the transversal directions than in BaTiO3 (see Table 5.1). The
other Ti-atoms display a slightly anisotropic tensor, but similar to the one in BaTiO3: by
referring to Ti2 of Fig. 7.4(a), values are (+0.162,+0.151,+0.162) Ha/bohr2. In contrast, Zr

CHAPTER 7. BA(TI,ZR)O3 SOLID SOLUTIONS 103
displays an isotropic tensor BaZrO3-like with diagonal values of about +0.229 Ha/bohr2, as it
experiences the same interactions in each direction. Concerning Ba at the A-site, the dynamics
is the same as in pure BaTiO3. In fact, the A-O interatomic force constant is close to zero along
parallel direction of the coupling meaning that Ba distortion does not lead ferroelectricity in
BaTi0.875Zr0.125O3. The A-B interaction is also similar to the one in the two parent compounds
reported in Table 5.3.
Such complex dynamics results in slightly reduced total polarization and more spread energy
landscape with respect to the case of the parent BaTiO3. On one hand, the calculated spon-
taneous polarization is of about 28 µC/cm2 and 35 µC/cm2 for the P4mm and R3m phases,
respectively, while it is of about 34 µC/cm2 and 38 µC/cm2 for the corresponding phases in
pure BaTiO3. This has to be assigned to the local depolarizing contribution arising from the
O-Zr-O-Ti-O chain. On the other hand, the energy gain of the three polar phases relative to the
cubic phase is higher than in BaTiO3 and it appears much more pronounced for the Amm2 and
R3m phases as reported in Fig. 7.4(c). This effect traces back to the overall volume increase,
that further favors the rhombohedral phase.
In line with the higher anisotropy of the energy landscape and reduced polarity of the system,
the piezoelectric response results then reduced than in BaTiO3. Specifically, we calculated the
dij coefficients of the piezoelectric tensor in the stable R3m-phase. Values are: d33 ≃ 11,
d11 ≃ 23 and d15 ≃ 85 in pC/N .
7.2.2 BaTi0.50Zr0.50O3
The case of BaTi0.50Zr0.50O3 [Fig. 4.2(f-h)] clearly reveals the importance of the atomic ordering
on the dynamical properties. The first result is that the atomic arrangement associated to
the high-symmetry-Fm3m rocksalt configuration is lower in energy than the ordered-P4mmm
structures based on chains or layers of same type of B-cations: the three structures have been
optimized and the energy lowering with respect to the highest energy layered configuration is of
about −30.95 meV/f.u. for the columnar configuration and −93.73 meV/f.u. for the rocksalt.
Beyond that, all the three configurations show very different dynamical properties. Looking
at the phonon frequencies reported in Table 7.2, unstable modes appear at each high-symmetry
point of the P4mmm-tetragonal Brillouin zone of the layered-based supercell. Specifically, the
BaTi0.5Zr0.5O3 (P4mmm-supercell)
Configuration Γ(0 0 0) Z (0 0 12) M (12
12 0) A (12
12
12) R (0 1
212 ) X (0 1
2 0)
layered [110] 274.18i 271.42i 65.17i 60.85i 259.90i 262.65i
columnar [001] 304.05i 90.60 301.88i 75.43 76.32 299.4i
Table 7.2: Lowest phonon frequencies (cm−1) at the high symmetry points of the tetragonal P4mmmBrillouin zone. As BaTi0.5Zr0.5O3 has no instabilities within VCA, only results from supercells arereported.

CHAPTER 7. BA(TI,ZR)O3 SOLID SOLUTIONS 104
BaTi0.50Zr0.50O3
Fm3m-2x2x2 CELL
Atoms Total
B −B′ Ti-Zr (‖) -0.063d=4.075 A (⊥) +0.008
A−B Ba-Ti (‖) -0.027d=3.529 A (⊥) +0.013
Ba-Zr (‖) -0.030d=3.529 A (⊥) +0.013
B −O Ti-O (‖) -0.002d=1.978 A (⊥) -0.020
Zr-O (‖) -0.025d=2.097 A (⊥) -0.015
A−O Ba-O (xx′) +0.002d=2.882 A (yy′) -0.011
(zz′) -0.005
Table 7.3: Interatomic force constants from supercell calculations for BaTi0.50Zr0.50O3 in the cubic-Fm3m phase. Units are in (Ha/bohr2). Directions (‖), (xx′) and (⊥), (yy′), (zz′) refer to the localcoordinates system between different atomic coupling. Distances in (A) between the selected atomsare also reported. Atomic labels refer to Fig. 7.4(b).
two instabilities appearing at the M and A points are associated to antiferrodistortive modes
due to oxygen rotations, while all the other instabilities are related to the polar instability
arising from Γ and mostly ascribed to the (Ti,O)-polar motion along the direction of preserved
O-Ti-O-Ti-O chains. Zr displays the same dynamics as described for the BaTi0.875Zr0.125O3
case. Within the columnar configuration, the instabilities appear only along the Γ − X −M
line and are linked to the polar distortion arising from the Γ-point with the same character as
the former cases. In sharp contrast, no instability appears for the rocksalt configuration. In
particular, the absence of O-Ti-O-Ti-O chain in any direction makes the cubic phase stable.
As reported in Table 7.3, in fact, both the Ti-O and Zr-O interactions are dominated by the
short-range forces and the slightly destabilizing interaction between Ba and O atoms is not
enough to globally destabilize the system.
Since the Zr-doping directly affects the B-O interaction, the system clearly prefers to keep
an isotropic surrounding environment in order to preserve the same kind of interaction in each
direction, i.e. O-Zr-O-Ti-O chains like in the Fm3m-structure. This arrangement prevents the
original Ti-driven polar distortion of BaTiO3. Therefore, the ground-state for the y = 0.50
composition is globally non-polar, as reported in Fig. 7.4(d).

CHAPTER 7. BA(TI,ZR)O3 SOLID SOLUTIONS 105
7.3 VCA vs SUPERCELL approaches
By comparing the results reported in Sec. 7.1 and Sec. 7.2, it becomes clear that the VCA
method is not suitable for describing the Ba(Ti,Zr)O3 solid solutions. The decrease of polariza-
tion for increasing Zr-concentration is obtained in both cases. However, within VCA, neither
the energetics nor the dynamical properties are well reproduced. In particular, VCA does not
detect any instability in the cubic phase already for y > 0.10, whereas it is not the case as
found out in BaTi0.875Zr0.125O3-supercell as well as in the experiments introduced at the begin-
ning of the present section. As already widely discussed, the reason behind such failure is that
VCA does not allow to access distinct contributions to the dynamics arising from the different
nature of the mixed cations as well as the effects due different atomic ordering. The latter is,
in fact, the main variable controlling the dynamics in BTZ. Additionally, we know that the FE
instability in BaTiO3 is strongly sensitive to the O 2p - Ti 3d hybridization. Therefore, as Zr
occupies 4d states, the changes in the electronic properties induced by the Zr-doping directly
affect the dynamics of the system. As such, the way VCA combines the different electronic
properties from the parents BaTiO3 and BaZrO3 is also determinant in the failure of the VCA
approach for BTZ.
In Fig. 7.5 we compare the electronic density of states (DOS) within the two approaches. It
appears that VCA acts in making an “horizontal” average of the DOS of the parent compounds.
This is clearly visible in Fig. 7.5(a), where we have aligned the valence-band maximum of
BaTiO3, BaZrO3 and the VCA compound. In fact, the DOS calculated by VCA is the one of
BaTiO3 horizontally shifted toward that of BaZrO3 proportionally to the 12.5% composition
of Zr since it is linearly interpolating between the 3d states of Ti and 4d states of Zr. In
panel 7.5(b), we reproduce this average by adding up the density of peaks facing one with
the other with the weight fixed by the chosen composition. The result, plotted on top of the
VCA graph, reproduces nicely the calculated DOS (non-linear effects play a minor role in the
creation of fictitious virtual atom).
The way supercell-based calculations combine properties from the parent compounds is
significantly different [Fig. 7.5(c)]. It results to be a straightforward linear combination of
the two DOS. In Fig. 7.5(d), we just added up 78DOSBTO + 1
8DOSBZO and the plot perfectly
overlaps the supercell calculated one.
This distinct way of averaging the electronic properties can be the reason why the two
approaches reproduce different ground-state for the same composition. The incorrect average
location of the d-states of the virtual atoms in VCA (i.e. at higher energy) prevents the correct
p-d hybridization, which is at the basis of the ferroelectric distortion in BaTiO3.

CHAPTER 7. BA(TI,ZR)O3 SOLID SOLUTIONS 106
0
4
8
12
16to
tal D
OS
VCABaTiO3BaZrO3
0
4
8
12
16
0 2 4 6 8 10 12 14 16 18 20
tota
l D
OS
E (eV)
VCAaveraged DOSh-
SUPER CELLBaTiO3BaZrO3
0 2 4 6 8 10 12 14 16 18 20
E (eV)
SUPER CELL
linear combined DOS
(a)
(b)
(c)
(d)
Figure 7.5: Calculated electronic density of states for BaTiO3, BaZrO3 and BaTi0.875Zr0.125O3.Upper panels: DOS of the BTZ solid solution as obtained within VCA (left) and supercell calculation(right) in comparison with the parent compounds. Bottom panels: empirical reproduction of DOSas obtained from “horizontal” average to reproduce the VCA (left) and linear combination for thesupercell case (right).
7.4 Role of cation arrangement
Since the dynamics in Ba(Ti,Zr)O3 is strongly related to the geometrical and atomic ordering
while the polar distortion in BaTiO3 requires correlated displacements along (Ti,O)-chains,
we find it interesting to explore more deeply different compositions and cations arrangements.
Thus, we have performed additional calculations for idealized BaZrO3/BaTiO3 (BZO/BTO)
supercells (Fig. 7.6) in order to clarify the role played by the geometrical environment and
composition in getting ferroelectricity and homogeneous polarization in Ba(Ti,Zr)O3 solid so-
lutions.
At first, we considered a given structural ordering with different composition. We built
1×1×L superlattices (BZO/mBTO) by adding up to six layers of BaTiO3 to one unit cell thick
layer of BaZrO3, as represented in Fig. 7.6(a). This corresponds to decreasing concentrantion
of zirconium from 50% for L=2, to 33% for L=3, 25% for L=4, 20% for L=5 and 17% for
L=6. The total length in terms of unit cells is L = m+1. Then, proceeding from the evolution
with L of the energetics and polarization along the stacking direction, we tried to explain the

CHAPTER 7. BA(TI,ZR)O3 SOLID SOLUTIONS 107
(a)
(b) (c)
1x1xL
1x2xL 2x2xL
Ð
Ñ
y
Figure 7.6: Scheme of the investigated BZO/mBTO-based supercells. (a) 1 × 1 × L superlatticebased on one single chain of BaZrO3-mBaTiO3 with decreasing composition of zirconium. The smallestchain with L=2 corresponds to the layered 50%-composition. The represented chain is doubled alongthe x and y direction to help the visualization of the crystal periodicity. (b)-(c) 1×2×L and 2×2×L
supercells based on alternating chains BaZrO3-mBaTiO3 and BaTiO3-nBaZrO3 to keep a 50% globalcomposition. The smallest cells with L=2 correspond to the columnar and rocksalt 50%-composition,respectively. The represented 1× 2× L-case is doubled along the x to help visualization.
appearance of ferroelectricity by a simple electrostatic model.
In detail, we started our study by investigating the appearance of polarization along the
epitaxy direction of the 1× 1× L superlattice. For each length L, we fully relaxed the centro-
symmetric P4/mmm and the polar P4mm structures, where the inversion symmetry breaking
is due to the atomic displacements along the z direction. As expected, we found no polar distor-
tions along the z direction for L=2. Because of the periodicity of the crystal, this configuration
corresponds, in fact, to the layered structure described in Sec. 7.2.2, Fig. 4.2. Conversely, for
L ≥3 the polar structures have an energy gain with respect to the paraelectric one and values
of polarization increase with the number m of BaTiO3 layers. Values of Ps are reported in
Table 7.4 and in Fig. 7.8. Then we described the atomic distortion from the paraelectric to the
ferroelectric phase as a cooperative motion around the center of mass (CM) of the system, in
order to better clarify the driving mechanism. This description has revealed the active role of
Zr-atom in the polarization against the dynamical properties found out in bulk BaZrO3 as well
as in the investigated Ba(Ti,Zr)O3 solid solutions (Sec. 5.1.4 and 7.2 respectively). For m ≥ 2,
BZO/mBTO superlattice behaves like BaTiO3 with the opposite motion of the O-anions and
(Ti,Zr)-cations. In terms of stiffness, the zirconium atom experiences a much smaller “on-site”
force constant in the direction of the epitaxy, i.e. of the Ti-atoms, that allows for the Zr-
polar motion. Moreover, the associated Born effective charge, of about ≃ 7.2 e, is considerably
anomalous along that direction and comparable to that of Ti.
For the sake of completeness, we also performed DFPT calculations in order to evaluate the
d33 piezoelectric coefficient in the P4mm phase. Results are reported in Table 7.4. Moreover,

CHAPTER 7. BA(TI,ZR)O3 SOLID SOLUTIONS 108
1x1xL 1x2xL 2x2xL
L ∆E P d33 ∆E P d33 ∆E P d33
2 0.0 0.0 0.0 0.0 0.0 0.0 0.0 0.0 0.03 -1.0 17.0 77.3 -0.8 10.2 34.0 -1.3 11.1 28.04 -4.2 24.2 57.2 -5.6 15.9 – -9.2 17.3 –5 -6.7 27.2 52.3 -10.2 18.1 – -16.3 19.7 –6 -8.6 28.9 49.7 -13.8 19.3 – -21.7 21.0 –
Table 7.4: Comparison of P (in µC/cm2) and d33 (in pC/N) as a function of the length L in thethree investigated atomic arrangements, as obtained by Berry-phase and DFPT calculations. For1 × 2 × L and 2 × 2 × L supercells, DFPT calculations have been performed only for L=3. Forcomparison, in P4mm-BaTiO3 we obtained d33 ≃ 43.3 pC/N . Relative energy gain between theoptimized ferroelectric and paraelectric phases [∆E(FE-PE) in meV/f.u.] is also reported.
it results that this polar phase is not the ground-state. In fact, it still presents phonon polar
instabilities (not shown) in the (x, y) plane, i.e. along the preserved Ti-O-Ti-O chains, with
dynamical properties similar to the Ba(Ti,Zr)O3 solid solutions described in Sec. 7.2.
In order to interpret the latter results, specifically the polar activation of Zr, here we adapt
the simple model proposed in Ref. [92] describing the behavior of dielectric/ferroelectric multi-
layers to our BZO/mBTO superlattice.
Neglecting interface corrections, the total energy of a (1, m) superlattice can be written as
E(PBZO, PBTO;m) = UBZO(PBZO) +mUBTO(PBTO)
+ C(m)(PBTO − PBZO)2 (7.1)
Here P is the polarization arising from the displacement of the ions from their high-symmetry
positions under the condition of zero electric field, U is the internal energy of bulk BaZrO3 and
BaTiO3 at zero field as a function of P and C(m)(PBTO − PBZO)2 is macroscopic electrostatic
energy, Eelec, resulting from the eventual presence of non-vanishing electric fields in the layer
when PBZO and PBTO are different. This term typically acts as an energy penalty which
tends to reduce the polarization mismatch in polarizing the dielectric layer and depolarizing
the ferroelectric one. In practice, when the dielectric layer is sufficiently polarizable, this term
forces the system to adopt a uniform polarization along the stacking direction (z direction in
Fig. 7.6), i.e. PBZO = PBTO = P . In this case the model reduces to [204, 205, 206]
E(P ;m) = UBZO(P ) +mUBTO(P ) (7.2)
The energies UBTO(P ) and UBZO(P ) can be directly obtained from appropriate DFT calcu-
lations on pure bulk compounds. In the case of BaTiO3, we built the adiabatic path from the
paraelectric to the ferroelectric P4mm phase (discussed in Sec. 5.2) by means of linear inter-
polation of the atomic displacements. During this interpolation the volume is fixed to the one
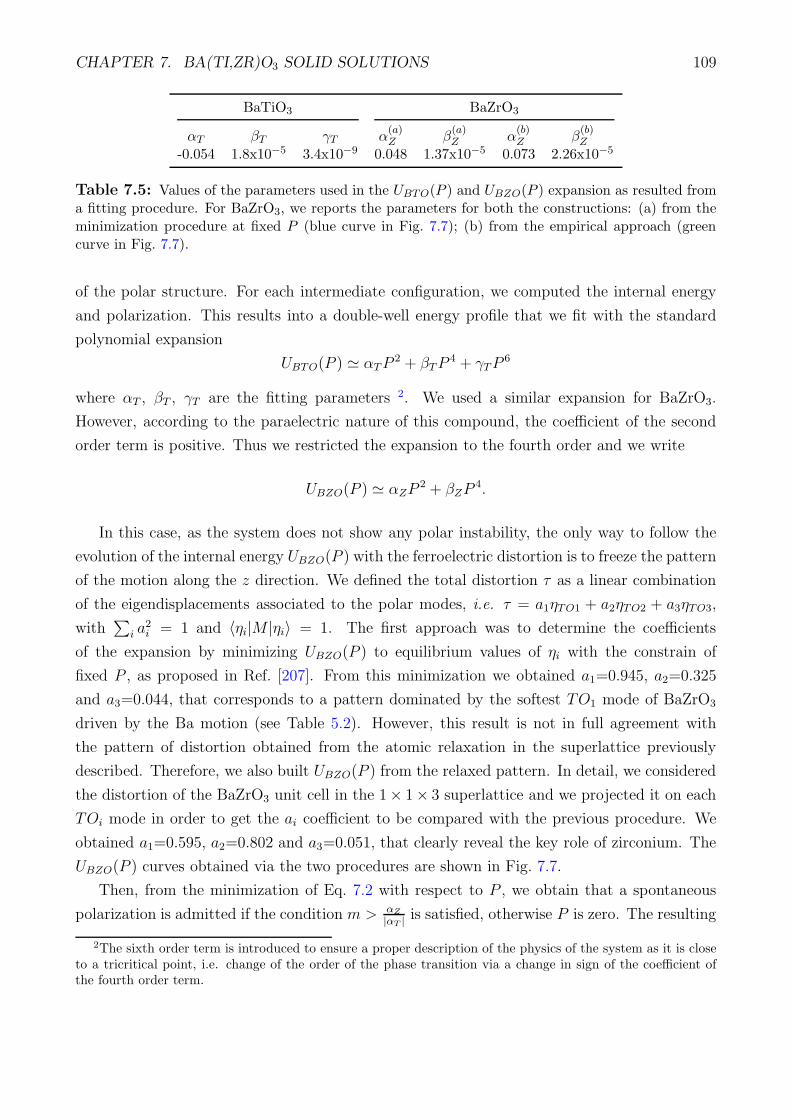
CHAPTER 7. BA(TI,ZR)O3 SOLID SOLUTIONS 109
BaTiO3 BaZrO3
αT βT γT α(a)Z β
(a)Z α
(b)Z β
(b)Z
-0.054 1.8x10⁻⁵ 3.4x10⁻⁹ 0.048 1.37x10⁻⁵ 0.073 2.26x10⁻⁵
Table 7.5: Values of the parameters used in the UBTO(P ) and UBZO(P ) expansion as resulted froma fitting procedure. For BaZrO3, we reports the parameters for both the constructions: (a) from theminimization procedure at fixed P (blue curve in Fig. 7.7); (b) from the empirical approach (greencurve in Fig. 7.7).
of the polar structure. For each intermediate configuration, we computed the internal energy
and polarization. This results into a double-well energy profile that we fit with the standard
polynomial expansion
UBTO(P ) ≃ αTP2 + βTP
4 + γTP6
where αT , βT , γT are the fitting parameters 2. We used a similar expansion for BaZrO3.
However, according to the paraelectric nature of this compound, the coefficient of the second
order term is positive. Thus we restricted the expansion to the fourth order and we write
UBZO(P ) ≃ αZP2 + βZP
4.
In this case, as the system does not show any polar instability, the only way to follow the
evolution of the internal energy UBZO(P ) with the ferroelectric distortion is to freeze the pattern
of the motion along the z direction. We defined the total distortion τ as a linear combination
of the eigendisplacements associated to the polar modes, i.e. τ = a1ηTO1 + a2ηTO2 + a3ηTO3,
with∑
i a2i = 1 and 〈ηi|M |ηi〉 = 1. The first approach was to determine the coefficients
of the expansion by minimizing UBZO(P ) to equilibrium values of ηi with the constrain of
fixed P , as proposed in Ref. [207]. From this minimization we obtained a1=0.945, a2=0.325
and a3=0.044, that corresponds to a pattern dominated by the softest TO1 mode of BaZrO3
driven by the Ba motion (see Table 5.2). However, this result is not in full agreement with
the pattern of distortion obtained from the atomic relaxation in the superlattice previously
described. Therefore, we also built UBZO(P ) from the relaxed pattern. In detail, we considered
the distortion of the BaZrO3 unit cell in the 1× 1× 3 superlattice and we projected it on each
TOi mode in order to get the ai coefficient to be compared with the previous procedure. We
obtained a1=0.595, a2=0.802 and a3=0.051, that clearly reveal the key role of zirconium. The
UBZO(P ) curves obtained via the two procedures are shown in Fig. 7.7.
Then, from the minimization of Eq. 7.2 with respect to P , we obtain that a spontaneous
polarization is admitted if the condition m > αZ
|αT |is satisfied, otherwise P is zero. The resulting
2The sixth order term is introduced to ensure a proper description of the physics of the system as it is closeto a tricritical point, i.e. change of the order of the phase transition via a change in sign of the coefficient ofthe fourth order term.

CHAPTER 7. BA(TI,ZR)O3 SOLID SOLUTIONS 110
0
100
200
300
400
500
Ò60 Ò40 Ò20 0 20 40 60
∆E
(m
eV
/f.u
.)
P (µC/cm2)
BaTiO3
BaZrO3: approach 1
BaZrO3: approach 2
Figure 7.7: Variation of total energy (in meV/f.u.) as a function of the varying polarization (inµC/cm2) from the centric to the polar configurations for distorted bulk BaTiO3 (red squares) andBaZrO3. For the latter, curves as obtained within the two approaches are reported: (blue triangles)from the minimization procedure at fixed P ; (green circles) from the relaxed pattern of distortion of1× 1× 3 superlattice.
formula for the polarization and energy are
P 2(α, β,m) ≃ − mαT + αZ
2(mβT + βZ)
E(α, β,m) ≃ −(mαT + αZ)2
4(mβT + βZ)
Coefficients are reported in Table 7.5. The evolution of P and E resulting from the electro-
static model within the two different approaches and from DFT calculations are reproduced in
Fig. 7.8. The two models globally reproduce the same trend, however the second one built on
the relaxed pattern is in better agreement with the calculations. In fact, from the parameters re-
lated to the first curve, with smaller curvature, a polar state is admitted for all m instead of the
condition m ≥ 2. On one hand, the quantitative inconsistencies between the two approaches,
both in the distortion pattern and in ferroelectric properties of the superlattice, point out that
a simple model only based on pure bulk quantities can fail in reproducing the dynamics of the
system because of strong coupling between the two different B-cations at play. On the other
hand, the perfect agreement obtained between the “second” model and first-principles calcu-
lations (Fig. 7.8) confirms the validity of the hypothesis of uniform P in the superlattice, i.e.
electrostatic energy cost equal to zero, due to the fact that the polar distortion of Zr preserves
the charge transfer along Zr-O-Ti-O-Ti-O chains. Moreover, P asymptotically approaches the
value of P4mm-BaTiO3, that is of about ≃ 34 µC/cm2 as calculated via DFT.
These results, in particular the cooperative BaTiO3-like atomic motion along the Zr-O-Ti-
O-Ti-O chains, are the manifestation of the “chain-like” nature of the distortion. In fact, we

CHAPTER 7. BA(TI,ZR)O3 SOLID SOLUTIONS 111
m
1 2 3 Ó 5 6
0
5
10
15
20
25
30
35
P (
µC
/cm
2)
ELEC MODEL 1
ELEC MODEL 2
ÔÕÖ
−20
−15
−10
−5
0
E (
meV
/f.u
.)
−×ØÙÚ
0
1
Figure 7.8: Evolution of the total polarization (in µC/cm2) and energy (in meV/formula unit) asa function of increasing number m of BTO-layers. Values obtained from DFT calculations and fromthe electrostatic model are reported. We refer to results coming from the first approach based on theminimization at fixed P as model 1, while to those based on the relaxed pattern as model 2. The insetshows the different energies for m = 1. The E from DFT calculations refers to the relative energygain between the optimized ferroelectric phase and the centro-symmetric reference with volume fixedto that of the polar structure.
already discussed in Sec. 7.2 how the break of correlated Ti-O chains introduced by the polar
inactive Zr prevents the propagation of the original BaTiO3 distortion in Ba(Ti,Zr)O3 solid
solutions. Nevertheless, when a minimum number of consecutive Ti atoms are preserved along
those chains, the substitution of one atom of Ti with one of Zr does not suppress the polariza-
tion. On the contrary, the electrostatic coupling forces the system to sustain a homogeneous P
by making Zr polar active.
Previous calculations and physical interpretation have been based on superlattices with de-
creasing Zr-concentration. Therefore, in order to further prove the crucial role played by the
local “chain-like” correlation over the increasing BTO-concentration, we have better distin-
guished the effects arising from the composition and from the imposed atomic ordering. Thus
we carried DFT calculations on 1 × 2 × L and 2 × 2 × L ordered supercells as we did for the
1 × 1 × L case. These two supercells, composed by alternating single chains of BZO/mBTO

CHAPTER 7. BA(TI,ZR)O3 SOLID SOLUTIONS 112
and BTO/nBZO, allow to keep the total composition fixed to 50% of Zr and Ti and to preserve
locally the imposed “chain-like” atomic ordering, as reproduced in Fig.7.6(b,c).
For both the arrangements, it is not surprising to get no polar phases for L = 2 from the
inversion symmetry breaking along the z direction. In fact, by periodicity, these structures
correspond to the columnar and rocksalt orders described in Sec. 7.2.2 (Fig. 4.2). Relevant re-
sults arise from L ≥ 3, since a spontaneous polarization appears along the BZO/mBTO chains
driven by the (Zr,Ti)-motion against the oxygens inside the global BaTi0.50Zr0.50O3 matrix. As
in the 1 × 1 × L superlattice, in fact, we described the atomic displacements as a cooperative
motion around CM and we found out that most of the polar distortion comes from the B-
cations stacked on the local BZO/mBTO chains. We also obtained sizeable d33 piezoelectric
coefficient, but smaller than in the 1 × 1 × L and pure P4mm-BaTiO3 cases, as reported in
Table 7.4 (because of the high computational cost for these supercells, we performed DFPT
calculations only for the case L=3). A simple explanation could be that the coexistence of the
BZO/mBTO and BTO/nBZO chains, that behave differently since the cations in the latter one
do not participate to the polarization, could globally prevent the variation of P . Noteworthy
is that the polar P4mm phase within the 2× 2× L structure is stable.
The main finding from the comparison of results coming from the three different structures
is the polar activation of zirconium in Ba(Ti,Zr)O3 system as a function of specific atomic or-
dering, that is local BZO/mBTO chains with m ≥ 2, and independent of the total composition
of the matrix. Therefore, the analysis and physical interpretation of the dynamics conducted
through the previous electrostatic model remains valid also for the 1×2×L and 2×2×L cases:
Zr atom is locally activated by a Zr-Ti coupling to avoid polarization gradients and electrostatic
energy cost. But then, the gain of energy related to polarizing ferroelectric BaTiO3 is decreased
by the energy cost to polarize BaZrO3.
From the U(P ) curves of the pure compounds in Fig. 7.7 and trends reported in Fig. 7.8,
the maximum Zr-concentration to get a ferroelectric system seems to be around 30% in agree-
ment with experimental observations. Beyond this concentration, the results are line with the
observed relaxor behavior of BaTi1−yZryO3 and existence of polar nanoregions associated to
local fluctuation of y, that allows for correlated polar motions, as described in Refs. [209, 208,
210, 212]. Maiti et al., in their experimental investigation of the correlation between structure
and property in Ba(Ti,Zr)O3 ceramics [208, 211], point out that a gradual incorporation of
Ti4+ into the nonpolar BaZrO3 lattice results in the evolution of relaxation behavior because
of the increasing amount of ordering and density of nano-sized Ti4+-rich polar regions in the
Zr4+-rich matrix. Moreover, C. Laulhe et al. suggest that the observation of such polar nanore-
gions consist in 1D-chains with correlated Ti displacements [210]. By means of Monte-Carlo
simulations, Akbarzadeh et al. describe the Ti sites as nuclei acting to formation of polar
clusters with rather small contribution from Zr sites [212].

CHAPTER 7. BA(TI,ZR)O3 SOLID SOLUTIONS 113
Accordingly, by means of combined DFT calculations and phenomenological model, we
have provided a complementary microscopic information. In particular, the behavior of the
polar-clusters in a global paraelectric-matrix, like the case of the investigated BaTi0.50Zr0.50O3
composition, may be due to the cooperative motion of Zr and Ti atoms and not only by isolated
Ti-dipoles.

Chapter 8
Discussion & Conclusions
In this thesis, we have investigated the dynamical, structural, ferroelectric and related prop-
erties of chosen compositions of (Ba,Ca)TiO3-Ba(Ti,Zr)O3 solid solutions and related parent
compounds by means of first-principles calculations based on Density Functional Theory, with
the intent to identify some of the key microscopic mechanisms behind the enhanced piezo-
electric properties of (Ba,Ca)(Ti,Zr)O3. In particular, we have focused on the evolution of
the properties in (Ba,Ca)TiO3 and Ba(Ti,Zr)O3 solid solutions (Chap. 6 and Chap. 7) and
analyzed them in relationship with those of the pure BaTiO3, CaTiO3, CaZrO3 and BaZrO3
parent compounds (Chap. 5) in order to disentangle the role of individual atomic substitutions
at the A- and B-sites. In fact, these two solid solutions result from the mixing of systems with
very different dynamics. This turns out to be a crucial point regarding the suitableness of the
ab-initio method employed, VCA vs direct supercell calculations.
When going from BaTiO3 to CaTiO3 in (Ba,Ca)TiO3, the main feature is the mixing of
the so called B-driven and A-driven ferroelectricity associated to the two parent compounds,
respectively. Cubic BaTiO3, in fact, exhibits strong and highly polar instabilities that expand
over the entire Γ-X-M planes of the Brillouin zone, as shown in Fig. 5.1(a). They are de-
termined by the destabilizing Ti-O interaction resulting in the relative motion of Ti atoms
with respect to oxygens. Particularly, this polar distortion requires cooperative atomic dis-
placements along Ti-O chains. From the electronic point of view, such instability is ascribed
to the hybridization between the O 2p and Ti 3d states [187]. The sizeable stiffness of Ba
determines its negligible contribution to the distortion instead. Related values of the “on-site”
and interatomic force constants are reported in Tables 5.1 and 5.3. These mechanisms stabi-
lize the rhombohedral R3m-phase, as reported in Fig. 5.2 and Fig. 6.5(a). On the contrary,
CaTiO3, in its cubic phase, hosts a strong polar instability confined at Γ and mostly related
to a polar motion of Ca and O. In fact, we found that a strong destabilizing interaction occurs
between these two atoms (Table 5.3). Such Ca driven instability is ascribed to steric effects
as the smaller size and greater softness of Ca than Ba (Tables 4.1 and 5.1). In fact, same
dynamical properties characterize CaZrO3, for which the covalency between Zr and O is even
further reduced [187]. Additionally, the reduced volume of cubic CaTiO3 compared to BaTiO3
114

CHAPTER 8. DISCUSSION & CONCLUSIONS 115
shortens the Ti-O distances, making the Ti-O interaction mainly repulsive and Ti atoms much
more stiffer (volume effect on Ti-O interaction is shown in Fig. 6.4). These mechanisms favor
the tetragonal P4mm-phase over the R3m-one in CaTiO3 [Fig. 5.2 and Fig. 6.5(c)]. However,
the ground-state of CaTiO3 is determined by the strong AFD instabilities present along the
M − R line [see Fig. 5.1(b) and Fig. 5.2]. Consequently, as obtained from supercell calcula-
tions for BaTiO3-rich compositions, the mixing of the two A-cations in Ba1−xCaxTiO3 solid
solutions does not make barium active in the polar distortion, but introduces a cooperative
motion of Ca-atoms together with Ti-atoms against the oxygens-cage, i.e. interplay between
A-site and B-site driven polar distortion [Fig. 6.5(h)]. A ferroelectric ground-state is then
predicted up to x = 0.50. As it is expected from the dynamical properties and energetics of
the two parent compounds, the increasing Ca-concentration favors P4mm-like polar phases
over the R3m one. In particular, in the Ba-rich region, the evolution from the B-type to the
A-type ferroelectricity promoted by the partial atomic substitution of Ba with Ca arises from
the interplay of two distinct mechanisms: the weakening of Ti-driven ferroelectricity via the
modification of the Ti-O interactions and the emergence of Ca-driven ferroelectricity sustained
by the Ca-O interactions. Such effects, then, reduce and eventually suppress the energy barrier
between the different polar phases. This behavior yields to increasing piezoelectric response as
the energy landscape in terms of polarization orientation becomes quasi-isotropic. Specifically,
these properties are found in Ba0.875Ca0.125TiO3, as obtained from the use of 2 × 2 × 2 super-
cells [Figs. 6.5(b,e)]. Interesting and qualitatively compatible trends have been also achieved
within the VCA approach. However, within VCA the distinction of the dynamics of Ba and
Ca atoms is not accessible, because only a final average effect from the two cations at the same
A-site is reproduced, as shown in Fig. 6.1(c). This method forces the change of character of
the mechanisms at play without allowing distinction of the opposite nature of Ba and Ca. In
fact, Ca is actually polar active for each composition x. Such a limitation is especially evident
in the finding of the concentration where the inversion of polar phases takes place, and in the
polarization trend, that is decreasing with Ca-concentration within VCA, while it is increasing
within the supercells.
When going from BaTiO3 to BaZrO3 in Ba(Ti,Zr)O3, the scenario is completely different.
BaZrO3, in fact, does not host any polar instability. Zr atom is quite stiff and the Zr-O
interaction is strongly repulsive, as reported in Table 5.1 and Table 5.3. From the electronic
point of view, this can be ascribed to the fact that Zr occupies 4d states less hybridized with
the 2p states of O. Therefore, at first, low Zr-concentration indirectly further stabilizes the
R3m-phase in BaTi1−yZryO3 [Fig. 7.4(c)] because of the larger ionic radius of Zr than Ti,
i.e. volume effect on the dynamics of BaTiO3. However, the spontaneous polarization is
slightly reduced. Then, for higher Zr-concentration, the system tends to globally reduce the
polar distortion, thus suppressing the original ferroelectricity of BaTiO3. In fact, the presence
of Zr on the B-site introduces breaks along the correlated Ti-O-Ti-O chains, preventing the
preservation of polarization. Such mechanisms are evident both for y = 0.125 and y = 0.50

CHAPTER 8. DISCUSSION & CONCLUSIONS 116
supercells compositions. For instance, in BaTi0.50Zr0.50O3, the energetically favored Fm3m
nonpolar phase is stable. Nevertheless, polar nanoregions can be locally preserved in Ti-rich
regions. Additionally, by building different supercell environments based on BaZrO3/mBaTiO3
chains (Fig. 7.6), we found that as soon as Zr experiences at least 2 subsequent Ti atoms, it
becomes active in the polarization and a cooperative motion of the two B-cations is observed.
The reason of such behavior, explained via a basic electrostatic model, is that Zr is locally
activated in order to preserve homogeneous polarization along the Zr-O-Ti-O-Ti-O chain and
to minimize the electrostatic energy cost. Such important role played by local structures on
the Zr-Ti dynamics and differences in the electronic configuration of the two B-cations make
VCA not suitable for the Ba(Ti,Zr)O3 system. In fact, predictions achieved via supercell-based
calculations concerning both the dynamics and energetics are not reproduced by VCA.
From a methodological point of view, in both (Ba,Ca)TiO3 and Ba(Ti,Zr)O3, we found
that the two types of cations introduced at the A and B sites, respectively, behave very differ-
ently and, therefore, the mixing can hardly be described by averaged virtual atoms. Although
providing some trends, VCA is therefore not suitable for reproducing and understanding the
microscopic physics of (Ba,Ca)(Ti,Zr)O3 solid solutions. By construction, in fact, this approxi-
mation fails in reproducing both specific local arrangements and same-site independent motion
of the active atoms involved in the ferroelectric instabilities, oversimplifying the actual dy-
namical and electronic properties of the solid solutions. These are key features for the overall
behavior of BaTiO3-based solid solutions, which thus need to be addressed by means of direct
supercell calculations. This also clarifies why recent attempts [213] to study BCTZ from a
VCA-based effective Hamiltonian required to adjust by hands some of the parameters initially
fitted from first-principles in order to reproduce experimental data.
In conclusion, we have seen that in (Ba,Ca)TiO3 the competition between the B-type and
the A-type ferroelectricity of the two parent compounds is the key mechanism behind the
eventual competition between different polar phases. In fact, BaTiO3 and CaTiO3 have a
reversed energy sequence of ferroelectric states so that a crossover between them is required to
achieve the inversion. The achievement of such crossover manifests in quasi-degeneracy of the
energy landscape and quasi-isotropic polarization, thus enhancing the piezoelectric response.
Different behaviors characterize Ba(Ti,Zr)O3, where the appearance of ferroelectricity is
strongly dependent on the local atomic arrangements and electrostatic. BaZrO3, in fact, ex-
hibits highly stable cubic phase. The increasing substitution of Ti by Zr thus acts to reduce the
spontaneous polarization and progressively suppress the overall ferroelectricity. Nevertheless,
polar nanoregions can be preserved in Ti-rich regions.
Moreover, we have provided a direct comparison between the virtual crystal approxima-
tion (VCA) and direct supercell calculations, showing that the specific microscopic physics of
(Ba,Ca)TiO3 and Ba(Ti,Zr)O3 solid solutions imposes severe limitations to the applicability of
VCA.

CHAPTER 8. DISCUSSION & CONCLUSIONS 117
With respect to the experimentally observed enhanced piezoelectric response in BCTZ
around the polymorphic phase boundary (PPB) at 0.135 . x . 0.15 and 0.10 . y . 0.11
concentrations of Ca and Zr respectively (i.e. low Ca- and Zr- concentrations) [44, 54, 106]
(Fig. 1.2), our study reveals that a key microscopic factor is the interplay between weakened
Ti-driven ferroelectricity and emerging Ca-driven ferroelectricity, both promoted by steric ef-
fects. On the one hand, small concentration of Zr does not drastically affect the original
dynamics of BaTiO3, preserving, indeed, the R3m ferroelectric ground-state. However, it acts
to contract the spontaneous polarization. On the other hand, the presence of Ca strongly
change the dynamical properties of the full system. In particular, small Ca-concentration in-
duces a competition between the Ti-driven ferroelectricity and the Ca-driven ferroelectricity,
which would favor separately either a rhombohedral or a tetragonal phase. This thus provides
the condition for minimal anisotropy with respect to directions of the polarization and mani-
fests in the enhancement of the piezoelectric response.
Providing such a theoretical investigation on an atomic scale, we believe that our work sig-
nificantly contributes to clarify the microscopic physics of BaTiO3-based systems and provides
a solid background to further investigations of the important family of BCTZ solid solutions
via advanced large-scale and finite-temperature simulations. Moreover, the revealed complex
mechanisms involved in the dynamics of such systems, might be exploited to develop advanced
effective Hamiltonian approaches expanding the number of the key atomic degrees of freedom,
going beyond the standard use of VCA. Furthermore, discussing the physics, it is of generic
interest to both theorists and experimentalists and might be also relevant to the discussion of
other families of solid solutions.
Most of the discussed results are published in D. Amoroso, A. Cano, and Ph. Ghosez, Phys.
Rev. B, 97, 174108 (2018).

Appendix A
Distorted phases of BaZrO3
As introduced in Sec. 5.2, the condensation of the out-of-phase oxygen rotations (Table 5.5) as-
sociated to the tiny instability at the R point of the cubic Brillouin zone of BaZrO3 [Fig. 5.1(c)],
brings the system to lower energy antiferrodistortive structures. The energetics, angle of rota-
tion and volume (per 5-atom cell) of the tetragonal-I4/mcm (T), orthorhombic-Imma (O) and
rhombohedral-R3c (R) phases with respect to the cubic-Pm3m phase are reported in Fig. A.1.
0
1
2
3
Û
5
Θ
CUBIC RHOMBO ORTHOORTHO TETRA
Pm-3m
a0a0a0R-3c
a-a-a-Imma
a0b-b-I4/mcm
a0a0c-
−3
−2
−1
0
E (
meV
/f.u
.)
ÜÝ
Þßàá
âãäå
æçèç
é
3
Figure A.1: Energy gain (in meV/f.u.), rotational angle Θ, and volume (in A3/f.u.) for T, O, andR antiferrodistortive phases of BaZrO3 with respect to the cubic phase. Structures have been fullyrelaxed within GGA-WC functional.
118

APPENDIX A. DISTORTED PHASES OF BAZRO3 119
In particular, these AFD phases result all stable, as shown by the phonon dispersion curves in
Fig. A.2. Phonon calculations have been performed on the fully relaxed AFD structures, and
structural details are reported in Table A.1.
Structure Lattice parameters Wyckoff positions
I4/mcm a=b= 5.907 A α = β = γ = 90 Ba 4 b 0.00000 0.50000 0.25000c= 8.382 A Zr 4 c 0.00000 0.00000 0.00000
O1 8 h 0.77000 0.27000 0.00000O2 4 a 0.00000 0.00000 0.25000
Imma a= 5.912 A α = β = γ = 90 Ba 4 e 0.00000 0.25000 0.50046b= 8.355 A Zr 4 a 0.00000 0.00000 0.00000c= 5.922 A O1 4 e 0.00000 0.25000 0.02738
O2 8 g 0.25000 0.51389 0.25000
R3c a=b=c 5.911 A α = β = γ = 60 Ba 2 a 0.25000 0.25000 0.25000Zr 2 b 0.00000 0.00000 0.00000O 6 e 0.77200 0.72800 0.25000
Table A.1: Structural details for the I4/mcm, Imma, and R3c AFD optimized structures.Structural analysis has been done via FINDSYM tool [218].
In order to provide an insight into these distorted phases of BaZrO3, we also provide here
the analysis of the zone-center phonon modes. Such analysis can be useful for the interpretation
of infrared and/or Raman spectra, being the low-temperature properties of BaZrO3 still under
discussion [214, 163, 215]. Therefore, the irreducible representations at Γ (0,0,0) for the three
AFD phases in Mulliken’s notation [216] are:
I4/mcm
Γacoustic = A2u ⊕ Eu
Γoptic = A1g ⊕ A1u ⊕ 2A2g ⊕ 3A2u ⊕B1g ⊕B1u ⊕ 2B2g ⊕ 5Eu ⊕ 3Eg
Imma
Γacoustic = B1u ⊕ B2u ⊕ B3u
Γoptic = 3Ag ⊕ 2Au ⊕ 2B1g ⊕ 5B1u ⊕ 3B2g ⊕ 4B2u ⊕ 4B3g ⊕ 4B3u
R3c
Γacoustic = A2u ⊕ Eu
Γoptic = A1g ⊕ 2A1u ⊕ 3A2g ⊕ 3A2u ⊕ 5Eu ⊕ 4Eg
In Table A.2, we report the zone-center phonon frequencies and assignments of the associated
modes for these distorted phases.

APPENDIX A. DISTORTED PHASES OF BAZRO3 120
Fre
qu
ency
(cm
-1)
0
170
340
510
680
850
Γ X P N Γ P
Fre
quen
cy (
cm-1
)
0
170
340
510
680
850
Γ T W R S Γ W
(0 0 0) êëìí 1/2 0) (1/2 1/2 1/2) (1/2 0 1/2) (0 0 0) (1/2 1/2 1/2)
(0 0 0) (1/2 1/2 0) (1/2 1/2 1/2) (1/2 0 1/2) (0 0 0) (1/2 1/2 1/2)(0 1/2 1/2)
Fre
quen
cy (
cm-1
)
0
170
340
510
680
850
Γ F Z Y Γ Z(0 0 0) (1/2 1/2 0) (1/2 1/2 1/2) (1/2 0 1/2) (0 0 0) (1/2 1/2 1/2)
TETRA-I4/mcm
ORTHO-Imma
RHOMBO-R-3c
BaZr
O
BaZr
O
BaZr
O
Figure A.2: Calculated phonon dispersion curves of I4/mcm, Imma and R3c antiferrodistortivestructures associated to out-of-phase oxygen rotations in BaZrO3. Phonon density of states by atomicspecies are also reported on the right side of the phonon band structures. Different colors indicate thedifferent atomic contributions in the corresponding eigenvectors as in Ref. [102] (red for the A atom,green for B atom and blue for O atoms). Small anomalies in the proximity of the high-symmetryQ-points in the phonon dispersion curves of the O and R structures are matter of accuracy in theinterpolation procedure to extrapolate the curves [61]. Therefore, they do not have physical meaningand do not affect the provided analysis.

APPENDIX
A.DISTORTED
PHASESOFBAZRO
3121
I4/mcm-T Imma-O R3c-R
ω (cm−1) mode deg. activity ω (cm−1) mode deg. activity ω (cm−1) mode deg. activity
23.49 Eg 2 Raman 20.01 B2g 1 Raman 7.27 Eg 2 Raman92.72 A1g 1 Raman 23.02 B1g 1 Raman 88.50 A1g 1 Raman101.82 Eg 2 Raman 87.07 Ag 1 Raman 98.24 A2g 1 silent104.36 B2g 1 Raman 100.41 B2g 1 Raman 99.34 A2u 1 IR106.52 Eu 2 IR 101.36 B3g 1 Raman 104.43 Eg 2 Raman113.38 A2u 1 IR 103.75 B3u 1 IR 111.66 Eu 2 IR191.57 Eu 2 IR 106.71 B2u 1 IR 187.82 Eu 2 IR194.52 A2u 1 IR 107.17 Ag 1 Raman 193.20 A2u 1 IR194.72 Eu 2 IR 114.24 B1u 1 IR 194.91 Eu 2 IR199.53 B1u 1 silent 186.36 B3u 1 IR 204.16 A1u 1 silent301.13 A1u 1 silent 191.90 Au 1 silent 300.89 A1u 1 silent302.03 Eu 2 IR 193.75 B2u 1 IR 302.29 Eu 2 IR356.41 Eg 2 Raman 193.85 B3u 1 IR 353.29 A2g 1 silent358.05 B2g 1 Raman 194.10 B1u 1 IR 358.38 Eg 2 Raman494.37 Eu 2 IR 204.40 B1u 1 IR 494.27 A2u 1 IR496.48 A2u 1 IR 300.73 Au 1 silent 496.52 Eu 2 IR534.22 A2g 1 silent 302.11 B1u 1 IR 535.38 Eg 2 Raman535.33 B1g 1 Raman 302.48 B2u 1 IR 791.52 A2g 1 silent790.83 A2g 1 silent 354.31 B2g 1 Raman
356.37 B3g 1 Raman359.78 Ag 1 Raman494.07 B3u 1 IR494.75 B2u 1 IR497.47 B1u 1 IR534.78 B1g 1 Raman535.53 B3g 1 Raman791.18 B3g 1 Raman
Table A.2: Calculated phonon frequencies ω (in cm−1) at the Γ (0 0 0) point of the I4/mcm, Imma, and R3c Brillouin zone. Thesymmetry assignments in Mulliken’s notation, degeneracy and activity in the infrared (IR) or Raman spectroscopy for each mode are alsoreported. The analysis relies on SAM [220] and SMODES [221] tools.

Appendix B
Discussion et conclusions : resumeLes piezoelectriques a haute performance sont des composants cles pour les dispositifs agiles. Il
a ete demontre recemment que les solutions solides (Ba,Ca)(Ti,Zr)O3 (BCTZ) presentent des
proprietes electromecaniques prometteuses. Cependant, les mecanismes microscopiques con-
duisant a de telles caracteristiques restent a eclaircir, et les investigations theoriques de BCTZ
demeurent tres limitees a ce jour. En consequence, cette these propose d’etudier les proprietes
de differentes compositions de solutions solides (Ba,Ca)TiO3-Ba(Ti,Zr)O3 au moyen de calculs
de premier principe fondes sur la theorie de la fonctionnelle de la densite, en mettant l’accent sur
la dynamique du reseau et sur la competition entre differentes phases ferroelectriques. L’objectif
principal est d’identifier certains des mecanismes microscopiques essentiels a l’origine des pro-
prietes piezoelectriques ameliorees de (Ba,Ca)(Ti,Zr)O3. En particulier, nous nous sommes
concentres sur l’evolution des proprietes des solutions solides (Ba,Ca)TiO3 et Ba(Ti,Zr)O3
(Chap. 6 et Chap. 7) et les avons analysees en relation avec celles des composes parents BaTiO3,
CaTiO3, CaZrO3 et BaZrO3 (Chap. 5) afin de differencier le role des substitutions atomiques
individuelles sur les sites A et B. En fait, ces deux solutions solides resultent du melange de
systemes ayant chacun une dynamique tres differente. Cela s’avere etre un point crucial en ce
qui concerne l’adequation de la methode ab-initio employee, calculs VCA vs calcul direct de
supercellule.
Lorsqu’on passe continument de BaTiO3 a CaTiO3 dans (Ba,Ca)TiO3, la caracteristique
principale est une transformation progressive de la ferroelectricite de type B en type A, as-
sociee respectivement aux deux composes parents. Le BaTiO3 cubique presente en effet des
instabilites fortes et hautement polaires qui se developpent sur l’ensemble des plans Γ−X−Mde la zone de Brillouin, comme indique sur la Fig. B.3(a). Ces instabilites sont determinees par
l’interaction destabilisante Ti-O produisant le mouvement relatif des atomes de Ti par rapport
aux ions oxygene. En particulier, cette distorsion polaire necessite un mouvement atomique
cooperatif le long les chaınes Ti-O. Du point de vue electronique, cette instabilite est attribuee
a l’hybridation entre les etats Ti 3d et O 2p [187]. La raideur considerable de Ba determine
sa contribution negligeable a la distorsion. Les valeurs associees aux constantes de force sur
chaque site atomique (“on-site”) et interatomique sont presentees dans les tableaux 5.1 et 5.3.
Ces mecanismes stabilisent la phase rhomboedrique R3m, comme indique dans les Fig. B.4
122

APPENDIX B. RESUME 123
et Fig. B.9(a). Au contraire, CaTiO3, dans sa phase cubique, heberge une forte instabilite
polaire confinee a Γ, qui est principalement liee a un mouvement polaire de Ca et O. En fait,
nous avons constate qu’une forte interaction destabilisatrice se produit entre ces deux atomes
(tableau 5.3). Cette instabilite guidee par le calcium est attribuee aux effets steriques en raison
de la plus petite taille et de la plus grande douceur du Ca par rapport au Ba (Tableaux 4.1
et 5.1). En fait, les memes proprietes dynamiques caracterisent CaZrO3, pour lequel la cova-
lence entre Zr et O est reduite. De plus, le volume reduit de CaTiO3 cubique par rapport a
BaTiO3 raccourcit les distances Ti-O, rendant l’interaction Ti-O principalement plus repulsive
et les atomes de Ti beaucoup plus rigides (l’effet de volume sur l’interaction Ti-O est illustre a la
Fig. B.8). Ces mecanismes favorisent la phase tetragonale P4mm par rapport a la phase R3m
dans CaTiO3 [Fig. B.4 et Fig. B.9(c)]. Cependant, l’etat fondamental de CaTiO3 est determine
par les fortes instabilites antiferrodistorsives (AFD) presentes le long de la brancheM−R [voir
Fig. B.3(b) et Fig. B.4]. Par consequent, tel qu’obtenu par des calculs en supercellule effectues
pour des compositions riches en BaTiO3, le melange des deux cations A dans des solutions
solides Ba1−xCaxTiO3 ne rend pas le baryum actif dans la distorsion polaire, mais introduit
un mouvement cooperatif des atomes de Ca avec des atomes de Ti contre les oxygenes, c.-a-d.
une interaction entre la distorsion polaire guidee par le site A et le site B [Fig. B.9(h)]. Un
etat fondamental ferroelectrique est ensuite predit jusqu’a x = 0.50. Comme attendu au vu des
proprietes dynamiques et energetiques des deux composes parents, la concentration croissante
de Ca favorise des phases polaires de type P4mm par rapport aux phases de type R3m. En
particulier, dans la region riche en Ba, l’evolution de la ferroelectricite de type B vers le type A,
favorisee par la substitution atomique partielle de Ba par Ca, resulte de l’interaction de deux
mecanismes distincts: l’affaiblissement de la ferroelectricite guidee par Ti via la modification
des interactions Ti-O et l’emergence d’une ferroelectricite guidee par Ca soutenue par les inter-
actions Ca-O. Ces effets reduisent et, finalement, suppriment la barriere energetique entre les
differentes phases polaires. Ce comportement conduit a une reponse piezoelectrique croissante
car le paysage energetique en termes d’orientation de polarisation devient quasi-isotrope. Plus
precisement, ces proprietes ont ete trouvees dans Ba0.875Ca0.125TiO3, a partir de l’utilisation de
supercellules 2× 2× 2 [Figs. B.9(b,e)]. Des tendances interessantes et qualitativement compat-
ibles ont egalement ete obtenues dans l’approche VCA. Cependant, dans l’approche VCA, la
distinction entre la dynamique des atomes de Ba et de Ca n’est pas accessible, car seul un effet
moyen final des deux cations sur le meme site A est reproduit, comme le montre la figure 6.1(c).
Cette methode force le changement de caractere des mecanismes en jeu sans permettre la dis-
tinction de la nature opposee de Ba et Ca. En fait, Ca est actif dans la polarisation pour
chaque composition x. Une telle limitation est particulierement evidente dans la decouverte
de la concentration a laquelle se produit l’inversion des phases polaires et dans la tendance de
polarisation, qui diminue avec la concentration de Ca dans VCA, alors qu’elle augmente dans
les supercellules.
Lorsqu’on passe continument de BaTiO3 a BaZrO3 dans Ba(Ti,Zr)O3, le scenario est tres

APPENDIX B. RESUME 124
different. Le BaZrO3, en effet, n’heberge aucune instabilite polaire. L’atome de Zr est assez
rigide et l’interaction Zr-O est fortement repulsive, comme l’indiquent les tableaux 5.1 et Ta-
ble 5.3. Du point de vue electronique, cela peut etre attribue au fait que Zr occupe des etats 4d
moins hybrides avec les etats 2p de O. Par consequent, au debut, une faible concentration en Zr
stabilise indirectement la phase R3m dans BaTi1−yZryO3 [Fig. B.15(c)] en raison du rayon ion-
ique de Zr superieur a celui de Ti, c’est-a-dire un effet de volume sur la dynamique du BaTiO3.
Cependant, la polarisation spontanee est legerement reduite. Ensuite, pour une concentration
plus elevee en Zr, le systeme a tendance a reduire globalement la distorsion polaire, supprimant
ainsi la ferroelectricite initiale de BaTiO3. En fait, la presence de Zr sur le site B introduit des
ruptures locales dans les chaınes correlees Ti-O-Ti-O, empechant la preservation de la polarisa-
tion. De tels mecanismes sont evidents pour les concentrations y = 0.125 et y = 0.50 etudiees
au moyen de supercellules. Par exemple, au sein de BaTi0.50Zr0.50O3, la phase non polaire
Fm3m est stable et preferee par des considerations energetiques. Neanmoins, des nanoregions
polaires peuvent etre localement preservees dans des regions riches en Ti. De plus, en con-
struisant differents environnements de supercellules bases sur des chaınes BaZrO3/mBaTiO3
(Fig. B.17), nous avons trouve que des que Zr est suivi par 2 atomes de Ti, il devient actif
dans la polarisation et un mouvement cooperatif des deux cations B est observe. La raison de
ce comportement, expliquee via un modele electrostatique de base, est que Zr est localement
active afin de preserver une polarisation homogene le long de la chaıne Zr-O-Ti-O-Ti-O et ainsi
minimiser le cout de l’energie electrostatique. Ce role important joue par les structures locales
sur la dynamique du Zr-Ti et les differences de configuration electronique des deux cations sur
le site B rend l’approche VCA inadequate au systeme Ba(Ti,Zr)O3. En fait, les predictions
obtenues au moyen de calculs effectues sur les supercellules concernant a la fois la dynamique
et l’energetique ne sont pas reproduits par VCA.
D’un point de vue methodologique, a la fois en (Ba,Ca)TiO3 et en Ba(Ti,Zr)O3, nous
avons trouve que les deux types de cations introduits aux sites A et B, respectivement, se
comportent tres differemment et, par consequent, le melange peut difficilement etre decrit
par des atomes virtuels moyennes. A l’exception de certaines tendances moyennes, VCA ne
convient donc pas pour reproduire et comprendre la physique microscopique de solutions solides
(Ba,Ca)(Ti,Zr)O3. Par construction, en fait, cette approximation echoue dans la reproduction
des arrangements locaux et des mouvements independants des atomes sur le meme site actif dans
les instabilites ferroelectriques, simplifiant a l’exces les proprietes dynamiques et electroniques
reelles des solutions solides. Ce sont des caracteristiques cles pour le comportement global
des solutions solides a base de BaTiO3, qui doit donc etre analyse au moyen de calculs sur
supercellules. C’est egalement la raison pour laquelle les tentatives recentes [213] d’etudier
BCTZ a partir d’un Hamiltonien effectif base sur VCA requierent l’ajustement manuel de
certains parametres initialement adaptes aux resultats des calculs de premiers principes afin de
reproduire les donnees experimentales.
En conclusion, nous avons vu que dans (Ba,Ca)TiO3, la concurrence entre la ferroelectricite

APPENDIX B. RESUME 125
de type B et de type A des deux composes parents est le mecanisme cle de la competition
eventuelle entre differentes phases polaires. En fait, BaTiO3 et CaTiO3 ont une sequence
d’energie d’etats ferroelectriques inverse, de sorte qu’un croisement entre eux est necessaire pour
obtenir l’inversion. La realisation de ce croisement se traduit par une quasi-degenerescence du
paysage energetique et une polarisation quasi-isotrope, ameliorant ainsi la reponse piezoelectrique.
Differents comportements caracterisent Ba(Ti,Zr)O3, ou l’apparition de la ferroelectricite est
fortement dependante des arrangements atomiques locaux et electrostatiques. BaZrO3 presente
en effet une phase cubique tres stable. La substitution croissante de Ti par Zr a donc pour effet
de reduire la polarisation spontanee et de supprimer progressivement la ferroelectricite globale.
Neanmoins, des nanoregions polaires peuvent etre preservees dans les regions riches en Ti. De
plus, nous avons fourni une comparaison directe entre l’approximation du cristal virtuel (VCA)
et les calculs directs de supercellules, montrant que la physique microscopique specifique des
solutions solides (Ba,Ca)TiO3 et Ba(Ti,Zr)O3 impose de serieuses limitations a l’applicabilite
de VCA.
Par rapport a la reponse piezoelectrique amelioree telle qu’observee experimentalement dans
la BCTZ autour de la limite polymorphe de phase (“Polymorphic Phase Boundary” PPB) pour
les concentrations x ∈ [0.135 : 0.15] et y ∈ [0.10 : 0.11] respectives de Ca et de Zr (petites
concentrations de Ca et de Zr) [44, 54, 106] (Fig. 1.2), notre etude revele qu’un facteur mi-
croscopique essentiel est l’interaction entre la ferroelectricite guidee par le Ti affaiblie et la
ferroelectricite guidee par le Ca emergente, en raison d’effets steriques. D’une part, une faible
concentration de Zr n’affecte pas radicalement la dynamique initiale du BaTiO3, preservant
en effet l’etat fondamental ferroelectrique et la phase stable R3m, mais reduisant la polari-
sation spontanee. Par contre, la presence de Ca change fortement les proprietes dynamiques
du systeme. En particulier, une petite concentration de Ca induit une competition entre la
ferroelectricite guidee par Ti sur le site B et la ferroelectricite guidee par Ca sur le site A, qui
favoriserait separement une phase rhomboedrique ou tetragonale, respectivement. Ceci produit
donc la condition pour une anisotropie minimale selon les directions de la polarisation et se
manifeste dans l’amelioration de la reponse piezoelectrique.
En proposant cette etude thorique au niveau atomique, notre travail peut contribuer de
maniere significative a clarifier la physique microscopique des systemes a base de BaTiO3 et
fournit une base solide pour d’autres etudes de solutions solides BCTZ au moyen de simulations
avancees a grande echelle et a temperature finie. De plus, les mecanismes complexes ici reveles,
impliques dans la dynamique de tels systemes, pourraient etre exploites pour developper des ap-
proches hamiltoniennes efficaces avancees augmentant le nombre de degres de liberte atomiques
cles, allant au-dela de l’utilisation standard de VCA. De plus, en discutant de la physique, ce
travail presente un interet generique a la fois pour les theoriciens et pour les experimentateurs
et pourrait egalement interesser la discussion d’autres familles de solutions solides.
La plupart des resultats discutes sont publies dans D. Amoroso, A. Cano, and Ph. Ghosez,
Phys. Rev. B, 97, 174108 (2018).

APPENDIX B. RESUME 126
Figure B.1: (Haut) Vue schematique en 3D des atomes. (Bas) Positions en coordonnees reduitesdes atomes dans la structure perovskite.
(a) (b) (c) (d)
(e) (f) (g) (h)
Ca
Ca
CaCa
Ca
Ca
CaCa
CaCa
Ca
CaCa
Ca
CaCa
Ca
Ca
Ca
Ca
CaCa
Ca
Ca
Ca
CaCa
Ca
CaCa
CaCa
CaCa
Ca
CaCa
Ca
CaCa
CaCaCa
CaCaCa
Ca
x y
z
Ca
îï Ca Ti Zr O
Zr Zr
ZrZr
Zr
ZrZr
ZrZr
Zr Zr
Zr Zr
Figure B.2: Representation schematique de differents ordres atomiques dans des supercellules 2×2× 2 pour les deux solutions solides etudiees. (Haut) Sous-reseau des cations A dans Ba1−xCaxTiO3.(Bas) Sous-reseau des cations B et oxygenes dans in BaTi1−yZryO3. (a,e) x, y = 0.125. (b,f) “rocksalt”ordre, (c,g) “columnar” ordre le long de l’axe z et (d,h) “layered” ordre perpendiculaire a l’axe z pourx, y = 0.50.

APPENDIX B. RESUME 127F
requen
cy (
cm-1
)
-300
-150
0
150
300
450
600
750
900
Γ X M Γ R M
Fre
quen
cy (
cm-1
)
-300
-150
0
150
300
450
600
750
900
Γ X M Γ R M
Fre
quen
cy (
cm-1
)
-300
-150
0
150
300
450
600
750
900
Γ X M Γ R M
BaTiO3 CaTiO3
CaZrO3BaZrO3
(a) (b)
(c)ðñò
Fre
quen
cy (
cm-1
)
-300
-150
0
150
300
450
600
750
900
Γ X M Γ R M
Figure B.3: Courbes de dispersion de phonons dans la phase cubique du BaTiO3 (a), CaTiO3 (b),BaZrO3 (c) et CaZrO3 (d) le long du chemin des lignes de haute symetrie dans la zone de Brillouin. Lesvaleurs negatives de frequences se referent a des frequences imaginaires (ω en cm−1). Les differentescouleurs indiquent les differentes contributions atomiques dans les vecteurs propres correspondantscomme dans Ref. [102] (rouge pour l’atome A, vert pour l’atome B et bleu pour les atomes O).
óôõ ö÷õõøùù2 ö÷úõûõ ü÷úõýõ óþôý üõõÿ öPõÿPm-3m
1
10
100
1000
log
|∆
E| (m
eV
/f.u
.)
BaTiO3CaTiO3CaZrO3BaZrO3
Figure B.4: Gain d’energie (en log echelle) par rapport a la phase cubique des phases FE at desphases AFD liees aux rotations des oxygenes dans le BaTiO3 (cercles rouges), le CaTiO3 (carres bleus),le CaZrO3 (losanges roses) et le BaZrO3 (triangles verts). Toutes les structures ont ete entierementrelaxees dans la GGA-WC fonctionnelle. Les principales caracteristiques des differentes structuressont presentees dans le Tableau 5.5.

APPENDIX B. RESUME 128
1 1 1 1 1 11 1 0
tolerance
factor
(b)
(e)
-200
-150
-100
-50
0
50
100
150
200
ω(c
m-1
)
Γ
XRM M
3
3
3
3
3
3
33
3
3
3
a
VVegard law
AFD
AFE
FE
(a)
−0.15
−0.1
−0.05
0
0.05
0.1
0 0.1 0.2 0.3 0.4 0.5 0.6 0.7 0.8 0.9 1
η
Γ
(
Ba/Ca
x
TO1
O2/3
−!"!#!
−!"!$!
−!"!%!
−!"!&!
')'''
')'*'
IFC
s (T
i−O
) ||
−0.003
0.000
0.003
0.006
0.009
0.012
IFC
s (A
−O
) ||
(d)
(c)
Figure B.5: Evolution de differentes proprietes du reseau en fonction de la composition x dansBa1−xCaxTiO3 tel qu’obtenu par l’utilisation de VCA. (a) Parametres de maille dans la phase cubiqueacell (en A). La loi de Vegard a ete construite sur les valeurs theoriques dans le BaTiO3 et le CaTiO3
cubiques (Tableau 4.1): a(x) = (1 − x)aBTO + (x)aCTO. (b) Evolution des frequences de phonons abasse energie aux points de haute symetrie dans la zone de Brillouin cubique. Evolution des constantesde forces interatomiques (IFC en Ha/bohr2) entre Ti-O (c) et A-O (d). (e) Evolution des vecteurspropres (en a.u.) du mode instable a Γ dans la zone de Brillouin cubique.

APPENDIX B. RESUME 129
−350
−300
−250
−200
−150
−100
−50
0
0 +,- +,. +,/ +,2 +,4 +,5 +,6 +,7 +,8 1
9
E (
meV
/f.u
.)
x
:2;;
Amm2
R3m
I4/mcm
R−3c
Imma
Pnma−18
−16
−14
−12
−10
−8
−6
−4
−2
0
0.1 0.2 0.3 0.4 0.5 0.6 0.7 0.8 0.9
<=>>Amm2R3m
Figure B.6: Gain d’energie par rapport a la phase cubique des phases FE at des phases AFD lieesaux rotations des oxygenes relaxees en VCA en fonction de la composition x dans Ba1−xCaxTiO3.Proprietes des structures reportees dans le Tableau 5.5.
0.4
0.5
0.6
0.7
0.8
0.9
1
1.1
1.2
P/P
BT
O
Berry Phase−DFT
P=Z*B?@AuB?@AP=Z*BTOuB?@AP=Z*B?@AuBTO
C
1
1.2
1.4
1.6
1.8
2
0 0.2 0.4 0.6
d
ijDd
ij BT
O
E11
E15
E33
1
1.5
2
2.5
3
3.5
4
4.5
0 0.2 0.4 0.6
εij/
εij B
TO
ε11=ε22ε33
Figure B.7: Evolution de la polarisation, des coefficients piezoelectriques et dielectriques “stress-free” dans la phase rhomboedrique R3m en fonction de la composition x dans Ba1−xCaxTiO3 enVCA. Les valeurs sont normalises a celles de R3m-BaTiO3: P
BTOs ≃ 38 µC/cm2; dBTO
11 ≃ 76 pC/N ,dBTO15 ≃ 270 pC/N and dBTO
33 ≃ 15 pC/N ; εBTO11 ≃ 208 et εBTO
33 ≃ 11. Panneau superieur: variationde la polarisation calculee directement par les calculs de “Berry phase” (cercles bleus) et par lescharges effectives de Born afin de distinguer la contribution de la variation des charges atomiqueset des deplacements. Panneau inferieur: tendance du coefficient piezoelectrique dij et de la reponsedielectrique εij .

APPENDIX B. RESUME 130
−200−150−100−50
050
100
ω(c
m−
1)
Γ pFGHI
X anti−polarM anti−polar
−12−10−8−6−4−2
0
1.955 1.960 1.965 1.970 1.975 1.980 1.985 1.990 1.995
∆E
(R−
T)(m
eV/f.
u.)
dTi−O Å( )
0.011
0.012
IFC
s (C
a−O
)||
1.955 1.960 1.965 1.970 1.975 1.980 1.985 1.990 1.995
BaTiO3
BaTiO3
BaTiO3CaTiO3
CaTiO3
(a)
(c)
(b)
(d)
BTO
volume
−0.018
−0.012
−0.006
0.000
0.006
IFC
s (T
i−O
) ||
Figure B.8: Evolution en fonction de la distance Ti-O des proprietes dynamiques dans la phasecubique de BaTiO3 et CaTiO3. (a) Evolution des frequences de phonons (en cm−1) aux Q-points dehaute symetrie dans la zone de Brillouin cubique de BaTiO3. (b) Difference d’energie (en meV/f.u.)entre [111]-R et [001]-T distorsions dans le BaTiO3 contraint a la maille cubique. (c) Constantesde Forces Interatomiques (en Ha/bohr2) le long du couplage Ti-O dans le BaTiO3 et CaTiO3. (d)Constantes de Forces Interatomiques (en Ha/bohr2) le long du couplage Ca-O dans le CaTiO3.

APPENDIX B. RESUME 131
P000 P001 P011 P111PJKL
NO µ
QSUW
2)
BaTiO3 Ba0.875Ca0.125TiO3 CaTiO3
0 00
∆E
(m
eV
/f.u
.)
(a) (b) (c)
(d)
(g)
(e)
(h)
(f)
(i)
−80
−60
−40
−20
0
40
20
40
20
2040
60
80
−0.02
0
0.02
0.04Ti
O
−0.02
0
0.02
0.04
u−
−20
−10
0
Pm-3m P4mm Amm2 R3m Pm-3m P4mm Amm2 R3mPm-3m P4mm Amm2 R3mPm P1
−YZY[
−0.04
−0.02
0
0.02
0.04
0.06
0.08Ca\]
−20
−10
0
^000 ^001 ^011 ^111 ^000 ^001 ^011 ^111^_`b
Figure B.9: Comparaison de l’energetique, de la polarisation spontanee et des deplacements atom-iques dans le BaTiO3 (a,d,g), Ba0.875Ca0.125TiO3 (b,e,h) et CaTiO3 (c,f,i). (Haut) Gain d’energie (enmeV/f.u.) par rapport a la phase cubique des phases avec differentes orientations de polarisation. Lescercles pleins representent des structures completement relaxees. En (a) and (c) les cercles ouvertsreproduisent le gain d’energie associe a la distorsion polaire dans la maille cubique (c.-a-d. pas de“strain” relaxation) dans le BaTiO3 et le CaTiO3 respectivement. Dans le cas de Ba0.875Ca0.125TiO3
(b) carres pleins reproduisent l’energetique obtenue a partir de Eq. 6.1. (Centre) Variation de lapolarisation (en µC/cm2) calculee par les deplacements atomiques et les charges effectives de BornPs,α = 1
Ω
∑
k,β Z∗k,αβ∆τk,β [99], pour differents etats polaires. En (d) et (f) losanges ouverts repro-
duisent la polarisation contrainte a la maille cubique dans le BaTiO3 et le CaTiO3 respectivement.Dans le cas de Ba0.875Ca0.125TiO3 (e) triangles pleins reproduisent la polarisation obtenue a partir deEq. 6.2. (Bas) Evolution des deplacements atomiques moyens (en coordonnees internes) par rapportau centre de masse de chaque structure.

APPENDIX B. RESUME 132
ce7/8Ca1/8TiO3 Ba1/2Ca1/2TiO3
LAYERED(a) (b)
P000 P001 P100 P110 P111
LAYERED
COLUMNAR
ROCKSALT
Ba0.50Ca0.50TiO3
-20
0
20
40
60
80
f
E (
me
V/f
.u.)
(c)
z
xy
Ti Tig
h1
h2
h2h1
ia
iag ja
Ca
Ti
O2
O3
O1 O1
Ba
-40
Figure B.10: Representation schematique de l’arrangement atomique dans Ba0.875Ca0.125TiO3 (a)et dans “layered”-Ba0.5Ca0.5TiO3 (b). La direction le long de l’axe y est equivalente a la directionx. Les labels facilitent la visualisation des paires atomiques analysees dans les tableaux 6.1 and 6.2.(c) Gain d’energie (en meV/f.u.) par rapport a la structure P4mmm-“layered” pour differents etatspolaires dans les supercells de Ba0.5Ca0.5TiO3. La notation de l’axis x fait reference a la direction descomposants de la polarisation.
0
100
200
300
400
500
0 0.05 0.1 0.15 0.2 0.25 0.3 0.35
klmn
oq1−rCarTiOs
O−R coolingO−t uvwyz|
T− ~z|T− uvwyz|
− ~z|uvwyz|
T = a(x-xc)
T = b(x-xc) + c(x-xc)2
0
100
200
300
400
500
600
700
800
0 0.05 0.1 0.15 0.2 0.25 0.3
T2
1−CaTiO3
T2 = a(x-xc)
O− −
[x 10^2]
(a) (b)
(c) (d)
T ~ (x-xc)1/2
T ~ (x-xc)
0.35
Figure B.11: (a) Dependance de la constante dielectrique (ǫ′) en fonction de la temperature dansles cristaux de Ba1−xCaxTiO3. (b) Diagramme de phase de Ba1−xCaxTiO3 a partir des mesuresdielectriques. Losanges bleu et cercles rouges indiquent les processus de refroidissement et de chauffage,respectivement. Des Refs. [184, 195]. (c) et (d) ajustement (fitting) de la tendance de la temperature detransition T en fonction de la concentration x: (c) graphique de T 2 ajuste a partir de le comportementlineaire a(x−xc) pour tester la tendance T ∝ (x−xc)
1/2 telle que supposee par Fu et al. dans Refs. [184,195] pour les transitions de phase T-O et O-R; (d) ajustement de T a partir de le comportement lineaire(x − xc) pour la transition C-T, alors que a partir d’une tendance generique a(x − xc) + b(x − xc)
2
afin d’extrapoler xc(T=0 K) pour les transitions T-O et O-R. a et b correspondent a des parametresd’ajustement. Les donnees pour l’ajustement ont ete extraites de le diagramme de phase (b) rapportedans la reference [184].

APPENDIX B. RESUME 133
1.06 1.06 1.05 1.04 1.04 1.03 1.03 1.02 1.01 1.01 1.00 tolerance
factor
(a)
(b)
y
3.980
4.000
4.020
4.040
4.060
4.080
4.100
4.120
4.140
4.160
4.180a
(Å
)
-200
-150
-100
-50
0
50
100
150
200
0 0.1 0.2 0.3 0.4 0.5 0.6 0.7 0.8 0.9 1
ω(c
m-1
)
Γ
XRM AFEM AFD
VCAVegard law
AFE
AFD
FE
Figure B.12: (a) Evolution de parametres de maille dans la phase cubique acell (en A) en fonction dela composition y dans BaTi1−yZryO3 par l’utilisation de VCA. La loi de Vegard a ete construite sur lesvaleurs theoriques dans le BaTiO3 et le BaZrO3 cubiques (Tableau 4.1): a(y) = (1−y)aBTO+(y)aBZO.(b) Evolution des frequences de phonons a basse energie (en cm−1) aux points de haute symetrie dansla zone de Brillouin cubique en fonction de la composition y dans VCA.
−20
−15
−10
−5
0
0 0.05 0.1 0.15 0.2
∆E
(m
eV
/f.u
.)
y
P4mm
Amm2
R3m
Figure B.13: Zoom sur l’evolution du gain d’energie (en meV/f.u.) par rapport a la phase cubiquedes trois phases polaires en fonction de la composition y en VCA.

APPENDIX B. RESUME 134
y
1
1.2
1.4
1.6
1.8
2
2.2
2.4
2.6
0 0.05 0.1
d
11
15
33
0.2
0.4
0.6
0.8
1
1.2
P/P
Berry Phase−DFT
P=Z* uBTZOBTZO
P=Z*BTOuBTZO
P=Z*BTZOuBTO
0
1
2
3
4
5
6
7
8
0 0.05 0.1
εij/
εij B
TO
ε11=ε22ε33
Figure B.14: Evolution de la polarisation, des coefficients piezoelectriques et dielectriques “stress-free” dans la phase rhomboedrique R3m en fonction de la composition y dans BaTi1−yZryO3 dansVCA. Les valeurs sont normalises a celles de R3m-BaTiO3: P
BTOs ≃ 38 µC/cm2; dBTO
11 ≃ 76 pC/N ,dBTO15 ≃ 270 pC/N and dBTO
33 ≃ 15 pC/N ; εBTO11 ≃ 208 et εBTO
33 ≃ 11. Panneau superieur: variationde la polarisation calculee directement par les calculs de “Berry phase” (cercles bleus) et par lescharges effectives de Born afin de distinguer la contribution de la variation des charges atomiqueset des deplacements. Panneau inferieur: tendance du coefficient piezoelectrique dij et de la reponsedielectrique εij .
7/8Zr1/8O3
BaTi1/2Zr1/2T¡¢£ROCKSALT
(a) (b)
¤¥YERED
COLUMNAR
ROCKSALT
¦
E (
me
V/f
.u.)
BaTi0.875Zr0.125O3 BaTi0.50Zr0.50O3
P000 P001 P011 P111 P000 P001 P100 P110
-30
-20
-10
0
0
15
30
45
60
75
90
(c) (d)
z
xy
Ba
§¨©
ª«
ª« ª«
ª«
ª¬
ª¬
ª¬ª¬
®¯°±
®²
°± ®
³
³ ³
´
³
´
µ¶
Figure B.15: Representation schematique de l’arrangement atomique dans BaTi0.875Zr0.125O3
(a) et dans “rocksalt”-BaTi0.50Zr0.50O3 (b). Les labels facilitent la visualisation des paires atom-iques analysees dans les tableaux 7.1 and 7.3. (c) Gain d’energie (en meV/f.u.) par rapport a lastructure Pm3m pour BaTi0.875Zr0.125O3 (c) at par rapport a la structure “rocksalt”-Fm3m pourBaTi0.50Zr0.50O3 en fonction de differents etats polaires relaxees dans supercellules. La notation del’axis x fait reference a la direction des composants de la polarisation.

APPENDIX B. RESUME 135
0
4
8
12
16
tota
l D
OS
VCABaTiO3BaZrO3
0
4
8
12
16
0 2 4 6 8 10 12 14 16 18 20
tota
l D
OS
E (eV)
VCAaveraged DOSh-
SUPER CELLBaTiO3BaZrO3
0 2 4 6 8 10 12 14 16 18 20
E (eV)
SUPER CELL
linear combined DOS
(a)
(b)
(c)
(d)
Figure B.16: Densite electronique des etats (Density Of States DOS) dans le BaTiO3, le BaZrO3
et BaTi0.875Zr0.125O3. Panneaux superieurs: DOS de la solution solide BTZ telle qu’obtenue dans lescalculs VCA (gauche) et supercellule (droite) par rapport aux composes parents. Panneaux inferieurs:reproduction empirique de DOS tel qu’obtenu a partir de la moyenne “horizontale” afin de reproduireles resultats de VCA (gauche) et par la combinaison lineaire dans le cas de la supercellule (droite).
(a)
(b) (c)
1x1xL
1x2xL 2x2xL
·
x
y
Figure B.17: Representation schematique des supercellules basees sur BZO/mBTO. (a) 1× 1× L
super-reseau base sur une seule chaıne de BaZrO3-mBaTiO3 avec une composition decroissante enzirconium. La plus petite chaıne avec L=2 correspond a la structure “layered” dans la composition50%. La chaıne representee est doublee dans les directions x et y pour aider a la visualisation de laperiodicite du cristal. (b)-(c) 1× 2 × L et 2 × 2 × L supercellules basees sur des chaınes alternees deBaZrO3-mBaTiO3 et BaTiO3-nBaZrO3 afin de conserver une composition globale de 50%. Les pluspetites cellules avec L=2 correspondent respectivement a la composition 50% dans l’ordre “columnar”et “rocksalt”. Le 1 × 2 × L-case represente est double le long de la direction x pour faciliter lavisualisation.

APPENDIX B. RESUME 136
0
100
200
300
400
500
−60 −40 −20 0 20 40 60
∆E
(m
eV
/f.u
.)
P (µC/cm2)
BaTiO3
BaZrO3: approach 1
BaZrO3: approach 2
Figure B.18: Variation de l’energie totale (en meV/f.u.) en fonction de la polarisation (en µC/cm2)de la configuration paraelectrique a la a configuration polaire dans le BaTiO3 (carres rouges) et leBaZrO3. Pour ce dernier, les courbes ont ete obtenues selon deux approches: (triangles bleus) a partirde la procedure de minimisation a P fixe; (cercles verts) a partir de la structure polaire relaxee dansle super-reseau 1× 1× 3.
m
1 2 3 4 5 6
0
5
10
15
20
25
30
35
P (
µC
/cm
2)
ELEC MODEL 1
ELEC MODEL 2
¸¹º
−20
−15
−10
−5
0
E (
me
V/f
.u.)
−»¼½¾
0
1
Figure B.19: Variation de la polarisation totale (en µC/cm2) et de l’energie (en meV/f.u.) enfonction du nombre m croissant de couches de BTO. Les valeurs obtenues a partir de calculs DFTpurs et du modele electrostatique sont rapportees. Nous nous referons aux resultats de la premiereapproche bases sur la minimisation a P fixee comme modele 1, tandis que ceux bases sur la structurepolaire relaxee comme modele 2. Le zoom montre les differentes energies pour m = 1. L’energie Eobtenue par les calculs DFT se refere a le gain d’energie entre la phase ferroelectrique entierementoptimisee et la phase centro-symetrique a volume fixe a celui de la structure polaire.

Bibliography
[1] J. Rodel, K. G. Webber, R. Dittmer, W. Jo, M. Kimura, and D. Damjanovic, J. Eur.
Ceram. Soc, 35, 1659 (2015).
[2] M. Acosta, N. Novak, V. Rojas, S. Patel, R. Vaish, J. Koruza, G. A. Rossetti, and J.
Rodel, Appl. Phys. Rev., 4, 041305 (2017).
[3] K. Uchino, The development of piezoelectric materials and the new perspective, K. Uchino
(ed): Chap. 1, pp 1 − 92 in Advanced Piezoelectric Materials: Science and Technology
(First Edition), Woodhead Publishing 2010..
[4] Y. Saigusa, Quartz-based piezoelectric materials, K. Uchino (ed): Chap. 5, pp 171− 203
in Advanced Piezoelectric Materials: Science and Technology (First Edition), Woodhead
Publishing 2010..
[5] L. B. Kong, T. Li, H. H. Hng, F. Boey, T. Zhang, and S. Li, Waste Energy Harvesting:
Mechanical and Thermal Energies, Springer-Verlag Berlin Heidelberg 2014.
[6] A.L. Kholkin, N.A. Pertsev, and A.V. Goltsev, Piezoelectricity and Crystal Symmetry, A.
Safari, E.K. Akdogan (eds.): Chap. 2, Piezoelectric and Acoustic Materials for Transducer
Applications, Springer Science+Business Media, LLC 2008.
[7] A. Stapleton, T. Souliman, and T. Syed, Biochemical Society: the Biochemist, 40, 28
(2018).
[8] A. Fleming, Proc. R Soc. B Biol. Sci., 93, 306 (1922).
[9] A. Stapleton, M. R. Noor, T. Soulimane, and S. A. M. Tofail, Physiological Role of
Piezoelectricity in Biological Building Blocks, in Electrically Active Materials for Medical
Devices (World Scientific, 2016).
[10] A. Stapleton, M.R. Noor, J. Sweeney, V. Casey, A. L. Kholkin, C. Silien, A. A. Gandhi,
T. Soulimane, and S. A. M. Tofail, Appl. Phys. Lett., 111, 142902 (2017).
[11] Y. Liu et al., Proc. Natl Acad. Sci. USA, 111, E2780 (2014).
[12] E. Fukada, and I. Yasuda, Jpn. J. Appl. Phys., 3, 117 (1964).
137
BIBLIOGRAPHY 138
[13] D. Dennig et al., ACS Biomater. Sci. Eng., 3 929 (2017).
[14] S. Guarin et al., Nat. Mater., 17, 180 (2018).
[15] E. Fukada, and I. Yasuda, J. Phys. Soc. Jpn., 12 1157 (1957).
[16] J. Chang, M. Dommer, C. Chang, and L. Lin, Nano Energy, 1, 356 (2012).
[17] M. Pohanka, Materials, 11, 448 (2018).
[18] S. Waqar, L. Wang, and S. John, Piezoelectric energy harvesting from intelligent textiles,
T. Dias (ed): Chap. 9, in Electronic Textiles:Smart Fabrics and Wearable Technology,
2015 Elsevier.
[19] R.S. Dahiya, M. Valle, Robotic Tactile Sensing: Technologies and System, Springer 2013.
[20] https://www.energy-floors.com/.
[21] A. Moure et al., Energy Convers. Manag., 112, 246 (2016).
[22] H. Yang, et al., Int. J. Pavement Res. and Technol., 11, 168 (2018).
[23] B. M. Vul, and L. F. Vereshtschagin, Dokl. Akad. Nauk SSSR, 48, 662 (1945).
[24] S. Robert, Phys. Rev., 71, 890 (1947).
[25] A. F. Devonshire, Philos. Mag., 40, 1040 (1949); 42, 1065 (1951); Adv. Phys., 3, 85
(1954).
[26] D. Berlincourt, and H. Jaffe, Phys. Rev., 111, 143 (1958).
[27] G. Shirane and A. Takeda, J. Phys. Soc. Jpn., 7, 5 (1952).
[28] G. Shirane and K. Suzuki, J. Phys. Soc. Jpn., 7, 333 (1952).
[29] E. Sawaguchi, J. Phys. Soc. Jpn., 8, 615 (1953).
[30] B. Jaffe, R. S. Roth, and S. Marzullo, J. Appl. Phys., 25, 809 (1954).
[31] M. McQuarrie and F. W. Behnke, J. Am. Ceram. Soc., 37, 539 (1954).
[32] L. Luo, X. Zhao, and H. Luo, Single crystal PZN-PT, PMN-PT, PSN-PT and PIN-
PT-based piezoelectric materials, K. Uchino (ed): Chap. 7, pp 239 − 286 in Advanced
Piezoelectric Materials: Science and Technology (First Edition), Woodhead Publishing
2010.
[33] E. Fukada and S. Takashita, Jpn. J. Appl. Phys., 8, 960 (1969).
[34] H. Kawai, Jpn. J. Appl. Phys., 8, 975 (1969).

BIBLIOGRAPHY 139
[35] A. J. Lovinger, Science, 220, 1115 (1983).
[36] L. Persano et al., Nat. Commun., 4, 1633 (2013).
[37] E. Nilsson et al., Sens. Actuators A Phys., 201, 477 (2013).
[38] A. Lund et al., npj Flexible Electronics 2, 9 (2018).
[39] T. Kitayama and S. Sugawara, Proc. Study Comm. Electronic Circuit Components &
Mater., CPM72-17 (1972).
[40] Directive 2002/95/EC, Official Journal of the European Union, L 37/19 (2003); Directive
2011/65/EU, ibid. L 174/88 (2011).
[41] https://echa.europa.eu
[42] T. Takenata, K. Maruyama, and K. Sakata, Jpn. J. Appl. Phys., 30, 2236 (1991).
[43] Y. Saito et al., Nature, 432, 84 (2004).
[44] W. Liu, and X. Ren, Phys. Rev. Lett., 103, 257602 (2009).
[45] T. Takenaka, Lead-free piezo-ceramics, K. Uchino (ed): Chap. 4, pp 130−170 in Advanced
Piezoelectric Materials: Science and Technology (First Edition), Woodhead Publishing
2010.
[46] F. Cordero, Materials, 8 8195 (2015).
[47] T. T. A. Lummen et al., Nat. Commun., 5, 3172 (2014).
[48] R. Guo, L. E. Cross, S-E. Park, B. Noheda, D. E. Cox, and G. Shirane, Phys. Rev. Lett.
84, 5423 (1999).
[49] B. Noheda, J. A. Gonzalo, L. E. Cross, R. Guo, S.-E. Park, D. E. Cox, and G. Shirane,
Appl. Phys. Lett. 74, 2059 (1999).
[50] B. Noheda, J. A. Gonzalo, L. E. Cross, R. Guo, S.-E. Park, D. E. Cox and G. Shirane,
Phys. Rev. B, 61, 8687 (2000).
[51] D. S. Keeble, F. Benabdallah, P. A. Thomas, M. Maglione, and J. Kreisel, Appl. Phys.
Lett. 102, 092903 (2013).
[52] H. Fu, and R. E. Cohen, Nature, 403, 281 (2000).
[53] B. Nohesa and D. E. Cox, Phase Transitions, 97, 5 (2006).
[54] M. Acosta, N. Novak. W. Jo, and J. Rdel, Acta Mater., 80, 48 (2014).

BIBLIOGRAPHY 140
[55] M. Yuan et al., Adv. Mater., 26, 7432 (2014).
[56] L. Cheng et al., Nano Energy, 15, 598 (2015).
[57] N. R. Alluri, B. Saravanakumar, and S.-J. Kim, ACS Appl. Mater. Interfaces, 7, 9831
(2015).
[58] N. D. Scarisoreanu et al., ACS Appl. Mater. Interfaces, 9, 266 (2017).
[59] E. Bousquet, First-principles study of ferroelectric oxide nanostructures, PhD thesis, Uni-
versite de Liege (2008).
[60] R. Resta and, D. Vanderbilt Theory of Polarization: A Modern Approach, K. Rabe, C.
H. Ahn and J.-M. Triscone (Eds): Physics of Ferrelectrics, Topics Appl. Physics, 105,
117 (2007).
[61] Ph. Ghosez: Microscopic properties of ferroelectric oxides from first principles: Selected
topics (Troisieme Cycle de la Physique en Suisse Romande, Lausanne 2002) 145 pages
URL: http://www.phythema.ulg.ac.be/Books/Cours/Ferro.Ghosez.pdf
[62] W. Setyawan, and S. Curtarolo, Computational Materials Science, 49, 299 (2010).
[63] Goldschmidt, V.M. Naturwissenschaften, 14, 477 (1926).
[64] M. W. Lufaso and P. M. and Woodward, Acta Cryst., B57, 725 (2001).
[65] L. D. Landau and, E. M. Lifshitz, Statistical Physics (Mir, 1968).
[66] P. Chandra and, P. B. Littlewood, A Landau Primer for Ferroelectrics, K. Rabe, C. H.
Ahn and J.-M. Triscone (Eds): Physics of Ferrelectrics, Topics Appl. Physics, 105, 117
(2007).
[67] B. A. Strukov and A. P. Levanyuk, Ferroelectric Phenomena in Crystals: Physical Foun-
dations, Springer-Verlag Berlin Heidelberg 1998.
[68] F. Li, L. Jin, Z. Hu, and S. Zhang, Appl. Phys. Rev., 1, 011103 (2014).
[69] A. P. Levanyuk and D. G. Sannikov, Usp. Fiz. Nauk., 112, 561 (1974).
[70] J. Varignon and Ph. Ghosez, Phys. Rev. B, 87, 140403(R) (2013).
[71] E. Bousquet et al., Nature, 452, 732 (2008).
[72] J. Holakovsky, Phys. Status Solidi B, 56, 615 (1973).
[73] K. M. Rabe and J. D. Joannopoulos, Phys. Rev. Lett., 59, 570 (1987).
[74] R. D. King-Smith and D. Vanderbilt, Phys. Rev. B, 49, 5828 (1994).

BIBLIOGRAPHY 141
[75] W. Zhong, D. Vanderbilt and K. M. Rabe, Phys. Rev. B, 52, 6301 (1995).
[76] C. Ederer and, N. A. Spaldin, Phys. Rev. Lett., 95, 257601 (2005).
[77] P. Hermet, M. Goffinet, J. Kreisel, and Ph. Ghosez, Phys. Rev. B, 75, 220102 (2007).
[78] I. A. Kornev, S. Lisenkov, R. Haumont, B. Dkhil, and L. Bellaiche, Phys. Rev. Lett., 99,
227602 (2007).
[79] A. M. Glazer, Acta Crystallogr. B, 28, 3384 (1972).
[80] C. J. Howard, and H. T. Stokes, Acta Cryst., B54, 782 (1998).
[81] N. A. Benedek, C. J. Fennie, J. Phys. Chem. C, 117, 13339 (2013).
[82] M. Posternak, R. Resta, and A. Baldereschi, Phys. Rev. B, 50, 8911(R) (1994).
[83] A. Garcıa, and D. Vanderbilt, Phys. Rev. B, 54, 3817 (1996).
[84] R. E. Cohen, J. Phys. Chem. Solids , 61, 139 (2000).
[85] D. I. Bilc, and D. J. Singh, Phys. Rev. Lett., 96, 147602 (2006).
[86] S. Amisi et al, Phys. Rev. B, 85, 064112 (2012).
[87] N. Miao et al., J. Phys.: Condens. Matter, 26, 035401 (2014).
[88] V. L. Ginzburg, Zh. Eksp. Teor. Fiz., 19, 36 (1949).
[89] W. Cochran, Phys. Rev. Lett., 3, 412 (1959).
[90] W. Cochran, Adv. Phys., 9, 387 (1960).
[91] American Mineralogist, 82, 213 (1997).
[92] Ph. Ghosez and J. Junquera, Handbook of Theoretical and Computational Nanotechnology,
(American Scientific Publishers, Stevenson Ranch, CA, 2006).
[93] K. M. Rabe and Ph. Ghosez, First-Principles Studies of Ferroelectric Oxide, K. Rabe, C.
H. Ahn and J.-M. Triscone (Eds): Physics of Ferrelectrics, Topics Appl. Physics, 105,
117 (2007).
[94] P. A. Fleury, J. F. Scott, and J. M. Worlock, Phys. Rev. Lett., 21, 16 (1968).
[95] G. Shirane, J. D. Axe, J. Harada, and J. P. Remeika Phys. Rev. B, 2, 155 (1970).
[96] J. F. Scott, Rev. Mod. Phys., 46, 83 (1974).

BIBLIOGRAPHY 142
[97] M. T. Dove, Structure and Dynamics: An Atomic View of Materials, Oxford Master
Series in Condensed Matter Physics (Oxford University Press, 2002).
[98] K. F. Garrity, K. M. Rabe, and D. Vanderbilt, Phys. Rev. Lett., 112, 127601 (2014).
[99] Ph. Ghosez, J.-P. Michenaud and X. Gonze, Phys. Rev. B, 58, 6224 (1998).
[100] W. Zhong, R.D. King-Smith and D. Vanderbilt, Phys. Rev. Lett., 72, 3618 (1994).
[101] Ph. Ghosez, X. Gonze and J.-P. Michenaud, Ferroelectrics, 194, 39 (1997).
[102] Ph. Ghosez, E. Cockayne, U. V. Waghmare and K. M. Rabe, Phys. Rev. B, 60, 836
(1999).
[103] L. Bellaiche, Curr. Opin. Solid State Mater. Sci., 6, 19 (2002).
[104] G. Saghi-Szabo, R. E. Cohen and, H. Krakauer, Phys. Rev. Lett., 80, 4321 (1998).
[105] K. M. Rabe, M. Dawber, C. Lichtensteiger, Ch. H. Ahnand, and J.-M. Triscone Modern
Physics of Ferroelectrics: Essential Background, K. Rabe, C. H. Ahn and J.-M. Triscone
(Eds): Physics of Ferrelectrics, Topics Appl. Physics, 105, 117 (2007).
[106] M. Acosta, N. Khakpash, T. Someya, N. Novak, W. Jo, H. Nagata, G. A. Rossetti, and
J. Rodel Phys. Rev. B, 91, 104108 (2015).
[107] G. Grosso, and G. P. Parravicini, Solid State Physics, Elsevier.
[108] P. Hohenberg, and W. Kohn, Phys. Rev., 136, B 864 (1964).
[109] W. Kohn, L. Sham, Phys. Rev., 140, A 1133 (1965).
[110] E. P. Wigner, Trans. Faraday Soc., 34, 678 (1938).
[111] L. Hedin, and B. Lundqvist, J. Phys. C, 4, 2064 (1971).
[112] S. H. Vosko, L. Wilk, and M. Nusair, Can. J. Phys., 58, 1200 (1980).
[113] J. P. Perdew, A. Zunger, Phys. Rev. B, 23, 5048 (1981).
[114] D.C. Langreth, and M. J. Mehl, Phys. Rev. Lett., 47, 446 (1981).
[115] D.C. Langreth, and M. J. Mehl, Phys. Rev. B, 28, 1809 (1983).
[116] M. C. Payne, M. P. Teter, D. C. Allan, T. A. Arias, and J. D. Joannopoulos, Rev. Mod.
Phys., 64, 1045 (1992).
[117] A. K. Rajagopal, J. Callaway, Phys. Rev. B, 7, 1912 (1973).
[118] O. Gunnarsson, B. I. Lundqvist, Phys. Rev. B, 13, 4274 (1976)

BIBLIOGRAPHY 143
[119] S. Baroni, S. De Gironcoli, and A. Dal Corso, Rev. Mod. Phys., 73, 515 (2001).
[120] J. P. Perdew, M. Levy, Phys. Rev. Lett., 51, 1884 (1983).
[121] J. P. Perdew, J. Chevary, S. Vosko, K. Jackson, M. Pederson, D. Singh, C. Fiolhais, Phys.
Rev. B, 46, 6671, (1992).
[122] J. P. Perdew, K. Burke, M. Ernzerhof, Phys. Rev. Lett., 77, 3865, 1996.
[123] J. P. Perdew, and K. Burke, Int. J. Quant. Chem, 57, 309, 1996.
[124] J. P. Perdew, J. Chevary, S. Vosko, K. Jackson, M. Pederson, D. Singh, C. Fiolhais, Phys.
Rev. B, 69, 075102 (2004).
[125] D. R. Hamann, Phys. Rev. Lett., 76, 660 (1996).
[126] C. Filippi, D. J. Singh, C. Umrigar, Phys. Rev. B, 50, 14947 (1994).
[127] J. P. Perdew, K. Burke, Y. Wang, Phys. Rev. B, 54, 16533 (1996).
[128] D. C. Langreth, J. P. Perdew, Phys. Rev. B, 21, 5469 (1980).
[129] J. P. Perdew, S. Kurth, A. Zupan, and P. Blaha, Phys. Rev. Lett., 82, 2544 (1999).
[130] J. Tao, J. P. Perdew, V. N. Staroverov, and G. E. Scuseria, Phys. Rev. Lett., 91, 146401
(2003).
[131] V. N. Staroverov, G. E. Scuseria, J. Tao and John P. Perdew, Phys. Rev. B, 48, 4978
(1993).
[132] Z. Wu, R. E. Cohen and D. J. Singh, Phys. Rev. B, 70, 104112 (2004).
[133] Z. Wu and R. E. Cohen, Phys. Rev. B, 73, 235116 (2006).
[134] D. J. Chadi, and M. L. Cohen, Phys. Rev. B, 8, 5747 (1973).
[135] H. J. Monkhorst, and J. D. Pack, Phys. Rev. B, 13, 5188 (1976).
[136] R. A. Evarestov, and V. P. Smirnov, Phys. Status Solidi, 119, 9 (1983).
[137] D. R. Hamann, Phys. Rev. B, 88, 085117 (2013).
[138] L. Bellaiche and D. Vanderbilt, Phys. Rev. B, 61, 7877 (2000).
[139] Ph. Ghosez, D. Desquesnes, X. Gonze, and K. M. Rabe, AIP Conference Proceedings
535, 102 (2000).
[140] N. J. Ramer, and A. M. Rappe, J. Phys. Chem. Solids 61, 317 (2000).

BIBLIOGRAPHY 144
[141] S. Baroni, P. Giannozzi, and A. Testa, Phys. Rev. Lett. 58, 1861 (1987).
[142] X. Gonze, and C. Lee, Phys. Rev. B, 55, 10355 (1997).
[143] X. Gonze Phys. Rev. B, 55, 10337 (1997).
[144] S. Baroni, P. Giannozzi, and A. Testa, Phys. Rev. Lett., 59, 2662, (1987).
[145] S. de Gironcoli, S. Baroni, and R. Resta, Phys. Rev. Lett., 62, 2853, (1989).
[146] S. de Gironcoli, P. Giannozzi, and S. Baroni, Phys. Rev. Lett., 66, 2116, (1991).
[147] P. Giannozzi, S. de Gironcoli, P. Pavone, and S. Baroni, Phys. Rev. B, 43, 7231, (1991).
[148] X. Gonze, and J.-P. Vigneron, Phys. Rev. B, 39, 13120, (1989); Phys. Rev. B, 44, 3494,
(1991).
[149] X. Gonze, Phys. Rev. A, 52, 1086, (1995).
[150] X. Gonze, Phys. Rev. A, 52, 1096, (1995).
[151] M. J. Verstraete, and Z. Zanolli, Density Functional Perturbation Theory, 45th IFF
Spring School “Computing Solids: Models, ab-initio methods and supercomputing”
(Forschungszentrum Julich, 2014).
[152] X. Gonze et al., Phys. Rev. B, 50 13035 (1994).
[153] R. Resta, Ferroelectrics, 136, 51 (1992).
[154] R. Resta, Rev. Mod. Phys., 66, 899 (1994).
[155] Ph. Ghosez, and X. Gonze, J. Phys.: Condens. Matter, 12, 9179 (2000).
[156] X. Gonze, J.-M. Beuken, R. Caracas, F. Detraux, M. Fuchs, G.-M. Rignanese, L. Sindic,
M. Verstraete, G. Zerah, F. Jollet, M. Torrent, A. Roy, M. Mikami, Ph. Ghosez, J.-Y.
Raty, and D.C. Allan, Computational Materials Science, 25, 478 (2002).
[157] X. Gonze, G.-M. Rignanese, M. Verstraete, J.-M. Beuken, Y. Pouillon, R. Caracas, F.
Jollet, M. Torrent, G. Zerah, M. Mikami, Ph. Ghosez, M. Veithen, J.-Y. Raty, V. Ole-
vano, F. Bruneval, L. Reining, R. Godby, G. Onida, D.R. Hamann, and D.C. Allan, Z.
Kristallogr. 220, 558 (2005).
[158] X. Gonze, B. Amadon, P.-M. Anglade, J.-M. Beuken, F. Bottin, P. Boulanger, F.
Bruneval, D. Caliste, R. Caracas, M. Cote, T. Deutsch, L. Genovese, Ph. Ghosez, M.
Giantomassi, S. Goedecker, D.R. Hamann, P. Hermet, F. Jollet, G. Jomard, S. Ler-
oux, M. Mancini, S. Mazevet, M.J.T. Oliveira, G. Onida, Y. Pouillon, T. Rangel, G.-M.
Rignanese, D. Sangalli, R. Shaltaf, M. Torrent, M.J. Verstraete, G. Zerah, and J.W.
Zwanziger, Computer Phys. Comm. 180, 2582 (2009).

BIBLIOGRAPHY 145
[159] www.abinit.org
[160] R. C. Kell, and N. J. Hellicar, Acta Acustica united with Acustica, 6, 235 (1956).
[161] K. Brajesh, M. Abebe, and R. Ranjan, Phys. Rev. B, 94, 104108 (2016).
[162] J. W. Edwards, R. Speiser, and H. L. Johnston, J. Am. Chem. Soc, 73, 2934 (1951).
[163] A. R. Akbarzadeh, I. Kornev, C. Malibert, L. Bellaiche, and J. M. Kiat, Phys. Rev. B,
72, 205104 (2005).
[164] R. Ali, and M. Yashima, J. Solid State Chem., 178, 2867 (2005).
[165] R. W. G. Wyckoff, Crystal Structures, 2, 390 (1964).
[166] W. Cochran, Adv. Phys., 9, 387 (1960).
[167] W. Zhong, D. Vanderbilt, and K. M. Rabe, Phys. Rev. B, 52, 6301 (1995).
[168] Ph. Ghosez, X. Gonze, and J.-P. Michenaud, Ferroelectrics, 206, 205 (1998).
[169] Y. Qi, S. Liu, I. Grinberg, and A. M. Rappe, Phys. Rev. B, 94, 134308 (2016).
[170] G. Shirane, H. Danner, and R. Pepinsky, Phys. Rev., 105, 856 (1957).
[171] A. W. Hewat, Ferrelectrics, 6, 215 (1974).
[172] G. H. Kwei, A. C. Lawson, S. J. L. Billinge, and S. W. Cheong, J. Phys. Chem. 97, 2368
(1993).
[173] W. Zhong, and D. Vanderbilt, Phys. Rev. Lett., 74, 2587 (1995).
[174] B. J. Kennedy, C. J. Howard, and B. C. Chakoumakos, J. Phys.: Condens. Matter, 11,
1479 (1993).
[175] Y. Wang, and R. C. Liebermann, Phys. Chem. Minerals, 20, 147 (1993).
[176] Z. F. Hou, Physica B, 403, 2624 (2008).
[177] P. Stoch, J. Szczerba, J. Lis, D. Madej, and Z. Pedzich, J. Eur. Ceram. Soc, 32, 665
(2012).
[178] Y. Du, Z.P. Jin, and P. Y. Huang, J. Am. Ceram. Soc, 75, 3040 (1992).
[179] L. Bellaiche, and J. Iniguez, Phys. Rev. B, 88, 014104 (2013).
[180] K. M. Rabe and U. V. Waghmare, Phil. Trans. R. Soc. Lond. A, 354, 2897 (1996).
[181] C. Ederer and, N. A. Spaldin, Phys. Rev. Lett., 95, 257601 (2005).

BIBLIOGRAPHY 146
[182] A. J. Hatt, N. A. Spaldin and, C. Ederer, Phys. Rev. B, 81, 054109 (2010).
[183] X. Cheng, and M. Shen, Mater. Res. Bull., 42, 1662 (2007).
[184] D. Fu, and M. Itoh, arXiv:1503.00406 [cond-mat.mtrl-sci] (2015).
[185] V. D. Araujo, F. V. Motta, A. P. A. Marques, C. A. Paskocimas, M. R. D. Bomio, E.
Longo, and J. A. Varela, J. Mater. Sci., 49, 2875 (2014).
[186] R. D. Shannon, Acta Cryst., A 32, 751 (1976).
[187] R. E. Cohen, and H. Krakauer, Phys. Rev. B, 42, 6416 (1990).
[188] Ph. Ghosez, X. Gonze, and J.-P. Michenaud, Europhys. Lett., 33, 713 (1996).
[189] E. Bousquet, and Ph. Ghosez, Phys. Rev. B, 74, 180101 (2006).
[190] J. W. Bennett, I. Grinberg, and A. M. Rappe, Chem. Mater., bf 20, 5134 (2008).
[191] R. D. Smith, and D. Vanderbilt, Phys. Rev. B, 47, 1651 (1993).
[192] J. W. Bennett, I. Grinberg, and A. M. Rappe, Chem. Mater., 20, 5134 (2008)
[193] I. Levin, V. Krayzman, and J. C. Woicik, Appl. Phys. Lett., 102, 162906 (2013).
[194] I. B. Ouni, D. Chapron, H. Aroui and M. D. Fontana, J. Appl. Phys., 121, 114102 (2017).
[195] D. Fu, M. Itoh, S.-ya Koshihara, T. Kosugi, and S. Tsuneyuki, Phys. Rev. Lett., 100,
227601 (2008).
[196] T. Mitsui, and W. B. Westphal, Phys. Rev., 124, 1354 (1961).
[197] D. E. Khmel’nitskii and V. L. Shneerson, Sov. Phys. Solid State, 13, 687 (1971).
[198] A. Cano and A. P. Levanyuk, Phys. Rev. B, 70, 064104 (2004).
[199] J. Ravez, and A. Simon, Eur. J. Solid State Inorg. Chem., 34, 1199 (1997).
[200] J. Savez, C. Broustera, and A. Simon, J. Mater. Chem., 9, 1609 (1999).
[201] A. Simon, J. Ravez, and M. Maglione, J. Phys.: Condens. Matter, 16, 936 (2004).
[202] C. Laulhe, F. Hippert, J. Kreisel, M. Maglione, A. Simon, J. L. Hazemann, and V. Nassif
, Phys. Rev. B, 74, 014106 (2006).
[203] V. S. Puli, D. K. Pradhan, B. C. Riggs, D. B. Chrisey, and R. S. Katiyar, Integrated
Ferrolectrics, 157, 139 (2014).

BIBLIOGRAPHY 147
[204] M. Dawber, C. Lichtensteiger, M. Cantoni, M. Veithen, Ph. Ghosez,K. Johnston, K. M.
Rabe,and J.-M. Triscone, Phys. Rev. Lett., 95, 177601 (2005).
[205] M. Dawber, N. Stucki, C. Lichtensteiger, S. Gariglio, Ph. Ghosez, and J.-M. Triscone,
Adv. Mater., 19, 4153 (2007).
[206] E. Bousquet, J. Junquera, and Ph. Ghosez, Phys. Rev. B, 82, 045426 (2010).
[207] N. Sai, K. Rabe, and D. Vanderbilt, Phys. Rev. B, 66, 104108 (2002).
[208] T. Maiti, R. Guo, and A.S. Bhalla, J. Am. Ceram. Soc., 91, 1769 (2008).
[209] J. Kreisel, P. Bouvier, M. Maglione, B. Dkhil, and A. Simon, Phys. Rev. B, 69, 092104
(2004).
[210] C. Laulhe, F. Hippert, J. Kreisel, A. Pasturel, A. Simon, J.-L. Hazemann, R. Bellissent,
and G.J. Cuello, Phase Transition, 84, 438 (2011).
[211] N. K. Karan et al., J. Raman Spectrosc, 40, 370 (2009).
[212] A. R. Akbarzadeh, S. Prosandeev, Eric J. Walter, A. Al-Barakaty, and L. Bellaiche, Phys.
Rev. Lett., 108, 257601 (2012).
[213] Y. Nahas, A. Akbarzadeh, S. Prokhorenko, S. Prosandeev, R. Walter, I. Kornev, J.
Iniguez, and L. Bellaiche, Nat. Commun., 8, 15944 (2017).
[214] C. Chemarin, N. Rosman, T. Pagnier, and G. Lucazeau, Journal of Solid State Chemistry,
149, 298 (2000).
[215] Md Al Helal, T. Mori, and S. Kojima, Ferroelectrics, 499, 107 (2016).
[216] R. S. Mulliken, J. Chem. Phys., 23, 1997 (1955).
[217] K.Momma, and F. Izumi, J. Appl. Crystallogr., 44, 1272 (2011).
[218] ISOTROPY Software Suite, iso.byu.edu., H. T. Stokes, D. M. Hatch, and Branton J.
Campbell, FINDSYM: Program for Identifying the Space Group Symmetry of a Crystal,
J. Appl. Cryst., 38, 237 (2005).
[219] K.Momma, and F. Izumi, J. Appl. Crystallogr., 44, 1272 (2011).
[220] Kroumova et. al., Phase Transitions, 76, 155 (2003).
[221] ISOTROPY Software Suite, iso.byu.edu., H. T. Stokes, D. M. Hatch, and Branton J.
Campbell, SMODES:Find the displacement modes in a crystal which brings the dynamical
matrix to block-diagonal form, with the smallest possible blocks.