first quantum minerals 2012 ghg report · this report therefore represents the latest and most...
TRANSCRIPT

First Quantum Minerals 2017 GHG Report
First Quantum Minerals Ltd
2017 Greenhouse Gas Report

First Quantum Minerals 2017 GHG Report
June 2017 i
Contents 1. Introduction ...................................................................................................................... 1
2. Greenhouse Gas Reduction Initiatives ......................................................................... 1
3. Greenhouse Gas Emissions ............................................................................................ 2
3.1 Scope and Approach ................................................................................................ 2
3.2 Scope 1 (Direct) GHG Emissions ............................................................................ 3
3.3 Scope 2 (Indirect) GHG Emissions ......................................................................... 4
3.4 Scope 3 (Other Indirect) GHG Emissions ............................................................. 5
3.5 Emission Intensity .................................................................................................... 6
3.6 Emissions by Country .............................................................................................. 8
3.7 Supporting Information .......................................................................................... 9
4. References ......................................................................................................................... 9
Tables Table 1: Scope 1 GHG Emissions (tonnes of CO2 equivalents) ........................................ 3
Table 2: Electricity Consumption (MWh) ............................................................................ 4
Table 3: Scope 2 GHG Emissions (tonnes of CO2 equivalents) ........................................ 4
Table 4: Scope 3 GHG Emissions (tonnes of CO2 equivalents) ........................................ 5
Table 5: GHG Emissions Reported by Country .................................................................. 8
Figures Figure 1: Scope 1 GHG Emissions in 2016 ........................................................................... 3
Figure 2: Scope 2 GHG Emissions in 2016 ........................................................................... 5
Figure 3: CO2-eq Intensity – Milled Ore (ton CO2/ton milled ore) ................................. 7
Figure 4: CO2-eq Intensity – Metal Production (ton CO2/ton metal produced) ........... 7
Figure 5: CO2-eq Intensity – Copper Equivalents (ton CO2/ton copper equivalent produced) ................................................................................................................................. 8

First Quantum Minerals 2017 GHG Report
June 2017 1
1. Introduction This document provides a summary of First Quantum Minerals “FQM” or “the Company” greenhouse gas (GHG) emissions from its operations in 2016. This document provides information on just one aspect of our environmental and corporate social responsibility (CSR) programs. For further information on FQM’s sustainability programs, including our bi-annual Sustainability Report and an annual Environmental Information Sheet, review our website at www.first-quantum.com. This report was prepared internally under the control of the Group Environmental Manager. Where previous data was found to be inaccurate, recent data was used to replace it. This report therefore represents the latest and most accurate data available. FQM is still experiencing significant growth. Despite this growth, the company’s overall GHG emissions decreased in 2016. This decrease was as a result of a number of factors across the Group. Factors include, but are not limited to increased production at new sites, revised mining plans as a result of lower metal prices, changes to CO2 emissions factors at utilities providing us with electricity and the sale of some assets (in Finland). Scope 3 emissions increased as a result of more business related travel in 2016.
2. Greenhouse Gas Reduction Initiatives FQM operates under a philosophy of continuous improvement and pushes operations to improve efficiency of energy and raw material use. As most of the Company’s energy use is from Scope 1 activities and in particular operating mobile mining equipment, the Company has focused on these areas for opportunities. Modifications that allow mining equipment to be operated by electricity and not fossil fuels have resulted in significant GHG emission reduction in Zambia. The initiatives which have been rolled out over the last few years include:
A large percentage of haul trucks at Kansanshi mine use trolley assist to move waste rock and/or copper ore from the open pit under electrical power. As in 2015, the savings in CO2 emissions during 2016 at Kansanshi are equivalent to approximately 1% of total CO2 emissions.
Sentinel copper mine in Zambia uses electrical mining equipment including three Caterpillar 7495 rope shovels, two Komatsu PC 5500 shovels, 15 Komastu 960E- and 15 Komatsu 860E trucks as well as Caterpillar MD6640 blast hole drill rigs. In-pit crushers are used to convey ore to the mill and concentrator further reducing diesel fuel usage and associated carbon emissions.
At our Ravensthorpe nickel operation in Western Australia, waste heat from the acid plant is used to generate electricity in three 18.5 MW stream turbines. At full

First Quantum Minerals 2017 GHG Report
June 2017 2
production, the steam turbines are capable of meeting 86% of the operation’s power requirements. Diesel generators are available to supply electricity when one or more of the steam turbines are down. Each operating site also has several smaller initiatives to reduce energy use and the associated emissions. Examples include improved water use and pumping efficiencies, the use of solar power, recycling process solution to capture heat energy, re-engineering grinding circuits, etc.
3. Greenhouse Gas Emissions 3.1 Scope and Approach The identification of greenhouse gas sources, scope of reporting and calculation of the emissions is based on the Greenhouse Gas Protocol: A Corporate Accounting and Reporting Standard Revised Edition by World Resources Institute. Specifically, the scope of our reporting includes emissions from:
Sites where we have operational control of the project and over 50% ownership. For the sites listed in Table 1, we have 100% ownership, except Kansanshi and Cobre Panama (each 80% equity).
Exploration where we control the operations. We have not included exploration activities where we have minor equity involvement.
Three airplanes owned and operated by FQM.
Activities by our Roads Division.
Corporate and administrative offices, which only generate Scope 2 emissions.
Business travel, which is the only Scope 3 emission presented in this report. Internationally recognized calculation tools were used to determine CO2-equivelent emissions from various sources, as follows:
Greenhouse Gas Protocol: The Corporate Accounting and Reporting Standard Revised Edition by World Resources Institute was used as a guide to calculate CO2
emissions.
The Australian Government National Pollution Inventory Emission estimation technique manual - Explosives Detonation was used to determine the nitrous oxide emissions from the use of explosives during mining.
The International Energy Agency CO2 Emissions from Combustion 2013, was used to determine the carbon dioxide emissions from fuels and purchased electricity from various countries.
National Greenhouse and Energy Reporting System Measurement, Australian government, July 2013 was used to calculate GHG emissions from limestone use and carbonate leaching.

First Quantum Minerals 2017 GHG Report
June 2017 3
3.2 Scope 1 (Direct) GHG Emissions
The main sources of First Quantum’s Scope 1 GHG emissions are the combustion of fuels by mobile mining equipment, electric generators, the processing of limestone in metallurgical processes, and the reaction of carbonates in ore from acid leaching. The Scope 1 GHG emissions over the past six years are presented in Table 1. In 2016, the Company’s Scope 1 GHG emissions decreased by 2.6%. The decrease is primarily related to changes in mining activity at a number of sites and the sale of Kevitsa. The
percentage of Group GHG emissions produced per operation is provided in Figure 1.
Table 1: Scope 1 GHG Emissions (tonnes of CO2 equivalents)
Location 2011 2012 2013 2014 2015 2016
Bwana Mkubwa, Zambia 50,200 2,000 200 131 108 733
Çayeli, Turkey 4,700 4,826 5,490 6,061 6,114 6,250
Closed Properties, Canada & US
500 500 895 664 549 411
Cobre Las Cruces, Spain 40,700+ 72,500 72,973 76,436 69,408 65,241
Cobre Panama, Panama 5,900 14,200 13,069 81,302 110,831 139,998
Exploration Global 6,000 4,100 6,237 3,026 1,025 352
Guelb Moghrein, Mauritania 126,700 136,000 146,249 140,687 146,768 158,169
Haquira, Peru - 500 121 513 492 454
Taca Taca, Argentina - - - - - 62
Kansanshi, Zambia* 199,900 293,921 489,068 457,903 551,965 605,147
Roads Division 1,000 1,100 2,130 35,497 - 1,315
Kevitsa, Finland# 16,600 21,000 26,710 35,314 82,323 13,528
Pyhäsalmi, Finland 1,800 1,900 1,811 1,763 2,509 2,521
Ravensthorpe, Australia 125,400 294,418 247,635 254,176 158,734 116,876
Sentinel, Zambia 2,100 10,100 42,995 103,645 165,503 151,579
Total 581,500 857,065 1,055,583 1,197,118 1,296,329 1,262,636 * Roads Division (excluding their planes) has been included in Kansanshi figures in 2015 and 2016 # Kevitsa was sold on June 1, 2016
Figure 1: Scope 1 GHG Emissions in 2016
Çayeli0.50% Cobre Las
Cruces5.17%
Guelb Moghrein
12.54%
Kansanshi47.98%
Kevitsa1.07%
Pyhäsalmi0.20%
Ravensthorpe9.27%
Trident12.02%
Bwana Mkubwa
0.06%
N.Am Closed Properties
0.03%Kansanshi
Smelter11.10%
Cobre Panama0.04% Haquira
0.03%

First Quantum Minerals 2017 GHG Report
June 2017 4
3.3 Scope 2 (Indirect) GHG Emissions The electricity consumption at our major sites over the last four years is provided in Table 2. All sites listed purchase electricity from local power generation companies. Guelb Moghrein and Ravensthorpe generate their own power. In 2016, the Company’s purchased electricity consumption decreased by approximately 2%. The increase in consumption in Zambia was offset by the sale of Kevitsa.
Table 2: Electricity Consumption (MWh)
Location 2012 2013 2014 2015 2016
Bwana Mkubwa, Zambia 72,540 2,730 2,250 1,950 1,586
Closed Properties, Canada & US 4,880 4,940 4,570 4,732 4,315
Çayeli, Turkey 76,770 77,587 77,587 75,926 71,423
Cobre Las Cruces, Spain 249,820 249,750 272,130 276,055 291,784
Guelb Moghrein, Mauritania# - - - 869 2,410
Kansanshi, Zambia 836,610 896,030 1,015,450 1,191,865 1,269,323
Kevitsa, Finland+ 164,270 289,300 301,600 329,559 110,649
Pyhäsalmi, Finland 76,150 76,490 78,790 77,754 73,601
Ravensthorpe, Australia* - - - 39 -
Sentinel, Zambia - - 13,380 339,020 424,947
Offices - Johannesburg, Lima, London, Ndola, Nouakchott, Panama City, Perth, Toronto, Vancouver
10,750 10,110 10,000 1,490 1,029
Total 1,491,790 1,606,937 1,775,757 2,299,259 2,251,067 # Guelb Moghrein generates their own electricity at the mine. Values for 2016 represent facilities in Nouakchott + Kevitsa was sold on June 1, 2016 * Ravensthorpe generates its own electricity at site
The Scope 2 GHG emissions from the purchase of electricity from external electricity generating companies over the past five years are provided in Table 3 and Figure 2. As with electrical consumption, the Company’s Scope 2 GHG emissions decreased in 2016. The decrease in Scope 2 emissions was primarily as a result of the sale of Kevitsa. Our biggest two electricity users rely on electricity provided by the Zambian state utility, ZESCO. Most of the power generated by ZESCO is generated from hydro-electric sources.
Table 3: Scope 2 GHG Emissions (tonnes of CO2 equivalents)
Location 2011 2012 2013 2014 2015 2016
Bwana Mkubwa, Zambia 20 200 10 10 12 10
Çayeli, Turkey 36,000 36,200 36,600 36,600 35,837 32,793
Closed Properties, Canada & U.S 80 20 50 180 173 11
Cobre Las Cruces, Spain 78,000 72,696 72,678 79,183 80,332 90,453
Guelb Moghrein, Mauritania - - - - 426 245
Kansanshi, Zambia 2,400 2,500 5,380 6,100 7,151 7,616
Kevitsa, Finland+ 20 34,000 60,000 67,250 62,946 21,134

First Quantum Minerals 2017 GHG Report
June 2017 5
Location 2011 2012 2013 2014 2015 2016
Pyhäsalmi, Finland 19,100 24,000 23,490 23,680 15,512 14,058
Ravensthorpe, Australia - - - - 32 -
Trident, Zambia - - - 80 2,034 2,550
Administrative - Johannesburg, Lima, London, Ndola, Nouakchott, Panama City, Perth, Toronto, Vancouver
700 1,100 700 860 541 388
Total 136,320 170,749 198,929 213,964 204,995 169,256 + Kevitsa was sold on June 1, 2016
Figure 2: Scope 2 GHG Emissions in 2016
3.4 Scope 3 (Other Indirect) GHG Emissions The only Scope 3 GHG emission information provided in this report is for employee business air travel. Data on business air travel for all FQM sites for the last four years is provided in Table 4. Scope 3 GHG emissions increased in 2016 as a result of more employee business air travel.
Table 4: Scope 3 GHG Emissions (tonnes of CO2 equivalents)
Site 2012 2013 2014 2015 2016
Bwana Mkubwa 4 80 2 - -
Çayeli 205 255 141 99.8 57.0
Cobre Las Cruces 74 74 102 69.3 54.8
Cobre Panama 1,205 47 402 962.2 2,981.3
Exploration 69 NR 93 303.8 231.3
Guelb Moghrein 2,142 888 940 1,470.2 1,114.8
Haquira 241 38 340 128.9 122.9
Johannesburg Office 437 274 1,138 432 732.7
Kansanshi 593 813 1,827 247.8 352.8
Kevitsa + 145 201 252 246.9 92.9
Çayeli19.37%
Cobre Las Cruces53.44%
Guelb Moghrein
0.14%
Kansanshi4.50%
Kevitsa12.49%
Pyhäsalmi8.31%
Ravensthorpe0.00%
Trident1.51%
Closed Mines0.09%
KansanshiSmelter1.00%
Projects0.08%
Admin and Offices0.18%

First Quantum Minerals 2017 GHG Report
June 2017 6
Site 2012 2013 2014 2015 2016
London Office 334 430 575 476 255.2
Closed Properties, Canada & US 5 3 12 5.7 0.4
Ndola Office 979 990 990 25 -
Perth Office 970 1,261 1,249 1,070 942.8
Pyhäsalmi 70 28 46 21.2 11.0
Ravensthorpe 889 159 349 593.6 1,168.9
Sentinel - - 1,545 125.9 224.3
Toronto Office 668 274 114 59.6 55.0
Vancouver Office - 6 3 - -
Total 9,031 5,819 10,119 7,351 9,802 + Kevitsa was sold on June 1, 2016
3.5 Emission Intensity Emission intensity (normalizing emission loading based on key operational parameters) is an important tool to better understand performance. FQM is in a significant growth phase due to acquisitions and development projects. As a result, our absolute emissions are increasing as noted in the discussions above. Furthermore, during 2016, FQM sold the Kevitsa operation in Finland. These absolute changes mask operational improvements that are being implemented at each site. This sections looks at the emission data by normalizing it for three operating parameters, namely:
Milled Ore
Metal Production
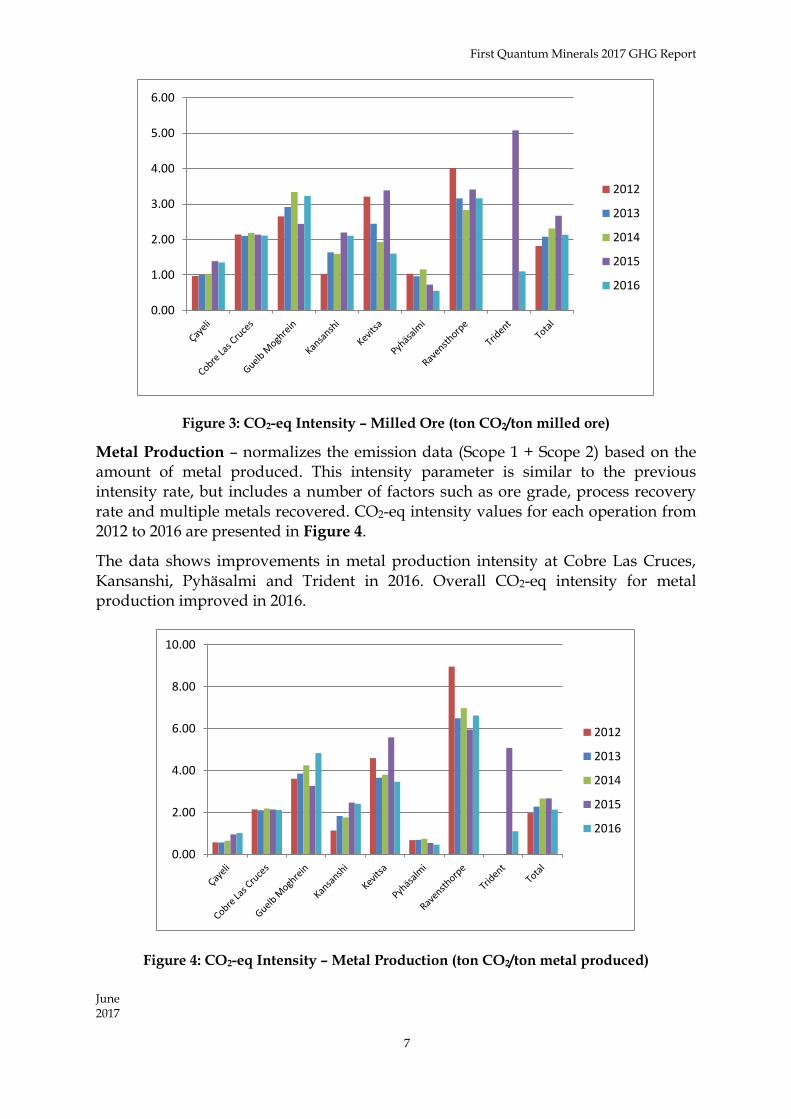
Copper Equivalents Milled Ore – normalizes the emission data (Scope 1 + Scope 2) based on the amount of ore processed. In this analysis, changes in emissions due solely to changes in throughput are discounted. The resulting comparisons often reflect improvements in operating efficiency. CO2-eq intensity values for each operation from 2012 to 2016 are presented in Figure 3. The data shows improvements in milled ore intensity at all the sites except Guelb Moghrein in 2016. Overall CO2-eq intensity for milled ore improved in 2016.
First Quantum Minerals 2017 GHG Report
June 2017 7
Figure 3: CO2-eq Intensity – Milled Ore (ton CO2/ton milled ore)
Metal Production – normalizes the emission data (Scope 1 + Scope 2) based on the amount of metal produced. This intensity parameter is similar to the previous intensity rate, but includes a number of factors such as ore grade, process recovery rate and multiple metals recovered. CO2-eq intensity values for each operation from 2012 to 2016 are presented in Figure 4.
The data shows improvements in metal production intensity at Cobre Las Cruces, Kansanshi, Pyhäsalmi and Trident in 2016. Overall CO2-eq intensity for metal production improved in 2016.
Figure 4: CO2-eq Intensity – Metal Production (ton CO2/ton metal produced)
0.00
1.00
2.00
3.00
4.00
5.00
6.00
2012
2013
2014
2015
2016
0.00
2.00
4.00
6.00
8.00
10.00
2012
2013
2014
2015
2016

First Quantum Minerals 2017 GHG Report
June 2017 8
Copper Equivalents – normalizes the emission data (Scope 1 + Scope 2) and combines metals sold and presents it as if all of the revenue were in copper. This intensity reflects the CO2 produced as a function of the revenue created from the mine. Other factors to consider include the change in commodity pricing of metals relative to the price change in copper. CO2-eq intensity values for each operation from 2012 to 2016 are presented in Figure 5.
The data shows improvements in copper equivalents intensity at all sites except Guelb Moghrein in 2016. Overall CO2-eq intensity for copper equivalents improved in 2016.
Figure 5: CO2-eq Intensity – Copper Equivalents (ton CO2/ton copper equivalent produced)
3.6 Emissions by Country
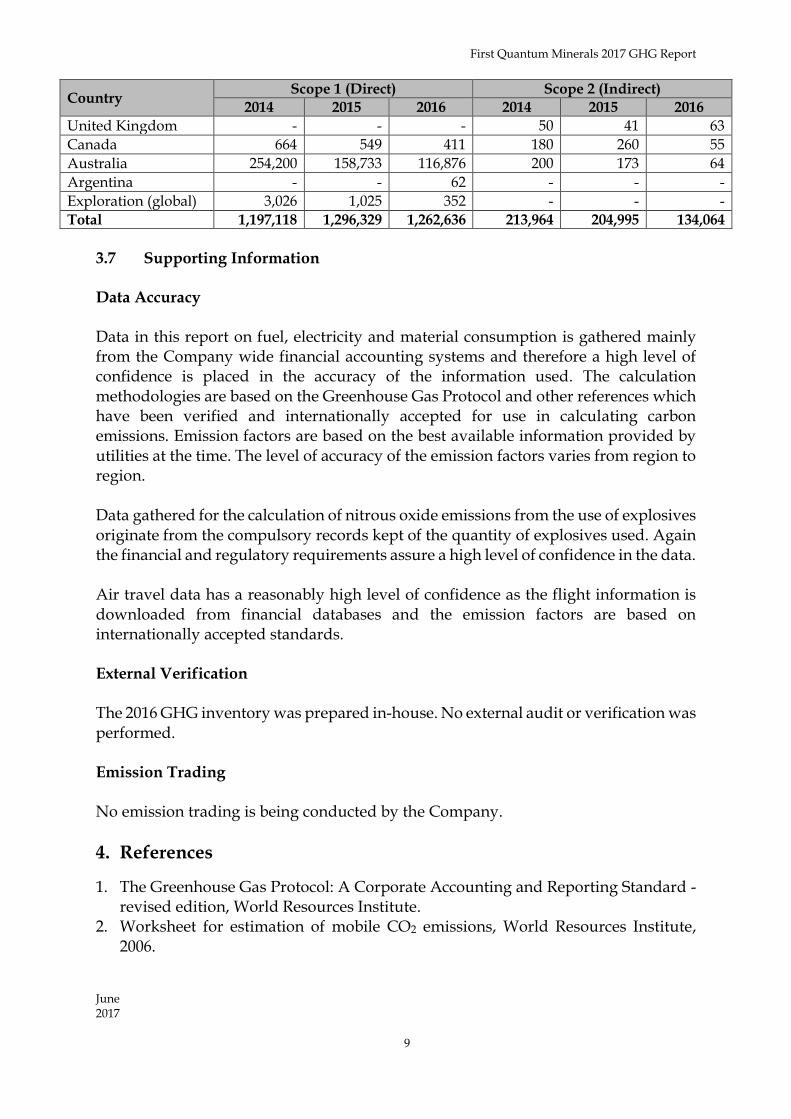
The direct and indirect emission data by country are provided in Table 5.
Table 5: GHG Emissions Reported by Country
Country Scope 1 (Direct) Scope 2 (Indirect)
2014 2015 2016 2014 2015 2016
Zambia 597,177 717,575 758,774 6,190 9,197 10,175
Turkey 6,061 6,113 6,250 36,621 35,837 32,793
Spain 76,436 69,408 65,241 79,183 80,332 90,453
Panama 81,300 110, 831 139,998 100 144 139
Mauritania 140,687 146,767 158,169 300 425 245
Peru 513 492 454 30 26 17
South Africa - - - 100 87 60
Finland 37,077 84,832 16,049 90,800 78,457 35,192
0.00
1.00
2.00
3.00
4.00
5.00
6.00
2012
2013
2014
2015
2016
First Quantum Minerals 2017 GHG Report
June 2017 9
Country Scope 1 (Direct) Scope 2 (Indirect)
2014 2015 2016 2014 2015 2016
United Kingdom - - - 50 41 63
Canada 664 549 411 180 260 55
Australia 254,200 158,733 116,876 200 173 64
Argentina - - 62 - - -
Exploration (global) 3,026 1,025 352 - - -
Total 1,197,118 1,296,329 1,262,636 213,964 204,995 134,064
3.7 Supporting Information Data Accuracy Data in this report on fuel, electricity and material consumption is gathered mainly from the Company wide financial accounting systems and therefore a high level of confidence is placed in the accuracy of the information used. The calculation methodologies are based on the Greenhouse Gas Protocol and other references which have been verified and internationally accepted for use in calculating carbon emissions. Emission factors are based on the best available information provided by utilities at the time. The level of accuracy of the emission factors varies from region to region. Data gathered for the calculation of nitrous oxide emissions from the use of explosives originate from the compulsory records kept of the quantity of explosives used. Again the financial and regulatory requirements assure a high level of confidence in the data. Air travel data has a reasonably high level of confidence as the flight information is downloaded from financial databases and the emission factors are based on internationally accepted standards. External Verification The 2016 GHG inventory was prepared in-house. No external audit or verification was performed. Emission Trading No emission trading is being conducted by the Company.
4. References
1. The Greenhouse Gas Protocol: A Corporate Accounting and Reporting Standard - revised edition, World Resources Institute.
2. Worksheet for estimation of mobile CO2 emissions, World Resources Institute, 2006.
First Quantum Minerals 2017 GHG Report
June 2017 10
3. Optional Emissions from Commuting, Business Travel and Product Transport; May 2008, US Environmental Protection Agency; EPA430-R-08-006.
4. National Greenhouse Accounts (NGA) Factors Australian Government Department of Climate Change, 2008 - Table 4
5. National Greenhouse and Energy Reporting System Measurement, Australian government, July 2013
6. The International Energy Agency CO2 Emissions from Fuel Combustion Highlights, 2013
7. Annual Reports, First Quantum Minerals Ltd.