first quarter 2015 groundwater monitoring and sampling report
TRANSCRIPT

First Quarter 2015 Groundwater Monitoring and Sampling Report Maryland Square PCE Site
April 27, 2015 Cardno ATC i
First Quarter 2015 Groundwater Monitoring and Sampling Report
Maryland Square PCE Site Cardno ATC Project No. Z085000030
Prepared for Herman Kishner Trust c/o Mr. Tom Vandenberg, Esq. 707 Wilshire Boulevard, 45th Floor Los Angeles, California 90017
Prepared by Cardno ATC 7115 Amigo Street, Suite 100 Las Vegas, Nevada 89119 Phone: 702-990-9300 Fax: 702-990-9305
April 27, 2015
First Quarter 2015 Groundwater Monitoring and Sampling Report
Maryland Square PCE Site 3661 South Maryland Parkway Las Vegas, Nevada Facility ID: H-000086 Cardno ATC Project No. Z085000030

First Quarter 2015 Groundwater Monitoring and Sampling Report Maryland Square PCE Site
April 27, 2015 Cardno ATC ii
Executive Summary
April 27, 2015
Herman Kishner Trust c/o Mr. Tom Vandenberg, Esq. 707 Wilshire Boulevard, 45th Floor Los Angeles, California 90017 Re: First Quarter 2015 Groundwater Monitoring and Sampling Report
Maryland Square PCE Site 3661 South Maryland Parkway Las Vegas, Nevada NDEP Facility ID No. H-000086
Dear Mr. Vandenberg:
Cardno ATC is submitting this report documenting the results of a recent quarterly groundwater monitoring event conducted at the Maryland Square PCE Site (site). The groundwater monitoring was conducted to evaluate dissolved chlorinated ethenes, specifically tetrachloroethene (PCE), detected in the soil and groundwater in the vicinity of the above referenced site in accordance with requests from the Nevada Division of Environmental Protection (NDEP).
Work Performed First Quarter 2015
Cardno ATC performed quarterly monitoring and sampling activities at 59 of the 59 site groundwater monitoring wells.
Current Phase of Project: Monitoring and Sampling
Frequency of Sampling: Groundwater: Select Wells Quarterly (Semi-annual or Annual for 2015)
Frequency of Monitoring: Groundwater: Select Wells Quarterly (Semi-annual or Annual for 2015)
Purge Water Removed This Quarter: 79.59 gallons
Approximate Depth to Groundwater: 19.66 ft btoc
Groundwater Gradient: Site Monitoring Network: 0.013 feet/foot
Groundwater Flow Direction: Site Monitoring Network: East
Groundwater Analytical Methods: Select VOCs by EPA 8260B, metals by EPA 6020, and hexavalent chromium (Cr(VI)) by EPA 218.6
Monitoring Wells Sampled with PCE Concentrations Greater than 5.0 μg/L: 41 of 59 monitoring points
Maximum PCE Concentration (µg/L): 11,000 (MW-14I)
Monitoring Wells Sampled with PCE Concentrations Greater than 5.0 μg/L Previous Quarter: 18 of 22 monitoring points
Maximum PCE Concentration Previous Quarter (µg/L): 11,000 (MW-14I)
Historical groundwater elevation data and analytical results are summarized in Table A-1. Current groundwater elevation data and analytical results are summarized in Table A-2. Site figures and groundwater analytical isoconcentration maps, are included as Figures 1 and 2. Groundwater field sampling forms and laboratory analytical reports are included in Appendix A and B, respectively. Mann-Kendall Trend Tests for Plume Stability are included in Appendix C.

First Quarter 2015 Groundwater Monitoring and Sampling Report Maryland Square PCE Site
April 27, 2015 Cardno ATC iii
Table of Contents
Executive Summary ii
1 Background 4
2 Groundwater Monitoring and Sampling 6
2.1 Deviations 7
2.2 Groundwater Conditions 8
2.2.1 Vertical Gradient Assessment 8
2.3 Groundwater Analytical Results 9
2.4 Mann-Kendall Trend Test for Plume Stability 17
3 Summary 19
3.2 Recommendations 20
3.3 Limitations 20
4 Environmental Certification Jurat 22
Tables Current Groundwater Gauging and Analytical Data Historical Groundwater Gauging and Analytical Data Figures Site Vicinity Map Groundwater Potentiometric Map PCE Isoconcentration Map
Appendix A Field Sheets
Appendix B Laboratory Analytical Reports Appendix C Mann-Kendall Trend Test for Plume Stability

First Quarter 2015 Groundwater Monitoring and Sampling Report Maryland Square PCE Site
April 27, 2015 Cardno ATC 4
1 Background
The source area for the Maryland Square Tetrachloroethylene (PCE) Site is located at 3661 South Maryland
Parkway in Las Vegas, Nevada. The source area is the location of a former dry cleaner (Al Phillips the Cleaner)
that was contained within the former Maryland Square Shopping Center. Al Phillips the Cleaner operated at the
site from 1969 through 2000.
The parent parcel for the former shopping center is located at the northwest corner of Maryland Parkway and
Twain Avenue, and lies within the Southeast ¼ of the Northeast ¼ of Section 15, Township 21 South, Range 61
East. This parcel is designated as assessor’s parcel number (APN) 162-15-602-009 and is a 6.57-acre tract of
land. The parcel lies northwest of the corner of South Maryland Parkway and East Twain Avenue.
Properties surrounding the former Maryland Square Shopping Center consist primarily of commercial
developments, as well as some residential areas. The Boulevard Mall lies directly east of the source area,
across South Maryland Parkway. A residential neighborhood and a golf course are located east of The
Boulevard Mall.
The initial spill report for PCE in groundwater was reported to NDEP in November 2000. The contamination was
discovered during environmental investigations being performed for a property transaction. A soil boring
installed during the initial environmental investigation at the former shopping center was converted into a
monitoring well (MW-1). Analysis of the groundwater sample collected from MW-1 found 2,300 micrograms per
liter (μg/L) or parts per billion (ppb) of PCE in groundwater. This concentration of PCE exceeded Nevada’s
action level of 5 µg/L, as defined in NAC445A.2273.5(1)(c), which adopts the primary maximum contamination
level (MCL) of 5 µg/L for PCE in drinking water, as defined by the U.S. Environmental Protection Agency (EPA).
From 2000 through 2004, additional soil borings and monitoring wells were installed at the former Maryland
Square Shopping Center and to the east on the Boulevard Mall property in an attempt to find the eastern extent
of the PCE plume. In February, the parent company (DCI) of the former dry cleaners accepted responsibility for
the PCE contamination and assumed control of assessment activities, using URS Corporation (URS) to perform
additional characterization and groundwater monitoring.
In March 2005, after not finding the eastern extent of the PCE plume on mall property, URS installed five
monitoring wells within the residential neighborhood east of the Boulevard Mall (see:
http://ndep.nv.gov/pce/graphic/2012_Map_Well_History.pdf). Concentrations of PCE exceeded the action level
(5 µg/L) in groundwater samples collected from three of these five wells, with the highest concentration at 1,430
µg/L. In 2006, two additional wells were installed farther east in the neighborhood, and groundwater samples
from the wells confirmed the presence of the PCE plume in groundwater beneath the neighborhood.
In early 2007, the NDEP performed vapor transport modeling using the analytical data for wells within the
neighborhood. The results of modeling indicated the potential for unacceptable level of PCE vapors in indoor air,
via the process of vapor intrusion. In response to a NDEP requirement to sample soil gas for PCE, URS
conducted a soil vapor study in March 2007. Soil borings were installed along three transects across the inferred
extent of the PCE plume; one transect in the eastern parking lot of the Boulevard Mall, and two within the
residential neighborhood east of the mall. Soil gas samples were collected at multiple depths within each boring.
The concentrations of PCE in soil vapor samples ranged from not detected to170,000 micrograms per cubic
meter (μg/m3), with the maximum concentration measured for a vapor sample collected at 20 feet bgs from
boring SVB-14.
The dry cleaner’s parent company (DCI) declared bankruptcy in July 2008, and URS discontinued work at the
site. Converse, on behalf of the Trust, resumed quarterly monitoring as required by the NDEP. Converse
continued with monitoring until July 2010, when field activities and responsibilities were transferred from
Converse to Tetra Tech EM Inc. (Tetra Tech) during the second quarter of 2010. Groundwater monitoring

First Quarter 2015 Groundwater Monitoring and Sampling Report Maryland Square PCE Site
April 27, 2015 Cardno ATC 5
protocol and procedures used by Converse and accepted by NDEP were continued to maintain data
consistency.
On December 27, 2010, the U.S District Court issued a Permanent Injunction that dictated the schedule for
remediation of source-area soils and PCE-contaminated groundwater across the site. The injunction also
decreed that groundwater monitoring should continue based on the schedule previously defined by the NDEP.
Responsibilities for groundwater monitoring and sampling were transferred from Tetra Tech to Cardno ATC in
the fourth quarter of 2011. Tetra Tech continued to provide the Trust with support for indoor air testing and
performed field pilot testing for groundwater remedies in early 2013. Pilot testing focused on in situ chemical
oxidation (ISCO).
As of the date of this quarterly report, there are 59 monitoring wells (some of which include nested and multi-
depth wells) located across the site. The site spans approximately 6,000 feet in length, from the source area to
the terminus of the plume, as defined by the 5 μg/L boundary.
Additional information, including the full administrative record detailing correspondence with NDEP can be found
at http://ndep.nv.gov/pce/maryland_square.htm and clicking on the Administrative Record link.

First Quarter 2015 Groundwater Monitoring and Sampling Report Maryland Square PCE Site
April 27, 2015 Cardno ATC 6
2 Groundwater Monitoring and Sampling
NDEP has directed monitoring of the site-related groundwater monitoring well network as outlined in its response
letter to the Converse report titled “Groundwater Monitoring Report, 3rd Quarter 2009, Maryland Square
Shopping Center,” dated December 22, 2009.
Select monitoring wells are sampled in 2015 on a quarterly, semi-annual, or annual basis as per agreement with
NDEP. The sampling schedule is based on the relative PCE concentrations detected in individual monitoring
wells in addition to the proximity of a monitoring well to the ascertained plume area. The 2015 sampling schedule
has been modified and approved by NDEP.
The NDEP modified the sampling schedule in response to Cardno ATC’s request in the “Fourth Quarter 2013
Groundwater Monitoring and Sampling Report,” dated January 28, 2014. The letter proposed that the 2014
monitoring be revised to include all site wells as the annual sampling event. The NDEP concurred with Cardno
ATC’s recommended sampling schedule, with minor changes, in the response letter dated February 21, 2014.
The sampling schedule is expected to continue in 2015.
The NDEP approved annual sampling schedule for monitoring wells in the groundwater monitoring program is as
follows:
First Quarter – MW-1 through MW-3, MW-5 through MW-39, MW-40 (all depths), MW-41, MW-42, MW-
43 MW-14I, MW-19I, MW-6D1, MW-6D2, MW-6D3, MW-19D1, MW-19D2, MW-19D3, MW-20D1, MW-
20D2, and MW-20D3.
Second Quarter – MW-1, MW-5, MW-6, MW-18, MW-38, MW-41, MW-42, MW-43, MW-14I, MW-19I,
MW-6D1, MW-19D1, MW-19D2, MW-19D3, MW-20D2, MW-40 CMT-30, MW-40 CMT-45, and MW-40
CMT-60 (plus any newly installed wells).
Third Quarter – MW-1, MW-5, MW-6, MW-13, MW-14, MW-18, MW-19, MW-23, MW-25, MW-26, MW-
32, MW-38, MW-41, MW-42, MW-43, MW-14I, MW-19I, MW-6D1, MW-6D3, MW-19D1, MW-19D2, MW-
19D3, MW-20D1, MW-20D2, MW-20D3, MW-40 CMT-30, MW-40 CMT-45, and MW-40 CMT-60 (plus
any newly installed wells).
Fourth Quarter – MW-1, MW-5, MW-6, MW-18, MW-38, MW-41, MW-42, MW-43, MW-14I, MW-19I,
MW-6D1, MW-19D1, MW-19D2, MW-19D3, MW-20D2, MW-40 CMT-30, MW-40 CMT-45, and MW-40
CMT-60 (plus any newly installed wells).
The groundwater monitoring procedures are consistent with the protocol presented by URS in its August 2007
letter and accepted by NDEP in its September 10, 2007 letter. The prescribed groundwater monitoring protocol
used at the site was revised to employ the ASTM D6771-02 method in the fourth quarter of 2007. This sampling
method relies on low flow pumping that moderates the velocity of water entering the pump intake from the
formation pore water surrounding the well. Minimized stress and turbulence within the water-bearing unit during
pumping allows collection of groundwater samples generally considered more representative of water quality in
the formation than the conventional method, which calls for evacuation of three well volumes of groundwater
using downhole pumps or bailers.
Cardno ATC reviewed prior field notes to determine a consistent sampling depth in each well within the
monitoring network. The depth chosen was based on the PCE results taken over time. The representative depth
was placed on each sampling sheet along with a marking on the dedicated hose in each well casing, and will be
carried over for each sampling event, irrespective of the depth to water and total depth measurements. Based on
the results of the First Quarter 2015 sampling event, Cardno ATC will continue to utilize the depths used this
quarter going forward.
Groundwater parameters (i.e., pH, temperature, dissolved oxygen (DO), oxidation reduction potential (ORP), and
electrical conductivity) were measured to evaluate the entrance of actual formation water into the well. Cardno

First Quarter 2015 Groundwater Monitoring and Sampling Report Maryland Square PCE Site
April 27, 2015 Cardno ATC 7
Cardno ATC placed the inlet of the pump at the pre-determined depth that will be consistently used at each
particular well. Groundwater was pumped at a flow rate of 0.25 L/min. The pump rate was lowered following the
stabilization of groundwater parameters to minimize turbulence, and groundwater was transferred to clean
laboratory-supplied 40-milliliter glass volatile organic analysis vials (VOAs), sealed, labeled, and placed in a cool
environment for transport to an NDEP-certified laboratory for analysis.
The groundwater monitoring procedure for MW-40 CMT wells had to be modified due to the well construction of
MW-40 CMT. CMT is a product manufactured by Solinst that stands for continuous multichannel tubing, meaning
that there are multiple tubings set at different depths in one borehole. The benefits of a CMT well is that each
channel of tubing allows for discrete sampling at a particular depth which in turn gives a three dimensional view
of contamination through the entire range of sampling depths, rather than an average of the entire well length.
The method used for groundwater sampling all depths of MW-40 CMT was a 3/8 inch Model 408M Micro Double
Valve Pump. The double-valve pump is a pneumatic pump which was set to the bottom of each well depth, and
pumped at each depth until groundwater parameters stabilized, and then groundwater was transferred to clean
laboratory-supplied 40-milliliter glass volatile organic analysis vials (VOAs), sealed, labeled, and placed in a cool
environment for transport to an NDEP-certified laboratory for analysis.
Decontamination procedures were performed throughout sampling. The pump, water level meter, and field meter
probe were decontaminated after sampling each well. Purge water generated during the sampling of the
monitoring wells was containerized in properly labeled steel 55-gallon drums and stored onsite pending off-site
disposal.
Cardno ATC submitted the collected groundwater samples to an NDEP-certified analytical laboratory for the
analysis of volatile organic compounds (VOCs) using U.S. Environmental Protection Agency (EPA) Method
8260B. The analysis of metals (arsenic, chromium, and manganese) using EPA method 6020 for wells MW-19,
MW-20, MW-19I, MW-40 CMT-30 through MW-40 CMT-60, and the analysis of hexavalent chromium using EPA
method 218.6 for wells MW-19, MW-20, MW-19I, MW-40 CMT-30 through MW-40 CMT-60 was also performed.
Groundwater data collected during this sampling event are summarized in Table 1 and Table A-1. Monitoring
and sampling field sheets are included in Appendix A.
2.1 Deviations
Trip, field, and equipment blanks were sent to the lab along with the groundwater samples collected at each
monitoring well in order to insure quality control. Cardno ATC also collected a duplicate groundwater sample
from monitoring well MW-1.
Laboratory analysis of each groundwater sample produced quantitative data within quality assurance standards,
with the exception of the analysis for hexavalent chromium from MW-19I and four comments made about sample
issues. The sample for MW-19I was purple, most likely due to continued saturation from the prior nearby
potassium permanganate pilot test, and therefore the analysis could not be performed. Other comments made
were:
EPA 8260B: Dilution was necessary on samples N014984-005 and N014984-016 due to high
concentration of Tetrachloroethene.
EPA 6020: Matrix Spike (MS) and Matrix Spike Duplicate (MSD) are outside recovery for Arsenic and
Chromium on QC samples N014985-001B-MS and N014985-001B-MSD criteria possibly due to matrix
interference. The associated Laboratory Control Sample (LCS) recovery was acceptable.
EPA 6020: Hexavalent Chromium was reported at 1.5 μg/L while Chromium was ND on sample
N014984-023. Chromium was detected at concentration of 0.5 μg/L (J-flag value) which is less than the
PQL of 1 μg/L.
With the exception of the above mentioned comments, no laboratory quality control data were flagged outside of
established tolerances. The analytical data on water quality for the fourth quarter were accepted as
representative of actual site conditions.

First Quarter 2015 Groundwater Monitoring and Sampling Report Maryland Square PCE Site
April 27, 2015 Cardno ATC 8
2.2 Groundwater Conditions
Groundwater elevations for this sampling event are summarized in Table 1, while historical groundwater data are
summarized in Table A-1. Depths to groundwater in the wells sampled during this quarterly event ranged from
12.36 feet bgs (MW-28) to 27.55 feet bgs (MW-16). The average groundwater elevation of monitored wells
(excluding MW-40 CMT-35 through CMT-60) was 19.66 feet bgs. There was a 0.77 foot increase when
comparing depth to water of similar monitoring wells that had groundwater measurements for both the Fourth
Quarter 2014 and First Quarter 2015. Based on the first quarter results, the local hydraulic gradient across the
site is generally toward the east.
DO readings for across the site ranged from 0.27 to 6.27 milligrams per liter (mg/L). ORP readings from across
the site ranged from -181.3 to 538.6 millivolts (mV). In response to NDEP’s comment, the DO meter is re-
calibrated each quarter, and the maximum DO readings decreased to within reasonable limits.
2.2.1 Vertical Gradient Assessment
Cardno ATC utilized measured groundwater elevations to determine vertical gradients within two of the five sets
of clustered wells at the site (MW-1/MW-9, MW-6D, MW-19D, MW-20D, and MW-40 CMT). Vertical gradients
are measured to determine the upward or downward flow of groundwater. Clustered wells measured will have a
deep and shallow well that are screened at different lengths which shows the vertical movement of the water
within the adjacent geologic units. The EPA On-Line Vertical Gradient Calculator
(http://www.epa.gov/athens/learn2model/part-two/onsite/vgradient.html) was used to determine the vertical
gradient at the various well clusters.
Table 2-1 Vertical Gradient Calculation, 1st
Quarter 2015
Clustered/Nested Well
Surface Elevation (feet asml)
Depth to Well Screen (feet bgs)
Screen Length (feet)
Depth to Water (feet bgs)
Magnitude (Screen mid-point value)
Flow Direction
MW-1 MW-9
MW-1: 1992.01 MW-9:
1992.25
MW-1: 10
MW-9: 48.5
MW-1: 20
MW-9: 1.5
MW-1: 20.15 MW-9: 20.62
0.009609 Down
MW-6D1 MW-6D2
MW-6D1: 1988.72
MW-6D2: 1988.72
MW-6D1: 50
MW-6D2: 80
MW-6D1: 10
MW-6D2: 10
MW-6D1: 15.41
MW-6D2: 15.35
0.00200 Up
MW-6D2 MW-6D3
MW-6D2: 1988.72
MW-6D3: 1988.72
MW-6D2: 80
MW-6D3: 100
MW-6D2: 10
MW-6D3: 10
MW-6D2: 15.35
MW-6D3: 15.47
0.006000 Down
MW-6D1 MW-6D3
MW-6D1: 1988.72
MW-6D3: 1988.72
MW-6D1: 50
MW-6D3: 100
MW-6D1: 10
MW-6D3: 10
MW-6D1: 15.41
MW-6D3: 15.47
0.001200 Down
MW-19D1 MW-19D2
MW-19D1: 1979.25
MW-19D2: 1979.28
MW-19D1: 31
MW-19D2: 60
MW-19D1: 20
MW-19D2: 10
MW-19D1: 25.74
MW-19D2: 26.88
0.04631 Down
MW-19D2 MW-19D3
MW-19D2: 1979.28
MW-19D3: 1979.32
MW-19D1: 60
MW-19D3: 92
MW-19D1: 10
MW-19D3: 10
MW-19D2: 26.88
MW-19D3: 24.12
0.08761 Up
MW-19D1 MW-19D3
MW-19D1: 1979.25
MW-19D3: 1979.32
MW-19D1: 31
MW-19D3: 92
MW-19D1: 20
MW-19D3: 10
MW-19D1: 25.74
MW-19D3: 24.12
0.03022 Up

First Quarter 2015 Groundwater Monitoring and Sampling Report Maryland Square PCE Site
April 27, 2015 Cardno ATC 9
Clustered/Nested Well
Surface Elevation (feet asml)
Depth to Well Screen (feet bgs)
Screen Length (feet)
Depth to Water (feet bgs)
Magnitude (Screen mid-point value)
Flow Direction
MW-20D1 MW-20D2
MW-20D1: 1978.81
MW-20D2: 1978.66
MW-20D1: 25
MW-20D2: 55
MW-20D1: 20
MW-20D2: 10
MW-20D1: 25.56
MW-20D2: 25.95
0.02171
Down
MW-20D2 MW-20D3
MW-20D2: 1978.66
MW-20D3: 1978.69
MW-20D2: 55
MW-20D3: 90
MW-20D2: 10
MW-20D3: 10
MW-20D2: 25.95
MW-20D3: 20.10
0.1681
Up
MW-20D1 MW-20D3
MW-20D1: 1978.81
MW-20D3: 1978.69
MW-20D1: 25
MW-20D3: 90
MW-20D1: 20
MW-20D3: 10
MW-20D1: 25.56
MW-20D3: 20.10
0.08924
Up
MW-40 CMT-30 MW-40 CMT-45
MW-40 CMT-30: 1978.48 MW-40
CMT-45: 1978.48
MW-40 CMT-30:
30 MW-40
CMT-45: 45
MW-40 CMT-30:
0.6 MW-40
CMT-45: 0.6
MW-40 CMT-30: 25.19
MW-40 CMT-45: 25.12
0.004667
Up
MW-40 CMT-45 MW-40 CMT-55
MW-40 CMT-45: 1978.48 MW-40
CMT-55: 1978.48
MW-40 CMT-45:
45 MW-40
CMT-55: 55
MW-40 CMT-45:
0.6 MW-40
CMT-55: 0.6
MW-40 CMT-45: 25.12
MW-40 CMT-55: 25.17
0.005000
Down
MW-40 CMT-30 MW-40 CMT-55
MW-40 CMT-30: 1978.48 MW-40
CMT-55: 1978.48
MW-40 CMT-30:
30 MW-40
CMT-55: 55
MW-40 CMT-30:
0.6 MW-40
CMT-55: 0.6
MW-40 CMT-30: 25.19
MW-40 CMT-55: 25.17
0.000800
Up
Bold: Direction change from previous quarter measured
2.3 Groundwater Analytical Results
Cardno ATC collected groundwater samples on March 2nd
through 12th, 2015 from the existing groundwater
monitoring wells (MW-1 through MW-3, MW-5 through MW-39, MW-40 (all depths), MW-41, MW-42, MW-43
MW-14I, MW-19I, MW-6D1, MW-6D2, MW-6D3, MW-19D1, MW-19D2, MW-19D3, MW-20D1, MW-20D2, and
MW-20D3.) over the vicinity of the site (Figure 2 ).
Groundwater samples were submitted to Asset Laboratories of Las Vegas, Nevada, an NDEP-certified
laboratory, for the analysis of VOCs using EPA method 8260B for samples collected, the analysis of metals
(arsenic, chromium, and manganese) using EPA method 6020 for wells MW-19, MW-20, MW-19I, MW-40 CMT-
30, MW-40 CMT-45, and MW-40 CMT-60, and the analysis of hexavalent chromium using EPA method 218.6 for
wells MW-19, MW-20, MW-19I, MW-40 CMT-30, MW-40 CMT-45, and MW-40 CMT-60.
The laboratory analytical results compared with qualitative changes in groundwater elevation and concentrations
are summarized in Table 1. Laboratory analytical reports are provided in Appendix B.
Table 2-2 Groundwater Elevations, Current PCE/TCE Concentrations, and PCE Plume Stability Test

First Quarter 2015 Groundwater Monitoring and Sampling Report Maryland Square PCE Site
April 27, 2015 Cardno ATC 10
Well ID Depth to GW Level (feet)
Groundwater Elevation (feet amsl)
PCE (μg/L)
TCE (μg/L)
Mann-Kendall Trend (Since Well Installation)
MW-1 20.15 1971.86 210 <0.50 Decreasing
MW-2 19.17 1964.36 550 2.3 Decreasing
MW-3 20.02 1963.79 13 <0.50 Probably Increasing
(No Trend 4th
Quarter 2014)
MW-5 19.35 1969.34 790 3.7 Increasing
MW-6 19.96 1968.16 3,300 9.3 Increasing
MW-6D1 15.41 1973.31 3.0 <0.50 No Trend
MW-6D2 15.35 1975.37 3.2 <0.50 No Trend
MW-6D3 15.47 1974.25 32 0.50 Increasing
MW-7 18.20 1972.58 17 <0.50 Increasing
MW-8 20.55 1971.16 2.4 <0.50 Decreasing
MW-9 20.62 1971.63 9.7 <0.50 Decreasing
MW-10 21.60 1961.68 <0.50 <0.50 No Trend
MW-11 26.55 1953.32 <0.50 <0.50 N/A1
MW-12 16.69 1979.26 0.77 <0.50 No Trend
MW-13 18.40 1964.91 1,700 4.6 Decreasing
MW-14 18.85 1968.48 1,900 3.6 Decreasing
MW-14I 19.41 1968.13 11,000 32 Increasing
(No Trend 4th
Quarter 2014)
MW-15 16.70 1966.04 3.6 <0.50 Stable
MW-16 27.55 1952.98 <0.50 <0.50 N/A1
MW-17 19.80 1971.24 65 <0.50 Decreasing
MW-18 12.50 1950.40 1,200 2.5 Decreasing
MW-19 26.60 1953.53 930 4.0 Probably Decreasing
MW-19I 25.52 1952.85 0.62 <0.50 No Trend
MW-19D1 25.74 1953.51 210 1.3 Stable
(No Trend 4th
Quarter 2014)
MW-19D2 26.88 1952.40 44 <0.50 Increasing
MW-19D3 24.12 1955.20 41 <0.50 No Trend
(Probably Increasing 4th
Quarter 2014)
MW-20 26.34 1953.48 680 2.3 Decreasing
MW-20D1 25.56 1954.25 340 0.98 No Trend
MW-20D2 25.95 1952.71 230 1.9 No Trend
MW-20D3 20.10 1958.59 <0.50 <0.50 No Trend
MW-21 25.37 1953.88 11 <0.50 Decreasing
MW-22 26.95 1948.24 0.58 <0.50 N/A1
MW-23 16.50 1945.95 740 1.5 Decreasing
MW-24 14.32 1946.50 0.58 <0.50 Decreasing

First Quarter 2015 Groundwater Monitoring and Sampling Report Maryland Square PCE Site
April 27, 2015 Cardno ATC 11
Well ID Depth to GW Level (feet)
Groundwater Elevation (feet amsl)
PCE (μg/L)
TCE (μg/L)
Mann-Kendall Trend (Since Well Installation)
(Probably Decreasing 4th Quarter
2014)
MW-25 19.25 1940.04 640 0.71 Decreasing
MW-26 17.09 1936.36 680 <0.50 Decreasing
MW-27 13.33 1930.82 450 1.3 No Trend
MW-28 12.36 1930.71 0.69 <0.50 Decreasing
MW-29 13.85 1918.50 <0.50 <0.50 Decreasing
MW-30 15.90 1924.69 93 0.76 Stable
(Probably Decreasing 4th Quarter
2014)
MW-31 15.34 1922.32 73 <0.50 Probably Increasing
(No Trend 4th
Quarter 2014)
MW-32 18.32 1934.58 730 2.0 Decreasing
MW-33 17.06 1933.92 <0.50 <0.50 Decreasing
MW-34 19.09 1974.79 370 0.91 Decreasing
MW-35 19.82 1971.55 180 <0.50 Decreasing
MW-36 19.09 1936.21 150 <0.50 Stable
MW-37 19.25 1910.73 35 <0.50 No Trend
MW-38 14.75 1893.63 6.0 <0.50 No Trend
MW-39 24.67 1942.88 160 <0.50 Probably Decreasing
(Stable 4th Quarter 2014)
MW-40 CMT-30 25.19 1953.30 14 <0.50 No Trend
MW-40 CMT-35 25.36 1953.13 13 1.6 No Trend
MW-40 CMT-40 25.32 1953.17 100 1.5 Stable
(Decreasing 4th Quarter 2014)
MW-40 CMT-45 25.12 1953.37 120 3.2 Stable
MW-40 CMT-50 25.11 1954.38 160 6.8 Stable
MW-40 CMT-55 25.11 1954.38 430 6.7 Stable
MW-40 CMT-60 25.17 1953.32 190 8.9 Probably Decreasing
(Stable 4th
Quarter 2014)
MW-41 14.85 1894.04 3.5 <0.50 Increasing
MW-42 16.12 1894.19 0.62 <0.50 No Trend
MW-43 15.60 1942.73 <0.50 <0.50 Stable
Notes:
1Mann-Kendall Trend Test was not utilized on MW-11, MW-16, and MW-22 because they had
historically been reported under laboratory detection limits NM = Not sampled and dtw measurements not taken
Amsl: Above Mean Sea Level Bold: Trend change from previous quarter
The groundwater locations selected for quarterly monitoring represent the wells that cover the groundwater
conditions at the Maryland Square site. The range of groundwater elevations spanned from 1893.63 feet above
First Quarter 2015 Groundwater Monitoring and Sampling Report Maryland Square PCE Site
April 27, 2015 Cardno ATC 12
mean sea level (amsl) (MW-38) to 1975.37 feet amsl (MW-6D2). Groundwater elevations are summarized in
Tables 1, A-1, and A-2.
Groundwater elevations increased across groundwater monitoring wells located on the Maryland Square
property by 0.27 feet compared with similar wells with Fourth Quarter 2014 data. Groundwater elevations across
the Boulevard Mall property increased by an average of 0.58 feet. Groundwater elevations increased across
groundwater monitoring wells located on the surrounding streets and golf course area by 0.78 feet when
compared with similar wells with Fourth Quarter 2014 data. Application of a large volume of irrigation water at
the golf course, especially during summer months, may influence water elevation in shallow groundwater
measured in the monitoring wells. This influence is historically observed in MW-27, MW-28, MW-30, MW-31,
MW-32, and MW-33.
PCE was detected in the groundwater samples collected from the project monitoring wells except MW-10, MW-
11, MW-16, MW-20D3, MW-29, MW-33, and MW-43. PCE was detected at concentrations ranging from 0.58
μg/L (MW-22) to 11,000 μg/L (MW-14I). PCE concentrations identified by the laboratory in the groundwater
samples collected exceeded the maximum contaminant levels (MCL) for PCE in groundwater of 5 μg/L in 41 of
59 wells.
Based on NDEP comments, Cardno ATC conducted additional analysis of the groundwater samples collected
from MW-5, MW-6, MW-19, and MW-20. In the Third Quarter 2014 Groundwater Monitoring and Sampling
Report Response, NDEP noted that water levels suddenly had varied inconsistently with surrounding wells in
MW-5, MW-6, MW-19, and MW-20 within two studied time periods. MW-5, MW-6, MW-19, and MW-20
experienced an increase in water levels while the overall water levels in the mall parking lot increased during the
first quarter. Cardno ATC requested additional sampling of MW-5, MW-6, MW-19, and MW-20 for the full suite
of volatile organic compounds (VOCs) via EPA Method 8260B to evaluate for chlorinated disinfection by-
products. Chloroform ranging from 1.1 μg/L to 6.5 μg/L was found during First Quarter 2015 in the four
monitoring wells, however PCE concentrations increased to around their historical averages at each well.
Cardno ATC will continue to monitor the water levels in these wells, but requests discontinuation of the full suite
VOC analysis.
A potential reason for the inconsistent sampling results of First Quarter 2014 and Third Quarter 2014 may have
had to do with the pump depth placement from one quarter to another. Historically, in accordance with NDEP
approved sampling techniques, Cardno ATC has measured the depth to water and total depth of the well, and if
the well screen was not submerged we would place the pump depth halfway between the depth to water
measurement and total depth measurement. With changing groundwater depths, this would result in the pump
drawing water from a potential pathway of a higher or lower permeable zone which could result in higher or lower
concentrations over time. Due to the heterogeneous soil conditions present across the site, it is possible that the
pump depth could have been placed in a higher or lower permeability zone that led to varying PCE results. In
additional vertical gradients have changed to downward in some of the nested wells indicating that PCE may be
also migrating vertically and that concentrations could alter with depth of screen or length of the screen (greater
than 10 feet impacts the effectiveness of low flow sampling). In order to determine the permanent sampling
depth that the pump would be set at, Cardno ATC reviewed the previous three years of pump depths from the
field notes, and took the average depth of the pump placement while omitting the depths that produce
anomalous PCE concentrations. The permanent pump depth was placed on to the sampling sheets before
sampling occurred, so that the depth would remain consistent from quarter to quarter. The hose present in each
well was measured and marked to the proper depth, to ensure consistency for future sampling events. This
method produced PCE concentrations during First Quarter 2015 that were consistent with expected values for
PCE based on recent historical averages.
Additional sampling was recommended at well MW-19D following pilot testing activities utilizing potassium
permanganate. Pilot testing activities seemed to have unintended consequences in the movement of
contamination due to the injection that warranted further investigation. The following table shows the results of
testing following pilot testing activities that occurred in March 2013.

First Quarter 2015 Groundwater Monitoring and Sampling Report Maryland Square PCE Site
April 27, 2015 Cardno ATC 13
Table 2-3 Summary of MW-19D Groundwater Testing, 1st
Quarter 2013 to 4th
Quarter 2014
Well ID Date PCE (μg/L)
TCE (μg/L)
MW-19D1
03/08/13 300 2.9
06/13/13 690 4.2
09/09/13 990 4.2
11/08/13 620 3.5
01/27/14 490 2.4
02/19/14 210 1.1
03/12/14 3.7 <0.50
06/11/14 730 4.2
09/19/14 240 1.5
11/18/14 1,000 5.9
03/15/15 210 1.3
MW-19D2
03/08/13 170 1.5
06/13/13 <0.50 <0.50
09/09/13 <0.50 <0.50
11/08/13 <0.50 <0.50
01/27/14 <0.50 <0.50
02/19/14 <0.50 <0.50
03/12/14 0.53 <0.50
06/11/14 6.0 <0.50
09/19/14 10 <0.50
11/18/14 39 <0.50
03/15/15 44 <0.50
MW-19D3
03/08/13 0.50 <0.50
06/13/13 0.68 <0.50
09/09/13 710 4.8
11/08/13 160 0.75
01/27/14 32 <0.50
02/19/14 36 <0.50
03/12/14 17 <0.50
06/11/14 40 <0.50
09/19/14 710 4.7
11/28/14 190 3.2
03/15/15 41 <0.50
Shaded row represents results prior to pilot testing Grey text represents First Quarter 2014 sampling event, not deemed representative of site conditions.
After potassium permanganate pilot testing, by the Third Quarter 2013 sampling event, PCE concentrations had
increased significantly at MW-19D1 and MW-19D3 while decreasing significantly at MW-19D2. After monthly and
quarterly monitoring of MW-19D, it appeared that PCE concentrations had either stabilized or were decreasing
from the high points observed during the Third Quarter 2013 sampling at MW-19D2 and MW-19D3, but may still
have been increasing at MW-19D1. After the Third Quarter 2014 sampling however, a large increase in PCE
concentration occurred in MW-19D3 with a corresponding decrease in MW-19D1. The primary concern from the
Third Quarter 2014 sampling event was the substantial increase in PCE concentration noted at MW-19D3, which
was previously thought to have stabilized. When the initial spike happened in Third Quarter 2013, it was
assumed that the nearby injection of large volumes of potassium permanganate had displaced the existing PCE
contamination in the area and caused the PCE plume to travel deeper to areas it had not formerly thought to
exist. Cardno ATC notes that both spikes occurred during the third quarter of the year. Cardno ATC assessed
the vertical gradients between MW-19D1 and MW-19D3 for each quarter from First Quarter 2013 to Third
Quarter 2014. The vertical gradient between the two wells was “up” every quarter monitored, except for Third
Quarter 2013 and Third Quarter 2014 when the vertical gradient was “down”. The vertical gradient during the
Fourth Quarter 2014 was also “down” but at a decreased magnitude when compared with Third Quarter 2014,

First Quarter 2015 Groundwater Monitoring and Sampling Report Maryland Square PCE Site
April 27, 2015 Cardno ATC 14
and switched back to “up” during First Quarter 2015. Groundwater extraction planned to be performed in this
area next year should control vertical and horizontal gradients.
A duplicate sample was collected from MW-1. MW-1 PCE concentrations were measured at 210 μg/L and 210
μg/L, a relative percent difference (RPD) of 0.0%. The duplicate sample result did not show significant statistical
variation based on the levels of the concentrations.
Trichloroethene (TCE) was detected at concentrations ranging from 0.50 μg/L to 32 μg/L in the groundwater
samples collected from 25 of the 59 site monitoring wells. The detected concentrations were below the MCL for
TCE in groundwater of 5 μg/L, with the exception of MW-6 (9.3 μg/L), MW-14I (32 μg/L), MW-40 CMT-50 (6.8
μg/L), MW-40 CMT-55 (6.7 μg/L), and MW-40 CMT-60 (8.9 μg/L).
Cis-1,2-dichloroethene (DCE) was detected in monitoring wells at concentrations ranging from 0.61 μg/L to 20
μg/L in 7 of the 59 site monitoring wells. The detected concentrations were below the MCL for DCE in
groundwater of 70 μg/L.
Vinyl chloride (VC) was not detected at concentrations in excess of laboratory detection levels (0.50 μg/L). The
presence of small amounts of TCE and cis-1,2 DCE suggests that reductive dechlorination is not significant at
the site.
Metals and Hexavalent Chromium were also analyzed this quarter, to compare with concentrations obtained by
Tetra Tech after pilot tests were conducted using potassium permanganate (KMnO4) and PulseOx in early 2013.
The following table shows Tetra Tech data along with concentrations detected during Cardno ATC’s successive
sampling events.
Table 2-4 Summary of Metals Concentrations in Select Wells, 1st
Quarter 2013 to 1st
Quarter 2015
Well ID Date PCE (μg/L)
Arsenic (μg/L)
Manganese (μg/L)
Chromium (μg/L)
Hexavalent Chromium (μg/L)
MW-19 (KMnO4 Pilot Test, upgradient)
03/08/13 520 7.4 170 17 NA
03/12/13 390 2 120,000 25 NA
03/27/13 14 0.33 43,000 130 NA
04/04/13 110 2 7,100 79 NA
04/11/13 220 1.8 5,400 44 NA
05/02/13 810 2.7 460 9.7 NA
06/14/13 530 2.3 68 4.6 2.5
09/09/13 840 4.0 <0.50 1.8 1.9
11/07/13 440 3.3 <0.50 1.3 1.7
03/07/14 910 3.2 <0.50 1.7 2.0
06/09/14 NS NS NS NS NS
09/15/14 NS NS NS NS NS
11/17/14 NS NS NS NS NS
03/04/15 930 3.8 <0.50 1.4 1.7
MW-19I (KMnO4 Pilot Test, downgradient)
03/08/13 710 2.0 ND 1.6 NA
03/12/13 280 1.7 2,700 14 NA
03/26/13 9.4 0.93 27,000 44 NA
04/04/13 3.5 3 4,700 170 NA
04/11/13 1.7 0.19 9,400 52 NA
05/02/13 0.61 1.2 20,000 43 NA
06/12/13 <0.50 0.34 62,000 87 NA*
09/09/13 <0.50 0.24 26,000 12 NA*
11/08/13 <0.50 1.1 48,000 290 NA*
03/12/14 <0.50 <0.10 51,000 300 NA*
06/11/14 <0.50 0.97 260,000 370 NA*
09/18/14 <0.50 <0.10 14,000 260 NA*
11/18/14 <0.50 <2.5 94,000 260 NA*
03/04/15 0.62 1.0 54,000 160 NA*
MW-20 03/26/13 290 4.7 NA 4.3 NA

First Quarter 2015 Groundwater Monitoring and Sampling Report Maryland Square PCE Site
April 27, 2015 Cardno ATC 15
Well ID Date PCE (μg/L)
Arsenic (μg/L)
Manganese (μg/L)
Chromium (μg/L)
Hexavalent Chromium (μg/L)
(PulseOx Pilot Test, upgradient)
04/10/13 480 5.6 NA 9.7 NA
04/23/13 850 6.1 NA 8.8 NA
05/02/13 470 4 NA 2.7 NA
06/12/13 660 2.4 <0.50 1.6 1.1
09/09/13 570 3.2 <0.50 1.1 1.2
11/07/13 530 2.6 <0.50 <1.0 1.3
03/12/14 170 3.6 64 5.1 3.5
06/09/14 NS NS NS NS NS
09/15/14 NS NS NS NS NS
11/17/14 NS NS NS NS NS
03/11/15 680 1.3 <0.50 <1.0 1.5
MW-40 CMT-30 (PulseOx Pilot Test, downgradient)
03/25/13 4.7 4 NA ND NA
04/10/13 0.86 7.2 NA 65 NA
04/23/13 8.8 4.6 NA 180 NA
05/01/13 1.2 5.9 NA 210 NA
06/14/13 10 3.9 <0.50 140 140
09/04/13 2.1 2.3 43 55 120
11/06/13 1.3 3.6 77 110 110
03/06/14 4.5 3.6 83 15 17
06/10/14 3.2 3.6 25 5.0 5.5
09/18/14 4.6 4.3 70 1.6 1.1
11/19/14 35 3.7 22 1.5 1.4
03/05/15 14 3.6 28 <1.0 0.88
MW-40 CMT-35 (PulseOx Pilot Test, downgradient)
03/25/13 14 14 NA ND NA
04/10/13 6.9 6.9 NA ND NA
04/23/13 2.6 2.6 NA 5.7 NA
05/01/13 3.5 3.5 NA 25 NA
06/14/13 3.6 4 250 2.9 1.1
09/04/13 9.6 9.6 450 <1.0 0.23
11/06/13 12 7.8 430 <1.0 <0.20
03/06/14 2.6 4.6 370 <1.0 0.31
06/09/14 NS NS NS NS NS
09/15/14 NS NS NS NS NS
11/17/14 NS NS NS NS NS
03/05/15 13 3.3 370 <1.0 0.25
MW-40 CMT-40 (PulseOx Pilot Test, downgradient)
03/25/13 270 2.5 NA 3.2 NA
04/10/13 94 2.5 NA 6.6 NA
04/23/13 150 2.4 NA 20 NA
05/01/13 96 3.3 NA 38 NA
06/14/13 53 3.0 26 9.8 22
09/04/13 37 2.7 100 22 25
11/06/13 51 1.9 61 14 15
03/06/14 27 1.9 360 1.3 2.0
06/09/14 NS NS NS NS NS
09/15/14 NS NS NS NS NS
11/17/14 NS NS NS NS NS
03/05/15 100 1.9 33 <1.0 0.71
MW-40 CMT-45 (PulseOx Pilot Test, downgradient)
03/25/13 310 2.4 NA ND NA
04/10/13 120 2.0 NA 15 NA
04/23/13 100 1.8 NA 41 NA
05/01/13 78 2.7 NA 47 NA
06/17/13 47 1.6 <0.50 39 43
09/04/13 110 2.4 100 7.6 8.3
11/06/13 77 1.5 110 6.0 6.1

First Quarter 2015 Groundwater Monitoring and Sampling Report Maryland Square PCE Site
April 27, 2015 Cardno ATC 16
Well ID Date PCE (μg/L)
Arsenic (μg/L)
Manganese (μg/L)
Chromium (μg/L)
Hexavalent Chromium (μg/L)
03/06/14 24 1.8 160 4.0 5.1
06/10/14 250 1.6 250 <1.0 0.85
09/18/14 240 1.5 70 <1.0 <0.20
11/19/14 150 1.5 7.7 1.9 2.0
03/05/15 120 1.9 15 <1.0 0.53
MW-40 CMT-50 (PulseOx Pilot Test, downgradient)
03/25/13 280 4.1 NA ND NA
04/10/13 110 2.2 NA 14 NA
04/23/13 120 2 NA 38 NA
05/01/13 79 3.1 NA 41 NA
06/17/13 64 2.2 <0.50 8.2 8.9
09/11/13 24 4.3 43 <1.0 0.39
11/06/13 120 1.9 250 <1.0 0.35
03/06/14 72 2.0 120 <1.0 0.25
06/09/14 NS NS NS NS NS
09/15/14 NS NS NS NS NS
11/17/14 NS NS NS NS NS
03/05/15 160 2.5 15 <1.0 0.40
MW-40 CMT-55 (PulseOx Pilot Test, downgradient)
03/25/13 390 1.5 NA ND NA
04/10/13 570 1.6 NA 3.9 NA
04/23/13 510 1.5 NA 10 NA
05/01/13 430 2.7 NA 12 NA
06/17/13 200 1.6 <0.50 26 27
09/11/13 38 3.4 38 <1.0 0.49
11/06/13 110 2.4 69 20 11
03/06/14 130 1.2 380 4.7 5.1
06/09/14 NS NS NS NS NS
09/15/14 NS NS NS NS NS
11/17/14 NS NS NS NS NS
03/05/15 430 1.8 12 21 22
MW-40 CMT-60 (PulseOx Pilot Test, downgradient)
03/25/13 1,200 1.8 NA ND NA
04/10/13 1,200 1.7 NA ND NA
04/23/13 1,400 1.5 NA 1.1 NA
05/01/13 1,200 2.7 NA 2 NA
06/17/13 1,000 1.4 <0.50 5.7 6.6
09/11/13 20 2.5 18 <1.0 0.92
11/06/13 190 0.96 43 3.2 3.7
03/06/14 360 1.3 470 4.4 1.3
06/10/14 750 1.2 140 31 18
09/18/14 700 1.3 290 52 12
11/19/14 1,000 1.3 <0.50 110 120
03/05/15 190 1.3 23 61 56
Notes: NA=Not Analyzed NS= Not Sampled ND=Non Detect Shaded row represents baseline test
Grey text represents First Quarter 2014 sampling event, not deemed representative of site conditions.
*=Sample could not be analyzed for Cr(VI) because sample was saturated with potassium permanganate
The primary metal of concern was the effects of the oxidant on trivalent and hexavalent chromium
concentrations in groundwater. Cardno ATC performed groundwater testing after the completion of the pilot
testing and found elevated levels of chromium in the tested wells, except for MW-19 and MW-20, compared to
before pilot testing. Both MW-19 and MW-20 are located upgradient from the pilot testing. Cardno ATC also
performed analysis of hexavalent chromium (Cr(VI)), because the oxidizing effect of the two treatments has the

First Quarter 2015 Groundwater Monitoring and Sampling Report Maryland Square PCE Site
April 27, 2015 Cardno ATC 17
potential to change the non-toxic, non- mobile Cr(III) into the acutely toxic, mobile Cr(VI). Hexavalent chromium
levels ranged from 0.25 μg/L to 56 μg/L. Monitoring well MW-19I (160 μg/L) exceeded the MCL of 100 μg/L for
total chromium in groundwater. No MCL has been established for CR(VI), but NDEP has set a basic comparison
level (BCL) of 100 μg/L in groundwater, which none of the monitored wells exceeded. Literature suggests that
the increase of chromium levels may be a temporary condition.
The potassium permanganate pilot test led to an expected increase of manganese at MW-19 and MW-19I due to
the injection of the solution containing manganese into the groundwater. Manganese levels in MW-19 have
steadily decreased to below laboratory detection limits; however monitoring well MW-19I had reported levels of
manganese at 54,000 μg/L, which is equivalent to the manganese levels observed almost two years ago.
Manganese has persisted within MW-19I longer than initially anticipated. Cardno ATC also noted a
corresponding increase in the chromium concentration from MW-19I. This condition will continue to be monitored
in the future.
PCE concentrations also appear to have undergone some rebound in wells MW-40 CMT-45 and MW-40 CMT-
60, even though there is some residual manganese left from the pilot testing. Although manganese continues to
persist within and near MW-19I, this is the first quarter since Second Quarter 2013 that has had a PCE
concentration above laboratory reporting limits. This may represent the start of possible rebound in the well that
has been noted in many of the other wells that had been affected by the potassium permanganate pilot test.
Although the timeframe of the manganese within the wells lasted significantly longer than previously anticipated,
rebound should be expected, especially in the deeper wells that proved difficult to administer the potassium
permanganate injection effectively.
The NDEP stated in response to Cardno ATC’s “Fourth Quarter 2014 Groundwater Monitoring and Sampling
Report,” dated January 27, 2015 that mobilization of naturally occurring arsenic does not appear to be a
problem. The primary metal of concern is the levels of trivalent and hexavalent chromium, the levels of chromium
in the wells monitored, with the exception of MW-19I and MW-40 CMT-60, have been well below the applicable
MCLs and BCL for trivalent and hexavalent chromium for the past two years. For these reasons, Cardno ATC
requests that metals testing be discontinued going forward at the site, except for MW-19I and MW-40 CMT-60
which will continue to be monitored until it is shown that the chromium levels are below the applicable regulatory
limits.
2.4 Mann-Kendall Trend Test for Plume Stability
The Mann-Kendall Trend Test for Plume Stability was used to determine whether the plume is increasing,
probably increasing, decreasing, probably increasing, stable, or showing no trend at each particular well. At least
four quarters of sampling data is needed for the test to determine whether the plume is increasing or decreasing
at a well. A confidence factor greater than 95% was needed to state whether PCE concentrations at a given well
are increasing or decreasing. A confidence factor between 90% and 95% was needed to state PCE
concentrations at a given well are increasing or decreasing. Past sample data was gathered for each well.
Results of the Mann-Kendall Test indicated that the PCE plume was decreasing at twenty wells and increasing
at seven wells. The Mann-Kendall Test also showed that the plume was probably decreasing at three wells,
probably increasing at two wells, stable at nine wells, and showed no trend at fifteen wells (eighteen including
MW-11, MW-16, and MW-22 which weren’t analyzed due to historically low readings). Many wells have just
reached or are close to the minimum amount of sampling data necessary for the Mann-Kendall Trend Test to
give an output and therefore many currently show no trend.
Seven wells currently are increasing to the trend test at the site (MW-5, MW-6, MW-7, MW-14I, MW-41, MW-
6D3, and MW-19D2).
Concentrations at MW-7 fluctuate between 1 and 11 μg/L over the span of twelve years. The low concentrations
of PCE and small range of concentrations of MW-7 represent a low concern at the site, however the continued
PCE results from the well could show that some residual source material still remains at the Maryland Square
property.

First Quarter 2015 Groundwater Monitoring and Sampling Report Maryland Square PCE Site
April 27, 2015 Cardno ATC 18
Concentrations at MW-41 have fluctuated between 1.7 and 3.7 over the span of six quarters. The low
concentrations of PCE, small range of concentrations, and low quantity of sampling events represent a low
concern at the site for the time being. In regards to MW-41, as stated by NDEP in their response to Cardno
ATC’s “Fourth Quarter 2014 Groundwater Monitoring and Sampling Report,” dated January 27, 2015, it is
important to note that MW-41 is one of the three downgradient wells that represent the tail end of the plume.
Cardno understands the importance in assessing the possible downgradient movement of the plume, however
after looking at the No Trend results at MW-38 (which has eleven quarters of monitoring) and MW-42, that it is
likely with more monitoring data that the Mann-Kendall data may soon show a Stable or No Trend result.
Although concentrations are also low at MW-6D3, ranging from less than the laboratory detection limit to 32
μg/L, MW-6D3 is screened from 100 feet to 110 feet below ground surface and could demonstrate that PCE
contamination is deeper than originally thought or is migrating downward. The vertical gradient analysis between
MW-6D1 and MW-6D3 showed a downward movement between the two wells. However, only six sampling
events are used in the Mann-Kendall model currently so the model lacks precision at this time.
Results at MW-19D2 may have been affected by the pilot testing that occurred during First Quarter 2013. Only
one sampling event was taken before pilot testing was conducted nearby, followed by a decrease in PCE
concentration from 170 μg/L to below laboratory detection limits for three consecutive quarters. The four most
recent monitoring events have experienced increasing concentrations that may be indicative of some rebound at
the well however the most recent increase was minor. There has also been hypothesized movement of PCE due
to vertical gradients in the vicinity of MW-19D over multiple quarters. The condition will continue to be monitored.
Wells MW-5, MW-6 both have higher PCE concentrations (approximately 800 μg/L in MW-5 and approximately
3,000 μg/L in MW-6). MW-6 is located directly along the centerline of the plume and MW-5 is south of MW-6 by
approximately 90 feet. The two wells have exhibited the increasing trend over the span of fourteen years. Based
on their location, to the east of Maryland Parkway, it is possible that additional source source material remains
under the road and is continuing to contribute to the plume. Mann Kendall analysis during First Quarter 2015
also showed MW-14I has an increasing trend for the first time. Monitor well MW-14I has consistently had the
highest PCE concentration across the entire site, averaging around 10,000 μg/L. Well MW-14I is also located
near MW-5 and MW-6, approximately 100 feet north of MW-6, and on the east side of Maryland Parkway. The
future remediation plan for the site should address the possibility of source material being present under
Maryland Parkway and be prepared for the possible migration on to the Boulevard Mall Property.

First Quarter 2015 Groundwater Monitoring and Sampling Report Maryland Square PCE Site
April 27, 2015 Cardno ATC 19
3 Summary
Cardno ATC provides the following summary based on the results of the First Quarter 2015 groundwater
sampling event:
Tetrachloroethene (PCE) was detected at concentrations ranging from 0.58 μg/L to 11,000 μg/L. The
MCL for PCE in groundwater is 5 μg/L. PCE concentrations are summarized in the following table:
Table 3-1 Summary of PCE Concentrations in Monitoring Wells across the Site, 1st
Quarter 2015
Non Detect (<0.50 μg/L)
>0.50 μg/L to <5.0 μg/L
5.0 μg/L to 11,000 μg/L
MW-10 MW-6D1 MW-1 MW-23
MW-11 MW-6D2 MW-2 MW-25
MW-16 MW-8 MW-3 MW-26
MW-20D3 MW-12 MW-5 MW-27
MW-22 MW-15 MW-6 MW-30
MW-29 MW-19I MW-6D3 MW-31
MW-33 MW-24 MW-7 MW-32
MW-43 MW-28 MW-9 MW-34
MW-41 MW-13 MW-35
MW-42 MW-14 MW-36
MW-14I MW-37
MW-17 MW-38
MW-18 MW-39
MW-19 MW-40 CMT-30
MW-19D1 MW-40 CMT-35
MW-19D2 MW-40 CMT-40
MW-19D3 MW-40 CMT-45
MW-20 MW-40 CMT-50
MW-20D1 MW-40 CMT-55
MW-20D2 MW-40 CMT-60
MW-21
Trichloroethene (TCE) was detected at concentrations ranging from 0.50 μg/L to 32 μg/L. The MCL for
TCE in groundwater is 5 μg/L. TCE concentrations are summarized in the following table:
Table 3-2 Summary of TCE Concentrations in Monitoring Wells across the Site, 1st
Quarter 2015
Non Detect (<0.50 μg/L)
>0.5 μg/L to <5.0 μg/L
5.0 μg/L to 32 μg/L
MW-1 MW-20D3 MW-2 MW-6
MW-3 MW-21 MW-5 MW-14I
MW-6D1 MW-22 MW-6D3 MW-40 CMT-50
MW-6D2 MW-24 MW-13 MW-40 CMT-55
MW-7 MW-26 MW-14 MW-40 CMT-60
MW-8 MW-28 MW-18
MW-9 MW-29 MW-19
MW-10 MW-31 MW-19D1

First Quarter 2015 Groundwater Monitoring and Sampling Report Maryland Square PCE Site
April 27, 2015 Cardno ATC 20
Non Detect (<0.50 μg/L)
>0.5 μg/L to <5.0 μg/L
5.0 μg/L to 32 μg/L
MW-11 MW-33 MW-20
MW-12 MW-35 MW-23
MW-15 MW-36 MW-25
MW-16 MW-37 MW-27
MW-17 MW-38 MW-30
MW-19I MW-39 MW-32
MW-19D2 MW-40 CMT-30 MW-34
MW-19D3 MW-41 MW-40 CMT-35
MW-20D1 MW-42 MW-40 CMT-40
MW-20D2 MW-43 MW-40 CMT-45
Cis-1,2-dichloroethene (DCE) was detected in monitoring wells at concentrations ranging from 0.61 μg/L
to 20 μg/L in 7 of the 59 site monitoring wells. The detected concentrations were below the MCL for DCE
in groundwater of 70 μg/L.
Hexavalent Chromium (Cr(VI)) ranged from 0.25 μg/L to 56 μg/L in monitoring wells MW-19, MW-20,
MW-19I, and MW-40 CMT-30 through MW-40 CMT-60. No monitoring wells were above the NDEP basic
comparison level (BCL) of 100 μg/L in groundwater. The total chromium concentration measured in MW-
19I (160 μg/L) exceeded the MCL of 100 μg/L in groundwater. MW-19I was not able to be analyzed for
hexavalent chromium content due to the color of the groundwater sample.
3.2 Recommendations
Cardno ATC recommends continuing monitoring and sampling of the site monitoring wells in accordance with
the NDEP approved 2014 schedule for 2015, with the exception that metals testing be reduced to only MW-19I
and MW-40 CMT-60. The primary metal of concern is the levels of trivalent and hexavalent chromium, the levels
of chromium in the wells monitored, with the exception of MW-19I and MW-40 CMT-60, have been well below
the applicable MCLs and BCL for trivalent and hexavalent chromium for the past two years. For these reasons,
Cardno ATC requests that metals testing be discontinued going forward at the site, except for MW-19I and MW-
40 CMT-60 which will continue to be monitored until it is shown that the chromium levels are below the
applicable regulatory limits.
Cardno ATC incorporated a system of custody seals on the site monitoring wells using zip ties. The zip ties were
placed in a fashion so cap is secure but if the cap is removed, the zip tie system will come apart and show if any
tampering occurred between monitoring events, results of these custody seals will be updated in the next
quarterly report. The addition of custody seals was requested by NDEP due to uncharacteristically low PCE
concentrations during First Quarter 2014. However, testing since that time shows that the low concentrations
appear to have been related to variable pump depth placement, not due to outside interference.
A copy of this report has been forwarded to the NDEP case officer for review.
3.3 Limitations
This report has been prepared for the exclusive use of Herman Kishner Trust, as it pertains to Maryland Square
PCE Site located at 3661 South Maryland Parkway, in Las Vegas, Nevada. Our professional services have been
performed, our findings obtained, and our recommendations prepared in accordance with customary principles
and practices in the fields of environmental science and engineering. This warranty is in lieu of all other
warranties either expressed or implied. This company is not responsible for the independent conclusions,
opinions, or recommendations made by others based on the records review, site inspection, field exploration,
and laboratory test data presented in this report.

First Quarter 2015 Groundwater Monitoring and Sampling Report Maryland Square PCE Site
April 27, 2015 Cardno ATC 21
It should be noted that all surficial environmental assessments are inherently limited in the sense that
conclusions are drawn and recommendations developed from information obtained from limited research and
site evaluation. For these types of evaluations, it is often necessary to use information prepared by others and
Cardno ATC cannot be responsible for the accuracy of such information. In addition, the passage of time may
result in a change in the environmental characteristics at this site and surrounding properties. This report does
not warrant against future operations or conditions, nor does it warrant operations or conditions present of a type
or at a location not investigated. This report is not a regulatory compliance audit and is not intended to satisfy the
requirements of any state, federal, or local real estate transfer laws.
It must be noted that no investigation can absolutely rule out the existence of any hazardous materials at a given
site. This assessment has been based upon prior site history, observable conditions, and the subsurface soil
sampling described in this report. Existing hazardous materials and contaminants can escape detection using
these methods.

First Quarter 2015 Groundwater Monitoring and Sampling Report Maryland Square PCE Site
April 27, 2015 Cardno ATC 22
4 Environmental Certification Jurat
This First Quarter 2015 Groundwater Monitoring and Sampling Report for Maryland Square PCE Site located at
3661 South Maryland Parkway, Las Vegas, Nevada, has been prepared in accordance with Nevada
Administrative Code (NAC), Chapter 459, Section 9717.
I hereby certify that I am responsible for the services described in this document and for the preparation of this
document. The services described in this document have been provided in a manner consistent with the current
standards of the profession and, to the best of my knowledge, comply with all applicable Federal, State and local
statutes, regulations and ordinances.
If you have any questions or require additional information, please feel free to contact the undersigned at (702)
990-9300.
Sincerely,
Cardno ATC
Adam Katlein Andrew D. Stuart Project Manager Branch Manager Nevada Certified Environmental Manager No. EM-1905 (Expires 01/26/17)
cc: Dr. Mary Siders, Nevada Division of Environmental Protection-Carson City, Nevada
Maryland Square PCE Site
TABLES

Maryland Square PCE SiteCardno ATC
Page 1 of 47
Well ID Date of Well Installation
Date of Sampling
Top of Casing
Elevation (feet msl)
Depth to Groundwater Level (feet)
Groundwater Elevation (feet msl)
Screen Interval
(feet bgs)
Dissolved Oxygen (mg/L)
TDS (g/L)
ORP (mV)
PCE (μg/L)
TCE (μg/L)
cis-1,2-DCE
(μg/L)
MW-1 Aug 00 Mar 15 1992.01 20.15 1971.86 10-30 1.34 2.4 85.0 210 <0.50 <0.50
MW-7 Sep 02 Mar 15 1990.78 18.20 1972.58 10-30 2.28 2.4 206.1 17 <0.50 <0.50
MW-8 Sep 02 Mar 15 1991.71 20.55 1971.16 10-30 1.03 2.2 201.1 2.4 <0.50 <0.50
MW-9 Sep 02 Mar 15 1992.25 20.62 1971.63 48.5-50 2.37 1.0 90.8 9.7 <0.50 <0.50
MW-12 Sep 02 Mar 15 1995.95 16.69 1979.26 13.5-33.5 1.76 2.3 221.4 0.77 <0.50 <0.50
MW-17 Nov 03 Mar 15 1991.04 19.80 1971.24 15-30 1.01 2.3 88.6 65 <0.50 <0.50
MW-34 Dec 11 Mar 15 1993.88 19.09 1974.79 -- 1.56 2.4 90.7 370 0.91 <0.50
MW-35 Dec 11 Mar 15 1991.37 19.82 1971.55 -- 2.36 2.3 87.3 180 <0.50 <0.50
MW-2 Oct 00 Mar 15 1983.53 19.17 1964.36 10-32 1.75 2.2 197.0 550 2.3 0.6
MW-3 Oct 00 Mar 15 1983.81 20.02 1963.79 10-31 0.65 2.8 218.5 13 <0.50 <0.50
MW-5 Oct 00 Mar 15 1988.69 19.35 1969.34 10-32 2.83 2.2 204.8 790 3.7 1.2
MW-6 Oct 00 Mar 15 1988.12 19.96 1968.16 10-32 2.31 2.2 99.1 3,300 9.3 2.3
MW-6D1 Jan 13 Mar 15 1988.72 15.41 1973.31 50-60 3.44 0.4 102.2 3.0 <0.50 <0.50
MW-6D2 Jan 13 Mar 15 1989.72 15.35 1975.37 80-90 3.69 0.4 113.4 3.2 <0.50 <0.50
Table A-1: Current Groundwater Gauging and Analytical DataMaryland Square Shopping Center
Project Monitoring Wells Located on Maryland Square Property
Project Monitoring Wells Located on Boulevard Mall Property

Maryland Square PCE SiteCardno ATC
Page 2 of 47
Well ID Date of Well Installation
Date of Sampling
Top of Casing
Elevation (feet msl)
Depth to Groundwater Level (feet)
Groundwater Elevation (feet msl)
Screen Interval
(feet bgs)
Dissolved Oxygen (mg/L)
TDS (g/L)
ORP (mV)
PCE (μg/L)
TCE (μg/L)
cis-1,2-DCE
(μg/L)
Table A-1: Current Groundwater Gauging and Analytical DataMaryland Square Shopping Center
MW-6D3 Jan 13 Mar 15 1988.72 15.47 1974.25 100-110 3.86 0.3 106.9 32 0.50 <0.50
MW-10 Sep 02 Mar 15 1983.28 21.60 1961.68 10-30 0.44 2.3 -181.3 <0.50 <0.50 <0.50
MW-11 Sep 02 Mar 15 1979.87 26.55 1953.32 13.5-33.5 1.01 2.3 -95.5 <0.50 <0.50 <0.50
MW-13 May 03 Mar 15 1983.31 18.40 1964.91 9-29 1.12 2.3 216.8 1,700 4.6 <0.50
MW-14 Nov 03 Mar 15 1987.33 18.85 1968.48 15-40 2.06 2.4 104.9 1,900 3.6 <0.50
MW-14l Jul 12 Mar 15 1987.54 19.41 1968.13 40-55 2.65 0.8 106.0 11,000 32 20
MW-15 Nov 03 Mar 15 1982.74 16.70 1966.04 15-32 1.79 2.2 95.4 3.6 <0.50 <0.50
MW-16 Nov 03 Mar 15 1980.53 27.55 1952.98 19-32 0.27 2.1 1.5 <0.50 <0.50 <0.50
MW-19 Nov 03 Mar 15 1980.13 26.60 1953.53 19-35 3.40 2.2 NM 930 4.0 <0.50
MW-19D1 Jan 13 Mar 15 1979.25 25.74 1953.51 31-51 3.92 0.6 159.4 210 1.3 <0.50
MW-19D2 Jan 13 Mar 15 1979.28 26.88 1952.40 60-70 0.70 1.5 179.5 44 <0.50 <0.50
MW-19D3 Jan 13 Mar 15 1979.32 24.12 1955.20 92-102 3.87 0.4 201.4 41 <0.50 <0.50
MW-19I Jul 12 Mar 15 1978.37 25.52 1952.85 34-54 2.93 2.2 538.6 0.62 <0.50 <0.50
MW-20 Nov 03 Mar 15 1979.82 26.34 1953.48 19-35 2.09 2.4 209.7 680 2.30 <0.50
MW-20D1 Jan 13 Mar 15 1979.81 25.56 1954.25 25-45 2.00 1.6 190.8 340 0.98 <0.50
Project Monitoring Wells Located on Boulevard Mall Property

Maryland Square PCE SiteCardno ATC
Page 3 of 47
Well ID Date of Well Installation
Date of Sampling
Top of Casing
Elevation (feet msl)
Depth to Groundwater Level (feet)
Groundwater Elevation (feet msl)
Screen Interval
(feet bgs)
Dissolved Oxygen (mg/L)
TDS (g/L)
ORP (mV)
PCE (μg/L)
TCE (μg/L)
cis-1,2-DCE
(μg/L)
Table A-1: Current Groundwater Gauging and Analytical DataMaryland Square Shopping Center
MW-20D2 Jan 13 Mar 15 1978.66 25.95 1952.71 55-65 6.27 1.5 179.6 230 1.9 0.96
MW-20D3 Jan 13 Mar 15 1978.69 20.10 1958.59 90-100 3.24 0.3 207.7 <0.50 <0.50 <0.50
MW-21 Nov 03 Mar 15 1979.25 25.37 1953.88 19-36 0.41 2.3 46.1 11 <0.50 <0.50
MW-40 CMT-30 Jul 12 Mar 15 1978.49 25.19 1953.30 30-30.6 4.17 2.3 287.3 14 <0.50 <0.50
MW-40 CMT-35 Jul 12 Mar 15 1978.49 25.36 1953.13 35-35.6 4.97 1.8 306.7 13 1.6 <0.50
MW-40 CMT-40 Jul 12 Mar 15 1978.49 25.32 1953.17 40-40.7 3.54 1.9 339.9 100 1.5 <0.50
MW-40 CMT-45 Jul 12 Mar 15 1978.49 25.12 1953.37 45-45.6 4.21 0.5 361.0 120 3.2 <0.50
MW-40 CMT-50 Jul 12 Mar 15 1978.49 25.11 1954.38 50-50.6 3.21 0.3 314.5 160 6.80 <0.50
MW-40 CMT-55 Jul 12 Mar 15 1978.49 25.11 1953.38 55-55.6 2.84 0.4 378.6 430 6.7 1.0
MW-40 CMT-60 Jul 12 Mar 15 1978.49 25.17 1953.32 60-60.6 3.14 1.9 253.3 190 8.9 1.8
MW-18 Nov 03 Mar 15 1962.90 12.50 1950.40 5-26 2.32 2.3 243.1 1,200 2.5 <0.50
MW-22 Mar 05 Mar 15 1975.19 26.47 1948.72 15-36 0.87 2.4 93.3 <0.50 <0.50 <0.50
MW-23 Mar 05 Mar 15 1962.45 16.50 1945.95 5-26 2.04 2.2 58.2 740 1.5 <0.50
MW-24 Mar 05 Mar 15 1960.82 14.32 1946.50 5-26 1.31 2.1 79.1 0.58 <0.50 <0.50
MW-25 Mar 05 Mar 15 1959.29 19.25 1940.04 5-26 1.15 2.4 52.9 640 0.71 <0.50
Project Monitoring Wells Located on Boulevard Mall Property
Project Monitoring Wells Located on Surrounding Streets and Golf Course

Maryland Square PCE SiteCardno ATC
Page 4 of 47
Well ID Date of Well Installation
Date of Sampling
Top of Casing
Elevation (feet msl)
Depth to Groundwater Level (feet)
Groundwater Elevation (feet msl)
Screen Interval
(feet bgs)
Dissolved Oxygen (mg/L)
TDS (g/L)
ORP (mV)
PCE (μg/L)
TCE (μg/L)
cis-1,2-DCE
(μg/L)
Table A-1: Current Groundwater Gauging and Analytical DataMaryland Square Shopping Center
MW-26 Mar 06 Mar 15 1953.45 17.09 1936.36 10-36 1.80 2.4 66.5 680 <0.50 <0.50
MW-27 Mar 06 Mar 15 1944.15 13.33 1930.82 10-36 1.32 2.4 39.1 450 1.3 <0.50
MW-28 Oct 07 Mar 15 1943.07 12.36 1930.71 15-36 0.74 2.5 79.8 0.69 <0.50 <0.50
MW-29 Oct 07 Mar 15 1932.35 13.85 1918.50 15-36 2.68 2.6 85.0 <0.50 <0.50 <0.50
MW-30 Oct 07 Mar 15 1940.59 15.90 1924.69 20-41 2.39 1.9 49.6 93 0.76 <0.50
MW-31 Mar 08 Mar 15 1937.66 15.34 1922.32 13.5-33.6 2.71 2.6 56.9 73 <0.50 <0.50
MW-32 Mar 08 Mar 15 1952.90 18.32 1934.58 13.5-33.7 1.83 2.3 53.0 730 2.0 <0.50
MW-33 Mar 08 Mar 15 1950.98 17.06 1933.92 13.5-33.8 0.69 2.7 67.5 <0.50 <0.50 <0.50
MW-36 Jan 12 Mar 15 1955.30 19.09 1936.21 17-38 1.36 2.4 59.6 150 <0.50 <0.50
MW-37 Jan 12 Mar 15 1929.98 19.25 1910.73 17-38 3.03 2.5 63.7 35 <0.50 <0.50
MW-38 Apr 12 Mar 15 1908.38 14.75 1893.63 15-36 2.93 2.6 59.2 6.0 <0.50 <0.50
MW-39 Apr 12 Mar 15 1967.55 24.67 1942.88 15-36 1.25 2.4 59.8 160 <0.50 <0.50
MW-41 Aug 13 Mar 15 1908.89 14.85 1894.04 10-35 1.63 2.4 37.9 3.5 <0.50 <0.50
MW-42 Sep 13 Mar 15 1910.31 16.12 1894.19 10-35 2.30 2.7 22.6 0.62 <0.50 <0.50
MW-43 Sep 13 Mar 15 1958.33 15.60 1942.73 10-35 1.41 2.1 85.0 <0.50 <0.50 <0.50
Notes: NM = Not Measured °C = degrees Celsiusmsl = mean sea level g/L = gallons per literND = Non Detect mg/L = milligrams per literNS = Not Sampled mS/cm = milli Siemens per centimeter
mV = milllivoltsNTU = Nephelometric Turbudity Units
Bold value indicates concentration that exceeds regulatory standard.
μg/L = micrograms per liter
Project Monitoring Wells Located on Surrounding Streets and Golf Course

Maryland Square PCE SiteCardno ATC
Page 5 of 47
Well ID Date
Top of Casing
Elevation (feet msl)
Depth to Groundwater Level (feet)
Groundwater Elevation (feet msl)
pH Specific
Conductance (mS/cm)
Turbidity
(NTU)
Dissolved Oxygen (mg/L)
Temp (ºC) TDS (g/L)
ORP (mV)
PCE (μg/L)
TCE (μg/L)
cis-1,2-DCE
(μg/L)
Vinyl Chloride
(μg/L)
MW-1 Aug 00 NM NM NM NM NM NM NM NM NM NM 2,300 ND ND ND Oct 00 1991.81 17.54 1974.27 NM NM NM NM NM NM NM NS NS NS NS Sep 02 1992.04 17.90 1974.14 NM NM NM NM NM NM NM 2,000 ND ND ND May 03 1992.04 18.70 1973.34 NM NM NM NM NM NM NM 870 ND ND ND Sep 03 1992.04 18.97 1973.07 NM NM NM NM NM NM NM 2,300 ND ND ND Jan 04 1992.04 19.30 1972.74 7.0 3.5 NM 0.9 22.50 NM NM 1,700 ND ND ND May 05 1992.04 15.24 1976.8 7.0 4.0 441.0 5.4 26.00 NM 110 3,500 ND ND ND Sep 05 1992.04 16.74 1975.3 7.1 4.2 64.0 7.0 27.50 2.7 129 1,700 ND ND ND Dec 05 1992.04 17.61 1974.43 7.0 5.1 290.0 2.0 26.90 3.2 404 820 ND ND ND Mar 06 1992.04 18.42 1973.62 NM 5.6 >999 NM 23.10 3.7 545 420 ND ND ND Jun 06 1992.04 NM NM NM NM NM NM NM NM NM NS NS NS NS Oct 06 1992.04 18.30 1973.74 6.3 3.7 81.0 4.6 26.70 2.4 129 1,100 ND ND ND Dec 06 1992.04 18.88 1973.16 6.7 4.4 >999 5.1 26.90 2.8 111 1,300 ND ND ND Mar 07 1992.04 20.08 1971.96 NM NM NM NM NM NM NM NS NS NS NS Jun 07 1992.04 19.81 1972.23 7.0 2.3 611.0 6.2 25.70 1.4 468 450 ND ND ND Sep 07 1992.04 18.39 1973.65 NM NM NM NM NM NM NM NS NS NS NS Dec 07 1992.04 19.01 1973.03 6.4 3.9 15.0 5.5 22.20 2.5 223 710 ND ND ND Mar 08 1992.04 20.03 1972.01 NM NM NM NM NM NM NM NS NS NS NS Jun 08 1992.04 NM NM NM NM NM NM NM NM NM 260 ND ND ND Oct 08 1992.01 19.82 1972.19 6.6 3.7 62.4 1.1 27.10 2.4 130 460 ND ND ND Feb 09 1992.01 19.65 1972.36 NM NM NM NM NM NM NM NS NS NS NS Jun 09 1992.01 19.88 1972.13 7.1 3.7 39.6 1.6 26.20 2.4 101 NS NS NS NS Jul 09 NM NM NM NM NM NM NM NM NM NM 590 ND ND ND Sep 09 1992.01 19.90 1970.11 NM NM NM NM NM NM NM NS NS NS NS Nov 09 1992.01 20.33 1971.68 6.3 3.4 -10.0 1.5 26.90 2.2 126 390 ND ND ND Feb 10 1992.01 20.04 1971.97 NM NM NM NM NM NM NM NS NS NS NS Jun 10 1992.01 19.98 1972.03 7.0 3.3 0.0 3.2 26.13 NM NM 400 ND ND ND Oct 10 1992.01 19.44 1972.57 NM NM NM NM NM NM NM NS NS NS NS Nov 10 1992.01 19.54 1972.47 6.7 3.5 1.2 1.4 27.56 NM 212 430 ND ND ND Mar 11 1992.01 20.10 1971.91 NM NM NM NM NM NM NM NS NS NS NS Jun 11 1992.01 20.18 1971.83 7.2 3.6 0.0 1.7 25.58 NM 259 460 ND ND NDSep 11 1992.01 19.85 1972.16 NM NM NM NM NM NM NM NS NS NS NS Nov 11 1992.01 19.65 1972.36 7.0 3.4 NM 1.3 25.97 2.2 266 410 ND ND NDMar 12 1992.01 20.41 1971.60 7.2 3.5 5.4 1.3 25.48 2.3 -70 370 NS NS NS
* Jun 12 1992.01 19.18 1972.83 7.3 3.5 15.9 3.0 25.97 2.3 90 410 ND ND NDSep 12 1992.01 19.97 1972.04 7.6 3.6 NM 1.2 27.28 2.3 98 390 ND ND NDNov 12 1992.01 NM NM NM NM NM NM NM NM NM NS NS NS NSMar 13 1992.01 20.35 1971.66 6.97 3.9 NM 0.90 24.80 2.5 59 260 <0.50 <0.50 <0.50Jun 13 1992.01 20.69 1971.32 7.16 3.9 NM 1.72 25.43 2.5 78 240 <0.50 <0.50 <0.50Sep 13 1992.01 20.52 1971.49 7.06 3.8 NM 0.76 26.95 2.4 -14 240 <0.50 <0.50 <0.50Nov 13 1992.01 20.31 1971.70 5.97 3.5 2.9 0.31 25.51 2.2 166 270 <0.50 <0.50 <0.50Mar 14 1992.01 20.10 1971.91 7.23 3.3 28.7 1.71 24.14 2.2 1 350 <0.50 <0.50 <0.50Jun 14 1992.01 20.29 1971.72 6.94 3.3 28.7 2.61 28.57 2.4 133 350 <0.50 <0.50 <0.50Sep 14 1992.01 20.15 1971.86 7.68 3.6 10.6 6.41 29.16 2.3 66 96 <0.50 <0.50 <0.50Nov 14 1992.01 20.42 1971.59 7.05 3.8 9.3 2.12 25.08 2.4 -39 240 <0.50 <0.50 <0.50Mar 15 1992.01 20.15 1971.86 6.43 3.7 4.8 1.34 25.49 2.4 85 210 <0.50 <0.50 <0.50
Table A-2: Historical Groundwater Gauging and Analytical DataMaryland Square Shopping Center

Maryland Square PCE SiteCardno ATC
Page 6 of 47
Well ID Date
Top of Casing
Elevation (feet msl)
Depth to Groundwater Level (feet)
Groundwater Elevation (feet msl)
pH Specific
Conductance (mS/cm)
Turbidity
(NTU)
Dissolved Oxygen (mg/L)
Temp (ºC) TDS (g/L)
ORP (mV)
PCE (μg/L)
TCE (μg/L)
cis-1,2-DCE
(μg/L)
Vinyl Chloride
(μg/L)
Table A-2: Historical Groundwater Gauging and Analytical DataMaryland Square Shopping Center
MW-2 Oct 00 1983.79 15.52 1968.27 NM NM NM NM NM NM NM 3,000 18.0 18.0 ND Sep 02 1983.99 16.62 1967.37 NM NM NM NM NM NM NM 3,000 13.0 13.0 ND May 03 1983.99 17.15 1966.84 NM NM NM NM NM NM NM 1,400 ND ND ND Sep 03 1983.97 17.70 1966.27 NM NM NM NM NM NM NM 1,700 ND ND ND Jan 04 1983.97 18.25 1965.72 7.1 3.1 NM 1.1 23.20 NM NM 1,700 ND ND ND May 05 1983.97 14.65 1969.32 6.9 3.5 698.0 4.8 23.40 NM 193 2,050 17.0 9.7 ND Dec 05 1983.97 16.00 1967.97 6.6 4.8 360.0 2.7 25.40 3.1 264 2,900 ND ND ND Mar 06 1983.97 NM NM NM NM NM NM NM NM NM NS NS NS NS Jun 06 1983.97 17.55 1966.42 NM 3.7 728.0 7.0 24.90 2.4 116 1,600 ND ND ND Oct 06 1983.97 17.25 1966.72 6.1 3.5 20.0 5.1 24.40 2.2 161 1,900 ND ND ND Dec 06 1983.97 17.60 1966.37 6.8 4.2 28.0 4.9 24.50 2.7 241 1,300 ND ND ND Mar 07 1983.97 18.84 1965.13 NM NM NM NM NM NM NM NS NS NS NS Jun 07 1983.97 19.01 1964.96 7.0 3.5 539.0 5.7 24.40 2.3 305 1,400 ND ND ND Sep 07 1983.97 17.94 1966.03 NM NM NM NM NM NM NM NS NS NS NS Dec 07 1983.97 18.04 1965.93 6.3 3.6 144.0 6.9 21.80 2.3 314 1,000 ND ND ND Mar 08 1983.97 18.82 1965.15 NM NM NM NM NM NM NM NS NS NS NS Jun 08 1983.97 NM NM NM NM NM NM NM NM NM 900 ND ND ND Oct 08 1983.97 18.54 1965.43 6.9 3.5 44.7 3.4 24.80 2.3 103 960 3.4 1.2 ND Feb 09 1983.97 18.68 1965.29 NM NM NM NM NM NM NM NS NS NS NS Jun 09 1983.97 18.95 1965.02 7.0 3.7 15.4 1.9 24.50 2.4 116 880 3.2 1.1 ND Sep 09 1983.97 18.95 1965.02 NM NM NM NM NM NM NM NS NS NS NS Nov 09 1983.97 19.32 1964.65 5.6 3.3 280.0 1.9 24.40 2.1 155 530 2.4 ND ND Feb 10 1983.97 19.68 1964.29 NM NM NM NM NM NM NM NS NS NS NS Jun 10 1983.97 19.08 1964.89 7.0 3.1 14.8 3.5 24.19 NM NM 570 2.1 0.8 ND Oct 10 1983.97 18.76 1965.21 NM NM NM NM NM NM NM NS NS NS NSNov 10 1983.97 18.78 1965.19 6.9 3.4 32.8 3.0 24.11 NM 92 560 2.4 0.7 NDMar 11 1983.97 19.19 1964.78 NM NM NM NM NM NM NM NS NS NS NS Jun 11 1983.97 19.50 1964.47 7.2 3.4 25.9 2.6 24.47 NM 273 680 2.2 0.6 NDSep 11 1983.97 19.11 1964.86 NM NM NM NM NM NM NM NS NS NS NS Nov 11 1983.97 19.08 1964.89 7.0 3.3 NM 2.7 23.55 2.1 168 610 2.1 0.66 NSMar 12 1983.97 NM NM NM NM NM NM NM NM NM NS NS NS NS
* Jun 12 1983.53 19.11 1964.42 7.2 3.3 57.1 2.6 23.57 2.2 87 490 2 0.6 NDSep 12 1983.53 NM NM NM NM NM NM NM NM NM NS NS NS NSNov 12 1983.53 NM NM NM NM NM NM NM NM NM NS NS NS NSMar 13 1983.53 19.29 1964.24 7.1 3.5 NM 2.7 23.24 2.3 205 580 2.5 1.0 <0.50Jun 13 1983.53 NM NM NM NM NM NM NM NM NM NS NS NS NSSep 13 1983.53 NM NM NM NM NM NM NM NM NM NS NS NS NSNov 13 1983.53 19.27 1964.26 7.3 3.7 36.9 2.0 24.28 2.4 83 720 2.3 0.9 <0.50Mar 14 1983.53 19.15 1964.38 7.3 3.1 39.2 1.6 23.05 2.0 -65 340 1.8 <0.50 <0.50Jun 14 1983.53 NM NM NM NM NM NM NM NM NM NS NS NS NSSep 14 1983.53 NM NM NM NM NM NM NM NM NM NS NS NS NSNov 14 1983.53 NM NM NM NM NM NM NM NM NM NS NS NS NSMar 15 1983.53 19.17 1964.36 6.44 3.38 19.21 1.75 23.35 2.20 197.00 550 2.3 0.61 <0.50

Maryland Square PCE SiteCardno ATC
Page 7 of 47
Well ID Date
Top of Casing
Elevation (feet msl)
Depth to Groundwater Level (feet)
Groundwater Elevation (feet msl)
pH Specific
Conductance (mS/cm)
Turbidity
(NTU)
Dissolved Oxygen (mg/L)
Temp (ºC) TDS (g/L)
ORP (mV)
PCE (μg/L)
TCE (μg/L)
cis-1,2-DCE
(μg/L)
Vinyl Chloride
(μg/L)
Table A-2: Historical Groundwater Gauging and Analytical DataMaryland Square Shopping Center
MW-3 Oct 00 1984.19 15.95 1968.24 NM NM NM NM NM NM NM 98 ND ND ND Sep 02 1984.46 17.20 1967.26 NM NM NM NM NM NM NM ND ND ND ND May 03 1984.46 17.70 1966.76 NM NM NM NM NM NM NM 6.9 ND ND ND Sep 03 1984.46 18.35 1966.08 NM NM NM NM NM NM NM 12 ND ND ND Jan 04 1984.46 19.25 1965.18 6.9 2.9 NM 1.0 22.40 NM NM 6.7 ND ND ND May 05 1984.46 15.22 1969.21 7.0 2.9 NM 2.5 26.00 NM 149 ND ND ND ND Dec 05 1984.46 16.45 1967.98 6.6 4.7 100.0 0.9 27.30 3.0 33 ND ND ND ND Mar 06 1984.46 NM NM NM NM NM NM NM NM NM NS NS NS NS Jun 06 1984.46 18.38 1966.05 NM 3.8 285.0 5.6 26.40 2.4 -32 ND ND ND ND Oct 06 1984.46 17.88 1966.55 5.9 3.9 26.0 2.0 26.70 2.5 279 ND ND ND ND Dec 06 1984.46 18.26 1966.17 6.7 4.8 272.0 2.9 26.70 3.1 9 1.2 ND ND ND Mar 07 1984.46 19.86 1964.57 NM NM NM NM NM NM NM NS NS NS NS Jun 07 1984.46 20.23 1964.2 7.1 3.7 605.0 3.6 25.90 2.4 43 ND ND ND ND Sep 07 1984.46 18.99 1965.44 NM NM NM NM NM NM NM NS NS NS NS Dec 07 1984.46 18.99 1965.44 6.1 3.9 55.1 2.2 21.90 2.5 135 1.4 ND ND ND Mar 08 1984.46 19.94 1964.49 NM NM NM NM NM NM NM NS NS NS NS Jun 08 1984.46 NM NM NM NM NM NM NM NM NM NS NS NS NS Oct 08 1984.41 19.46 1964.95 6.7 3.8 44.2 0.4 27.50 2.4 99 6.5 ND ND ND Feb 09 1984.41 19.80 1964.61 NM NM NM NM NM NM NM NS NS NS NS Jun 09 1984.41 20.20 1964.21 NM NM NM NM NM NM NM NS NS NS NS Sep 09 1984.41 20.16 1964.25 NM NM NM NM NM NM NM NS NS NS NS Nov 09 1984.41 20.48 1963.93 6.0 3.8 180.0 1.3 26.60 2.4 143 5.1 ND ND ND Feb 10 1984.41 21.07 1963.34 NM NM NM NM NM NM NM NS NS NS NS Jun 10 1984.41 13.91 1970.50 6.8 3.5 2.2 2.0 27.36 NM NM NS NS NS NS Oct 10 1984.41 19.95 1964.46 NM NM NM NM NM NM NM NS NS NS NSNov 10 1984.41 19.91 1964.50 6.7 3.9 12.5 0.6 27.29 NM 106 5.8 ND ND NDMar 11 1984.41 20.47 1963.94 NM NM NM NM NM NM NM NS NS NS NS Jun 11 1984.41 20.86 1963.55 NM NM NM NM NM NM NM NS NS NS NSSep 11 1984.41 20.45 1963.96 NM NM NM NM NM NM NM NS NS NS NS Nov 11 1984.41 20.35 1964.06 6.7 4.5 NM 3.3 26.17 NM -38 16 ND ND NSMar 12 1984.41 NM NM NM NM NM NM NM NM NM NS NS NS NS
* Jun 12 1983.81 20.43 1963.38 7.0 4.0 102.0 2.6 25.50 2.6 122 25 ND ND NDSep 12 1983.81 NM NM NM NM NM NM NM NM NM NS NS NS NSNov 12 1983.81 NM NM NM NM NM NM NM NM NM NS NS NS NSMar 13 1983.81 20.37 1963.44 6.9 4.5 NM 1.7 25.15 2.9 153 12 <0.50 <0.50 <0.50Jun 13 1983.81 NM NM NM NM NM NM NM NM NM NS NS NS NSSep 13 1983.81 NM NM NM NM NM NM NM NM NM NS NS NS NSNov 13 1983.81 NM NM NM NM NM NM NM NM NM NS NS NS NSMar 14 1983.81 20.25 1963.56 7.2 4.3 107.0 2.0 24.79 2.8 149 11 <0.50 <0.50 <0.50Jun 14 1983.81 NM NM NM NM NM NM NM NM NM NS NS NS NSSep 14 1983.81 NM NM NM NM NM NM NM NM NM NS NS NS NSNov 14 1983.81 NM NM NM NM NM NM NM NM NM NS NS NS NSMar 15 1983.81 20.02 1963.79 6.18 4.28 11.14 0.65 25.52 2.78 218.50 13 <0.50 <0.50 <0.50

Maryland Square PCE SiteCardno ATC
Page 8 of 47
Well ID Date
Top of Casing
Elevation (feet msl)
Depth to Groundwater Level (feet)
Groundwater Elevation (feet msl)
pH Specific
Conductance (mS/cm)
Turbidity
(NTU)
Dissolved Oxygen (mg/L)
Temp (ºC) TDS (g/L)
ORP (mV)
PCE (μg/L)
TCE (μg/L)
cis-1,2-DCE
(μg/L)
Vinyl Chloride
(μg/L)
Table A-2: Historical Groundwater Gauging and Analytical DataMaryland Square Shopping Center
MW-4 Oct 00 1989.68 16.95 1972.73 NM NM NM NM NM NM NM 14 ND ND ND Sep 02 1989.87 NM NM NM NM NM NM NM NM NM 25 ND ND ND May 03 1989.87 18.71 1971.16 NM NM NM NM NM NM NM 24 ND ND ND Sep 03 1989.85 19.05 1970.8 NM NM NM NM NM NM NM 100 ND ND ND Jan 04 1989.85 19.86 1969.99 7.0 2.7 NM 1.2 22.00 NM NM 220 ND ND ND May 05 1989.85 15.83 1974.02 6.8 3.7 664.0 3.7 24.20 NM 160 25 ND ND ND Dec 05 1989.85 17.62 1972.23 6.7 4.9 670.0 3.2 25.90 3.1 219 15 ND ND ND Mar 06 1989.85 NM NM NM NM NM NM NM NM NM NS NS NS NS Jun 06 1989.85 18.36 1971.49 NM NM NM NM NM NM NM 27 ND ND ND Oct 06 1989.85 18.34 1971.51 NM NM NM NM NM NM NM NS NS NS NS Dec 06 1989.85 NM NM NM NM NM NM NM NM NM NS NS NS NS Mar 07 1989.85 NM NM NM NM NM NM NM NM NM NS NS NS NS Jun 07 1989.85 NM NM NM NM NM NM NM NM NM NS NS NS NS Sep 07 1989.85 18.96 1970.89 NM NM NM NM NM NM NM NS NS NS NS Dec 07 1989.85 NM NM NM NM NM NM NM NM NM NS NS NS NS Mar 08 1989.85 NM NM NM NM NM NM NM NM NM NS NS NS NS Jun 08 1989.85 NM NM NM NM NM NM NM NM NM NS NS NS NS Oct 08 1989.86 NM NM NM NM NM NM NM NM NM NS NS NS NS Feb 09 1989.86 NM NM NM NM NM NM NM NM NM NS NS NS NS Jun 09 1989.86 Dry Dry NM NM NM NM NM NM NM NS NS NS NS Sep 09 1989.86 Dry Dry NM NM NM NM NM NM NM NS NS NS NS Nov 09 1989.86 Dry Dry NM NM NM NM NM NM NM NS NS NS NS Feb 10 1989.86 Dry Dry NM NM NM NM NM NM NM NS NS NS NS Jun 10 1989.86 NM NM NM NM NM NM NM NM NM NS NS NS NS Oct 10 1989.86 NM NM NM NM NM NM NM NM NM NS NS NS NS Nov 10 1989.86 NM NM NM NM NM NM NM NM NM NS NS NS NSMar 11 1989.86 NM NM NM NM NM NM NM NM NM NS NS NS NS Jun 11 1989.86 NM NM NM NM NM NM NM NM NM NS NS NS NSSep 11 1989.86 NM NM NM NM NM NM NM NM NM NS NS NS NS Nov 11 1989.86 NM NM NM NM NM NM NM NM NM NS NS NS NS Mar 12 1989.86 NM NM NM NM NM NM NM NM NM NS NS NS NS Jun 14 1989.86 NM NM NM NM NM NM NM NM NM NS NS NS NS
Abandoned June 4, 2012

Maryland Square PCE SiteCardno ATC
Page 9 of 47
Well ID Date
Top of Casing
Elevation (feet msl)
Depth to Groundwater Level (feet)
Groundwater Elevation (feet msl)
pH Specific
Conductance (mS/cm)
Turbidity
(NTU)
Dissolved Oxygen (mg/L)
Temp (ºC) TDS (g/L)
ORP (mV)
PCE (μg/L)
TCE (μg/L)
cis-1,2-DCE
(μg/L)
Vinyl Chloride
(μg/L)
Table A-2: Historical Groundwater Gauging and Analytical DataMaryland Square Shopping Center
MW-5 Oct 00 1988.93 16.20 1972.73 NM NM NM NM NM NM NM 100 ND ND ND Sep 02 1989.18 17.00 1972.18 NM NM NM NM NM NM NM 110 ND ND ND May 03 1989.18 17.80 1971.38 NM NM NM NM NM NM NM 240 ND ND ND Sep 03 1989.18 18.07 1971.11 NM NM NM NM NM NM NM 220 ND ND ND Jan 04 1989.18 18.65 1970.53 6.7 2.6 NM 1.2 22.30 NM NM 370 ND ND ND May 05 1989.18 14.87 1974.31 7.1 2.6 NM 4.6 25.40 NM 184 146 ND ND ND Dec 05 1989.18 16.80 1972.38 6.8 5.3 >999 1.5 26.80 3.3 377 93 ND ND ND Mar 06 1989.18 NM NM NM NM NM NM NM NM NM NS NS NS NS Jun 06 1989.18 17.40 1971.78 NM 3.8 >999 6.9 26.60 2.4 126 220 ND ND ND Oct 06 1989.18 17.46 1971.72 6.2 3.5 21.0 4.8 26.70 2.2 99 67 ND ND ND Dec 06 1989.18 18.01 1971.17 6.8 4.5 134.0 5.4 26.50 2.9 93 130 ND ND ND Mar 07 1989.18 19.30 1969.88 NM NM NM NM NM NM NM NS NS NS NS Jun 07 1989.18 19.12 1970.06 7.0 3.4 375.0 6.5 25.20 2.2 460 550 ND ND ND Sep 07 1989.18 17.85 1971.33 NM NM NM NM NM NM NM NS NS NS NS Dec 07 1989.18 18.33 1970.85 6.3 3.8 28.3 5.7 24.40 2.4 159 170 ND ND ND Mar 08 1989.18 19.31 1969.87 NM NM NM NM NM NM NM NS NS NS NS Jun 08 1989.18 NM NM NM NM NM NM NM NM NM 400 ND ND ND Oct 08 1989.15 18.99 1970.16 6.8 3.5 21.4 4.8 27.40 2.3 119 340 2.7 1.2 ND Feb 09 1989.15 18.99 1970.16 NM NM NM NM NM NM NM NS NS NS NS Jun 09 1989.15 19.17 1969.98 7.0 3.6 0.0 5.6 26.20 2.3 125 700 4.6 1.3 ND Sep 09 1989.15 19.14 1970.01 NM NM NM NM NM NM NM NS NS NS NS Nov 09 1989.15 19.55 1969.6 5.8 3.2 -6.0 3.8 27.10 2.1 132 520 3.9 1.4 ND Feb 10 1989.15 19.57 1969.58 NM NM NM NM NM NM NM NS NS NS NS Jun 10 1989.15 19.21 1969.94 7.1 3.1 7.0 6.7 25.60 NM 273 550 2.9 1.3 ND Oct 10 1989.15 18.67 1970.48 NM NM NM NM NM NM NM NS NS NS NS Nov 10 1989.15 18.85 1970.30 7.0 5.4 2.0 4.7 25.64 NM 104 360 2.4 1.0 NDMar 11 1989.15 19.41 1969.74 NM NM NM NM NM NM NM NS NS NS NS Jun 11 1989.15 19.50 1969.65 6.9 3.5 14.0 4.9 26.58 NM 412 670 2.7 1.1 NDSep 11 1989.15 19.19 1969.96 NM NM NM NM NM NM NM NS NS NS NS Nov 11 1989.15 19.22 1969.93 6.9 4.0 NM 3.8 25.54 NM -30 540 2.5 1.1 NDMar 12 1989.15 19.74 1969.41 7.2 3.3 123.0 5.6 23.51 2.4 -38 800 NS NS NS
* Jun 12 1988.69 19.25 1969.44 7.3 3.3 50.1 6.0 25.30 2.1 106 520 2.5 1.2 NDSep 12 1988.69 18.25 1970.44 7.3 3.3 NM 5.3 26.25 2.2 129 340 2.2 0.95 NDNov 12 1988.69 NM NM NM NM NM NM NM NM NM NS NS NS NSMar 13 1988.69 19.69 1969.00 7.1 3.6 NM 4.4 25.23 2.3 134 530 2.3 0.67 <0.50Jun 13 1988.69 20.00 1968.69 7.2 3.5 NM 4.7 27.60 2.3 126 600 2.9 0.95 <0.50Sep 13 1988.69 19.60 1969.09 7.0 3.4 NM 4.3 26.63 2.2 167 830 3.7 1.3 <0.50Nov 13 1988.69 19.52 1969.17 7.8 3.6 9.7 4.1 25.37 2.3 90 690 2.8 1.2 <0.50Mar 14 1988.69 19.37 1969.32 7.3 3.1 18.3 5.1 24.90 2.0 -85 440 2.2 <0.50 <0.50Jun 14 1988.69 19.68 1969.01 7.0 3.4 37.4 5.1 27.98 2.2 87 780 2.6 1.1 <0.50Sep 14 1988.69 19.08 1969.61 7.5 3.4 4.2 6.6 28.41 2.2 70 350 0.94 <0.50 <0.50Nov 14 1988.69 19.55 1969.14 7.1 3.6 4.5 4.2 25.89 2.3 59 740 3.9 1.5 <0.50Mar 15 1988.69 19.35 1969.34 6.4 3.5 12.2 2.8 24.02 2.2 205 790 3.7 1.2 <0.50

Maryland Square PCE SiteCardno ATC
Page 10 of 47
Well ID Date
Top of Casing
Elevation (feet msl)
Depth to Groundwater Level (feet)
Groundwater Elevation (feet msl)
pH Specific
Conductance (mS/cm)
Turbidity
(NTU)
Dissolved Oxygen (mg/L)
Temp (ºC) TDS (g/L)
ORP (mV)
PCE (μg/L)
TCE (μg/L)
cis-1,2-DCE
(μg/L)
Vinyl Chloride
(μg/L)
Table A-2: Historical Groundwater Gauging and Analytical DataMaryland Square Shopping Center
MW-6 Oct 00 1988.72 17.41 1971.31 NM NM NM NM NM NM NM 2,200 13.0 8.1 ND Sep 02 1989.01 18.26 1970.75 NM NM NM NM NM nM NM 1,000 41.0 14.0 ND May 03 1989.01 18.87 1970.14 NM NM NM NM NM NM NM 710 22.0 ND ND Sep 03 1989.01 19.25 1969.76 NM NM NM NM NM NM NM 1,300 ND ND ND Jan 04 1989.01 19.74 1969.27 7.0 2.3 NM 1.2 22.40 NM NM 2,400 ND ND ND May 05 1989.01 16.21 1972.8 6.9 2.4 NM 2.8 25.90 NM 123 2,090 13.0 11.0 ND Sep 05 1989.01 17.26 1971.75 7.0 4.0 34.0 6.2 26.90 2.3 -119 890 13.0 23.0 ND Dec 05 1989.01 17.88 1971.13 6.8 4.9 220.0 1.1 26.50 3.2 163 530 41.0 21.0 ND Mar 06 1989.01 NM NM NM NM NM NM NM NM NM NS NS NS NS Jun 06 1989.01 18.80 1970.21 NM 4.0 707.0 6.3 26.70 2.4 172 1,100 ND ND ND Oct 06 1989.01 18.73 1970.28 6.3 3.6 7.0 4.1 26.50 2.3 61 1,300 ND ND ND Dec 06 1989.01 19.18 1969.83 6.7 4.2 96.0 4.4 26.20 2.7 239 810 9.9 8.9 ND Mar 07 1989.01 20.40 1968.61 NM NM NM NM NM NM NM NS NS NS NS Jun 07 1989.01 20.28 1968.73 7.1 3.5 352.0 5.6 24.90 2.2 241 1,300 ND ND ND Sep 07 1989.01 19.00 1970.01 NM NM NM NM NM NM NM NS NS NS NS Dec 07 1989.01 19.29 1969.72 6.2 3.8 4.3 5.4 24.80 2.4 277 1,500 ND ND ND Mar 08 1989.01 20.26 1968.75 NM NM NM NM NM NM NM NS NS NS NS Jun 08 1989.01 NM NM NM NM NM NM NM NM NM 1,900 ND ND ND Oct 08 1989.03 20.00 1969.03 6.8 3.5 46.3 3.3 26.30 2.3 117 2,000 13.0 3.9 ND Feb 09 1989.03 20.03 1969 NM NM NM NM NM NM NM NS NS NS NS Jun 09 1989.03 20.20 1968.83 7.0 3.5 76.3 2.8 26.70 2.2 121 2,800 14.0 4.1 ND Sep 09 1989.03 20.27 1968.76 NM NM NM NM NM NM NM NS NS NS NS Nov 09 1989.03 20.66 1968.37 5.9 3.1 87.0 2.5 26.30 1.9 132 2,100 14.0 6.4 ND Feb 10 1989.03 20.77 1968.26 NM NM NM NM NM NM NM NS NS NS NS Jun 10 1989.03 20.38 1968.65 7.0 3.0 23.2 4.1 26.32 NM NM 2,500 13.0 6.2 NS Oct 10 1989.03 19.94 1969.09 NM NM NM NM NM NM NM NS NS NS NS Nov 10 1989.03 20.02 1969.01 6.9 3.3 7.0 3.5 25.26 NM 86 2,300 13.0 8.2 NDMar 11 1989.03 20.49 1968.54 NM NM NM NM NM NM NM NS NS NS NS Jun 11 1989.03 20.66 1968.37 7.0 3.3 8.2 3.7 26.52 NM 365 2,400 10.0 3.7 NDSep 11 1989.03 20.30 1968.73 NM NM NM NM NM NM NM NS NS NS NS Nov 11 1989.03 20.30 1968.73 7.0 3.2 NM 3.4 25.16 2.1 113 2,900 12 5.6 NDMar 12 1989.03 20.84 1968.19 7.3 3.2 107.0 4.4 24.30 2.1 -44 3,500 NS NS NS
* Jun 12 1988.12 19.71 1968.41 7.6 3.1 57.1 7.5 27.25 2.0 114 1,700 8.5 5.4 NDSep 12 1988.12 19.23 1968.89 7.3 3.1 NM 3.7 26.27 2.0 122 3,000 17 8.1 NDNov 12 1988.12 NM NM NM NM NM NM NM NM NM NS NS NS NS Mar 13 1988.12 20.23 1967.89 7.1 3.4 NM 3.3 24.83 2.2 100 2,600 10 2.2 <0.50Jun 13 1988.12 20.58 1967.54 7.3 3.4 NM 3.6 30.62 2.2 130 2,400 7.7 1.3 <0.50Sep 13 1988.12 20.25 1967.87 7.0 3.3 NM 3.0 29.86 2.2 90 2,500 11 11 <0.50Nov 13 1988.12 20.14 1967.98 7.8 3.5 16.2 3.1 25.27 2.3 97 3,100 12 3.5 <0.50Mar 14 1988.12 20.00 1968.12 7.2 2.9 152.0 4.8 24.30 1.9 -108 2,700 11 2.3 <0.50Jun 14 1988.12 20.30 1967.82 7.2 3.2 21.3 6.7 26.43 2.1 158 3,000 8.7 2.6 <0.50Sep 14 1988.12 19.27 1968.85 7.4 3.2 56.6 6.5 32.77 2.1 64 700 4.0 1.2 <0.50Nov 14 1988.12 20.09 1968.03 6.9 3.5 5.0 3.3 24.83 2.3 79 3,300 12.0 3.1 <0.50Mar 15 1988.12 19.96 1968.16 6.4 3.4 11.6 2.3 25.06 2.2 99 3,300 9.3 2.3 <0.50

Maryland Square PCE SiteCardno ATC
Page 11 of 47
Well ID Date
Top of Casing
Elevation (feet msl)
Depth to Groundwater Level (feet)
Groundwater Elevation (feet msl)
pH Specific
Conductance (mS/cm)
Turbidity
(NTU)
Dissolved Oxygen (mg/L)
Temp (ºC) TDS (g/L)
ORP (mV)
PCE (μg/L)
TCE (μg/L)
cis-1,2-DCE
(μg/L)
Vinyl Chloride
(μg/L)
Table A-2: Historical Groundwater Gauging and Analytical DataMaryland Square Shopping Center
MW-6D1 Mar 13 1988.72 16.29 1972.43 7.6 0.6 NM 5.7 23.48 0.4 86 <0.50 <0.50 <0.50 <0.50Jun 13 1988.72 20.20 1968.52 7.5 0.7 NM 5.2 25.82 0.4 280 <0.50 <0.50 <0.50 <0.50Sep 13 1988.72 21.40 1967.32 7.4 0.9 NM 4.4 27.20 0.6 61 58 <0.50 <0.50 <0.50Nov 13 1988.72 19.24 1969.48 6.9 0.6 49.3 5.0 23.81 0.4 84 3.2 <0.50 <0.50 <0.50Mar 14 1988.72 16.20 1972.52 7.4 0.5 62.4 4.3 26.16 0.3 87 1.2 <0.50 <0.50 <0.50Jun 14 1988.72 19.60 1969.12 7.3 0.6 47.4 5.8 26.70 0.4 200 0.67 <0.50 <0.50 <0.50Sep 14 1988.72 20.40 1968.32 7.2 0.8 51.3 4.2 25.75 0.5 120 120 <0.50 <0.50 <0.50Nov 14 1988.72 18.40 1970.32 7.4 0.7 6.7 6.1 23.50 0.4 40 21 <0.50 <0.50 <0.50Mar 15 1988.72 15.41 1973.31 6.8 0.6 19.3 3.4 26.20 0.4 102 3.0 <0.50 <0.50 <0.50
MW-6D2 Mar 13 1988.72 14.94 1973.78 7.6 0.6 NM 4.3 22.93 0.4 55 <0.50 <0.50 <0.50 <0.50Jun 13 1988.72 20.40 1968.32 7.5 0.7 NM 5.9 25.49 0.4 142 <0.50 <0.50 <0.50 <0.50Sep 13 1988.72 21.61 1967.11 7.4 0.7 NM 5.0 26.61 0.5 58 33 <0.50 <0.50 <0.50Nov 13 1988.72 18.94 1969.78 7.5 0.6 18.0 NM 23.22 0.4 24 3.3 <0.50 <0.50 <0.50Mar 14 1988.72 15.90 1972.82 7.3 0.5 52.3 4.4 24.76 0.3 88 1.6 <0.50 <0.50 <0.50Jun 14 1988.72 NM NM NM NM NM NM NM NM NM NS NS NS NSSep 14 1988.72 NM NM NM NM NM NM NM NM NM NS NS NS NSNov 14 1989.72 NM NM NM NM NM NM NM NM NM NS NS NS NSMar 15 1990.72 15.35 1975.37 6.8 0.6 58.6 3.7 24.31 0.4 113 3.2 <0.50 <0.50 <0.50
MW-6D3 Mar 13 1988.72 14.04 1974.68 7.6 0.5 NM 0.7 22.18 0.3 29 <0.50 <0.50 <0.50 <0.50Jun 13 1988.72 24.40 1964.32 7.7 0.5 NM 2.8 31.09 0.4 155 <0.50 <0.50 <0.50 <0.50Sep 13 1988.72 24.89 1963.83 7.2 0.6 NM 2.2 28.92 0.4 112 2.0 <0.50 <0.50 <0.50Nov 13 1988.72 22.16 1966.56 6.9 0.5 43.6 5.7 23.58 0.3 78 3.0 <0.50 <0.50 <0.50Mar 14 1988.72 16.70 1972.02 7.3 0.5 86.4 5.4 24.62 0.3 61 1.9 <0.50 <0.50 <0.50Jun 14 1988.72 NM NM NM NM NM NM NM NM NM NS NS NS NSSep 14 1988.72 26.93 1961.79 7.42 0.49 67.50 6.17 27.28 0.32 65.40 10 <0.50 <0.50 <0.50Nov 14 1988.72 NM NM NM NM NM NM NM NM NM NS NS NS NSMar 15 1989.72 15.47 1974.25 6.8 0.5 99.1 3.9 25.30 0.3 107 32 0.50 <0.50 <0.50

Maryland Square PCE SiteCardno ATC
Page 12 of 47
Well ID Date
Top of Casing
Elevation (feet msl)
Depth to Groundwater Level (feet)
Groundwater Elevation (feet msl)
pH Specific
Conductance (mS/cm)
Turbidity
(NTU)
Dissolved Oxygen (mg/L)
Temp (ºC) TDS (g/L)
ORP (mV)
PCE (μg/L)
TCE (μg/L)
cis-1,2-DCE
(μg/L)
Vinyl Chloride
(μg/L)
Table A-2: Historical Groundwater Gauging and Analytical DataMaryland Square Shopping Center
MW-7 Sep 02 1990.28 18.27 1972.01 NM NM NM NM NM NM NM ND ND ND ND May 03 1990.28 16.60 1973.68 NM NM NM NM NM NM NM 1.7 ND ND ND Sep 03 1990.25 16.79 1973.46 NM NM NM NM NM NM NM 2.0 ND ND ND Jan 04 1990.25 17.32 1972.93 7.0 2.2 NM 0.9 22.40 NM NM 11 ND ND ND May 05 1990.25 13.86 1976.39 7.1 1.8 NM 4.0 24.80 NM 129 ND ND ND ND Sep 05 1990.25 14.97 1975.28 7.0 4.6 140.0 6.2 26.60 3.0 144 3.3 ND ND ND Dec 05 1990.25 15.45 1974.80 6.7 5.3 5.0 1.8 23.80 3.4 472 1.2 ND ND ND Mar 06 1990.25 16.41 1973.84 4.7 6.7 428.0 NM 22.40 4.2 634 1.5 ND ND ND Jun 06 1990.25 16.50 1973.75 NM 4.1 >999 6.6 26.20 2.6 -14 2.2 ND ND ND Oct 06 1990.25 16.50 1973.75 6.2 3.7 >999 4.4 25.00 2.3 92 2.9 ND ND ND Dec 06 1990.25 16.87 1973.38 6.9 4.8 >999 5.7 25.10 3.0 65 2.1 ND ND ND Mar 07 1990.25 18.19 1972.06 NM NM NM NM NM NM NM NS NS NS NS Jun 07 1990.25 18.08 1972.17 7.1 3.6 450.0 6.3 25.10 2.2 129 1.1 ND ND ND Sep 07 1990.25 16.31 1973.94 NM NM NM NM NM NM NM NS NS NS NS Dec 07 1990.25 16.60 1973.65 6.2 4.0 0.0 2.3 22.50 2.6 161 1.3 ND ND ND Mar 08 1990.25 17.93 1972.32 NM NM NM NM NM NM NM NS NS NS NS Jun 08 1990.25 NM NM NM NM NM NM NM NM NM NS NS NS NS Oct 08 1990.22 17.57 1972.65 6.6 3.8 204.0 3.5 26.70 2.4 134 2.5 ND ND ND Feb 09 1990.22 17.52 1972.70 NM NM NM NM NM NM NM NS NS NS NS Jun 09 1990.22 17.92 1972.30 NM NM NM NM NM NM NM NS NS NS NS Sep 09 1990.22 18.13 1972.09 NM NM NM NM NM NM NM NS NS NS NS Nov 09 1990.22 18.50 1971.72 5.8 3.4 46.0 3.2 26.70 2.2 160 7.9 ND ND ND Feb 10 1990.22 18.36 1971.86 NM NM NM NM NM NM NM NS NS NS NS Jun 10 1990.22 NM NM NM NM NM NM NM NM NM NS NS NS NS Oct 10 1990.22 17.54 1972.68 NM NM NM NM NM NM NM NS NS NS NS Nov 10 1990.22 17.65 1972.57 6.9 3.7 230.8 4.9 26.17 NM 98 2.0 ND ND NDMar 11 1990.22 18.19 1972.03 NM NM NM NM NM NM NM NS NS NS NS Jun 11 1990.22 18.40 1971.82 NM NM NM NM NM NM NM NS NS NS NSSep 11 1990.22 18.02 1972.20 NM NM NM NM NM NM NM NS NS NS NS Nov 11 1990.22 17.86 1972.36 7.0 3.5 NM 3.7 25.20 2.2 302 8.9 ND ND NDMar 12 1990.22 NM NM NM NM NM NM NM NM NM NS NS NS NS
* Jun 12 1989.78 17.78 1972.00 7.3 3.5 8.0 4.8 27.56 2.3 -42 10 ND ND NDSep 12 1989.78 NM NM NM NM NM NM NM NM NM NS NS NS NSNov 12 1989.78 NM NM NM NM NM NM NM NM NM NS NS NS NS Mar 13 1989.78 18.47 1971.31 7.0 3.8 NM 3.4 25.22 2.5 70 10 <0.50 <0.50 <0.50Jun 13 1989.78 NM NM NM NM NM NM NM NM NM NS NS NS NSSep 13 1989.78 NM NM NM NM NM NM NM NM NM NS NS NS NSNov 13 1990.78 18.40 1972.38 6.1 3.4 53.0 1.64 26.34 2.17 165 8.4 <0.50 <0.50 <0.50Mar 14 1990.78 18.12 1972.66 7.3 3.3 39.0 4.18 24.49 2.11 90 1.3 <0.50 <0.50 <0.50Jun 14 1990.78 NM NM NM NM NM NM NM NM NM NS NS NS NSSep 14 1990.78 18.23 1972.55 7.42 3.48 59.40 6.32 28.59 2.25 108 4.7 <0.50 <0.50 <0.50Nov 14 1990.78 NM NM NM NM NM NM NM NM NM NS NS NS NSMar 15 1990.78 18.20 1972.58 6.5 3.6 11.5 2.3 26.60 2.4 206 17 <0.50 <0.50 <0.50

Maryland Square PCE SiteCardno ATC
Page 13 of 47
Well ID Date
Top of Casing
Elevation (feet msl)
Depth to Groundwater Level (feet)
Groundwater Elevation (feet msl)
pH Specific
Conductance (mS/cm)
Turbidity
(NTU)
Dissolved Oxygen (mg/L)
Temp (ºC) TDS (g/L)
ORP (mV)
PCE (μg/L)
TCE (μg/L)
cis-1,2-DCE
(μg/L)
Vinyl Chloride
(μg/L)
Table A-2: Historical Groundwater Gauging and Analytical DataMaryland Square Shopping Center
MW-8 Sep 02 1994.25 18.55 1975.70 NM NM NM NM NM NM NM 5.4 ND ND ND May 03 1994.25 19.50 1974.75 NM NM NM NM NM NM NM 3.2 ND ND ND Sep 03 1994.23 19.55 1974.68 NM NM NM NM NM NM NM 3.7 ND ND ND Jan 04 1994.23 19.91 1974.32 7.0 2.2 NM 1.0 22.00 NM NM 4.7 ND ND ND May 05 1994.23 15.51 1978.72 7.0 1.8 NM 3.6 27.70 NM 107 5.6 5.6 ND ND Dec 05 1994.23 18.48 1975.75 6.7 4.2 >999 2.1 24.10 2.7 483 3.6 ND ND ND Mar 06 1994.23 NM NM NM NM NM NM NM NM NM NS NS NS NS Jun 06 1994.23 18.89 1975.34 NM 3.7 >999 6.9 27.40 2.3 185 2.6 ND ND ND Oct 06 1994.23 19.12 1975.11 6.2 3.4 >999 5.9 26.70 2.2 108 3.4 ND ND ND Dec 06 1994.23 19.60 1974.63 6.2 3.4 >999 5.9 26.70 2.2 108 4.3 ND ND ND Mar 07 1994.23 20.56 1973.67 NM NM NM NM NM NM NM NS NS NS NS Jun 07 1994.23 20.31 1973.92 7.1 3.5 259.0 7.3 27.30 2.3 287 2.8 ND ND ND Sep 07 1994.23 19.14 1975.09 NM NM NM NM NM NM NM NS NS NS NS Dec 07 1994.23 19.81 1974.42 6.5 3.7 0.0 3.5 25.50 2.4 158 2.8 ND ND ND Mar 08 1994.23 20.61 1973.62 NM NM NM NM NM NM NM NS NS NS NS Jun 08 1994.23 NM NM NM NM NM NM NM NM NM NS NS NS NS Oct 08 1994.22 20.79 1973.43 6.8 3.5 421.0 5.2 26.90 2.2 154 3.7 ND ND ND Feb 09 1994.22 20.29 1973.93 NM NM NM NM NM NM NM NS NS NS NS Jun 09 1994.22 20.44 1973.78 NM NM NM NM NM NM NM NS NS NS NS Sep 09 1994.22 20.41 1973.81 NM NM NM NM NM NM NM NS NS NS NS Nov 09 1994.22 20.71 1973.51 6.7 3.2 450.0 5.0 26.80 2.0 133 2.8 ND ND ND Feb 10 1994.22 20.86 1973.36 NM NM NM NM NM NM NM NS NS NS NS Jun 10 1994.22 NM NM NM NM NM NM NM NM NM NS NS NS NS Oct 10 1994.22 19.68 1974.54 NM NM NM NM NM NM NM NS NS NS NS Nov 10 1994.22 19.94 1974.28 7.0 3.5 39.5 5.3 26.65 NM 98 4 ND ND NDMar 11 1994.22 20.41 1973.81 NM NM NM NM NM NM NM NS NS NS NS Jun 11 1994.22 20.50 1973.72 NM NM NM NM NM NM NM NS NS NS NSSep 11 1994.22 20.27 1973.95 NM NM NM NM NM NM NM NS NS NS NS Mar 12 1994.22 NM NM NM NM NM NM NM NM NM NS NS NS NS
* Jun 12 1991.71 19.32 1972.39 7.4 3.2 93.1 6.6 27.55 2.1 17 3.5 ND ND NDSep 12 1991.71 NM NM NM NM NM NM NM NM NM NS NS NS NSNov 12 1991.71 NM NM NM NM NM NM NM NM NM NS NS NS NS Mar 13 1991.71 20.65 1971.06 7.0 3.5 NM 5.0 25.97 2.3 78 1.5 <0.50 <0.50 <0.50Jun 13 1991.71 NM NM NM NM NM NM NM NM NM NS NS NS NSSep 13 1991.71 NM NM NM NM NM NM NM NM NM NS NS NS NSNov 13 1991.71 20.60 1971.11 6.1 3.2 95.0 2.3 26.12 2.1 194 2.2 <0.50 <0.50 <0.50Mar 14 1991.71 20.45 1971.26 7.3 3.1 92.9 5.4 24.07 2.0 89 1.6 <0.50 <0.50 <0.50Jun 14 1991.71 NM NM NM NM NM NM NM NM NM NS NS NS NSSep 14 1991.71 NM NM NM NM NM NM NM NM NM NS NS NS NSNov 14 1991.71 NM NM NM NM NM NM NM NM NM NS NS NS NSMar 15 1991.71 20.55 1971.16 6.3 3.4 18.7 1.0 26.64 2.2 201 2.4 <0.50 <0.50 <0.50

Maryland Square PCE SiteCardno ATC
Page 14 of 47
Well ID Date
Top of Casing
Elevation (feet msl)
Depth to Groundwater Level (feet)
Groundwater Elevation (feet msl)
pH Specific
Conductance (mS/cm)
Turbidity
(NTU)
Dissolved Oxygen (mg/L)
Temp (ºC) TDS (g/L)
ORP (mV)
PCE (μg/L)
TCE (μg/L)
cis-1,2-DCE
(μg/L)
Vinyl Chloride
(μg/L)
Table A-2: Historical Groundwater Gauging and Analytical DataMaryland Square Shopping Center
MW-9 Sep 02 1992.26 18.46 1973.80 NM NM NM NM NM NM NM 670 ND ND ND May 03 1992.26 19.15 1973.11 NM NM NM NM NM NM NM 59 ND ND ND Sep 03 1992.26 19.02 1973.24 NM NM NM NM NM NM NM 9.2 ND ND ND Jan 04 1992.26 19.05 1973.21 7.0 2.5 NM 1.2 22.60 NM NM 10 ND ND ND May 05 1992.26 15.36 1976.90 7.1 2.7 296.0 7.6 26.10 NM 130 353 ND ND ND Sep 05 1992.26 17.85 1974.41 7.2 1.8 4.0 6.6 27.10 1.2 111 64 ND ND ND Dec 05 1992.26 17.68 1974.58 6.9 2.5 33.0 2.5 26.60 1.6 123 190 ND ND ND Mar 06 1992.26 18.55 1973.71 5.1 2.1 >999 NM 25.90 1.3 496 ND ND ND ND Jun 06 1992.26 NM NM NM NM NM NM NM NM NM NS NS NS NS Oct 06 1992.26 18.40 1973.86 6.3 2.4 0.0 4.1 25.70 1.5 86 160 ND ND ND Dec 06 1992.26 19.00 1973.26 6.8 3.0 0.0 5.1 25.50 1.9 233 45 ND ND ND Mar 07 1992.26 20.19 1972.07 NM NM NM NM NM NM NM NS NS NS NS Jun 07 1992.26 19.95 1972.31 7.1 2.5 0.0 5.6 26.10 1.6 428 170 ND ND ND Sep 07 1992.26 18.51 1973.75 NM NM NM NM NM NM NM NS NS NS NS Dec 07 1992.26 19.20 1973.06 NM NM NM NM NM NM NM 110 ND ND ND Mar 08 1992.26 20.16 1972.10 NM NM NM NM NM NM NM NS NS NS NS Jun 08 1992.26 NM NM NM NM NM NM NM NM NM NS NS NS NS Oct 08 1992.25 19.87 1972.38 7.0 1.4 162.0 4.7 26.60 0.9 58 12 ND ND ND Feb 09 1992.25 19.76 1972.49 NM NM NM NM NM NM NM NS NS NS NS Jun 09 1992.25 20.00 1972.25 7.5 1.4 >-5.0 4.0 26.50 0.8 -9 13 ND ND ND Sep 09 1992.25 20.20 1972.05 NM NM NM NM NM NM NM NS NS NS NS Nov 09 1992.25 20.45 1971.80 7.0 1.1 -10.0 4.0 26.40 0.7 -157 5.5 ND ND ND Feb 10 1992.25 20.21 1972.04 NM NM NM NM NM NM NM NS NS NS NS Jun 10 1992.25 20.10 1972.15 7.3 1.2 12.0 5.1 27.67 NM NM 6.6 ND ND ND Oct 10 1992.25 19.44 1972.81 NM NM NM NM NM NM NM NS NS NS NS Nov 10 1992.25 19.63 1972.62 7.1 1.2 7.0 3.5 27.31 NM 50 3.7 ND ND NDMar 11 1992.25 20.13 1972.12 NM NM NM NM NM NM NM NS NS NS NS Jun 11 1992.25 20.40 1971.85 7.1 1.2 0.4 0.5 31.96 NM 286 2.3 ND ND NDSep 11 1992.25 19.99 1972.26 NM NM NM NM NM NM NM NS NS NS NS Nov 11 1992.25 19.91 1972.34 7.3 1.2 NM 2.2 24.70 0.8 265 5.6 ND ND NDMar 12 1992.25 20.50 1971.75 7.5 1.2 17.8 1.7 26.86 0.8 -79 5.2 NS NS NS
* Jun 12 1992.25 19.45 1972.80 7.6 1.0 13.4 4.7 30.27 0.8 -8 5.7 ND ND NDSep 12 1992.25 19.07 1973.18 7.7 1.2 NM 2.2 27.57 0.8 118 3.7 ND ND NDNov 12 1992.25 NM NM NM NM NM NM NM NM NM NS NS NS NS Mar 13 1992.25 20.56 1971.69 7.2 1.4 NM 0.6 25.53 0.9 -0.1 6.6 <0.50 <0.50 <0.50Jun 13 1992.25 20.91 1971.34 7.2 1.4 NM 2.3 25.44 0.9 110 9.8 <0.50 <0.50 <0.50Sep 13 1992.25 20.69 1971.56 7.3 1.4 NM 2.4 27.88 0.9 -81 6.6 <0.50 <0.50 <0.50Nov 13 1992.25 20.53 1971.72 6.4 1.3 35.3 0.6 25.32 0.8 56 11 <0.50 <0.50 <0.50Mar 14 1992.25 20.36 1971.89 7.3 1.4 13.8 4.1 24.73 0.9 75 11 <0.50 <0.50 <0.50Jun 14 1992.25 NM NM NM NM NM NM NM NM NM NS NS NS NS Sep 14 1992.25 20.55 1971.70 7.25 1.31 17.60 3.98 29.12 0.86 58.50 7.9 <0.50 <0.50 <0.50Nov 14 1992.25 NM NM NM NM NM NM NM NM NM NS NS NS NS Mar 15 1992.25 20.62 1971.63 6.73 1.59 13.33 2.37 25.95 1.04 90.80 9.7 <0.50 <0.50 <0.50

Maryland Square PCE SiteCardno ATC
Page 15 of 47
Well ID Date
Top of Casing
Elevation (feet msl)
Depth to Groundwater Level (feet)
Groundwater Elevation (feet msl)
pH Specific
Conductance (mS/cm)
Turbidity
(NTU)
Dissolved Oxygen (mg/L)
Temp (ºC) TDS (g/L)
ORP (mV)
PCE (μg/L)
TCE (μg/L)
cis-1,2-DCE
(μg/L)
Vinyl Chloride
(μg/L)
Table A-2: Historical Groundwater Gauging and Analytical DataMaryland Square Shopping Center
MW-10 Sep 02 1983.81 18.51 1965.30 NM NM NM NM NM NM NM ND ND ND ND May 03 1983.81 18.65 1965.16 NM NM NM NM NM NM NM ND ND ND ND Sep 03 1983.81 19.45 1964.36 NM NM NM NM NM NM NM 15 ND ND ND Jan 04 1983.81 20.32 1963.49 7.0 3.1 NM 1.0 24.40 NM NM ND ND ND ND May 05 1983.81 16.76 1967.05 6.8 3.2 25.0 1.5 28.10 NM -253 ND ND ND ND Sep 05 1983.81 16.95 1966.86 7.0 2.9 28.0 3.9 27.90 1.9 -239 ND ND ND ND Dec 05 1983.81 17.64 1966.17 6.7 3.7 57.0 1.5 23.90 2.3 -140 ND ND ND ND Mar 06 1983.81 19.25 1964.56 5.7 1.8 153.0 NM 21.30 1.2 -154 ND ND ND ND Jun 06 1983.81 17.90 1965.91 NM 2.1 >999 3.5 28.10 1.5 -303 ND ND ND ND Oct 06 1983.81 19.00 1964.81 6.2 1.4 86.0 1.6 27.10 0.9 -272 ND ND ND ND Dec 06 1983.81 19.21 1964.60 6.8 3.9 144.0 3.9 26.60 2.5 -321 1 ND ND ND Mar 07 1983.81 20.84 1962.97 NM NM NM NM NM NM NM NS NS NS NS Jun 07 1983.81 21.39 1962.42 7.0 3.5 >999 2.7 27.30 2.1 -179 ND ND ND ND Sep 07 1983.81 20.38 1963.43 NM NM NM NM NM NM NM NS NS NS NS Dec 07 1983.81 20.26 1963.55 6.9 3.6 0.0 0.6 24.50 2.3 -170 1 ND ND ND Mar 08 1983.81 21.06 1962.75 NM NM NM NM NM NM NM NS NS NS NS Jun 08 1983.81 NM NM NM NM NM NM NM NM NM NS NS NS NS Oct 08 1983.78 20.45 1963.33 6.8 2.9 100.0 0.0 27.70 1.9 -226 ND ND ND ND Feb 09 1983.78 20.90 1962.88 NM NM NM NM NM NM NM NS NS NS NS Jun 09 1983.78 21.42 1962.36 NM NM NM NM NM NM NM NS NS NS NS Sep 09 1983.78 21.46 1962.32 NM NM NM NM NM NM NM NS NS NS NS Nov 09 1983.78 21.67 1962.11 6.3 2.6 -10.0 0.2 27.40 1.6 -330 ND ND ND ND Feb 10 1983.78 22.47 1961.31 NM NM NM NM NM NM NM NS NS NS NS Jun 10 1983.78 NM NM NM NM NM NM NM NM NM NS NS NS NS Oct 10 1983.78 21.23 1962.55 NM NM NM NM NM NM NM NS NS NS NS Nov 10 1983.78 21.10 1962.68 7.1 1.0 1.0 0.1 28.00 NM -274 ND ND ND NDMar 11 1983.78 21.76 1962.02 NM NM NM NM NM NM NM NS NS NS NS Jun 11 1983.78 22.18 1961.60 NM NM NM NM NM NM NM NS NS NS NSSep 11 1983.78 21.75 1962.03 NM NM NM NM NM NM NM NS NS NS NS Nov 11 1983.78 21.62 1962.16 6.9 1.3 NM 0.2 26.91 NM -335 ND ND ND NDMar 12 1983.78 NM NM NM NM NM NM NM NM NM NS NS NS NS
* Jun 12 1983.28 21.76 1961.52 7.4 3.0 11.0 1.0 27.50 2.0 -283 0.9 ND ND NDSep 12 1983.28 NM NM NM NM NM NM NM NM NM NS NS NS NSNov 12 1983.28 NM NM NM NM NM NM NM NM NM NS NS NS NS Mar 13 1983.28 21.36 1961.92 7.1 2.7 NM 0.7 26.34 1.7 -238 <0.50 <0.50 <0.50 <0.50Jun 13 1983.28 NM NM NM NM NM NM NM NM NM NS NS NS NSSep 13 1983.28 NM NM NM NM NM NM NM NM NM NS NS NS NSNov 13 1983.28 NM NM NM NM NM NM NM NM NM NS NS NS NSMar 14 1983.28 21.43 1961.85 7.3 3.0 76.1 4.7 27.18 1.9 -78 <0.50 <0.50 <0.50 <0.50Jun 14 1983.28 NM NM NM NM NM NM NM NM NM NS NS NS NSSep 14 1983.28 NM NM NM NM NM NM NM NM NM NS NS NS NSNov 14 1983.28 NM NM NM NM NM NM NM NM NM NS NS NS NSMar 15 1983.28 21.60 1961.68 6.4 3.6 5.8 0.4 25.38 2.3 -181 <0.50 <0.50 <0.50 <0.50

Maryland Square PCE SiteCardno ATC
Page 16 of 47
Well ID Date
Top of Casing
Elevation (feet msl)
Depth to Groundwater Level (feet)
Groundwater Elevation (feet msl)
pH Specific
Conductance (mS/cm)
Turbidity
(NTU)
Dissolved Oxygen (mg/L)
Temp (ºC) TDS (g/L)
ORP (mV)
PCE (μg/L)
TCE (μg/L)
cis-1,2-DCE
(μg/L)
Vinyl Chloride
(μg/L)
Table A-2: Historical Groundwater Gauging and Analytical DataMaryland Square Shopping Center
MW-11 Sep 02 1980.24 24.22 1956.02 NM NM NM NM NM NM NM ND ND ND ND May 03 1980.24 24.25 1955.99 NM NM NM NM NM NM NM ND ND ND ND Sep 03 1980.24 25.62 1954.62 NM NM NM NM NM NM NM NS NS NS NS Jan 04 1980.24 26.22 1954.02 NM NM NM NM NM NM NM NS NS NS NS May 05 1980.24 22.55 1957.69 NM NM NM NM NM NM NM NS NS NS NS Mar 06 1980.24 NM NM NM NM NM NM NM NM NM NS NS NS NS Jun 06 1980.24 NM NM NM NM NM NM NM NM NM NS NS NS NS Oct 06 1980.24 NM NM NM NM NM NM NM NM NM NS NS NS NS Dec 06 1980.24 NM NM NM NM NM NM NM NM NM NS NS NS NS Mar 07 1980.24 25.51 1954.73 NM NM NM NM NM NM NM NS NS NS NS Jun 07 1980.24 NM NM NM NM NM NM NM NM NM NS NS NS NS Sep 07 1980.24 26.13 1954.11 NM NM NM NM NM NM NM NS NS NS NS Dec 07 1980.24 NM NM NM NM NM NM NM NM NM NS NS NS NS Mar 08 1980.24 NM NM NM NM NM NM NM NM NM NS NS NS NS Jun 08 1980.24 NM NM NM NM NM NM NM NM NM NS NS NS NS Oct 08 1980.21 NM NM NM NM NM NM NM NM NM NS NS NS NS Feb 09 1980.21 NM NM NM NM NM NM NM NM NM NS NS NS NS Jun 09 1980.21 NM NM NM NM NM NM NM NM NM NS NS NS NS Sep 09 1980.21 NM NM NM NM NM NM NM NM NM NS NS NS NS Nov 09 1980.21 NM NM NM NM NM NM NM NM NM NS NS NS NS Feb 10 1980.21 27.54 1952.67 6.7 3.3 3.0 5.0 24.30 2.1 -134 ND ND ND ND Jun 10 1980.21 NM NM NM NM NM NM NM NM NM NS NS NS NS Oct 10 1980.21 NM NM NM NM NM NM NM NM NM NS NS NS NS Nov 10 1980.21 26.69 1953.52 NM NM NM NM NM NM NM NS NS NS NSMar 11 1980.21 NM NM NM NM NM NM NM NM NM NS NS NS NS Jun 11 1980.21 27.36 1952.85 NM NM NM NM NM NM NM NS NS NS NSSep 11 1980.21 27.45 1952.76 NM NM NM NM NM NM NM NS NS NS NS Nov 11 1980.21 27.28 1952.93 6.9 3.3 NM 0.2 24.72 21.3 -94 1.4 ND ND NDMar 12 1980.21 NM NM NM NM NM NM NM NM NM NS NS NS NS
* Jun 12 1979.87 27.37 1952.50 7.3 3.4 3.9 0.9 26.07 2.2 -194 1.4 ND ND NDSep 12 1979.87 NM NM NM NM NM NM NM NM NM NS NS NS NSNov 12 1979.87 NM NM NM NM NM NM NM NM NM NS NS NS NS Mar 13 1979.87 25.81 1954.06 7.0 3.7 NM 1.2 24.43 2.4 -104 <0.50 <0.50 <0.50 <0.50Jun 13 1979.87 NM NM NM NM NM NM NM NM NM NS NS NS NSSep 13 1979.87 NM NM NM NM NM NM NM NM NM NS NS NS NSNov 13 1979.87 NM NM NM NM NM NM NM NM NM NS NS NS NSMar 14 1979.87 26.32 1953.55 7.2 3.2 13.2 0.9 24.93 2.1 -19 <0.50 <0.50 <0.50 <0.50Jun 14 1979.87 NM NM NM NM NM NM NM NM NM NS NS NS NSSep 14 1979.87 NM NM NM NM NM NM NM NM NM NS NS NS NSNov 14 1979.87 NM NM NM NM NM NM NM NM NM NS NS NS NSMar 15 1979.87 26.55 1953.32 6.8 3.5 3.7 1.0 23.66 2.3 -96 <0.50 <0.50 <0.50 <0.50

Maryland Square PCE SiteCardno ATC
Page 17 of 47
Well ID Date
Top of Casing
Elevation (feet msl)
Depth to Groundwater Level (feet)
Groundwater Elevation (feet msl)
pH Specific
Conductance (mS/cm)
Turbidity
(NTU)
Dissolved Oxygen (mg/L)
Temp (ºC) TDS (g/L)
ORP (mV)
PCE (μg/L)
TCE (μg/L)
cis-1,2-DCE
(μg/L)
Vinyl Chloride
(μg/L)
Table A-2: Historical Groundwater Gauging and Analytical DataMaryland Square Shopping Center
MW-12 Sep 02 1996.59 14.90 1981.69 NM NM NM NM NM NM NM ND ND ND ND May 03 1996.59 15.07 1981.52 NM NM NM NM NM NM NM 1.3 ND ND ND Sep 03 1996.59 15.30 1981.29 NM NM NM NM NM NM NM 14 ND ND ND Jan 04 1996.59 15.40 1981.19 7.0 2.2 NM NM 22.40 NM NM 6.1 ND ND ND May 05 1996.59 12.34 1984.25 6.8 2.6 NM 3.2 24.90 NM 219 ND ND ND ND Sep 05 1996.59 13.45 1983.14 7.0 4.2 160.0 5.0 25.60 2.7 95 1.1 ND ND ND Dec 05 1996.59 14.20 1982.39 6.7 5.0 210.0 2.0 22.50 3.2 523 1.2 ND ND ND Mar 06 1996.59 15.00 1981.59 NM 6.7 91.0 NM 23.50 4.2 503 1.1 ND ND ND Jun 06 1996.59 NM NM NM NM NM NM NM NM NM NS NS NS NS Oct 06 1996.59 14.71 1981.88 6.3 3.9 >999 3.9 26.10 2.5 112 ND ND ND ND Dec 06 1996.59 15.05 1981.54 6.6 4.4 >999 6.2 25.30 2.8 206 1.4 ND ND ND Mar 07 1996.59 16.55 1980.04 NM NM NM NM NM NM NM NS NS NS NS Jun 07 1996.59 16.31 1980.28 7.1 3.8 >999 3.5 25.50 2.4 -39 ND ND ND ND Sep 07 1996.59 14.27 1982.32 NM NM NM NM NM NM NM NS NS NS NS Dec 07 1996.59 15.04 1981.55 6.3 3.9 286.0 2.6 24.70 2.5 207 ND ND ND ND Mar 08 1996.59 16.51 1980.08 NM NM NM NM NM NM NM NS NS NS NS Jun 08 1996.59 NM NM NM NM NM NM NM NM NM NS NS NS NS Oct 08 1996.48 15.73 1980.75 6.7 3.8 366.0 0.8 26.90 2.4 119 2 ND ND ND Feb 09 1996.48 15.61 1980.87 NM NM NM NM NM NM NM NS NS NS NS Jun 09 1996.48 16.26 1980.22 NM NM NM NM NM NM NM NS NS NS NS Sep 09 1996.48 16.29 1980.19 NM NM NM NM NM NM NM NS NS NS NS Nov 09 1996.48 16.76 1979.72 6.0 3.5 370.0 1.5 27.60 2.2 54 1.2 ND ND ND Feb 10 1996.48 16.92 1979.56 NM NM NM NM NM NM NM NS NS NS NS Jun 10 1996.48 NM NM NM NM NM NM NM NM NM NS NS NS NS Oct 10 1996.48 15.58 1980.90 NM NM NM NM NM NM NM NS NS NS NS Nov 10 1996.48 15.85 1980.63 6.8 3.6 20.4 1.6 26.18 NM 109 0.76 ND ND NDMar 11 1996.48 16.49 1979.99 NM NM NM NM NM NM NM NS NS NS NS Jun 11 1996.48 16.66 1979.82 NM NM NM NM NM NM NM NS NS NS NSSep 11 1996.48 NM NM NM NM NM NM NM NM NM NS NS NS NS Nov 11 1996.48 15.93 1980.55 7.0 3.5 NM 2.0 24.82 2.3 315 0.95 ND ND NDMar 12 1996.48 NM NM NM NM NM NM NM NM NM NS NS NS NS
* Jun 12 1995.95 15.37 1980.58 7.3 3.5 15.3 2.8 28.24 2.3 -18 1.2 ND ND NDSep 12 1995.95 NM NM NM NM NM NM NM NM NM NS NS NS NSNov 12 1995.95 NM NM NM NM NM NM NM NM NM NS NS NS NS Mar 13 1995.95 16.76 1979.19 7.0 3.8 NM 2.4 25.55 2.5 46 0.65 <0.50 <0.50 <0.50Jun 13 1995.95 NM NM NM NM NM NM NM NM NM NS NS NS NSSep 13 1995.95 NM NM NM NM NM NM NM NM NM NS NS NS NSNov 13 1995.95 16.66 1979.29 6.0 3.4 79.0 1.1 24.57 2.2 189 0.86 <0.50 <0.50 <0.50Mar 14 1995.95 16.26 1979.69 7.3 3.3 83.0 4.4 23.31 2.1 48 0.67 <0.50 <0.50 <0.50Jun 14 1995.95 NM NM NM NM NM NM NM NM NM NS NS NS NSSep 14 1995.95 NM NM NM NM NM NM NM NM NM NS NS NS NSNov 14 1995.95 NM NM NM NM NM NM NM NM NM NS NS NS NSMar 15 1995.95 16.69 1979.26 6.52 3.58 101.00 1.76 25.65 2.32 221.40 0.77 <0.50 <0.50 <0.50

Maryland Square PCE SiteCardno ATC
Page 18 of 47
Well ID Date
Top of Casing
Elevation (feet msl)
Depth to Groundwater Level (feet)
Groundwater Elevation (feet msl)
pH Specific
Conductance (mS/cm)
Turbidity
(NTU)
Dissolved Oxygen (mg/L)
Temp (ºC) TDS (g/L)
ORP (mV)
PCE (μg/L)
TCE (μg/L)
cis-1,2-DCE
(μg/L)
Vinyl Chloride
(μg/L)
Table A-2: Historical Groundwater Gauging and Analytical DataMaryland Square Shopping Center
MW-13 May 03 1984.23 17.25 1966.98 NM NM NM NM NM NM NM 2,100 ND ND ND Sep 03 1984.23 17.60 1966.63 NM NM NM NM NM NM NM 2,800 ND ND ND Jan 04 1984.23 18.00 1966.23 6.6 3.3 NM 1.1 22.20 NM NM 2,700 ND ND ND May 05 1984.23 14.76 1969.47 7.0 2.1 >999 4.2 24.50 NM 118 5,310 ND ND ND Sep 05 1984.23 15.60 1968.63 7.1 4.0 270.0 6.9 25.40 2.5 144 2,600 ND ND ND Dec 05 1984.23 16.05 1968.18 6.7 5.0 330.0 2.2 24.90 3.2 250 3,400 ND ND ND Mar 06 1984.23 17.24 1966.99 5.5 3.6 44.0 NM 22.80 2.3 68 3,700 ND ND ND Jun 06 1984.23 17.40 1966.83 NM 3.7 425.0 7.1 24.20 2.4 120 2,900 NS NS NS Oct 06 1984.23 17.15 1967.08 6.2 3.6 50.0 3.8 24.60 2.3 169 2,800 ND ND ND Dec 06 1984.23 17.47 1966.76 6.8 4.3 94.0 4.2 24.50 2.7 330 3,200 ND ND ND Mar 07 1984.23 18.58 1965.65 6.9 3.5 308.0 9.5 24.00 2.3 514 2,500 ND ND ND Jun 07 1984.23 18.66 1965.57 7.0 3.5 0.0 6.1 23.60 2.2 411 3,700 ND ND ND Sep 07 1984.23 17.41 1966.82 6.7 3.3 3.0 4.7 27.70 2.1 228 2,000 ND ND ND Dec 07 1984.23 17.50 1966.73 6.4 3.7 19.7 6.5 21.30 2.4 282 2,500 ND ND ND Mar 08 1984.23 18.31 1965.92 NM NM NM NM NM NM NM NS NS NS NS Jun 08 1984.23 NM NM NM NM NM NM NM NM NM 2,300 ND ND ND Oct 08 1984.18 18.25 1965.93 6.8 3.5 50.3 3.1 24.80 2.2 87 2,600 5.3 ND ND Feb 09 1984.18 18.28 1965.90 NM NM NM NM NM NM NM NS NS NS NS Jun 09 1984.18 18.41 1965.77 7.0 3.8 15.7 3.0 24.40 2.4 120 2,200 2.9 ND ND Sep 09 1984.18 18.63 1965.55 NM NM NM NM NM NM NM NS NS NS NS Nov 09 1984.18 19.05 1965.13 6.0 3.4 0.0 2.0 25.20 2.1 135 1,700 3.7 ND ND Feb 10 1984.18 19.22 1964.96 NM NM NM NM NM NM NM NS NS NS NS Jun 10 1984.18 18.72 1965.46 7.0 3.2 5.2 2.9 25.27 NM NM 1,600 3.2 ND ND Oct 10 1984.18 18.44 1965.74 NM NM NM NM NM NM NM NS NS NS NS Nov 10 1984.18 18.45 1965.73 6.9 3.5 2.0 2.3 23.79 NM 90 1,900 3.9 ND NDMar 11 1984.18 18.75 1965.43 NM NM NM NM NM NM NM NS NS NS NS Jun 11 1984.18 19.15 1965.03 7.1 3.5 4.0 2.7 24.74 NM 284 1,600 3.2 ND NDSep 11 1984.18 18.64 1965.54 NM NM NM NM NM NM NM NS NS NS NS Nov 11 1984.18 18.67 1965.51 6.9 3.7 NM 1.6 23.97 2.4 113 1,700 2.4 ND NDMar 12 1984.18 NM NM NM NM NM NM NM NM NM NS NS NS NS
* Jun 12 1983.31 18.45 1964.86 7.2 3.5 19.6 1.9 23.36 2.3 86 1,500 3.7 ND NDSep 12 1983.31 NM NM NM NM NM NM NM NM NM NS NS NS NSNov 12 1983.31 NM NM NM NM NM NM NM NM NM NS NS NS NS Mar 13 1983.31 18.53 1964.78 7.0 3.8 NM 1.6 22.69 2.5 159 1,300 2.8 <0.50 <0.50Jun 13 1983.31 NM NM NM NM NM NM NM NM NM NS NS NS NSSep 13 1983.31 NM NM NM NM NM NM NM NM NM NS NS NS NSNov 13 1983.31 18.50 1964.81 7.5 3.9 19.7 0.9 23.77 2.5 104 1,800 3.5 <0.50 <0.50Mar 14 1983.31 18.37 1964.94 7.2 3.2 12.2 3.6 23.95 2.1 -158 1,500 3.7 <0.50 <0.50Jun 14 1983.31 NM NM NM NM NM NM NM NM NM NS NS NS NSSep 14 1983.31 18.31 1965.00 7.39 3.52 7.97 5.92 29.88 2.31 133 640 2.8 <0.50 <0.50Nov 14 1983.31 NM NM NM NM NM NM NM NM NM NS NS NS NSMar 15 1983.31 18.40 1964.91 6.34 3.61 12.03 1.12 23.24 2.35 216.80 1,700 4.6 <0.50 <0.50

Maryland Square PCE SiteCardno ATC
Page 19 of 47
Well ID Date
Top of Casing
Elevation (feet msl)
Depth to Groundwater Level (feet)
Groundwater Elevation (feet msl)
pH Specific
Conductance (mS/cm)
Turbidity
(NTU)
Dissolved Oxygen (mg/L)
Temp (ºC) TDS (g/L)
ORP (mV)
PCE (μg/L)
TCE (μg/L)
cis-1,2-DCE
(μg/L)
Vinyl Chloride
(μg/L)
Table A-2: Historical Groundwater Gauging and Analytical DataMaryland Square Shopping Center
MW-14 Nov 03 NM NM NM NM NM NM NM NM NM NM 1,900 ND ND ND Jan 04 1987.89 18.35 1969.54 7.0 2.3 NM 1.3 22.30 NM NM 2,100 ND ND ND May 05 1987.89 15.02 1972.87 7.0 3.2 NM NM 24.70 NM 140 2,920 5.5 ND ND Dec 05 1987.89 16.50 1971.39 6.8 5.3 >999 2.1 26.10 3.3 206 3,400 ND ND ND Mar 06 1987.89 17.54 1970.35 5.2 6.8 898.0 NM 24.20 4.3 234 2,500 ND ND ND Jun 06 1987.89 17.61 1970.28 NM 3.9 >999 6.8 25.40 2.5 119 1,800 NS NS NS Oct 06 1987.89 17.42 1970.47 6.1 3.6 >999 7.0 24.80 2.3 297 1,900 ND ND ND Dec 06 1987.89 17.78 1970.11 6.8 4.5 350.0 4.2 25.70 2.9 226 3,500 ND ND ND Mar 07 1987.89 18.93 1968.96 6.8 3.7 455.0 8.1 25.10 2.4 501 1,900 ND ND ND Jun 07 1987.89 18.80 1969.09 7.0 3.7 259.0 6.4 24.80 2.4 299 1,700 ND ND ND Sep 07 1987.89 17.40 1970.49 6.8 3.5 103.0 4.2 32.20 2.2 220 650 ND ND ND Dec 07 1987.89 17.66 1970.23 6.4 4.0 9.7 5.7 23.30 2.6 147 1,500 ND ND ND Mar 08 1987.89 18.63 1969.26 NM NM NM NM NM NM NM NS NS NS NS Jun 08 1987.89 NM NM NM NM NM NM NM NM NM 1,500 ND ND ND Oct 08 1987.86 18.60 1969.26 6.8 3.7 249.0 3.1 25.70 2.4 116 1,500 2.9 ND ND Feb 09 1987.86 18.47 1969.39 NM NM NM NM NM NM NM NS NS NS NS Jun 09 1987.86 18.63 1969.23 7.0 4.0 >-5.0 2.9 25.60 2.5 118 1,900 4.4 ND ND Sep 09 1987.86 18.88 1968.98 NM NM NM NM NM NM NM NS NS NS NS Nov 09 1987.86 19.20 1968.66 5.6 3.6 300.0 1.8 26.20 2.3 132 1,200 2.1 ND ND Feb 10 1987.86 19.26 1968.60 NM NM NM NM NM NM NM NS NS NS NS Jun 10 1987.86 18.88 1968.98 7.0 3.3 84.2 3.6 25.49 NM NM 1,500 2.4 ND ND Oct 10 1987.86 18.50 1969.36 NM NM NM NM NM NM NM NS NS NS NS Nov 10 1987.86 18.56 1969.30 6.9 3.6 25.8 2.9 25.07 NM 101 1,500 2.6 ND NDMar 11 1987.86 18.97 1968.89 NM NM NM NM NM NM NM NS NS NS NS Jun 11 1987.86 19.15 1968.71 7.3 3.6 11.4 3.2 25.78 NM 259 1,700 2.0 ND NDSep 11 1987.86 18.74 1969.12 NM NM NM NM NM NM NM NS NS NS NS Nov 11 1987.86 18.72 1969.14 7.0 3.5 NM 2.6 25.40 2.3 111 1,700 2.5 ND NDMar 12 1987.86 19.33 1968.53 7.2 3.6 87.5 4.3 23.33 2.3 -51 1,600 NS NS NS
* Jun 12 1987.33 18.71 1968.62 7.3 3.5 122.0 3.9 25.77 2.3 104 1,400 2.5 ND NDSep 12 1987.33 18.28 1969.05 7.3 3.5 NM 3.2 25.71 2.3 144 1,300 2.8 ND NDNov 12 1987.33 NM NM NM NM NM NM NM NM NM NS NS NS NS Mar 13 1987.33 19.12 1968.21 7.0 3.9 NM 2.6 24.10 2.5 112 1,900 2.9 <0.50 <0.50Jun 13 1987.33 19.44 1967.89 7.2 3.1 NM 3.5 28.28 2.5 130 1,300 2.1 <0.50 <0.50Sep 13 1987.33 19.16 1968.17 7.0 3.7 NM 2.8 26.13 2.4 91 1,400 2.5 <0.50 <0.50Nov 13 1987.33 18.96 1968.37 7.8 3.9 28.9 2.6 25.17 3.5 96 1,500 2.7 <0.50 <0.50Mar 14 1987.33 18.89 1968.44 7.3 3.0 165.0 6.0 24.70 2.1 -114 930 2.2 <0.50 <0.50Jun 14 1987.33 NM NM NM NM NM NM NM NM NM NS NS NS NS Sep 14 1987.33 18.95 1968.38 7.34 3.60 67.60 3.53 27.45 2.34 122 330 1.0 <0.50 <0.50Nov 14 1987.33 NM NM NM NM NM NM NM NM NM NS NS NS NS Mar 15 1987.33 18.85 1968.48 6.44 3.67 69.60 2.06 25.28 2.39 104.90 1,900 3.6 <0.50 <0.50

Maryland Square PCE SiteCardno ATC
Page 20 of 47
Well ID Date
Top of Casing
Elevation (feet msl)
Depth to Groundwater Level (feet)
Groundwater Elevation (feet msl)
pH Specific
Conductance (mS/cm)
Turbidity
(NTU)
Dissolved Oxygen (mg/L)
Temp (ºC) TDS (g/L)
ORP (mV)
PCE (μg/L)
TCE (μg/L)
cis-1,2-DCE
(μg/L)
Vinyl Chloride
(μg/L)
Table A-2: Historical Groundwater Gauging and Analytical DataMaryland Square Shopping Center
MW-14l Mar 13 NM 19.52 NM 7.4 1.3 NM 4.1 24.19 0.9 95 7,200 51 4.9 <0.50Jun 13 1987.54 19.95 1967.59 7.5 1.4 NM 4.2 30.76 0.9 101 5,500 27 3.8 <0.50Sep 13 1987.54 19.66 1967.88 7.4 1.4 NM 2.9 35.26 0.9 82 3,700 23 1.6 <0.50Nov 13 1987.54 19.53 1968.01 7.8 1.4 6.3 4.0 24.38 0.9 102 10,000 38 17 <0.50Mar 14 1987.54 19.53 1968.01 7.3 1.1 11.3 4.4 25.36 0.7 134 7,600 32 17 <0.50Jun 14 1987.54 19.69 1967.85 7.2 1.3 6.5 4.4 28.29 0.9 111 9,800 21 6.9 <0.50Sep 14 1987.54 19.41 1968.13 7.3 1.3 6.4 4.0 30.32 0.9 93 9,300 21 1.4 <0.50Nov 14 1987.54 19.44 1968.10 7.0 1.3 3.4 4.0 24.91 0.9 26 11,000 25 17 <1.0Mar 15 1987.54 19.41 1968.13 6.7 1.3 6.3 2.7 24.99 0.8 106 11,000 32 20 <0.50

Maryland Square PCE SiteCardno ATC
Page 21 of 47
Well ID Date
Top of Casing
Elevation (feet msl)
Depth to Groundwater Level (feet)
Groundwater Elevation (feet msl)
pH Specific
Conductance (mS/cm)
Turbidity
(NTU)
Dissolved Oxygen (mg/L)
Temp (ºC) TDS (g/L)
ORP (mV)
PCE (μg/L)
TCE (μg/L)
cis-1,2-DCE
(μg/L)
Vinyl Chloride
(μg/L)
Table A-2: Historical Groundwater Gauging and Analytical DataMaryland Square Shopping Center
MW-15 Nov 03 NM NM NM NM NM NM NM NM NM NM 5.2 ND ND ND Jan 04 1983.28 15.60 1967.68 6.4 2.2 NM 1.0 22.40 NM NM 2.7 ND ND ND May 05 1983.28 12.59 1970.69 7.0 2.3 NM 2.9 25.10 NM 164 ND ND ND ND Sep 05 1983.28 13.45 1969.83 7.0 3.6 36.0 3.5 25.80 2.3 -24 3.6 ND ND ND Dec 05 1983.28 13.77 1969.51 6.6 4.5 140.0 1.0 25.90 2.8 -38 5 ND ND ND Mar 06 1983.28 15.00 1968.28 4.7 6.4 20.0 NM 23.90 4.0 613 4.5 ND ND ND Jun 06 1983.28 15.15 1968.13 NM 3.8 300.0 4.3 26.00 2.5 106 4.4 NS NS NS Oct 06 1983.28 14.91 1968.37 6.2 3.7 10.0 2.0 25.70 2.3 51 3.3 ND ND ND Dec 06 1983.28 15.17 1968.11 6.8 4.7 15.0 3.4 25.90 3.0 28 3.7 ND ND ND Mar 07 1983.28 16.31 1966.97 NM NM NM NM NM NM NM NS NS NS NS Jun 07 1983.28 16.16 1967.12 7.0 3.6 37.0 3.1 25.30 2.3 362 3 ND ND ND Sep 07 1983.28 14.80 1968.48 NM NM NM NM NM NM NM NS NS NS NS Dec 07 1983.28 14.71 1968.57 6.4 3.7 0.0 1.9 23.30 2.3 170 3 ND ND ND Mar 08 1983.28 16.62 1966.66 NM NM NM NM NM NM NM NS NS NS NS Jun 08 1983.28 NM NM NM NM NM NM NM NM NM NS NS NS NS Oct 08 1983.25 15.80 1967.45 6.8 3.6 132.0 2.1 27.00 2.3 112 7.8 ND ND ND Feb 09 1983.25 15.76 1967.49 NM NM NM NM NM NM NM NS NS NS NS Jun 09 1983.25 15.89 1967.36 NM NM NM NM NM NM NM NS NS NS NS Sep 09 1983.25 16.34 1966.91 NM NM NM NM NM NM NM NS NS NS NS Nov 09 1983.25 16.68 1966.57 5.8 3.2 44.0 1.8 26.60 2.1 34 3 ND ND ND Feb 10 1983.25 16.81 1966.44 NM NM NM NM NM NM NM NS NS NS NS Jun 10 1983.25 NM NM NM NM NM NM NM NM NM NS NS NS NS Oct 10 1983.25 16.10 1967.15 NM NM NM NM NM NM NM NS NS NS NS Nov 10 1983.25 16.08 1967.17 6.8 3.4 7.6 2.3 27.60 NM 154 2.5 ND ND ND Mar 11 1983.25 16.29 1966.96 NM NM NM NM NM NM NM NS NS NS NS Jun 11 1983.25 16.64 1966.61 NM NM NM NM NM NM NM NS NS NS NSSep 11 1983.25 16.18 1967.07 NM NM NM NM NM NM NM NS NS NS NS Nov 11 1983.25 16.17 1967.08 6.8 4.0 NM 2.1 26.75 NM -42 3.5 ND ND NDMar 12 1983.25 NM NM NM NM NM NM NM NM NM NS NS NS NSJun 12 1982.74 16.70 1966.04 7.3 3.1 25.4 4.1 27.82 2.1 -64 4.2 ND ND NDSep 12 1982.74 NM NM NM NM NM NM NM NM NM NS NS NS NSNov 12 1982.74 NM NM NM NM NM NM NM NM NM NS NS NS NS Mar 13 1982.74 16.41 1966.33 7.0 3.6 NM 2.9 26.24 2.3 48 2.7 <0.50 <0.50 <0.50Jun 13 1982.74 NM NM NM NM NM NM NM NM NM NS NS NS NS Sep 13 1982.74 NM NM NM NM NM NM NM NM NM NS NS NS NS Nov 13 1982.74 NM NM NM NM NM NM NM NM NM NS NS NS NS Mar 14 1982.74 16.25 1966.49 7.2 3.1 62.6 2.9 26.32 2.0 66 2.8 <0.50 <0.50 <0.50Jun 14 1982.74 NM NM NM NM NM NM NM NM NM NS NS NS NSSep 14 1982.74 NM NM NM NM NM NM NM NM NM NS NS NS NSNov 14 1982.74 NM NM NM NM NM NM NM NM NM NS NS NS NSMar 15 1982.74 16.70 1966.04 6.43 3.46 21.70 1.79 26.25 2.25 95.40 3.6 <0.50 <0.50 <0.50

Maryland Square PCE SiteCardno ATC
Page 22 of 47
Well ID Date
Top of Casing
Elevation (feet msl)
Depth to Groundwater Level (feet)
Groundwater Elevation (feet msl)
pH Specific
Conductance (mS/cm)
Turbidity
(NTU)
Dissolved Oxygen (mg/L)
Temp (ºC) TDS (g/L)
ORP (mV)
PCE (μg/L)
TCE (μg/L)
cis-1,2-DCE
(μg/L)
Vinyl Chloride
(μg/L)
Table A-2: Historical Groundwater Gauging and Analytical DataMaryland Square Shopping Center
MW-16 Nov 03 NM NM NM NM NM NM NM NM NM NM ND ND ND ND Jan 04 1980.63 26.22 1954.41 7.0 2.3 NM 0.7 22.40 NM NM ND ND ND ND May 05 1980.63 23.41 1957.22 7.1 2.9 NM 1.1 25.20 NM -4 ND ND ND ND Sep 05 1980.63 24.12 1956.51 7.0 3.4 520.0 3.5 24.60 2.3 -31 ND ND ND ND Dec 05 1980.63 24.21 1956.42 6.7 3.8 >999 1.3 25.30 2.4 48 ND ND ND ND Mar 06 1980.63 25.06 1955.57 5.2 5.7 199.0 NM 23.80 3.6 162 ND ND ND ND Jun 06 1980.63 26.05 1954.58 NM 3.4 >999 5.6 27.10 2.2 -64 ND ND ND ND Oct 06 1980.63 25.67 1954.96 6.3 3.4 32.0 2.0 24.60 2.2 -145 ND ND ND ND Dec 06 1980.63 25.56 1955.07 6.5 3.6 271.0 2.9 24.40 1.3 -52 ND ND ND ND Mar 07 1980.63 26.33 1954.30 NM NM NM NM NM NM NM NS NS NS NS Jun 07 1980.63 27.28 1953.35 6.7 3.3 282.0 2.2 25.00 2.1 94 ND ND ND ND Sep 07 1980.63 27.03 1953.60 NM NM NM NM NM NM NM NS NS NS NS Dec 07 1980.63 26.46 1954.17 6.5 3.4 0.0 1.9 24.90 2.2 82 ND ND ND ND Mar 08 1980.63 26.33 1954.30 NM NM NM NM NM NM NM NS NS NS NS Jun 08 1980.63 NM NM NM NM NM NM NM NM NM NS NS NS NS Oct 08 1980.61 27.19 1953.42 6.9 3.2 68.0 0.0 24.90 2.1 38 ND 2.8 ND ND Feb 09 1980.61 26.52 1954.09 NM NM NM NM NM NM NM NS NS NS NS Jun 09 1980.61 27.30 1953.31 NM NM NM NM NM NM NM NS NS NS NS Sep 09 1980.61 27.86 1952.75 NM NM NM NM NM NM NM NS NS NS NS Nov 09 1980.61 27.99 1952.62 5.7 3.0 100.0 0.4 26.00 1.9 -96 1.9 ND ND ND Feb 09 1980.61 28.43 1952.18 NM NM NM NM NM NM NM NS NS NS NS Jun 10 1980.61 NM NM NM NM NM NM NM NM NM NS NS NS NS Oct 10 1980.61 27.95 1952.66 NM NM NM NM NM NM NM NS NS NS NS Nov 10 1980.61 27.68 1952.93 6.6 3.1 2.5 0.2 26.52 NM 140 ND ND ND ND Mar 11 1980.61 27.49 1953.12 NM NM NM NM NM NM NM NS NS NS NS Jun 11 1980.61 28.22 1952.39 NM NM NM NM NM NM NM NS NS NS NSSep 11 1980.61 28.36 1952.25 NM NM NM NM NM NM NM NS NS NS NS Nov 11 1980.61 28.17 1952.44 6.9 3.5 NM 0.2 24.40 NM -74 ND ND ND NDMar 12 1980.61 NM NM NM NM NM NM NM NM NM NS NS NS NS
* Jun 12 1980.53 28.51 1952.02 7.2 2.9 NM 1.2 25.13 1.9 -23 ND ND ND NDSep 12 1980.53 NM NM NM NM NM NM NM NM NM NS NS NS NSNov 12 1980.53 NM NM NM NM NM NM NM NM NM NS NS NS NSMar 13 1980.53 26.86 1953.67 7.0 3.3 NM 1.7 25.33 2.2 -111 <0.50 <0.50 <0.50 <0.50Jun 13 1980.53 NM NM NM NM NM NM NM NM NM NS NS NS NSSep 13 1980.53 NM NM NM NM NM NM NM NM NM NS NS NS NSNov 13 1980.53 NM NM NM NM NM NM NM NM NM NS NS NS NSMar 14 1980.53 27.39 1953.14 7.3 2.8 1.8 2.5 24.61 1.8 23 <0.50 <0.50 <0.50 <0.50Jun 14 1980.53 NM NM NM NM NM NM NM NM NM NS NS NS NSSep 14 1980.53 NM NM NM NM NM NM NM NM NM NS NS NS NSNov 14 1980.53 NM NM NM NM NM NM NM NM NM NS NS NS NSMar 15 1980.53 27.55 1952.98 6.8 3.2 3.4 0.3 24.24 2.1 2 <0.50 <0.50 <0.50 <0.50

Maryland Square PCE SiteCardno ATC
Page 23 of 47
Well ID Date
Top of Casing
Elevation (feet msl)
Depth to Groundwater Level (feet)
Groundwater Elevation (feet msl)
pH Specific
Conductance (mS/cm)
Turbidity
(NTU)
Dissolved Oxygen (mg/L)
Temp (ºC) TDS (g/L)
ORP (mV)
PCE (μg/L)
TCE (μg/L)
cis-1,2-DCE
(μg/L)
Vinyl Chloride
(μg/L)
Table A-2: Historical Groundwater Gauging and Analytical DataMaryland Square Shopping Center
MW-17 May 05 1990.92 15.07 1975.85 6.9 3.5 22.0 5.9 24.10 NM 181 520 ND ND ND Dec 05 1990.92 17.05 1973.87 6.9 4.7 6.0 2.3 26.80 3.0 240 470 ND ND ND Mar 06 1990.92 NM NM NM NM NM NM NM NM NM NS NS NS NS Jun 06 1990.92 NM NM NM NM NM NM NM NM NM NS NS NS NS Oct 06 1990.92 17.91 1973.01 6.2 3.5 2.0 7.4 24.90 2.2 174 1,300 ND ND ND Dec 06 1990.92 18.41 1972.51 6.9 4.1 25.0 6.8 24.10 2.7 386 710 ND ND ND Mar 07 1990.92 19.63 1971.29 7.0 3.6 87.0 8.1 24.30 2.3 350 440 ND ND ND Jun 07 1990.92 19.48 1971.44 7.0 3.7 37.0 7.3 25.00 2.3 471 300 ND ND ND Sep 07 1990.92 17.91 1973.01 6.7 3.4 0.0 5.0 26.70 2.2 197 380 ND ND ND Dec 07 1990.92 18.45 1972.47 6.3 3.9 0.0 4.8 19.70 2.5 176 480 ND ND ND Mar 08 1990.92 19.51 1971.41 NM NM NM NM NM NM NM NS NS NS NS Jun 08 1990.92 NM NM NM NM NM NM NM NM NM 360 ND ND ND Oct 08 1990.89 18.84 1972.05 6.8 3.7 -3.1 4.1 25.00 2.4 136 290 ND ND ND Feb 09 1990.89 19.12 1971.77 NM NM NM NM NM NM NM NS NS NS NS Jun 09 1990.89 19.44 1971.45 5.6 3.8 0.0 1.3 25.00 2.4 170 270 ND ND ND Sep 09 1990.89 19.58 1971.31 NM NM NM NM NM NM NM NS NS NS NS Nov 09 1990.89 19.95 1970.94 6.6 3.5 -10.0 3.0 25.20 2.2 131 310 ND ND ND Feb 10 1990.89 19.71 1971.18 NM NM NM NM NM NM NM NS NS NS NS Jun 10 1990.89 19.62 1971.27 7.0 2.9 -0.7 3.1 25.10 NM NM 270 ND ND ND Oct 10 1990.89 19.10 1971.79 NM NM NM NM NM NM NM NS NS NS NS Nov 10 1990.89 19.14 1971.75 6.6 3.7 1.3 1.8 26.48 NM 207 240 ND ND NDMar 11 1990.89 19.65 1971.24 NM NM NM NM NM NM NM NS NS NS NS Jun 11 1990.89 19.85 1971.04 6.7 3.7 0.5 1.7 25.89 NM 399 350 ND ND NDSep 11 1990.89 NM NM NM NM NM NM NM NM NM NS NS NS NS Nov 11 1990.89 19.45 1971.44 7.0 3.5 NM 2.7 24.09 2.6 274 350 ND ND NDMar 12 1990.89 20.03 1970.86 7.2 3.6 4.1 1.3 24.72 2.3 -92 320 NS NS NS
* Jun 12 1991.04 19.09 1971.95 7.2 3.5 4.5 1.6 24.31 2.3 101 260 ND ND NDSep 12 1991.04 18.83 1972.21 7.5 3.5 NM 2.0 25.50 2.8 72 250 ND ND NDNov 12 1991.04 NM NM NM NM NM NM NM NM NM NS NS NS NSMar 13 1991.04 19.94 1971.10 7.0 3.7 NM 1.0 23.75 2.4 54 190 <0.50 <0.50 <0.50Jun 13 1991.04 20.30 1970.74 7.0 3.8 NM 1.1 23.43 2.4 91 150 <0.50 <0.50 <0.50Sep 13 1991.04 20.18 1970.86 7.1 3.7 NM 1.4 25.61 2.4 -86 130 <0.50 <0.50 <0.50Nov 13 1991.04 19.90 1971.14 6.0 3.2 1.7 0.4 24.10 2.1 154 120 <0.50 <0.50 <0.50Mar 14 1991.04 19.67 1971.37 7.2 3.2 2.0 2.2 23.49 2.1 47 69 <0.50 <0.50 <0.50Jun 14 1991.04 NM NM NM NM NM NM NM NM NM NS NS NS NSSep 14 1991.04 NM NM NM NM NM NM NM NM NM NS NS NS NSNov 14 1991.04 NM NM NM NM NM NM NM NM NM NS NS NS NSMar 15 1991.04 19.80 1971.24 6.4 3.5 4.1 1.0 24.82 2.3 89 65 <0.50 <0.50 <0.50

Maryland Square PCE SiteCardno ATC
Page 24 of 47
Well ID Date
Top of Casing
Elevation (feet msl)
Depth to Groundwater Level (feet)
Groundwater Elevation (feet msl)
pH Specific
Conductance (mS/cm)
Turbidity
(NTU)
Dissolved Oxygen (mg/L)
Temp (ºC) TDS (g/L)
ORP (mV)
PCE (μg/L)
TCE (μg/L)
cis-1,2-DCE
(μg/L)
Vinyl Chloride
(μg/L)
Table A-2: Historical Groundwater Gauging and Analytical DataMaryland Square Shopping Center
MW-18 May 05 1962.87 8.71 1954.16 7.1 3.9 >999 5.6 24.30 NM 139 1,600 ND ND ND Sep 05 1962.87 9.69 1953.18 7.1 4.1 3.0 6.2 26.30 2.6 88 1,700 ND ND ND Dec 05 1962.87 9.70 1953.17 6.8 4.7 NM 2.0 25.20 3.0 420 2,400 ND ND ND Mar 06 1962.87 10.21 1952.66 5.2 6.2 3.0 NM 23.30 3.9 237 1,700 NS NS NS Jun 06 1962.87 11.64 1951.23 NM 3.6 304.0 6.2 25.40 2.3 166 1,600 NS NS NS Oct 06 1962.87 11.21 1951.66 6.3 3.5 0.0 4.1 25.50 2.2 127 2,100 ND ND ND Dec 06 1962.87 10.98 1951.89 6.8 4.2 0.0 4.3 24.70 2.7 297 1,400 ND ND ND Mar 07 1962.87 11.36 1951.51 7.0 3.4 23.0 7.5 22.80 2.2 286 1,400 ND ND ND Jun 07 1962.87 12.53 1950.34 7.0 3.5 24.0 5.5 23.90 2.2 394 1,300 ND ND ND Sep 07 1962.87 12.45 1950.42 6.8 3.3 22.0 5.4 29.30 2.1 210 930 ND ND ND Dec 07 1962.87 11.54 1951.33 6.3 3.6 0.0 5.8 21.60 2.3 232 1,400 ND ND ND Mar 08 1962.87 11.15 1951.72 6.9 3.5 0.2 4.3 21.20 2.2 212 1,800 ND ND ND Jun 08 1962.87 NM NM NM NM NM NM NM NM NM 1,200 ND ND ND Oct 08 1962.86 11.96 1950.90 5.5 3.5 14.3 7.8 25.50 2.2 196 950 3.7 ND ND Feb 09 1962.86 11.48 1951.38 6.7 3.3 0.0 3.8 22.70 2.1 90 1,500 5.2 ND ND Jun 09 1962.86 12.36 1950.50 7.3 3.5 20.2 3.5 23.90 2.3 131 3,500 5.1 ND ND Sep 09 1962.86 13.24 1949.62 6.6 3.9 18.9 4.3 28.00 2.5 136 1,200 ND ND ND Nov 09 1962.86 13.27 1949.59 5.9 3.3 40.0 3.6 25.80 2.1 132 1,400 4.1 ND ND Feb 10 1962.86 13.37 1949.49 6.9 3.3 9.0 4.0 23.30 2.1 134 1,600 4.8 ND ND Jun 10 1962.86 12.90 1949.96 7.1 3.1 -0.9 8.0 25.10 NM NM 1,100 3.5 ND ND Oct 10 1962.86 13.43 1949.43 6.7 3.3 -0.7 4.4 26.19 2.2 528 1,300 3.4 ND ND Nov 10 1962.86 13.20 1949.66 6.8 3.3 0.2 4.0 25.79 NM 192 1,200 3.8 ND ND Mar 11 1962.86 12.43 1950.43 7.5 3.4 25.7 7.8 22.14 NM 118 1,000 2.7 ND NDJun 11 1962.86 13.32 1949.54 7.4 3.4 0.7 4.4 24.99 NM 234 1,300 2.9 ND NDSep 11 1962.86 13.61 1949.25 7.0 3.4 39.0 6.2 26.60 2.2 276 1,300 3.2 ND NDNov 11 1962.86 13.39 1949.47 7.0 3.2 NM 4.0 24.97 2.1 178 1,100 3.3 ND NDMar 12 1962.86 NM NM NM NM NM NM NM NM NM NS NS NS NS
* Jun 12 1962.9 13.80 1949.10 7.3 3.2 6.1 4.8 25.23 2.1 115 1,300 3.4 ND NDSep 12 1962.9 NM NM NM NM NM NM NM NM NM NS NS NS NSNov 12 1962.9 NM NM NM NM NM NM NM NM NM NS NS NS NSMar 13 1962.9 12.06 1950.84 7.1 3.6 NM 2.6 23.54 2.3 83 1,200 2.5 <0.50 <0.50Jun 13 1962.9 NM NM NM NM NM NM NM NM NM NS NS NS NSSep 13 1962.9 NM NM NM NM NM NM NM NM NM NS NS NS NSNov 13 1962.9 13.62 1949.28 6.8 3.6 8.3 3.6 25.49 2.4 152 780 <0.50 <0.50 <0.50Mar 14 1962.9 12.75 1950.15 7.3 3.2 58.1 4.6 19.23 2.1 247 230 <0.50 <0.50 <0.50Jun 14 1962.9 13.78 1949.12 7.1 3.4 4.8 4.9 27.63 2.2 71 1,100 1.2 <0.50 <0.50Sep 14 1962.9 13.97 1948.93 8.0 2.9 7.6 2.5 30.26 1.8 92 620 0.78 <0.50 <0.50Nov 14 1962.9 13.22 1949.68 7.0 3.5 2.9 3.9 24.09 2.3 71 1,100 1.7 <0.50 <0.50Mar 15 1962.9 12.50 1950.40 6.5 3.5 7.4 2.3 22.37 2.3 243 1,200 2.5 <0.50 <0.50

Maryland Square PCE SiteCardno ATC
Page 25 of 47
Well ID Date
Top of Casing
Elevation (feet msl)
Depth to Groundwater Level (feet)
Groundwater Elevation (feet msl)
pH Specific
Conductance (mS/cm)
Turbidity
(NTU)
Dissolved Oxygen (mg/L)
Temp (ºC) TDS (g/L)
ORP (mV)
PCE (μg/L)
TCE (μg/L)
cis-1,2-DCE
(μg/L)
Vinyl Chloride
(μg/L)
Table A-2: Historical Groundwater Gauging and Analytical DataMaryland Square Shopping Center
MW-19 Nov 03 NM NM NM NM NM NM NM NM NM NM 1,100 ND ND ND Jan 04 1980.26 25.65 1954.61 7.0 1.9 NM 1.0 22.40 NM NM 1,200 ND ND ND May 05 1980.26 22.70 1957.56 7.1 1.9 NM 5.8 25.00 NM 130 873 ND ND ND Dec 05 1980.26 23.65 1956.61 6.6 4.7 NM 2.0 24.70 3.0 388 1,300 ND ND ND Mar 06 1980.26 NM NM NM NM NM NM NM NM NM NS NS NS NS Jun 06 1980.26 25.55 1954.71 NM 3.7 >999 7.9 27.10 2.4 86 910 ND ND ND Oct 06 1980.26 25.23 1955.03 6.1 3.7 >999 4.6 23.90 2.4 175 840 ND ND ND Dec 06 1980.26 25.01 1955.25 6.8 4.4 >999 5.7 23.90 2.8 595 1,200 ND ND ND Mar 07 1980.26 25.77 1954.49 6.9 3.7 >999 9.1 24.30 2.3 284 890 ND ND ND Jun 07 1980.26 26.84 1953.42 7.1 3.5 >999 6.7 24.50 2.3 551 870 ND ND ND Sep 07 1980.26 26.41 1953.85 6.8 3.4 352.0 5.1 27.40 2.2 201 510 ND ND ND Dec 07 1980.26 25.52 1954.74 6.4 3.8 440.0 5.6 24.30 2.4 150 990 ND ND ND Mar 08 1980.26 25.35 1954.91 7.0 3.7 7.6 5.2 24.80 2.3 190 1,200 NS NS NS Jun 08 1980.26 NM NM NM NM NM NM NM NM NM 930 ND ND ND Oct 08 1980.24 26.19 1954.05 6.9 3.5 18.0 4.1 24.40 2.2 135 1,300 5.7 ND ND Feb 09 1980.24 25.76 1954.48 NM NM NM NM NM NM NM NS NS NS NS Jun 09 1980.24 26.59 1953.65 7.0 3.6 178.0 4.5 25.80 2.3 125 1,400 6.1 ND ND Sep 09 1980.24 27.34 1952.90 6.4 3.9 999.0 4.7 26.60 2.5 157 880 ND ND ND Nov 09 1980.24 27.42 1952.82 5.9 3.4 >990 2.7 25.50 2.2 131 580 3.7 ND ND Feb 10 1980.24 27.78 1952.46 6.9 3.2 120.0 4.8 23.70 2.1 135 990 5.5 ND ND Jun 10 1980.24 27.08 1953.16 7.0 3.0 2.7 5.0 25.41 NM NM 930 4.2 ND ND Oct 10 1980.24 27.50 1952.74 7.1 3.2 15.3 5.2 25.28 2.1 394 420 3.2 ND ND Nov 10 1980.24 27.24 1953.00 7.1 3.3 15.5 5.0 25.25 NM 241 840 4.1 ND ND Mar 11 1980.24 26.73 1953.51 6.9 3.4 71.3 5.4 24.59 NM 258 880 3.7 ND NDJun 11 1980.24 27.55 1952.69 7.4 3.3 20.5 5.0 26.19 NM 190 1,000 3.5 ND NDSep 11 1980.24 27.68 1952.56 7.0 3.4 570.0 6.5 26.90 2.2 250 950 3.6 ND NDNov 11 1980.24 27.50 1952.74 7.1 3.1 NM 4.6 23.94 2.0 131 1,100 4.2 ND NDMar 12 1980.24 NM NM NM NM NM NM NM NM NM NS NS NS NS
* Jun 12 1980.13 27.88 1952.25 7.5 3.1 27.1 5.3 25.86 2.0 102 1,000 3.5 ND NDSep 12 1980.13 NM NM NM NM NM NM NM NM NM NS NS NS NS Nov 12 1980.13 NM NM NM NM NM NM NM NM NM NS NS NS NSMar 13 1980.13 NM NM NM NM NM NM NM NM NM 520 3.2 <0.50 <0.50Jun 13 1980.13 27.46 1952.67 7.2 3.4 NM 4.9 28.16 2.2 119 530 3.4 <0.50 <0.50Sep 13 1980.13 27.94 1952.19 7.2 3.2 NM 4.7 27.22 2.1 255 840 3.2 <0.50 <0.50Nov 13 1980.13 27.48 1952.65 6.3 3.1 65.8 3.2 26.49 2.0 228 440 3.2 <0.50 <0.50Mar 14 1980.13 26.66 1953.47 7.3 3.0 72.1 3.2 24.47 2.0 160 910 3.7 <0.50 <0.50Jun 14 1980.13 NM NM NM NM NM NM NM NM NM NS NS NS NSSep 14 1980.13 NM NM NM NM NM NM NM NM NM NS NS NS NSNov 14 1980.13 NM NM NM NM NM NM NM NM NM NS NS NS NSMar 15 1980.13 26.60 1953.53 6.9 3.3 36.2 3.4 23.35 2.2 NM 930 4.0 <0.50 <0.50

Maryland Square PCE SiteCardno ATC
Page 26 of 47
Well ID Date
Top of Casing
Elevation (feet msl)
Depth to Groundwater Level (feet)
Groundwater Elevation (feet msl)
pH Specific
Conductance (mS/cm)
Turbidity
(NTU)
Dissolved Oxygen (mg/L)
Temp (ºC) TDS (g/L)
ORP (mV)
PCE (μg/L)
TCE (μg/L)
cis-1,2-DCE
(μg/L)
Vinyl Chloride
(μg/L)
Table A-2: Historical Groundwater Gauging and Analytical DataMaryland Square Shopping Center
MW-19I Sep 12 1967.55 26.60 1940.95 7.7 3.0 NM 3.9 26.53 2.0 131 690 4.0 0.8 NDNov 12 1967.55 NM NM NM NM NM NM NM NM NM NS NS NS NSMar 13 1967.55 NM NM NM NM NM NM NM NM NM 710 5.2 0.74 <0.50Jun 13 1967.55 26.42 1941.13 7.3 3.4 NM 4.4 26.1 2.1 589 <0.50 <0.50 <0.50 <0.50Sep 13 1978.37 26.92 1951.45 7.0 3.9 NM 5.2 28.5 2.5 650 <0.50 <0.50 <0.50 <0.50Nov 13 1978.37 26.47 1951.90 4.3 4.2 20.8 4.3 25.6 2.7 579 <0.50 <0.50 <0.50 <0.50Mar 14 1978.37 25.62 1952.75 7.3 3.4 69.4 3.6 23.0 2.2 626 <0.50 <0.50 <0.50 <0.50Jun 14 1978.37 26.71 1951.66 6.9 3.5 15.7 5.6 28.5 2.2 650 <0.50 <0.50 <0.50 <0.50Sep 14 1978.37 26.81 1951.56 7.4 3.3 46.2 7.3 27.0 2.1 631 <0.50 <0.50 <0.50 <0.50Nov 14 1978.37 26.02 1952.35 7.1 3.4 6.3 5.1 22.5 2.2 643 <0.50 <0.50 <0.50 <0.50Mar 15 1978.37 25.52 1952.85 6.9 3.3 10.9 2.9 24.0 2.2 539 0.62 <0.50 <0.50 <0.50
MW-19D1 Mar 13 NM NM NM NM NM NM NM NM NM NM 300 2.9 <0.50 <0.50Jun 13 1979.25 27.73 1951.52 7.3 3.0 NM 4.7 27.42 1.9 3 690 4.2 <0.50 <0.50Sep 13 1979.25 27.17 1952.08 7.0 3.2 NM 4.3 26.23 2.1 485 990 4.2 <0.50 <0.50Nov 13 1979.25 26.70 1952.55 7.3 2.4 28.1 4.7 24.24 1.7 385 620 3.5 <0.50 <0.50Jan 14 1979.25 25.81 1953.44 7.3 1.1 NM 4.8 23.10 0.7 274 490 2.4 <0.50 <0.50Feb 14 1979.25 25.83 1953.42 7.4 0.5 NM 3.7 23.68 0.4 230 210 1.1 <0.50 <0.50Mar 14 1979.25 25.91 1953.34 7.4 0.5 52.8 4.1 23.31 0.3 239 3.7 <0.50 <0.50 <0.50Jun 14 1979.25 26.97 1952.28 7.0 2.6 56.2 5.5 31.79 1.7 501 730 4.2 <0.50 <0.50Sep 14 1979.25 27.06 1952.19 7.8 2.9 61.4 6.4 29.97 2.1 333 240 1.5 <0.50 <0.50Nov 14 1979.25 26.30 1952.95 7.1 3.3 18.6 4.8 23.11 2.1 68 1,000 5.9 <0.50 <0.50Mar 15 1979.25 25.74 1953.51 6.8 0.9 44.4 3.9 25.94 0.6 159 210 1.3 <0.50 <0.50
MW-19D2 Mar 13 NM NM NM NM NM NM NM NM NM NM 170 1.5 <0.50 <0.50Jun 13 1979.28 27.85 1951.43 7.4 2.7 NM 2.0 26.09 1.8 607 <0.50 <0.50 <0.50 <0.50Sep 13 1979.28 28.50 1950.78 7.2 2.4 NM 2.6 25.10 1.6 565 <0.50 <0.50 <0.50 <0.50Nov 13 1979.28 27.71 1951.57 7.5 2.6 18.0 3.3 24.83 1.7 485 <0.50 <0.50 <0.50 <0.50Jan 14 1979.28 26.66 1952.62 7.4 2.0 NM 3.5 22.53 1.3 531 <0.50 <0.50 <0.50 <0.50Feb 14 1979.28 26.85 1952.43 7.4 2.1 NM 2.1 23.04 1.3 502 <0.50 <0.50 <0.50 <0.50Mar 14 1979.28 26.97 1952.31 7.4 2.1 28.0 4.0 23.12 1.4 509 0.53 <0.50 <0.50 <0.50Jun 14 1979.28 27.88 1951.40 7.2 2.2 17.0 3.7 29.19 1.4 617 6.0 <0.50 <0.50 <0.50Sep 14 1979.28 27.67 1951.61 7.6 2.2 7.9 4.8 26.23 1.4 531 10 <0.50 <0.50 <0.50Nov 14 1979.28 27.01 1952.27 7.2 2.5 3.8 2.9 23.63 1.6 75 39 <0.50 <0.50 <0.50Mar 15 1979.28 26.88 1952.40 6.7 2.2 6.0 0.7 25.77 1.5 180 44 <0.50 <0.50 <0.50
MW-19D3 Mar 13 NM NM NM NM NM NM NM NM NM NM 0.50 <0.50 <0.50 <0.50Jun 13 1979.32 25.53 1953.79 7.7 0.5 NM 4.0 28.15 0.3 68 0.68 <0.50 <0.50 <0.50Sep 13 1979.32 28.80 1950.52 6.9 3.2 NM 4.9 24.91 2.1 133 710 4.8 <0.50 <0.50Nov 13 1979.32 25.42 1953.90 7.6 1.0 10.3 4.1 24.27 0.7 424 160 0.75 <0.50 <0.50Jan 14 1979.32 24.87 1954.45 7.4 0.5 NM 4.8 22.46 0.3 368 32 <0.50 <0.50 <0.50Feb 14 1979.32 24.67 1954.65 7.4 0.5 NM 4.6 22.68 0.3 344 36 <0.50 <0.50 <0.50Mar 14 1979.32 24.72 1954.60 7.4 0.5 17.0 4.4 23.47 0.3 80 17 <0.50 <0.50 <0.50Jun 14 1979.32 26.99 1952.33 7.7 0.6 41.6 4.6 33.28 0.4 158 40 <0.50 <0.50 <0.50Sep 14 1979.32 29.00 1950.32 7.0 3.1 6.9 6.5 26.73 2.0 256 710 4.7 <0.50 <0.50Nov 14 1979.32 26.48 1952.84 7.1 3.2 50.6 6.7 23.14 2.1 135 190 3.2 <0.50 <0.50Mar 15 1979.32 24.12 1955.20 6.7 0.6 14.8 3.9 25.63 0.4 201 41 <0.50 <0.50 <0.50
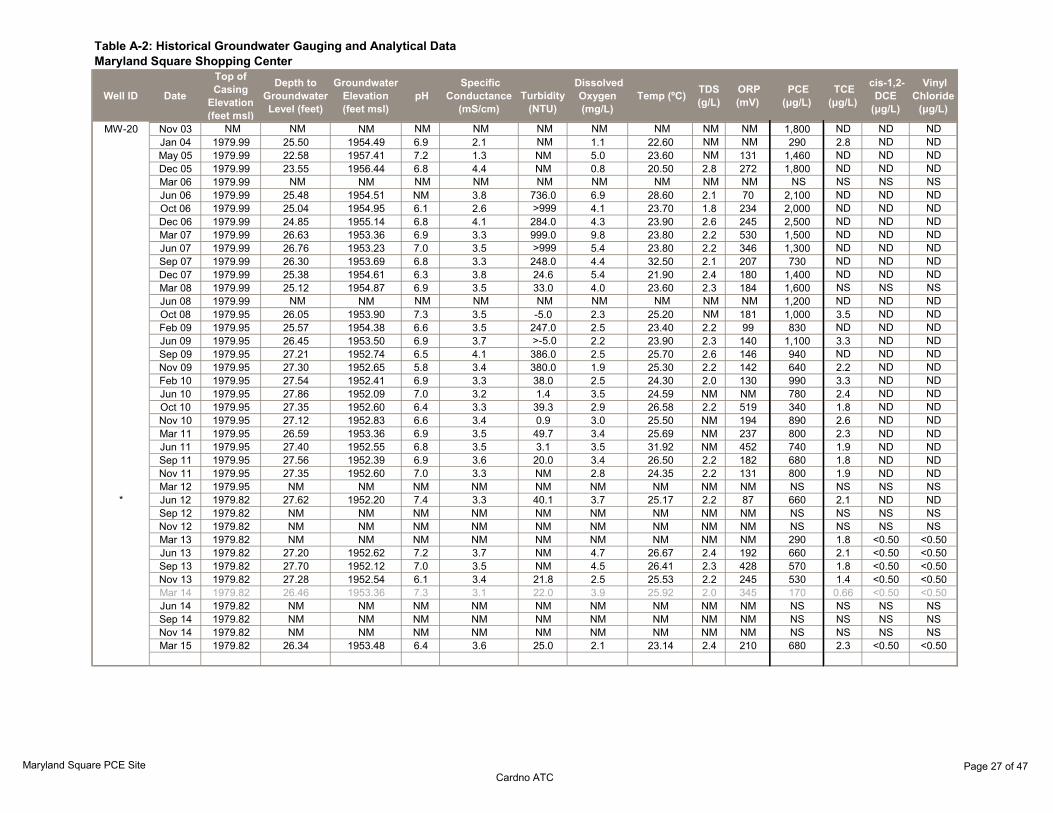
Maryland Square PCE SiteCardno ATC
Page 27 of 47
Well ID Date
Top of Casing
Elevation (feet msl)
Depth to Groundwater Level (feet)
Groundwater Elevation (feet msl)
pH Specific
Conductance (mS/cm)
Turbidity
(NTU)
Dissolved Oxygen (mg/L)
Temp (ºC) TDS (g/L)
ORP (mV)
PCE (μg/L)
TCE (μg/L)
cis-1,2-DCE
(μg/L)
Vinyl Chloride
(μg/L)
Table A-2: Historical Groundwater Gauging and Analytical DataMaryland Square Shopping Center
MW-20 Nov 03 NM NM NM NM NM NM NM NM NM NM 1,800 ND ND ND Jan 04 1979.99 25.50 1954.49 6.9 2.1 NM 1.1 22.60 NM NM 290 2.8 ND ND May 05 1979.99 22.58 1957.41 7.2 1.3 NM 5.0 23.60 NM 131 1,460 ND ND ND Dec 05 1979.99 23.55 1956.44 6.8 4.4 NM 0.8 20.50 2.8 272 1,800 ND ND ND Mar 06 1979.99 NM NM NM NM NM NM NM NM NM NS NS NS NS Jun 06 1979.99 25.48 1954.51 NM 3.8 736.0 6.9 28.60 2.1 70 2,100 ND ND ND Oct 06 1979.99 25.04 1954.95 6.1 2.6 >999 4.1 23.70 1.8 234 2,000 ND ND ND Dec 06 1979.99 24.85 1955.14 6.8 4.1 284.0 4.3 23.90 2.6 245 2,500 ND ND ND Mar 07 1979.99 26.63 1953.36 6.9 3.3 999.0 9.8 23.80 2.2 530 1,500 ND ND ND Jun 07 1979.99 26.76 1953.23 7.0 3.5 >999 5.4 23.80 2.2 346 1,300 ND ND ND Sep 07 1979.99 26.30 1953.69 6.8 3.3 248.0 4.4 32.50 2.1 207 730 ND ND ND Dec 07 1979.99 25.38 1954.61 6.3 3.8 24.6 5.4 21.90 2.4 180 1,400 ND ND ND Mar 08 1979.99 25.12 1954.87 6.9 3.5 33.0 4.0 23.60 2.3 184 1,600 NS NS NS Jun 08 1979.99 NM NM NM NM NM NM NM NM NM 1,200 ND ND ND Oct 08 1979.95 26.05 1953.90 7.3 3.5 -5.0 2.3 25.20 NM 181 1,000 3.5 ND ND Feb 09 1979.95 25.57 1954.38 6.6 3.5 247.0 2.5 23.40 2.2 99 830 ND ND ND Jun 09 1979.95 26.45 1953.50 6.9 3.7 >-5.0 2.2 23.90 2.3 140 1,100 3.3 ND ND Sep 09 1979.95 27.21 1952.74 6.5 4.1 386.0 2.5 25.70 2.6 146 940 ND ND ND Nov 09 1979.95 27.30 1952.65 5.8 3.4 380.0 1.9 25.30 2.2 142 640 2.2 ND ND Feb 10 1979.95 27.54 1952.41 6.9 3.3 38.0 2.5 24.30 2.0 130 990 3.3 ND ND Jun 10 1979.95 27.86 1952.09 7.0 3.2 1.4 3.5 24.59 NM NM 780 2.4 ND ND Oct 10 1979.95 27.35 1952.60 6.4 3.3 39.3 2.9 26.58 2.2 519 340 1.8 ND ND Nov 10 1979.95 27.12 1952.83 6.6 3.4 0.9 3.0 25.50 NM 194 890 2.6 ND ND Mar 11 1979.95 26.59 1953.36 6.9 3.5 49.7 3.4 25.69 NM 237 800 2.3 ND NDJun 11 1979.95 27.40 1952.55 6.8 3.5 3.1 3.5 31.92 NM 452 740 1.9 ND NDSep 11 1979.95 27.56 1952.39 6.9 3.6 20.0 3.4 26.50 2.2 182 680 1.8 ND NDNov 11 1979.95 27.35 1952.60 7.0 3.3 NM 2.8 24.35 2.2 131 800 1.9 ND NDMar 12 1979.95 NM NM NM NM NM NM NM NM NM NS NS NS NS
* Jun 12 1979.82 27.62 1952.20 7.4 3.3 40.1 3.7 25.17 2.2 87 660 2.1 ND NDSep 12 1979.82 NM NM NM NM NM NM NM NM NM NS NS NS NS Nov 12 1979.82 NM NM NM NM NM NM NM NM NM NS NS NS NSMar 13 1979.82 NM NM NM NM NM NM NM NM NM 290 1.8 <0.50 <0.50Jun 13 1979.82 27.20 1952.62 7.2 3.7 NM 4.7 26.67 2.4 192 660 2.1 <0.50 <0.50Sep 13 1979.82 27.70 1952.12 7.0 3.5 NM 4.5 26.41 2.3 428 570 1.8 <0.50 <0.50Nov 13 1979.82 27.28 1952.54 6.1 3.4 21.8 2.5 25.53 2.2 245 530 1.4 <0.50 <0.50Mar 14 1979.82 26.46 1953.36 7.3 3.1 22.0 3.9 25.92 2.0 345 170 0.66 <0.50 <0.50Jun 14 1979.82 NM NM NM NM NM NM NM NM NM NS NS NS NSSep 14 1979.82 NM NM NM NM NM NM NM NM NM NS NS NS NSNov 14 1979.82 NM NM NM NM NM NM NM NM NM NS NS NS NSMar 15 1979.82 26.34 1953.48 6.4 3.6 25.0 2.1 23.14 2.4 210 680 2.3 <0.50 <0.50

Maryland Square PCE SiteCardno ATC
Page 28 of 47
Well ID Date
Top of Casing
Elevation (feet msl)
Depth to Groundwater Level (feet)
Groundwater Elevation (feet msl)
pH Specific
Conductance (mS/cm)
Turbidity
(NTU)
Dissolved Oxygen (mg/L)
Temp (ºC) TDS (g/L)
ORP (mV)
PCE (μg/L)
TCE (μg/L)
cis-1,2-DCE
(μg/L)
Vinyl Chloride
(μg/L)
Table A-2: Historical Groundwater Gauging and Analytical DataMaryland Square Shopping Center
MW-20D1 Mar 13 NM NM NM NM NM NM NM NM NM NM 69 2.8 3.6 <0.50Jun 13 1978.81 26.17 1952.64 7.3 3.0 NM 5.2 27.38 2.0 115 110 <0.50 <0.50 <0.50Sep 13 1978.81 27.01 1951.80 7.1 3.4 NM 4.8 27.83 2.2 113 100 0.56 <0.50 <0.50Nov 13 1978.81 26.60 1952.21 7.1 3.3 83.3 4.5 25.16 2.2 57 260 0.86 <0.50 <0.50Mar 14 1978.81 25.70 1953.11 7.4 0.9 70.4 4.9 25.09 0.6 76 76 <0.50 <0.50 <0.50Jun 14 1978.81 NM NM NM NM NM NM NM NM NM NS NS NS NSSep 14 1979.81 27.05 1952.76 7.6 3.1 29.1 4.0 27.20 2.0 213 160 0.62 <0.50 <0.50Nov 14 1979.81 NM NM NM NM NM NM NM NM NM NS NS NS NSMar 15 1979.81 25.56 1954.25 6.3 2.4 45.5 2.0 25.17 1.6 191 340 0.98 <0.50 <0.50
MW-20D2 Mar 13 NM NM NM NM NM NM NM NM NM NM 25 <0.50 <0.50 <0.50Jun 13 1978.66 26.23 1952.43 7.4 0.8 NM 4.6 25.83 0.5 107 64 <0.50 <0.50 <0.50Sep 13 1978.66 26.90 1951.76 7.0 3.5 NM 4.2 27.95 2.3 114 210 0.77 <0.50 <0.50Nov 13 1978.66 26.92 1951.74 6.7 2.5 9.0 4.3 24.88 1.6 75 160 1.0 0.81 <0.50Mar 14 1978.66 26.05 1952.61 7.4 0.5 11.1 5.4 23.88 0.3 68 11 <0.50 <0.50 <0.50Jun 14 1978.66 26.55 1952.11 7.3 2.1 9.3 5.5 27.33 1.4 77 120 0.78 <0.50 <0.50Sep 14 1978.66 27.21 1951.45 7.4 3.4 7.5 3.9 25.21 2.2 229 140 0.84 <0.50 <0.50Nov 14 1978.66 26.28 1952.38 7.2 3.2 10.3 12.2 24.38 2.1 142 410 2.20 0.78 <0.50Mar 15 1978.66 25.95 1952.71 6.7 2.2 26.7 6.3 26.88 1.5 180 230 1.9 0.96 <0.50
MW-20D3 Mar 13 NM NM NM NM NM NM NM NM NM NM 0.66 <0.50 <0.50 <0.50Jun 13 1978.69 26.17 1952.52 7.1 0.5 NM 3.9 24.81 0.3 119 <0.50 <0.50 <0.50 <0.50Sep 13 1978.69 27.28 1951.41 7.1 3.0 NM 4.9 33.54 1.9 100 25 <0.50 0.80 <0.50Nov 13 1978.69 26.57 1952.12 6.9 1.4 31.9 4.0 24.89 0.9 81 62 <0.50 <0.50 <0.50Mar 14 1978.69 22.92 1955.77 7.4 0.5 61.1 4.8 23.65 0.3 277 7.9 <0.50 <0.50 <0.50Jun 14 1978.69 NM NM NM NM NM NM NM NM NM NS NS NS NSSep 14 1978.69 31.52 1947.17 7.4 0.8 37.2 3.9 28.12 0.5 215 9.6 <0.50 <0.50 <0.50Nov 14 1978.69 NM NM NM NM NM NM NM NM NM NS NS NS NSMar 15 1978.69 20.10 1958.59 6.8 0.5 11.7 3.2 24.48 0.3 208 <0.50 <0.50 <0.50 <0.50

Maryland Square PCE SiteCardno ATC
Page 29 of 47
Well ID Date
Top of Casing
Elevation (feet msl)
Depth to Groundwater Level (feet)
Groundwater Elevation (feet msl)
pH Specific
Conductance (mS/cm)
Turbidity
(NTU)
Dissolved Oxygen (mg/L)
Temp (ºC) TDS (g/L)
ORP (mV)
PCE (μg/L)
TCE (μg/L)
cis-1,2-DCE
(μg/L)
Vinyl Chloride
(μg/L)
Table A-2: Historical Groundwater Gauging and Analytical DataMaryland Square Shopping Center
MW-21 Nov 03 NM NM NM NM NM NM NM NM NM NM 51 ND ND ND Jan 04 1979.56 24.72 1954.84 6.9 2.0 NM 1.1 22.30 NM NM 55 ND ND ND May 05 1979.56 21.76 1957.80 7.1 2.8 NM 2.9 24.60 NM 131 30 ND ND ND Sep 05 1979.56 22.70 1956.86 7.1 4.7 39.0 4.1 25.80 2.6 109 19 2.4 1.5 ND Dec 05 1979.56 22.85 1956.71 6.6 4.6 >999 0.5 24.30 2.9 264 16 1.8 1.3 ND Mar 06 1979.56 23.46 1956.10 5.5 3.6 140.0 NM 23.00 2.3 309 43 ND ND ND Jun 06 1979.56 24.68 1954.88 NM 3.5 >999 4.7 28.50 2.3 112 32 ND ND ND Oct 06 1979.56 24.35 1955.21 6.2 3.5 >999 2.0 24.10 2.2 79 23 ND ND ND Dec 06 1979.56 24.15 1955.41 6.7 4.5 617.0 2.7 24.00 2.9 89 39 ND ND ND Mar 07 1979.56 24.87 1954.69 NM NM NM NM NM NM NM NS NS NS NS Jun 07 1979.56 25.95 1953.61 7.0 3.4 >999 4.2 24.20 2.2 373 28 ND ND ND Sep 07 1979.56 25.44 1954.12 NM NM NM NM NM NM NM NS NS NS NS Dec 07 1979.56 24.34 1955.22 6.2 3.7 >999 4.4 19.30 2.4 117 83 ND ND ND Mar 08 1979.56 24.19 1955.37 NM NM NM NM NM NM NM NS NS NS NS Jun 08 1979.56 NM NM NM NM NM NM NM NM NM NS NS NS NS Oct 08 1979.54 24.80 1954.74 7.2 3.4 545.0 0.0 24.50 NM 173 20 ND ND ND Feb 09 1979.54 24.73 1954.81 NM NM NM NM NM NM NM NS NS NS NS Jun 09 1979.54 25.53 1954.01 NM NM NM NM NM NM NM NS NS NS NS Sep 09 1979.54 26.39 1953.15 NM NM NM NM NM NM NM NS NS NS NS Nov 09 1979.54 26.40 1953.14 6.0 3.4 90.0 0.9 24.90 2.2 119 11 ND ND ND Feb 10 1979.54 26.14 1953.40 NM NM NM NM NM NM NM NS NS NS NS Jun 10 1979.54 NM NM NM NM NM NM NM NM NM NS NS NS NS Oct 10 1979.54 NM NM NM NM NM NM NM NM NM NS NS NS NS Nov 10 1979.54 26.32 1953.22 6.6 3.5 2.6 0.3 25.18 NM 202 13 ND ND NDMar 11 1979.54 25.68 1953.86 NM NM NM NM NM NM NM NS NS NS NS Jun 11 1979.54 26.57 1952.97 NM NM NM NM NM NM NM NS NS NS NSSep 11 1979.54 26.67 1952.87 NM NM NM NM NM NM NM NS NS NS NS Nov 11 1979.54 26.47 1953.07 6.8 4.0 NM 0.2 24.75 NM -38 13 ND ND NDMar 12 1979.54 NM NM NM NM NM NM NM NM NM NS NS NS NS
* Jun 12 1979.25 26.77 1952.48 7.3 3.4 8.6 1.0 26.21 2.2 -127 9.4 ND ND NDSep 12 1979.25 NM NM NM NM NM NM NM NM NM NS NS NS NSNov 12 1979.25 NM NM NM NM NM NM NM NM NM NS NS NS NSMar 13 1979.25 25.03 1954.22 6.9 3.7 NM 0.2 24.49 2.4 107 8.4 <0.50 <0.50 <0.50Jun 13 1979.25 NM NM NM NM NM NM NM NM NM NS NS NS NSSep 13 1979.25 NM NM NM NM NM NM NM NM NM NS NS NS NSNov 13 1979.25 NM NM NM NM NM NM NM NM NM NS NS NS NSMar 14 1979.25 25.58 1953.67 7.2 3.1 61.2 2.7 23.96 2.0 430 1.4 <0.50 <0.50 <0.50Jun 14 1979.25 NM NM NM NM NM NM NM NM NM NS NS NS NSSep 14 1979.25 NM NM NM NM NM NM NM NM NM NS NS NS NSNov 14 1979.25 NM NM NM NM NM NM NM NM NM NS NS NS NSMar 15 1979.25 25.37 1953.88 6.7 3.5 17.3 0.4 25.03 2.3 46 11 <0.50 <0.50 <0.50

Maryland Square PCE SiteCardno ATC
Page 30 of 47
Well ID Date
Top of Casing
Elevation (feet msl)
Depth to Groundwater Level (feet)
Groundwater Elevation (feet msl)
pH Specific
Conductance (mS/cm)
Turbidity
(NTU)
Dissolved Oxygen (mg/L)
Temp (ºC) TDS (g/L)
ORP (mV)
PCE (μg/L)
TCE (μg/L)
cis-1,2-DCE
(μg/L)
Vinyl Chloride
(μg/L)
Table A-2: Historical Groundwater Gauging and Analytical DataMaryland Square Shopping Center
MW-22 May 05 1974.76 23.04 1951.72 6.8 3.9 474.0 1.7 24.10 NM 46 ND ND ND ND Sep 05 1974.76 24.18 1950.58 6.9 4.3 10.0 7.2 23.90 2.7 46 ND ND ND ND Dec 05 1974.76 24.30 1950.46 6.4 4.2 NM 1.3 24.60 2.7 213 1 ND ND ND Mar 06 1974.76 24.68 1950.08 4.8 6.1 30.0 NM 24.00 3.8 269 ND ND ND ND Jun 06 1974.76 25.91 1948.85 NM 3.4 287.0 6.0 26.40 2.2 376 ND ND ND ND Oct 06 1974.76 25.79 1948.97 6.0 3.7 11.0 2.4 23.80 2.4 141 ND ND ND ND Dec 06 1974.76 25.49 1949.27 6.5 4.5 0.0 3.5 23.50 2.9 477 ND ND ND ND Mar 07 1974.76 24.73 1950.03 NM NM NM NM NM NM NM NS NS NS NS Jun 07 1974.76 26.91 1947.85 6.7 3.8 26.0 3.4 24.30 2.4 137 ND ND ND ND Sep 07 1974.76 26.90 1947.86 NM NM NM NM NM NM NM NS NS NS NS Dec 07 1974.76 25.88 1948.88 6.3 4.0 55.6 2.3 23.80 2.5 216 ND ND ND ND Mar 08 1974.76 25.17 1949.59 NM NM NM NM NM NM NM NS NS NS NS Jun 08 1974.76 NM NM NM NM NM NM NM NM NM NS NS NS NS Oct 08 1974.75 NM NM NM NM NM NM NM NM NM NS NS NS NS Feb 09 1974.75 25.60 1949.15 NM NM NM NM NM NM NM NS NS NS NS Jun 09 1974.75 26.59 1948.16 NM NM NM NM NM NM NM NS NS NS NS Sep 09 1974.75 27.58 1947.17 NM NM NM NM NM NM NM NS NS NS NS Nov 09 1974.75 27.38 1947.37 6.0 3.6 31.0 1.4 24.50 2.3 131 1.4 ND ND ND Feb 10 1974.75 NM NM NM NM NM NM NM NM NM NS NS NS NS Jun 10 1974.75 NM NM NM NM NM NM NM NM NM NS NS NS NS Oct 10 1974.75 27.82 1946.93 NM NM NM NM NM NM NM NS NS NS NS Nov 10 1974.75 27.55 1947.20 6.7 3.7 0.1 1.6 24.30 NM 129 ND ND ND NDMar 11 1974.75 26.58 1948.17 NM NM NM NM NM NM NM NS NS NS NS Jun 11 1974.75 27.45 1947.30 7.2 3.4 50.2 5.2 24.89 NM 266 NS NS NS NSSep 11 1974.75 27.87 1946.88 NM NM NM NM NM NM NM NS NS NS NS Nov 11 1974.75 27.57 1947.18 6.9 3.6 NM 1.6 23.70 2.3 88 0.55 ND ND NDMar 12 1974.75 NM NM NM NM NM NM NM NM NM NS NS NS NS
* Jun 12 1975.19 28.05 1947.14 6.8 4.1 250.0 4.0 26.20 2.6 102 0.58 ND ND NDSep 12 1975.19 NM NM NM NM NM NM NM NM NM NS NS NS NSNov 12 1975.19 NM NM NM NM NM NM NM NM NM NS NS NS NSMar 13 1975.19 26.27 1948.92 6.9 3.9 NM 1.7 23.49 2.5 140 <0.50 <0.50 <0.50 <0.50Jun 13 1975.19 NM NM NM NM NM NM NM NM NM NS NS NS NSSep 13 1975.19 NM NM NM NM NM NM NM NM NM NS NS NS NSNov 13 1975.19 NM NM NM NM NM NM NM NM NM NS NS NS NSMar 14 1975.19 26.95 1948.24 7.3 3.3 120.0 5.0 24.37 2.2 17 0.58 <0.50 <0.50 <0.50Jun 14 1975.19 NM NM NM NM NM NM NM NM NM NS NS NS NSSep 14 1975.19 NM NM NM NM NM NM NM NM NM NS NS NS NSNov 14 1975.19 NM NM NM NM NM NM NM NM NM NS NS NS NSMar 15 1975.19 26.47 1948.72 6.6 3.6 4.9 0.9 21.25 2.4 93 <0.50 <0.50 <0.50 <0.50

Maryland Square PCE SiteCardno ATC
Page 31 of 47
Well ID Date
Top of Casing
Elevation (feet msl)
Depth to Groundwater Level (feet)
Groundwater Elevation (feet msl)
pH Specific
Conductance (mS/cm)
Turbidity
(NTU)
Dissolved Oxygen (mg/L)
Temp (ºC) TDS (g/L)
ORP (mV)
PCE (μg/L)
TCE (μg/L)
cis-1,2-DCE
(μg/L)
Vinyl Chloride
(μg/L)
Table A-2: Historical Groundwater Gauging and Analytical DataMaryland Square Shopping Center
MW-23 May 05 1962.32 13.06 1949.26 7.0 3.6 NM 2.6 24.50 NM 121 1,430 ND ND ND Dec 05 1962.32 14.05 1948.27 6.7 4.9 NM 2.1 24.90 3.1 320 1,900 ND ND ND Mar 06 1962.32 NM NM NM NM NM NM NM NM NM NS NS NS NS Jun 06 1962.32 15.60 1946.72 NM 3.7 318.0 5.8 23.80 2.3 238 1,500 ND ND ND Oct 06 1962.32 15.48 1946.84 6.3 3.5 0.0 2.5 24.00 2.2 107 2,000 ND ND ND Dec 06 1962.32 15.16 1947.16 6.8 4.2 0.0 3.2 24.20 2.7 2 2,100 ND ND ND Mar 07 1962.32 15.12 1947.20 NM NM NM NM NM NM NM 2.1 ND ND ND Jun 07 1962.32 16.40 1945.92 7.0 3.5 31.0 4.2 23.50 2.2 301 1,300 ND ND ND Sep 07 1962.32 16.61 1945.71 6.8 3.3 1.0 3.8 25.80 2.1 204 750 ND ND ND Dec 07 1962.32 15.80 1946.52 6.3 3.7 0.0 5.5 22.10 2.4 250 1,200 ND ND ND Mar 08 1962.32 15.18 1947.14 7.0 6.3 0.4 2.2 24.00 4.1 188 1,400 ND ND ND Jun 08 1962.32 NM NM NM NM NM NM NM NM NM 1,100 ND ND ND Oct 08 1962.29 16.34 1945.95 6.7 3.5 18.3 2.0 23.40 2.3 170 1,300 4.4 ND ND Feb 09 1962.29 15.41 1946.88 6.7 3.4 0.0 1.1 23.00 2.2 82 1,100 ND ND ND Jun 09 1962.29 16.40 1945.89 7.2 3.6 7.1 0.6 23.80 2.3 124 1,400 4.6 ND ND Sep 09 1962.29 17.30 1944.99 6.6 4.0 24.5 2.0 25.40 2.5 133 1,200 ND ND ND Nov 09 1962.29 17.31 1944.98 5.9 3.3 51.0 2.0 24.80 2.1 139 880 3.2 ND ND Feb 10 1962.29 17.18 1945.11 6.8 3.4 9.0 1.8 23.70 2.2 135 1,000 3.8 ND ND Jun 10 1962.29 16.93 1945.36 7.0 3.2 3.8 4.2 26.24 NM NM 900 2.6 ND ND Oct 10 1962.29 17.53 1944.76 5.7 3.4 -0.1 2.2 23.60 2.2 610 1,100 2.6 ND ND Nov 10 1962.29 17.30 1944.99 7.0 3.4 0.1 2.5 22.72 NM 76 970 2.7 ND ND Mar 11 1962.29 16.30 1945.99 6.9 3.6 2.9 1.9 23.42 NM 202 1,100 2.5 ND NDJun 11 1962.29 17.22 1945.07 NM NM NM NM NM NM NM 970 2.3 ND NDSep 11 1962.29 17.67 1944.62 6.9 3.5 8.0 3.0 24.50 2.2 229 1,000 2.4 ND NDNov 11 1962.29 17.41 1944.88 7.0 3.3 NM 2.3 23.58 2.1 170 1,100 2.4 ND NDMar 12 1962.29 NM NM NM NM NM NM NM NM NM NS NS NS NS
* Jun 12 1962.45 17.83 1944.62 7.3 3.2 5.1 5.8 24.66 2.1 114 950 2.3 ND NDSep 12 1962.45 NM NM NM NM NM NM NM NM NM NS NS NS NS Nov 12 1962.45 NM NM NM NM NM NM NM NM NM NS NS NS NSMar 13 1962.45 15.95 1946.50 7.0 3.6 NM 1.4 23.52 2.4 107 960 2.2 <0.50 <0.50Jun 13 1962.45 NM NM NM NM NM NM NM NM NM NS NS NS NSSep 13 1962.45 NM NM NM NM NM NM NM NM NM NS NS NS NSNov 13 1962.45 17.57 1944.88 6.7 3.7 5.1 2.1 24.32 2.4 152 900 1.8 <0.50 <0.50Mar 14 1962.45 16.63 1945.82 7.2 3.2 46.2 2.5 18.77 2.1 226 170 0.63 <0.50 <0.50Jun 14 1962.45 17.74 1944.71 6.9 3.4 6.0 2.4 27.06 2.2 151 850 1.4 <0.50 <0.50Sep 14 1962.45 17.89 1944.56 7.9 2.8 57.4 3.2 26.69 1.9 95 120 <0.50 <0.50 <0.50Nov 14 1962.45 17.19 1945.26 7.0 3.5 2.4 2.1 23.68 2.3 11 870 1.7 <0.50 <0.50Mar 15 1962.45 16.50 1945.95 6.7 3.4 5.4 2.0 21.66 2.2 58 740 1.5 <0.50 <0.50

Maryland Square PCE SiteCardno ATC
Page 32 of 47
Well ID Date
Top of Casing
Elevation (feet msl)
Depth to Groundwater Level (feet)
Groundwater Elevation (feet msl)
pH Specific
Conductance (mS/cm)
Turbidity
(NTU)
Dissolved Oxygen (mg/L)
Temp (ºC) TDS (g/L)
ORP (mV)
PCE (μg/L)
TCE (μg/L)
cis-1,2-DCE
(μg/L)
Vinyl Chloride
(μg/L)
Table A-2: Historical Groundwater Gauging and Analytical DataMaryland Square Shopping Center
MW-24 May 05 1960.74 10.72 1950.02 7.0 3.6 >999 1.5 23.10 NM 76 ND ND ND ND Sep 05 1960.74 11.75 1948.99 7.0 3.8 25.0 3.6 25.80 2.4 5 4.3 ND ND ND Dec 05 1960.74 11.65 1949.09 6.6 4.5 29.0 1.0 25.60 2.7 183 6.7 ND ND ND Mar 06 1960.74 12.10 1948.64 4.7 6.0 1.0 NM 22.60 3.8 503 6.5 ND ND ND Jun 06 1960.74 13.16 1947.58 NM 3.4 201.0 5.1 25.10 2.2 132 5.6 ND ND ND Oct 06 1960.74 13.06 1947.68 6.2 3.2 0.0 1.2 25.50 2.0 -23 2.6 ND ND ND Dec 06 1960.74 12.80 1947.94 6.9 4.1 0.0 2.6 25.10 2.6 62 2.6 ND ND ND Mar 07 1960.74 12.88 1947.86 NM NM NM NM NM NM NM 1 ND ND ND Jun 07 1960.74 13.94 1946.80 7.1 3.3 23.0 2.5 23.20 2.1 409 ND ND ND ND Sep 07 1960.74 14.24 1946.50 NM NM NM NM NM NM NM NS NS NS NS Dec 07 1960.74 13.58 1947.16 6.2 3.5 0.0 1.7 24.40 2.2 118 NS NS NS NS Mar 08 1960.74 12.98 1947.76 NM NM NM NM NM NM NM NS NS NS NS Jun 08 1960.74 NM NM NM NM NM NM NM NM NM NS NS NS NS Oct 08 1960.73 14.03 1946.70 6.8 3.4 -2.3 1.1 25.20 2.1 152 6.1 ND ND ND Feb 09 1960.73 13.20 1947.53 NM NM NM NM NM NM NM NS NS NS NS Jun 09 1960.73 14.10 1946.63 NM NM NM NM NM NM NM NS NS NS NS Sep 09 1960.73 14.93 1945.80 NM NM NM NM NM NM NM NS NS NS NS Nov 09 1960.73 14.99 1945.74 5.9 3.1 45.0 1.4 26.50 1.9 130 2.9 ND ND ND Feb 10 1960.73 14.23 1946.50 NM NM NM NM NM NM NM NS NS NS NS Jun 10 1960.73 NM NM NM NM NM NM NM NM NM NS NS NS NS Oct 10 1960.73 15.16 1945.57 NM NM NM NM NM NM NM NS NS NS NS Nov 10 1960.73 14.90 1945.83 7.0 3.2 -0.8 1.4 25.24 NM 68 0.81 ND ND NDMar 11 1960.73 14.06 1946.67 NM NM NM NM NM NM NM NS NS NS NS Jun 11 1960.73 14.89 1945.84 NM NM NM NM NM NM NM NS NS NS NSSep 11 1960.73 15.31 1945.42 NM NM NM NM NM NM NM NS NS NS NS Nov 11 1960.73 15.12 1945.61 7.0 3.1 NM 1.3 24.98 2.0 149 0.95 ND ND NDMar 12 1960.73 NM NM NM NM NM NM NM NM NM NS NS NS NS
* Jun 12 1960.82 15.49 1945.33 6.9 3.4 110.0 1.8 25.00 2.2 94 1.3 ND ND NDSep 12 1960.82 NM NM NM NM NM NM NM NM NM NS NS NS NSNov 12 1960.82 NM NM NM NM NM NM NM NM NM NS NS NS NSMar 13 1960.82 13.62 1947.20 7.1 3.6 NM 1.8 22.77 2.3 62 1.3 <0.50 <0.50 <0.50Jun 13 1960.82 NM NM NM NM NM NM NM NM NM NS NS NS NSSep 13 1960.82 NM NM NM NM NM NM NM NM NM NS NS NS NSNov 13 1960.82 NM NM NM NM NM NM NM NM NM NS NS NS NSMar 14 1960.82 14.34 1946.48 7.3 3.0 10.2 2.4 20.18 1.9 42 2.0 <0.50 <0.50 <0.50Jun 14 1960.82 NM NM NM NM NM NM NM NM NM NS NS NS NSSep 14 1960.82 NM NM NM NM NM NM NM NM NM NS NS NS NSNov 14 1960.82 NM NM NM NM NM NM NM NM NM NS NS NS NSMar 15 1960.82 14.32 1946.50 6.7 3.3 3.6 1.3 22.86 2.1 79 0.58 <0.50 <0.50 <0.50

Maryland Square PCE SiteCardno ATC
Page 33 of 47
Well ID Date
Top of Casing
Elevation (feet msl)
Depth to Groundwater Level (feet)
Groundwater Elevation (feet msl)
pH Specific
Conductance (mS/cm)
Turbidity
(NTU)
Dissolved Oxygen (mg/L)
Temp (ºC) TDS (g/L)
ORP (mV)
PCE (μg/L)
TCE (μg/L)
cis-1,2-DCE
(μg/L)
Vinyl Chloride
(μg/L)
Table A-2: Historical Groundwater Gauging and Analytical DataMaryland Square Shopping Center
MW-25 May 05 1960.74 16.01 1944.73 7.0 4.0 >999 4.3 23.60 NM 141 993 ND ND ND Sep 05 1960.74 17.45 1943.29 7.0 4.2 30.0 5.1 26.20 2.7 57 920 ND ND ND Dec 05 1960.74 16.85 1943.89 6.6 5.3 0.0 1.4 24.70 3.3 417 1,000 ND ND ND Mar 06 1960.74 17.30 1943.44 5.2 6.7 94.0 NM 23.60 4.2 255 970 ND ND ND Jun 06 1960.74 18.64 1942.10 NM 3.9 228.0 5.7 23.50 2.5 376 960 ND ND ND Oct 06 1960.74 18.75 1941.99 6.2 3.7 0.0 3.1 23.60 2.4 106 1,300 ND ND ND Dec 06 1960.74 18.61 1942.13 6.7 4.5 0.0 3.8 23.90 2.8 429 1,200 ND ND ND Mar 07 1960.74 17.72 1943.02 7.0 3.7 >999 7.5 23.30 2.4 258 670 ND ND ND Jun 07 1960.74 19.31 1941.43 7.0 3.7 50.0 4.5 23.00 2.4 485 960 ND ND ND Sep 07 1960.74 19.96 1940.78 6.7 3.5 15.0 3.6 27.00 2.3 195 560 ND ND ND Dec 07 1960.74 18.92 1941.82 6.3 3.9 0.0 4.8 19.40 2.5 168 780 ND ND ND Mar 08 1960.74 17.87 1942.87 6.9 3.7 11.9 2.5 24.40 2.3 170 890 ND ND ND Jun 08 1960.74 NM NM NM NM NM NM NM NM NM 630 ND ND ND Oct 08 1960.73 19.84 1940.89 6.8 3.7 30.2 2.3 23.50 2.4 -94 730 1.5 ND ND Feb 09 1960.73 18.07 1942.66 6.7 3.5 0.0 2.1 23.70 2.3 66 770 ND ND ND Jun 09 1960.73 19.35 1941.38 7.2 3.7 6.9 1.2 24.10 2.4 127 880 2.0 ND ND Sep 09 1960.73 18.60 1942.13 6.5 4.2 14.2 2.5 25.90 2.7 136 770 ND ND ND Nov 09 1960.73 20.65 1940.08 5.8 3.5 66.0 2.2 24.70 2.2 140 570 1.3 ND ND Feb 10 1960.73 19.81 1940.92 6.8 3.5 9.0 2.2 22.50 2.2 122 460 2.3 ND ND Jun 10 1960.73 19.85 1940.88 7.0 3.3 -0.1 5.5 26.26 NM NM 550 0.9 ND ND Oct 10 1960.73 20.85 1939.88 5.9 3.5 -0.7 2.4 24.21 2.3 603 760 0.9 ND ND Nov 10 1960.73 20.62 1940.11 6.7 3.5 0.5 2.8 25.16 NM 182 550 0.9 ND NDMar 11 1960.73 18.97 1941.76 7.0 3.4 0.0 4.1 20.24 NM 115 420 0.6 ND NDJun 11 1960.73 19.83 1940.90 7.3 3.6 -1.2 2.4 24.31 NM 216 700 0.8 ND NDSep 11 1960.73 20.83 1939.90 6.9 3.7 4.0 2.9 24.00 2.3 257 680 0.8 ND NDNov 11 1960.73 20.62 1940.11 7.0 3.4 NM 2.3 23.26 2.2 166 740 0.82 ND NDMar 12 1960.73 NM NM NM NM NM NM NM NM NM NS NS NS NS
* Jun 12 1959.29 21.06 1938.23 6.8 3.9 56.0 2.9 25.20 2.5 89 640 0.88 ND NDSep 12 1959.29 NM NM NM NM NM NM NM NM NM NS NS NS NSNov 12 1959.29 NM NM NM NM NM NM NM NM NM NS NS NS NSMar 13 1959.29 18.75 1940.54 7.0 3.8 NM 2.3 23.84 2.5 127 660 0.75 <0.50 <0.50Jun 13 1959.29 NM NM NM NM NM NM NM NM NM NS NS NS NSSep 13 1959.29 NM NM NM NM NM NM NM NM NM NS NS NS NSNov 13 1959.29 20.87 1938.42 6.2 3.9 6.5 1.4 24.38 2.5 114 700 0.88 <0.50 <0.50Mar 14 1959.29 19.48 1939.81 5.9 3.3 28.3 2.7 15.90 2.1 229 340 0.61 <0.50 <0.50Jun 14 1959.29 20.94 1938.35 6.9 3.6 3.9 2.3 27.02 2.4 258 780 0.69 <0.50 <0.50Sep 14 1959.29 20.82 1938.47 7.5 3.5 47.8 NM 27.69 2.3 90 550 <0.50 <0.50 <0.50Nov 14 1959.29 20.32 1938.97 7.0 3.7 2.4 1.6 22.93 2.4 24 590 0.91 <0.50 <0.50Mar 15 1959.29 19.25 1940.04 6.7 3.6 4.5 1.2 22.82 2.4 53 640 0.71 <0.50 <0.50

Maryland Square PCE SiteCardno ATC
Page 34 of 47
Well ID Date
Top of Casing
Elevation (feet msl)
Depth to Groundwater Level (feet)
Groundwater Elevation (feet msl)
pH Specific
Conductance (mS/cm)
Turbidity
(NTU)
Dissolved Oxygen (mg/L)
Temp (ºC) TDS (g/L)
ORP (mV)
PCE (μg/L)
TCE (μg/L)
cis-1,2-DCE
(μg/L)
Vinyl Chloride
(μg/L)
Table A-2: Historical Groundwater Gauging and Analytical DataMaryland Square Shopping Center
MW-26 Mar 06 1953.48 15.60 1937.88 6.8 3.8 0.0 2.6 23.80 2.4 158 730 ND ND ND Jun 06 1953.48 17.00 1936.48 NM 2.3 229.0 4.8 24.10 1.5 305 770 ND ND ND Oct 06 1953.48 17.17 1936.31 6.2 69.4 0.0 2.9 23.70 2.4 180 1,100 ND ND ND Dec 06 1953.48 NM NM NM NM NM NM NM NM NM NS NS NS NS Mar 07 1953.48 15.66 1937.82 7.0 3.8 >999 7.1 23.50 2.4 422 790 ND ND ND Jun 07 1953.48 17.50 1935.98 7.0 3.5 41.0 4.8 23.60 2.5 517 960 ND ND ND Sep 07 1953.48 18.12 1935.36 6.7 3.6 5.0 3.5 27.10 2.3 176 620 ND ND ND Dec 07 1953.48 17.01 1936.47 6.4 4.0 0.0 5.1 21.70 2.5 212 910 ND ND ND Mar 08 1953.48 15.91 1937.57 7.0 3.8 0.7 7.9 24.30 2.4 176 1,100 ND ND ND Jun 08 1953.48 NM NM NM NM NM NM NM NM NM 930 ND ND ND Oct 08 1953.48 18.34 1935.14 6.8 3.9 -7.2 2.7 24.00 2.5 86 900 1.4 ND ND Feb 09 1953.48 16.04 1937.44 6.7 3.7 0.0 3.3 23.90 2.3 82 960 ND ND ND Jun 09 1953.48 17.57 1935.91 7.2 3.8 49.3 2.2 25.40 2.5 133 970 1.5 ND ND Sep 09 1953.48 18.79 1934.69 6.6 4.3 10.5 2.8 26.40 2.8 137 910 ND ND ND Nov 09 1953.48 18.85 1934.63 5.8 3.6 210.0 2.8 24.30 2.3 139 690 ND ND ND Feb 10 1953.48 17.61 1935.87 6.9 3.6 7.0 2.5 22.60 2.3 143 790 1.8 ND ND Jun 10 1953.48 17.95 1935.53 7.0 2.4 0.2 6.6 26.14 NM NM 680 0.7 ND ND Oct 10 1953.48 19.09 1934.39 6.8 3.7 -0.8 2.0 24.60 2.4 504 450 0.6 ND ND Nov 10 1953.48 18.75 1934.73 6.9 3.7 0.6 2.6 24.91 NM 92 750 0.7 ND NDMar 11 1953.48 18.83 1934.65 6.9 3.8 0.0 2.7 23.78 NM 141 760 0.6 ND NDJun 11 1953.48 17.82 1935.66 6.7 3.7 -1.2 2.0 25.86 NM 475 860 0.67 ND NDSep 11 1953.48 19.04 1934.44 6.9 3.8 7.0 2.9 24.40 2.4 260 780 0.6 ND NDNov 11 1953.48 18.72 1934.76 7.0 3.6 NM 2.1 23.33 2.3 161 690 0.61 ND NDMar 12 1953.48 NM NM NM NM NM NM NM NM NM NS NS NS NS
* Jun 12 1953.45 19.24 1934.21 6.8 4.1 72.0 2.8 26.00 2.6 85 740 0.54 ND NDSep 12 1953.45 NM NM NM NM NM NM NM NM NM NS NS NS NS Nov 12 1953.45 NM NM NM NM NM NM NM NM NM NS NS NS NSMar 13 1953.45 16.81 1936.64 7.0 3.8 NM 2.7 24.35 2.6 118 740 0.51 <0.50 <0.50Jun 13 1953.45 NM NM NM NM NM NM NM NM NM NS NS NS NSSep 13 1953.45 NM NM NM NM NM NM NM NM NM NS NS NS NSNov 13 1953.45 19.02 1934.43 6.4 4.0 7.0 2.4 24.59 2.6 138 770 0.62 <0.50 <0.50Mar 14 1953.45 17.44 1936.01 7.3 2.2 20.3 4.8 21.08 1.4 270 210 <0.50 <0.50 <0.50Jun 14 1953.45 19.10 1934.35 6.9 3.7 2.1 2.8 26.43 2.4 233 860 0.50 <0.50 <0.50Sep 14 1953.45 18.60 1934.85 7.3 3.6 32.7 NM 25.85 2.4 80 360 <0.50 <0.50 <0.50Nov 14 1953.45 18.31 1935.14 7.0 3.8 2.4 2.2 22.84 2.5 -44 890 0.66 <0.50 <0.50Mar 15 1953.45 17.09 1936.36 6.7 3.8 2.7 1.8 21.61 2.4 67 680 <0.50 <0.50 <0.50

Maryland Square PCE SiteCardno ATC
Page 35 of 47
Well ID Date
Top of Casing
Elevation (feet msl)
Depth to Groundwater Level (feet)
Groundwater Elevation (feet msl)
pH Specific
Conductance (mS/cm)
Turbidity
(NTU)
Dissolved Oxygen (mg/L)
Temp (ºC) TDS (g/L)
ORP (mV)
PCE (μg/L)
TCE (μg/L)
cis-1,2-DCE
(μg/L)
Vinyl Chloride
(μg/L)
Table A-2: Historical Groundwater Gauging and Analytical DataMaryland Square Shopping Center
MW-27 Mar 06 1944.23 13.48 1930.75 6.8 3.3 0.0 2.4 21.90 2.1 142 220 ND ND ND Jun 06 1944.23 18.50 1925.73 NM 3.7 626.0 4.6 26.10 2.3 69 350 ND ND ND Oct 06 1944.23 16.16 1928.07 6.2 3.3 0.0 2.8 22.20 2.1 155 380 ND ND ND Dec 06 1944.23 13.85 1930.38 6.8 4.0 507.0 4.5 22.20 2.6 444 380 ND ND ND Mar 07 1944.23 12.58 1931.65 7.0 3.3 83.0 7.0 21.90 2.1 181 160 ND ND ND Jun 07 1944.23 18.43 1925.80 7.0 3.3 238.0 4.1 22.20 2.1 392 340 ND ND ND Sep 07 1944.23 17.85 1926.38 6.8 3.4 22.0 3.4 24.20 2.2 198 320 ND ND ND Dec 07 1944.23 14.41 1929.82 6.4 3.8 0.0 3.5 20.60 2.5 153 430 ND ND ND Mar 08 1944.23 13.65 1930.58 7.0 3.4 1.4 2.5 22.60 2.2 174 580 ND ND ND Jun 08 1944.23 NM NM NM NM NM NM NM NM NM 320 ND ND ND Oct 08 1944.23 18.33 1925.90 6.5 3.8 25.2 1.1 22.59 2.4 105 510 2.6 ND ND Feb 09 1944.23 13.22 1931.01 6.6 3.6 0.0 0.7 21.90 2.3 108 510 ND ND ND Jun 09 1944.23 18.39 1925.84 7.1 3.9 0.0 0.5 24.10 2.5 128 570 3.3 ND ND Sep 09 1944.23 19.73 1924.50 6.6 4.3 -6.7 0.9 24.20 2.7 131 640 ND ND ND Nov 09 1944.23 18.92 1925.31 NM NM NM NM NM NM NM 400 2.0 ND ND Feb 10 1944.23 13.00 1931.23 NM NM NM NM NM NM NM 770 3.5 ND ND Jun 10 1944.23 17.77 1926.46 7.1 3.4 10.2 6.8 24.66 NM NM 330 1.4 ND ND Oct 10 1944.23 18.87 1925.36 6.9 3.6 0.4 1.4 22.95 2.4 434 420 1.4 ND ND Nov 10 1944.23 17.19 1927.04 6.8 3.7 2.9 1.5 23.57 NM 115 480 1.8 ND ND Mar 11 1944.23 12.99 1931.24 7.0 3.7 259.3 6.7 21.37 NM 108 370 1.2 ND NDJun 11 1944.23 16.68 1927.55 7.3 3.7 -1.4 1.6 23.61 NM 180 440 1.3 ND NDSep 11 1944.23 20.23 1924.00 6.8 3.8 10.0 2.2 23.60 2.4 237 470 1.3 ND NDNov 11 1944.23 17.32 1926.91 7.0 3.5 NM 2.1 22.62 2.3 164 380 1.3 ND NDMar 12 1944.23 16.22 1928.01 7.2 3.6 5.9 2.5 23.10 2.4 -58 470 NS NS NS
* Jun 12 1944.15 14.46 1929.69 6.8 3.9 230.0 2.9 23.80 2.4 108 440 0.97 ND NDSep 12 1944.15 18.54 1925.61 7.3 3.6 NM 2.1 23.06 2.3 152 430 1.2 ND NDNov 12 1944.15 NM NM NM NM NM NM NM NM NM NS NS NS NSMar 13 1944.15 15.33 1928.82 7.0 4.0 NM 1.8 23.16 2.6 100 450 1.0 <0.50 <0.50Jun 13 1944.15 20.37 1923.78 7.0 4.0 NM 2.1 25.31 2.6 95 300 1.1 <0.50 <0.50Sep 13 1944.15 19.67 1924.48 7.2 2.0 NM 2.4 27.75 1.3 88 350 0.79 <0.50 <0.50Nov 13 1944.15 17.49 1926.66 7.2 4.0 7.2 1.7 24.27 2.6 120 420 0.94 <0.50 <0.50Mar 14 1944.15 14.67 1929.48 7.2 3.4 29.3 4.3 23.18 2.2 15 220 0.59 <0.50 <0.50Jun 14 1944.15 18.96 1925.19 7.0 3.7 4.9 2.3 27.29 2.4 271 430 0.94 <0.50 <0.50Sep 14 1944.15 17.94 1926.21 7.3 3.4 24.2 NM 25.78 2.1 96 290 <0.50 <0.50 <0.50Nov 14 1944.15 NM NM NM NM NM NM NM NM NM NS NS NS NSMar 15 1944.15 13.33 1930.82 6.7 3.7 6.4 1.3 21.76 2.4 39 450 1.3 <0.50 <0.50

Maryland Square PCE SiteCardno ATC
Page 36 of 47
Well ID Date
Top of Casing
Elevation (feet msl)
Depth to Groundwater Level (feet)
Groundwater Elevation (feet msl)
pH Specific
Conductance (mS/cm)
Turbidity
(NTU)
Dissolved Oxygen (mg/L)
Temp (ºC) TDS (g/L)
ORP (mV)
PCE (μg/L)
TCE (μg/L)
cis-1,2-DCE
(μg/L)
Vinyl Chloride
(μg/L)
Table A-2: Historical Groundwater Gauging and Analytical DataMaryland Square Shopping Center
MW-28 Nov 07 1942.97 14.02 1928.95 6.8 4.2 196.0 9.6 26.80 2.7 125 3 ND ND ND Dec 07 1942.97 12.80 1930.17 NM NM NM NM NM NM NM NS NS NS NS Mar 08 1942.97 11.61 1931.36 NM NM NM NM NM NM NM NS NS NS NS Jun 08 1942.97 NM NM NM NM NM NM NM NM NM 1 ND ND ND Oct 08 1942.96 14.60 1928.36 6.8 4.2 165.0 0.6 22.80 2.7 82 2.2 ND ND ND Feb 09 1942.96 11.66 1931.30 NM NM NM NM NM NM NM NS NS NS NS Jun 09 1942.96 13.91 1929.05 7.2 4.2 63.8 0.0 23.50 2.7 119 3.3 ND ND ND Sep 09 1942.96 14.96 1928.00 NM NM NM NM NM NM NM NS NS NS NS Nov 09 1942.96 14.83 1928.13 6.0 3.8 180.0 1.1 23.20 2.5 136 1.3 ND ND ND Feb 10 1942.96 12.78 1930.18 NM NM NM NM NM NM NM NS NS NS NS Jun 10 1942.96 13.91 1929.05 7.0 3.7 3.7 3.3 23.89 NM NM 0.94 ND ND ND Oct 10 1942.96 14.93 1928.03 NM NM NM NM NM NM NM NS NS NS NS Nov 10 1942.96 14.31 1928.65 6.7 3.9 0.6 0.9 24.25 NM 162 0.66 ND ND NDMar 11 1942.96 12.10 1930.86 NM NM NM NM NM NM NM NS NS NS NS Jun 11 1942.96 13.50 1929.46 7.0 4.0 2.4 0.7 23.71 NM 185 ND ND ND NDSep 11 1942.96 14.93 1928.03 NM NM NM NM NM NM NM NS NS NS NS Nov 11 1942.96 14.42 1928.54 7.0 3.7 NM 1.0 22.10 2.4 157 0.62 ND ND NDMar 12 1942.96 NM NM NM NM NM NM NM NM NM NS NS NS NS
* Jun 12 1943.07 15.30 1927.77 6.8 4.1 32.0 1.1 22.70 2.6 133 0.73 ND ND NDSep 12 1943.07 NM NM NM NM NM NM NM NM NM NS NS NS NS Nov 12 1943.07 NM NM NM NM NM NM NM NM NM NS NS NS NSMar 13 1943.07 12.50 1930.57 7.0 4.1 NM 1.9 24.06 2.7 70 0.50 <0.50 <0.50 <0.50Jun 13 1943.07 NM NM NM NM NM NM NM NM NM NS NS NS NSSep 13 1943.07 NM NM NM NM NM NM NM NM NM NS NS NS NSNov 13 1943.07 NM NM NM NM NM NM NM NM NM NS NS NS NSMar 14 1943.07 12.87 1930.20 7.3 3.5 20.8 1.8 22.59 2.3 66 0.69 <0.50 <0.50 <0.50Jun 14 1943.07 NM NM NM NM NM NM NM NM NM NS NS NS NSSep 14 1943.07 NM NM NM NM NM NM NM NM NM NS NS NS NSNov 14 1943.07 NM NM NM NM NM NM NM NM NM NS NS NS NSMar 15 1943.07 12.36 1930.71 6.7 3.8 6.3 0.7 22.63 2.5 80 0.69 <0.50 <0.50 <0.50

Maryland Square PCE SiteCardno ATC
Page 37 of 47
Well ID Date
Top of Casing
Elevation (feet msl)
Depth to Groundwater Level (feet)
Groundwater Elevation (feet msl)
pH Specific
Conductance (mS/cm)
Turbidity
(NTU)
Dissolved Oxygen (mg/L)
Temp (ºC) TDS (g/L)
ORP (mV)
PCE (μg/L)
TCE (μg/L)
cis-1,2-DCE
(μg/L)
Vinyl Chloride
(μg/L)
Table A-2: Historical Groundwater Gauging and Analytical DataMaryland Square Shopping Center
MW-29 Nov 07 1932.27 14.20 1918.07 6.9 4.3 15.1 6.0 21.80 2.7 108 2.5 ND ND ND Dec 07 1932.27 14.01 1918.26 NM NM NM NM NM NM NM NS NS NS NS Mar 08 1932.27 13.77 1918.50 NM NM NM NM NM NM NM NS NS NS NS Jun 08 1932.27 NM NM NM NM NM NM NM NM NM 1 ND ND ND Oct 08 1932.25 14.44 1917.81 6.8 4.0 500.0 3.9 20.00 2.6 122 2.2 ND ND ND Feb 09 1932.25 13.81 1918.44 NM NM NM NM NM NM NM NS NS NS NS Jun 09 1932.25 13.98 1918.27 7.2 4.0 212.0 3.3 20.50 2.6 133 1.3 ND ND ND Sep 09 1932.25 14.38 1917.87 NM NM NM NM NM NM NM NS NS NS NS Nov 09 1932.25 14.37 1917.88 6.1 3.8 200.0 3.9 20.80 2.4 139 ND ND ND ND Feb 10 1932.25 14.19 1918.06 NM NM NM NM NM NM NM NS NS NS NS Jun 10 1932.25 13.92 1918.33 6.9 3.5 3.8 4.8 23.43 NM NM 0.58 ND ND ND Oct 10 1932.25 14.19 1918.06 NM NM NM NM NM NM NM NS NS NS NS Nov 10 1932.25 13.90 1918.35 6.8 3.9 1.5 4.0 21.09 NM 138 ND ND ND NDMar 11 1932.25 13.52 1918.73 NM NM NM NM NM NM NM NS NS NS NS Jun 11 1932.25 13.65 1918.60 6.9 3.9 -1.4 4.1 20.62 NM 232 ND ND ND NDSep 11 1932.25 13.84 1918.41 NM NM NM NM NM NM NM NS NS NS NS Nov 11 1932.25 13.85 1918.40 7.0 3.7 NM 4.0 19.77 2.4 183 ND ND ND NDMar 12 1932.25 NM NM NM NM NM NM NM NM NM NS NS NS NS
* Jun 12 1932.35 13.99 1918.36 6.9 3.8 79.0 5.2 20.30 2.4 133 ND ND ND NDSep 12 1932.35 NM NM NM NM NM NM NM NM NM NS NS NS NS Nov 12 1932.35 NM NM NM NM NM NM NM NM NM NS NS NS NSMar 13 1932.35 13.30 1919.05 7.0 4.1 NM 4.4 19.43 2.7 85 <0.50 <0.50 <0.50 <0.50Jun 13 1932.35 NM NM NM NM NM NM NM NM NM NS NS NS NSSep 13 1932.35 NM NM NM NM NM NM NM NM NM NS NS NS NSNov 13 1932.35 NM NM NM NM NM NM NM NM NM NS NS NS NSMar 14 1932.35 13.55 1918.80 7.3 3.6 42.3 3.6 18.53 2.4 170 <0.50 <0.50 <0.50 <0.50Jun 14 1932.35 NM NM NM NM NM NM NM NM NM NS NS NS NSSep 14 1932.35 NM NM NM NM NM NM NM NM NM NS NS NS NSNov 14 1932.35 NM NM NM NM NM NM NM NM NM NS NS NS NSMar 15 1932.35 13.85 1918.50 6.8 4.0 1.6 2.7 18.75 2.6 85 <0.50 <0.50 <0.50 <0.50

Maryland Square PCE SiteCardno ATC
Page 38 of 47
Well ID Date
Top of Casing
Elevation (feet msl)
Depth to Groundwater Level (feet)
Groundwater Elevation (feet msl)
pH Specific
Conductance (mS/cm)
Turbidity
(NTU)
Dissolved Oxygen (mg/L)
Temp (ºC) TDS (g/L)
ORP (mV)
PCE (μg/L)
TCE (μg/L)
cis-1,2-DCE
(μg/L)
Vinyl Chloride
(μg/L)
Table A-2: Historical Groundwater Gauging and Analytical DataMaryland Square Shopping Center
MW-30 Nov 07 1940.56 20.11 1920.45 6.8 3.7 144.0 3.1 24.20 2.4 135 74 ND ND ND Dec 07 1940.56 17.12 1923.44 NM NM NM NM NM NM NM NS NS NS NS Mar 08 1940.56 16.32 1924.24 6.9 3.3 7.2 3.7 18.80 2.1 204 86 ND ND ND Jun 08 1940.56 NM NM NM NM NM NM NM NM NM 49 ND ND ND Oct 08 1940.56 20.91 1919.65 6.7 3.7 221.0 0.9 20.10 2.4 124 100 1.8 ND ND Feb 09 1940.56 16.05 1924.51 6.6 3.3 7.2 3.2 19.60 2.1 97 71 ND ND ND Jun 09 1940.56 19.88 1920.68 7.1 3.7 34.3 1.2 21.40 2.3 141 110 2.0 ND ND Sep 09 1940.56 21.57 1918.99 6.6 4.2 0.8 2.0 23.40 2.7 127 70 1.1 ND ND Nov 09 1940.56 20.55 1920.01 5.9 3.3 -10.0 2.3 20.40 2.1 167 85 1.4 ND ND Feb 10 1940.56 16.49 1924.07 6.7 3.2 12.0 3.9 19.60 2.1 162 60 ND ND ND Jun 10 1940.56 18.98 1921.58 6.9 2.9 1.0 5.3 25.04 NM NM 41 ND ND ND Oct 10 1940.56 20.63 1919.93 6.0 3.1 0.1 4.2 21.95 2.0 595 62 ND ND ND Nov 10 1940.56 19.32 1921.24 6.6 3.1 0.7 4.4 22.09 NM 212 54 ND ND ND Mar 11 1940.56 15.85 1924.71 6.5 3.3 0.0 4.7 19.41 NM 142 50 ND ND NDJun 11 1940.56 18.17 1922.39 6.3 3.1 -1.1 4.2 22.48 NM 446 50 ND ND NDSep 11 1940.56 21.28 1919.28 7.1 2.9 16.0 7.9 22.20 1.9 237 25 ND ND NDNov 11 1940.56 19.47 1921.09 7.0 2.8 NM 4.7 20.48 1.8 182 38 ND ND NDMar 12 1940.56 NM NM NM NM NM NM NM NM NM NS NS NS NS
* Jun 12 1940.59 21.42 1919.17 6.9 3.2 210.0 3.7 21.00 2.0 125 84 0.73 ND NDSep 12 1940.59 NM NM NM NM NM NM NM NM NM NS NS NS NS Nov 12 1940.59 NM NM NM NM NM NM NM NM NM NS NS NS NSMar 13 1940.59 17.38 1923.21 6.9 3.3 NM 4.2 19.45 2.1 144 62 <0.50 <0.50 <0.50Jun 13 1940.59 NM NM NM NM NM NM NM NM NM NS NS NS NSSep 13 1940.59 NM NM NM NM NM NM NM NM NM NS NS NS NSNov 13 1940.59 19.89 1920.70 6.6 3.3 7.6 3.3 22.07 2.1 141 96 0.58 <0.50 <0.50Mar 14 1940.59 17.14 1923.45 7.2 2.9 3.8 3.5 21.39 1.9 166 42 <0.50 <0.50 <0.50Jun 14 1940.59 NM NM NM NM NM NM NM NM NM NS NS NS NSSep 14 1940.59 NM NM NM NM NM NM NM NM NM NS NS NS NSNov 14 1940.59 NM NM NM NM NM NM NM NM NM NS NS NS NSMar 15 1940.59 15.90 1924.69 6.6 2.9 4.3 2.4 19.18 1.9 50 93 0.76 <0.50 <0.50

Maryland Square PCE SiteCardno ATC
Page 39 of 47
Well ID Date
Top of Casing
Elevation (feet msl)
Depth to Groundwater Level (feet)
Groundwater Elevation (feet msl)
pH Specific
Conductance (mS/cm)
Turbidity
(NTU)
Dissolved Oxygen (mg/L)
Temp (ºC) TDS (g/L)
ORP (mV)
PCE (μg/L)
TCE (μg/L)
cis-1,2-DCE
(μg/L)
Vinyl Chloride
(μg/L)
Table A-2: Historical Groundwater Gauging and Analytical DataMaryland Square Shopping Center
MW-31 Mar 08 1937.93 15.23 1922.70 7.0 4.7 125.0 6.0 22.50 2.9 152 49 ND ND ND Jun 08 1937.93 NM NM NM NM NM NM NM NM NM 31 ND ND ND Oct 08 1937.93 18.94 1918.99 6.7 4.2 265.0 3.6 22.40 2.7 123 39 ND ND ND Feb 09 1937.93 15.59 1922.34 6.5 4.0 11.0 3.4 21.90 2.6 99 44 ND ND ND Jun 09 1937.93 17.30 1920.63 7.0 4.3 77.9 4.6 21.10 2.8 137 45 ND ND ND Sep 09 1937.93 19.08 1918.85 6.6 4.8 45.2 4.9 23.60 3.0 124 38 ND ND ND Nov 09 1937.93 18.40 1919.53 6.0 4.0 230.0 4.0 22.90 2.5 141 24 ND ND ND Feb 10 1937.93 16.41 1921.52 6.7 4.0 18.0 3.9 21.10 2.5 148 34 1.2 ND ND Jun 10 1937.93 16.94 1920.99 6.9 3.7 14.8 5.2 23.60 NM NM 34 ND ND ND Oct 10 1937.93 18.80 1919.13 5.9 4.0 3.5 3.9 22.86 2.6 582 30 ND ND ND Nov 10 1937.93 18.33 1919.60 6.5 4.0 10.1 3.9 24.41 NM 225 27 ND ND ND Mar 11 1937.93 15.70 1922.23 6.9 4.1 22.7 5.0 22.63 NM 145 26 ND ND NDJun 11 1937.93 16.76 1921.17 6.2 4.0 9.8 4.2 25.43 NM 480 64 ND ND NDSep 11 1937.93 18.73 1919.20 6.8 4.1 9.5 4.8 24.90 2.6 256 57 ND ND NDNov 11 1937.93 17.93 1920.00 6.9 3.8 NM 3.9 21.23 2.5 178 58 ND ND NDMar 12 1937.93 NM NM NM NM NM NM NM NM NM NS NS NS NS
* Jun 12 1937.66 18.37 1919.29 6.8 4.1 440.0 3.9 23.20 2.6 121 44 0.52 ND NDSep 12 1937.66 NM NM NM NM NM NM NM NM NM NS NS NS NSNov 12 1937.66 NM NM NM NM NM NM NM NM NM NS NS NS NSMar 13 1937.66 16.27 1921.39 6.9 4.2 NM 2.9 21.34 2.7 139 61 <0.50 <0.50 <0.50Jun 13 1937.66 NM NM NM NM NM NM NM NM NM NS NS NS NSSep 13 1937.66 NM NM NM NM NM NM NM NM NM NS NS NS NSNov 13 1937.66 18.55 1919.11 6.4 4.2 12.7 2.4 24.30 2.7 192 54 <0.50 <0.50 <0.50Mar 14 1937.66 16.45 1921.21 7.2 3.6 16.7 2.3 25.83 2.4 92 35 <0.50 <0.50 <0.50Jun 14 1937.66 NM NM NM NM NM NM NM NM NM NS NS NS NSSep 14 1937.66 NM NM NM NM NM NM NM NM NM NS NS NS NSNov 14 1937.66 NM NM NM NM NM NM NM NM NM NS NS NS NSMar 15 1937.66 15.34 1922.32 6.7 4.0 5.6 2.7 21.20 2.6 57 73 <0.50 <0.50 <0.50
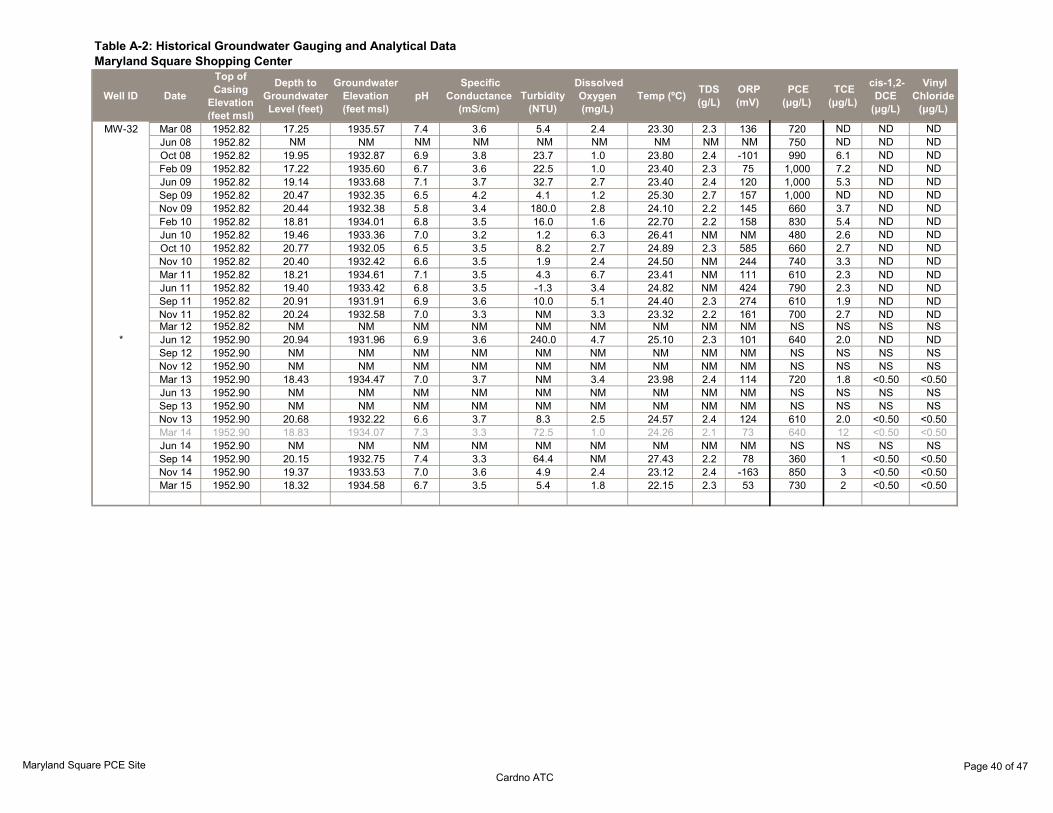
Maryland Square PCE SiteCardno ATC
Page 40 of 47
Well ID Date
Top of Casing
Elevation (feet msl)
Depth to Groundwater Level (feet)
Groundwater Elevation (feet msl)
pH Specific
Conductance (mS/cm)
Turbidity
(NTU)
Dissolved Oxygen (mg/L)
Temp (ºC) TDS (g/L)
ORP (mV)
PCE (μg/L)
TCE (μg/L)
cis-1,2-DCE
(μg/L)
Vinyl Chloride
(μg/L)
Table A-2: Historical Groundwater Gauging and Analytical DataMaryland Square Shopping Center
MW-32 Mar 08 1952.82 17.25 1935.57 7.4 3.6 5.4 2.4 23.30 2.3 136 720 ND ND ND Jun 08 1952.82 NM NM NM NM NM NM NM NM NM 750 ND ND ND Oct 08 1952.82 19.95 1932.87 6.9 3.8 23.7 1.0 23.80 2.4 -101 990 6.1 ND ND Feb 09 1952.82 17.22 1935.60 6.7 3.6 22.5 1.0 23.40 2.3 75 1,000 7.2 ND ND Jun 09 1952.82 19.14 1933.68 7.1 3.7 32.7 2.7 23.40 2.4 120 1,000 5.3 ND ND Sep 09 1952.82 20.47 1932.35 6.5 4.2 4.1 1.2 25.30 2.7 157 1,000 ND ND ND Nov 09 1952.82 20.44 1932.38 5.8 3.4 180.0 2.8 24.10 2.2 145 660 3.7 ND ND Feb 10 1952.82 18.81 1934.01 6.8 3.5 16.0 1.6 22.70 2.2 158 830 5.4 ND ND Jun 10 1952.82 19.46 1933.36 7.0 3.2 1.2 6.3 26.41 NM NM 480 2.6 ND ND Oct 10 1952.82 20.77 1932.05 6.5 3.5 8.2 2.7 24.89 2.3 585 660 2.7 ND ND Nov 10 1952.82 20.40 1932.42 6.6 3.5 1.9 2.4 24.50 NM 244 740 3.3 ND ND Mar 11 1952.82 18.21 1934.61 7.1 3.5 4.3 6.7 23.41 NM 111 610 2.3 ND NDJun 11 1952.82 19.40 1933.42 6.8 3.5 -1.3 3.4 24.82 NM 424 790 2.3 ND NDSep 11 1952.82 20.91 1931.91 6.9 3.6 10.0 5.1 24.40 2.3 274 610 1.9 ND NDNov 11 1952.82 20.24 1932.58 7.0 3.3 NM 3.3 23.32 2.2 161 700 2.7 ND NDMar 12 1952.82 NM NM NM NM NM NM NM NM NM NS NS NS NS
* Jun 12 1952.90 20.94 1931.96 6.9 3.6 240.0 4.7 25.10 2.3 101 640 2.0 ND NDSep 12 1952.90 NM NM NM NM NM NM NM NM NM NS NS NS NSNov 12 1952.90 NM NM NM NM NM NM NM NM NM NS NS NS NSMar 13 1952.90 18.43 1934.47 7.0 3.7 NM 3.4 23.98 2.4 114 720 1.8 <0.50 <0.50Jun 13 1952.90 NM NM NM NM NM NM NM NM NM NS NS NS NSSep 13 1952.90 NM NM NM NM NM NM NM NM NM NS NS NS NSNov 13 1952.90 20.68 1932.22 6.6 3.7 8.3 2.5 24.57 2.4 124 610 2.0 <0.50 <0.50Mar 14 1952.90 18.83 1934.07 7.3 3.3 72.5 1.0 24.26 2.1 73 640 12 <0.50 <0.50Jun 14 1952.90 NM NM NM NM NM NM NM NM NM NS NS NS NSSep 14 1952.90 20.15 1932.75 7.4 3.3 64.4 NM 27.43 2.2 78 360 1 <0.50 <0.50Nov 14 1952.90 19.37 1933.53 7.0 3.6 4.9 2.4 23.12 2.4 -163 850 3 <0.50 <0.50Mar 15 1952.90 18.32 1934.58 6.7 3.5 5.4 1.8 22.15 2.3 53 730 2 <0.50 <0.50

Maryland Square PCE SiteCardno ATC
Page 41 of 47
Well ID Date
Top of Casing
Elevation (feet msl)
Depth to Groundwater Level (feet)
Groundwater Elevation (feet msl)
pH Specific
Conductance (mS/cm)
Turbidity
(NTU)
Dissolved Oxygen (mg/L)
Temp (ºC) TDS (g/L)
ORP (mV)
PCE (μg/L)
TCE (μg/L)
cis-1,2-DCE
(μg/L)
Vinyl Chloride
(μg/L)
Table A-2: Historical Groundwater Gauging and Analytical DataMaryland Square Shopping Center
MW-33 Mar 08 1950.92 16.02 1934.90 7.0 3.5 82.4 7.6 20.30 2.2 161 2.4 ND ND ND Jun 08 1950.92 NM NM NM NM NM NM NM NM NM 1 ND ND ND Oct 08 1950.92 18.00 1932.92 6.7 3.8 6.7 1.0 22.20 2.4 85 3.4 ND ND ND Feb 09 1950.92 16.11 1934.81 6.4 3.7 0.0 0.0 21.30 2.4 120 ND ND ND ND Jun 09 1950.92 17.28 1933.64 7.0 4.0 0.0 0.0 21.40 2.5 138 ND ND ND ND Sep 09 1950.92 18.93 1931.99 6.6 4.2 2.2 1.2 23.50 2.7 166 3.3 ND ND ND Nov 09 1950.92 18.78 1932.14 6.0 3.5 200.0 1.7 22.60 2.2 136 1.4 ND ND ND Feb 10 1950.92 17.28 1933.64 6.7 3.5 0.0 0.7 21.50 2.2 146 ND ND ND ND Jun 10 1950.92 17.71 1933.21 6.9 3.4 1.1 2.1 28.96 NM NM ND ND ND ND Oct 10 1950.92 19.42 1931.50 6.1 3.6 3.7 1.4 23.04 2.3 558 ND ND ND ND Nov 10 1950.92 19.25 1931.67 6.6 3.6 1.7 1.6 23.34 NM 217 ND ND ND ND Mar 11 1950.92 17.36 1933.56 6.5 3.8 2.8 1.7 21.27 NM 107 ND ND ND NDJun 11 1950.92 18.00 1932.92 7.3 3.8 -1.2 0.8 22.54 NM 74 ND ND ND NDSep 11 1950.92 19.31 1931.61 6.9 3.8 10.0 4.2 23.10 2.4 191 ND ND ND NDNov 11 1950.92 18.72 1932.20 7.0 3.6 NM 2.2 21.62 2.3 181 ND ND ND NDMar 12 1950.92 NM NM NM NM NM NM NM NM NM NS NS NS NS
* Jun 12 1950.98 19.03 1931.95 6.8 4.0 130.0 1.3 22.90 2.5 136 ND ND ND NDSep 12 1950.98 NM NM NM NM NM NM NM NM NM NS NS NS NSNov 12 1950.98 NM NM NM NM NM NM NM NM NM NS NS NS NSMar 13 1950.98 17.25 1933.73 6.9 4.2 NM 1.9 21.50 2.7 134 <0.50 <0.50 <0.50 <0.50Jun 13 1950.98 NM NM NM NM NM NM NM NM NM NS NS NS NSSep 13 1950.98 NM NM NM NM NM NM NM NM NM NS NS NS NSNov 13 1950.98 19.40 1931.58 6.9 4.0 7.6 1.4 21.58 2.6 146 <0.50 <0.50 <0.50 <0.50Mar 14 1950.98 17.66 1933.32 7.2 3.4 68.8 4.9 18.82 2.2 45 <0.50 <0.50 <0.50 <0.50Jun 14 1950.98 NM NM NM NM NM NM NM NM NM NS NS NS NSSep 14 1950.98 NM NM NM NM NM NM NM NM NM NS NS NS NSNov 14 1950.98 NM NM NM NM NM NM NM NM NM NS NS NS NSMar 15 1950.98 17.06 1933.92 6.6 4.1 8.9 0.7 21.50 2.7 68 <0.50 <0.50 <0.50 <0.50

Maryland Square PCE SiteCardno ATC
Page 42 of 47
Well ID Date
Top of Casing
Elevation (feet msl)
Depth to Groundwater Level (feet)
Groundwater Elevation (feet msl)
pH Specific
Conductance (mS/cm)
Turbidity
(NTU)
Dissolved Oxygen (mg/L)
Temp (ºC) TDS (g/L)
ORP (mV)
PCE (μg/L)
TCE (μg/L)
cis-1,2-DCE
(μg/L)
Vinyl Chloride
(μg/L)
Table A-2: Historical Groundwater Gauging and Analytical DataMaryland Square Shopping Center
MW-34 Dec 11 -- -- 910 NS NS NSJan 12 -- -- 1000 NS NS NSMar 12 -- -- 7.2 3.7 27.4 2.0 22.63 2.4 -47 1000 NS NS NS
* Jun 12 1993.88 17.74 1976.14 7.3 3.4 16.4 2.4 24.19 2.4 89 860 0.97 ND NDSep 12 1993.88 18.07 1975.81 7.3 3.6 NM 2.1 24.43 2.4 141 730 1.2 ND NDNov 12 1993.88 17.75 1976.13 8.0 3.7 NM 2.0 24.86 2.4 45 550 1.1 <0.50 <0.50Mar 13 1993.88 19.06 1974.82 7.1 4.0 NM 1.6 22.65 2.6 125 550 0.86 <0.50 <0.50Jun 13 1993.88 19.32 1974.56 7.3 4.0 NM 1.9 24.03 2.6 63 380 0.90 <0.50 <0.50Sep 13 1993.88 19.36 1974.52 7.0 3.8 NM 1.6 25.41 2.5 71 440 0.78 <0.50 <0.50Nov 13 1993.88 19.14 1974.74 6.1 3.4 20.0 0.9 23.56 2.3 184 500 0.86 <0.50 <0.50Mar 14 1993.88 18.75 1975.13 7.3 3.4 10.4 3.8 22.73 2.2 81 360 0.73 <0.50 <0.50Jun 14 1993.88 NM NM NM NM NM NM NM NM NM NS NS NS NSSep 14 1993.88 NM NM NM NM NM NM NM NM NM NS NS NS NSNov 14 1993.88 NM NM NM NM NM NM NM NM NM NS NS NS NSMar 15 1993.88 19.09 1974.79 6.5 3.8 6.6 1.6 24.17 2.4 91 370 0.91 <0.50 <0.50
MW-35 Dec 11 -- -- 410 NS NS NSJan 12 -- -- 630 NS NS NSMar 12 -- 20.03 -- 7.3 3.4 181.0 3.6 23.81 2.2 -21 580 NS NS NS
* Jun 12 1991.37 18.90 1972.47 7.3 3.4 87.1 4.0 24.30 2.2 100 530 ND ND NDSep 12 1991.37 18.77 1972.60 7.2 3.4 NM 3.5 23.19 2.2 150 520 ND ND NDNov 12 1991.37 18.55 1972.82 8.0 3.4 NM 3.9 24.06 2.2 70 480 <0.50 <0.50 <0.50Mar 13 1991.37 19.99 1971.38 7.1 3.7 NM 3.2 23.20 2.4 129 340 <0.50 <0.50 <0.50Jun 13 1991.37 20.30 1971.07 7.2 3.8 NM 3.9 24.12 2.5 84 250 <0.50 <0.50 <0.50Sep 13 1991.37 20.21 1971.16 7.2 3.6 NM 3.3 25.54 2.3 50 250 <0.50 <0.50 <0.50Nov 13 1991.37 19.93 1971.44 6.1 3.8 45.8 1.8 23.47 2.2 184 310 <0.50 <0.50 <0.50Mar 14 1991.37 19.72 1971.65 7.3 3.3 323 5.4 23.24 2.1 89 92 <0.50 <0.50 <0.50Jun 14 1991.37 NM NM NM NM NM NM NM NM NM NS NS NS NSSep 14 1991.37 NM NM NM NM NM NM NM NM NM NS NS NS NSNov 14 1991.37 NM NM NM NM NM NM NM NM NM NS NS NS NSMar 15 1991.37 19.82 1971.55 6.5 3.7 23 2.4 25.22 2.3 87 180 <0.50 <0.50 <0.50

Maryland Square PCE SiteCardno ATC
Page 43 of 47
Well ID Date
Top of Casing
Elevation (feet msl)
Depth to Groundwater Level (feet)
Groundwater Elevation (feet msl)
pH Specific
Conductance (mS/cm)
Turbidity
(NTU)
Dissolved Oxygen (mg/L)
Temp (ºC) TDS (g/L)
ORP (mV)
PCE (μg/L)
TCE (μg/L)
cis-1,2-DCE
(μg/L)
Vinyl Chloride
(μg/L)
Table A-2: Historical Groundwater Gauging and Analytical DataMaryland Square Shopping Center
MW-36 Mar 12 1955.30 19.51 1935.79 7.1 3.5 15.8 2.3 23.44 2.3 -62 160 NS NS NS* Jun 12 1955.30 21.26 1934.04 6.8 3.8 110.0 2.2 25.30 2.5 74 130 ND ND ND
Sep 12 1955.30 21.55 1933.75 7.5 3.4 NM 1.9 25.53 2.2 128 130 ND ND NDNov 12 1955.30 20.62 1934.68 7.8 3.5 NM 2.1 22.87 2.7 71 150 <0.50 <0.50 <0.50Mar 13 1955.30 19.03 1936.27 6.9 3.8 NM 1.7 23.48 2.5 121 160 0.52 <0.50 <0.50Jun 13 1955.30 20.75 1934.55 7.0 3.8 NM 1.8 25.96 2.5 104 110 0.52 <0.50 <0.50Sep 13 1955.30 21.48 1933.82 7.0 3.6 NM 1.7 24.72 2.4 131 140 <0.50 <0.50 <0.50Nov 13 1955.30 21.22 1934.08 7.4 3.9 9.4 1.9 23.32 2.5 126 130 <0.50 <0.50 <0.50Mar 14 1955.30 19.50 1935.80 7.3 3.1 53.6 4.2 24.34 2.1 147 62 <0.50 <0.50 <0.50Jun 14 1955.30 NM NM NM NM NM NM NM NM NM NS NS NS NSSep 14 1955.30 NM NM NM NM NM NM NM NM NM NS NS NS NSNov 14 1955.30 NM NM NM NM NM NM NM NM NM NS NS NS NSMar 15 1955.30 19.09 1936.21 6.7 3.6 7.3 1.4 23.23 2.4 60 150 <0.50 <0.50 <0.50
MW-37 Mar 12 1930.06 18.89 1911.17 7.2 3.7 9.5 5.6 20.42 2.4 -27 36 NS NS NS* Jun 12 1929.98 19.10 1910.88 6.9 3.8 200.0 6.3 20.80 2.4 128 34 ND ND ND
Sep 12 1929.98 20.05 1909.93 7.4 3.7 NM 5.5 21.79 2.4 144 32 ND ND NDNov 12 1929.98 19.66 1910.32 7.9 3.8 NM 5.0 20.46 2.5 97 31 <0.50 <0.50 <0.50Mar 13 1929.98 18.83 1911.15 7.0 4.1 NM 4.3 19.76 2.7 139 34 <0.50 <0.50 <0.50Jun 13 1929.98 19.33 1910.65 7.0 4.1 NM 4.2 21.58 2.6 114 37 <0.50 <0.50 <0.50Sep 13 1929.98 19.80 1910.18 7.0 3.8 NM 4.6 21.66 2.5 215 40 <0.50 <0.50 <0.50Nov 13 1929.98 19.79 1910.19 6.5 4.0 7.2 4.2 21.71 2.6 335 33 <0.50 <0.50 <0.50Mar 14 1929.98 18.44 1911.54 7.4 3.5 33.9 4.6 23.10 2.3 113 30 <0.50 <0.50 <0.50Jun 14 1929.98 NM NM NM NM NM NM NM NM NM NS NS NS NSSep 14 1929.98 NM NM NM NM NM NM NM NM NM NS NS NS NSNov 14 1929.98 NM NM NM NM NM NM NM NM NM NS NS NS NSMar 15 1929.98 19.25 1910.73 6.7 3.6 3.6 3.0 20.22 2.5 64 35 <0.50 <0.50 <0.50

Maryland Square PCE SiteCardno ATC
Page 44 of 47
Well ID Date
Top of Casing
Elevation (feet msl)
Depth to Groundwater Level (feet)
Groundwater Elevation (feet msl)
pH Specific
Conductance (mS/cm)
Turbidity
(NTU)
Dissolved Oxygen (mg/L)
Temp (ºC) TDS (g/L)
ORP (mV)
PCE (μg/L)
TCE (μg/L)
cis-1,2-DCE
(μg/L)
Vinyl Chloride
(μg/L)
Table A-2: Historical Groundwater Gauging and Analytical DataMaryland Square Shopping Center
MW-38 Jun 12 1908.38 15.05 1893.33 6.8 3.9 550.0 5.0 22.00 2.5 124 5.8 ND ND NDSep 12 1908.38 14.95 1893.43 7.6 3.8 NM 4.2 24.26 2.5 140 5.7 ND ND NDNov 12 1908.38 14.69 1893.69 7.9 3.8 NM 3.6 22.20 2.5 89 5.9 <0.50 <0.50 <0.50Mar 13 1908.38 14.48 1893.90 7.0 4.2 NM 3.9 20.46 2.7 138 7.3 <0.50 <0.50 <0.50Jun 13 1908.38 15.05 1893.33 7.0 4.1 NM 3.9 23.24 2.7 117 7.8 <0.50 <0.50 <0.50Sep 13 1908.38 14.75 1893.63 6.8 3.9 NM 3.8 23.26 2.5 380 6.6 <0.50 <0.50 <0.50Nov 13 1908.38 14.97 1893.41 6.5 4.2 19.1 3.3 22.33 2.7 356 7.0 <0.50 <0.50 <0.50Mar 14 1908.38 14.65 1893.73 7.2 3.6 6.8 2.2 20.57 2.4 92 7.3 <0.50 <0.50 <0.50Jun 14 1908.38 15.16 1893.22 7.1 3.9 17.4 3.2 54.90 2.5 100 5.4 <0.50 <0.50 <0.50Sep 14 1908.38 15.12 1893.26 7.2 3.8 22.4 6.1 25.74 2.5 82 5.8 <0.50 <0.50 <0.50Nov 14 1908.38 15.23 1893.15 6.9 4.0 7.6 3.7 21.82 2.6 75 8.2 <0.50 <0.50 <0.50Mar 15 1908.38 14.75 1893.63 6.7 4.0 4.3 2.9 20.24 2.6 59 6.0 <0.50 <0.50 <0.50
MW-39 Jun 12 1967.55 26.15 1941.40 7.3 3.4 252.0 3.3 25.73 2.2 50 250 0.63 ND NDSep 12 1967.55 26.10 1941.45 7.4 3.5 NM 1.6 25.75 2.2 132 240 0.83 ND NDNov 12 1967.55 25.51 1942.04 7.7 3.5 NM 2.2 22.11 2.3 61 270 0.91 <0.50 <0.50Mar 13 1967.55 24.20 1943.35 7.0 3.8 NM 1.4 22.63 2.4 137 280 0.83 <0.50 <0.50Jun 13 1967.55 25.63 1941.92 7.0 3.8 NM 1.7 26.48 2.5 94 210 0.83 <0.50 <0.50Sep 13 1967.55 26.34 1941.21 6.9 3.7 NM 2.0 26.67 2.4 122 250 0.76 <0.50 <0.50Nov 13 1967.55 26.01 1941.54 6.7 3.9 133 1.4 26.36 2.5 157 260 0.81 <0.50 <0.50Mar 14 1967.55 24.87 1942.68 7.3 3.3 120 4.9 28.81 2.1 116 59 <0.50 <0.50 <0.50Jun 14 1967.55 26.07 1941.48 7.2 3.5 60 4.1 30.55 2.3 389 120 <0.50 <0.50 <0.50Sep 14 1967.55 26.15 1941.40 7.5 3.2 84 4.8 26.92 2.0 135 120 <0.50 <0.50 <0.50Nov 14 1967.55 NM NM NM NM NM NM NM NM NM NS NS NS NSMar 15 1967.55 24.67 1942.88 6.7 3.7 96.2 1.3 23.51 2.4 60 160 <0.50 <0.50 <0.50

Maryland Square PCE SiteCardno ATC
Page 45 of 47
Well ID Date
Top of Casing
Elevation (feet msl)
Depth to Groundwater Level (feet)
Groundwater Elevation (feet msl)
pH Specific
Conductance (mS/cm)
Turbidity
(NTU)
Dissolved Oxygen (mg/L)
Temp (ºC) TDS (g/L)
ORP (mV)
PCE (μg/L)
TCE (μg/L)
cis-1,2-DCE
(μg/L)
Vinyl Chloride
(μg/L)
Table A-2: Historical Groundwater Gauging and Analytical DataMaryland Square Shopping Center
Nov 12 NM 25.28 NM 7.9 3.6 NM 2.6 17.93 2.3 -68 340 1.1 <0.50 <0.50Mar 13 NM NM NM NM NM NM NM NM NM NM 4.7 <0.50 <0.50 <0.50Jun 13 1978.49 26.15 1952.34 7.6 3.3 NM 4.7 35.97 2.1 160 10 <0.50 <0.50 <0.50Sep 13 1978.49 26.71 1951.78 7.9 2.2 NM 3.0 34.38 1.5 35 2.1 <0.50 <0.50 <0.50Nov 13 1978.49 26.35 1952.14 7.6 3.0 9.6 3.0 20.28 1.9 91 1.3 <0.50 <0.50 <0.50Mar 14 1978.49 26.52 1951.97 7.6 3.1 73.6 3.8 23.63 2.0 103 4.5 <0.50 <0.50 <0.50Jun 14 1978.49 26.44 1952.05 8.3 3.6 5.0 4.4 46.19 2.3 79 3.2 <0.50 <0.50 <0.50Sep 14 1978.49 26.65 1951.84 8.4 2.7 18.1 5.1 32.95 1.8 313 4.6 <0.50 <0.50 <0.50Nov 14 1978.49 25.74 1952.75 8.1 3.6 2.7 8.9 19.34 2.4 -49 35 <0.50 <0.50 <0.50Mar 15 1978.49 25.19 1953.30 8.0 3.6 4.1 4.2 18.74 2.3 287 14 <0.50 <0.50 <0.50
Nov 12 NM 25.30 NM 8.1 4.1 NM 1.9 17.84 2.7 -163 260 6.6 <0.50 <0.50Mar 13 NM NM NM NM NM NM NM NM NM NM 48 3.1 <0.50 <0.50Jun 13 NM 26.15 NM 7.3 3.3 NM 5.0 36.39 2.2 127 3.6 <0.50 <0.50 <0.50Sep 13 1978.49 26.71 1951.78 7.1 2.4 NM 3.0 33.82 1.3 55 7.9 0.93 <0.50 <0.50Nov 13 1978.49 26.20 1952.29 6.5 2.4 4.3 1.7 23.26 1.6 88 12 2.4 <0.50 <0.50Mar 14 1978.49 26.47 1952.02 7.6 2.6 58.7 3.6 23.75 1.7 128 2.6 <0.50 <0.50 <0.50Jun 14 1978.49 NM NM NM NM NM NM NM NM NM NS NS NS NSSep 14 1978.49 NM NM NM NM NM NM NM NM NM NS NS NS NSNov 14 1978.49 NM NM NM NM NM NM NM NM NM NS NS NS NSMar 15 1978.49 25.36 1953.13 7.9 2.8 4.5 5.0 17.67 1.8 207 13 1.6 <0.50 <0.50
Nov 12 NM 25.34 NM 8.1 3.1 NM 2.0 20.43 2.0 -132 320 1.7 <0.50 <0.50Mar 13 NM NM NM NM NM NM NM NM NM NM 270 1.6 <0.50 <0.50Jun 13 NM 26.18 NM 7.5 3.2 NM 3.5 37.72 2.1 135 53 0.73 <0.50 <0.50Sep 13 1978.49 26.69 1951.80 7.7 2.0 NM 4.0 37.45 1.3 -39 37 0.73 <0.50 <0.50Nov 13 1978.49 26.19 1952.30 6.4 2.3 238.0 3.5 26.72 1.5 38 51 0.64 <0.50 <0.50Mar 14 1978.49 26.50 1951.99 7.6 2.7 33.8 3.2 23.34 1.8 46 27 <0.50 <0.50 <0.50Jun 14 1978.49 NM NM NM NM NM NM NM NM NM NS NS NS NSSep 14 1978.49 NM NM NM NM NM NM NM NM NM NS NS NS NSNov 14 1978.49 NM NM NM NM NM NM NM NM NM NS NS NS NSMar 15 1978.49 25.32 1953.17 7.3 3.0 92.3 3.5 21.84 1.9 340 100 1.5 <0.50 <0.50
MW-40 CMT-40
MW-40 CMT-30
MW-40 CMT-35

Maryland Square PCE SiteCardno ATC
Page 46 of 47
Well ID Date
Top of Casing
Elevation (feet msl)
Depth to Groundwater Level (feet)
Groundwater Elevation (feet msl)
pH Specific
Conductance (mS/cm)
Turbidity
(NTU)
Dissolved Oxygen (mg/L)
Temp (ºC) TDS (g/L)
ORP (mV)
PCE (μg/L)
TCE (μg/L)
cis-1,2-DCE
(μg/L)
Vinyl Chloride
(μg/L)
Table A-2: Historical Groundwater Gauging and Analytical DataMaryland Square Shopping Center
Nov 12 NM 25.28 NM 8.0 3.3 NM 2.1 20.47 2.1 -159 280 1.9 <0.50 <0.50Mar 13 NM NM NM NM NM NM NM NM NM NM 310 1.6 <0.50 <0.50Jun 13 NM 26.14 NM 7.7 3.1 NM 4.2 29.10 2.0 203 47 <0.50 <0.50 <0.50Sep 13 1978.49 26.66 1951.83 7.2 2.2 NM 2.9 38.22 1.2 -90 110 1.3 <0.50 <0.50Nov 13 1978.49 26.16 1952.33 6.3 2.6 5.0 3.0 26.60 1.6 82 77 1.1 <0.50 <0.50Mar 14 1978.49 26.55 1951.94 7.6 2.7 67.9 4.7 26.76 1.8 57 24 <0.50 <0.50 <0.50Jun 14 1978.49 26.41 1952.08 7.0 3.0 7.1 4.7 36.07 2.0 -66 250 1.3 <0.50 <0.50Sep 14 1978.49 26.50 1951.99 7.3 2.0 25.4 3.3 33.31 1.3 -51 240 3.0 <0.50 <0.50Nov 14 1978.49 25.69 1952.80 7.5 3.1 5.2 6.6 20.28 2.0 -14 150 0.9 <0.50 <0.50Mar 15 1978.49 25.12 1953.37 6.4 0.8 12.2 4.2 23.38 0.5 361 120 3.2 <0.50 <0.50
Nov 12 NM 25.28 NM 8.2 3.4 NM 2.0 19.27 2.2 -175 300 2.5 <0.50 <0.50Mar 13 NM NM NM NM NM NM NM NM NM NM 280 2.4 <0.50 <0.50Jun 13 NM 26.14 NM 7.7 3.2 NM 5.7 29.51 2.1 165 64 <0.50 <0.50 <0.50Sep 13 1978.49 26.63 1951.86 7.2 3.4 NM 5.8 29.36 2.3 243 24 <0.50 <0.50 <0.50Nov 13 1978.49 26.15 1952.34 6.5 2.5 12.9 1.5 25.67 1.6 29 120 1.8 <0.50 <0.50Mar 14 1978.49 26.49 1952.00 7.5 2.6 81.0 3.3 20.48 1.7 41 72 0.89 <0.50 <0.50Jun 14 1978.49 NM NM NM NM NM NM NM NM NM NS NS NS NSSep 14 1978.49 NM NM NM NM NM NM NM NM NM NS NS NS NSNov 14 1979.49 NM NM NM NM NM NM NM NM NM NS NS NS NSMar 15 1979.49 25.11 1954.38 6.7 0.5 5.0 3.2 23.78 0.3 315 160 6.8 <0.50 <0.50
Nov 12 NM 25.33 NM 8.0 2.9 NM 3.6 20.60 1.9 -55 930 4.0 1.7 <0.50Mar 13 NM NM NM NM NM NM NM NM NM NM 390 4.1 1.7 <0.50Jun 13 NM 26.12 NM 7.5 3.1 NM 4.3 28.93 2.0 178 200 0.57 <0.50 <0.50Sep 13 1978.49 26.61 1951.88 7.7 3.2 NM 4.5 31.25 2.4 168 38 1.0 <0.50 <0.50Nov 13 1978.49 26.15 1952.34 6.2 2.3 17.2 3.1 26.89 1.4 38 110 0.86 <0.50 <0.50Mar 14 1978.49 26.56 1951.93 7.4 2.5 90.3 3.9 31.25 1.6 -69 130 3.1 <0.50 <0.50Jun 14 1978.49 NM NM NM NM NM NM NM NM NM NS NS NS NSSep 14 1978.49 NM NM NM NM NM NM NM NM NM NS NS NS NSNov 14 1978.49 NM NM NM NM NM NM NM NM NM NS NS NS NSMar 15 1978.49 25.11 1953.38 7.3 0.6 5.3 2.8 23.03 0.4 379 430 6.7 1.0 <0.50
Nov 12 NM 25.38 NM 8.0 3.2 NM 2.6 18.85 2.1 -128 1,400 11 6.3 <0.50Mar 13 NM NM NM NM NM NM NM NM NM NM 1,200 9.5 6.0 <0.50Jun 13 NM 26.16 NM 7.5 3.3 NM 4.9 29.49 2.1 220 1,000 5.9 3.6 <0.50Sep 13 1978.49 26.62 1951.87 7.6 3.4 NM 5.0 29.80 2.2 236 20 0.56 <0.50 <0.50Nov 13 1978.49 26.16 1952.33 5.9 1.0 619.0 1.7 22.22 0.7 -78 190 3.6 2.5 <0.50Mar 14 1978.49 26.54 1951.95 7.4 2.6 65.3 5.5 31.53 1.7 -84 360 6.5 2.2 <0.50Jun 14 1978.49 26.56 1951.93 7.1 3.0 5.7 5.4 35.94 1.9 -49 750 8.0 2.9 <0.50Sep 14 1978.49 26.52 1951.97 7.2 2.9 35.2 3.4 32.51 1.9 -114 700 10.0 2.8 <0.50Nov 14 1978.49 25.70 1952.79 7.2 3.0 2.3 18.4 22.40 2.0 28 1,000 6.8 2.6 <0.50Mar 15 1978.49 25.17 1953.32 6.7 2.9 5.9 3.1 23.42 1.9 253 190 8.9 1.8 <0.50
MW-40 CMT-60
MW-40 CMT-45
MW-40 CMT-50
MW-40 CMT-55

Maryland Square PCE SiteCardno ATC
Page 47 of 47
Well ID Date
Top of Casing
Elevation (feet msl)
Depth to Groundwater Level (feet)
Groundwater Elevation (feet msl)
pH Specific
Conductance (mS/cm)
Turbidity
(NTU)
Dissolved Oxygen (mg/L)
Temp (ºC) TDS (g/L)
ORP (mV)
PCE (μg/L)
TCE (μg/L)
cis-1,2-DCE
(μg/L)
Vinyl Chloride
(μg/L)
Table A-2: Historical Groundwater Gauging and Analytical DataMaryland Square Shopping Center
Sep 13 1908.89 14.81 1894.08 6.9 3.7 NM 2.7 26.56 2.8 135 1.7 <0.50 <0.50 <0.50Nov 13 1908.89 15.05 1893.84 6.7 3.9 239.0 1.1 21.40 2.2 360 2.6 <0.50 <0.50 <0.50Mar 14 1908.89 14.55 1894.34 7.3 3.3 192.0 2.8 20.93 2.2 64 2.1 <0.50 <0.50 <0.50Jun 14 1908.89 15.34 1893.55 6.9 3.6 76.1 1.2 26.24 2.3 85 2.8 <0.50 <0.50 <0.50Sep 14 1908.89 15.50 1893.39 7.0 3.6 68.4 2.4 26.18 2.3 54 2.8 <0.50 <0.50 <0.50Nov 14 1908.89 15.47 1893.42 6.9 3.7 57.0 1.2 20.80 2.4 25 3.7 <0.50 <0.50 <0.50Mar 15 1908.89 14.85 1894.04 6.7 3.7 33.1 1.6 21.17 2.4 38 3.5 <0.50 <0.50 <0.50
Sep 13 1910.31 16.16 1894.15 7.1 4.1 NM 3.0 24.55 2.7 66 0.53 <0.50 <0.50 <0.50Nov 13 1910.31 16.32 1893.99 7.0 4.3 29.4 2.1 21.41 2.8 326 0.60 <0.50 <0.50 <0.50Mar 14 1910.31 16.01 1894.30 7.3 3.7 73.8 1.5 20.05 2.4 41 <0.50 <0.50 <0.50 <0.50Jun 14 1910.31 16.51 1893.80 6.7 4.0 13.6 2.1 23.60 2.6 105 0.58 <0.50 <0.50 <0.50Sep 14 1910.31 16.45 1893.86 6.8 4.0 21.4 3.2 23.75 2.6 107 0.53 <0.50 <0.50 <0.50Nov 14 1910.31 16.57 1893.74 7.0 4.1 6.3 1.7 22.21 2.7 -5 0.71 <0.50 <0.50 <0.50Mar 15 1910.31 16.12 1894.19 6.7 4.1 6.5 2.3 20.16 2.7 23 0.62 <0.50 <0.50 <0.50
Sep 13 1958.33 17.14 1941.19 7.1 3.5 NM 3.1 26.33 2.2 45 <0.50 <0.50 <0.50 <0.50Nov 13 1958.33 16.96 1941.37 7.0 3.6 163.0 2.2 22.87 2.3 138 <0.50 <0.50 <0.50 <0.50Mar 14 1958.33 16.11 1942.22 7.2 3.0 109.0 1.6 22.15 1.9 45 <0.50 <0.50 <0.50 <0.50Jun 14 1958.33 17.15 1941.18 6.7 3.2 61.3 2.3 25.50 2.1 128 <0.50 <0.50 <0.50 <0.50Sep 14 1958.33 17.33 1941.00 6.8 3.1 70.4 2.7 25.53 2.0 170 <0.50 <0.50 <0.50 <0.50Nov 14 1958.33 16.63 1941.70 7.0 3.2 23.5 2.9 23.23 2.1 98 <0.50 <0.50 <0.50 <0.50Mar 15 1958.33 15.60 1942.73 6.7 3.2 20.3 1.4 21.61 2.1 85 <0.50 <0.50 <0.50 <0.50
Notes: NM = Not Measured *: All wells were resurveyed to determine top of casing elevationmsl = mean sea level Mar 2014: Wells monitored were determined to not be representative ND = Non Detect of site conditions. NS = Not Sampled
MW-41
MW-42
MW-43
°C = degrees Celsiusg/L = gallons per litermg/L = milligrams per litermS/cm = milli Siemens per centimetermV = milllivoltsNTU = Nephelometric Turbudity Units
μg/L = micrograms per liter

Maryland Square PCE Site
FIGURES

2925 East Patrick Lane, Suite M Las Vegas, Nevada 89120-2457
SITE VICINITIY MAP DATE: 12/12
APPROVED BY: ADS Figure
1
Ph: (702) 798-5750 *** Fax: (702) 798-5742
DRAWN BY: ABK
SOURCE: Google Earth
PROJECT NUMBER: Z085000030
MARYLAND SQUARE SHOPPING CENTER 3661 S. MARYLAND PARKWAY
LAS VEGAS, NEVADA
SITE LOCATION
1 inch = 1,000 feet
Note: Scale and location are approximate


Maryland Square PCE Site
M
APPENDIX A FIELD SHEETS

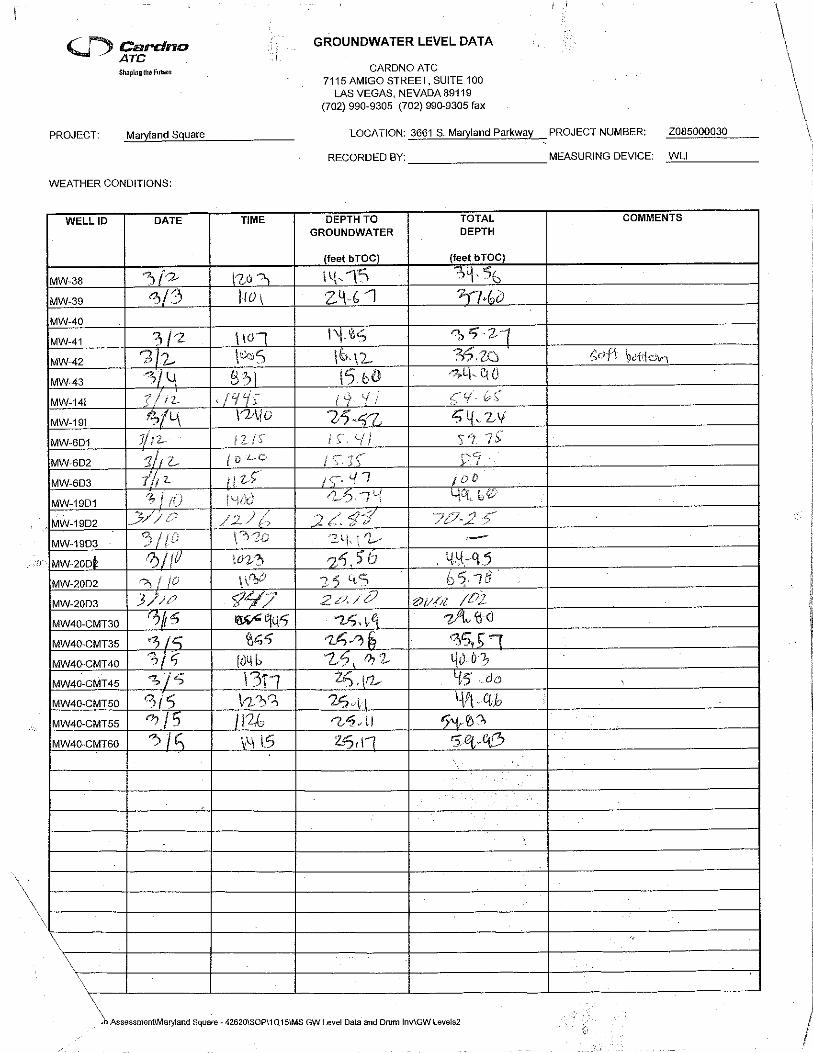


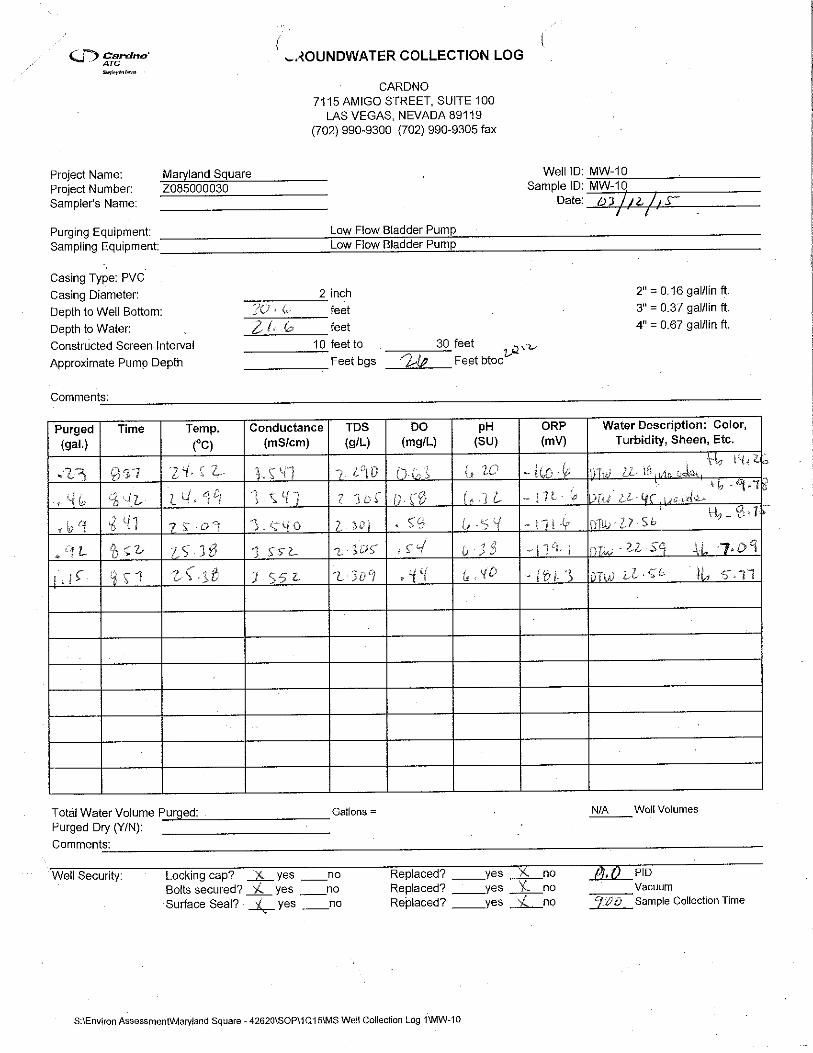


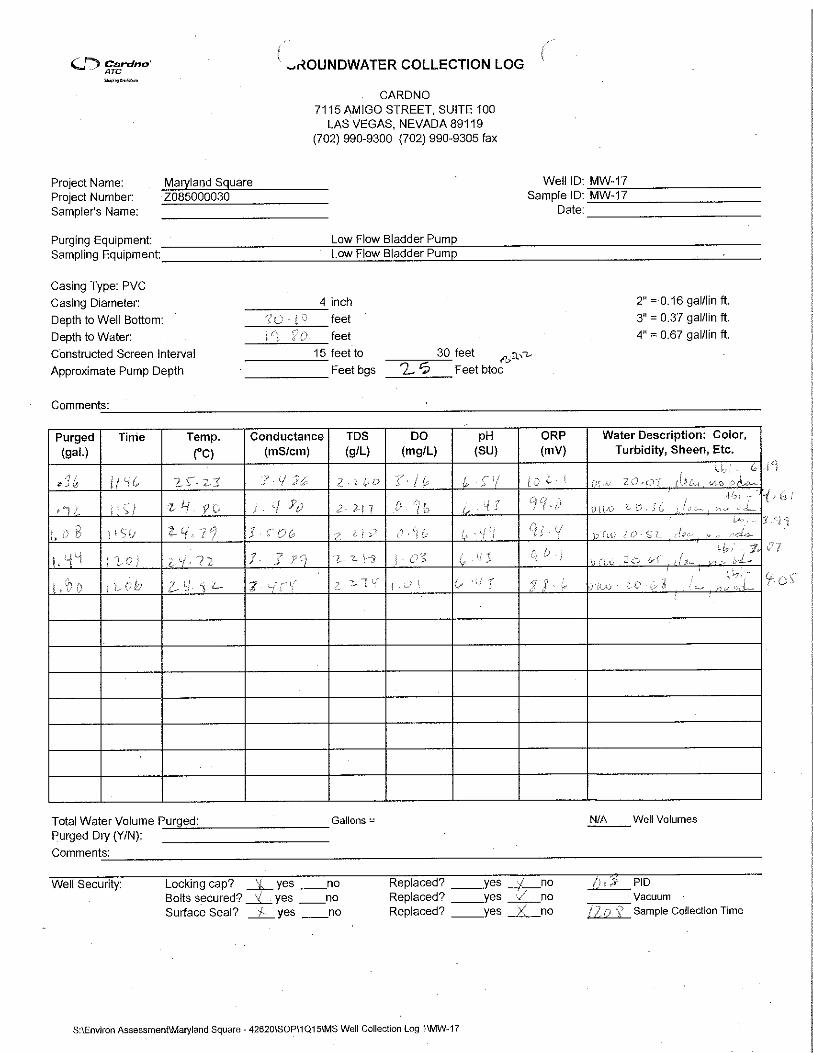


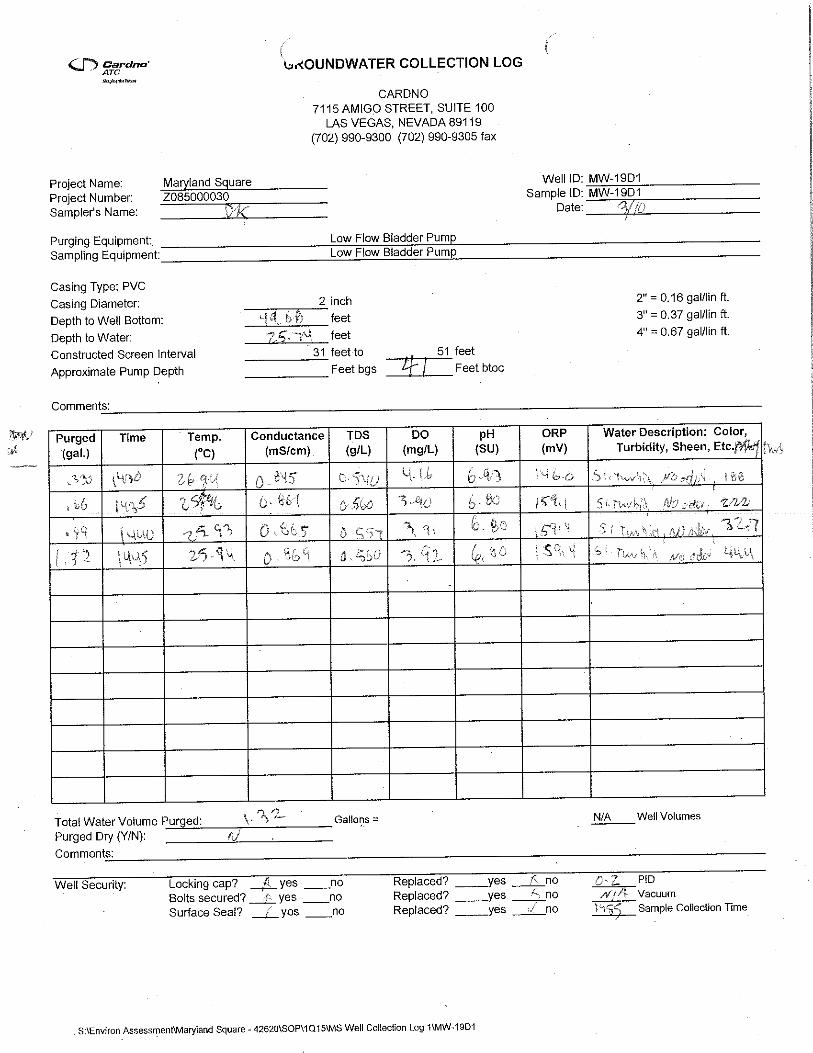


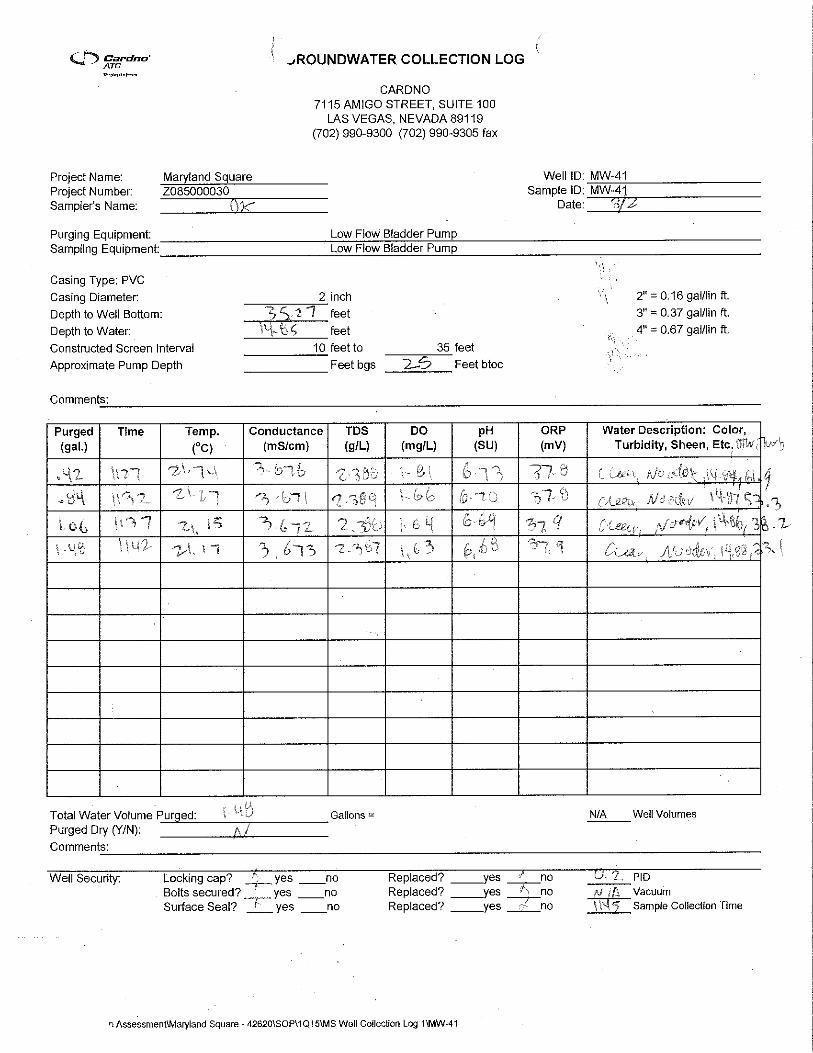

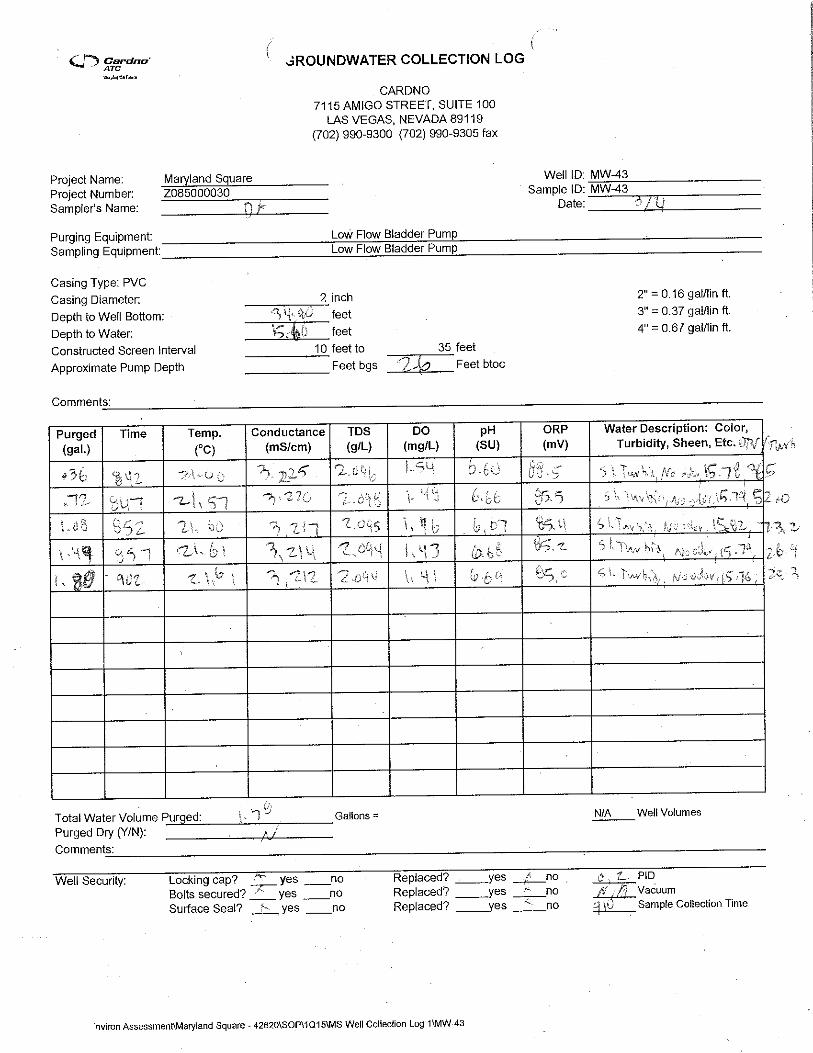

Maryland Square PCE Site
APPENDIX B LABORATORY ANALYTICAL REPORTS

NEVADA 3151 W. Post Rd., Las Vegas, NV 89118
P: 702.307.2659 F: 702.307.2691
“Serving Clients with Passion and Professionalism”
CALIFORNIA 11060 Artesia Blvd., Ste C, Cerritos, CA 90703
P: 562.219.7435 F: 562.219.7436
March 16, 2015
Cardno ATCAndrew Stuart
Attention: Andrew Stuart
RE: Maryland Square, Z085000030
Workorder No.: N014893FAX:TEL: (702) 990-9300
7115 Amigo Street Suite 100Las Vegas, NV 89119
CA-ELAP No.: 2676NV Cert. No.: NV-00922
Thank you for the opportunity to service the needs of your company.
Please feel free to call me at (702) 307-2659 if I can be of further assistance to your company.
Sincerely,
Glen Gesmundo
QA Manager
Enclosed are the results for sample(s) received on March 06, 2015 by ASSET Laboratories . The sample(s) are tested for the parameters as indicated in the enclosed chain of custody in accordance with the applicable laboratory certifications.
The cover letter is an integral part of this analytical report. This Laboratory Report cannot be reproduced in part or in its entirety without written permission from the client and Advanced Technology Laboratories - Las Vegas.
1 of 45
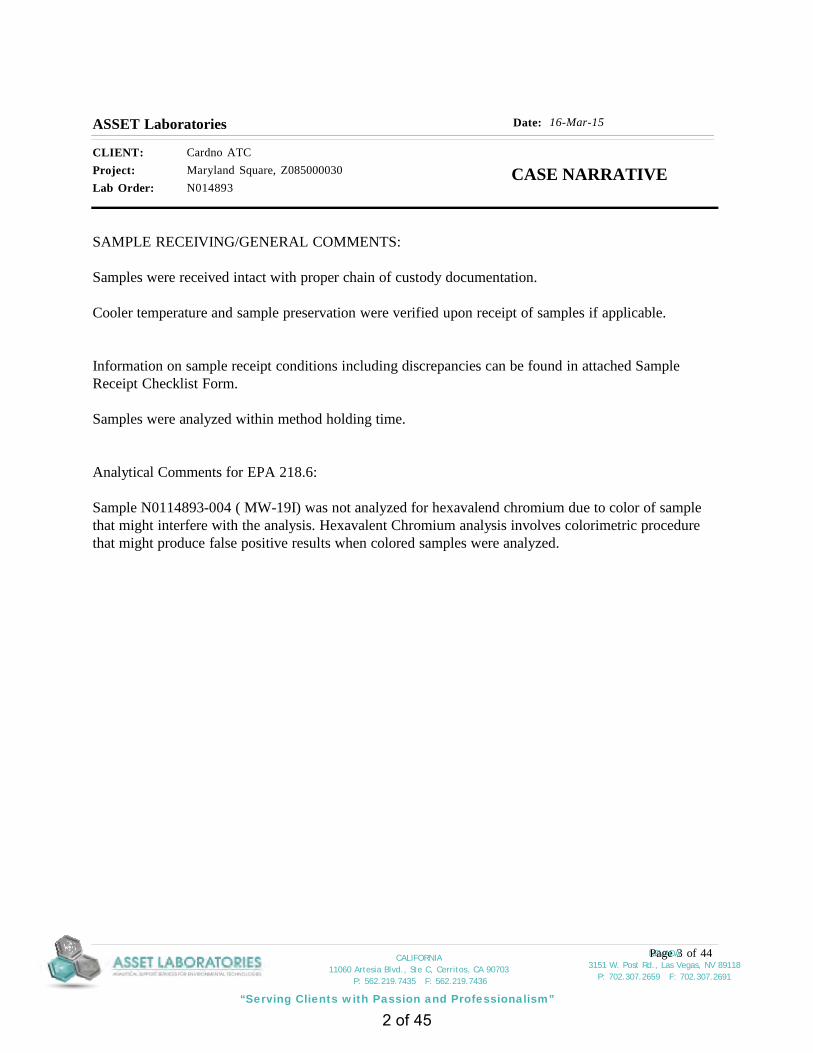
NEVADA 3151 W. Post Rd., Las Vegas, NV 89118
P: 702.307.2659 F: 702.307.2691
“Serving Clients with Passion and Professionalism”
CALIFORNIA 11060 Artesia Blvd., Ste C, Cerritos, CA 90703
P: 562.219.7435 F: 562.219.7436
16-Mar-15Date:ASSET Laboratories
Project: Maryland Square, Z085000030CLIENT: Cardno ATC
Lab Order: N014893CASE NARRATIVE
SAMPLE RECEIVING/GENERAL COMMENTS:
Samples were received intact with proper chain of custody documentation.
Cooler temperature and sample preservation were verified upon receipt of samples if applicable.
Information on sample receipt conditions including discrepancies can be found in attached Sample Receipt Checklist Form.
Samples were analyzed within method holding time.
Analytical Comments for EPA 218.6:
Sample N0114893-004 ( MW-19I) was not analyzed for hexavalend chromium due to color of sample that might interfere with the analysis. Hexavalent Chromium analysis involves colorimetric procedure that might produce false positive results when colored samples were analyzed.
Page 3 of 44
2 of 45

NEVADA 3151 W. Post Rd., Las Vegas, NV 89118
P: 702.307.2659 F: 702.307.2691
“Serving Clients with Passion and Professionalism”
CALIFORNIA 11060 Artesia Blvd., Ste C, Cerritos, CA 90703
P: 562.219.7435 F: 562.219.7436
16-Mar-15Date:ASSET Laboratories
Project: Maryland Square, Z085000030CLIENT: Cardno ATC
Lab Order: N014893Work Order Sample Summary
Lab Sample ID Client Sample ID Collection DateMatrix Date Received
Contract No:
Date Reported
N014893-001A MW-11 3/4/2015 11:45:00 AM 3/6/2015 3/16/2015Groundwater
N014893-002A MW-16 3/4/2015 12:30:00 PM 3/6/2015 3/16/2015Groundwater
N014893-003A MW-19 3/4/2015 3:20:00 PM 3/6/2015 3/16/2015Groundwater
N014893-003B MW-19 3/4/2015 3:20:00 PM 3/6/2015 3/16/2015Groundwater
N014893-003C MW-19 3/4/2015 3:20:00 PM 3/6/2015 3/16/2015Groundwater
N014893-004A MW-19I 3/4/2015 1:12:00 PM 3/6/2015 3/16/2015Groundwater
N014893-004B MW-19I 3/4/2015 1:12:00 PM 3/6/2015 3/16/2015Groundwater
N014893-004C MW-19I 3/4/2015 1:12:00 PM 3/6/2015 3/16/2015Groundwater
N014893-005A MW-21 3/4/2015 2:30:00 PM 3/6/2015 3/16/2015Groundwater
N014893-006A MW-22 3/4/2015 9:57:00 AM 3/6/2015 3/16/2015Groundwater
N014893-007A MW-23 3/3/2015 3:47:00 PM 3/6/2015 3/16/2015Groundwater
N014893-008A MW-24 3/4/2015 10:50:00 AM 3/6/2015 3/16/2015Groundwater
N014893-009A MW-25 3/3/2015 1:30:00 PM 3/6/2015 3/16/2015Groundwater
N014893-010A MW-26 3/3/2015 2:12:00 PM 3/6/2015 3/16/2015Groundwater
N014893-011A MW-27 3/2/2015 4:14:00 PM 3/6/2015 3/16/2015Groundwater
N014893-012A MW-28 3/3/2015 10:07:00 AM 3/6/2015 3/16/2015Groundwater
N014893-013A MW-29 3/3/2015 9:27:00 AM 3/6/2015 3/16/2015Groundwater
N014893-014A MW-30 3/2/2015 3:20:00 PM 3/6/2015 3/16/2015Groundwater
N014893-015A MW-31 3/2/2015 2:30:00 PM 3/6/2015 3/16/2015Groundwater
N014893-016A MW-32 3/3/2015 2:57:00 PM 3/6/2015 3/16/2015Groundwater
N014893-017A MW-33 3/3/2015 10:47:00 AM 3/6/2015 3/16/2015Groundwater
N014893-018A MW-36 3/3/2015 12:30:00 PM 3/6/2015 3/16/2015Groundwater
N014893-019A MW-37 3/2/2015 1:40:00 PM 3/6/2015 3/16/2015Groundwater
N014893-020A MW-38 3/2/2015 12:43:00 PM 3/6/2015 3/16/2015Groundwater
N014893-021A MW-39 3/3/2015 11:47:00 AM 3/6/2015 3/16/2015Groundwater
N014893-022A MW-41 3/2/2015 11:45:00 AM 3/6/2015 3/16/2015Groundwater
N014893-023A MW-42 3/2/2015 10:41:00 AM 3/6/2015 3/16/2015Groundwater
N014893-024A MW-43 3/4/2015 9:10:00 AM 3/6/2015 3/16/2015Groundwater
N014893-025A MW-40 CMT30 3/5/2015 10:38:00 AM 3/6/2015 3/16/2015Groundwater
Page 1 of 2
3 of 45

NEVADA 3151 W. Post Rd., Las Vegas, NV 89118
P: 702.307.2659 F: 702.307.2691
“Serving Clients with Passion and Professionalism”
CALIFORNIA 11060 Artesia Blvd., Ste C, Cerritos, CA 90703
P: 562.219.7435 F: 562.219.7436
Project: Maryland Square, Z085000030CLIENT: Cardno ATC
Lab Order: N014893Work Order Sample Summary
Lab Sample ID Client Sample ID Collection DateMatrix Date Received
Contract No:
Date Reported
N014893-025B MW-40 CMT30 3/5/2015 10:38:00 AM 3/6/2015 3/16/2015Groundwater
N014893-025C MW-40 CMT30 3/5/2015 10:38:00 AM 3/6/2015 3/16/2015Groundwater
N014893-026A MW-40 CMT35 3/5/2015 9:30:00 AM 3/6/2015 3/16/2015Groundwater
N014893-026B MW-40 CMT35 3/5/2015 9:30:00 AM 3/6/2015 3/16/2015Groundwater
N014893-026C MW-40 CMT35 3/5/2015 9:30:00 AM 3/6/2015 3/16/2015Groundwater
N014893-027A MW-40 CMT40 3/5/2015 11:27:00 AM 3/6/2015 3/16/2015Groundwater
N014893-027B MW-40 CMT40 3/5/2015 11:27:00 AM 3/6/2015 3/16/2015Groundwater
N014893-027C MW-40 CMT40 3/5/2015 11:27:00 AM 3/6/2015 3/16/2015Groundwater
N014893-028A MW-40 CMT45 3/5/2015 2:00:00 PM 3/6/2015 3/16/2015Groundwater
N014893-028B MW-40 CMT45 3/5/2015 2:00:00 PM 3/6/2015 3/16/2015Groundwater
N014893-028C MW-40 CMT45 3/5/2015 2:00:00 PM 3/6/2015 3/16/2015Groundwater
N014893-029A MW-40 CMT50 3/5/2015 1:08:00 PM 3/6/2015 3/16/2015Groundwater
N014893-029B MW-40 CMT50 3/5/2015 1:08:00 PM 3/6/2015 3/16/2015Groundwater
N014893-029C MW-40 CMT50 3/5/2015 1:08:00 PM 3/6/2015 3/16/2015Groundwater
N014893-030A MW-40 CMT55 3/5/2015 12:04:00 PM 3/6/2015 3/16/2015Groundwater
N014893-030B MW-40 CMT55 3/5/2015 12:04:00 PM 3/6/2015 3/16/2015Groundwater
N014893-030C MW-40 CMT55 3/5/2015 12:04:00 PM 3/6/2015 3/16/2015Groundwater
N014893-031A MW-40 CMT60 3/5/2015 3:17:00 PM 3/6/2015 3/16/2015Groundwater
N014893-031B MW-40 CMT60 3/5/2015 3:17:00 PM 3/6/2015 3/16/2015Groundwater
N014893-031C MW-40 CMT60 3/5/2015 3:17:00 PM 3/6/2015 3/16/2015Groundwater
Page 2 of 2
4 of 45
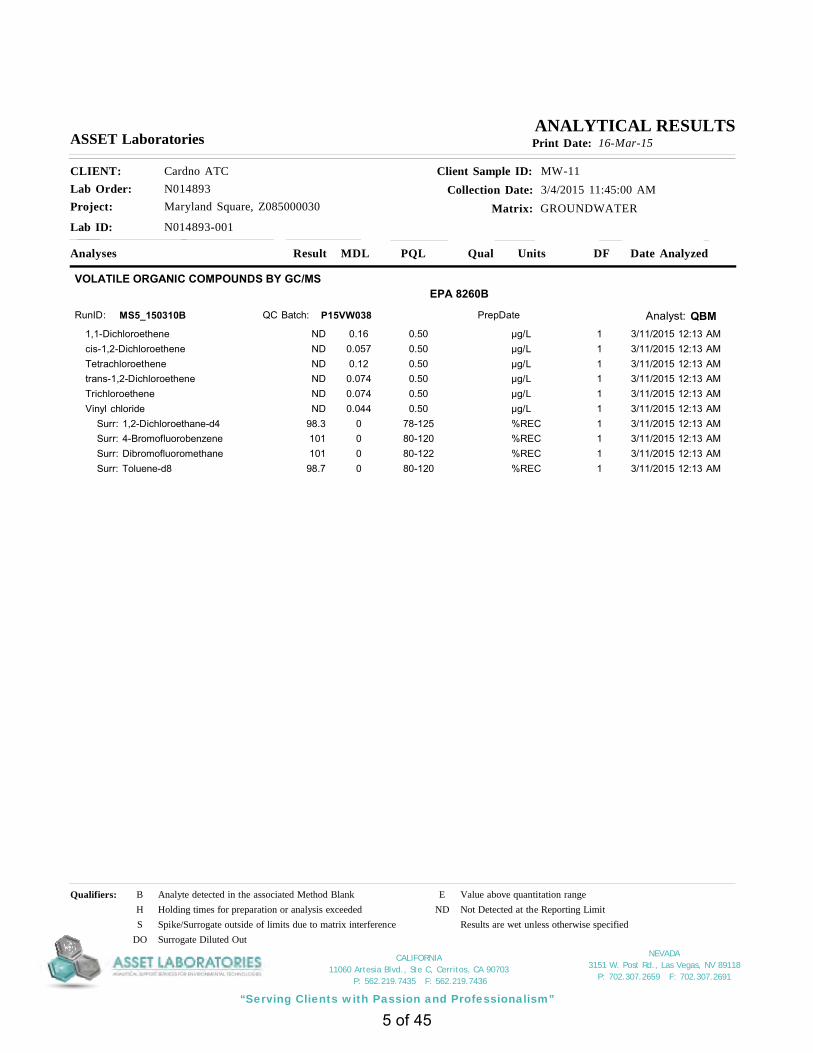
NEVADA 3151 W. Post Rd., Las Vegas, NV 89118
P: 702.307.2659 F: 702.307.2691
“Serving Clients with Passion and Professionalism”
CALIFORNIA 11060 Artesia Blvd., Ste C, Cerritos, CA 90703
P: 562.219.7435 F: 562.219.7436
Project: Maryland Square, Z085000030
Client Sample ID: MW-11Collection Date: 3/4/2015 11:45:00 AM
Matrix: GROUNDWATER
CLIENT: Cardno ATCLab Order: N014893
Lab ID: N014893-001
ASSET Laboratories Print Date: 16-Mar-15
Analyses Result Qual Units Date AnalyzedDFPQLMDL
ANALYTICAL RESULTS
VOLATILE ORGANIC COMPOUNDS BY GC/MSEPA 8260B
Analyst: QBMRunID: MS5_150310B P15VW038QC Batch: PrepDate
1,1-Dichloroethene 0.50 µg/L 1ND 0.16 3/11/2015 12:13 AMcis-1,2-Dichloroethene 0.50 µg/L 1ND 0.057 3/11/2015 12:13 AMTetrachloroethene 0.50 µg/L 1ND 0.12 3/11/2015 12:13 AMtrans-1,2-Dichloroethene 0.50 µg/L 1ND 0.074 3/11/2015 12:13 AMTrichloroethene 0.50 µg/L 1ND 0.074 3/11/2015 12:13 AMVinyl chloride 0.50 µg/L 1ND 0.044 3/11/2015 12:13 AM Surr: 1,2-Dichloroethane-d4 78-125 %REC 198.3 0 3/11/2015 12:13 AM Surr: 4-Bromofluorobenzene 80-120 %REC 1101 0 3/11/2015 12:13 AM Surr: Dibromofluoromethane 80-122 %REC 1101 0 3/11/2015 12:13 AM Surr: Toluene-d8 80-120 %REC 198.7 0 3/11/2015 12:13 AM
Qualifiers: B Analyte detected in the associated Method Blank E Value above quantitation rangeH Holding times for preparation or analysis exceeded ND Not Detected at the Reporting LimitS Spike/Surrogate outside of limits due to matrix interference Results are wet unless otherwise specified
DO Surrogate Diluted Out
5 of 45

NEVADA 3151 W. Post Rd., Las Vegas, NV 89118
P: 702.307.2659 F: 702.307.2691
“Serving Clients with Passion and Professionalism”
CALIFORNIA 11060 Artesia Blvd., Ste C, Cerritos, CA 90703
P: 562.219.7435 F: 562.219.7436
Project: Maryland Square, Z085000030
Client Sample ID: MW-16Collection Date: 3/4/2015 12:30:00 PM
Matrix: GROUNDWATER
CLIENT: Cardno ATCLab Order: N014893
Lab ID: N014893-002
ASSET Laboratories Print Date: 16-Mar-15
Analyses Result Qual Units Date AnalyzedDFPQLMDL
ANALYTICAL RESULTS
VOLATILE ORGANIC COMPOUNDS BY GC/MSEPA 8260B
Analyst: QBMRunID: MS5_150310B P15VW038QC Batch: PrepDate
1,1-Dichloroethene 0.50 µg/L 1ND 0.16 3/10/2015 11:48 PMcis-1,2-Dichloroethene 0.50 µg/L 1ND 0.057 3/10/2015 11:48 PMTetrachloroethene 0.50 µg/L 1ND 0.12 3/10/2015 11:48 PMtrans-1,2-Dichloroethene 0.50 µg/L 1ND 0.074 3/10/2015 11:48 PMTrichloroethene 0.50 µg/L 1ND 0.074 3/10/2015 11:48 PMVinyl chloride 0.50 µg/L 1ND 0.044 3/10/2015 11:48 PM Surr: 1,2-Dichloroethane-d4 78-125 %REC 197.8 0 3/10/2015 11:48 PM Surr: 4-Bromofluorobenzene 80-120 %REC 1102 0 3/10/2015 11:48 PM Surr: Dibromofluoromethane 80-122 %REC 1101 0 3/10/2015 11:48 PM Surr: Toluene-d8 80-120 %REC 198.4 0 3/10/2015 11:48 PM
Qualifiers: B Analyte detected in the associated Method Blank E Value above quantitation rangeH Holding times for preparation or analysis exceeded ND Not Detected at the Reporting LimitS Spike/Surrogate outside of limits due to matrix interference Results are wet unless otherwise specified
DO Surrogate Diluted Out
6 of 45

NEVADA 3151 W. Post Rd., Las Vegas, NV 89118
P: 702.307.2659 F: 702.307.2691
“Serving Clients with Passion and Professionalism”
CALIFORNIA 11060 Artesia Blvd., Ste C, Cerritos, CA 90703
P: 562.219.7435 F: 562.219.7436
Project: Maryland Square, Z085000030
Client Sample ID: MW-19Collection Date: 3/4/2015 3:20:00 PM
Matrix: GROUNDWATER
CLIENT: Cardno ATCLab Order: N014893
Lab ID: N014893-003
ASSET Laboratories Print Date: 16-Mar-15
Analyses Result Qual Units Date AnalyzedDFPQLMDL
ANALYTICAL RESULTS
VOLATILE ORGANIC COMPOUNDS BY GC/MSEPA 8260B
Analyst: QBMRunID: MS5_150310B P15VW038QC Batch: PrepDate
1,1-Dichloroethene 0.50 µg/L 1ND 0.16 3/11/2015 07:42 AMcis-1,2-Dichloroethene 0.50 µg/L 1ND 0.057 3/11/2015 07:42 AMTetrachloroethene 10 µg/L 20930 2.3 3/12/2015 12:31 AMtrans-1,2-Dichloroethene 0.50 µg/L 1ND 0.074 3/11/2015 07:42 AMTrichloroethene 0.50 µg/L 14.0 0.074 3/11/2015 07:42 AMVinyl chloride 0.50 µg/L 1ND 0.044 3/11/2015 07:42 AM Surr: 1,2-Dichloroethane-d4 78-125 %REC 1101 0 3/11/2015 07:42 AM Surr: 1,2-Dichloroethane-d4 78-125 %REC 20103 0 3/12/2015 12:31 AM Surr: 4-Bromofluorobenzene 80-120 %REC 2099.7 0 3/12/2015 12:31 AM Surr: 4-Bromofluorobenzene 80-120 %REC 1100 0 3/11/2015 07:42 AM Surr: Dibromofluoromethane 80-122 %REC 20103 0 3/12/2015 12:31 AM Surr: Dibromofluoromethane 80-122 %REC 1103 0 3/11/2015 07:42 AM Surr: Toluene-d8 80-120 %REC 2099.7 0 3/12/2015 12:31 AM Surr: Toluene-d8 80-120 %REC 199.6 0 3/11/2015 07:42 AM
HEXAVALENT CHROMIUM BY ICEPA 218.6
Analyst: RBRunID: IC6_150309A R99366QC Batch: PrepDate
Hexavalent Chromium 0.20 µg/L 11.7 0.015 3/9/2015 01:39 PM
DISSOLVED METALS BY ICP-MSEPA 6020
Analyst: CEI
EPA 3010A
RunID: ICP7_150311A 49876QC Batch: PrepDate 3/10/2015
Arsenic 0.10 µg/L 13.8 0.027 3/11/2015 01:05 PMChromium 1.0 µg/L 11.4 0.030 3/11/2015 01:05 PMManganese 0.50 µg/L 1ND 0.026 3/11/2015 01:05 PM
Qualifiers: B Analyte detected in the associated Method Blank E Value above quantitation rangeH Holding times for preparation or analysis exceeded ND Not Detected at the Reporting LimitS Spike/Surrogate outside of limits due to matrix interference Results are wet unless otherwise specified
DO Surrogate Diluted Out
7 of 45

NEVADA 3151 W. Post Rd., Las Vegas, NV 89118
P: 702.307.2659 F: 702.307.2691
“Serving Clients with Passion and Professionalism”
CALIFORNIA 11060 Artesia Blvd., Ste C, Cerritos, CA 90703
P: 562.219.7435 F: 562.219.7436
Project: Maryland Square, Z085000030
Client Sample ID: MW-19ICollection Date: 3/4/2015 1:12:00 PM
Matrix: GROUNDWATER
CLIENT: Cardno ATCLab Order: N014893
Lab ID: N014893-004
ASSET Laboratories Print Date: 16-Mar-15
Analyses Result Qual Units Date AnalyzedDFPQLMDL
ANALYTICAL RESULTS
VOLATILE ORGANIC COMPOUNDS BY GC/MSEPA 8260B
Analyst: QBMRunID: MS5_150310B P15VW038QC Batch: PrepDate
1,1-Dichloroethene 0.50 µg/L 1ND 0.16 3/11/2015 12:38 AMcis-1,2-Dichloroethene 0.50 µg/L 1ND 0.057 3/11/2015 12:38 AMTetrachloroethene 0.50 µg/L 10.62 0.12 3/11/2015 12:38 AMtrans-1,2-Dichloroethene 0.50 µg/L 1ND 0.074 3/11/2015 12:38 AMTrichloroethene 0.50 µg/L 1ND 0.074 3/11/2015 12:38 AMVinyl chloride 0.50 µg/L 1ND 0.044 3/11/2015 12:38 AM Surr: 1,2-Dichloroethane-d4 78-125 %REC 199.5 0 3/11/2015 12:38 AM Surr: 4-Bromofluorobenzene 80-120 %REC 199.9 0 3/11/2015 12:38 AM Surr: Dibromofluoromethane 80-122 %REC 1100 0 3/11/2015 12:38 AM Surr: Toluene-d8 80-120 %REC 192.8 0 3/11/2015 12:38 AM
DISSOLVED METALS BY ICP-MSEPA 6020
Analyst: CEI
EPA 3010A
RunID: ICP7_150311A 49876QC Batch: PrepDate 3/10/2015
Arsenic 0.50 µg/L 51.0 0.13 3/11/2015 12:00 PMChromium 5.0 µg/L 5160 0.15 3/11/2015 12:00 PMManganese 250 µg/L 50054000 13 3/11/2015 01:10 PM
Qualifiers: B Analyte detected in the associated Method Blank E Value above quantitation rangeH Holding times for preparation or analysis exceeded ND Not Detected at the Reporting LimitS Spike/Surrogate outside of limits due to matrix interference Results are wet unless otherwise specified
DO Surrogate Diluted Out
8 of 45

NEVADA 3151 W. Post Rd., Las Vegas, NV 89118
P: 702.307.2659 F: 702.307.2691
“Serving Clients with Passion and Professionalism”
CALIFORNIA 11060 Artesia Blvd., Ste C, Cerritos, CA 90703
P: 562.219.7435 F: 562.219.7436
Project: Maryland Square, Z085000030
Client Sample ID: MW-21Collection Date: 3/4/2015 2:30:00 PM
Matrix: GROUNDWATER
CLIENT: Cardno ATCLab Order: N014893
Lab ID: N014893-005
ASSET Laboratories Print Date: 16-Mar-15
Analyses Result Qual Units Date AnalyzedDFPQLMDL
ANALYTICAL RESULTS
VOLATILE ORGANIC COMPOUNDS BY GC/MSEPA 8260B
Analyst: QBMRunID: MS5_150310B P15VW038QC Batch: PrepDate
1,1-Dichloroethene 0.50 µg/L 1ND 0.16 3/11/2015 02:44 AMcis-1,2-Dichloroethene 0.50 µg/L 1ND 0.057 3/11/2015 02:44 AMTetrachloroethene 0.50 µg/L 111 0.12 3/11/2015 02:44 AMtrans-1,2-Dichloroethene 0.50 µg/L 1ND 0.074 3/11/2015 02:44 AMTrichloroethene 0.50 µg/L 1ND 0.074 3/11/2015 02:44 AMVinyl chloride 0.50 µg/L 1ND 0.044 3/11/2015 02:44 AM Surr: 1,2-Dichloroethane-d4 78-125 %REC 1100 0 3/11/2015 02:44 AM Surr: 4-Bromofluorobenzene 80-120 %REC 198.2 0 3/11/2015 02:44 AM Surr: Dibromofluoromethane 80-122 %REC 1103 0 3/11/2015 02:44 AM Surr: Toluene-d8 80-120 %REC 198.2 0 3/11/2015 02:44 AM
Qualifiers: B Analyte detected in the associated Method Blank E Value above quantitation rangeH Holding times for preparation or analysis exceeded ND Not Detected at the Reporting LimitS Spike/Surrogate outside of limits due to matrix interference Results are wet unless otherwise specified
DO Surrogate Diluted Out
9 of 45

NEVADA 3151 W. Post Rd., Las Vegas, NV 89118
P: 702.307.2659 F: 702.307.2691
“Serving Clients with Passion and Professionalism”
CALIFORNIA 11060 Artesia Blvd., Ste C, Cerritos, CA 90703
P: 562.219.7435 F: 562.219.7436
Project: Maryland Square, Z085000030
Client Sample ID: MW-22Collection Date: 3/4/2015 9:57:00 AM
Matrix: GROUNDWATER
CLIENT: Cardno ATCLab Order: N014893
Lab ID: N014893-006
ASSET Laboratories Print Date: 16-Mar-15
Analyses Result Qual Units Date AnalyzedDFPQLMDL
ANALYTICAL RESULTS
VOLATILE ORGANIC COMPOUNDS BY GC/MSEPA 8260B
Analyst: QBMRunID: MS5_150310B P15VW038QC Batch: PrepDate
1,1-Dichloroethene 0.50 µg/L 1ND 0.16 3/11/2015 02:18 AMcis-1,2-Dichloroethene 0.50 µg/L 1ND 0.057 3/11/2015 02:18 AMTetrachloroethene 0.50 µg/L 1ND 0.12 3/11/2015 02:18 AMtrans-1,2-Dichloroethene 0.50 µg/L 1ND 0.074 3/11/2015 02:18 AMTrichloroethene 0.50 µg/L 1ND 0.074 3/11/2015 02:18 AMVinyl chloride 0.50 µg/L 1ND 0.044 3/11/2015 02:18 AM Surr: 1,2-Dichloroethane-d4 78-125 %REC 199.7 0 3/11/2015 02:18 AM Surr: 4-Bromofluorobenzene 80-120 %REC 199.8 0 3/11/2015 02:18 AM Surr: Dibromofluoromethane 80-122 %REC 1104 0 3/11/2015 02:18 AM Surr: Toluene-d8 80-120 %REC 1101 0 3/11/2015 02:18 AM
Qualifiers: B Analyte detected in the associated Method Blank E Value above quantitation rangeH Holding times for preparation or analysis exceeded ND Not Detected at the Reporting LimitS Spike/Surrogate outside of limits due to matrix interference Results are wet unless otherwise specified
DO Surrogate Diluted Out
10 of 45
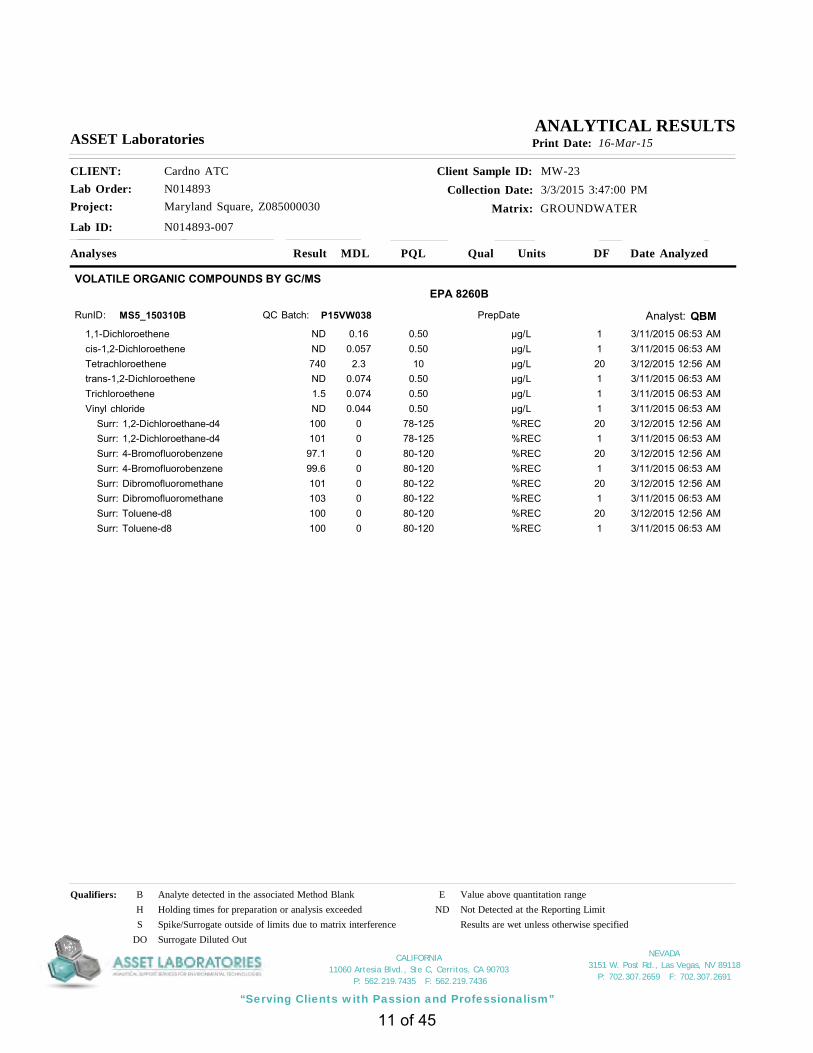
NEVADA 3151 W. Post Rd., Las Vegas, NV 89118
P: 702.307.2659 F: 702.307.2691
“Serving Clients with Passion and Professionalism”
CALIFORNIA 11060 Artesia Blvd., Ste C, Cerritos, CA 90703
P: 562.219.7435 F: 562.219.7436
Project: Maryland Square, Z085000030
Client Sample ID: MW-23Collection Date: 3/3/2015 3:47:00 PM
Matrix: GROUNDWATER
CLIENT: Cardno ATCLab Order: N014893
Lab ID: N014893-007
ASSET Laboratories Print Date: 16-Mar-15
Analyses Result Qual Units Date AnalyzedDFPQLMDL
ANALYTICAL RESULTS
VOLATILE ORGANIC COMPOUNDS BY GC/MSEPA 8260B
Analyst: QBMRunID: MS5_150310B P15VW038QC Batch: PrepDate
1,1-Dichloroethene 0.50 µg/L 1ND 0.16 3/11/2015 06:53 AMcis-1,2-Dichloroethene 0.50 µg/L 1ND 0.057 3/11/2015 06:53 AMTetrachloroethene 10 µg/L 20740 2.3 3/12/2015 12:56 AMtrans-1,2-Dichloroethene 0.50 µg/L 1ND 0.074 3/11/2015 06:53 AMTrichloroethene 0.50 µg/L 11.5 0.074 3/11/2015 06:53 AMVinyl chloride 0.50 µg/L 1ND 0.044 3/11/2015 06:53 AM Surr: 1,2-Dichloroethane-d4 78-125 %REC 20100 0 3/12/2015 12:56 AM Surr: 1,2-Dichloroethane-d4 78-125 %REC 1101 0 3/11/2015 06:53 AM Surr: 4-Bromofluorobenzene 80-120 %REC 2097.1 0 3/12/2015 12:56 AM Surr: 4-Bromofluorobenzene 80-120 %REC 199.6 0 3/11/2015 06:53 AM Surr: Dibromofluoromethane 80-122 %REC 20101 0 3/12/2015 12:56 AM Surr: Dibromofluoromethane 80-122 %REC 1103 0 3/11/2015 06:53 AM Surr: Toluene-d8 80-120 %REC 20100 0 3/12/2015 12:56 AM Surr: Toluene-d8 80-120 %REC 1100 0 3/11/2015 06:53 AM
Qualifiers: B Analyte detected in the associated Method Blank E Value above quantitation rangeH Holding times for preparation or analysis exceeded ND Not Detected at the Reporting LimitS Spike/Surrogate outside of limits due to matrix interference Results are wet unless otherwise specified
DO Surrogate Diluted Out
11 of 45

NEVADA 3151 W. Post Rd., Las Vegas, NV 89118
P: 702.307.2659 F: 702.307.2691
“Serving Clients with Passion and Professionalism”
CALIFORNIA 11060 Artesia Blvd., Ste C, Cerritos, CA 90703
P: 562.219.7435 F: 562.219.7436
Project: Maryland Square, Z085000030
Client Sample ID: MW-24Collection Date: 3/4/2015 10:50:00 AM
Matrix: GROUNDWATER
CLIENT: Cardno ATCLab Order: N014893
Lab ID: N014893-008
ASSET Laboratories Print Date: 16-Mar-15
Analyses Result Qual Units Date AnalyzedDFPQLMDL
ANALYTICAL RESULTS
VOLATILE ORGANIC COMPOUNDS BY GC/MSEPA 8260B
Analyst: QBMRunID: MS5_150310B P15VW038QC Batch: PrepDate
1,1-Dichloroethene 0.50 µg/L 1ND 0.16 3/11/2015 03:08 AMcis-1,2-Dichloroethene 0.50 µg/L 1ND 0.057 3/11/2015 03:08 AMTetrachloroethene 0.50 µg/L 10.58 0.12 3/11/2015 03:08 AMtrans-1,2-Dichloroethene 0.50 µg/L 1ND 0.074 3/11/2015 03:08 AMTrichloroethene 0.50 µg/L 1ND 0.074 3/11/2015 03:08 AMVinyl chloride 0.50 µg/L 1ND 0.044 3/11/2015 03:08 AM Surr: 1,2-Dichloroethane-d4 78-125 %REC 1101 0 3/11/2015 03:08 AM Surr: 4-Bromofluorobenzene 80-120 %REC 1100 0 3/11/2015 03:08 AM Surr: Dibromofluoromethane 80-122 %REC 1102 0 3/11/2015 03:08 AM Surr: Toluene-d8 80-120 %REC 1101 0 3/11/2015 03:08 AM
Qualifiers: B Analyte detected in the associated Method Blank E Value above quantitation rangeH Holding times for preparation or analysis exceeded ND Not Detected at the Reporting LimitS Spike/Surrogate outside of limits due to matrix interference Results are wet unless otherwise specified
DO Surrogate Diluted Out
12 of 45

NEVADA 3151 W. Post Rd., Las Vegas, NV 89118
P: 702.307.2659 F: 702.307.2691
“Serving Clients with Passion and Professionalism”
CALIFORNIA 11060 Artesia Blvd., Ste C, Cerritos, CA 90703
P: 562.219.7435 F: 562.219.7436
Project: Maryland Square, Z085000030
Client Sample ID: MW-25Collection Date: 3/3/2015 1:30:00 PM
Matrix: GROUNDWATER
CLIENT: Cardno ATCLab Order: N014893
Lab ID: N014893-009
ASSET Laboratories Print Date: 16-Mar-15
Analyses Result Qual Units Date AnalyzedDFPQLMDL
ANALYTICAL RESULTS
VOLATILE ORGANIC COMPOUNDS BY GC/MSEPA 8260B
Analyst: QBMRunID: MS5_150310B P15VW038QC Batch: PrepDate
1,1-Dichloroethene 0.50 µg/L 1ND 0.16 3/11/2015 06:03 AMcis-1,2-Dichloroethene 0.50 µg/L 1ND 0.057 3/11/2015 06:03 AMTetrachloroethene 10 µg/L 20640 2.3 3/12/2015 01:21 AMtrans-1,2-Dichloroethene 0.50 µg/L 1ND 0.074 3/11/2015 06:03 AMTrichloroethene 0.50 µg/L 10.71 0.074 3/11/2015 06:03 AMVinyl chloride 0.50 µg/L 1ND 0.044 3/11/2015 06:03 AM Surr: 1,2-Dichloroethane-d4 78-125 %REC 20102 0 3/12/2015 01:21 AM Surr: 1,2-Dichloroethane-d4 78-125 %REC 1102 0 3/11/2015 06:03 AM Surr: 4-Bromofluorobenzene 80-120 %REC 2099.3 0 3/12/2015 01:21 AM Surr: 4-Bromofluorobenzene 80-120 %REC 199.2 0 3/11/2015 06:03 AM Surr: Dibromofluoromethane 80-122 %REC 20103 0 3/12/2015 01:21 AM Surr: Dibromofluoromethane 80-122 %REC 1104 0 3/11/2015 06:03 AM Surr: Toluene-d8 80-120 %REC 20101 0 3/12/2015 01:21 AM Surr: Toluene-d8 80-120 %REC 199.7 0 3/11/2015 06:03 AM
Qualifiers: B Analyte detected in the associated Method Blank E Value above quantitation rangeH Holding times for preparation or analysis exceeded ND Not Detected at the Reporting LimitS Spike/Surrogate outside of limits due to matrix interference Results are wet unless otherwise specified
DO Surrogate Diluted Out
13 of 45

NEVADA 3151 W. Post Rd., Las Vegas, NV 89118
P: 702.307.2659 F: 702.307.2691
“Serving Clients with Passion and Professionalism”
CALIFORNIA 11060 Artesia Blvd., Ste C, Cerritos, CA 90703
P: 562.219.7435 F: 562.219.7436
Project: Maryland Square, Z085000030
Client Sample ID: MW-26Collection Date: 3/3/2015 2:12:00 PM
Matrix: GROUNDWATER
CLIENT: Cardno ATCLab Order: N014893
Lab ID: N014893-010
ASSET Laboratories Print Date: 16-Mar-15
Analyses Result Qual Units Date AnalyzedDFPQLMDL
ANALYTICAL RESULTS
VOLATILE ORGANIC COMPOUNDS BY GC/MSEPA 8260B
Analyst: QBMRunID: MS5_150310B P15VW038QC Batch: PrepDate
1,1-Dichloroethene 0.50 µg/L 1ND 0.16 3/11/2015 07:18 AMcis-1,2-Dichloroethene 0.50 µg/L 1ND 0.057 3/11/2015 07:18 AMTetrachloroethene 10 µg/L 20680 2.3 3/12/2015 01:46 AMtrans-1,2-Dichloroethene 0.50 µg/L 1ND 0.074 3/11/2015 07:18 AMTrichloroethene 0.50 µg/L 1ND 0.074 3/11/2015 07:18 AMVinyl chloride 0.50 µg/L 1ND 0.044 3/11/2015 07:18 AM Surr: 1,2-Dichloroethane-d4 78-125 %REC 20100 0 3/12/2015 01:46 AM Surr: 1,2-Dichloroethane-d4 78-125 %REC 1101 0 3/11/2015 07:18 AM Surr: 4-Bromofluorobenzene 80-120 %REC 2094.7 0 3/12/2015 01:46 AM Surr: 4-Bromofluorobenzene 80-120 %REC 1101 0 3/11/2015 07:18 AM Surr: Dibromofluoromethane 80-122 %REC 20102 0 3/12/2015 01:46 AM Surr: Dibromofluoromethane 80-122 %REC 1104 0 3/11/2015 07:18 AM Surr: Toluene-d8 80-120 %REC 2099.8 0 3/12/2015 01:46 AM Surr: Toluene-d8 80-120 %REC 1101 0 3/11/2015 07:18 AM
Qualifiers: B Analyte detected in the associated Method Blank E Value above quantitation rangeH Holding times for preparation or analysis exceeded ND Not Detected at the Reporting LimitS Spike/Surrogate outside of limits due to matrix interference Results are wet unless otherwise specified
DO Surrogate Diluted Out
14 of 45

NEVADA 3151 W. Post Rd., Las Vegas, NV 89118
P: 702.307.2659 F: 702.307.2691
“Serving Clients with Passion and Professionalism”
CALIFORNIA 11060 Artesia Blvd., Ste C, Cerritos, CA 90703
P: 562.219.7435 F: 562.219.7436
Project: Maryland Square, Z085000030
Client Sample ID: MW-27Collection Date: 3/2/2015 4:14:00 PM
Matrix: GROUNDWATER
CLIENT: Cardno ATCLab Order: N014893
Lab ID: N014893-011
ASSET Laboratories Print Date: 16-Mar-15
Analyses Result Qual Units Date AnalyzedDFPQLMDL
ANALYTICAL RESULTS
VOLATILE ORGANIC COMPOUNDS BY GC/MSEPA 8260B
Analyst: QBMRunID: MS5_150310B P15VW038QC Batch: PrepDate
1,1-Dichloroethene 0.50 µg/L 1ND 0.16 3/11/2015 05:38 AMcis-1,2-Dichloroethene 0.50 µg/L 1ND 0.057 3/11/2015 05:38 AMTetrachloroethene 5.0 µg/L 10450 1.2 3/12/2015 02:12 AMtrans-1,2-Dichloroethene 0.50 µg/L 1ND 0.074 3/11/2015 05:38 AMTrichloroethene 0.50 µg/L 11.3 0.074 3/11/2015 05:38 AMVinyl chloride 0.50 µg/L 1ND 0.044 3/11/2015 05:38 AM Surr: 1,2-Dichloroethane-d4 78-125 %REC 10101 0 3/12/2015 02:12 AM Surr: 1,2-Dichloroethane-d4 78-125 %REC 1100 0 3/11/2015 05:38 AM Surr: 4-Bromofluorobenzene 80-120 %REC 1098.6 0 3/12/2015 02:12 AM Surr: 4-Bromofluorobenzene 80-120 %REC 198.3 0 3/11/2015 05:38 AM Surr: Dibromofluoromethane 80-122 %REC 10102 0 3/12/2015 02:12 AM Surr: Dibromofluoromethane 80-122 %REC 1101 0 3/11/2015 05:38 AM Surr: Toluene-d8 80-120 %REC 1099.1 0 3/12/2015 02:12 AM Surr: Toluene-d8 80-120 %REC 1101 0 3/11/2015 05:38 AM
Qualifiers: B Analyte detected in the associated Method Blank E Value above quantitation rangeH Holding times for preparation or analysis exceeded ND Not Detected at the Reporting LimitS Spike/Surrogate outside of limits due to matrix interference Results are wet unless otherwise specified
DO Surrogate Diluted Out
15 of 45
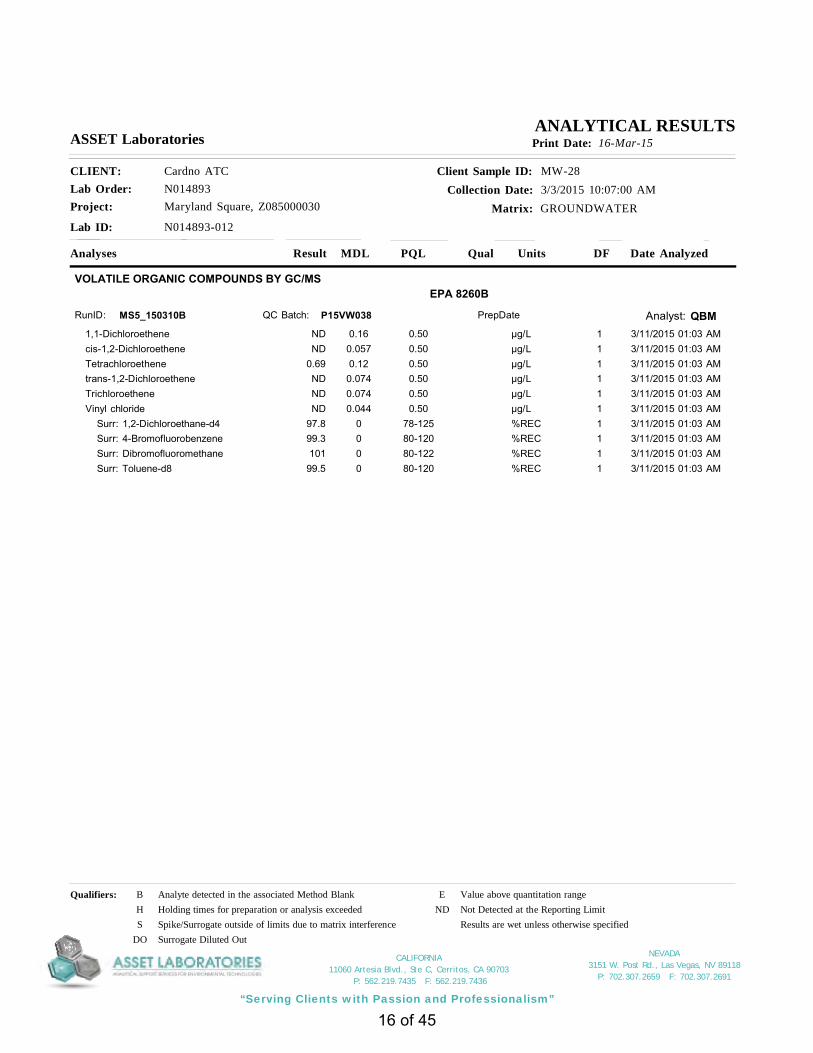
NEVADA 3151 W. Post Rd., Las Vegas, NV 89118
P: 702.307.2659 F: 702.307.2691
“Serving Clients with Passion and Professionalism”
CALIFORNIA 11060 Artesia Blvd., Ste C, Cerritos, CA 90703
P: 562.219.7435 F: 562.219.7436
Project: Maryland Square, Z085000030
Client Sample ID: MW-28Collection Date: 3/3/2015 10:07:00 AM
Matrix: GROUNDWATER
CLIENT: Cardno ATCLab Order: N014893
Lab ID: N014893-012
ASSET Laboratories Print Date: 16-Mar-15
Analyses Result Qual Units Date AnalyzedDFPQLMDL
ANALYTICAL RESULTS
VOLATILE ORGANIC COMPOUNDS BY GC/MSEPA 8260B
Analyst: QBMRunID: MS5_150310B P15VW038QC Batch: PrepDate
1,1-Dichloroethene 0.50 µg/L 1ND 0.16 3/11/2015 01:03 AMcis-1,2-Dichloroethene 0.50 µg/L 1ND 0.057 3/11/2015 01:03 AMTetrachloroethene 0.50 µg/L 10.69 0.12 3/11/2015 01:03 AMtrans-1,2-Dichloroethene 0.50 µg/L 1ND 0.074 3/11/2015 01:03 AMTrichloroethene 0.50 µg/L 1ND 0.074 3/11/2015 01:03 AMVinyl chloride 0.50 µg/L 1ND 0.044 3/11/2015 01:03 AM Surr: 1,2-Dichloroethane-d4 78-125 %REC 197.8 0 3/11/2015 01:03 AM Surr: 4-Bromofluorobenzene 80-120 %REC 199.3 0 3/11/2015 01:03 AM Surr: Dibromofluoromethane 80-122 %REC 1101 0 3/11/2015 01:03 AM Surr: Toluene-d8 80-120 %REC 199.5 0 3/11/2015 01:03 AM
Qualifiers: B Analyte detected in the associated Method Blank E Value above quantitation rangeH Holding times for preparation or analysis exceeded ND Not Detected at the Reporting LimitS Spike/Surrogate outside of limits due to matrix interference Results are wet unless otherwise specified
DO Surrogate Diluted Out
16 of 45

NEVADA 3151 W. Post Rd., Las Vegas, NV 89118
P: 702.307.2659 F: 702.307.2691
“Serving Clients with Passion and Professionalism”
CALIFORNIA 11060 Artesia Blvd., Ste C, Cerritos, CA 90703
P: 562.219.7435 F: 562.219.7436
Project: Maryland Square, Z085000030
Client Sample ID: MW-29Collection Date: 3/3/2015 9:27:00 AM
Matrix: GROUNDWATER
CLIENT: Cardno ATCLab Order: N014893
Lab ID: N014893-013
ASSET Laboratories Print Date: 16-Mar-15
Analyses Result Qual Units Date AnalyzedDFPQLMDL
ANALYTICAL RESULTS
VOLATILE ORGANIC COMPOUNDS BY GC/MSEPA 8260B
Analyst: QBMRunID: MS5_150310B P15VW038QC Batch: PrepDate
1,1-Dichloroethene 0.50 µg/L 1ND 0.16 3/11/2015 01:28 AMcis-1,2-Dichloroethene 0.50 µg/L 1ND 0.057 3/11/2015 01:28 AMTetrachloroethene 0.50 µg/L 1ND 0.12 3/11/2015 01:28 AMtrans-1,2-Dichloroethene 0.50 µg/L 1ND 0.074 3/11/2015 01:28 AMTrichloroethene 0.50 µg/L 1ND 0.074 3/11/2015 01:28 AMVinyl chloride 0.50 µg/L 1ND 0.044 3/11/2015 01:28 AM Surr: 1,2-Dichloroethane-d4 78-125 %REC 197.9 0 3/11/2015 01:28 AM Surr: 4-Bromofluorobenzene 80-120 %REC 198.2 0 3/11/2015 01:28 AM Surr: Dibromofluoromethane 80-122 %REC 1100 0 3/11/2015 01:28 AM Surr: Toluene-d8 80-120 %REC 1100 0 3/11/2015 01:28 AM
Qualifiers: B Analyte detected in the associated Method Blank E Value above quantitation rangeH Holding times for preparation or analysis exceeded ND Not Detected at the Reporting LimitS Spike/Surrogate outside of limits due to matrix interference Results are wet unless otherwise specified
DO Surrogate Diluted Out
17 of 45

NEVADA 3151 W. Post Rd., Las Vegas, NV 89118
P: 702.307.2659 F: 702.307.2691
“Serving Clients with Passion and Professionalism”
CALIFORNIA 11060 Artesia Blvd., Ste C, Cerritos, CA 90703
P: 562.219.7435 F: 562.219.7436
Project: Maryland Square, Z085000030
Client Sample ID: MW-30Collection Date: 3/2/2015 3:20:00 PM
Matrix: GROUNDWATER
CLIENT: Cardno ATCLab Order: N014893
Lab ID: N014893-014
ASSET Laboratories Print Date: 16-Mar-15
Analyses Result Qual Units Date AnalyzedDFPQLMDL
ANALYTICAL RESULTS
VOLATILE ORGANIC COMPOUNDS BY GC/MSEPA 8260B
Analyst: QBMRunID: MS5_150310B P15VW038QC Batch: PrepDate
1,1-Dichloroethene 0.50 µg/L 1ND 0.16 3/11/2015 04:49 AMcis-1,2-Dichloroethene 0.50 µg/L 1ND 0.057 3/11/2015 04:49 AMTetrachloroethene 2.5 µg/L 593 0.59 3/12/2015 02:37 AMtrans-1,2-Dichloroethene 0.50 µg/L 1ND 0.074 3/11/2015 04:49 AMTrichloroethene 0.50 µg/L 10.76 0.074 3/11/2015 04:49 AMVinyl chloride 0.50 µg/L 1ND 0.044 3/11/2015 04:49 AM Surr: 1,2-Dichloroethane-d4 78-125 %REC 599.7 0 3/12/2015 02:37 AM Surr: 1,2-Dichloroethane-d4 78-125 %REC 1101 0 3/11/2015 04:49 AM Surr: 4-Bromofluorobenzene 80-120 %REC 596.7 0 3/12/2015 02:37 AM Surr: 4-Bromofluorobenzene 80-120 %REC 198.8 0 3/11/2015 04:49 AM Surr: Dibromofluoromethane 80-122 %REC 5101 0 3/12/2015 02:37 AM Surr: Dibromofluoromethane 80-122 %REC 1103 0 3/11/2015 04:49 AM Surr: Toluene-d8 80-120 %REC 599.9 0 3/12/2015 02:37 AM Surr: Toluene-d8 80-120 %REC 1100 0 3/11/2015 04:49 AM
Qualifiers: B Analyte detected in the associated Method Blank E Value above quantitation rangeH Holding times for preparation or analysis exceeded ND Not Detected at the Reporting LimitS Spike/Surrogate outside of limits due to matrix interference Results are wet unless otherwise specified
DO Surrogate Diluted Out
18 of 45

NEVADA 3151 W. Post Rd., Las Vegas, NV 89118
P: 702.307.2659 F: 702.307.2691
“Serving Clients with Passion and Professionalism”
CALIFORNIA 11060 Artesia Blvd., Ste C, Cerritos, CA 90703
P: 562.219.7435 F: 562.219.7436
Project: Maryland Square, Z085000030
Client Sample ID: MW-31Collection Date: 3/2/2015 2:30:00 PM
Matrix: GROUNDWATER
CLIENT: Cardno ATCLab Order: N014893
Lab ID: N014893-015
ASSET Laboratories Print Date: 16-Mar-15
Analyses Result Qual Units Date AnalyzedDFPQLMDL
ANALYTICAL RESULTS
VOLATILE ORGANIC COMPOUNDS BY GC/MSEPA 8260B
Analyst: QBMRunID: MS5_150310B P15VW038QC Batch: PrepDate
1,1-Dichloroethene 0.50 µg/L 1ND 0.16 3/11/2015 04:24 AMcis-1,2-Dichloroethene 0.50 µg/L 1ND 0.057 3/11/2015 04:24 AMTetrachloroethene 0.50 µg/L 173 0.12 3/11/2015 04:24 AMtrans-1,2-Dichloroethene 0.50 µg/L 1ND 0.074 3/11/2015 04:24 AMTrichloroethene 0.50 µg/L 1ND 0.074 3/11/2015 04:24 AMVinyl chloride 0.50 µg/L 1ND 0.044 3/11/2015 04:24 AM Surr: 1,2-Dichloroethane-d4 78-125 %REC 199.8 0 3/11/2015 04:24 AM Surr: 4-Bromofluorobenzene 80-120 %REC 196.3 0 3/11/2015 04:24 AM Surr: Dibromofluoromethane 80-122 %REC 1105 0 3/11/2015 04:24 AM Surr: Toluene-d8 80-120 %REC 1101 0 3/11/2015 04:24 AM
Qualifiers: B Analyte detected in the associated Method Blank E Value above quantitation rangeH Holding times for preparation or analysis exceeded ND Not Detected at the Reporting LimitS Spike/Surrogate outside of limits due to matrix interference Results are wet unless otherwise specified
DO Surrogate Diluted Out
19 of 45

NEVADA 3151 W. Post Rd., Las Vegas, NV 89118
P: 702.307.2659 F: 702.307.2691
“Serving Clients with Passion and Professionalism”
CALIFORNIA 11060 Artesia Blvd., Ste C, Cerritos, CA 90703
P: 562.219.7435 F: 562.219.7436
Project: Maryland Square, Z085000030
Client Sample ID: MW-32Collection Date: 3/3/2015 2:57:00 PM
Matrix: GROUNDWATER
CLIENT: Cardno ATCLab Order: N014893
Lab ID: N014893-016
ASSET Laboratories Print Date: 16-Mar-15
Analyses Result Qual Units Date AnalyzedDFPQLMDL
ANALYTICAL RESULTS
VOLATILE ORGANIC COMPOUNDS BY GC/MSEPA 8260B
Analyst: QBMRunID: MS5_150310B P15VW038QC Batch: PrepDate
1,1-Dichloroethene 0.50 µg/L 1ND 0.16 3/11/2015 06:28 AMcis-1,2-Dichloroethene 0.50 µg/L 1ND 0.057 3/11/2015 06:28 AMTetrachloroethene 10 µg/L 20730 2.3 3/12/2015 03:02 AMtrans-1,2-Dichloroethene 0.50 µg/L 1ND 0.074 3/11/2015 06:28 AMTrichloroethene 0.50 µg/L 12.0 0.074 3/11/2015 06:28 AMVinyl chloride 0.50 µg/L 1ND 0.044 3/11/2015 06:28 AM Surr: 1,2-Dichloroethane-d4 78-125 %REC 20103 0 3/12/2015 03:02 AM Surr: 1,2-Dichloroethane-d4 78-125 %REC 1101 0 3/11/2015 06:28 AM Surr: 4-Bromofluorobenzene 80-120 %REC 2097.2 0 3/12/2015 03:02 AM Surr: 4-Bromofluorobenzene 80-120 %REC 199.8 0 3/11/2015 06:28 AM Surr: Dibromofluoromethane 80-122 %REC 20103 0 3/12/2015 03:02 AM Surr: Dibromofluoromethane 80-122 %REC 1103 0 3/11/2015 06:28 AM Surr: Toluene-d8 80-120 %REC 2099.2 0 3/12/2015 03:02 AM Surr: Toluene-d8 80-120 %REC 1100 0 3/11/2015 06:28 AM
Qualifiers: B Analyte detected in the associated Method Blank E Value above quantitation rangeH Holding times for preparation or analysis exceeded ND Not Detected at the Reporting LimitS Spike/Surrogate outside of limits due to matrix interference Results are wet unless otherwise specified
DO Surrogate Diluted Out
20 of 45

NEVADA 3151 W. Post Rd., Las Vegas, NV 89118
P: 702.307.2659 F: 702.307.2691
“Serving Clients with Passion and Professionalism”
CALIFORNIA 11060 Artesia Blvd., Ste C, Cerritos, CA 90703
P: 562.219.7435 F: 562.219.7436
Project: Maryland Square, Z085000030
Client Sample ID: MW-33Collection Date: 3/3/2015 10:47:00 AM
Matrix: GROUNDWATER
CLIENT: Cardno ATCLab Order: N014893
Lab ID: N014893-017
ASSET Laboratories Print Date: 16-Mar-15
Analyses Result Qual Units Date AnalyzedDFPQLMDL
ANALYTICAL RESULTS
VOLATILE ORGANIC COMPOUNDS BY GC/MSEPA 8260B
Analyst: QBMRunID: MS5_150310B P15VW038QC Batch: PrepDate
1,1-Dichloroethene 0.50 µg/L 1ND 0.16 3/11/2015 01:53 AMcis-1,2-Dichloroethene 0.50 µg/L 1ND 0.057 3/11/2015 01:53 AMTetrachloroethene 0.50 µg/L 1ND 0.12 3/11/2015 01:53 AMtrans-1,2-Dichloroethene 0.50 µg/L 1ND 0.074 3/11/2015 01:53 AMTrichloroethene 0.50 µg/L 1ND 0.074 3/11/2015 01:53 AMVinyl chloride 0.50 µg/L 1ND 0.044 3/11/2015 01:53 AM Surr: 1,2-Dichloroethane-d4 78-125 %REC 1102 0 3/11/2015 01:53 AM Surr: 4-Bromofluorobenzene 80-120 %REC 1101 0 3/11/2015 01:53 AM Surr: Dibromofluoromethane 80-122 %REC 1102 0 3/11/2015 01:53 AM Surr: Toluene-d8 80-120 %REC 1100 0 3/11/2015 01:53 AM
Qualifiers: B Analyte detected in the associated Method Blank E Value above quantitation rangeH Holding times for preparation or analysis exceeded ND Not Detected at the Reporting LimitS Spike/Surrogate outside of limits due to matrix interference Results are wet unless otherwise specified
DO Surrogate Diluted Out
21 of 45

NEVADA 3151 W. Post Rd., Las Vegas, NV 89118
P: 702.307.2659 F: 702.307.2691
“Serving Clients with Passion and Professionalism”
CALIFORNIA 11060 Artesia Blvd., Ste C, Cerritos, CA 90703
P: 562.219.7435 F: 562.219.7436
Project: Maryland Square, Z085000030
Client Sample ID: MW-36Collection Date: 3/3/2015 12:30:00 PM
Matrix: GROUNDWATER
CLIENT: Cardno ATCLab Order: N014893
Lab ID: N014893-018
ASSET Laboratories Print Date: 16-Mar-15
Analyses Result Qual Units Date AnalyzedDFPQLMDL
ANALYTICAL RESULTS
VOLATILE ORGANIC COMPOUNDS BY GC/MSEPA 8260B
Analyst: QBMRunID: MS5_150310B P15VW038QC Batch: PrepDate
1,1-Dichloroethene 0.50 µg/L 1ND 0.16 3/11/2015 05:13 AMcis-1,2-Dichloroethene 0.50 µg/L 1ND 0.057 3/11/2015 05:13 AMTetrachloroethene 2.5 µg/L 5150 0.59 3/12/2015 03:27 AMtrans-1,2-Dichloroethene 0.50 µg/L 1ND 0.074 3/11/2015 05:13 AMTrichloroethene 0.50 µg/L 1ND 0.074 3/11/2015 05:13 AMVinyl chloride 0.50 µg/L 1ND 0.044 3/11/2015 05:13 AM Surr: 1,2-Dichloroethane-d4 78-125 %REC 5102 0 3/12/2015 03:27 AM Surr: 1,2-Dichloroethane-d4 78-125 %REC 199.3 0 3/11/2015 05:13 AM Surr: 4-Bromofluorobenzene 80-120 %REC 599.1 0 3/12/2015 03:27 AM Surr: 4-Bromofluorobenzene 80-120 %REC 198.3 0 3/11/2015 05:13 AM Surr: Dibromofluoromethane 80-122 %REC 5104 0 3/12/2015 03:27 AM Surr: Dibromofluoromethane 80-122 %REC 1101 0 3/11/2015 05:13 AM Surr: Toluene-d8 80-120 %REC 5102 0 3/12/2015 03:27 AM Surr: Toluene-d8 80-120 %REC 1101 0 3/11/2015 05:13 AM
Qualifiers: B Analyte detected in the associated Method Blank E Value above quantitation rangeH Holding times for preparation or analysis exceeded ND Not Detected at the Reporting LimitS Spike/Surrogate outside of limits due to matrix interference Results are wet unless otherwise specified
DO Surrogate Diluted Out
22 of 45

NEVADA 3151 W. Post Rd., Las Vegas, NV 89118
P: 702.307.2659 F: 702.307.2691
“Serving Clients with Passion and Professionalism”
CALIFORNIA 11060 Artesia Blvd., Ste C, Cerritos, CA 90703
P: 562.219.7435 F: 562.219.7436
Project: Maryland Square, Z085000030
Client Sample ID: MW-37Collection Date: 3/2/2015 1:40:00 PM
Matrix: GROUNDWATER
CLIENT: Cardno ATCLab Order: N014893
Lab ID: N014893-019
ASSET Laboratories Print Date: 16-Mar-15
Analyses Result Qual Units Date AnalyzedDFPQLMDL
ANALYTICAL RESULTS
VOLATILE ORGANIC COMPOUNDS BY GC/MSEPA 8260B
Analyst: QBMRunID: MS5_150310B P15VW038QC Batch: PrepDate
1,1-Dichloroethene 0.50 µg/L 1ND 0.16 3/11/2015 03:58 AMcis-1,2-Dichloroethene 0.50 µg/L 1ND 0.057 3/11/2015 03:58 AMTetrachloroethene 0.50 µg/L 135 0.12 3/11/2015 03:58 AMtrans-1,2-Dichloroethene 0.50 µg/L 1ND 0.074 3/11/2015 03:58 AMTrichloroethene 0.50 µg/L 1ND 0.074 3/11/2015 03:58 AMVinyl chloride 0.50 µg/L 1ND 0.044 3/11/2015 03:58 AM Surr: 1,2-Dichloroethane-d4 78-125 %REC 199.4 0 3/11/2015 03:58 AM Surr: 4-Bromofluorobenzene 80-120 %REC 199.1 0 3/11/2015 03:58 AM Surr: Dibromofluoromethane 80-122 %REC 1101 0 3/11/2015 03:58 AM Surr: Toluene-d8 80-120 %REC 1101 0 3/11/2015 03:58 AM
Qualifiers: B Analyte detected in the associated Method Blank E Value above quantitation rangeH Holding times for preparation or analysis exceeded ND Not Detected at the Reporting LimitS Spike/Surrogate outside of limits due to matrix interference Results are wet unless otherwise specified
DO Surrogate Diluted Out
23 of 45

NEVADA 3151 W. Post Rd., Las Vegas, NV 89118
P: 702.307.2659 F: 702.307.2691
“Serving Clients with Passion and Professionalism”
CALIFORNIA 11060 Artesia Blvd., Ste C, Cerritos, CA 90703
P: 562.219.7435 F: 562.219.7436
Project: Maryland Square, Z085000030
Client Sample ID: MW-38Collection Date: 3/2/2015 12:43:00 PM
Matrix: GROUNDWATER
CLIENT: Cardno ATCLab Order: N014893
Lab ID: N014893-020
ASSET Laboratories Print Date: 16-Mar-15
Analyses Result Qual Units Date AnalyzedDFPQLMDL
ANALYTICAL RESULTS
VOLATILE ORGANIC COMPOUNDS BY GC/MSEPA 8260B
Analyst: QBMRunID: MS5_150310B P15VW038QC Batch: PrepDate
1,1-Dichloroethene 0.50 µg/L 1ND 0.16 3/11/2015 03:34 AMcis-1,2-Dichloroethene 0.50 µg/L 1ND 0.057 3/11/2015 03:34 AMTetrachloroethene 0.50 µg/L 16.0 0.12 3/11/2015 03:34 AMtrans-1,2-Dichloroethene 0.50 µg/L 1ND 0.074 3/11/2015 03:34 AMTrichloroethene 0.50 µg/L 1ND 0.074 3/11/2015 03:34 AMVinyl chloride 0.50 µg/L 1ND 0.044 3/11/2015 03:34 AM Surr: 1,2-Dichloroethane-d4 78-125 %REC 1100 0 3/11/2015 03:34 AM Surr: 4-Bromofluorobenzene 80-120 %REC 197.6 0 3/11/2015 03:34 AM Surr: Dibromofluoromethane 80-122 %REC 1103 0 3/11/2015 03:34 AM Surr: Toluene-d8 80-120 %REC 1102 0 3/11/2015 03:34 AM
Qualifiers: B Analyte detected in the associated Method Blank E Value above quantitation rangeH Holding times for preparation or analysis exceeded ND Not Detected at the Reporting LimitS Spike/Surrogate outside of limits due to matrix interference Results are wet unless otherwise specified
DO Surrogate Diluted Out
24 of 45

NEVADA 3151 W. Post Rd., Las Vegas, NV 89118
P: 702.307.2659 F: 702.307.2691
“Serving Clients with Passion and Professionalism”
CALIFORNIA 11060 Artesia Blvd., Ste C, Cerritos, CA 90703
P: 562.219.7435 F: 562.219.7436
Project: Maryland Square, Z085000030
Client Sample ID: MW-39Collection Date: 3/3/2015 11:47:00 AM
Matrix: GROUNDWATER
CLIENT: Cardno ATCLab Order: N014893
Lab ID: N014893-021
ASSET Laboratories Print Date: 16-Mar-15
Analyses Result Qual Units Date AnalyzedDFPQLMDL
ANALYTICAL RESULTS
VOLATILE ORGANIC COMPOUNDS BY GC/MSEPA 8260B
Analyst: QBMRunID: MS5_150311A P15VW039QC Batch: PrepDate
1,1-Dichloroethene 0.50 µg/L 1ND 0.16 3/11/2015 05:25 PMcis-1,2-Dichloroethene 0.50 µg/L 1ND 0.057 3/11/2015 05:25 PMTetrachloroethene 2.5 µg/L 5160 0.59 3/12/2015 03:52 AMtrans-1,2-Dichloroethene 0.50 µg/L 1ND 0.074 3/11/2015 05:25 PMTrichloroethene 0.50 µg/L 1ND 0.074 3/11/2015 05:25 PMVinyl chloride 0.50 µg/L 1ND 0.044 3/11/2015 05:25 PM Surr: 1,2-Dichloroethane-d4 78-125 %REC 5103 0 3/12/2015 03:52 AM Surr: 1,2-Dichloroethane-d4 78-125 %REC 1106 0 3/11/2015 05:25 PM Surr: 4-Bromofluorobenzene 80-120 %REC 596.8 0 3/12/2015 03:52 AM Surr: 4-Bromofluorobenzene 80-120 %REC 197.8 0 3/11/2015 05:25 PM Surr: Dibromofluoromethane 80-122 %REC 5104 0 3/12/2015 03:52 AM Surr: Dibromofluoromethane 80-122 %REC 1106 0 3/11/2015 05:25 PM Surr: Toluene-d8 80-120 %REC 5101 0 3/12/2015 03:52 AM Surr: Toluene-d8 80-120 %REC 1100 0 3/11/2015 05:25 PM
Qualifiers: B Analyte detected in the associated Method Blank E Value above quantitation rangeH Holding times for preparation or analysis exceeded ND Not Detected at the Reporting LimitS Spike/Surrogate outside of limits due to matrix interference Results are wet unless otherwise specified
DO Surrogate Diluted Out
25 of 45

NEVADA 3151 W. Post Rd., Las Vegas, NV 89118
P: 702.307.2659 F: 702.307.2691
“Serving Clients with Passion and Professionalism”
CALIFORNIA 11060 Artesia Blvd., Ste C, Cerritos, CA 90703
P: 562.219.7435 F: 562.219.7436
Project: Maryland Square, Z085000030
Client Sample ID: MW-41Collection Date: 3/2/2015 11:45:00 AM
Matrix: GROUNDWATER
CLIENT: Cardno ATCLab Order: N014893
Lab ID: N014893-022
ASSET Laboratories Print Date: 16-Mar-15
Analyses Result Qual Units Date AnalyzedDFPQLMDL
ANALYTICAL RESULTS
VOLATILE ORGANIC COMPOUNDS BY GC/MSEPA 8260B
Analyst: QBMRunID: MS5_150311A P15VW039QC Batch: PrepDate
1,1-Dichloroethene 0.50 µg/L 1ND 0.16 3/11/2015 04:11 PMcis-1,2-Dichloroethene 0.50 µg/L 1ND 0.057 3/11/2015 04:11 PMTetrachloroethene 0.50 µg/L 13.5 0.12 3/11/2015 04:11 PMtrans-1,2-Dichloroethene 0.50 µg/L 1ND 0.074 3/11/2015 04:11 PMTrichloroethene 0.50 µg/L 1ND 0.074 3/11/2015 04:11 PMVinyl chloride 0.50 µg/L 1ND 0.044 3/11/2015 04:11 PM Surr: 1,2-Dichloroethane-d4 78-125 %REC 1102 0 3/11/2015 04:11 PM Surr: 4-Bromofluorobenzene 80-120 %REC 199.5 0 3/11/2015 04:11 PM Surr: Dibromofluoromethane 80-122 %REC 1106 0 3/11/2015 04:11 PM Surr: Toluene-d8 80-120 %REC 1100 0 3/11/2015 04:11 PM
Qualifiers: B Analyte detected in the associated Method Blank E Value above quantitation rangeH Holding times for preparation or analysis exceeded ND Not Detected at the Reporting LimitS Spike/Surrogate outside of limits due to matrix interference Results are wet unless otherwise specified
DO Surrogate Diluted Out
26 of 45

NEVADA 3151 W. Post Rd., Las Vegas, NV 89118
P: 702.307.2659 F: 702.307.2691
“Serving Clients with Passion and Professionalism”
CALIFORNIA 11060 Artesia Blvd., Ste C, Cerritos, CA 90703
P: 562.219.7435 F: 562.219.7436
Project: Maryland Square, Z085000030
Client Sample ID: MW-42Collection Date: 3/2/2015 10:41:00 AM
Matrix: GROUNDWATER
CLIENT: Cardno ATCLab Order: N014893
Lab ID: N014893-023
ASSET Laboratories Print Date: 16-Mar-15
Analyses Result Qual Units Date AnalyzedDFPQLMDL
ANALYTICAL RESULTS
VOLATILE ORGANIC COMPOUNDS BY GC/MSEPA 8260B
Analyst: QBMRunID: MS5_150311A P15VW039QC Batch: PrepDate
1,1-Dichloroethene 0.50 µg/L 1ND 0.16 3/11/2015 03:22 PMcis-1,2-Dichloroethene 0.50 µg/L 1ND 0.057 3/11/2015 03:22 PMTetrachloroethene 0.50 µg/L 10.62 0.12 3/11/2015 03:22 PMtrans-1,2-Dichloroethene 0.50 µg/L 1ND 0.074 3/11/2015 03:22 PMTrichloroethene 0.50 µg/L 1ND 0.074 3/11/2015 03:22 PMVinyl chloride 0.50 µg/L 1ND 0.044 3/11/2015 03:22 PM Surr: 1,2-Dichloroethane-d4 78-125 %REC 1103 0 3/11/2015 03:22 PM Surr: 4-Bromofluorobenzene 80-120 %REC 1100 0 3/11/2015 03:22 PM Surr: Dibromofluoromethane 80-122 %REC 1104 0 3/11/2015 03:22 PM Surr: Toluene-d8 80-120 %REC 1100 0 3/11/2015 03:22 PM
Qualifiers: B Analyte detected in the associated Method Blank E Value above quantitation rangeH Holding times for preparation or analysis exceeded ND Not Detected at the Reporting LimitS Spike/Surrogate outside of limits due to matrix interference Results are wet unless otherwise specified
DO Surrogate Diluted Out
27 of 45

NEVADA 3151 W. Post Rd., Las Vegas, NV 89118
P: 702.307.2659 F: 702.307.2691
“Serving Clients with Passion and Professionalism”
CALIFORNIA 11060 Artesia Blvd., Ste C, Cerritos, CA 90703
P: 562.219.7435 F: 562.219.7436
Project: Maryland Square, Z085000030
Client Sample ID: MW-43Collection Date: 3/4/2015 9:10:00 AM
Matrix: GROUNDWATER
CLIENT: Cardno ATCLab Order: N014893
Lab ID: N014893-024
ASSET Laboratories Print Date: 16-Mar-15
Analyses Result Qual Units Date AnalyzedDFPQLMDL
ANALYTICAL RESULTS
VOLATILE ORGANIC COMPOUNDS BY GC/MSEPA 8260B
Analyst: QBMRunID: MS5_150311A P15VW039QC Batch: PrepDate
1,1-Dichloroethene 0.50 µg/L 1ND 0.16 3/11/2015 12:29 PMcis-1,2-Dichloroethene 0.50 µg/L 1ND 0.057 3/11/2015 12:29 PMTetrachloroethene 0.50 µg/L 1ND 0.12 3/11/2015 12:29 PMtrans-1,2-Dichloroethene 0.50 µg/L 1ND 0.074 3/11/2015 12:29 PMTrichloroethene 0.50 µg/L 1ND 0.074 3/11/2015 12:29 PMVinyl chloride 0.50 µg/L 1ND 0.044 3/11/2015 12:29 PM Surr: 1,2-Dichloroethane-d4 78-125 %REC 1103 0 3/11/2015 12:29 PM Surr: 4-Bromofluorobenzene 80-120 %REC 198.8 0 3/11/2015 12:29 PM Surr: Dibromofluoromethane 80-122 %REC 1103 0 3/11/2015 12:29 PM Surr: Toluene-d8 80-120 %REC 1103 0 3/11/2015 12:29 PM
Qualifiers: B Analyte detected in the associated Method Blank E Value above quantitation rangeH Holding times for preparation or analysis exceeded ND Not Detected at the Reporting LimitS Spike/Surrogate outside of limits due to matrix interference Results are wet unless otherwise specified
DO Surrogate Diluted Out
28 of 45

NEVADA 3151 W. Post Rd., Las Vegas, NV 89118
P: 702.307.2659 F: 702.307.2691
“Serving Clients with Passion and Professionalism”
CALIFORNIA 11060 Artesia Blvd., Ste C, Cerritos, CA 90703
P: 562.219.7435 F: 562.219.7436
Project: Maryland Square, Z085000030
Client Sample ID: MW-40 CMT30Collection Date: 3/5/2015 10:38:00 AM
Matrix: GROUNDWATER
CLIENT: Cardno ATCLab Order: N014893
Lab ID: N014893-025
ASSET Laboratories Print Date: 16-Mar-15
Analyses Result Qual Units Date AnalyzedDFPQLMDL
ANALYTICAL RESULTS
VOLATILE ORGANIC COMPOUNDS BY GC/MSEPA 8260B
Analyst: QBMRunID: MS5_150311A P15VW039QC Batch: PrepDate
1,1-Dichloroethene 0.50 µg/L 1ND 0.16 3/11/2015 05:01 PMcis-1,2-Dichloroethene 0.50 µg/L 1ND 0.057 3/11/2015 05:01 PMTetrachloroethene 0.50 µg/L 114 0.12 3/11/2015 05:01 PMtrans-1,2-Dichloroethene 0.50 µg/L 1ND 0.074 3/11/2015 05:01 PMTrichloroethene 0.50 µg/L 1ND 0.074 3/11/2015 05:01 PMVinyl chloride 0.50 µg/L 1ND 0.044 3/11/2015 05:01 PM Surr: 1,2-Dichloroethane-d4 78-125 %REC 1103 0 3/11/2015 05:01 PM Surr: 4-Bromofluorobenzene 80-120 %REC 1100 0 3/11/2015 05:01 PM Surr: Dibromofluoromethane 80-122 %REC 1103 0 3/11/2015 05:01 PM Surr: Toluene-d8 80-120 %REC 1101 0 3/11/2015 05:01 PM
HEXAVALENT CHROMIUM BY ICEPA 218.6
Analyst: RBRunID: IC6_150309A R99366QC Batch: PrepDate
Hexavalent Chromium 0.20 µg/L 10.88 0.015 3/9/2015 01:59 PM
DISSOLVED METALS BY ICP-MSEPA 6020
Analyst: CEI
EPA 3010A
RunID: ICP7_150311A 49876QC Batch: PrepDate 3/10/2015
Arsenic 0.10 µg/L 13.6 0.027 3/11/2015 01:16 PMChromium 1.0 µg/L 1ND 0.030 3/11/2015 01:16 PMManganese 0.50 µg/L 128 0.026 3/11/2015 01:16 PM
Qualifiers: B Analyte detected in the associated Method Blank E Value above quantitation rangeH Holding times for preparation or analysis exceeded ND Not Detected at the Reporting LimitS Spike/Surrogate outside of limits due to matrix interference Results are wet unless otherwise specified
DO Surrogate Diluted Out
29 of 45
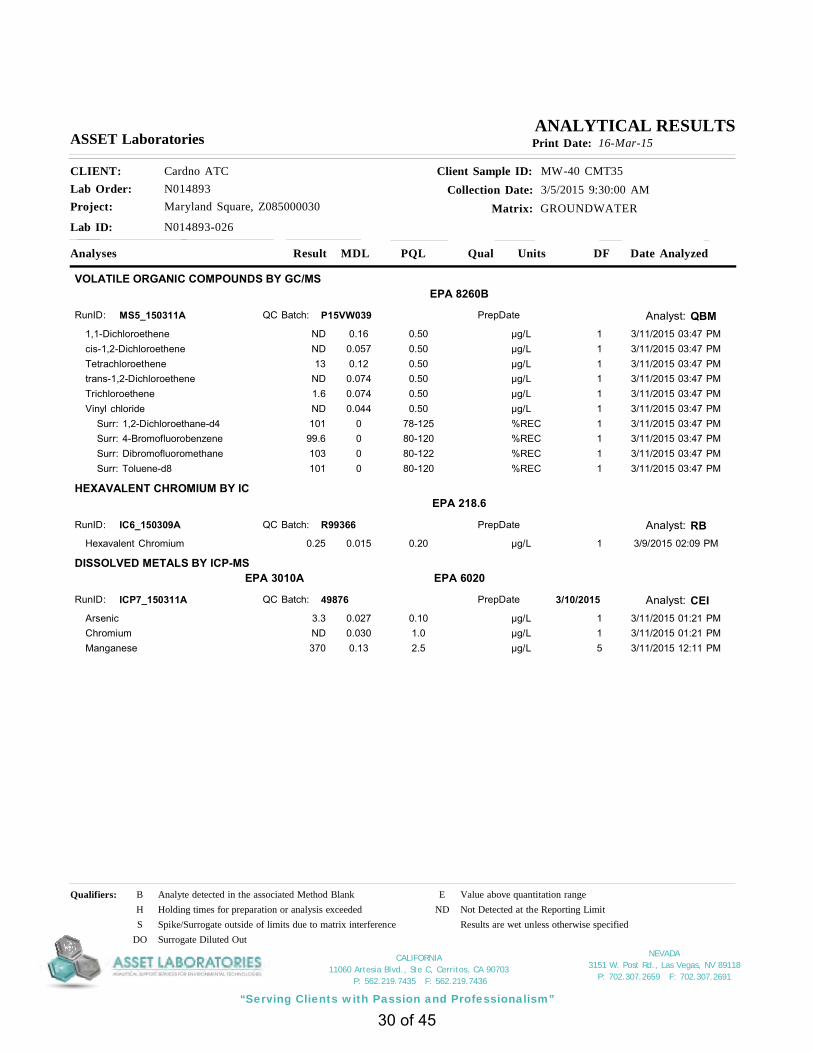
NEVADA 3151 W. Post Rd., Las Vegas, NV 89118
P: 702.307.2659 F: 702.307.2691
“Serving Clients with Passion and Professionalism”
CALIFORNIA 11060 Artesia Blvd., Ste C, Cerritos, CA 90703
P: 562.219.7435 F: 562.219.7436
Project: Maryland Square, Z085000030
Client Sample ID: MW-40 CMT35Collection Date: 3/5/2015 9:30:00 AM
Matrix: GROUNDWATER
CLIENT: Cardno ATCLab Order: N014893
Lab ID: N014893-026
ASSET Laboratories Print Date: 16-Mar-15
Analyses Result Qual Units Date AnalyzedDFPQLMDL
ANALYTICAL RESULTS
VOLATILE ORGANIC COMPOUNDS BY GC/MSEPA 8260B
Analyst: QBMRunID: MS5_150311A P15VW039QC Batch: PrepDate
1,1-Dichloroethene 0.50 µg/L 1ND 0.16 3/11/2015 03:47 PMcis-1,2-Dichloroethene 0.50 µg/L 1ND 0.057 3/11/2015 03:47 PMTetrachloroethene 0.50 µg/L 113 0.12 3/11/2015 03:47 PMtrans-1,2-Dichloroethene 0.50 µg/L 1ND 0.074 3/11/2015 03:47 PMTrichloroethene 0.50 µg/L 11.6 0.074 3/11/2015 03:47 PMVinyl chloride 0.50 µg/L 1ND 0.044 3/11/2015 03:47 PM Surr: 1,2-Dichloroethane-d4 78-125 %REC 1101 0 3/11/2015 03:47 PM Surr: 4-Bromofluorobenzene 80-120 %REC 199.6 0 3/11/2015 03:47 PM Surr: Dibromofluoromethane 80-122 %REC 1103 0 3/11/2015 03:47 PM Surr: Toluene-d8 80-120 %REC 1101 0 3/11/2015 03:47 PM
HEXAVALENT CHROMIUM BY ICEPA 218.6
Analyst: RBRunID: IC6_150309A R99366QC Batch: PrepDate
Hexavalent Chromium 0.20 µg/L 10.25 0.015 3/9/2015 02:09 PM
DISSOLVED METALS BY ICP-MSEPA 6020
Analyst: CEI
EPA 3010A
RunID: ICP7_150311A 49876QC Batch: PrepDate 3/10/2015
Arsenic 0.10 µg/L 13.3 0.027 3/11/2015 01:21 PMChromium 1.0 µg/L 1ND 0.030 3/11/2015 01:21 PMManganese 2.5 µg/L 5370 0.13 3/11/2015 12:11 PM
Qualifiers: B Analyte detected in the associated Method Blank E Value above quantitation rangeH Holding times for preparation or analysis exceeded ND Not Detected at the Reporting LimitS Spike/Surrogate outside of limits due to matrix interference Results are wet unless otherwise specified
DO Surrogate Diluted Out
30 of 45

NEVADA 3151 W. Post Rd., Las Vegas, NV 89118
P: 702.307.2659 F: 702.307.2691
“Serving Clients with Passion and Professionalism”
CALIFORNIA 11060 Artesia Blvd., Ste C, Cerritos, CA 90703
P: 562.219.7435 F: 562.219.7436
Project: Maryland Square, Z085000030
Client Sample ID: MW-40 CMT40Collection Date: 3/5/2015 11:27:00 AM
Matrix: GROUNDWATER
CLIENT: Cardno ATCLab Order: N014893
Lab ID: N014893-027
ASSET Laboratories Print Date: 16-Mar-15
Analyses Result Qual Units Date AnalyzedDFPQLMDL
ANALYTICAL RESULTS
VOLATILE ORGANIC COMPOUNDS BY GC/MSEPA 8260B
Analyst: QBMRunID: MS5_150311A P15VW039QC Batch: PrepDate
1,1-Dichloroethene 0.50 µg/L 1ND 0.16 3/11/2015 04:36 PMcis-1,2-Dichloroethene 0.50 µg/L 1ND 0.057 3/11/2015 04:36 PMTetrachloroethene 2.5 µg/L 5100 0.59 3/12/2015 04:18 AMtrans-1,2-Dichloroethene 0.50 µg/L 1ND 0.074 3/11/2015 04:36 PMTrichloroethene 0.50 µg/L 11.5 0.074 3/11/2015 04:36 PMVinyl chloride 0.50 µg/L 1ND 0.044 3/11/2015 04:36 PM Surr: 1,2-Dichloroethane-d4 78-125 %REC 1100 0 3/11/2015 04:36 PM Surr: 1,2-Dichloroethane-d4 78-125 %REC 5102 0 3/12/2015 04:18 AM Surr: 4-Bromofluorobenzene 80-120 %REC 596.0 0 3/12/2015 04:18 AM Surr: 4-Bromofluorobenzene 80-120 %REC 1101 0 3/11/2015 04:36 PM Surr: Dibromofluoromethane 80-122 %REC 5101 0 3/12/2015 04:18 AM Surr: Dibromofluoromethane 80-122 %REC 1104 0 3/11/2015 04:36 PM Surr: Toluene-d8 80-120 %REC 599.2 0 3/12/2015 04:18 AM Surr: Toluene-d8 80-120 %REC 1102 0 3/11/2015 04:36 PM
HEXAVALENT CHROMIUM BY ICEPA 218.6
Analyst: RBRunID: IC6_150309A R99366QC Batch: PrepDate
Hexavalent Chromium 0.20 µg/L 10.71 0.015 3/9/2015 02:19 PM
DISSOLVED METALS BY ICP-MSEPA 6020
Analyst: CEI
EPA 3010A
RunID: ICP7_150311A 49876QC Batch: PrepDate 3/10/2015
Arsenic 0.10 µg/L 11.9 0.027 3/11/2015 01:27 PMChromium 1.0 µg/L 1ND 0.030 3/11/2015 01:27 PMManganese 0.50 µg/L 133 0.026 3/11/2015 01:27 PM
Qualifiers: B Analyte detected in the associated Method Blank E Value above quantitation rangeH Holding times for preparation or analysis exceeded ND Not Detected at the Reporting LimitS Spike/Surrogate outside of limits due to matrix interference Results are wet unless otherwise specified
DO Surrogate Diluted Out
31 of 45

NEVADA 3151 W. Post Rd., Las Vegas, NV 89118
P: 702.307.2659 F: 702.307.2691
“Serving Clients with Passion and Professionalism”
CALIFORNIA 11060 Artesia Blvd., Ste C, Cerritos, CA 90703
P: 562.219.7435 F: 562.219.7436
Project: Maryland Square, Z085000030
Client Sample ID: MW-40 CMT45Collection Date: 3/5/2015 2:00:00 PM
Matrix: GROUNDWATER
CLIENT: Cardno ATCLab Order: N014893
Lab ID: N014893-028
ASSET Laboratories Print Date: 16-Mar-15
Analyses Result Qual Units Date AnalyzedDFPQLMDL
ANALYTICAL RESULTS
VOLATILE ORGANIC COMPOUNDS BY GC/MSEPA 8260B
Analyst: QBMRunID: MS5_150311B P15VW040QC Batch: PrepDate
1,1-Dichloroethene 0.50 µg/L 1ND 0.16 3/12/2015 08:04 AMcis-1,2-Dichloroethene 0.50 µg/L 1ND 0.057 3/12/2015 08:04 AMTetrachloroethene 2.5 µg/L 5120 0.59 3/13/2015 07:38 AMtrans-1,2-Dichloroethene 0.50 µg/L 1ND 0.074 3/12/2015 08:04 AMTrichloroethene 0.50 µg/L 13.2 0.074 3/12/2015 08:04 AMVinyl chloride 0.50 µg/L 1ND 0.044 3/12/2015 08:04 AM Surr: 1,2-Dichloroethane-d4 78-125 %REC 1103 0 3/12/2015 08:04 AM Surr: 1,2-Dichloroethane-d4 78-125 %REC 598.0 0 3/13/2015 07:38 AM Surr: 4-Bromofluorobenzene 80-120 %REC 597.2 0 3/13/2015 07:38 AM Surr: 4-Bromofluorobenzene 80-120 %REC 196.3 0 3/12/2015 08:04 AM Surr: Dibromofluoromethane 80-122 %REC 599.1 0 3/13/2015 07:38 AM Surr: Dibromofluoromethane 80-122 %REC 1104 0 3/12/2015 08:04 AM Surr: Toluene-d8 80-120 %REC 599.2 0 3/13/2015 07:38 AM Surr: Toluene-d8 80-120 %REC 199.4 0 3/12/2015 08:04 AM
HEXAVALENT CHROMIUM BY ICEPA 218.6
Analyst: RBRunID: IC6_150309A R99366QC Batch: PrepDate
Hexavalent Chromium 0.20 µg/L 10.53 0.015 3/9/2015 02:29 PM
DISSOLVED METALS BY ICP-MSEPA 6020
Analyst: CEI
EPA 3010A
RunID: ICP7_150311A 49876QC Batch: PrepDate 3/10/2015
Arsenic 0.10 µg/L 11.9 0.027 3/11/2015 01:32 PMChromium 1.0 µg/L 1ND 0.030 3/11/2015 01:32 PMManganese 0.50 µg/L 115 0.026 3/11/2015 01:32 PM
Qualifiers: B Analyte detected in the associated Method Blank E Value above quantitation rangeH Holding times for preparation or analysis exceeded ND Not Detected at the Reporting LimitS Spike/Surrogate outside of limits due to matrix interference Results are wet unless otherwise specified
DO Surrogate Diluted Out
32 of 45

NEVADA 3151 W. Post Rd., Las Vegas, NV 89118
P: 702.307.2659 F: 702.307.2691
“Serving Clients with Passion and Professionalism”
CALIFORNIA 11060 Artesia Blvd., Ste C, Cerritos, CA 90703
P: 562.219.7435 F: 562.219.7436
Project: Maryland Square, Z085000030
Client Sample ID: MW-40 CMT50Collection Date: 3/5/2015 1:08:00 PM
Matrix: GROUNDWATER
CLIENT: Cardno ATCLab Order: N014893
Lab ID: N014893-029
ASSET Laboratories Print Date: 16-Mar-15
Analyses Result Qual Units Date AnalyzedDFPQLMDL
ANALYTICAL RESULTS
VOLATILE ORGANIC COMPOUNDS BY GC/MSEPA 8260B
Analyst: QBMRunID: MS5_150311A P15VW039QC Batch: PrepDate
1,1-Dichloroethene 0.50 µg/L 1ND 0.16 3/11/2015 05:50 PMcis-1,2-Dichloroethene 0.50 µg/L 1ND 0.057 3/11/2015 05:50 PMTetrachloroethene 2.5 µg/L 5160 0.59 3/12/2015 04:43 AMtrans-1,2-Dichloroethene 0.50 µg/L 1ND 0.074 3/11/2015 05:50 PMTrichloroethene 0.50 µg/L 16.8 0.074 3/11/2015 05:50 PMVinyl chloride 0.50 µg/L 1ND 0.044 3/11/2015 05:50 PM Surr: 1,2-Dichloroethane-d4 78-125 %REC 1106 0 3/11/2015 05:50 PM Surr: 1,2-Dichloroethane-d4 78-125 %REC 5104 0 3/12/2015 04:43 AM Surr: 4-Bromofluorobenzene 80-120 %REC 598.4 0 3/12/2015 04:43 AM Surr: 4-Bromofluorobenzene 80-120 %REC 1103 0 3/11/2015 05:50 PM Surr: Dibromofluoromethane 80-122 %REC 5103 0 3/12/2015 04:43 AM Surr: Dibromofluoromethane 80-122 %REC 1106 0 3/11/2015 05:50 PM Surr: Toluene-d8 80-120 %REC 5101 0 3/12/2015 04:43 AM Surr: Toluene-d8 80-120 %REC 1102 0 3/11/2015 05:50 PM
HEXAVALENT CHROMIUM BY ICEPA 218.6
Analyst: RBRunID: IC6_150309A R99366QC Batch: PrepDate
Hexavalent Chromium 0.20 µg/L 10.40 0.015 3/9/2015 03:25 PM
DISSOLVED METALS BY ICP-MSEPA 6020
Analyst: CEI
EPA 3010A
RunID: ICP7_150311A 49876QC Batch: PrepDate 3/10/2015
Arsenic 0.10 µg/L 12.5 0.027 3/11/2015 01:38 PMChromium 1.0 µg/L 1ND 0.030 3/11/2015 01:38 PMManganese 0.50 µg/L 115 0.026 3/11/2015 01:38 PM
Qualifiers: B Analyte detected in the associated Method Blank E Value above quantitation rangeH Holding times for preparation or analysis exceeded ND Not Detected at the Reporting LimitS Spike/Surrogate outside of limits due to matrix interference Results are wet unless otherwise specified
DO Surrogate Diluted Out
33 of 45

NEVADA 3151 W. Post Rd., Las Vegas, NV 89118
P: 702.307.2659 F: 702.307.2691
“Serving Clients with Passion and Professionalism”
CALIFORNIA 11060 Artesia Blvd., Ste C, Cerritos, CA 90703
P: 562.219.7435 F: 562.219.7436
Project: Maryland Square, Z085000030
Client Sample ID: MW-40 CMT55Collection Date: 3/5/2015 12:04:00 PM
Matrix: GROUNDWATER
CLIENT: Cardno ATCLab Order: N014893
Lab ID: N014893-030
ASSET Laboratories Print Date: 16-Mar-15
Analyses Result Qual Units Date AnalyzedDFPQLMDL
ANALYTICAL RESULTS
VOLATILE ORGANIC COMPOUNDS BY GC/MSEPA 8260B
Analyst: QBMRunID: MS5_150311B P15VW040QC Batch: PrepDate
1,1-Dichloroethene 0.50 µg/L 1ND 0.16 3/12/2015 07:39 AMcis-1,2-Dichloroethene 0.50 µg/L 11.0 0.057 3/12/2015 07:39 AMTetrachloroethene 5.0 µg/L 10430 1.2 3/13/2015 08:03 AMtrans-1,2-Dichloroethene 0.50 µg/L 1ND 0.074 3/12/2015 07:39 AMTrichloroethene 0.50 µg/L 16.7 0.074 3/12/2015 07:39 AMVinyl chloride 0.50 µg/L 1ND 0.044 3/12/2015 07:39 AM Surr: 1,2-Dichloroethane-d4 78-125 %REC 10100 0 3/13/2015 08:03 AM Surr: 1,2-Dichloroethane-d4 78-125 %REC 1105 0 3/12/2015 07:39 AM Surr: 4-Bromofluorobenzene 80-120 %REC 1099.4 0 3/13/2015 08:03 AM Surr: 4-Bromofluorobenzene 80-120 %REC 199.2 0 3/12/2015 07:39 AM Surr: Dibromofluoromethane 80-122 %REC 10102 0 3/13/2015 08:03 AM Surr: Dibromofluoromethane 80-122 %REC 1103 0 3/12/2015 07:39 AM Surr: Toluene-d8 80-120 %REC 10100 0 3/13/2015 08:03 AM Surr: Toluene-d8 80-120 %REC 199.8 0 3/12/2015 07:39 AM
HEXAVALENT CHROMIUM BY ICEPA 218.6
Analyst: RBRunID: IC6_150309A R99366QC Batch: PrepDate
Hexavalent Chromium 1.0 µg/L 522 0.075 3/9/2015 06:18 PM
DISSOLVED METALS BY ICP-MSEPA 6020
Analyst: CEI
EPA 3010A
RunID: ICP7_150311A 49876QC Batch: PrepDate 3/10/2015
Arsenic 0.10 µg/L 11.8 0.027 3/11/2015 01:43 PMChromium 1.0 µg/L 121 0.030 3/11/2015 01:43 PMManganese 0.50 µg/L 112 0.026 3/11/2015 01:43 PM
Qualifiers: B Analyte detected in the associated Method Blank E Value above quantitation rangeH Holding times for preparation or analysis exceeded ND Not Detected at the Reporting LimitS Spike/Surrogate outside of limits due to matrix interference Results are wet unless otherwise specified
DO Surrogate Diluted Out
34 of 45

NEVADA 3151 W. Post Rd., Las Vegas, NV 89118
P: 702.307.2659 F: 702.307.2691
“Serving Clients with Passion and Professionalism”
CALIFORNIA 11060 Artesia Blvd., Ste C, Cerritos, CA 90703
P: 562.219.7435 F: 562.219.7436
Project: Maryland Square, Z085000030
Client Sample ID: MW-40 CMT60Collection Date: 3/5/2015 3:17:00 PM
Matrix: GROUNDWATER
CLIENT: Cardno ATCLab Order: N014893
Lab ID: N014893-031
ASSET Laboratories Print Date: 16-Mar-15
Analyses Result Qual Units Date AnalyzedDFPQLMDL
ANALYTICAL RESULTS
VOLATILE ORGANIC COMPOUNDS BY GC/MSEPA 8260B
Analyst: QBMRunID: MS5_150311B P15VW040QC Batch: PrepDate
1,1-Dichloroethene 0.50 µg/L 1ND 0.16 3/12/2015 08:29 AMcis-1,2-Dichloroethene 0.50 µg/L 11.8 0.057 3/12/2015 08:29 AMTetrachloroethene 5.0 µg/L 10190 1.2 3/13/2015 08:27 AMtrans-1,2-Dichloroethene 0.50 µg/L 1ND 0.074 3/12/2015 08:29 AMTrichloroethene 0.50 µg/L 18.9 0.074 3/12/2015 08:29 AMVinyl chloride 0.50 µg/L 1ND 0.044 3/12/2015 08:29 AM Surr: 1,2-Dichloroethane-d4 78-125 %REC 1102 0 3/12/2015 08:29 AM Surr: 1,2-Dichloroethane-d4 78-125 %REC 1098.0 0 3/13/2015 08:27 AM Surr: 4-Bromofluorobenzene 80-120 %REC 1099.0 0 3/13/2015 08:27 AM Surr: 4-Bromofluorobenzene 80-120 %REC 199.6 0 3/12/2015 08:29 AM Surr: Dibromofluoromethane 80-122 %REC 1099.4 0 3/13/2015 08:27 AM Surr: Dibromofluoromethane 80-122 %REC 1105 0 3/12/2015 08:29 AM Surr: Toluene-d8 80-120 %REC 1098.4 0 3/13/2015 08:27 AM Surr: Toluene-d8 80-120 %REC 199.4 0 3/12/2015 08:29 AM
HEXAVALENT CHROMIUM BY ICEPA 218.6
Analyst: RBRunID: IC6_150309A R99366QC Batch: PrepDate
Hexavalent Chromium 2.0 µg/L 1056 0.15 3/9/2015 03:45 PM
DISSOLVED METALS BY ICP-MSEPA 6020
Analyst: CEI
EPA 3010A
RunID: ICP7_150311A 49876QC Batch: PrepDate 3/10/2015
Arsenic 0.10 µg/L 11.3 0.027 3/11/2015 01:49 PMChromium 1.0 µg/L 161 0.030 3/11/2015 01:49 PMManganese 0.50 µg/L 123 0.026 3/11/2015 01:49 PM
Qualifiers: B Analyte detected in the associated Method Blank E Value above quantitation rangeH Holding times for preparation or analysis exceeded ND Not Detected at the Reporting LimitS Spike/Surrogate outside of limits due to matrix interference Results are wet unless otherwise specified
DO Surrogate Diluted Out
35 of 45

NEVADA 3151 W. Post Rd., Las Vegas, NV 89118
P: 702.307.2659 F: 702.307.2691
“Serving Clients with Passion and Professionalism”
CALIFORNIA 11060 Artesia Blvd., Ste C, Cerritos, CA 90703
P: 562.219.7435 F: 562.219.7436
16-Mar-15Date:ASSET Laboratories
Project: Maryland Square, Z085000030
CLIENT: Cardno ATCWork Order: N014893
ANALYTICAL QC SUMMARY REPORTTestCode: 218.6_W
Sample ID MB-R99366
Batch ID: R99366 TestNo: EPA 218.6 Analysis Date: 3/9/2015
Prep Date:
Analyte Result SPK value SPK Ref Val %REC RPD Ref Val %RPDLowLimit HighLimit RPDLimit Qual
Units: µg/L
PQL
Client ID: PBW
RunNo: 99366
SeqNo: 1948690
MBLKSampType: TestCode: 218.6_W
Hexavalent Chromium 0.20ND
Sample ID LCS-R99366
Batch ID: R99366 TestNo: EPA 218.6 Analysis Date: 3/9/2015
Prep Date:
Analyte Result SPK value SPK Ref Val %REC RPD Ref Val %RPDLowLimit HighLimit RPDLimit Qual
Units: µg/L
PQL
Client ID: LCSW
RunNo: 99366
SeqNo: 1948691
LCSSampType: TestCode: 218.6_W
Hexavalent Chromium 5.000 99.4 90 1100.20 04.968
Sample ID N014893-003C-DUP
Batch ID: R99366 TestNo: EPA 218.6 Analysis Date: 3/9/2015
Prep Date:
Analyte Result SPK value SPK Ref Val %REC RPD Ref Val %RPDLowLimit HighLimit RPDLimit Qual
Units: µg/L
PQL
Client ID: ZZZZZZ
RunNo: 99366
SeqNo: 1948693
DUPSampType: TestCode: 218.6_W
Hexavalent Chromium 200.20 1.692 1.081.674
Sample ID N014893-003C-MS
Batch ID: R99366 TestNo: EPA 218.6 Analysis Date: 3/9/2015
Prep Date:
Analyte Result SPK value SPK Ref Val %REC RPD Ref Val %RPDLowLimit HighLimit RPDLimit Qual
Units: µg/L
PQL
Client ID: ZZZZZZ
RunNo: 99366
SeqNo: 1948700
MSSampType: TestCode: 218.6_W
Hexavalent Chromium 5.000 104 90 1100.20 1.6926.895
Sample ID N014893-003C-MSD
Batch ID: R99366 TestNo: EPA 218.6 Analysis Date: 3/9/2015
Prep Date:
Analyte Result SPK value SPK Ref Val %REC RPD Ref Val %RPDLowLimit HighLimit RPDLimit Qual
Units: µg/L
PQL
Client ID: ZZZZZZ
RunNo: 99366
SeqNo: 1948701
MSDSampType: TestCode: 218.6_W
Hexavalent Chromium 5.000 104 90 110 200.20 1.692 6.895 0.01746.896
Qualifiers: B Analyte detected in the associated Method Blank E Value above quantitation range H Holding times for preparation or analysis exceeded
ND Not Detected at the Reporting Limit R RPD outside accepted recovery limits S Spike/Surrogate outside of limits due to matrix interferenceDO Surrogate Diluted Out Calculations are based on raw values
36 of 45

NEVADA 3151 W. Post Rd., Las Vegas, NV 89118
P: 702.307.2659 F: 702.307.2691
“Serving Clients with Passion and Professionalism”
CALIFORNIA 11060 Artesia Blvd., Ste C, Cerritos, CA 90703
P: 562.219.7435 F: 562.219.7436
Project: Maryland Square, Z085000030
CLIENT: Cardno ATCWork Order: N014893
ANALYTICAL QC SUMMARY REPORTTestCode: 6020_DIS
Sample ID MB-49876
Batch ID: 49876 TestNo: EPA 6020 Analysis Date: 3/11/2015
Prep Date: 3/10/2015
Analyte Result SPK value SPK Ref Val %REC RPD Ref Val %RPDLowLimit HighLimit RPDLimit Qual
Units: µg/L
PQL
Client ID: PBW
RunNo: 99382
SeqNo: 1950159
MBLKSampType: TestCode: 6020_DIS
EPA 3010A
Arsenic 0.10NDChromium 1.00.044Manganese 0.50ND
Sample ID LCS-49876
Batch ID: 49876 TestNo: EPA 6020 Analysis Date: 3/11/2015
Prep Date: 3/10/2015
Analyte Result SPK value SPK Ref Val %REC RPD Ref Val %RPDLowLimit HighLimit RPDLimit Qual
Units: µg/L
PQL
Client ID: LCSW
RunNo: 99382
SeqNo: 1950160
LCSSampType: TestCode: 6020_DIS
EPA 3010A
Arsenic 10.00 102 85 1150.10 010.191Chromium 10.00 102 85 1151.0 010.184Manganese 100.0 104 85 1150.50 0103.716
Sample ID N014926-001B-MS
Batch ID: 49876 TestNo: EPA 6020 Analysis Date: 3/11/2015
Prep Date: 3/10/2015
Analyte Result SPK value SPK Ref Val %REC RPD Ref Val %RPDLowLimit HighLimit RPDLimit Qual
Units: µg/L
PQL
Client ID: ZZZZZZ
RunNo: 99382
SeqNo: 1950164
MSSampType: TestCode: 6020_DIS
EPA 3010A
Arsenic 10.00 117 75 1250.10 0.989512.672Chromium 10.00 112 75 1251.0 1.42212.642Manganese 100.0 110 75 1250.50 0110.161
Sample ID N014926-001B-MSD
Batch ID: 49876 TestNo: EPA 6020 Analysis Date: 3/11/2015
Prep Date: 3/10/2015
Analyte Result SPK value SPK Ref Val %REC RPD Ref Val %RPDLowLimit HighLimit RPDLimit Qual
Units: µg/L
PQL
Client ID: ZZZZZZ
RunNo: 99382
SeqNo: 1950165
MSDSampType: TestCode: 6020_DIS
EPA 3010A
Arsenic 10.00 117 75 125 200.10 0.9895 12.67 0.50712.736Chromium 10.00 112 75 125 201.0 1.422 12.64 0.42412.589Manganese 100.0 110 75 125 200.50 0 110.2 0.246110.433
Qualifiers: B Analyte detected in the associated Method Blank E Value above quantitation range H Holding times for preparation or analysis exceeded
ND Not Detected at the Reporting Limit R RPD outside accepted recovery limits S Spike/Surrogate outside of limits due to matrix interferenceDO Surrogate Diluted Out Calculations are based on raw values
37 of 45

NEVADA 3151 W. Post Rd., Las Vegas, NV 89118
P: 702.307.2659 F: 702.307.2691
“Serving Clients with Passion and Professionalism”
CALIFORNIA 11060 Artesia Blvd., Ste C, Cerritos, CA 90703
P: 562.219.7435 F: 562.219.7436
Project: Maryland Square, Z085000030
CLIENT: Cardno ATCWork Order: N014893
ANALYTICAL QC SUMMARY REPORTTestCode: 8260WATERP
Sample ID P150310LCS2
Batch ID: P15VW038 TestNo: EPA 8260B Analysis Date: 3/10/2015
Prep Date:
Analyte Result SPK value SPK Ref Val %REC RPD Ref Val %RPDLowLimit HighLimit RPDLimit Qual
Units: µg/L
PQL
Client ID: LCSW
RunNo: 99373
SeqNo: 1949746
LCSSampType: TestCode: 8260WATER
1,1-Dichloroethene 20.00 104 71 1270.50 020.760cis-1,2-Dichloroethene 20.00 97.0 80 1200.50 019.410Tetrachloroethene 20.00 107 80 1200.50 021.480trans-1,2-Dichloroethene 20.00 95.8 78 1260.50 019.160Trichloroethene 20.00 106 80 1200.50 021.130Vinyl chloride 20.00 90.0 70 1350.50 018.000 Surr: 1,2-Dichloroethane-d4 25.00 92.8 78 12523.190 Surr: 4-Bromofluorobenzene 25.00 103 80 12025.770 Surr: Dibromofluoromethane 25.00 95.1 80 12223.770 Surr: Toluene-d8 25.00 99.8 80 12024.960
Sample ID N014893-002AMS
Batch ID: P15VW038 TestNo: EPA 8260B Analysis Date: 3/10/2015
Prep Date:
Analyte Result SPK value SPK Ref Val %REC RPD Ref Val %RPDLowLimit HighLimit RPDLimit Qual
Units: µg/L
PQL
Client ID: ZZZZZZ
RunNo: 99373
SeqNo: 1949747
MSSampType: TestCode: 8260WATER
1,1-Dichloroethene 20.00 101 62 1350.50 020.290cis-1,2-Dichloroethene 20.00 95.0 73 1250.50 019.000Tetrachloroethene 20.00 105 71 1230.50 020.980trans-1,2-Dichloroethene 20.00 95.4 64 1320.50 019.090Trichloroethene 20.00 105 79 1210.50 020.980Vinyl chloride 20.00 88.8 64 1340.50 017.760 Surr: 1,2-Dichloroethane-d4 25.00 94.1 78 12523.520 Surr: 4-Bromofluorobenzene 25.00 103 80 12025.820 Surr: Dibromofluoromethane 25.00 97.6 80 12224.390 Surr: Toluene-d8 25.00 101 80 12025.330
Sample ID N014893-002AMSD
Batch ID: P15VW038 TestNo: EPA 8260B Analysis Date: 3/10/2015
Prep Date:
Analyte Result SPK value SPK Ref Val %REC RPD Ref Val %RPDLowLimit HighLimit RPDLimit Qual
Units: µg/L
PQL
Client ID: ZZZZZZ
RunNo: 99373
SeqNo: 1949748
MSDSampType: TestCode: 8260WATER
Qualifiers: B Analyte detected in the associated Method Blank E Value above quantitation range H Holding times for preparation or analysis exceeded
ND Not Detected at the Reporting Limit R RPD outside accepted recovery limits S Spike/Surrogate outside of limits due to matrix interferenceDO Surrogate Diluted Out Calculations are based on raw values
38 of 45
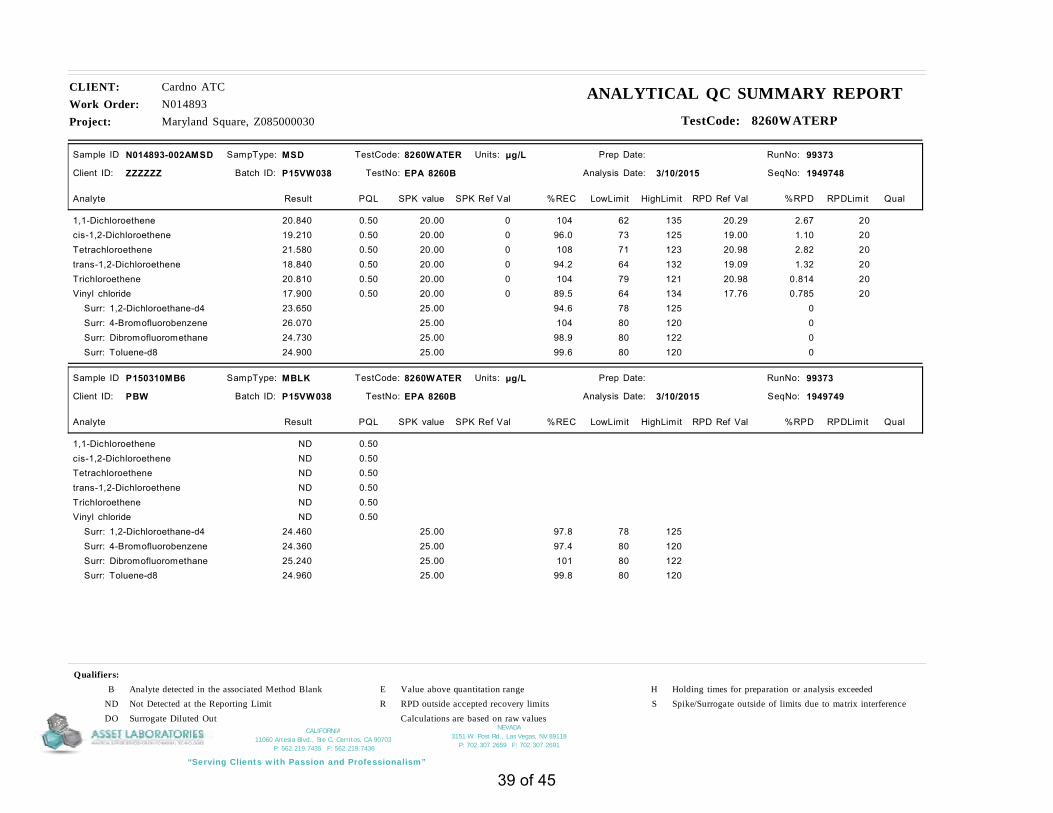
NEVADA 3151 W. Post Rd., Las Vegas, NV 89118
P: 702.307.2659 F: 702.307.2691
“Serving Clients with Passion and Professionalism”
CALIFORNIA 11060 Artesia Blvd., Ste C, Cerritos, CA 90703
P: 562.219.7435 F: 562.219.7436
Project: Maryland Square, Z085000030
CLIENT: Cardno ATCWork Order: N014893
ANALYTICAL QC SUMMARY REPORTTestCode: 8260WATERP
Sample ID N014893-002AMSD
Batch ID: P15VW038 TestNo: EPA 8260B Analysis Date: 3/10/2015
Prep Date:
Analyte Result SPK value SPK Ref Val %REC RPD Ref Val %RPDLowLimit HighLimit RPDLimit Qual
Units: µg/L
PQL
Client ID: ZZZZZZ
RunNo: 99373
SeqNo: 1949748
MSDSampType: TestCode: 8260WATER
1,1-Dichloroethene 20.00 104 62 135 200.50 0 20.29 2.6720.840cis-1,2-Dichloroethene 20.00 96.0 73 125 200.50 0 19.00 1.1019.210Tetrachloroethene 20.00 108 71 123 200.50 0 20.98 2.8221.580trans-1,2-Dichloroethene 20.00 94.2 64 132 200.50 0 19.09 1.3218.840Trichloroethene 20.00 104 79 121 200.50 0 20.98 0.81420.810Vinyl chloride 20.00 89.5 64 134 200.50 0 17.76 0.78517.900 Surr: 1,2-Dichloroethane-d4 25.00 94.6 78 125 023.650 Surr: 4-Bromofluorobenzene 25.00 104 80 120 026.070 Surr: Dibromofluoromethane 25.00 98.9 80 122 024.730 Surr: Toluene-d8 25.00 99.6 80 120 024.900
Sample ID P150310MB6
Batch ID: P15VW038 TestNo: EPA 8260B Analysis Date: 3/10/2015
Prep Date:
Analyte Result SPK value SPK Ref Val %REC RPD Ref Val %RPDLowLimit HighLimit RPDLimit Qual
Units: µg/L
PQL
Client ID: PBW
RunNo: 99373
SeqNo: 1949749
MBLKSampType: TestCode: 8260WATER
1,1-Dichloroethene 0.50NDcis-1,2-Dichloroethene 0.50NDTetrachloroethene 0.50NDtrans-1,2-Dichloroethene 0.50NDTrichloroethene 0.50NDVinyl chloride 0.50ND Surr: 1,2-Dichloroethane-d4 25.00 97.8 78 12524.460 Surr: 4-Bromofluorobenzene 25.00 97.4 80 12024.360 Surr: Dibromofluoromethane 25.00 101 80 12225.240 Surr: Toluene-d8 25.00 99.8 80 12024.960
Qualifiers: B Analyte detected in the associated Method Blank E Value above quantitation range H Holding times for preparation or analysis exceeded
ND Not Detected at the Reporting Limit R RPD outside accepted recovery limits S Spike/Surrogate outside of limits due to matrix interferenceDO Surrogate Diluted Out Calculations are based on raw values
39 of 45

NEVADA 3151 W. Post Rd., Las Vegas, NV 89118
P: 702.307.2659 F: 702.307.2691
“Serving Clients with Passion and Professionalism”
CALIFORNIA 11060 Artesia Blvd., Ste C, Cerritos, CA 90703
P: 562.219.7435 F: 562.219.7436
Project: Maryland Square, Z085000030
CLIENT: Cardno ATCWork Order: N014893
ANALYTICAL QC SUMMARY REPORTTestCode: 8260WATERP
Sample ID P150311LCS
Batch ID: P15VW039 TestNo: EPA 8260B Analysis Date: 3/11/2015
Prep Date:
Analyte Result SPK value SPK Ref Val %REC RPD Ref Val %RPDLowLimit HighLimit RPDLimit Qual
Units: µg/L
PQL
Client ID: LCSW
RunNo: 99393
SeqNo: 1950542
LCSSampType: TestCode: 8260WATER
1,1-Dichloroethene 20.00 109 71 1270.50 021.770cis-1,2-Dichloroethene 20.00 95.8 80 1200.50 019.150Tetrachloroethene 20.00 110 80 1200.50 021.970trans-1,2-Dichloroethene 20.00 95.5 78 1260.50 019.100Trichloroethene 20.00 108 80 1200.50 021.610Vinyl chloride 20.00 96.6 70 1350.50 019.310 Surr: 1,2-Dichloroethane-d4 25.00 98.8 78 12524.700 Surr: 4-Bromofluorobenzene 25.00 104 80 12025.910 Surr: Dibromofluoromethane 25.00 97.5 80 12224.380 Surr: Toluene-d8 25.00 102 80 12025.520
Sample ID N014893-024AMS
Batch ID: P15VW039 TestNo: EPA 8260B Analysis Date: 3/11/2015
Prep Date:
Analyte Result SPK value SPK Ref Val %REC RPD Ref Val %RPDLowLimit HighLimit RPDLimit Qual
Units: µg/L
PQL
Client ID: ZZZZZZ
RunNo: 99393
SeqNo: 1950543
MSSampType: TestCode: 8260WATER
1,1-Dichloroethene 20.00 107 62 1350.50 021.320cis-1,2-Dichloroethene 20.00 95.4 73 1250.50 019.090Tetrachloroethene 20.00 107 71 1230.50 0.280021.770trans-1,2-Dichloroethene 20.00 96.5 64 1320.50 019.300Trichloroethene 20.00 106 79 1210.50 021.180Vinyl chloride 20.00 94.1 64 1340.50 018.810 Surr: 1,2-Dichloroethane-d4 25.00 96.8 78 12524.190 Surr: 4-Bromofluorobenzene 25.00 104 80 12025.910 Surr: Dibromofluoromethane 25.00 98.6 80 12224.640 Surr: Toluene-d8 25.00 101 80 12025.250
Sample ID N014893-024AMSD
Batch ID: P15VW039 TestNo: EPA 8260B Analysis Date: 3/11/2015
Prep Date:
Analyte Result SPK value SPK Ref Val %REC RPD Ref Val %RPDLowLimit HighLimit RPDLimit Qual
Units: µg/L
PQL
Client ID: ZZZZZZ
RunNo: 99393
SeqNo: 1950544
MSDSampType: TestCode: 8260WATER
Qualifiers: B Analyte detected in the associated Method Blank E Value above quantitation range H Holding times for preparation or analysis exceeded
ND Not Detected at the Reporting Limit R RPD outside accepted recovery limits S Spike/Surrogate outside of limits due to matrix interferenceDO Surrogate Diluted Out Calculations are based on raw values
40 of 45

NEVADA 3151 W. Post Rd., Las Vegas, NV 89118
P: 702.307.2659 F: 702.307.2691
“Serving Clients with Passion and Professionalism”
CALIFORNIA 11060 Artesia Blvd., Ste C, Cerritos, CA 90703
P: 562.219.7435 F: 562.219.7436
Project: Maryland Square, Z085000030
CLIENT: Cardno ATCWork Order: N014893
ANALYTICAL QC SUMMARY REPORTTestCode: 8260WATERP
Sample ID N014893-024AMSD
Batch ID: P15VW039 TestNo: EPA 8260B Analysis Date: 3/11/2015
Prep Date:
Analyte Result SPK value SPK Ref Val %REC RPD Ref Val %RPDLowLimit HighLimit RPDLimit Qual
Units: µg/L
PQL
Client ID: ZZZZZZ
RunNo: 99393
SeqNo: 1950544
MSDSampType: TestCode: 8260WATER
1,1-Dichloroethene 20.00 107 62 135 200.50 0 21.32 0.32821.390cis-1,2-Dichloroethene 20.00 96.8 73 125 200.50 0 19.09 1.4019.360Tetrachloroethene 20.00 110 71 123 200.50 0.2800 21.77 2.2322.260trans-1,2-Dichloroethene 20.00 96.6 64 132 200.50 0 19.30 0.10419.320Trichloroethene 20.00 110 79 121 200.50 0 21.18 4.0222.050Vinyl chloride 20.00 97.6 64 134 200.50 0 18.81 3.7019.520 Surr: 1,2-Dichloroethane-d4 25.00 97.9 78 125 024.480 Surr: 4-Bromofluorobenzene 25.00 101 80 120 025.350 Surr: Dibromofluoromethane 25.00 97.6 80 122 024.390 Surr: Toluene-d8 25.00 100 80 120 025.090
Sample ID P150311MB3
Batch ID: P15VW039 TestNo: EPA 8260B Analysis Date: 3/11/2015
Prep Date:
Analyte Result SPK value SPK Ref Val %REC RPD Ref Val %RPDLowLimit HighLimit RPDLimit Qual
Units: µg/L
PQL
Client ID: PBW
RunNo: 99393
SeqNo: 1950545
MBLKSampType: TestCode: 8260WATER
1,1-Dichloroethene 0.50NDcis-1,2-Dichloroethene 0.50NDTetrachloroethene 0.500.240trans-1,2-Dichloroethene 0.50NDTrichloroethene 0.50NDVinyl chloride 0.50ND Surr: 1,2-Dichloroethane-d4 25.00 101 78 12525.270 Surr: 4-Bromofluorobenzene 25.00 99.6 80 12024.910 Surr: Dibromofluoromethane 25.00 101 80 12225.140 Surr: Toluene-d8 25.00 101 80 12025.280
Qualifiers: B Analyte detected in the associated Method Blank E Value above quantitation range H Holding times for preparation or analysis exceeded
ND Not Detected at the Reporting Limit R RPD outside accepted recovery limits S Spike/Surrogate outside of limits due to matrix interferenceDO Surrogate Diluted Out Calculations are based on raw values
41 of 45

NEVADA 3151 W. Post Rd., Las Vegas, NV 89118
P: 702.307.2659 F: 702.307.2691
“Serving Clients with Passion and Professionalism”
CALIFORNIA 11060 Artesia Blvd., Ste C, Cerritos, CA 90703
P: 562.219.7435 F: 562.219.7436
Project: Maryland Square, Z085000030
CLIENT: Cardno ATCWork Order: N014893
ANALYTICAL QC SUMMARY REPORTTestCode: 8260WATERP
Sample ID P150311LCS2
Batch ID: P15VW040 TestNo: EPA 8260B Analysis Date: 3/11/2015
Prep Date:
Analyte Result SPK value SPK Ref Val %REC RPD Ref Val %RPDLowLimit HighLimit RPDLimit Qual
Units: µg/L
PQL
Client ID: LCSW
RunNo: 99397
SeqNo: 1950651
LCSSampType: TestCode: 8260WATER
1,1-Dichloroethene 20.00 109 71 1270.50 021.880cis-1,2-Dichloroethene 20.00 94.7 80 1200.50 018.940Tetrachloroethene 20.00 106 80 1200.50 021.130trans-1,2-Dichloroethene 20.00 91.5 78 1260.50 018.300Trichloroethene 20.00 104 80 1200.50 020.740Vinyl chloride 20.00 94.2 70 1350.50 018.840 Surr: 1,2-Dichloroethane-d4 25.00 96.5 78 12524.120 Surr: 4-Bromofluorobenzene 25.00 104 80 12025.970 Surr: Dibromofluoromethane 25.00 99.2 80 12224.810 Surr: Toluene-d8 25.00 101 80 12025.130
Sample ID P150311LCSD
Batch ID: P15VW040 TestNo: EPA 8260B Analysis Date: 3/11/2015
Prep Date:
Analyte Result SPK value SPK Ref Val %REC RPD Ref Val %RPDLowLimit HighLimit RPDLimit Qual
Units: µg/L
PQL
Client ID: LCSS02
RunNo: 99397
SeqNo: 1950652
LCSDSampType: TestCode: 8260WATER
1,1-Dichloroethene 20.00 108 71 127 200.50 0 21.88 0.87221.690cis-1,2-Dichloroethene 20.00 93.8 80 120 200.50 0 18.94 1.0118.750Tetrachloroethene 20.00 107 80 120 200.50 0 21.13 1.6021.470trans-1,2-Dichloroethene 20.00 93.2 78 126 200.50 0 18.30 1.7918.630Trichloroethene 20.00 105 80 120 200.50 0 20.74 1.4821.050Vinyl chloride 20.00 94.6 70 135 200.50 0 18.84 0.47718.930 Surr: 1,2-Dichloroethane-d4 25.00 95.0 78 125 023.740 Surr: 4-Bromofluorobenzene 25.00 103 80 120 025.720 Surr: Dibromofluoromethane 25.00 96.8 80 122 024.210 Surr: Toluene-d8 25.00 99.9 80 120 024.970
Sample ID P150311MB6
Batch ID: P15VW040 TestNo: EPA 8260B Analysis Date: 3/12/2015
Prep Date:
Analyte Result SPK value SPK Ref Val %REC RPD Ref Val %RPDLowLimit HighLimit RPDLimit Qual
Units: µg/L
PQL
Client ID: PBW
RunNo: 99397
SeqNo: 1950653
MBLKSampType: TestCode: 8260WATER
Qualifiers: B Analyte detected in the associated Method Blank E Value above quantitation range H Holding times for preparation or analysis exceeded
ND Not Detected at the Reporting Limit R RPD outside accepted recovery limits S Spike/Surrogate outside of limits due to matrix interferenceDO Surrogate Diluted Out Calculations are based on raw values
42 of 45

NEVADA 3151 W. Post Rd., Las Vegas, NV 89118
P: 702.307.2659 F: 702.307.2691
“Serving Clients with Passion and Professionalism”
CALIFORNIA 11060 Artesia Blvd., Ste C, Cerritos, CA 90703
P: 562.219.7435 F: 562.219.7436
Project: Maryland Square, Z085000030
CLIENT: Cardno ATCWork Order: N014893
ANALYTICAL QC SUMMARY REPORTTestCode: 8260WATERP
Sample ID P150311MB6
Batch ID: P15VW040 TestNo: EPA 8260B Analysis Date: 3/12/2015
Prep Date:
Analyte Result SPK value SPK Ref Val %REC RPD Ref Val %RPDLowLimit HighLimit RPDLimit Qual
Units: µg/L
PQL
Client ID: PBW
RunNo: 99397
SeqNo: 1950653
MBLKSampType: TestCode: 8260WATER
1,1-Dichloroethene 0.50NDcis-1,2-Dichloroethene 0.50NDTetrachloroethene 0.50NDtrans-1,2-Dichloroethene 0.50NDTrichloroethene 0.50NDVinyl chloride 0.50ND Surr: 1,2-Dichloroethane-d4 25.00 101 78 12525.340 Surr: 4-Bromofluorobenzene 25.00 99.4 80 12024.850 Surr: Dibromofluoromethane 25.00 103 80 12225.670 Surr: Toluene-d8 25.00 101 80 12025.360
Qualifiers: B Analyte detected in the associated Method Blank E Value above quantitation range H Holding times for preparation or analysis exceeded
ND Not Detected at the Reporting Limit R RPD outside accepted recovery limits S Spike/Surrogate outside of limits due to matrix interferenceDO Surrogate Diluted Out Calculations are based on raw values
43 of 45

NEVADA 3151 W. Post Rd., Las Vegas, NV 89118
P: 702.307.2659 F: 702.307.2691
“Serving Clients with Passion and Professionalism”
CALIFORNIA 11060 Artesia Blvd., Ste C, Cerritos, CA 90703
P: 562.219.7435 F: 562.219.7436
Project: Maryland Square, Z085000030
CLIENT: Cardno ATCWork Order: N014893
ANALYTICAL QC SUMMARY REPORTTestCode: 8260WATERP
Sample ID P150312LCS2
Batch ID: P15VW041 TestNo: EPA 8260B Analysis Date: 3/12/2015
Prep Date:
Analyte Result SPK value SPK Ref Val %REC RPD Ref Val %RPDLowLimit HighLimit RPDLimit Qual
Units: µg/L
PQL
Client ID: LCSW
RunNo: 99413
SeqNo: 1952491
LCSSampType: TestCode: 8260WATER
1,1-Dichloroethene 20.00 101 71 1270.50 020.240cis-1,2-Dichloroethene 20.00 92.5 80 1200.50 018.490Tetrachloroethene 20.00 103 80 1200.50 020.670trans-1,2-Dichloroethene 20.00 89.9 78 1260.50 017.980Trichloroethene 20.00 104 80 1200.50 020.820Vinyl chloride 20.00 93.5 70 1350.50 018.690 Surr: 1,2-Dichloroethane-d4 25.00 92.4 78 12523.110 Surr: 4-Bromofluorobenzene 25.00 105 80 12026.360 Surr: Dibromofluoromethane 25.00 95.1 80 12223.780 Surr: Toluene-d8 25.00 101 80 12025.260
Sample ID P150312LCSD
Batch ID: P15VW041 TestNo: EPA 8260B Analysis Date: 3/12/2015
Prep Date:
Analyte Result SPK value SPK Ref Val %REC RPD Ref Val %RPDLowLimit HighLimit RPDLimit Qual
Units: µg/L
PQL
Client ID: LCSS02
RunNo: 99413
SeqNo: 1952492
LCSDSampType: TestCode: 8260WATER
1,1-Dichloroethene 20.00 104 71 127 200.50 0 20.24 3.0220.860cis-1,2-Dichloroethene 20.00 94.8 80 120 200.50 0 18.49 2.4618.950Tetrachloroethene 20.00 106 80 120 200.50 0 20.67 2.6721.230trans-1,2-Dichloroethene 20.00 91.6 78 126 200.50 0 17.98 1.8718.320Trichloroethene 20.00 107 80 120 200.50 0 20.82 2.6521.380Vinyl chloride 20.00 93.3 70 135 200.50 0 18.69 0.16118.660 Surr: 1,2-Dichloroethane-d4 25.00 93.7 78 125 023.420 Surr: 4-Bromofluorobenzene 25.00 104 80 120 026.100 Surr: Dibromofluoromethane 25.00 97.0 80 122 024.240 Surr: Toluene-d8 25.00 101 80 120 025.200
Sample ID P150312MB7
Batch ID: P15VW041 TestNo: EPA 8260B Analysis Date: 3/13/2015
Prep Date:
Analyte Result SPK value SPK Ref Val %REC RPD Ref Val %RPDLowLimit HighLimit RPDLimit Qual
Units: µg/L
PQL
Client ID: PBW
RunNo: 99413
SeqNo: 1952493
MBLKSampType: TestCode: 8260WATER
Qualifiers: B Analyte detected in the associated Method Blank E Value above quantitation range H Holding times for preparation or analysis exceeded
ND Not Detected at the Reporting Limit R RPD outside accepted recovery limits S Spike/Surrogate outside of limits due to matrix interferenceDO Surrogate Diluted Out Calculations are based on raw values
44 of 45

NEVADA 3151 W. Post Rd., Las Vegas, NV 89118
P: 702.307.2659 F: 702.307.2691
“Serving Clients with Passion and Professionalism”
CALIFORNIA 11060 Artesia Blvd., Ste C, Cerritos, CA 90703
P: 562.219.7435 F: 562.219.7436
Project: Maryland Square, Z085000030
CLIENT: Cardno ATCWork Order: N014893
ANALYTICAL QC SUMMARY REPORTTestCode: 8260WATERP
Sample ID P150312MB7
Batch ID: P15VW041 TestNo: EPA 8260B Analysis Date: 3/13/2015
Prep Date:
Analyte Result SPK value SPK Ref Val %REC RPD Ref Val %RPDLowLimit HighLimit RPDLimit Qual
Units: µg/L
PQL
Client ID: PBW
RunNo: 99413
SeqNo: 1952493
MBLKSampType: TestCode: 8260WATER
1,1-Dichloroethene 0.50NDcis-1,2-Dichloroethene 0.50NDTetrachloroethene 0.50NDtrans-1,2-Dichloroethene 0.50NDTrichloroethene 0.50NDVinyl chloride 0.50ND Surr: 1,2-Dichloroethane-d4 25.00 95.0 78 12523.750 Surr: 4-Bromofluorobenzene 25.00 98.5 80 12024.620 Surr: Dibromofluoromethane 25.00 96.5 80 12224.120 Surr: Toluene-d8 25.00 101 80 12025.180
Qualifiers: B Analyte detected in the associated Method Blank E Value above quantitation range H Holding times for preparation or analysis exceeded
ND Not Detected at the Reporting Limit R RPD outside accepted recovery limits S Spike/Surrogate outside of limits due to matrix interferenceDO Surrogate Diluted Out Calculations are based on raw values
45 of 45


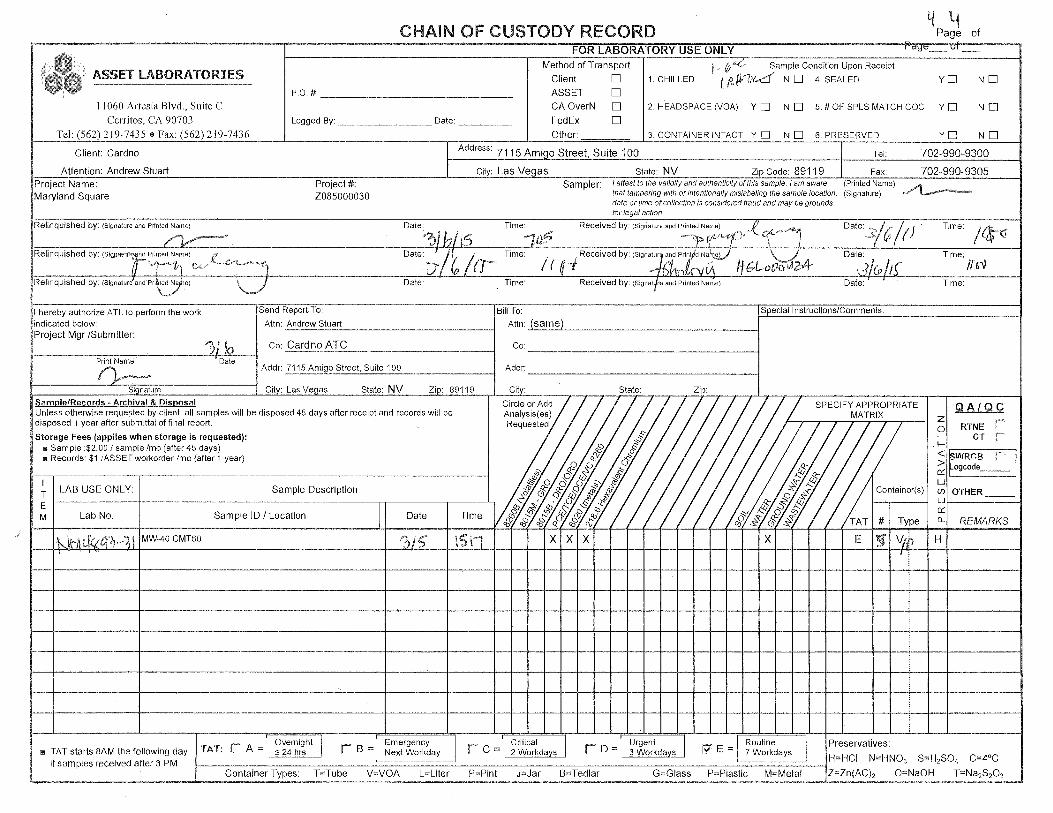

ASSET LaboratoriesPlease review the checklist below. Any NO signifies non-compliance. Any non-compliance will be noted and must be understood as having an impact on the quality of the data. All tests will be performed as requested regardless of any compliance issues.
If you have any questions or further instruction, please contact our Project Coordinator at (702) 307-2659.
Carrier name: ATL
Cooler Received/Opened On: 3/6/2015
Rep sample Temp (Deg C): 1.6 IR Gun ID: 2
Temp Blank: Yes No
Last 4 digits of Tracking No.: NA
Cooling process: Ice Ice Pack Dry Ice Other None
Packing Material Used: None
Workorder: N014893
Sample Receipt Checklist
4. Chain of custody present? Yes No
6. Chain of custody signed when relinquished and received? Yes No
7. Chain of custody agrees with sample labels? Yes No
8. Samples in proper container/bottle? Yes No
9. Sample containers intact? Yes No
10. Sufficient sample volume for indicated test? Yes No
11. All samples received within holding time? Yes No
Yes No NA13. Water - VOA vials have zero headspace?
14. Water - pH acceptable upon receipt? Yes No NAExample: pH > 12 for (CN,S); pH<2 for Metals
1. Shipping container/cooler in good condition? Yes No Not Present
2. Custody seals intact, signed, dated on shippping container/cooler? Yes No Not Present
3. Custody seals intact on sample bottles? Yes No Not Present
5. Sampler's name present in COC? Yes No
12. Temperature of rep sample or Temp Blank within acceptable limit? Yes No NA
Yes No NA15. Did the bottle labels indicate correct preservatives used?
16. Were there Non-Conformance issues at login? Yes No NAW as Client notified? Yes No NA
Comments:
Checklist Completed By: HG Reviewed By:

NEVADA 3151 W. Post Rd., Las Vegas, NV 89118
P: 702.307.2659 F: 702.307.2691
“Serving Clients with Passion and Professionalism”
CALIFORNIA 11060 Artesia Blvd., Ste C, Cerritos, CA 90703
P: 562.219.7435 F: 562.219.7436
April 22, 2015
Cardno ATC
Andrew Stuart
Attention: Andrew Stuart
RE: Maryland Square, Z085000030
Workorder No.: N014893FAX:
TEL: (702) 990-9300
7115 Amigo Street Suite 100
Las Vegas, NV 89119
CA-ELAP No.: 2676
NV Cert. No.: NV-00922
This is an amended report. Please disregard all previous documentation that corresponds to the page(s) enclosed.
Thank you for the opportunity to service the needs of your company.
Please feel free to call me at (702) 307-2659 if I can be of further assistance to your company.
Sincerely,
Glen Gesmundo
QA Manager
Enclosed are the results for sample(s) received on March 06, 2015 by ASSET Laboratories . The sample(s) are tested for the parameters as indicated in the enclosed chain of custody in accordance with the applicable laboratory certifications.
The cover letter is an integral part of this analytical report. This Laboratory Report cannot be reproduced in part or in its entirety without written permission from the client and Advanced Technology Laboratories - Las Vegas.
01 of 20

NEVADA 3151 W. Post Rd., Las Vegas, NV 89118
P: 702.307.2659 F: 702.307.2691
“Serving Clients with Passion and Professionalism”
CALIFORNIA 11060 Artesia Blvd., Ste C, Cerritos, CA 90703
P: 562.219.7435 F: 562.219.7436
Project: Maryland Square, Z085000030
Client Sample ID: MW-19
Collection Date: 3/4/2015 3:20:00 PM
Matrix: GROUNDWATER
CLIENT: Cardno ATC
Lab Order: N014893
Lab ID: N014893-003
ASSET Laboratories Print Date: 22-Apr-15
Analyses Result Qual Units Date AnalyzedDFPQLMDL
ANALYTICAL RESULTS
VOLATILE ORGANIC COMPOUNDS BY GC/MSEPA 8260B
Analyst: QBMRunID: MS5_150310B P15VW038QC Batch: PrepDate:
1,1,1,2-Tetrachloroethane 0.50 µg/L 1ND 0.068 3/11/2015 07:42 AM1,1,1-Trichloroethane 0.50 µg/L 1ND 0.072 3/11/2015 07:42 AM1,1,2,2-Tetrachloroethane 0.50 µg/L 1ND 0.10 3/11/2015 07:42 AM1,1,2-Trichloroethane 0.50 µg/L 1ND 0.042 3/11/2015 07:42 AM1,1-Dichloroethane 0.50 µg/L 1ND 0.054 3/11/2015 07:42 AM1,1-Dichloroethene 0.50 µg/L 1ND 0.16 3/11/2015 07:42 AM1,1-Dichloropropene 0.50 µg/L 1ND 0.073 3/11/2015 07:42 AM1,2,3-Trichlorobenzene 0.50 µg/L 1ND 0.077 3/11/2015 07:42 AM1,2,3-Trichloropropane 0.50 µg/L 1ND 0.071 3/11/2015 07:42 AM1,2,4-Trichlorobenzene 0.50 µg/L 1ND 0.10 3/11/2015 07:42 AM1,2,4-Trimethylbenzene 0.50 µg/L 1ND 0.036 3/11/2015 07:42 AM1,2-Dibromo-3-chloropropane 1.0 µg/L 1ND 0.23 3/11/2015 07:42 AM1,2-Dibromoethane 0.50 µg/L 1ND 0.036 3/11/2015 07:42 AM1,2-Dichlorobenzene 0.50 µg/L 1ND 0.048 3/11/2015 07:42 AM1,2-Dichloroethane 0.50 µg/L 1ND 0.044 3/11/2015 07:42 AM1,2-Dichloropropane 0.50 µg/L 1ND 0.094 3/11/2015 07:42 AM1,3,5-Trimethylbenzene 0.50 µg/L 1ND 0.054 3/11/2015 07:42 AM1,3-Dichlorobenzene 0.50 µg/L 1ND 0.061 3/11/2015 07:42 AM1,3-Dichloropropane 0.50 µg/L 1ND 0.077 3/11/2015 07:42 AM1,4-Dichlorobenzene 0.50 µg/L 1ND 0.078 3/11/2015 07:42 AM2,2-Dichloropropane 0.50 µg/L 1ND 0.061 3/11/2015 07:42 AM2-Butanone 5.0 µg/L 1ND 0.70 3/11/2015 07:42 AM2-Chlorotoluene 0.50 µg/L 1ND 0.054 3/11/2015 07:42 AM4-Chlorotoluene 0.50 µg/L 1ND 0.039 3/11/2015 07:42 AM4-Isopropyltoluene 0.50 µg/L 1ND 0.044 3/11/2015 07:42 AMBenzene 0.50 µg/L 1ND 0.048 3/11/2015 07:42 AMBromobenzene 0.50 µg/L 1ND 0.054 3/11/2015 07:42 AMBromodichloromethane 0.50 µg/L 1ND 0.048 3/11/2015 07:42 AMBromoform 0.50 µg/L 1ND 0.061 3/11/2015 07:42 AMBromomethane 1.0 µg/L 1ND 0.073 3/11/2015 07:42 AMCarbon tetrachloride 0.50 µg/L 1ND 0.057 3/11/2015 07:42 AMChlorobenzene 0.50 µg/L 1ND 0.028 3/11/2015 07:42 AMChloroethane 1.0 µg/L 1ND 0.099 3/11/2015 07:42 AMChloroform 0.50 µg/L 11.9 0.048 3/11/2015 07:42 AMChloromethane 0.50 µg/L 1ND 0.043 3/11/2015 07:42 AMcis-1,2-Dichloroethene 0.50 µg/L 1ND 0.057 3/11/2015 07:42 AM
Qualifiers: B Analyte detected in the associated Method Blank E Value above quantitation range
H Holding times for preparation or analysis exceeded ND Not Detected at the Reporting Limit
S Spike/Surrogate outside of limits due to matrix interference Results are wet unless otherwise specified
DO Surrogate Diluted Out
02 of 20

NEVADA 3151 W. Post Rd., Las Vegas, NV 89118
P: 702.307.2659 F: 702.307.2691
“Serving Clients with Passion and Professionalism”
CALIFORNIA 11060 Artesia Blvd., Ste C, Cerritos, CA 90703
P: 562.219.7435 F: 562.219.7436
Project: Maryland Square, Z085000030
Client Sample ID: MW-19
Collection Date: 3/4/2015 3:20:00 PM
Matrix: GROUNDWATER
CLIENT: Cardno ATC
Lab Order: N014893
Lab ID: N014893-003
ASSET Laboratories Print Date: 22-Apr-15
Analyses Result Qual Units Date AnalyzedDFPQLMDL
ANALYTICAL RESULTS
VOLATILE ORGANIC COMPOUNDS BY GC/MSEPA 8260B
Analyst: QBMRunID: MS5_150310B P15VW038QC Batch: PrepDate:
cis-1,3-Dichloropropene 0.50 µg/L 1ND 0.043 3/11/2015 07:42 AMDibromochloromethane 0.50 µg/L 1ND 0.057 3/11/2015 07:42 AMDibromomethane 0.50 µg/L 1ND 0.11 3/11/2015 07:42 AMDichlorodifluoromethane 0.50 µg/L 1ND 0.054 3/11/2015 07:42 AMEthylbenzene 0.50 µg/L 1ND 0.036 3/11/2015 07:42 AMHexachlorobutadiene 0.50 µg/L 1ND 0.070 3/11/2015 07:42 AMIsopropylbenzene 0.50 µg/L 1ND 0.041 3/11/2015 07:42 AMm,p-Xylene 1.0 µg/L 1ND 0.14 3/11/2015 07:42 AMMethylene chloride 2.0 µg/L 1ND 0.28 3/11/2015 07:42 AMMTBE 0.50 µg/L 1ND 0.098 3/11/2015 07:42 AMn-Butylbenzene 0.50 µg/L 1ND 0.076 3/11/2015 07:42 AMn-Propylbenzene 0.50 µg/L 1ND 0.049 3/11/2015 07:42 AMNaphthalene 0.50 µg/L 1ND 0.062 3/11/2015 07:42 AMo-Xylene 0.50 µg/L 1ND 0.042 3/11/2015 07:42 AMsec-Butylbenzene 0.50 µg/L 1ND 0.036 3/11/2015 07:42 AMStyrene 0.50 µg/L 1ND 0.040 3/11/2015 07:42 AMtert-Butylbenzene 0.50 µg/L 1ND 0.040 3/11/2015 07:42 AMTetrachloroethene 10 µg/L 20930 2.3 3/12/2015 12:31 AMToluene 0.50 µg/L 1ND 0.025 3/11/2015 07:42 AMtrans-1,2-Dichloroethene 0.50 µg/L 1ND 0.074 3/11/2015 07:42 AMTrichloroethene 0.50 µg/L 14.0 0.074 3/11/2015 07:42 AMTrichlorofluoromethane 0.50 µg/L 1ND 0.034 3/11/2015 07:42 AMVinyl chloride 0.50 µg/L 1ND 0.044 3/11/2015 07:42 AMXylenes, Total 1.5 µg/L 1ND 1.5 3/11/2015 07:42 AM Surr: 1,2-Dichloroethane-d4 78-125 %REC 1101 0 3/11/2015 07:42 AM Surr: 1,2-Dichloroethane-d4 78-125 %REC 20103 0 3/12/2015 12:31 AM Surr: 4-Bromofluorobenzene 80-120 %REC 1100 0 3/11/2015 07:42 AM Surr: 4-Bromofluorobenzene 80-120 %REC 2099.7 0 3/12/2015 12:31 AM Surr: Dibromofluoromethane 80-122 %REC 20103 0 3/12/2015 12:31 AM Surr: Dibromofluoromethane 80-122 %REC 1103 0 3/11/2015 07:42 AM Surr: Toluene-d8 80-120 %REC 2099.7 0 3/12/2015 12:31 AM Surr: Toluene-d8 80-120 %REC 199.6 0 3/11/2015 07:42 AM
HEXAVALENT CHROMIUM BY ICEPA 218.6
Analyst: RBRunID: IC6_150309A R99366QC Batch: PrepDate:
Qualifiers: B Analyte detected in the associated Method Blank E Value above quantitation range
H Holding times for preparation or analysis exceeded ND Not Detected at the Reporting Limit
S Spike/Surrogate outside of limits due to matrix interference Results are wet unless otherwise specified
DO Surrogate Diluted Out
03 of 20

NEVADA 3151 W. Post Rd., Las Vegas, NV 89118
P: 702.307.2659 F: 702.307.2691
“Serving Clients with Passion and Professionalism”
CALIFORNIA 11060 Artesia Blvd., Ste C, Cerritos, CA 90703
P: 562.219.7435 F: 562.219.7436
22-Apr-15Date:ASSET Laboratories
Project: Maryland Square, Z085000030
CLIENT: Cardno ATC
Work Order: N014893ANALYTICAL QC SUMMARY REPORT
TestCode: 8260WATERP
Sample ID: P150310LCS2
Batch ID: P15VW038 TestNo: EPA 8260B Analysis Date: 3/10/2015
Prep Date:
Analyte Result SPK value SPK Ref Val %REC RPD Ref Val %RPDLowLimit HighLimit RPDLimit Qual
Units: µg/L
PQL
Client ID: LCSW
RunNo: 99373
SeqNo: 1949746
LCSSampType: TestCode: 8260WATERP
1,1,1,2-Tetrachloroethane 20.00 107 80 1210.50 021.4901,1,1-Trichloroethane 20.00 101 77 1220.50 020.2901,1,2,2-Tetrachloroethane 20.00 93.8 77 1230.50 018.7601,1,2-Trichloroethane 20.00 102 87 1200.50 020.4201,1-Dichloroethane 20.00 93.8 72 1270.50 018.7501,1-Dichloroethene 20.00 104 71 1270.50 020.7601,1-Dichloropropene 20.00 103 87 1200.50 020.5901,2,3-Trichlorobenzene 20.00 107 77 1240.50 021.3201,2,3-Trichloropropane 20.00 90.6 77 1200.50 018.1201,2,4-Trichlorobenzene 20.00 107 76 1220.50 021.3401,2,4-Trimethylbenzene 20.00 101 85 1200.50 020.1501,2-Dibromo-3-chloropropane 20.00 104 67 1251.0 020.7301,2-Dibromoethane 20.00 105 80 1200.50 021.0101,2-Dichlorobenzene 20.00 98.5 80 1200.50 019.7001,2-Dichloroethane 20.00 99.7 80 1200.50 019.9301,2-Dichloropropane 20.00 95.6 80 1200.50 019.1201,3,5-Trimethylbenzene 20.00 100 80 1200.50 020.0901,3-Dichlorobenzene 20.00 98.3 80 1200.50 019.6601,3-Dichloropropane 20.00 100 80 1200.50 020.0201,4-Dichlorobenzene 20.00 98.2 80 1200.50 019.6302,2-Dichloropropane 20.00 99.7 53 1420.50 019.9302-Butanone 200.0 85.6 23 1755.0 0171.1602-Chlorotoluene 20.00 95.2 80 1200.50 019.0304-Chlorotoluene 20.00 96.3 80 1200.50 019.2604-Isopropyltoluene 20.00 102 80 1200.50 020.430Benzene 20.00 99.3 80 1200.50 019.860Bromobenzene 20.00 104 80 1200.50 020.720Bromodichloromethane 20.00 101 80 1200.50 020.240Bromoform 20.00 106 72 1330.50 021.290
Qualifiers:
B Analyte detected in the associated Method Blank E Value above quantitation range H Holding times for preparation or analysis exceeded
ND Not Detected at the Reporting Limit R RPD outside accepted recovery limits S Spike/Surrogate outside of limits due to matrix interference
DO Surrogate Diluted Out Calculations are based on raw values
04 of 20

NEVADA 3151 W. Post Rd., Las Vegas, NV 89118
P: 702.307.2659 F: 702.307.2691
“Serving Clients with Passion and Professionalism”
CALIFORNIA 11060 Artesia Blvd., Ste C, Cerritos, CA 90703
P: 562.219.7435 F: 562.219.7436
Project: Maryland Square, Z085000030
CLIENT: Cardno ATC
Work Order: N014893ANALYTICAL QC SUMMARY REPORT
TestCode: 8260WATERP
Sample ID: P150310LCS2
Batch ID: P15VW038 TestNo: EPA 8260B Analysis Date: 3/10/2015
Prep Date:
Analyte Result SPK value SPK Ref Val %REC RPD Ref Val %RPDLowLimit HighLimit RPDLimit Qual
Units: µg/L
PQL
Client ID: LCSW
RunNo: 99373
SeqNo: 1949746
LCSSampType: TestCode: 8260WATERP
Bromomethane 20.00 19.0 19 178 S1.0 03.790Carbon tetrachloride 20.00 118 72 1310.50 023.530Chlorobenzene 20.00 98.0 80 1200.50 019.610Chloroethane 20.00 131 66 1401.0 026.100Chloroform 20.00 93.6 77 1200.50 018.710Chloromethane 20.00 53.6 47 1540.50 010.710cis-1,2-Dichloroethene 20.00 97.0 80 1200.50 019.410cis-1,3-Dichloropropene 20.00 102 80 1200.50 020.340Dibromochloromethane 20.00 111 80 1220.50 022.170Dibromomethane 20.00 99.4 80 1200.50 019.880Dichlorodifluoromethane 20.00 118 53 1660.50 023.660Ethylbenzene 20.00 97.8 80 1200.50 019.550Hexachlorobutadiene 20.00 110 79 1230.50 022.050Isopropylbenzene 20.00 101 80 1200.50 020.260m,p-Xylene 40.00 101 80 1201.0 040.370Methylene chloride 20.00 84.2 71 1242.0 016.830MTBE 20.00 95.9 77 1200.50 019.170n-Butylbenzene 20.00 97.0 80 1270.50 019.390n-Propylbenzene 20.00 96.9 80 1220.50 019.370Naphthalene 20.00 90.3 63 1310.50 018.050o-Xylene 20.00 103 80 1200.50 020.620sec-Butylbenzene 20.00 97.4 80 1200.50 019.470Styrene 20.00 104 80 1200.50 020.840tert-Butylbenzene 20.00 103 80 1200.50 020.560Tetrachloroethene 20.00 107 80 1200.50 021.480Toluene 20.00 99.9 80 1200.50 019.980trans-1,2-Dichloroethene 20.00 95.8 78 1260.50 019.160Trichloroethene 20.00 106 80 1200.50 021.130Trichlorofluoromethane 20.00 110 67 1490.50 021.990Vinyl chloride 20.00 90.0 70 1350.50 018.000
Qualifiers:
B Analyte detected in the associated Method Blank E Value above quantitation range H Holding times for preparation or analysis exceeded
ND Not Detected at the Reporting Limit R RPD outside accepted recovery limits S Spike/Surrogate outside of limits due to matrix interference
DO Surrogate Diluted Out Calculations are based on raw values
05 of 20

NEVADA 3151 W. Post Rd., Las Vegas, NV 89118
P: 702.307.2659 F: 702.307.2691
“Serving Clients with Passion and Professionalism”
CALIFORNIA 11060 Artesia Blvd., Ste C, Cerritos, CA 90703
P: 562.219.7435 F: 562.219.7436
Project: Maryland Square, Z085000030
CLIENT: Cardno ATC
Work Order: N014893ANALYTICAL QC SUMMARY REPORT
TestCode: 8260WATERP
Sample ID: P150310LCS2
Batch ID: P15VW038 TestNo: EPA 8260B Analysis Date: 3/10/2015
Prep Date:
Analyte Result SPK value SPK Ref Val %REC RPD Ref Val %RPDLowLimit HighLimit RPDLimit Qual
Units: µg/L
PQL
Client ID: LCSW
RunNo: 99373
SeqNo: 1949746
LCSSampType: TestCode: 8260WATERP
Xylenes, Total 60.00 102 70 1301.5 060.990 Surr: 1,2-Dichloroethane-d4 25.00 92.8 78 12523.190 Surr: 4-Bromofluorobenzene 25.00 103 80 12025.770 Surr: Dibromofluoromethane 25.00 95.1 80 12223.770 Surr: Toluene-d8 25.00 99.8 80 12024.960
Sample ID: N014893-002AMS
Batch ID: P15VW038 TestNo: EPA 8260B Analysis Date: 3/10/2015
Prep Date:
Analyte Result SPK value SPK Ref Val %REC RPD Ref Val %RPDLowLimit HighLimit RPDLimit Qual
Units: µg/L
PQL
Client ID: ZZZZZZ
RunNo: 99373
SeqNo: 1949747
MSSampType: TestCode: 8260WATERP
1,1,1,2-Tetrachloroethane 20.00 105 76 1270.50 020.9601,1,1-Trichloroethane 20.00 98.9 72 1250.50 019.7801,1,2,2-Tetrachloroethane 20.00 97.0 75 1260.50 019.4101,1,2-Trichloroethane 20.00 102 80 1200.50 020.3601,1-Dichloroethane 20.00 92.8 69 1280.50 018.5501,1-Dichloroethene 20.00 101 62 1350.50 020.2901,1-Dichloropropene 20.00 102 75 1230.50 020.3401,2,3-Trichlorobenzene 20.00 105 66 1290.50 021.0001,2,3-Trichloropropane 20.00 91.6 73 1240.50 018.3201,2,4-Trichlorobenzene 20.00 104 63 1310.50 020.8301,2,4-Trimethylbenzene 20.00 97.7 62 1310.50 019.5401,2-Dibromo-3-chloropropane 20.00 108 66 1261.0 021.6401,2-Dibromoethane 20.00 105 80 1260.50 020.9601,2-Dichlorobenzene 20.00 97.9 80 1200.50 019.5801,2-Dichloroethane 20.00 101 80 1210.50 020.1401,2-Dichloropropane 20.00 95.6 79 1200.50 019.1201,3,5-Trimethylbenzene 20.00 99.0 69 1280.50 019.8101,3-Dichlorobenzene 20.00 98.6 80 1200.50 019.7301,3-Dichloropropane 20.00 98.4 80 1200.50 019.6701,4-Dichlorobenzene 20.00 96.7 80 1200.50 019.340
Qualifiers:
B Analyte detected in the associated Method Blank E Value above quantitation range H Holding times for preparation or analysis exceeded
ND Not Detected at the Reporting Limit R RPD outside accepted recovery limits S Spike/Surrogate outside of limits due to matrix interference
DO Surrogate Diluted Out Calculations are based on raw values
06 of 20

NEVADA 3151 W. Post Rd., Las Vegas, NV 89118
P: 702.307.2659 F: 702.307.2691
“Serving Clients with Passion and Professionalism”
CALIFORNIA 11060 Artesia Blvd., Ste C, Cerritos, CA 90703
P: 562.219.7435 F: 562.219.7436
Project: Maryland Square, Z085000030
CLIENT: Cardno ATC
Work Order: N014893ANALYTICAL QC SUMMARY REPORT
TestCode: 8260WATERP
Sample ID: N014893-002AMS
Batch ID: P15VW038 TestNo: EPA 8260B Analysis Date: 3/10/2015
Prep Date:
Analyte Result SPK value SPK Ref Val %REC RPD Ref Val %RPDLowLimit HighLimit RPDLimit Qual
Units: µg/L
PQL
Client ID: ZZZZZZ
RunNo: 99373
SeqNo: 1949747
MSSampType: TestCode: 8260WATERP
2,2-Dichloropropane 20.00 99.3 56 1440.50 019.8602-Butanone 200.0 86.2 4 1635.0 0172.4302-Chlorotoluene 20.00 94.0 79 1200.50 018.8004-Chlorotoluene 20.00 95.2 79 1200.50 019.0404-Isopropyltoluene 20.00 99.8 70 1280.50 019.950Benzene 20.00 98.8 80 1200.50 019.770Bromobenzene 20.00 101 80 1200.50 020.170Bromodichloromethane 20.00 103 80 1240.50 020.620Bromoform 20.00 107 66 1390.50 021.430Bromomethane 20.00 21.4 18 1741.0 04.290Carbon tetrachloride 20.00 118 59 1440.50 023.560Chlorobenzene 20.00 97.2 80 1200.50 019.440Chloroethane 20.00 105 62 1451.0 021.030Chloroform 20.00 92.6 74 1200.50 018.530Chloromethane 20.00 56.2 37 1570.50 011.230cis-1,2-Dichloroethene 20.00 95.0 73 1250.50 019.000cis-1,3-Dichloropropene 20.00 100 80 1230.50 020.070Dibromochloromethane 20.00 111 77 1300.50 022.210Dibromomethane 20.00 102 70 1320.50 020.350Dichlorodifluoromethane 20.00 113 47 1590.50 022.510Ethylbenzene 20.00 96.7 79 1200.50 019.330Hexachlorobutadiene 20.00 107 66 1280.50 021.340Isopropylbenzene 20.00 98.2 78 1200.50 019.650m,p-Xylene 40.00 99.8 80 1201.0 039.910Methylene chloride 20.00 80.8 65 1222.0 016.150MTBE 20.00 95.1 71 1250.50 019.020n-Butylbenzene 20.00 94.8 65 1340.50 018.970n-Propylbenzene 20.00 95.4 78 1210.50 019.090Naphthalene 20.00 91.1 52 1370.50 018.210o-Xylene 20.00 102 80 1200.50 020.370
Qualifiers:
B Analyte detected in the associated Method Blank E Value above quantitation range H Holding times for preparation or analysis exceeded
ND Not Detected at the Reporting Limit R RPD outside accepted recovery limits S Spike/Surrogate outside of limits due to matrix interference
DO Surrogate Diluted Out Calculations are based on raw values
07 of 20

NEVADA 3151 W. Post Rd., Las Vegas, NV 89118
P: 702.307.2659 F: 702.307.2691
“Serving Clients with Passion and Professionalism”
CALIFORNIA 11060 Artesia Blvd., Ste C, Cerritos, CA 90703
P: 562.219.7435 F: 562.219.7436
Project: Maryland Square, Z085000030
CLIENT: Cardno ATC
Work Order: N014893ANALYTICAL QC SUMMARY REPORT
TestCode: 8260WATERP
Sample ID: N014893-002AMS
Batch ID: P15VW038 TestNo: EPA 8260B Analysis Date: 3/10/2015
Prep Date:
Analyte Result SPK value SPK Ref Val %REC RPD Ref Val %RPDLowLimit HighLimit RPDLimit Qual
Units: µg/L
PQL
Client ID: ZZZZZZ
RunNo: 99373
SeqNo: 1949747
MSSampType: TestCode: 8260WATERP
sec-Butylbenzene 20.00 95.8 76 1220.50 019.160Styrene 20.00 101 43 1450.50 020.150tert-Butylbenzene 20.00 101 78 1200.50 020.160Tetrachloroethene 20.00 105 71 1230.50 020.980Toluene 20.00 99.0 80 1200.50 019.790trans-1,2-Dichloroethene 20.00 95.4 64 1320.50 019.090Trichloroethene 20.00 105 79 1210.50 020.980Trichlorofluoromethane 20.00 107 65 1440.50 021.420Vinyl chloride 20.00 88.8 64 1340.50 017.760Xylenes, Total 60.00 100 70 1301.5 060.280 Surr: 1,2-Dichloroethane-d4 25.00 94.1 78 12523.520 Surr: 4-Bromofluorobenzene 25.00 103 80 12025.820 Surr: Dibromofluoromethane 25.00 97.6 80 12224.390 Surr: Toluene-d8 25.00 101 80 12025.330
Sample ID: N014893-002AMSD
Batch ID: P15VW038 TestNo: EPA 8260B Analysis Date: 3/10/2015
Prep Date:
Analyte Result SPK value SPK Ref Val %REC RPD Ref Val %RPDLowLimit HighLimit RPDLimit Qual
Units: µg/L
PQL
Client ID: ZZZZZZ
RunNo: 99373
SeqNo: 1949748
MSDSampType: TestCode: 8260WATERP
1,1,1,2-Tetrachloroethane 20.00 107 76 127 200.50 0 20.96 2.1721.4201,1,1-Trichloroethane 20.00 102 72 125 200.50 0 19.78 2.7920.3401,1,2,2-Tetrachloroethane 20.00 95.7 75 126 200.50 0 19.41 1.4519.1301,1,2-Trichloroethane 20.00 99.6 80 120 200.50 0 20.36 2.1819.9201,1-Dichloroethane 20.00 91.9 69 128 200.50 0 18.55 0.97518.3701,1-Dichloroethene 20.00 104 62 135 200.50 0 20.29 2.6720.8401,1-Dichloropropene 20.00 101 75 123 200.50 0 20.34 0.24620.2901,2,3-Trichlorobenzene 20.00 104 66 129 200.50 0 21.00 1.3920.7101,2,3-Trichloropropane 20.00 92.6 73 124 200.50 0 18.32 1.0918.5201,2,4-Trichlorobenzene 20.00 104 63 131 200.50 0 20.83 0.33520.9001,2,4-Trimethylbenzene 20.00 97.9 62 131 200.50 0 19.54 0.15319.570
Qualifiers:
B Analyte detected in the associated Method Blank E Value above quantitation range H Holding times for preparation or analysis exceeded
ND Not Detected at the Reporting Limit R RPD outside accepted recovery limits S Spike/Surrogate outside of limits due to matrix interference
DO Surrogate Diluted Out Calculations are based on raw values
08 of 20

NEVADA 3151 W. Post Rd., Las Vegas, NV 89118
P: 702.307.2659 F: 702.307.2691
“Serving Clients with Passion and Professionalism”
CALIFORNIA 11060 Artesia Blvd., Ste C, Cerritos, CA 90703
P: 562.219.7435 F: 562.219.7436
Project: Maryland Square, Z085000030
CLIENT: Cardno ATC
Work Order: N014893ANALYTICAL QC SUMMARY REPORT
TestCode: 8260WATERP
Sample ID: N014893-002AMSD
Batch ID: P15VW038 TestNo: EPA 8260B Analysis Date: 3/10/2015
Prep Date:
Analyte Result SPK value SPK Ref Val %REC RPD Ref Val %RPDLowLimit HighLimit RPDLimit Qual
Units: µg/L
PQL
Client ID: ZZZZZZ
RunNo: 99373
SeqNo: 1949748
MSDSampType: TestCode: 8260WATERP
1,2-Dibromo-3-chloropropane 20.00 104 66 126 201.0 0 21.64 3.5720.8801,2-Dibromoethane 20.00 107 80 126 200.50 0 20.96 2.4021.4701,2-Dichlorobenzene 20.00 95.8 80 120 200.50 0 19.58 2.2219.1501,2-Dichloroethane 20.00 99.2 80 121 200.50 0 20.14 1.4519.8501,2-Dichloropropane 20.00 93.2 79 120 200.50 0 19.12 2.6018.6301,3,5-Trimethylbenzene 20.00 99.3 69 128 200.50 0 19.81 0.25219.8601,3-Dichlorobenzene 20.00 98.6 80 120 200.50 0 19.73 0.050719.7201,3-Dichloropropane 20.00 101 80 120 200.50 0 19.67 2.3620.1401,4-Dichlorobenzene 20.00 96.7 80 120 200.50 0 19.34 0.051719.3302,2-Dichloropropane 20.00 97.5 56 144 200.50 0 19.86 1.8819.4902-Butanone 200.0 87.5 4 163 205.0 0 172.4 1.43174.9202-Chlorotoluene 20.00 96.0 79 120 200.50 0 18.80 2.1119.2004-Chlorotoluene 20.00 95.1 79 120 200.50 0 19.04 0.10519.0204-Isopropyltoluene 20.00 101 70 128 200.50 0 19.95 1.4920.250Benzene 20.00 97.0 80 120 200.50 0 19.77 1.9419.390Bromobenzene 20.00 101 80 120 200.50 0 20.17 0.24820.220Bromodichloromethane 20.00 102 80 124 200.50 0 20.62 1.4220.330Bromoform 20.00 109 66 139 200.50 0 21.43 1.4421.740Bromomethane 20.00 23.0 18 174 201.0 0 4.290 6.974.600Carbon tetrachloride 20.00 118 59 144 200.50 0 23.56 023.560Chlorobenzene 20.00 98.0 80 120 200.50 0 19.44 0.82019.600Chloroethane 20.00 141 62 145 20 R1.0 0 21.03 28.928.120Chloroform 20.00 95.4 74 120 200.50 0 18.53 2.9219.080Chloromethane 20.00 56.7 37 157 200.50 0 11.23 0.97511.340cis-1,2-Dichloroethene 20.00 96.0 73 125 200.50 0 19.00 1.1019.210cis-1,3-Dichloropropene 20.00 100 80 123 200.50 0 20.07 0.15020.040Dibromochloromethane 20.00 114 77 130 200.50 0 22.21 3.0622.900Dibromomethane 20.00 100 70 132 200.50 0 20.35 1.6820.010Dichlorodifluoromethane 20.00 114 47 159 200.50 0 22.51 1.7222.900Ethylbenzene 20.00 97.2 79 120 200.50 0 19.33 0.56719.440
Qualifiers:
B Analyte detected in the associated Method Blank E Value above quantitation range H Holding times for preparation or analysis exceeded
ND Not Detected at the Reporting Limit R RPD outside accepted recovery limits S Spike/Surrogate outside of limits due to matrix interference
DO Surrogate Diluted Out Calculations are based on raw values
09 of 20

NEVADA 3151 W. Post Rd., Las Vegas, NV 89118
P: 702.307.2659 F: 702.307.2691
“Serving Clients with Passion and Professionalism”
CALIFORNIA 11060 Artesia Blvd., Ste C, Cerritos, CA 90703
P: 562.219.7435 F: 562.219.7436
Project: Maryland Square, Z085000030
CLIENT: Cardno ATC
Work Order: N014893ANALYTICAL QC SUMMARY REPORT
TestCode: 8260WATERP
Sample ID: N014893-002AMSD
Batch ID: P15VW038 TestNo: EPA 8260B Analysis Date: 3/10/2015
Prep Date:
Analyte Result SPK value SPK Ref Val %REC RPD Ref Val %RPDLowLimit HighLimit RPDLimit Qual
Units: µg/L
PQL
Client ID: ZZZZZZ
RunNo: 99373
SeqNo: 1949748
MSDSampType: TestCode: 8260WATERP
Hexachlorobutadiene 20.00 104 66 128 200.50 0 21.34 2.2320.870Isopropylbenzene 20.00 98.2 78 120 200.50 0 19.65 019.650m,p-Xylene 40.00 103 80 120 201.0 0 39.91 2.7441.020Methylene chloride 20.00 82.0 65 122 202.0 0 16.15 1.4816.390MTBE 20.00 96.5 71 125 200.50 0 19.02 1.4619.300n-Butylbenzene 20.00 95.1 65 134 200.50 0 18.97 0.26319.020n-Propylbenzene 20.00 95.1 78 121 200.50 0 19.09 0.42019.010Naphthalene 20.00 92.5 52 137 200.50 0 18.21 1.5318.490o-Xylene 20.00 104 80 120 200.50 0 20.37 2.4220.870sec-Butylbenzene 20.00 96.0 76 122 200.50 0 19.16 0.15619.190Styrene 20.00 104 43 145 200.50 0 20.15 2.6920.700tert-Butylbenzene 20.00 100 78 120 200.50 0 20.16 0.34820.090Tetrachloroethene 20.00 108 71 123 200.50 0 20.98 2.8221.580Toluene 20.00 97.6 80 120 200.50 0 19.79 1.3719.520trans-1,2-Dichloroethene 20.00 94.2 64 132 200.50 0 19.09 1.3218.840Trichloroethene 20.00 104 79 121 200.50 0 20.98 0.81420.810Trichlorofluoromethane 20.00 108 65 144 200.50 0 21.42 0.46621.520Vinyl chloride 20.00 89.5 64 134 200.50 0 17.76 0.78517.900Xylenes, Total 60.00 103 70 130 201.5 0 60.28 2.6461.890 Surr: 1,2-Dichloroethane-d4 25.00 94.6 78 125 023.650 Surr: 4-Bromofluorobenzene 25.00 104 80 120 026.070 Surr: Dibromofluoromethane 25.00 98.9 80 122 024.730 Surr: Toluene-d8 25.00 99.6 80 120 024.900
Sample ID: P150310MB6
Batch ID: P15VW038 TestNo: EPA 8260B Analysis Date: 3/10/2015
Prep Date:
Analyte Result SPK value SPK Ref Val %REC RPD Ref Val %RPDLowLimit HighLimit RPDLimit Qual
Units: µg/L
PQL
Client ID: PBW
RunNo: 99373
SeqNo: 1949749
MBLKSampType: TestCode: 8260WATERP
1,1,1,2-Tetrachloroethane 0.50ND1,1,1-Trichloroethane 0.50ND
Qualifiers:
B Analyte detected in the associated Method Blank E Value above quantitation range H Holding times for preparation or analysis exceeded
ND Not Detected at the Reporting Limit R RPD outside accepted recovery limits S Spike/Surrogate outside of limits due to matrix interference
DO Surrogate Diluted Out Calculations are based on raw values
10 of 20

NEVADA 3151 W. Post Rd., Las Vegas, NV 89118
P: 702.307.2659 F: 702.307.2691
“Serving Clients with Passion and Professionalism”
CALIFORNIA 11060 Artesia Blvd., Ste C, Cerritos, CA 90703
P: 562.219.7435 F: 562.219.7436
Project: Maryland Square, Z085000030
CLIENT: Cardno ATC
Work Order: N014893ANALYTICAL QC SUMMARY REPORT
TestCode: 8260WATERP
Sample ID: P150310MB6
Batch ID: P15VW038 TestNo: EPA 8260B Analysis Date: 3/10/2015
Prep Date:
Analyte Result SPK value SPK Ref Val %REC RPD Ref Val %RPDLowLimit HighLimit RPDLimit Qual
Units: µg/L
PQL
Client ID: PBW
RunNo: 99373
SeqNo: 1949749
MBLKSampType: TestCode: 8260WATERP
1,1,2,2-Tetrachloroethane 0.50ND1,1,2-Trichloroethane 0.50ND1,1-Dichloroethane 0.50ND1,1-Dichloroethene 0.50ND1,1-Dichloropropene 0.50ND1,2,3-Trichlorobenzene 0.50ND1,2,3-Trichloropropane 0.50ND1,2,4-Trichlorobenzene 0.50ND1,2,4-Trimethylbenzene 0.50ND1,2-Dibromo-3-chloropropane 1.0ND1,2-Dibromoethane 0.50ND1,2-Dichlorobenzene 0.50ND1,2-Dichloroethane 0.50ND1,2-Dichloropropane 0.50ND1,3,5-Trimethylbenzene 0.50ND1,3-Dichlorobenzene 0.50ND1,3-Dichloropropane 0.50ND1,4-Dichlorobenzene 0.50ND2,2-Dichloropropane 0.50ND2-Butanone 5.0ND2-Chlorotoluene 0.50ND4-Chlorotoluene 0.50ND4-Isopropyltoluene 0.50NDBenzene 0.50NDBromobenzene 0.50NDBromodichloromethane 0.50NDBromoform 0.50NDBromomethane 1.0NDCarbon tetrachloride 0.50NDChlorobenzene 0.50ND
Qualifiers:
B Analyte detected in the associated Method Blank E Value above quantitation range H Holding times for preparation or analysis exceeded
ND Not Detected at the Reporting Limit R RPD outside accepted recovery limits S Spike/Surrogate outside of limits due to matrix interference
DO Surrogate Diluted Out Calculations are based on raw values
11 of 20

NEVADA 3151 W. Post Rd., Las Vegas, NV 89118
P: 702.307.2659 F: 702.307.2691
“Serving Clients with Passion and Professionalism”
CALIFORNIA 11060 Artesia Blvd., Ste C, Cerritos, CA 90703
P: 562.219.7435 F: 562.219.7436
Project: Maryland Square, Z085000030
CLIENT: Cardno ATC
Work Order: N014893ANALYTICAL QC SUMMARY REPORT
TestCode: 8260WATERP
Sample ID: P150310MB6
Batch ID: P15VW038 TestNo: EPA 8260B Analysis Date: 3/10/2015
Prep Date:
Analyte Result SPK value SPK Ref Val %REC RPD Ref Val %RPDLowLimit HighLimit RPDLimit Qual
Units: µg/L
PQL
Client ID: PBW
RunNo: 99373
SeqNo: 1949749
MBLKSampType: TestCode: 8260WATERP
Chloroethane 1.0NDChloroform 0.50NDChloromethane 0.50NDcis-1,2-Dichloroethene 0.50NDcis-1,3-Dichloropropene 0.50NDDibromochloromethane 0.50NDDibromomethane 0.50NDDichlorodifluoromethane 0.50NDEthylbenzene 0.50NDHexachlorobutadiene 0.50NDIsopropylbenzene 0.50NDm,p-Xylene 1.0NDMethylene chloride 2.00.490MTBE 0.50NDn-Butylbenzene 0.50NDn-Propylbenzene 0.50NDNaphthalene 0.50NDo-Xylene 0.50NDsec-Butylbenzene 0.50NDStyrene 0.50NDtert-Butylbenzene 0.50NDTetrachloroethene 0.50NDToluene 0.50NDtrans-1,2-Dichloroethene 0.50NDTrichloroethene 0.50NDTrichlorofluoromethane 0.50NDVinyl chloride 0.50NDXylenes, Total 1.5ND Surr: 1,2-Dichloroethane-d4 25.00 97.8 78 12524.460 Surr: 4-Bromofluorobenzene 25.00 97.4 80 12024.360
Qualifiers:
B Analyte detected in the associated Method Blank E Value above quantitation range H Holding times for preparation or analysis exceeded
ND Not Detected at the Reporting Limit R RPD outside accepted recovery limits S Spike/Surrogate outside of limits due to matrix interference
DO Surrogate Diluted Out Calculations are based on raw values
12 of 20

NEVADA 3151 W. Post Rd., Las Vegas, NV 89118
P: 702.307.2659 F: 702.307.2691
“Serving Clients with Passion and Professionalism”
CALIFORNIA 11060 Artesia Blvd., Ste C, Cerritos, CA 90703
P: 562.219.7435 F: 562.219.7436
Project: Maryland Square, Z085000030
CLIENT: Cardno ATC
Work Order: N014893ANALYTICAL QC SUMMARY REPORT
TestCode: 8260WATERP
Sample ID: P150310MB6
Batch ID: P15VW038 TestNo: EPA 8260B Analysis Date: 3/10/2015
Prep Date:
Analyte Result SPK value SPK Ref Val %REC RPD Ref Val %RPDLowLimit HighLimit RPDLimit Qual
Units: µg/L
PQL
Client ID: PBW
RunNo: 99373
SeqNo: 1949749
MBLKSampType: TestCode: 8260WATERP
Surr: Dibromofluoromethane 25.00 101 80 12225.240 Surr: Toluene-d8 25.00 99.8 80 12024.960
Qualifiers:
B Analyte detected in the associated Method Blank E Value above quantitation range H Holding times for preparation or analysis exceeded
ND Not Detected at the Reporting Limit R RPD outside accepted recovery limits S Spike/Surrogate outside of limits due to matrix interference
DO Surrogate Diluted Out Calculations are based on raw values
13 of 20

NEVADA 3151 W. Post Rd., Las Vegas, NV 89118
P: 702.307.2659 F: 702.307.2691
“Serving Clients with Passion and Professionalism”
CALIFORNIA 11060 Artesia Blvd., Ste C, Cerritos, CA 90703
P: 562.219.7435 F: 562.219.7436
Project: Maryland Square, Z085000030
CLIENT: Cardno ATC
Work Order: N014893ANALYTICAL QC SUMMARY REPORT
TestCode: 8260WATERP
Sample ID: P150311LCS2
Batch ID: P15VW040 TestNo: EPA 8260B Analysis Date: 3/11/2015
Prep Date:
Analyte Result SPK value SPK Ref Val %REC RPD Ref Val %RPDLowLimit HighLimit RPDLimit Qual
Units: µg/L
PQL
Client ID: LCSW
RunNo: 99397
SeqNo: 1950651
LCSSampType: TestCode: 8260WATERP
1,1,1,2-Tetrachloroethane 20.00 108 80 1210.50 021.6701,1,1-Trichloroethane 20.00 103 77 1220.50 020.5901,1,2,2-Tetrachloroethane 20.00 92.7 77 1230.50 018.5401,1,2-Trichloroethane 20.00 101 87 1200.50 020.1801,1-Dichloroethane 20.00 89.4 72 1270.50 017.8901,1-Dichloroethene 20.00 109 71 1270.50 021.8801,1-Dichloropropene 20.00 104 87 1200.50 020.7201,2,3-Trichlorobenzene 20.00 103 77 1240.50 020.6001,2,3-Trichloropropane 20.00 91.8 77 1200.50 018.3501,2,4-Trichlorobenzene 20.00 102 76 1220.50 020.4401,2,4-Trimethylbenzene 20.00 96.3 85 1200.50 019.2601,2-Dibromo-3-chloropropane 20.00 110 67 1251.0 021.9801,2-Dibromoethane 20.00 107 80 1200.50 021.4001,2-Dichlorobenzene 20.00 96.2 80 1200.50 019.2501,2-Dichloroethane 20.00 103 80 1200.50 020.5901,2-Dichloropropane 20.00 94.2 80 1200.50 018.8301,3,5-Trimethylbenzene 20.00 97.3 80 1200.50 019.4501,3-Dichlorobenzene 20.00 97.3 80 1200.50 019.4501,3-Dichloropropane 20.00 95.4 80 1200.50 019.0901,4-Dichlorobenzene 20.00 96.0 80 1200.50 019.2102,2-Dichloropropane 20.00 102 53 1420.50 020.4202-Butanone 200.0 93.3 23 1755.0 0186.5502-Chlorotoluene 20.00 92.4 80 1200.50 018.4704-Chlorotoluene 20.00 92.6 80 1200.50 018.5104-Isopropyltoluene 20.00 98.5 80 1200.50 019.700Benzene 20.00 97.7 80 1200.50 019.540Bromobenzene 20.00 99.0 80 1200.50 019.810Bromodichloromethane 20.00 105 80 1200.50 021.020Bromoform 20.00 113 72 1330.50 022.690Bromomethane 20.00 41.0 19 1781.0 08.190
Qualifiers:
B Analyte detected in the associated Method Blank E Value above quantitation range H Holding times for preparation or analysis exceeded
ND Not Detected at the Reporting Limit R RPD outside accepted recovery limits S Spike/Surrogate outside of limits due to matrix interference
DO Surrogate Diluted Out Calculations are based on raw values
14 of 20

NEVADA 3151 W. Post Rd., Las Vegas, NV 89118
P: 702.307.2659 F: 702.307.2691
“Serving Clients with Passion and Professionalism”
CALIFORNIA 11060 Artesia Blvd., Ste C, Cerritos, CA 90703
P: 562.219.7435 F: 562.219.7436
Project: Maryland Square, Z085000030
CLIENT: Cardno ATC
Work Order: N014893ANALYTICAL QC SUMMARY REPORT
TestCode: 8260WATERP
Sample ID: P150311LCS2
Batch ID: P15VW040 TestNo: EPA 8260B Analysis Date: 3/11/2015
Prep Date:
Analyte Result SPK value SPK Ref Val %REC RPD Ref Val %RPDLowLimit HighLimit RPDLimit Qual
Units: µg/L
PQL
Client ID: LCSW
RunNo: 99397
SeqNo: 1950651
LCSSampType: TestCode: 8260WATERP
Carbon tetrachloride 20.00 125 72 1310.50 024.960Chlorobenzene 20.00 97.2 80 1200.50 019.430Chloroethane 20.00 132 66 1401.0 026.310Chloroform 20.00 94.9 77 1200.50 018.980Chloromethane 20.00 75.6 47 1540.50 015.110cis-1,2-Dichloroethene 20.00 94.7 80 1200.50 018.940cis-1,3-Dichloropropene 20.00 99.9 80 1200.50 019.980Dibromochloromethane 20.00 115 80 1220.50 023.020Dibromomethane 20.00 105 80 1200.50 021.080Dichlorodifluoromethane 20.00 116 53 1660.50 023.300Ethylbenzene 20.00 96.7 80 1200.50 019.330Hexachlorobutadiene 20.00 108 79 1230.50 021.690Isopropylbenzene 20.00 95.3 80 1200.50 019.060m,p-Xylene 40.00 101 80 1201.0 040.450Methylene chloride 20.00 87.8 71 1242.0 017.550MTBE 20.00 93.4 77 1200.50 018.670n-Butylbenzene 20.00 93.5 80 1270.50 018.690n-Propylbenzene 20.00 92.5 80 1220.50 018.490Naphthalene 20.00 86.6 63 1310.50 017.310o-Xylene 20.00 102 80 1200.50 020.460sec-Butylbenzene 20.00 96.0 80 1200.50 019.200Styrene 20.00 103 80 1200.50 020.690tert-Butylbenzene 20.00 98.1 80 1200.50 019.620Tetrachloroethene 20.00 106 80 1200.50 021.130Toluene 20.00 98.5 80 1200.50 019.700trans-1,2-Dichloroethene 20.00 91.5 78 1260.50 018.300Trichloroethene 20.00 104 80 1200.50 020.740Trichlorofluoromethane 20.00 115 67 1490.50 023.010Vinyl chloride 20.00 94.2 70 1350.50 018.840Xylenes, Total 60.00 102 70 1301.5 060.910
Qualifiers:
B Analyte detected in the associated Method Blank E Value above quantitation range H Holding times for preparation or analysis exceeded
ND Not Detected at the Reporting Limit R RPD outside accepted recovery limits S Spike/Surrogate outside of limits due to matrix interference
DO Surrogate Diluted Out Calculations are based on raw values
15 of 20

NEVADA 3151 W. Post Rd., Las Vegas, NV 89118
P: 702.307.2659 F: 702.307.2691
“Serving Clients with Passion and Professionalism”
CALIFORNIA 11060 Artesia Blvd., Ste C, Cerritos, CA 90703
P: 562.219.7435 F: 562.219.7436
Project: Maryland Square, Z085000030
CLIENT: Cardno ATC
Work Order: N014893ANALYTICAL QC SUMMARY REPORT
TestCode: 8260WATERP
Sample ID: P150311LCS2
Batch ID: P15VW040 TestNo: EPA 8260B Analysis Date: 3/11/2015
Prep Date:
Analyte Result SPK value SPK Ref Val %REC RPD Ref Val %RPDLowLimit HighLimit RPDLimit Qual
Units: µg/L
PQL
Client ID: LCSW
RunNo: 99397
SeqNo: 1950651
LCSSampType: TestCode: 8260WATERP
Surr: 1,2-Dichloroethane-d4 25.00 96.5 78 12524.120 Surr: 4-Bromofluorobenzene 25.00 104 80 12025.970 Surr: Dibromofluoromethane 25.00 99.2 80 12224.810 Surr: Toluene-d8 25.00 101 80 12025.130
Sample ID: P150311LCSD
Batch ID: P15VW040 TestNo: EPA 8260B Analysis Date: 3/11/2015
Prep Date:
Analyte Result SPK value SPK Ref Val %REC RPD Ref Val %RPDLowLimit HighLimit RPDLimit Qual
Units: µg/L
PQL
Client ID: LCSS02
RunNo: 99397
SeqNo: 1950652
LCSDSampType: TestCode: 8260WATERP
1,1,1,2-Tetrachloroethane 20.00 107 80 121 200.50 0 21.67 1.3021.3901,1,1-Trichloroethane 20.00 105 77 122 200.50 0 20.59 1.7820.9601,1,2,2-Tetrachloroethane 20.00 95.9 77 123 200.50 0 18.54 3.3919.1801,1,2-Trichloroethane 20.00 103 87 120 200.50 0 20.18 1.6220.5101,1-Dichloroethane 20.00 90.3 72 127 200.50 0 17.89 0.94618.0601,1-Dichloroethene 20.00 108 71 127 200.50 0 21.88 0.87221.6901,1-Dichloropropene 20.00 102 87 120 200.50 0 20.72 1.3620.4401,2,3-Trichlorobenzene 20.00 106 77 124 200.50 0 20.60 2.4021.1001,2,3-Trichloropropane 20.00 92.6 77 120 200.50 0 18.35 0.92218.5201,2,4-Trichlorobenzene 20.00 103 76 122 200.50 0 20.44 0.63420.5701,2,4-Trimethylbenzene 20.00 97.3 85 120 200.50 0 19.26 1.0319.4601,2-Dibromo-3-chloropropane 20.00 111 67 125 201.0 0 21.98 1.3122.2701,2-Dibromoethane 20.00 108 80 120 200.50 0 21.40 0.51321.5101,2-Dichlorobenzene 20.00 99.2 80 120 200.50 0 19.25 3.0219.8401,2-Dichloroethane 20.00 103 80 120 200.50 0 20.59 0.097120.6101,2-Dichloropropane 20.00 92.8 80 120 200.50 0 18.83 1.3918.5701,3,5-Trimethylbenzene 20.00 97.6 80 120 200.50 0 19.45 0.35919.5201,3-Dichlorobenzene 20.00 99.4 80 120 200.50 0 19.45 2.1419.8701,3-Dichloropropane 20.00 96.4 80 120 200.50 0 19.09 0.93819.2701,4-Dichlorobenzene 20.00 98.3 80 120 200.50 0 19.21 2.3219.6602,2-Dichloropropane 20.00 98.4 53 142 200.50 0 20.42 3.7419.670
Qualifiers:
B Analyte detected in the associated Method Blank E Value above quantitation range H Holding times for preparation or analysis exceeded
ND Not Detected at the Reporting Limit R RPD outside accepted recovery limits S Spike/Surrogate outside of limits due to matrix interference
DO Surrogate Diluted Out Calculations are based on raw values
16 of 20

NEVADA 3151 W. Post Rd., Las Vegas, NV 89118
P: 702.307.2659 F: 702.307.2691
“Serving Clients with Passion and Professionalism”
CALIFORNIA 11060 Artesia Blvd., Ste C, Cerritos, CA 90703
P: 562.219.7435 F: 562.219.7436
Project: Maryland Square, Z085000030
CLIENT: Cardno ATC
Work Order: N014893ANALYTICAL QC SUMMARY REPORT
TestCode: 8260WATERP
Sample ID: P150311LCSD
Batch ID: P15VW040 TestNo: EPA 8260B Analysis Date: 3/11/2015
Prep Date:
Analyte Result SPK value SPK Ref Val %REC RPD Ref Val %RPDLowLimit HighLimit RPDLimit Qual
Units: µg/L
PQL
Client ID: LCSS02
RunNo: 99397
SeqNo: 1950652
LCSDSampType: TestCode: 8260WATERP
2-Butanone 200.0 88.3 23 175 205.0 0 186.6 5.44176.6702-Chlorotoluene 20.00 94.1 80 120 200.50 0 18.47 1.8218.8104-Chlorotoluene 20.00 93.6 80 120 200.50 0 18.51 1.1318.7204-Isopropyltoluene 20.00 98.8 80 120 200.50 0 19.70 0.25319.750Benzene 20.00 97.0 80 120 200.50 0 19.54 0.77119.390Bromobenzene 20.00 102 80 120 200.50 0 19.81 2.9320.400Bromodichloromethane 20.00 104 80 120 200.50 0 21.02 1.4420.720Bromoform 20.00 116 72 133 200.50 0 22.69 1.9623.140Bromomethane 20.00 40.7 19 178 201.0 0 8.190 0.6128.140Carbon tetrachloride 20.00 126 72 131 200.50 0 24.96 0.63925.120Chlorobenzene 20.00 97.1 80 120 200.50 0 19.43 0.051519.420Chloroethane 20.00 126 66 140 201.0 0 26.31 4.6725.110Chloroform 20.00 94.2 77 120 200.50 0 18.98 0.74018.840Chloromethane 20.00 79.0 47 154 200.50 0 15.11 4.4015.790cis-1,2-Dichloroethene 20.00 93.8 80 120 200.50 0 18.94 1.0118.750cis-1,3-Dichloropropene 20.00 100 80 120 200.50 0 19.98 0.30020.040Dibromochloromethane 20.00 114 80 122 200.50 0 23.02 1.0922.770Dibromomethane 20.00 103 80 120 200.50 0 21.08 2.5520.550Dichlorodifluoromethane 20.00 117 53 166 200.50 0 23.30 0.17223.340Ethylbenzene 20.00 95.7 80 120 200.50 0 19.33 1.0419.130Hexachlorobutadiene 20.00 108 79 123 200.50 0 21.69 0.23121.640Isopropylbenzene 20.00 97.1 80 120 200.50 0 19.06 1.8719.420m,p-Xylene 40.00 100 80 120 201.0 0 40.45 1.0740.020Methylene chloride 20.00 88.6 71 124 202.0 0 17.55 0.90817.710MTBE 20.00 93.6 77 120 200.50 0 18.67 0.32118.730n-Butylbenzene 20.00 95.9 80 127 200.50 0 18.69 2.5419.170n-Propylbenzene 20.00 94.2 80 122 200.50 0 18.49 1.8218.830Naphthalene 20.00 88.0 63 131 200.50 0 17.31 1.7217.610o-Xylene 20.00 102 80 120 200.50 0 20.46 0.68720.320sec-Butylbenzene 20.00 96.7 80 120 200.50 0 19.20 0.67519.330
Qualifiers:
B Analyte detected in the associated Method Blank E Value above quantitation range H Holding times for preparation or analysis exceeded
ND Not Detected at the Reporting Limit R RPD outside accepted recovery limits S Spike/Surrogate outside of limits due to matrix interference
DO Surrogate Diluted Out Calculations are based on raw values
17 of 20

NEVADA 3151 W. Post Rd., Las Vegas, NV 89118
P: 702.307.2659 F: 702.307.2691
“Serving Clients with Passion and Professionalism”
CALIFORNIA 11060 Artesia Blvd., Ste C, Cerritos, CA 90703
P: 562.219.7435 F: 562.219.7436
Project: Maryland Square, Z085000030
CLIENT: Cardno ATC
Work Order: N014893ANALYTICAL QC SUMMARY REPORT
TestCode: 8260WATERP
Sample ID: P150311LCSD
Batch ID: P15VW040 TestNo: EPA 8260B Analysis Date: 3/11/2015
Prep Date:
Analyte Result SPK value SPK Ref Val %REC RPD Ref Val %RPDLowLimit HighLimit RPDLimit Qual
Units: µg/L
PQL
Client ID: LCSS02
RunNo: 99397
SeqNo: 1950652
LCSDSampType: TestCode: 8260WATERP
Styrene 20.00 103 80 120 200.50 0 20.69 0.29020.630tert-Butylbenzene 20.00 99.8 80 120 200.50 0 19.62 1.7219.960Tetrachloroethene 20.00 107 80 120 200.50 0 21.13 1.6021.470Toluene 20.00 100 80 120 200.50 0 19.70 1.4619.990trans-1,2-Dichloroethene 20.00 93.2 78 126 200.50 0 18.30 1.7918.630Trichloroethene 20.00 105 80 120 200.50 0 20.74 1.4821.050Trichlorofluoromethane 20.00 115 67 149 200.50 0 23.01 0.43622.910Vinyl chloride 20.00 94.6 70 135 200.50 0 18.84 0.47718.930Xylenes, Total 60.00 101 70 130 201.5 0 60.91 0.94060.340 Surr: 1,2-Dichloroethane-d4 25.00 95.0 78 125 023.740 Surr: 4-Bromofluorobenzene 25.00 103 80 120 025.720 Surr: Dibromofluoromethane 25.00 96.8 80 122 024.210 Surr: Toluene-d8 25.00 99.9 80 120 024.970
Sample ID: P150311MB6
Batch ID: P15VW040 TestNo: EPA 8260B Analysis Date: 3/12/2015
Prep Date:
Analyte Result SPK value SPK Ref Val %REC RPD Ref Val %RPDLowLimit HighLimit RPDLimit Qual
Units: µg/L
PQL
Client ID: PBW
RunNo: 99397
SeqNo: 1950653
MBLKSampType: TestCode: 8260WATERP
1,1,1,2-Tetrachloroethane 0.50ND1,1,1-Trichloroethane 0.50ND1,1,2,2-Tetrachloroethane 0.50ND1,1,2-Trichloroethane 0.50ND1,1-Dichloroethane 0.50ND1,1-Dichloroethene 0.50ND1,1-Dichloropropene 0.50ND1,2,3-Trichlorobenzene 0.50ND1,2,3-Trichloropropane 0.50ND1,2,4-Trichlorobenzene 0.50ND1,2,4-Trimethylbenzene 0.50ND1,2-Dibromo-3-chloropropane 1.0ND
Qualifiers:
B Analyte detected in the associated Method Blank E Value above quantitation range H Holding times for preparation or analysis exceeded
ND Not Detected at the Reporting Limit R RPD outside accepted recovery limits S Spike/Surrogate outside of limits due to matrix interference
DO Surrogate Diluted Out Calculations are based on raw values
18 of 20

NEVADA 3151 W. Post Rd., Las Vegas, NV 89118
P: 702.307.2659 F: 702.307.2691
“Serving Clients with Passion and Professionalism”
CALIFORNIA 11060 Artesia Blvd., Ste C, Cerritos, CA 90703
P: 562.219.7435 F: 562.219.7436
Project: Maryland Square, Z085000030
CLIENT: Cardno ATC
Work Order: N014893ANALYTICAL QC SUMMARY REPORT
TestCode: 8260WATERP
Sample ID: P150311MB6
Batch ID: P15VW040 TestNo: EPA 8260B Analysis Date: 3/12/2015
Prep Date:
Analyte Result SPK value SPK Ref Val %REC RPD Ref Val %RPDLowLimit HighLimit RPDLimit Qual
Units: µg/L
PQL
Client ID: PBW
RunNo: 99397
SeqNo: 1950653
MBLKSampType: TestCode: 8260WATERP
1,2-Dibromoethane 0.50ND1,2-Dichlorobenzene 0.50ND1,2-Dichloroethane 0.50ND1,2-Dichloropropane 0.50ND1,3,5-Trimethylbenzene 0.50ND1,3-Dichlorobenzene 0.50ND1,3-Dichloropropane 0.50ND1,4-Dichlorobenzene 0.50ND2,2-Dichloropropane 0.50ND2-Butanone 5.0ND2-Chlorotoluene 0.50ND4-Chlorotoluene 0.50ND4-Isopropyltoluene 0.50NDBenzene 0.50NDBromobenzene 0.50NDBromodichloromethane 0.50NDBromoform 0.50NDBromomethane 1.0NDCarbon tetrachloride 0.50NDChlorobenzene 0.50NDChloroethane 1.0NDChloroform 0.50NDChloromethane 0.500.350cis-1,2-Dichloroethene 0.50NDcis-1,3-Dichloropropene 0.50NDDibromochloromethane 0.50NDDibromomethane 0.50NDDichlorodifluoromethane 0.50NDEthylbenzene 0.50NDHexachlorobutadiene 0.50ND
Qualifiers:
B Analyte detected in the associated Method Blank E Value above quantitation range H Holding times for preparation or analysis exceeded
ND Not Detected at the Reporting Limit R RPD outside accepted recovery limits S Spike/Surrogate outside of limits due to matrix interference
DO Surrogate Diluted Out Calculations are based on raw values
19 of 20

NEVADA 3151 W. Post Rd., Las Vegas, NV 89118
P: 702.307.2659 F: 702.307.2691
“Serving Clients with Passion and Professionalism”
CALIFORNIA 11060 Artesia Blvd., Ste C, Cerritos, CA 90703
P: 562.219.7435 F: 562.219.7436
Project: Maryland Square, Z085000030
CLIENT: Cardno ATC
Work Order: N014893ANALYTICAL QC SUMMARY REPORT
TestCode: 8260WATERP
Sample ID: P150311MB6
Batch ID: P15VW040 TestNo: EPA 8260B Analysis Date: 3/12/2015
Prep Date:
Analyte Result SPK value SPK Ref Val %REC RPD Ref Val %RPDLowLimit HighLimit RPDLimit Qual
Units: µg/L
PQL
Client ID: PBW
RunNo: 99397
SeqNo: 1950653
MBLKSampType: TestCode: 8260WATERP
Isopropylbenzene 0.50NDm,p-Xylene 1.0NDMethylene chloride 2.0NDMTBE 0.50NDn-Butylbenzene 0.50NDn-Propylbenzene 0.50NDNaphthalene 0.50NDo-Xylene 0.50NDsec-Butylbenzene 0.50NDStyrene 0.50NDtert-Butylbenzene 0.50NDTetrachloroethene 0.50NDToluene 0.50NDtrans-1,2-Dichloroethene 0.50NDTrichloroethene 0.50NDTrichlorofluoromethane 0.50NDVinyl chloride 0.50NDXylenes, Total 1.5ND Surr: 1,2-Dichloroethane-d4 25.00 101 78 12525.340 Surr: 4-Bromofluorobenzene 25.00 99.4 80 12024.850 Surr: Dibromofluoromethane 25.00 103 80 12225.670 Surr: Toluene-d8 25.00 101 80 12025.360
Qualifiers:
B Analyte detected in the associated Method Blank E Value above quantitation range H Holding times for preparation or analysis exceeded
ND Not Detected at the Reporting Limit R RPD outside accepted recovery limits S Spike/Surrogate outside of limits due to matrix interference
DO Surrogate Diluted Out Calculations are based on raw values
20 of 20

NEVADA 3151 W. Post Rd., Las Vegas, NV 89118
P: 702.307.2659 F: 702.307.2691
“Serving Clients with Passion and Professionalism”
CALIFORNIA 11060 Artesia Blvd., Ste C, Cerritos, CA 90703
P: 562.219.7435 F: 562.219.7436
March 25, 2015
Cardno ATC
Andrew Stuart
Attention: Andrew Stuart
RE: Maryland Square, Z085000030
Workorder No.: N014984FAX:
TEL: (702) 990-9300
7115 Amigo Street Suite 100
Las Vegas, NV 89119
CA-ELAP No.: 2676
NV Cert. No.: NV-00922
I hereby certify that all laboratory analysis requested were performed by Nevada Division of Environmental Protection-certified laboratory for the parameters and matrices reported herein.
Thank you for the opportunity to service the needs of your company.Please feel free to call me at (702) 307-2659 if I can be of further assistance to your company.
Sincerely,
Glen Gesmundo
QA Manager
Enclosed are the results for sample(s) received on March 13, 2015 by ASSET Laboratories . The sample(s) are tested for the parameters as indicated in the enclosed chain of custody in accordance with the applicable laboratory certifications.
The cover letter and the case narrative are an integral part of this analytical report and cannot be reproduced in part or in its entirety without written permission from the client and Advanced Technology Laboratories - Las Vegas.
01 of 45

NEVADA 3151 W. Post Rd., Las Vegas, NV 89118
P: 702.307.2659 F: 702.307.2691
“Serving Clients with Passion and Professionalism”
CALIFORNIA 11060 Artesia Blvd., Ste C, Cerritos, CA 90703
P: 562.219.7435 F: 562.219.7436
25-Mar-15Date:ASSET Laboratories
Project: Maryland Square, Z085000030
CLIENT: Cardno ATC
Lab Order: N014984CASE NARRATIVE
SAMPLE RECEIVING/GENERAL COMMENTS:
Samples were received intact with proper chain of custody documentation.
Cooler temperature and sample preservation were verified upon receipt of samples if applicable.
Information on sample receipt conditions including discrepancies can be found in attached Sample Receipt Checklist Form.
Samples were analyzed within method holding time.
Analytical Comments for EPA 8260B:
Dilution was necessary on samples N014984-005 and N014984-016 due to high concentration of Tetrachloroethene.
Analytical Comments for EPA 6020:
Matrix Spike (MS) and Matrix Spike Duplicate (MSD) are outside recovery for Arsenic and Chromium on QC samples N014985-001B-MS and N014985-001B-MSD criteria possibly due to matrix interference. The associated Laboratory Control Sample (LCS) recovery was acceptable.
Hexavalent Chromium was repoted at 1.5 ug/L while Chromium was ND on sample N014984-023. Chromium was detected at concentration of 0.5 ug/L (J-flag value) which is less than the PQL of 1 ug/L.
Page 1 of 1
02 of 45

NEVADA 3151 W. Post Rd., Las Vegas, NV 89118
P: 702.307.2659 F: 702.307.2691
“Serving Clients with Passion and Professionalism”
CALIFORNIA 11060 Artesia Blvd., Ste C, Cerritos, CA 90703
P: 562.219.7435 F: 562.219.7436
25-Mar-15Date:ASSET Laboratories
Project: Maryland Square, Z085000030
CLIENT: Cardno ATC
Lab Order: N014984Work Order Sample Summary
Lab Sample ID Client Sample ID Collection DateMatrix Date Received
Contract No:
Date Reported
N014984-001A MW-1 3/13/2015 12:46:00 PM 3/13/2015 3/25/2015Groundwater
N014984-002A MW-2 3/11/2015 1:05:00 PM 3/13/2015 3/25/2015Groundwater
N014984-003A MW-3 3/11/2015 11:25:00 AM 3/13/2015 3/25/2015Groundwater
N014984-004A MW-5 3/11/2015 2:05:00 PM 3/13/2015 3/25/2015Groundwater
N014984-005A MW-6 3/12/2015 2:32:00 PM 3/13/2015 3/25/2015Groundwater
N014984-006A MW-6D1 3/12/2015 1:05:00 PM 3/13/2015 3/25/2015Groundwater
N014984-007A MW-6D2 3/12/2015 11:00:00 AM 3/13/2015 3/25/2015Groundwater
N014984-008A MW-6D3 3/12/2015 11:55:00 AM 3/13/2015 3/25/2015Groundwater
N014984-009A MW-7 3/9/2015 2:00:00 PM 3/13/2015 3/25/2015Groundwater
N014984-010A MW-8 3/9/2015 12:37:00 PM 3/13/2015 3/25/2015Groundwater
N014984-011A MW-9 3/13/2015 11:26:00 AM 3/13/2015 3/25/2015Groundwater
N014984-012A MW-10 3/12/2015 9:00:00 AM 3/13/2015 3/25/2015Groundwater
N014984-013A MW-12 3/9/2015 11:43:00 AM 3/13/2015 3/25/2015Groundwater
N014984-014A MW-13 3/11/2015 12:05:00 PM 3/13/2015 3/25/2015Groundwater
N014984-015A MW-14 3/12/2015 1:50:00 PM 3/13/2015 3/25/2015Groundwater
N014984-016A MW-14I 3/12/2015 3:18:00 PM 3/13/2015 3/25/2015Groundwater
N014984-017A MW-15 3/12/2015 10:00:00 AM 3/13/2015 3/25/2015Groundwater
N014984-018A MW-17 3/13/2015 12:08:00 PM 3/13/2015 3/25/2015Groundwater
N014984-019A MW-18 3/11/2015 10:25:00 AM 3/13/2015 3/25/2015Groundwater
N014984-020A MW-19D1 3/10/2015 2:55:00 PM 3/13/2015 3/25/2015Groundwater
N014984-021A MW-19D2 3/10/2015 12:55:00 PM 3/13/2015 3/25/2015Groundwater
N014984-022A MW-19D3 3/10/2015 1:55:00 PM 3/13/2015 3/25/2015Groundwater
N014984-023A MW-20 3/11/2015 9:20:00 AM 3/13/2015 3/25/2015Groundwater
N014984-023B MW-20 3/11/2015 9:20:00 AM 3/13/2015 3/25/2015Groundwater
N014984-023C MW-20 3/11/2015 9:20:00 AM 3/13/2015 3/25/2015Groundwater
N014984-024A MW-20D1 3/10/2015 11:05:00 AM 3/13/2015 3/25/2015Groundwater
N014984-025A MW-20D2 3/10/2015 12:00:00 PM 3/13/2015 3/25/2015Groundwater
N014984-026A MW-20D3 3/10/2015 10:10:00 AM 3/13/2015 3/25/2015Groundwater
N014984-027A MW-34 3/13/2015 2:16:00 PM 3/13/2015 3/25/2015Groundwater
Page 1 of 2
03 of 45

NEVADA 3151 W. Post Rd., Las Vegas, NV 89118
P: 702.307.2659 F: 702.307.2691
“Serving Clients with Passion and Professionalism”
CALIFORNIA 11060 Artesia Blvd., Ste C, Cerritos, CA 90703
P: 562.219.7435 F: 562.219.7436
Project: Maryland Square, Z085000030
CLIENT: Cardno ATC
Lab Order: N014984Work Order Sample Summary
Lab Sample ID Client Sample ID Collection DateMatrix Date Received
Contract No:
Date Reported
N014984-028A MW-35 3/13/2015 1:29:00 PM 3/13/2015 3/25/2015Groundwater
N014984-029A MW-1DUP 3/13/2015 12:40:00 PM 3/13/2015 3/25/2015Groundwater
N014984-030A TRIP BLANK 03/13/15 3/13/2015 10:00:00 AM 3/13/2015 3/25/2015Groundwater
N014984-031A FIELD BLANK 03/13/15 3/13/2015 12:25:00 PM 3/13/2015 3/25/2015Groundwater
N014984-032A EQUIPMENT RINSE 03/13/15
3/13/2015 1:35:00 PM 3/13/2015 3/25/2015Groundwater
Page 2 of 2
04 of 45
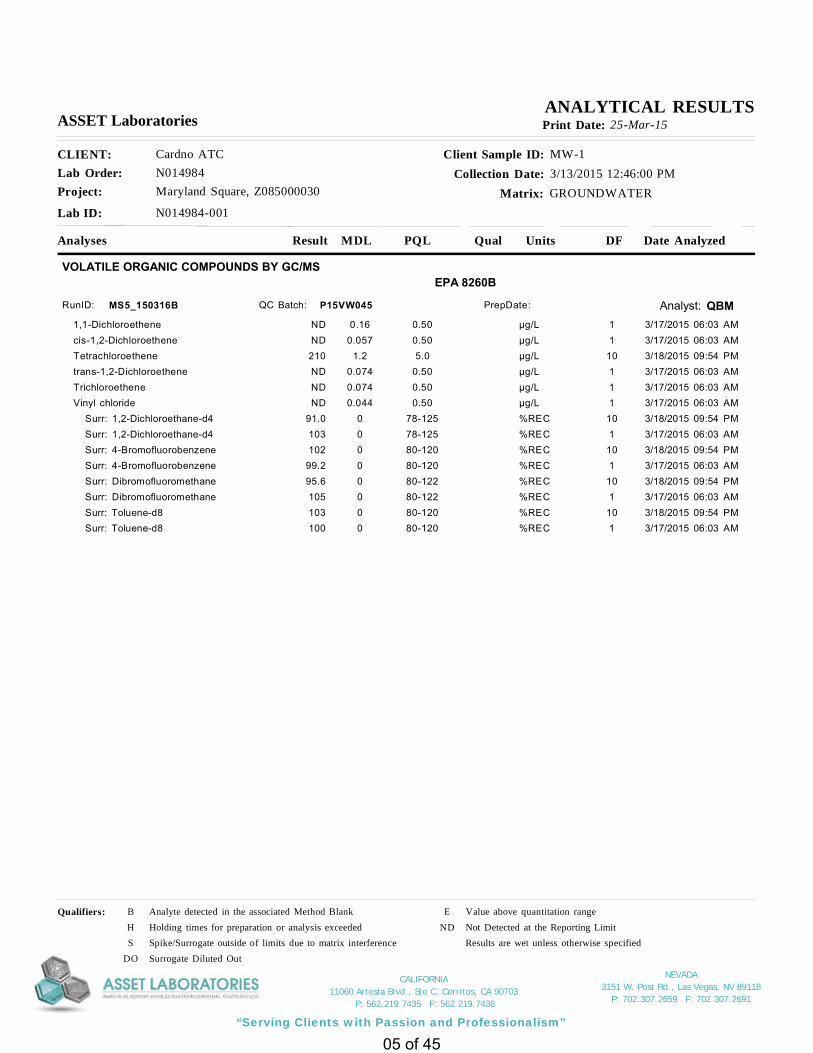
NEVADA 3151 W. Post Rd., Las Vegas, NV 89118
P: 702.307.2659 F: 702.307.2691
“Serving Clients with Passion and Professionalism”
CALIFORNIA 11060 Artesia Blvd., Ste C, Cerritos, CA 90703
P: 562.219.7435 F: 562.219.7436
Project: Maryland Square, Z085000030
Client Sample ID: MW-1
Collection Date: 3/13/2015 12:46:00 PM
Matrix: GROUNDWATER
CLIENT: Cardno ATC
Lab Order: N014984
Lab ID: N014984-001
ASSET Laboratories Print Date: 25-Mar-15
Analyses Result Qual Units Date AnalyzedDFPQLMDL
ANALYTICAL RESULTS
VOLATILE ORGANIC COMPOUNDS BY GC/MSEPA 8260B
Analyst: QBMRunID: MS5_150316B P15VW045QC Batch: PrepDate:
1,1-Dichloroethene 0.50 µg/L 1ND 0.16 3/17/2015 06:03 AMcis-1,2-Dichloroethene 0.50 µg/L 1ND 0.057 3/17/2015 06:03 AMTetrachloroethene 5.0 µg/L 10210 1.2 3/18/2015 09:54 PMtrans-1,2-Dichloroethene 0.50 µg/L 1ND 0.074 3/17/2015 06:03 AMTrichloroethene 0.50 µg/L 1ND 0.074 3/17/2015 06:03 AMVinyl chloride 0.50 µg/L 1ND 0.044 3/17/2015 06:03 AM Surr: 1,2-Dichloroethane-d4 78-125 %REC 1091.0 0 3/18/2015 09:54 PM Surr: 1,2-Dichloroethane-d4 78-125 %REC 1103 0 3/17/2015 06:03 AM Surr: 4-Bromofluorobenzene 80-120 %REC 10102 0 3/18/2015 09:54 PM Surr: 4-Bromofluorobenzene 80-120 %REC 199.2 0 3/17/2015 06:03 AM Surr: Dibromofluoromethane 80-122 %REC 1095.6 0 3/18/2015 09:54 PM Surr: Dibromofluoromethane 80-122 %REC 1105 0 3/17/2015 06:03 AM Surr: Toluene-d8 80-120 %REC 10103 0 3/18/2015 09:54 PM Surr: Toluene-d8 80-120 %REC 1100 0 3/17/2015 06:03 AM
Qualifiers: B Analyte detected in the associated Method Blank E Value above quantitation range
H Holding times for preparation or analysis exceeded ND Not Detected at the Reporting Limit
S Spike/Surrogate outside of limits due to matrix interference Results are wet unless otherwise specified
DO Surrogate Diluted Out
05 of 45
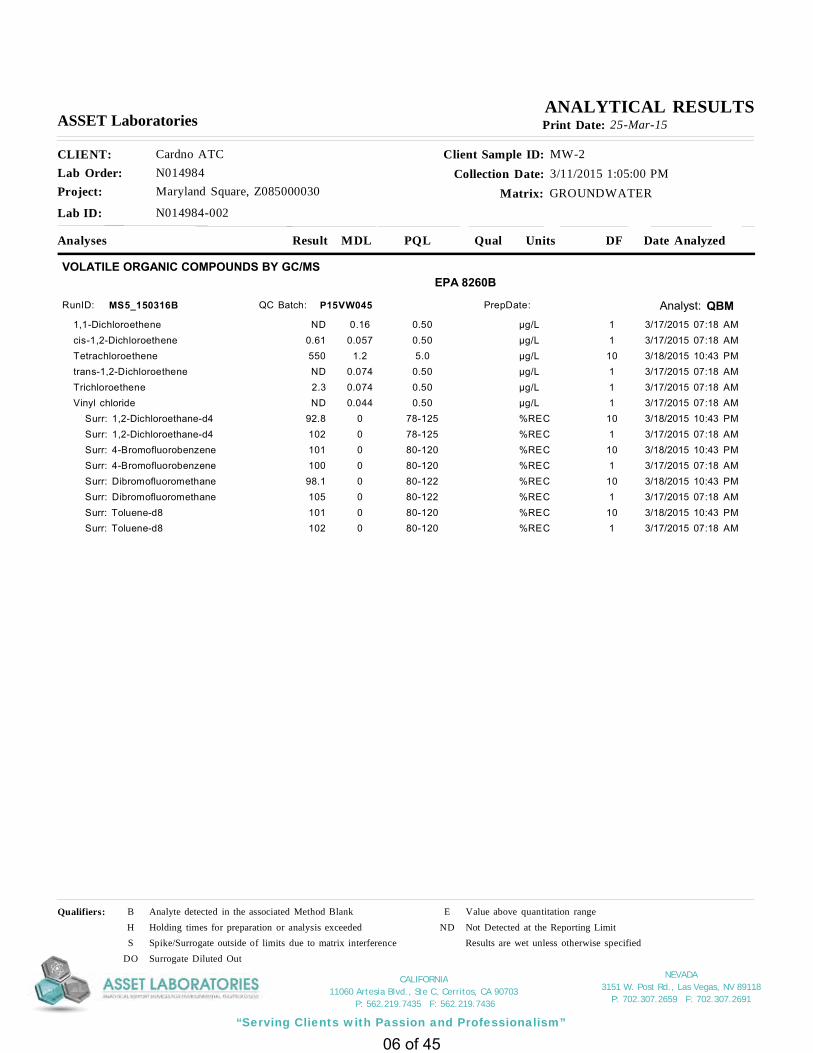
NEVADA 3151 W. Post Rd., Las Vegas, NV 89118
P: 702.307.2659 F: 702.307.2691
“Serving Clients with Passion and Professionalism”
CALIFORNIA 11060 Artesia Blvd., Ste C, Cerritos, CA 90703
P: 562.219.7435 F: 562.219.7436
Project: Maryland Square, Z085000030
Client Sample ID: MW-2
Collection Date: 3/11/2015 1:05:00 PM
Matrix: GROUNDWATER
CLIENT: Cardno ATC
Lab Order: N014984
Lab ID: N014984-002
ASSET Laboratories Print Date: 25-Mar-15
Analyses Result Qual Units Date AnalyzedDFPQLMDL
ANALYTICAL RESULTS
VOLATILE ORGANIC COMPOUNDS BY GC/MSEPA 8260B
Analyst: QBMRunID: MS5_150316B P15VW045QC Batch: PrepDate:
1,1-Dichloroethene 0.50 µg/L 1ND 0.16 3/17/2015 07:18 AMcis-1,2-Dichloroethene 0.50 µg/L 10.61 0.057 3/17/2015 07:18 AMTetrachloroethene 5.0 µg/L 10550 1.2 3/18/2015 10:43 PMtrans-1,2-Dichloroethene 0.50 µg/L 1ND 0.074 3/17/2015 07:18 AMTrichloroethene 0.50 µg/L 12.3 0.074 3/17/2015 07:18 AMVinyl chloride 0.50 µg/L 1ND 0.044 3/17/2015 07:18 AM Surr: 1,2-Dichloroethane-d4 78-125 %REC 1092.8 0 3/18/2015 10:43 PM Surr: 1,2-Dichloroethane-d4 78-125 %REC 1102 0 3/17/2015 07:18 AM Surr: 4-Bromofluorobenzene 80-120 %REC 10101 0 3/18/2015 10:43 PM Surr: 4-Bromofluorobenzene 80-120 %REC 1100 0 3/17/2015 07:18 AM Surr: Dibromofluoromethane 80-122 %REC 1098.1 0 3/18/2015 10:43 PM Surr: Dibromofluoromethane 80-122 %REC 1105 0 3/17/2015 07:18 AM Surr: Toluene-d8 80-120 %REC 10101 0 3/18/2015 10:43 PM Surr: Toluene-d8 80-120 %REC 1102 0 3/17/2015 07:18 AM
Qualifiers: B Analyte detected in the associated Method Blank E Value above quantitation range
H Holding times for preparation or analysis exceeded ND Not Detected at the Reporting Limit
S Spike/Surrogate outside of limits due to matrix interference Results are wet unless otherwise specified
DO Surrogate Diluted Out
06 of 45

NEVADA 3151 W. Post Rd., Las Vegas, NV 89118
P: 702.307.2659 F: 702.307.2691
“Serving Clients with Passion and Professionalism”
CALIFORNIA 11060 Artesia Blvd., Ste C, Cerritos, CA 90703
P: 562.219.7435 F: 562.219.7436
Project: Maryland Square, Z085000030
Client Sample ID: MW-3
Collection Date: 3/11/2015 11:25:00 AM
Matrix: GROUNDWATER
CLIENT: Cardno ATC
Lab Order: N014984
Lab ID: N014984-003
ASSET Laboratories Print Date: 25-Mar-15
Analyses Result Qual Units Date AnalyzedDFPQLMDL
ANALYTICAL RESULTS
VOLATILE ORGANIC COMPOUNDS BY GC/MSEPA 8260B
Analyst: QBMRunID: MS5_150316B P15VW045QC Batch: PrepDate:
1,1-Dichloroethene 0.50 µg/L 1ND 0.16 3/17/2015 03:55 AMcis-1,2-Dichloroethene 0.50 µg/L 1ND 0.057 3/17/2015 03:55 AMTetrachloroethene 0.50 µg/L 113 0.12 3/17/2015 03:55 AMtrans-1,2-Dichloroethene 0.50 µg/L 1ND 0.074 3/17/2015 03:55 AMTrichloroethene 0.50 µg/L 1ND 0.074 3/17/2015 03:55 AMVinyl chloride 0.50 µg/L 1ND 0.044 3/17/2015 03:55 AM Surr: 1,2-Dichloroethane-d4 78-125 %REC 1102 0 3/17/2015 03:55 AM Surr: 4-Bromofluorobenzene 80-120 %REC 199.0 0 3/17/2015 03:55 AM Surr: Dibromofluoromethane 80-122 %REC 1103 0 3/17/2015 03:55 AM Surr: Toluene-d8 80-120 %REC 1101 0 3/17/2015 03:55 AM
Qualifiers: B Analyte detected in the associated Method Blank E Value above quantitation range
H Holding times for preparation or analysis exceeded ND Not Detected at the Reporting Limit
S Spike/Surrogate outside of limits due to matrix interference Results are wet unless otherwise specified
DO Surrogate Diluted Out
07 of 45

NEVADA 3151 W. Post Rd., Las Vegas, NV 89118
P: 702.307.2659 F: 702.307.2691
“Serving Clients with Passion and Professionalism”
CALIFORNIA 11060 Artesia Blvd., Ste C, Cerritos, CA 90703
P: 562.219.7435 F: 562.219.7436
Project: Maryland Square, Z085000030
Client Sample ID: MW-5
Collection Date: 3/11/2015 2:05:00 PM
Matrix: GROUNDWATER
CLIENT: Cardno ATC
Lab Order: N014984
Lab ID: N014984-004
ASSET Laboratories Print Date: 25-Mar-15
Analyses Result Qual Units Date AnalyzedDFPQLMDL
ANALYTICAL RESULTS
VOLATILE ORGANIC COMPOUNDS BY GC/MSEPA 8260B
Analyst: QBMRunID: MS5_150316B P15VW045QC Batch: PrepDate:
1,1-Dichloroethene 0.50 µg/L 1ND 0.16 3/17/2015 07:43 AMcis-1,2-Dichloroethene 0.50 µg/L 11.2 0.057 3/17/2015 07:43 AMTetrachloroethene 10 µg/L 20790 2.3 3/18/2015 11:08 PMtrans-1,2-Dichloroethene 0.50 µg/L 1ND 0.074 3/17/2015 07:43 AMTrichloroethene 0.50 µg/L 13.7 0.074 3/17/2015 07:43 AMVinyl chloride 0.50 µg/L 1ND 0.044 3/17/2015 07:43 AM Surr: 1,2-Dichloroethane-d4 78-125 %REC 2092.6 0 3/18/2015 11:08 PM Surr: 1,2-Dichloroethane-d4 78-125 %REC 1102 0 3/17/2015 07:43 AM Surr: 4-Bromofluorobenzene 80-120 %REC 2098.9 0 3/18/2015 11:08 PM Surr: 4-Bromofluorobenzene 80-120 %REC 199.0 0 3/17/2015 07:43 AM Surr: Dibromofluoromethane 80-122 %REC 2098.5 0 3/18/2015 11:08 PM Surr: Dibromofluoromethane 80-122 %REC 1105 0 3/17/2015 07:43 AM Surr: Toluene-d8 80-120 %REC 2099.9 0 3/18/2015 11:08 PM Surr: Toluene-d8 80-120 %REC 1100 0 3/17/2015 07:43 AM
Qualifiers: B Analyte detected in the associated Method Blank E Value above quantitation range
H Holding times for preparation or analysis exceeded ND Not Detected at the Reporting Limit
S Spike/Surrogate outside of limits due to matrix interference Results are wet unless otherwise specified
DO Surrogate Diluted Out
08 of 45

NEVADA 3151 W. Post Rd., Las Vegas, NV 89118
P: 702.307.2659 F: 702.307.2691
“Serving Clients with Passion and Professionalism”
CALIFORNIA 11060 Artesia Blvd., Ste C, Cerritos, CA 90703
P: 562.219.7435 F: 562.219.7436
Project: Maryland Square, Z085000030
Client Sample ID: MW-6
Collection Date: 3/12/2015 2:32:00 PM
Matrix: GROUNDWATER
CLIENT: Cardno ATC
Lab Order: N014984
Lab ID: N014984-005
ASSET Laboratories Print Date: 25-Mar-15
Analyses Result Qual Units Date AnalyzedDFPQLMDL
ANALYTICAL RESULTS
VOLATILE ORGANIC COMPOUNDS BY GC/MSEPA 8260B
Analyst: QBMRunID: MS5_150319A P15VW047QC Batch: PrepDate:
1,1-Dichloroethene 1.0 µg/L 2ND 0.33 3/19/2015 09:20 PMcis-1,2-Dichloroethene 1.0 µg/L 22.3 0.11 3/19/2015 09:20 PMTetrachloroethene 50 µg/L 1003300 12 3/18/2015 11:33 PMtrans-1,2-Dichloroethene 1.0 µg/L 2ND 0.15 3/19/2015 09:20 PMTrichloroethene 1.0 µg/L 29.3 0.15 3/19/2015 09:20 PMVinyl chloride 1.0 µg/L 2ND 0.088 3/19/2015 09:20 PM Surr: 1,2-Dichloroethane-d4 78-125 %REC 299.9 0 3/19/2015 09:20 PM Surr: 1,2-Dichloroethane-d4 78-125 %REC 10094.2 0 3/18/2015 11:33 PM Surr: 4-Bromofluorobenzene 80-120 %REC 2100 0 3/19/2015 09:20 PM Surr: 4-Bromofluorobenzene 80-120 %REC 100101 0 3/18/2015 11:33 PM Surr: Dibromofluoromethane 80-122 %REC 2103 0 3/19/2015 09:20 PM Surr: Dibromofluoromethane 80-122 %REC 10097.8 0 3/18/2015 11:33 PM Surr: Toluene-d8 80-120 %REC 2101 0 3/19/2015 09:20 PM Surr: Toluene-d8 80-120 %REC 10099.8 0 3/18/2015 11:33 PM
Qualifiers: B Analyte detected in the associated Method Blank E Value above quantitation range
H Holding times for preparation or analysis exceeded ND Not Detected at the Reporting Limit
S Spike/Surrogate outside of limits due to matrix interference Results are wet unless otherwise specified
DO Surrogate Diluted Out
09 of 45

NEVADA 3151 W. Post Rd., Las Vegas, NV 89118
P: 702.307.2659 F: 702.307.2691
“Serving Clients with Passion and Professionalism”
CALIFORNIA 11060 Artesia Blvd., Ste C, Cerritos, CA 90703
P: 562.219.7435 F: 562.219.7436
Project: Maryland Square, Z085000030
Client Sample ID: MW-6D1
Collection Date: 3/12/2015 1:05:00 PM
Matrix: GROUNDWATER
CLIENT: Cardno ATC
Lab Order: N014984
Lab ID: N014984-006
ASSET Laboratories Print Date: 25-Mar-15
Analyses Result Qual Units Date AnalyzedDFPQLMDL
ANALYTICAL RESULTS
VOLATILE ORGANIC COMPOUNDS BY GC/MSEPA 8260B
Analyst: QBMRunID: MS5_150316B P15VW045QC Batch: PrepDate:
1,1-Dichloroethene 0.50 µg/L 1ND 0.16 3/17/2015 03:30 AMcis-1,2-Dichloroethene 0.50 µg/L 1ND 0.057 3/17/2015 03:30 AMTetrachloroethene 0.50 µg/L 13.0 0.12 3/17/2015 03:30 AMtrans-1,2-Dichloroethene 0.50 µg/L 1ND 0.074 3/17/2015 03:30 AMTrichloroethene 0.50 µg/L 1ND 0.074 3/17/2015 03:30 AMVinyl chloride 0.50 µg/L 1ND 0.044 3/17/2015 03:30 AM Surr: 1,2-Dichloroethane-d4 78-125 %REC 199.4 0 3/17/2015 03:30 AM Surr: 4-Bromofluorobenzene 80-120 %REC 1101 0 3/17/2015 03:30 AM Surr: Dibromofluoromethane 80-122 %REC 1102 0 3/17/2015 03:30 AM Surr: Toluene-d8 80-120 %REC 199.6 0 3/17/2015 03:30 AM
Qualifiers: B Analyte detected in the associated Method Blank E Value above quantitation range
H Holding times for preparation or analysis exceeded ND Not Detected at the Reporting Limit
S Spike/Surrogate outside of limits due to matrix interference Results are wet unless otherwise specified
DO Surrogate Diluted Out
10 of 45

NEVADA 3151 W. Post Rd., Las Vegas, NV 89118
P: 702.307.2659 F: 702.307.2691
“Serving Clients with Passion and Professionalism”
CALIFORNIA 11060 Artesia Blvd., Ste C, Cerritos, CA 90703
P: 562.219.7435 F: 562.219.7436
Project: Maryland Square, Z085000030
Client Sample ID: MW-6D2
Collection Date: 3/12/2015 11:00:00 AM
Matrix: GROUNDWATER
CLIENT: Cardno ATC
Lab Order: N014984
Lab ID: N014984-007
ASSET Laboratories Print Date: 25-Mar-15
Analyses Result Qual Units Date AnalyzedDFPQLMDL
ANALYTICAL RESULTS
VOLATILE ORGANIC COMPOUNDS BY GC/MSEPA 8260B
Analyst: QBMRunID: MS5_150316B P15VW045QC Batch: PrepDate:
1,1-Dichloroethene 0.50 µg/L 1ND 0.16 3/17/2015 01:00 AMcis-1,2-Dichloroethene 0.50 µg/L 1ND 0.057 3/17/2015 01:00 AMTetrachloroethene 0.50 µg/L 13.2 0.12 3/17/2015 01:00 AMtrans-1,2-Dichloroethene 0.50 µg/L 1ND 0.074 3/17/2015 01:00 AMTrichloroethene 0.50 µg/L 1ND 0.074 3/17/2015 01:00 AMVinyl chloride 0.50 µg/L 1ND 0.044 3/17/2015 01:00 AM Surr: 1,2-Dichloroethane-d4 78-125 %REC 1102 0 3/17/2015 01:00 AM Surr: 4-Bromofluorobenzene 80-120 %REC 198.4 0 3/17/2015 01:00 AM Surr: Dibromofluoromethane 80-122 %REC 1102 0 3/17/2015 01:00 AM Surr: Toluene-d8 80-120 %REC 1100 0 3/17/2015 01:00 AM
Qualifiers: B Analyte detected in the associated Method Blank E Value above quantitation range
H Holding times for preparation or analysis exceeded ND Not Detected at the Reporting Limit
S Spike/Surrogate outside of limits due to matrix interference Results are wet unless otherwise specified
DO Surrogate Diluted Out
11 of 45

NEVADA 3151 W. Post Rd., Las Vegas, NV 89118
P: 702.307.2659 F: 702.307.2691
“Serving Clients with Passion and Professionalism”
CALIFORNIA 11060 Artesia Blvd., Ste C, Cerritos, CA 90703
P: 562.219.7435 F: 562.219.7436
Project: Maryland Square, Z085000030
Client Sample ID: MW-6D3
Collection Date: 3/12/2015 11:55:00 AM
Matrix: GROUNDWATER
CLIENT: Cardno ATC
Lab Order: N014984
Lab ID: N014984-008
ASSET Laboratories Print Date: 25-Mar-15
Analyses Result Qual Units Date AnalyzedDFPQLMDL
ANALYTICAL RESULTS
VOLATILE ORGANIC COMPOUNDS BY GC/MSEPA 8260B
Analyst: QBMRunID: MS5_150316B P15VW045QC Batch: PrepDate:
1,1-Dichloroethene 0.50 µg/L 1ND 0.16 3/17/2015 01:25 AMcis-1,2-Dichloroethene 0.50 µg/L 1ND 0.057 3/17/2015 01:25 AMTetrachloroethene 0.50 µg/L 132 0.12 3/17/2015 01:25 AMtrans-1,2-Dichloroethene 0.50 µg/L 1ND 0.074 3/17/2015 01:25 AMTrichloroethene 0.50 µg/L 10.50 0.074 3/17/2015 01:25 AMVinyl chloride 0.50 µg/L 1ND 0.044 3/17/2015 01:25 AM Surr: 1,2-Dichloroethane-d4 78-125 %REC 1101 0 3/17/2015 01:25 AM Surr: 4-Bromofluorobenzene 80-120 %REC 1101 0 3/17/2015 01:25 AM Surr: Dibromofluoromethane 80-122 %REC 1102 0 3/17/2015 01:25 AM Surr: Toluene-d8 80-120 %REC 1101 0 3/17/2015 01:25 AM
Qualifiers: B Analyte detected in the associated Method Blank E Value above quantitation range
H Holding times for preparation or analysis exceeded ND Not Detected at the Reporting Limit
S Spike/Surrogate outside of limits due to matrix interference Results are wet unless otherwise specified
DO Surrogate Diluted Out
12 of 45

NEVADA 3151 W. Post Rd., Las Vegas, NV 89118
P: 702.307.2659 F: 702.307.2691
“Serving Clients with Passion and Professionalism”
CALIFORNIA 11060 Artesia Blvd., Ste C, Cerritos, CA 90703
P: 562.219.7435 F: 562.219.7436
Project: Maryland Square, Z085000030
Client Sample ID: MW-7
Collection Date: 3/9/2015 2:00:00 PM
Matrix: GROUNDWATER
CLIENT: Cardno ATC
Lab Order: N014984
Lab ID: N014984-009
ASSET Laboratories Print Date: 25-Mar-15
Analyses Result Qual Units Date AnalyzedDFPQLMDL
ANALYTICAL RESULTS
VOLATILE ORGANIC COMPOUNDS BY GC/MSEPA 8260B
Analyst: QBMRunID: MS5_150316B P15VW045QC Batch: PrepDate:
1,1-Dichloroethene 0.50 µg/L 1ND 0.16 3/17/2015 01:50 AMcis-1,2-Dichloroethene 0.50 µg/L 1ND 0.057 3/17/2015 01:50 AMTetrachloroethene 0.50 µg/L 117 0.12 3/17/2015 01:50 AMtrans-1,2-Dichloroethene 0.50 µg/L 1ND 0.074 3/17/2015 01:50 AMTrichloroethene 0.50 µg/L 1ND 0.074 3/17/2015 01:50 AMVinyl chloride 0.50 µg/L 1ND 0.044 3/17/2015 01:50 AM Surr: 1,2-Dichloroethane-d4 78-125 %REC 199.0 0 3/17/2015 01:50 AM Surr: 4-Bromofluorobenzene 80-120 %REC 198.1 0 3/17/2015 01:50 AM Surr: Dibromofluoromethane 80-122 %REC 1102 0 3/17/2015 01:50 AM Surr: Toluene-d8 80-120 %REC 1101 0 3/17/2015 01:50 AM
Qualifiers: B Analyte detected in the associated Method Blank E Value above quantitation range
H Holding times for preparation or analysis exceeded ND Not Detected at the Reporting Limit
S Spike/Surrogate outside of limits due to matrix interference Results are wet unless otherwise specified
DO Surrogate Diluted Out
13 of 45

NEVADA 3151 W. Post Rd., Las Vegas, NV 89118
P: 702.307.2659 F: 702.307.2691
“Serving Clients with Passion and Professionalism”
CALIFORNIA 11060 Artesia Blvd., Ste C, Cerritos, CA 90703
P: 562.219.7435 F: 562.219.7436
Project: Maryland Square, Z085000030
Client Sample ID: MW-8
Collection Date: 3/9/2015 12:37:00 PM
Matrix: GROUNDWATER
CLIENT: Cardno ATC
Lab Order: N014984
Lab ID: N014984-010
ASSET Laboratories Print Date: 25-Mar-15
Analyses Result Qual Units Date AnalyzedDFPQLMDL
ANALYTICAL RESULTS
VOLATILE ORGANIC COMPOUNDS BY GC/MSEPA 8260B
Analyst: QBMRunID: MS5_150316B P15VW045QC Batch: PrepDate:
1,1-Dichloroethene 0.50 µg/L 1ND 0.16 3/17/2015 02:15 AMcis-1,2-Dichloroethene 0.50 µg/L 1ND 0.057 3/17/2015 02:15 AMTetrachloroethene 0.50 µg/L 12.4 0.12 3/17/2015 02:15 AMtrans-1,2-Dichloroethene 0.50 µg/L 1ND 0.074 3/17/2015 02:15 AMTrichloroethene 0.50 µg/L 1ND 0.074 3/17/2015 02:15 AMVinyl chloride 0.50 µg/L 1ND 0.044 3/17/2015 02:15 AM Surr: 1,2-Dichloroethane-d4 78-125 %REC 1101 0 3/17/2015 02:15 AM Surr: 4-Bromofluorobenzene 80-120 %REC 198.3 0 3/17/2015 02:15 AM Surr: Dibromofluoromethane 80-122 %REC 1104 0 3/17/2015 02:15 AM Surr: Toluene-d8 80-120 %REC 198.9 0 3/17/2015 02:15 AM
Qualifiers: B Analyte detected in the associated Method Blank E Value above quantitation range
H Holding times for preparation or analysis exceeded ND Not Detected at the Reporting Limit
S Spike/Surrogate outside of limits due to matrix interference Results are wet unless otherwise specified
DO Surrogate Diluted Out
14 of 45

NEVADA 3151 W. Post Rd., Las Vegas, NV 89118
P: 702.307.2659 F: 702.307.2691
“Serving Clients with Passion and Professionalism”
CALIFORNIA 11060 Artesia Blvd., Ste C, Cerritos, CA 90703
P: 562.219.7435 F: 562.219.7436
Project: Maryland Square, Z085000030
Client Sample ID: MW-9
Collection Date: 3/13/2015 11:26:00 AM
Matrix: GROUNDWATER
CLIENT: Cardno ATC
Lab Order: N014984
Lab ID: N014984-011
ASSET Laboratories Print Date: 25-Mar-15
Analyses Result Qual Units Date AnalyzedDFPQLMDL
ANALYTICAL RESULTS
VOLATILE ORGANIC COMPOUNDS BY GC/MSEPA 8260B
Analyst: QBMRunID: MS5_150316B P15VW045QC Batch: PrepDate:
1,1-Dichloroethene 0.50 µg/L 1ND 0.16 3/17/2015 03:05 AMcis-1,2-Dichloroethene 0.50 µg/L 1ND 0.057 3/17/2015 03:05 AMTetrachloroethene 0.50 µg/L 19.7 0.12 3/17/2015 03:05 AMtrans-1,2-Dichloroethene 0.50 µg/L 1ND 0.074 3/17/2015 03:05 AMTrichloroethene 0.50 µg/L 1ND 0.074 3/17/2015 03:05 AMVinyl chloride 0.50 µg/L 1ND 0.044 3/17/2015 03:05 AM Surr: 1,2-Dichloroethane-d4 78-125 %REC 1101 0 3/17/2015 03:05 AM Surr: 4-Bromofluorobenzene 80-120 %REC 199.4 0 3/17/2015 03:05 AM Surr: Dibromofluoromethane 80-122 %REC 1106 0 3/17/2015 03:05 AM Surr: Toluene-d8 80-120 %REC 1101 0 3/17/2015 03:05 AM
Qualifiers: B Analyte detected in the associated Method Blank E Value above quantitation range
H Holding times for preparation or analysis exceeded ND Not Detected at the Reporting Limit
S Spike/Surrogate outside of limits due to matrix interference Results are wet unless otherwise specified
DO Surrogate Diluted Out
15 of 45

NEVADA 3151 W. Post Rd., Las Vegas, NV 89118
P: 702.307.2659 F: 702.307.2691
“Serving Clients with Passion and Professionalism”
CALIFORNIA 11060 Artesia Blvd., Ste C, Cerritos, CA 90703
P: 562.219.7435 F: 562.219.7436
Project: Maryland Square, Z085000030
Client Sample ID: MW-10
Collection Date: 3/12/2015 9:00:00 AM
Matrix: GROUNDWATER
CLIENT: Cardno ATC
Lab Order: N014984
Lab ID: N014984-012
ASSET Laboratories Print Date: 25-Mar-15
Analyses Result Qual Units Date AnalyzedDFPQLMDL
ANALYTICAL RESULTS
VOLATILE ORGANIC COMPOUNDS BY GC/MSEPA 8260B
Analyst: QBMRunID: MS5_150316B P15VW045QC Batch: PrepDate:
1,1-Dichloroethene 0.50 µg/L 1ND 0.16 3/17/2015 12:10 AMcis-1,2-Dichloroethene 0.50 µg/L 1ND 0.057 3/17/2015 12:10 AMTetrachloroethene 0.50 µg/L 1ND 0.12 3/17/2015 12:10 AMtrans-1,2-Dichloroethene 0.50 µg/L 1ND 0.074 3/17/2015 12:10 AMTrichloroethene 0.50 µg/L 1ND 0.074 3/17/2015 12:10 AMVinyl chloride 0.50 µg/L 1ND 0.044 3/17/2015 12:10 AM Surr: 1,2-Dichloroethane-d4 78-125 %REC 198.7 0 3/17/2015 12:10 AM Surr: 4-Bromofluorobenzene 80-120 %REC 199.0 0 3/17/2015 12:10 AM Surr: Dibromofluoromethane 80-122 %REC 1104 0 3/17/2015 12:10 AM Surr: Toluene-d8 80-120 %REC 1101 0 3/17/2015 12:10 AM
Qualifiers: B Analyte detected in the associated Method Blank E Value above quantitation range
H Holding times for preparation or analysis exceeded ND Not Detected at the Reporting Limit
S Spike/Surrogate outside of limits due to matrix interference Results are wet unless otherwise specified
DO Surrogate Diluted Out
16 of 45

NEVADA 3151 W. Post Rd., Las Vegas, NV 89118
P: 702.307.2659 F: 702.307.2691
“Serving Clients with Passion and Professionalism”
CALIFORNIA 11060 Artesia Blvd., Ste C, Cerritos, CA 90703
P: 562.219.7435 F: 562.219.7436
Project: Maryland Square, Z085000030
Client Sample ID: MW-12
Collection Date: 3/9/2015 11:43:00 AM
Matrix: GROUNDWATER
CLIENT: Cardno ATC
Lab Order: N014984
Lab ID: N014984-013
ASSET Laboratories Print Date: 25-Mar-15
Analyses Result Qual Units Date AnalyzedDFPQLMDL
ANALYTICAL RESULTS
VOLATILE ORGANIC COMPOUNDS BY GC/MSEPA 8260B
Analyst: QBMRunID: MS5_150316B P15VW045QC Batch: PrepDate:
1,1-Dichloroethene 0.50 µg/L 1ND 0.16 3/17/2015 12:35 AMcis-1,2-Dichloroethene 0.50 µg/L 1ND 0.057 3/17/2015 12:35 AMTetrachloroethene 0.50 µg/L 10.77 0.12 3/17/2015 12:35 AMtrans-1,2-Dichloroethene 0.50 µg/L 1ND 0.074 3/17/2015 12:35 AMTrichloroethene 0.50 µg/L 1ND 0.074 3/17/2015 12:35 AMVinyl chloride 0.50 µg/L 1ND 0.044 3/17/2015 12:35 AM Surr: 1,2-Dichloroethane-d4 78-125 %REC 1102 0 3/17/2015 12:35 AM Surr: 4-Bromofluorobenzene 80-120 %REC 199.6 0 3/17/2015 12:35 AM Surr: Dibromofluoromethane 80-122 %REC 1104 0 3/17/2015 12:35 AM Surr: Toluene-d8 80-120 %REC 1102 0 3/17/2015 12:35 AM
Qualifiers: B Analyte detected in the associated Method Blank E Value above quantitation range
H Holding times for preparation or analysis exceeded ND Not Detected at the Reporting Limit
S Spike/Surrogate outside of limits due to matrix interference Results are wet unless otherwise specified
DO Surrogate Diluted Out
17 of 45

NEVADA 3151 W. Post Rd., Las Vegas, NV 89118
P: 702.307.2659 F: 702.307.2691
“Serving Clients with Passion and Professionalism”
CALIFORNIA 11060 Artesia Blvd., Ste C, Cerritos, CA 90703
P: 562.219.7435 F: 562.219.7436
Project: Maryland Square, Z085000030
Client Sample ID: MW-13
Collection Date: 3/11/2015 12:05:00 PM
Matrix: GROUNDWATER
CLIENT: Cardno ATC
Lab Order: N014984
Lab ID: N014984-014
ASSET Laboratories Print Date: 25-Mar-15
Analyses Result Qual Units Date AnalyzedDFPQLMDL
ANALYTICAL RESULTS
VOLATILE ORGANIC COMPOUNDS BY GC/MSEPA 8260B
Analyst: QBMRunID: MS5_150319A P15VW047QC Batch: PrepDate:
1,1-Dichloroethene 0.50 µg/L 1ND 0.16 3/19/2015 09:45 PMcis-1,2-Dichloroethene 0.50 µg/L 1ND 0.057 3/19/2015 09:45 PMTetrachloroethene 25 µg/L 501700 5.9 3/18/2015 11:58 PMtrans-1,2-Dichloroethene 0.50 µg/L 1ND 0.074 3/19/2015 09:45 PMTrichloroethene 0.50 µg/L 14.6 0.074 3/19/2015 09:45 PMVinyl chloride 0.50 µg/L 1ND 0.044 3/19/2015 09:45 PM Surr: 1,2-Dichloroethane-d4 78-125 %REC 199.9 0 3/19/2015 09:45 PM Surr: 1,2-Dichloroethane-d4 78-125 %REC 5092.2 0 3/18/2015 11:58 PM Surr: 4-Bromofluorobenzene 80-120 %REC 1101 0 3/19/2015 09:45 PM Surr: 4-Bromofluorobenzene 80-120 %REC 50101 0 3/18/2015 11:58 PM Surr: Dibromofluoromethane 80-122 %REC 1104 0 3/19/2015 09:45 PM Surr: Dibromofluoromethane 80-122 %REC 5098.1 0 3/18/2015 11:58 PM Surr: Toluene-d8 80-120 %REC 1103 0 3/19/2015 09:45 PM Surr: Toluene-d8 80-120 %REC 5098.5 0 3/18/2015 11:58 PM
Qualifiers: B Analyte detected in the associated Method Blank E Value above quantitation range
H Holding times for preparation or analysis exceeded ND Not Detected at the Reporting Limit
S Spike/Surrogate outside of limits due to matrix interference Results are wet unless otherwise specified
DO Surrogate Diluted Out
18 of 45

NEVADA 3151 W. Post Rd., Las Vegas, NV 89118
P: 702.307.2659 F: 702.307.2691
“Serving Clients with Passion and Professionalism”
CALIFORNIA 11060 Artesia Blvd., Ste C, Cerritos, CA 90703
P: 562.219.7435 F: 562.219.7436
Project: Maryland Square, Z085000030
Client Sample ID: MW-14
Collection Date: 3/12/2015 1:50:00 PM
Matrix: GROUNDWATER
CLIENT: Cardno ATC
Lab Order: N014984
Lab ID: N014984-015
ASSET Laboratories Print Date: 25-Mar-15
Analyses Result Qual Units Date AnalyzedDFPQLMDL
ANALYTICAL RESULTS
VOLATILE ORGANIC COMPOUNDS BY GC/MSEPA 8260B
Analyst: QBMRunID: MS5_150316B P15VW045QC Batch: PrepDate:
1,1-Dichloroethene 0.50 µg/L 1ND 0.16 3/17/2015 08:08 AMcis-1,2-Dichloroethene 0.50 µg/L 1ND 0.057 3/17/2015 08:08 AMTetrachloroethene 25 µg/L 501900 5.9 3/19/2015 12:48 AMtrans-1,2-Dichloroethene 0.50 µg/L 1ND 0.074 3/17/2015 08:08 AMTrichloroethene 0.50 µg/L 13.6 0.074 3/17/2015 08:08 AMVinyl chloride 0.50 µg/L 1ND 0.044 3/17/2015 08:08 AM Surr: 1,2-Dichloroethane-d4 78-125 %REC 5097.4 0 3/19/2015 12:48 AM Surr: 1,2-Dichloroethane-d4 78-125 %REC 1105 0 3/17/2015 08:08 AM Surr: 4-Bromofluorobenzene 80-120 %REC 50101 0 3/19/2015 12:48 AM Surr: 4-Bromofluorobenzene 80-120 %REC 1101 0 3/17/2015 08:08 AM Surr: Dibromofluoromethane 80-122 %REC 5098.8 0 3/19/2015 12:48 AM Surr: Dibromofluoromethane 80-122 %REC 1106 0 3/17/2015 08:08 AM Surr: Toluene-d8 80-120 %REC 50101 0 3/19/2015 12:48 AM Surr: Toluene-d8 80-120 %REC 1101 0 3/17/2015 08:08 AM
Qualifiers: B Analyte detected in the associated Method Blank E Value above quantitation range
H Holding times for preparation or analysis exceeded ND Not Detected at the Reporting Limit
S Spike/Surrogate outside of limits due to matrix interference Results are wet unless otherwise specified
DO Surrogate Diluted Out
19 of 45

NEVADA 3151 W. Post Rd., Las Vegas, NV 89118
P: 702.307.2659 F: 702.307.2691
“Serving Clients with Passion and Professionalism”
CALIFORNIA 11060 Artesia Blvd., Ste C, Cerritos, CA 90703
P: 562.219.7435 F: 562.219.7436
Project: Maryland Square, Z085000030
Client Sample ID: MW-14I
Collection Date: 3/12/2015 3:18:00 PM
Matrix: GROUNDWATER
CLIENT: Cardno ATC
Lab Order: N014984
Lab ID: N014984-016
ASSET Laboratories Print Date: 25-Mar-15
Analyses Result Qual Units Date AnalyzedDFPQLMDL
ANALYTICAL RESULTS
VOLATILE ORGANIC COMPOUNDS BY GC/MSEPA 8260B
Analyst: QBMRunID: MS5_150319A P15VW047QC Batch: PrepDate:
1,1-Dichloroethene 2.5 µg/L 5ND 0.82 3/19/2015 10:10 PMcis-1,2-Dichloroethene 2.5 µg/L 520 0.29 3/19/2015 10:10 PMTetrachloroethene 100 µg/L 20011000 23 3/19/2015 07:17 PMtrans-1,2-Dichloroethene 2.5 µg/L 5ND 0.37 3/19/2015 10:10 PMTrichloroethene 2.5 µg/L 532 0.37 3/19/2015 10:10 PMVinyl chloride 2.5 µg/L 5ND 0.22 3/19/2015 10:10 PM Surr: 1,2-Dichloroethane-d4 78-125 %REC 5101 0 3/19/2015 10:10 PM Surr: 1,2-Dichloroethane-d4 78-125 %REC 200101 0 3/19/2015 07:17 PM Surr: 4-Bromofluorobenzene 80-120 %REC 598.4 0 3/19/2015 10:10 PM Surr: 4-Bromofluorobenzene 80-120 %REC 200101 0 3/19/2015 07:17 PM Surr: Dibromofluoromethane 80-122 %REC 5107 0 3/19/2015 10:10 PM Surr: Dibromofluoromethane 80-122 %REC 200103 0 3/19/2015 07:17 PM Surr: Toluene-d8 80-120 %REC 5101 0 3/19/2015 10:10 PM Surr: Toluene-d8 80-120 %REC 200100 0 3/19/2015 07:17 PM
Qualifiers: B Analyte detected in the associated Method Blank E Value above quantitation range
H Holding times for preparation or analysis exceeded ND Not Detected at the Reporting Limit
S Spike/Surrogate outside of limits due to matrix interference Results are wet unless otherwise specified
DO Surrogate Diluted Out
20 of 45

NEVADA 3151 W. Post Rd., Las Vegas, NV 89118
P: 702.307.2659 F: 702.307.2691
“Serving Clients with Passion and Professionalism”
CALIFORNIA 11060 Artesia Blvd., Ste C, Cerritos, CA 90703
P: 562.219.7435 F: 562.219.7436
Project: Maryland Square, Z085000030
Client Sample ID: MW-15
Collection Date: 3/12/2015 10:00:00 AM
Matrix: GROUNDWATER
CLIENT: Cardno ATC
Lab Order: N014984
Lab ID: N014984-017
ASSET Laboratories Print Date: 25-Mar-15
Analyses Result Qual Units Date AnalyzedDFPQLMDL
ANALYTICAL RESULTS
VOLATILE ORGANIC COMPOUNDS BY GC/MSEPA 8260B
Analyst: QBMRunID: MS5_150316B P15VW045QC Batch: PrepDate:
1,1-Dichloroethene 0.50 µg/L 1ND 0.16 3/17/2015 02:40 AMcis-1,2-Dichloroethene 0.50 µg/L 1ND 0.057 3/17/2015 02:40 AMTetrachloroethene 0.50 µg/L 13.6 0.12 3/17/2015 02:40 AMtrans-1,2-Dichloroethene 0.50 µg/L 1ND 0.074 3/17/2015 02:40 AMTrichloroethene 0.50 µg/L 1ND 0.074 3/17/2015 02:40 AMVinyl chloride 0.50 µg/L 1ND 0.044 3/17/2015 02:40 AM Surr: 1,2-Dichloroethane-d4 78-125 %REC 1104 0 3/17/2015 02:40 AM Surr: 4-Bromofluorobenzene 80-120 %REC 1101 0 3/17/2015 02:40 AM Surr: Dibromofluoromethane 80-122 %REC 1105 0 3/17/2015 02:40 AM Surr: Toluene-d8 80-120 %REC 1102 0 3/17/2015 02:40 AM
Qualifiers: B Analyte detected in the associated Method Blank E Value above quantitation range
H Holding times for preparation or analysis exceeded ND Not Detected at the Reporting Limit
S Spike/Surrogate outside of limits due to matrix interference Results are wet unless otherwise specified
DO Surrogate Diluted Out
21 of 45

NEVADA 3151 W. Post Rd., Las Vegas, NV 89118
P: 702.307.2659 F: 702.307.2691
“Serving Clients with Passion and Professionalism”
CALIFORNIA 11060 Artesia Blvd., Ste C, Cerritos, CA 90703
P: 562.219.7435 F: 562.219.7436
Project: Maryland Square, Z085000030
Client Sample ID: MW-17
Collection Date: 3/13/2015 12:08:00 PM
Matrix: GROUNDWATER
CLIENT: Cardno ATC
Lab Order: N014984
Lab ID: N014984-018
ASSET Laboratories Print Date: 25-Mar-15
Analyses Result Qual Units Date AnalyzedDFPQLMDL
ANALYTICAL RESULTS
VOLATILE ORGANIC COMPOUNDS BY GC/MSEPA 8260B
Analyst: QBMRunID: MS5_150316B P15VW045QC Batch: PrepDate:
1,1-Dichloroethene 0.50 µg/L 1ND 0.16 3/17/2015 05:38 AMcis-1,2-Dichloroethene 0.50 µg/L 1ND 0.057 3/17/2015 05:38 AMTetrachloroethene 0.50 µg/L 165 0.12 3/17/2015 05:38 AMtrans-1,2-Dichloroethene 0.50 µg/L 1ND 0.074 3/17/2015 05:38 AMTrichloroethene 0.50 µg/L 1ND 0.074 3/17/2015 05:38 AMVinyl chloride 0.50 µg/L 1ND 0.044 3/17/2015 05:38 AM Surr: 1,2-Dichloroethane-d4 78-125 %REC 1105 0 3/17/2015 05:38 AM Surr: 4-Bromofluorobenzene 80-120 %REC 199.8 0 3/17/2015 05:38 AM Surr: Dibromofluoromethane 80-122 %REC 1104 0 3/17/2015 05:38 AM Surr: Toluene-d8 80-120 %REC 1100 0 3/17/2015 05:38 AM
Qualifiers: B Analyte detected in the associated Method Blank E Value above quantitation range
H Holding times for preparation or analysis exceeded ND Not Detected at the Reporting Limit
S Spike/Surrogate outside of limits due to matrix interference Results are wet unless otherwise specified
DO Surrogate Diluted Out
22 of 45

NEVADA 3151 W. Post Rd., Las Vegas, NV 89118
P: 702.307.2659 F: 702.307.2691
“Serving Clients with Passion and Professionalism”
CALIFORNIA 11060 Artesia Blvd., Ste C, Cerritos, CA 90703
P: 562.219.7435 F: 562.219.7436
Project: Maryland Square, Z085000030
Client Sample ID: MW-18
Collection Date: 3/11/2015 10:25:00 AM
Matrix: GROUNDWATER
CLIENT: Cardno ATC
Lab Order: N014984
Lab ID: N014984-019
ASSET Laboratories Print Date: 25-Mar-15
Analyses Result Qual Units Date AnalyzedDFPQLMDL
ANALYTICAL RESULTS
VOLATILE ORGANIC COMPOUNDS BY GC/MSEPA 8260B
Analyst: QBMRunID: MS5_150316B P15VW045QC Batch: PrepDate:
1,1-Dichloroethene 0.50 µg/L 1ND 0.16 3/17/2015 06:53 AMcis-1,2-Dichloroethene 0.50 µg/L 1ND 0.057 3/17/2015 06:53 AMTetrachloroethene 25 µg/L 501200 5.9 3/19/2015 04:49 PMtrans-1,2-Dichloroethene 0.50 µg/L 1ND 0.074 3/17/2015 06:53 AMTrichloroethene 0.50 µg/L 12.5 0.074 3/17/2015 06:53 AMVinyl chloride 0.50 µg/L 1ND 0.044 3/17/2015 06:53 AM Surr: 1,2-Dichloroethane-d4 78-125 %REC 5097.5 0 3/19/2015 04:49 PM Surr: 1,2-Dichloroethane-d4 78-125 %REC 199.8 0 3/17/2015 06:53 AM Surr: 4-Bromofluorobenzene 80-120 %REC 50100 0 3/19/2015 04:49 PM Surr: 4-Bromofluorobenzene 80-120 %REC 197.8 0 3/17/2015 06:53 AM Surr: Dibromofluoromethane 80-122 %REC 5099.2 0 3/19/2015 04:49 PM Surr: Dibromofluoromethane 80-122 %REC 1102 0 3/17/2015 06:53 AM Surr: Toluene-d8 80-120 %REC 50101 0 3/19/2015 04:49 PM Surr: Toluene-d8 80-120 %REC 1100 0 3/17/2015 06:53 AM
Qualifiers: B Analyte detected in the associated Method Blank E Value above quantitation range
H Holding times for preparation or analysis exceeded ND Not Detected at the Reporting Limit
S Spike/Surrogate outside of limits due to matrix interference Results are wet unless otherwise specified
DO Surrogate Diluted Out
23 of 45

NEVADA 3151 W. Post Rd., Las Vegas, NV 89118
P: 702.307.2659 F: 702.307.2691
“Serving Clients with Passion and Professionalism”
CALIFORNIA 11060 Artesia Blvd., Ste C, Cerritos, CA 90703
P: 562.219.7435 F: 562.219.7436
Project: Maryland Square, Z085000030
Client Sample ID: MW-19D1
Collection Date: 3/10/2015 2:55:00 PM
Matrix: GROUNDWATER
CLIENT: Cardno ATC
Lab Order: N014984
Lab ID: N014984-020
ASSET Laboratories Print Date: 25-Mar-15
Analyses Result Qual Units Date AnalyzedDFPQLMDL
ANALYTICAL RESULTS
VOLATILE ORGANIC COMPOUNDS BY GC/MSEPA 8260B
Analyst: QBMRunID: MS5_150318B P15VW046QC Batch: PrepDate:
1,1-Dichloroethene 0.50 µg/L 1ND 0.16 3/19/2015 02:02 AMcis-1,2-Dichloroethene 0.50 µg/L 1ND 0.057 3/19/2015 02:02 AMTetrachloroethene 5.0 µg/L 10210 1.2 3/19/2015 05:14 PMtrans-1,2-Dichloroethene 0.50 µg/L 1ND 0.074 3/19/2015 02:02 AMTrichloroethene 0.50 µg/L 11.3 0.074 3/19/2015 02:02 AMVinyl chloride 0.50 µg/L 1ND 0.044 3/19/2015 02:02 AM Surr: 1,2-Dichloroethane-d4 78-125 %REC 1097.2 0 3/19/2015 05:14 PM Surr: 1,2-Dichloroethane-d4 78-125 %REC 193.0 0 3/19/2015 02:02 AM Surr: 4-Bromofluorobenzene 80-120 %REC 1098.1 0 3/19/2015 05:14 PM Surr: 4-Bromofluorobenzene 80-120 %REC 1102 0 3/19/2015 02:02 AM Surr: Dibromofluoromethane 80-122 %REC 10101 0 3/19/2015 05:14 PM Surr: Dibromofluoromethane 80-122 %REC 197.0 0 3/19/2015 02:02 AM Surr: Toluene-d8 80-120 %REC 10100 0 3/19/2015 05:14 PM Surr: Toluene-d8 80-120 %REC 199.0 0 3/19/2015 02:02 AM
Qualifiers: B Analyte detected in the associated Method Blank E Value above quantitation range
H Holding times for preparation or analysis exceeded ND Not Detected at the Reporting Limit
S Spike/Surrogate outside of limits due to matrix interference Results are wet unless otherwise specified
DO Surrogate Diluted Out
24 of 45

NEVADA 3151 W. Post Rd., Las Vegas, NV 89118
P: 702.307.2659 F: 702.307.2691
“Serving Clients with Passion and Professionalism”
CALIFORNIA 11060 Artesia Blvd., Ste C, Cerritos, CA 90703
P: 562.219.7435 F: 562.219.7436
Project: Maryland Square, Z085000030
Client Sample ID: MW-19D2
Collection Date: 3/10/2015 12:55:00 PM
Matrix: GROUNDWATER
CLIENT: Cardno ATC
Lab Order: N014984
Lab ID: N014984-021
ASSET Laboratories Print Date: 25-Mar-15
Analyses Result Qual Units Date AnalyzedDFPQLMDL
ANALYTICAL RESULTS
VOLATILE ORGANIC COMPOUNDS BY GC/MSEPA 8260B
Analyst: QBMRunID: MS5_150318B P15VW046QC Batch: PrepDate:
1,1-Dichloroethene 0.50 µg/L 1ND 0.16 3/19/2015 01:37 AMcis-1,2-Dichloroethene 0.50 µg/L 1ND 0.057 3/19/2015 01:37 AMTetrachloroethene 0.50 µg/L 144 0.12 3/19/2015 01:37 AMtrans-1,2-Dichloroethene 0.50 µg/L 1ND 0.074 3/19/2015 01:37 AMTrichloroethene 0.50 µg/L 1ND 0.074 3/19/2015 01:37 AMVinyl chloride 0.50 µg/L 1ND 0.044 3/19/2015 01:37 AM Surr: 1,2-Dichloroethane-d4 78-125 %REC 195.0 0 3/19/2015 01:37 AM Surr: 4-Bromofluorobenzene 80-120 %REC 197.7 0 3/19/2015 01:37 AM Surr: Dibromofluoromethane 80-122 %REC 1100 0 3/19/2015 01:37 AM Surr: Toluene-d8 80-120 %REC 1100 0 3/19/2015 01:37 AM
Qualifiers: B Analyte detected in the associated Method Blank E Value above quantitation range
H Holding times for preparation or analysis exceeded ND Not Detected at the Reporting Limit
S Spike/Surrogate outside of limits due to matrix interference Results are wet unless otherwise specified
DO Surrogate Diluted Out
25 of 45

NEVADA 3151 W. Post Rd., Las Vegas, NV 89118
P: 702.307.2659 F: 702.307.2691
“Serving Clients with Passion and Professionalism”
CALIFORNIA 11060 Artesia Blvd., Ste C, Cerritos, CA 90703
P: 562.219.7435 F: 562.219.7436
Project: Maryland Square, Z085000030
Client Sample ID: MW-19D3
Collection Date: 3/10/2015 1:55:00 PM
Matrix: GROUNDWATER
CLIENT: Cardno ATC
Lab Order: N014984
Lab ID: N014984-022
ASSET Laboratories Print Date: 25-Mar-15
Analyses Result Qual Units Date AnalyzedDFPQLMDL
ANALYTICAL RESULTS
VOLATILE ORGANIC COMPOUNDS BY GC/MSEPA 8260B
Analyst: QBMRunID: MS5_150318B P15VW046QC Batch: PrepDate:
1,1-Dichloroethene 0.50 µg/L 1ND 0.16 3/19/2015 03:17 AMcis-1,2-Dichloroethene 0.50 µg/L 1ND 0.057 3/19/2015 03:17 AMTetrachloroethene 0.50 µg/L 141 0.12 3/19/2015 03:17 AMtrans-1,2-Dichloroethene 0.50 µg/L 1ND 0.074 3/19/2015 03:17 AMTrichloroethene 0.50 µg/L 1ND 0.074 3/19/2015 03:17 AMVinyl chloride 0.50 µg/L 1ND 0.044 3/19/2015 03:17 AM Surr: 1,2-Dichloroethane-d4 78-125 %REC 197.4 0 3/19/2015 03:17 AM Surr: 4-Bromofluorobenzene 80-120 %REC 1101 0 3/19/2015 03:17 AM Surr: Dibromofluoromethane 80-122 %REC 1101 0 3/19/2015 03:17 AM Surr: Toluene-d8 80-120 %REC 1101 0 3/19/2015 03:17 AM
Qualifiers: B Analyte detected in the associated Method Blank E Value above quantitation range
H Holding times for preparation or analysis exceeded ND Not Detected at the Reporting Limit
S Spike/Surrogate outside of limits due to matrix interference Results are wet unless otherwise specified
DO Surrogate Diluted Out
26 of 45

NEVADA 3151 W. Post Rd., Las Vegas, NV 89118
P: 702.307.2659 F: 702.307.2691
“Serving Clients with Passion and Professionalism”
CALIFORNIA 11060 Artesia Blvd., Ste C, Cerritos, CA 90703
P: 562.219.7435 F: 562.219.7436
Project: Maryland Square, Z085000030
Client Sample ID: MW-20
Collection Date: 3/11/2015 9:20:00 AM
Matrix: GROUNDWATER
CLIENT: Cardno ATC
Lab Order: N014984
Lab ID: N014984-023
ASSET Laboratories Print Date: 25-Mar-15
Analyses Result Qual Units Date AnalyzedDFPQLMDL
ANALYTICAL RESULTS
VOLATILE ORGANIC COMPOUNDS BY GC/MSEPA 8260B
Analyst: QBMRunID: MS5_150318B P15VW046QC Batch: PrepDate:
1,1-Dichloroethene 0.50 µg/L 1ND 0.16 3/19/2015 04:32 AMcis-1,2-Dichloroethene 0.50 µg/L 1ND 0.057 3/19/2015 04:32 AMTetrachloroethene 10 µg/L 20680 2.3 3/19/2015 05:38 PMtrans-1,2-Dichloroethene 0.50 µg/L 1ND 0.074 3/19/2015 04:32 AMTrichloroethene 0.50 µg/L 12.3 0.074 3/19/2015 04:32 AMVinyl chloride 0.50 µg/L 1ND 0.044 3/19/2015 04:32 AM Surr: 1,2-Dichloroethane-d4 78-125 %REC 2096.7 0 3/19/2015 05:38 PM Surr: 1,2-Dichloroethane-d4 78-125 %REC 198.2 0 3/19/2015 04:32 AM Surr: 4-Bromofluorobenzene 80-120 %REC 197.6 0 3/19/2015 04:32 AM Surr: 4-Bromofluorobenzene 80-120 %REC 2098.6 0 3/19/2015 05:38 PM Surr: Dibromofluoromethane 80-122 %REC 199.3 0 3/19/2015 04:32 AM Surr: Dibromofluoromethane 80-122 %REC 20101 0 3/19/2015 05:38 PM Surr: Toluene-d8 80-120 %REC 20102 0 3/19/2015 05:38 PM Surr: Toluene-d8 80-120 %REC 199.0 0 3/19/2015 04:32 AM
HEXAVALENT CHROMIUM BY ICEPA 218.6
Analyst: RBRunID: IC6_150314A R99458QC Batch: PrepDate:
Hexavalent Chromium 0.20 µg/L 11.5 0.015 3/14/2015 02:48 PM
DISSOLVED METALS BY ICP-MSEPA 6020
Analyst: CEI
EPA 3010A
RunID: ICP7_150322A 49923QC Batch: PrepDate: 3/14/2015
Arsenic 0.10 µg/L 11.3 0.027 3/23/2015 12:28 AMChromium 1.0 µg/L 1ND 0.030 3/23/2015 12:28 AMManganese 0.50 µg/L 1ND 0.026 3/23/2015 12:28 AM
Qualifiers: B Analyte detected in the associated Method Blank E Value above quantitation range
H Holding times for preparation or analysis exceeded ND Not Detected at the Reporting Limit
S Spike/Surrogate outside of limits due to matrix interference Results are wet unless otherwise specified
DO Surrogate Diluted Out
27 of 45

NEVADA 3151 W. Post Rd., Las Vegas, NV 89118
P: 702.307.2659 F: 702.307.2691
“Serving Clients with Passion and Professionalism”
CALIFORNIA 11060 Artesia Blvd., Ste C, Cerritos, CA 90703
P: 562.219.7435 F: 562.219.7436
Project: Maryland Square, Z085000030
Client Sample ID: MW-20D1
Collection Date: 3/10/2015 11:05:00 AM
Matrix: GROUNDWATER
CLIENT: Cardno ATC
Lab Order: N014984
Lab ID: N014984-024
ASSET Laboratories Print Date: 25-Mar-15
Analyses Result Qual Units Date AnalyzedDFPQLMDL
ANALYTICAL RESULTS
VOLATILE ORGANIC COMPOUNDS BY GC/MSEPA 8260B
Analyst: QBMRunID: MS5_150318B P15VW046QC Batch: PrepDate:
1,1-Dichloroethene 0.50 µg/L 1ND 0.16 3/19/2015 03:42 AMcis-1,2-Dichloroethene 0.50 µg/L 1ND 0.057 3/19/2015 03:42 AMTetrachloroethene 5.0 µg/L 10340 1.2 3/19/2015 07:41 PMtrans-1,2-Dichloroethene 0.50 µg/L 1ND 0.074 3/19/2015 03:42 AMTrichloroethene 0.50 µg/L 10.98 0.074 3/19/2015 03:42 AMVinyl chloride 0.50 µg/L 1ND 0.044 3/19/2015 03:42 AM Surr: 1,2-Dichloroethane-d4 78-125 %REC 1098.5 0 3/19/2015 07:41 PM Surr: 1,2-Dichloroethane-d4 78-125 %REC 194.7 0 3/19/2015 03:42 AM Surr: 4-Bromofluorobenzene 80-120 %REC 1096.1 0 3/19/2015 07:41 PM Surr: 4-Bromofluorobenzene 80-120 %REC 197.6 0 3/19/2015 03:42 AM Surr: Dibromofluoromethane 80-122 %REC 10102 0 3/19/2015 07:41 PM Surr: Dibromofluoromethane 80-122 %REC 198.6 0 3/19/2015 03:42 AM Surr: Toluene-d8 80-120 %REC 10101 0 3/19/2015 07:41 PM Surr: Toluene-d8 80-120 %REC 1101 0 3/19/2015 03:42 AM
Qualifiers: B Analyte detected in the associated Method Blank E Value above quantitation range
H Holding times for preparation or analysis exceeded ND Not Detected at the Reporting Limit
S Spike/Surrogate outside of limits due to matrix interference Results are wet unless otherwise specified
DO Surrogate Diluted Out
28 of 45

NEVADA 3151 W. Post Rd., Las Vegas, NV 89118
P: 702.307.2659 F: 702.307.2691
“Serving Clients with Passion and Professionalism”
CALIFORNIA 11060 Artesia Blvd., Ste C, Cerritos, CA 90703
P: 562.219.7435 F: 562.219.7436
Project: Maryland Square, Z085000030
Client Sample ID: MW-20D2
Collection Date: 3/10/2015 12:00:00 PM
Matrix: GROUNDWATER
CLIENT: Cardno ATC
Lab Order: N014984
Lab ID: N014984-025
ASSET Laboratories Print Date: 25-Mar-15
Analyses Result Qual Units Date AnalyzedDFPQLMDL
ANALYTICAL RESULTS
VOLATILE ORGANIC COMPOUNDS BY GC/MSEPA 8260B
Analyst: QBMRunID: MS5_150318B P15VW046QC Batch: PrepDate:
1,1-Dichloroethene 0.50 µg/L 1ND 0.16 3/19/2015 02:52 AMcis-1,2-Dichloroethene 0.50 µg/L 10.96 0.057 3/19/2015 02:52 AMTetrachloroethene 5.0 µg/L 10230 1.2 3/19/2015 06:03 PMtrans-1,2-Dichloroethene 0.50 µg/L 1ND 0.074 3/19/2015 02:52 AMTrichloroethene 0.50 µg/L 11.9 0.074 3/19/2015 02:52 AMVinyl chloride 0.50 µg/L 1ND 0.044 3/19/2015 02:52 AM Surr: 1,2-Dichloroethane-d4 78-125 %REC 1098.2 0 3/19/2015 06:03 PM Surr: 1,2-Dichloroethane-d4 78-125 %REC 197.1 0 3/19/2015 02:52 AM Surr: 4-Bromofluorobenzene 80-120 %REC 1097.4 0 3/19/2015 06:03 PM Surr: 4-Bromofluorobenzene 80-120 %REC 1102 0 3/19/2015 02:52 AM Surr: Dibromofluoromethane 80-122 %REC 10102 0 3/19/2015 06:03 PM Surr: Dibromofluoromethane 80-122 %REC 1101 0 3/19/2015 02:52 AM Surr: Toluene-d8 80-120 %REC 10102 0 3/19/2015 06:03 PM Surr: Toluene-d8 80-120 %REC 1101 0 3/19/2015 02:52 AM
Qualifiers: B Analyte detected in the associated Method Blank E Value above quantitation range
H Holding times for preparation or analysis exceeded ND Not Detected at the Reporting Limit
S Spike/Surrogate outside of limits due to matrix interference Results are wet unless otherwise specified
DO Surrogate Diluted Out
29 of 45

NEVADA 3151 W. Post Rd., Las Vegas, NV 89118
P: 702.307.2659 F: 702.307.2691
“Serving Clients with Passion and Professionalism”
CALIFORNIA 11060 Artesia Blvd., Ste C, Cerritos, CA 90703
P: 562.219.7435 F: 562.219.7436
Project: Maryland Square, Z085000030
Client Sample ID: MW-20D3
Collection Date: 3/10/2015 10:10:00 AM
Matrix: GROUNDWATER
CLIENT: Cardno ATC
Lab Order: N014984
Lab ID: N014984-026
ASSET Laboratories Print Date: 25-Mar-15
Analyses Result Qual Units Date AnalyzedDFPQLMDL
ANALYTICAL RESULTS
VOLATILE ORGANIC COMPOUNDS BY GC/MSEPA 8260B
Analyst: QBMRunID: MS5_150319A P15VW047QC Batch: PrepDate:
1,1-Dichloroethene 0.50 µg/L 1ND 0.16 3/19/2015 02:22 PMcis-1,2-Dichloroethene 0.50 µg/L 1ND 0.057 3/19/2015 02:22 PMTetrachloroethene 0.50 µg/L 1ND 0.12 3/19/2015 02:22 PMtrans-1,2-Dichloroethene 0.50 µg/L 1ND 0.074 3/19/2015 02:22 PMTrichloroethene 0.50 µg/L 1ND 0.074 3/19/2015 02:22 PMVinyl chloride 0.50 µg/L 1ND 0.044 3/19/2015 02:22 PM Surr: 1,2-Dichloroethane-d4 78-125 %REC 197.3 0 3/19/2015 02:22 PM Surr: 4-Bromofluorobenzene 80-120 %REC 198.0 0 3/19/2015 02:22 PM Surr: Dibromofluoromethane 80-122 %REC 1102 0 3/19/2015 02:22 PM Surr: Toluene-d8 80-120 %REC 198.6 0 3/19/2015 02:22 PM
Qualifiers: B Analyte detected in the associated Method Blank E Value above quantitation range
H Holding times for preparation or analysis exceeded ND Not Detected at the Reporting Limit
S Spike/Surrogate outside of limits due to matrix interference Results are wet unless otherwise specified
DO Surrogate Diluted Out
30 of 45

NEVADA 3151 W. Post Rd., Las Vegas, NV 89118
P: 702.307.2659 F: 702.307.2691
“Serving Clients with Passion and Professionalism”
CALIFORNIA 11060 Artesia Blvd., Ste C, Cerritos, CA 90703
P: 562.219.7435 F: 562.219.7436
Project: Maryland Square, Z085000030
Client Sample ID: MW-34
Collection Date: 3/13/2015 2:16:00 PM
Matrix: GROUNDWATER
CLIENT: Cardno ATC
Lab Order: N014984
Lab ID: N014984-027
ASSET Laboratories Print Date: 25-Mar-15
Analyses Result Qual Units Date AnalyzedDFPQLMDL
ANALYTICAL RESULTS
VOLATILE ORGANIC COMPOUNDS BY GC/MSEPA 8260B
Analyst: QBMRunID: MS5_150318B P15VW046QC Batch: PrepDate:
1,1-Dichloroethene 0.50 µg/L 1ND 0.16 3/19/2015 04:58 AMcis-1,2-Dichloroethene 0.50 µg/L 1ND 0.057 3/19/2015 04:58 AMTetrachloroethene 5.0 µg/L 10370 1.2 3/19/2015 08:06 PMtrans-1,2-Dichloroethene 0.50 µg/L 1ND 0.074 3/19/2015 04:58 AMTrichloroethene 0.50 µg/L 10.91 0.074 3/19/2015 04:58 AMVinyl chloride 0.50 µg/L 1ND 0.044 3/19/2015 04:58 AM Surr: 1,2-Dichloroethane-d4 78-125 %REC 1099.5 0 3/19/2015 08:06 PM Surr: 1,2-Dichloroethane-d4 78-125 %REC 199.1 0 3/19/2015 04:58 AM Surr: 4-Bromofluorobenzene 80-120 %REC 1098.9 0 3/19/2015 08:06 PM Surr: 4-Bromofluorobenzene 80-120 %REC 1100 0 3/19/2015 04:58 AM Surr: Dibromofluoromethane 80-122 %REC 10102 0 3/19/2015 08:06 PM Surr: Dibromofluoromethane 80-122 %REC 1100 0 3/19/2015 04:58 AM Surr: Toluene-d8 80-120 %REC 10102 0 3/19/2015 08:06 PM Surr: Toluene-d8 80-120 %REC 1101 0 3/19/2015 04:58 AM
Qualifiers: B Analyte detected in the associated Method Blank E Value above quantitation range
H Holding times for preparation or analysis exceeded ND Not Detected at the Reporting Limit
S Spike/Surrogate outside of limits due to matrix interference Results are wet unless otherwise specified
DO Surrogate Diluted Out
31 of 45

NEVADA 3151 W. Post Rd., Las Vegas, NV 89118
P: 702.307.2659 F: 702.307.2691
“Serving Clients with Passion and Professionalism”
CALIFORNIA 11060 Artesia Blvd., Ste C, Cerritos, CA 90703
P: 562.219.7435 F: 562.219.7436
Project: Maryland Square, Z085000030
Client Sample ID: MW-35
Collection Date: 3/13/2015 1:29:00 PM
Matrix: GROUNDWATER
CLIENT: Cardno ATC
Lab Order: N014984
Lab ID: N014984-028
ASSET Laboratories Print Date: 25-Mar-15
Analyses Result Qual Units Date AnalyzedDFPQLMDL
ANALYTICAL RESULTS
VOLATILE ORGANIC COMPOUNDS BY GC/MSEPA 8260B
Analyst: QBMRunID: MS5_150318B P15VW046QC Batch: PrepDate:
1,1-Dichloroethene 0.50 µg/L 1ND 0.16 3/19/2015 04:07 AMcis-1,2-Dichloroethene 0.50 µg/L 1ND 0.057 3/19/2015 04:07 AMTetrachloroethene 2.5 µg/L 5180 0.59 3/19/2015 08:31 PMtrans-1,2-Dichloroethene 0.50 µg/L 1ND 0.074 3/19/2015 04:07 AMTrichloroethene 0.50 µg/L 1ND 0.074 3/19/2015 04:07 AMVinyl chloride 0.50 µg/L 1ND 0.044 3/19/2015 04:07 AM Surr: 1,2-Dichloroethane-d4 78-125 %REC 598.4 0 3/19/2015 08:31 PM Surr: 1,2-Dichloroethane-d4 78-125 %REC 198.6 0 3/19/2015 04:07 AM Surr: 4-Bromofluorobenzene 80-120 %REC 597.7 0 3/19/2015 08:31 PM Surr: 4-Bromofluorobenzene 80-120 %REC 198.5 0 3/19/2015 04:07 AM Surr: Dibromofluoromethane 80-122 %REC 5104 0 3/19/2015 08:31 PM Surr: Dibromofluoromethane 80-122 %REC 1103 0 3/19/2015 04:07 AM Surr: Toluene-d8 80-120 %REC 5103 0 3/19/2015 08:31 PM Surr: Toluene-d8 80-120 %REC 1101 0 3/19/2015 04:07 AM
Qualifiers: B Analyte detected in the associated Method Blank E Value above quantitation range
H Holding times for preparation or analysis exceeded ND Not Detected at the Reporting Limit
S Spike/Surrogate outside of limits due to matrix interference Results are wet unless otherwise specified
DO Surrogate Diluted Out
32 of 45

NEVADA 3151 W. Post Rd., Las Vegas, NV 89118
P: 702.307.2659 F: 702.307.2691
“Serving Clients with Passion and Professionalism”
CALIFORNIA 11060 Artesia Blvd., Ste C, Cerritos, CA 90703
P: 562.219.7435 F: 562.219.7436
Project: Maryland Square, Z085000030
Client Sample ID: MW-1DUP
Collection Date: 3/13/2015 12:40:00 PM
Matrix: GROUNDWATER
CLIENT: Cardno ATC
Lab Order: N014984
Lab ID: N014984-029
ASSET Laboratories Print Date: 25-Mar-15
Analyses Result Qual Units Date AnalyzedDFPQLMDL
ANALYTICAL RESULTS
VOLATILE ORGANIC COMPOUNDS BY GC/MSEPA 8260B
Analyst: QBMRunID: MS5_150316B P15VW045QC Batch: PrepDate:
1,1-Dichloroethene 0.50 µg/L 1ND 0.16 3/17/2015 06:28 AMcis-1,2-Dichloroethene 0.50 µg/L 1ND 0.057 3/17/2015 06:28 AMTetrachloroethene 5.0 µg/L 10210 1.2 3/18/2015 10:18 PMtrans-1,2-Dichloroethene 0.50 µg/L 1ND 0.074 3/17/2015 06:28 AMTrichloroethene 0.50 µg/L 1ND 0.074 3/17/2015 06:28 AMVinyl chloride 0.50 µg/L 1ND 0.044 3/17/2015 06:28 AM Surr: 1,2-Dichloroethane-d4 78-125 %REC 1092.0 0 3/18/2015 10:18 PM Surr: 1,2-Dichloroethane-d4 78-125 %REC 1100 0 3/17/2015 06:28 AM Surr: 4-Bromofluorobenzene 80-120 %REC 1099.6 0 3/18/2015 10:18 PM Surr: 4-Bromofluorobenzene 80-120 %REC 197.1 0 3/17/2015 06:28 AM Surr: Dibromofluoromethane 80-122 %REC 1098.4 0 3/18/2015 10:18 PM Surr: Dibromofluoromethane 80-122 %REC 1103 0 3/17/2015 06:28 AM Surr: Toluene-d8 80-120 %REC 10101 0 3/18/2015 10:18 PM Surr: Toluene-d8 80-120 %REC 1101 0 3/17/2015 06:28 AM
Qualifiers: B Analyte detected in the associated Method Blank E Value above quantitation range
H Holding times for preparation or analysis exceeded ND Not Detected at the Reporting Limit
S Spike/Surrogate outside of limits due to matrix interference Results are wet unless otherwise specified
DO Surrogate Diluted Out
33 of 45

NEVADA 3151 W. Post Rd., Las Vegas, NV 89118
P: 702.307.2659 F: 702.307.2691
“Serving Clients with Passion and Professionalism”
CALIFORNIA 11060 Artesia Blvd., Ste C, Cerritos, CA 90703
P: 562.219.7435 F: 562.219.7436
Project: Maryland Square, Z085000030
Client Sample ID: TRIP BLANK 03/13/15
Collection Date: 3/13/2015 10:00:00 AM
Matrix: GROUNDWATER
CLIENT: Cardno ATC
Lab Order: N014984
Lab ID: N014984-030
ASSET Laboratories Print Date: 25-Mar-15
Analyses Result Qual Units Date AnalyzedDFPQLMDL
ANALYTICAL RESULTS
VOLATILE ORGANIC COMPOUNDS BY GC/MSEPA 8260B
Analyst: QBMRunID: MS5_150316B P15VW045QC Batch: PrepDate:
1,1-Dichloroethene 0.50 µg/L 1ND 0.16 3/16/2015 11:21 PMcis-1,2-Dichloroethene 0.50 µg/L 1ND 0.057 3/16/2015 11:21 PMTetrachloroethene 0.50 µg/L 1ND 0.12 3/16/2015 11:21 PMtrans-1,2-Dichloroethene 0.50 µg/L 1ND 0.074 3/16/2015 11:21 PMTrichloroethene 0.50 µg/L 1ND 0.074 3/16/2015 11:21 PMVinyl chloride 0.50 µg/L 1ND 0.044 3/16/2015 11:21 PM Surr: 1,2-Dichloroethane-d4 78-125 %REC 197.1 0 3/16/2015 11:21 PM Surr: 4-Bromofluorobenzene 80-120 %REC 197.8 0 3/16/2015 11:21 PM Surr: Dibromofluoromethane 80-122 %REC 1101 0 3/16/2015 11:21 PM Surr: Toluene-d8 80-120 %REC 1101 0 3/16/2015 11:21 PM
Qualifiers: B Analyte detected in the associated Method Blank E Value above quantitation range
H Holding times for preparation or analysis exceeded ND Not Detected at the Reporting Limit
S Spike/Surrogate outside of limits due to matrix interference Results are wet unless otherwise specified
DO Surrogate Diluted Out
34 of 45

NEVADA 3151 W. Post Rd., Las Vegas, NV 89118
P: 702.307.2659 F: 702.307.2691
“Serving Clients with Passion and Professionalism”
CALIFORNIA 11060 Artesia Blvd., Ste C, Cerritos, CA 90703
P: 562.219.7435 F: 562.219.7436
Project: Maryland Square, Z085000030
Client Sample ID: FIELD BLANK 03/13/15
Collection Date: 3/13/2015 12:25:00 PM
Matrix: GROUNDWATER
CLIENT: Cardno ATC
Lab Order: N014984
Lab ID: N014984-031
ASSET Laboratories Print Date: 25-Mar-15
Analyses Result Qual Units Date AnalyzedDFPQLMDL
ANALYTICAL RESULTS
VOLATILE ORGANIC COMPOUNDS BY GC/MSEPA 8260B
Analyst: QBMRunID: MS5_150316B P15VW045QC Batch: PrepDate:
1,1-Dichloroethene 0.50 µg/L 1ND 0.16 3/16/2015 11:46 PMcis-1,2-Dichloroethene 0.50 µg/L 1ND 0.057 3/16/2015 11:46 PMTetrachloroethene 0.50 µg/L 1ND 0.12 3/16/2015 11:46 PMtrans-1,2-Dichloroethene 0.50 µg/L 1ND 0.074 3/16/2015 11:46 PMTrichloroethene 0.50 µg/L 1ND 0.074 3/16/2015 11:46 PMVinyl chloride 0.50 µg/L 1ND 0.044 3/16/2015 11:46 PM Surr: 1,2-Dichloroethane-d4 78-125 %REC 199.2 0 3/16/2015 11:46 PM Surr: 4-Bromofluorobenzene 80-120 %REC 199.8 0 3/16/2015 11:46 PM Surr: Dibromofluoromethane 80-122 %REC 1102 0 3/16/2015 11:46 PM Surr: Toluene-d8 80-120 %REC 1100 0 3/16/2015 11:46 PM
Qualifiers: B Analyte detected in the associated Method Blank E Value above quantitation range
H Holding times for preparation or analysis exceeded ND Not Detected at the Reporting Limit
S Spike/Surrogate outside of limits due to matrix interference Results are wet unless otherwise specified
DO Surrogate Diluted Out
35 of 45

NEVADA 3151 W. Post Rd., Las Vegas, NV 89118
P: 702.307.2659 F: 702.307.2691
“Serving Clients with Passion and Professionalism”
CALIFORNIA 11060 Artesia Blvd., Ste C, Cerritos, CA 90703
P: 562.219.7435 F: 562.219.7436
Project: Maryland Square, Z085000030
Client Sample ID: EQUIPMENT RINSE 03/13/15
Collection Date: 3/13/2015 1:35:00 PM
Matrix: GROUNDWATER
CLIENT: Cardno ATC
Lab Order: N014984
Lab ID: N014984-032
ASSET Laboratories Print Date: 25-Mar-15
Analyses Result Qual Units Date AnalyzedDFPQLMDL
ANALYTICAL RESULTS
VOLATILE ORGANIC COMPOUNDS BY GC/MSEPA 8260B
Analyst: QBMRunID: MS5_150318B P15VW046QC Batch: PrepDate:
1,1-Dichloroethene 0.50 µg/L 1ND 0.16 3/18/2015 08:40 PMcis-1,2-Dichloroethene 0.50 µg/L 1ND 0.057 3/18/2015 08:40 PMTetrachloroethene 0.50 µg/L 1ND 0.12 3/18/2015 08:40 PMtrans-1,2-Dichloroethene 0.50 µg/L 1ND 0.074 3/18/2015 08:40 PMTrichloroethene 0.50 µg/L 1ND 0.074 3/18/2015 08:40 PMVinyl chloride 0.50 µg/L 1ND 0.044 3/18/2015 08:40 PM Surr: 1,2-Dichloroethane-d4 78-125 %REC 193.2 0 3/18/2015 08:40 PM Surr: 4-Bromofluorobenzene 80-120 %REC 199.6 0 3/18/2015 08:40 PM Surr: Dibromofluoromethane 80-122 %REC 197.6 0 3/18/2015 08:40 PM Surr: Toluene-d8 80-120 %REC 1102 0 3/18/2015 08:40 PM
Qualifiers: B Analyte detected in the associated Method Blank E Value above quantitation range
H Holding times for preparation or analysis exceeded ND Not Detected at the Reporting Limit
S Spike/Surrogate outside of limits due to matrix interference Results are wet unless otherwise specified
DO Surrogate Diluted Out
36 of 45

NEVADA 3151 W. Post Rd., Las Vegas, NV 89118
P: 702.307.2659 F: 702.307.2691
“Serving Clients with Passion and Professionalism”
CALIFORNIA 11060 Artesia Blvd., Ste C, Cerritos, CA 90703
P: 562.219.7435 F: 562.219.7436
25-Mar-15Date:ASSET Laboratories
Project: Maryland Square, Z085000030
CLIENT: Cardno ATC
Work Order: N014984ANALYTICAL QC SUMMARY REPORT
TestCode: 218.6_W
Sample ID: MB-R99458
Batch ID: R99458 TestNo: EPA 218.6 Analysis Date: 3/14/2015
Prep Date:
Analyte Result SPK value SPK Ref Val %REC RPD Ref Val %RPDLowLimit HighLimit RPDLimit Qual
Units: µg/L
PQL
Client ID: PBW
RunNo: 99458
SeqNo: 1953549
MBLKSampType: TestCode: 218.6_W
Hexavalent Chromium 0.20ND
Sample ID: LCS-R99458
Batch ID: R99458 TestNo: EPA 218.6 Analysis Date: 3/14/2015
Prep Date:
Analyte Result SPK value SPK Ref Val %REC RPD Ref Val %RPDLowLimit HighLimit RPDLimit Qual
Units: µg/L
PQL
Client ID: LCSW
RunNo: 99458
SeqNo: 1953550
LCSSampType: TestCode: 218.6_W
Hexavalent Chromium 5.000 101 90 1100.20 05.048
Sample ID: N014970-001A-DUP
Batch ID: R99458 TestNo: EPA 218.6 Analysis Date: 3/14/2015
Prep Date:
Analyte Result SPK value SPK Ref Val %REC RPD Ref Val %RPDLowLimit HighLimit RPDLimit Qual
Units: µg/L
PQL
Client ID: ZZZZZZ
RunNo: 99458
SeqNo: 1953552
DUPSampType: TestCode: 218.6_W
Hexavalent Chromium 200.20 11.48 2.1311.240
Sample ID: N014970-001A-MS
Batch ID: R99458 TestNo: EPA 218.6 Analysis Date: 3/14/2015
Prep Date:
Analyte Result SPK value SPK Ref Val %REC RPD Ref Val %RPDLowLimit HighLimit RPDLimit Qual
Units: µg/L
PQL
Client ID: ZZZZZZ
RunNo: 99458
SeqNo: 1953553
MSSampType: TestCode: 218.6_W
Hexavalent Chromium 5.000 100 90 1100.20 11.4816.484
Sample ID: N014970-001A-MSD
Batch ID: R99458 TestNo: EPA 218.6 Analysis Date: 3/14/2015
Prep Date:
Analyte Result SPK value SPK Ref Val %REC RPD Ref Val %RPDLowLimit HighLimit RPDLimit Qual
Units: µg/L
PQL
Client ID: ZZZZZZ
RunNo: 99458
SeqNo: 1953554
MSDSampType: TestCode: 218.6_W
Hexavalent Chromium 5.000 101 90 110 200.20 11.48 16.48 0.33116.538
Qualifiers:
B Analyte detected in the associated Method Blank E Value above quantitation range H Holding times for preparation or analysis exceeded
ND Not Detected at the Reporting Limit R RPD outside accepted recovery limits S Spike/Surrogate outside of limits due to matrix interference
DO Surrogate Diluted Out Calculations are based on raw values
37 of 45

NEVADA 3151 W. Post Rd., Las Vegas, NV 89118
P: 702.307.2659 F: 702.307.2691
“Serving Clients with Passion and Professionalism”
CALIFORNIA 11060 Artesia Blvd., Ste C, Cerritos, CA 90703
P: 562.219.7435 F: 562.219.7436
Project: Maryland Square, Z085000030
CLIENT: Cardno ATC
Work Order: N014984ANALYTICAL QC SUMMARY REPORT
TestCode: 218.6_W
Sample ID: N014984-023A-MS
Batch ID: R99458 TestNo: EPA 218.6 Analysis Date: 3/14/2015
Prep Date:
Analyte Result SPK value SPK Ref Val %REC RPD Ref Val %RPDLowLimit HighLimit RPDLimit Qual
Units: µg/L
PQL
Client ID: ZZZZZZ
RunNo: 99458
SeqNo: 1953572
MSSampType: TestCode: 218.6_W
Hexavalent Chromium 5.000 97.8 90 1100.20 1.5376.429
Qualifiers:
B Analyte detected in the associated Method Blank E Value above quantitation range H Holding times for preparation or analysis exceeded
ND Not Detected at the Reporting Limit R RPD outside accepted recovery limits S Spike/Surrogate outside of limits due to matrix interference
DO Surrogate Diluted Out Calculations are based on raw values
38 of 45

NEVADA 3151 W. Post Rd., Las Vegas, NV 89118
P: 702.307.2659 F: 702.307.2691
“Serving Clients with Passion and Professionalism”
CALIFORNIA 11060 Artesia Blvd., Ste C, Cerritos, CA 90703
P: 562.219.7435 F: 562.219.7436
Project: Maryland Square, Z085000030
CLIENT: Cardno ATC
Work Order: N014984ANALYTICAL QC SUMMARY REPORT
TestCode: 6020_DIS
Sample ID: MB-49923
Batch ID: 49923 TestNo: EPA 6020 Analysis Date: 3/16/2015
Prep Date: 3/14/2015
Analyte Result SPK value SPK Ref Val %REC RPD Ref Val %RPDLowLimit HighLimit RPDLimit Qual
Units: µg/L
PQL
Client ID: PBW
RunNo: 99489
SeqNo: 1955258
MBLKSampType: TestCode: 6020_DIS
EPA 3010A
Arsenic 0.10NDChromium 1.00.050Manganese 0.50ND
Sample ID: LCS-49923
Batch ID: 49923 TestNo: EPA 6020 Analysis Date: 3/16/2015
Prep Date: 3/14/2015
Analyte Result SPK value SPK Ref Val %REC RPD Ref Val %RPDLowLimit HighLimit RPDLimit Qual
Units: µg/L
PQL
Client ID: LCSW
RunNo: 99489
SeqNo: 1955259
LCSSampType: TestCode: 6020_DIS
EPA 3010A
Arsenic 10.00 104 85 1150.10 010.352Chromium 10.00 103 85 1151.0 010.283Manganese 100.0 102 85 1150.50 0101.797
Sample ID: N014985-001B-MS
Batch ID: 49923 TestNo: EPA 6020 Analysis Date: 3/16/2015
Prep Date: 3/14/2015
Analyte Result SPK value SPK Ref Val %REC RPD Ref Val %RPDLowLimit HighLimit RPDLimit Qual
Units: µg/L
PQL
Client ID: ZZZZZZ
RunNo: 99489
SeqNo: 1955265
MSSampType: TestCode: 6020_DIS
EPA 3010A
Arsenic 10.00 -455 75 125 S0.10 56.4010.921Chromium 10.00 15.8 75 125 S1.0 9.60911.193Manganese 100.0 89.7 75 1250.50 089.651
Sample ID: N014985-001B-MSD
Batch ID: 49923 TestNo: EPA 6020 Analysis Date: 3/16/2015
Prep Date: 3/14/2015
Analyte Result SPK value SPK Ref Val %REC RPD Ref Val %RPDLowLimit HighLimit RPDLimit Qual
Units: µg/L
PQL
Client ID: ZZZZZZ
RunNo: 99489
SeqNo: 1955266
MSDSampType: TestCode: 6020_DIS
EPA 3010A
Arsenic 10.00 -457 75 125 20 S0.10 56.40 10.92 1.7310.733Chromium 10.00 13.2 75 125 20 S1.0 9.609 11.19 2.3710.930Manganese 100.0 89.9 75 125 200.50 0 89.65 0.22689.854
Qualifiers:
B Analyte detected in the associated Method Blank E Value above quantitation range H Holding times for preparation or analysis exceeded
ND Not Detected at the Reporting Limit R RPD outside accepted recovery limits S Spike/Surrogate outside of limits due to matrix interference
DO Surrogate Diluted Out Calculations are based on raw values
39 of 45

NEVADA 3151 W. Post Rd., Las Vegas, NV 89118
P: 702.307.2659 F: 702.307.2691
“Serving Clients with Passion and Professionalism”
CALIFORNIA 11060 Artesia Blvd., Ste C, Cerritos, CA 90703
P: 562.219.7435 F: 562.219.7436
Project: Maryland Square, Z085000030
CLIENT: Cardno ATC
Work Order: N014984ANALYTICAL QC SUMMARY REPORT
TestCode: 8260WATERP
Sample ID: P150316LCS2
Batch ID: P15VW045 TestNo: EPA 8260B Analysis Date: 3/16/2015
Prep Date:
Analyte Result SPK value SPK Ref Val %REC RPD Ref Val %RPDLowLimit HighLimit RPDLimit Qual
Units: µg/L
PQL
Client ID: LCSW
RunNo: 99470
SeqNo: 1954334
LCSSampType: TestCode: 8260WATERP
1,1-Dichloroethene 20.00 108 71 1270.50 021.660cis-1,2-Dichloroethene 20.00 96.0 80 1200.50 019.200Tetrachloroethene 20.00 108 80 1200.50 021.680trans-1,2-Dichloroethene 20.00 94.6 78 1260.50 018.920Trichloroethene 20.00 107 80 1200.50 021.450Vinyl chloride 20.00 94.5 70 1350.50 018.900 Surr: 1,2-Dichloroethane-d4 25.00 93.0 78 12523.250 Surr: 4-Bromofluorobenzene 25.00 103 80 12025.730 Surr: Dibromofluoromethane 25.00 98.4 80 12224.590 Surr: Toluene-d8 25.00 102 80 12025.440
Sample ID: P150316LCSD2
Batch ID: P15VW045 TestNo: EPA 8260B Analysis Date: 3/16/2015
Prep Date:
Analyte Result SPK value SPK Ref Val %REC RPD Ref Val %RPDLowLimit HighLimit RPDLimit Qual
Units: µg/L
PQL
Client ID: LCSS02
RunNo: 99470
SeqNo: 1954335
LCSDSampType: TestCode: 8260WATERP
1,1-Dichloroethene 20.00 109 71 127 200.50 0 21.66 0.46121.760cis-1,2-Dichloroethene 20.00 93.3 80 120 200.50 0 19.20 2.8518.660Tetrachloroethene 20.00 107 80 120 200.50 0 21.68 1.1621.430trans-1,2-Dichloroethene 20.00 97.3 78 126 200.50 0 18.92 2.7619.450Trichloroethene 20.00 110 80 120 200.50 0 21.45 2.9422.090Vinyl chloride 20.00 91.7 70 135 200.50 0 18.90 3.0118.340 Surr: 1,2-Dichloroethane-d4 25.00 92.7 78 125 023.170 Surr: 4-Bromofluorobenzene 25.00 102 80 120 025.510 Surr: Dibromofluoromethane 25.00 97.6 80 122 024.400 Surr: Toluene-d8 25.00 101 80 120 025.220
Sample ID: P150316MB6
Batch ID: P15VW045 TestNo: EPA 8260B Analysis Date: 3/16/2015
Prep Date:
Analyte Result SPK value SPK Ref Val %REC RPD Ref Val %RPDLowLimit HighLimit RPDLimit Qual
Units: µg/L
PQL
Client ID: PBW
RunNo: 99470
SeqNo: 1954338
MBLKSampType: TestCode: 8260WATERP
Qualifiers:
B Analyte detected in the associated Method Blank E Value above quantitation range H Holding times for preparation or analysis exceeded
ND Not Detected at the Reporting Limit R RPD outside accepted recovery limits S Spike/Surrogate outside of limits due to matrix interference
DO Surrogate Diluted Out Calculations are based on raw values
40 of 45

NEVADA 3151 W. Post Rd., Las Vegas, NV 89118
P: 702.307.2659 F: 702.307.2691
“Serving Clients with Passion and Professionalism”
CALIFORNIA 11060 Artesia Blvd., Ste C, Cerritos, CA 90703
P: 562.219.7435 F: 562.219.7436
Project: Maryland Square, Z085000030
CLIENT: Cardno ATC
Work Order: N014984ANALYTICAL QC SUMMARY REPORT
TestCode: 8260WATERP
Sample ID: P150316MB6
Batch ID: P15VW045 TestNo: EPA 8260B Analysis Date: 3/16/2015
Prep Date:
Analyte Result SPK value SPK Ref Val %REC RPD Ref Val %RPDLowLimit HighLimit RPDLimit Qual
Units: µg/L
PQL
Client ID: PBW
RunNo: 99470
SeqNo: 1954338
MBLKSampType: TestCode: 8260WATERP
1,1-Dichloroethene 0.50NDcis-1,2-Dichloroethene 0.50NDTetrachloroethene 0.50NDtrans-1,2-Dichloroethene 0.50NDTrichloroethene 0.50NDVinyl chloride 0.50ND Surr: 1,2-Dichloroethane-d4 25.00 96.3 78 12524.080 Surr: 4-Bromofluorobenzene 25.00 98.0 80 12024.490 Surr: Dibromofluoromethane 25.00 99.6 80 12224.900 Surr: Toluene-d8 25.00 99.6 80 12024.910
Qualifiers:
B Analyte detected in the associated Method Blank E Value above quantitation range H Holding times for preparation or analysis exceeded
ND Not Detected at the Reporting Limit R RPD outside accepted recovery limits S Spike/Surrogate outside of limits due to matrix interference
DO Surrogate Diluted Out Calculations are based on raw values
41 of 45

NEVADA 3151 W. Post Rd., Las Vegas, NV 89118
P: 702.307.2659 F: 702.307.2691
“Serving Clients with Passion and Professionalism”
CALIFORNIA 11060 Artesia Blvd., Ste C, Cerritos, CA 90703
P: 562.219.7435 F: 562.219.7436
Project: Maryland Square, Z085000030
CLIENT: Cardno ATC
Work Order: N014984ANALYTICAL QC SUMMARY REPORT
TestCode: 8260WATERP
Sample ID: P150318LCS2
Batch ID: P15VW046 TestNo: EPA 8260B Analysis Date: 3/18/2015
Prep Date:
Analyte Result SPK value SPK Ref Val %REC RPD Ref Val %RPDLowLimit HighLimit RPDLimit Qual
Units: µg/L
PQL
Client ID: LCSW
RunNo: 99514
SeqNo: 1957103
LCSSampType: TestCode: 8260WATERP
1,1-Dichloroethene 20.00 109 71 1270.50 021.730cis-1,2-Dichloroethene 20.00 95.8 80 1200.50 019.160Tetrachloroethene 20.00 110 80 1200.50 022.060trans-1,2-Dichloroethene 20.00 97.2 78 1260.50 019.430Trichloroethene 20.00 112 80 1200.50 022.490Vinyl chloride 20.00 95.2 70 1350.50 019.040 Surr: 1,2-Dichloroethane-d4 25.00 88.2 78 12522.060 Surr: 4-Bromofluorobenzene 25.00 103 80 12025.760 Surr: Dibromofluoromethane 25.00 95.3 80 12223.830 Surr: Toluene-d8 25.00 103 80 12025.820
Sample ID: P150318LCSD2
Batch ID: P15VW046 TestNo: EPA 8260B Analysis Date: 3/18/2015
Prep Date:
Analyte Result SPK value SPK Ref Val %REC RPD Ref Val %RPDLowLimit HighLimit RPDLimit Qual
Units: µg/L
PQL
Client ID: LCSS02
RunNo: 99514
SeqNo: 1957104
LCSDSampType: TestCode: 8260WATERP
1,1-Dichloroethene 20.00 107 71 127 200.50 0 21.73 1.8121.340cis-1,2-Dichloroethene 20.00 96.2 80 120 200.50 0 19.16 0.41719.240Tetrachloroethene 20.00 107 80 120 200.50 0 22.06 3.0421.400trans-1,2-Dichloroethene 20.00 96.4 78 126 200.50 0 19.43 0.82719.270Trichloroethene 20.00 112 80 120 200.50 0 22.49 0.089022.470Vinyl chloride 20.00 95.7 70 135 200.50 0 19.04 0.47219.130 Surr: 1,2-Dichloroethane-d4 25.00 88.0 78 125 022.010 Surr: 4-Bromofluorobenzene 25.00 105 80 120 026.250 Surr: Dibromofluoromethane 25.00 96.7 80 122 024.180 Surr: Toluene-d8 25.00 102 80 120 025.390
Sample ID: P150318MB7
Batch ID: P15VW046 TestNo: EPA 8260B Analysis Date: 3/18/2015
Prep Date:
Analyte Result SPK value SPK Ref Val %REC RPD Ref Val %RPDLowLimit HighLimit RPDLimit Qual
Units: µg/L
PQL
Client ID: PBW
RunNo: 99514
SeqNo: 1957107
MBLKSampType: TestCode: 8260WATERP
Qualifiers:
B Analyte detected in the associated Method Blank E Value above quantitation range H Holding times for preparation or analysis exceeded
ND Not Detected at the Reporting Limit R RPD outside accepted recovery limits S Spike/Surrogate outside of limits due to matrix interference
DO Surrogate Diluted Out Calculations are based on raw values
42 of 45

NEVADA 3151 W. Post Rd., Las Vegas, NV 89118
P: 702.307.2659 F: 702.307.2691
“Serving Clients with Passion and Professionalism”
CALIFORNIA 11060 Artesia Blvd., Ste C, Cerritos, CA 90703
P: 562.219.7435 F: 562.219.7436
Project: Maryland Square, Z085000030
CLIENT: Cardno ATC
Work Order: N014984ANALYTICAL QC SUMMARY REPORT
TestCode: 8260WATERP
Sample ID: P150318MB7
Batch ID: P15VW046 TestNo: EPA 8260B Analysis Date: 3/18/2015
Prep Date:
Analyte Result SPK value SPK Ref Val %REC RPD Ref Val %RPDLowLimit HighLimit RPDLimit Qual
Units: µg/L
PQL
Client ID: PBW
RunNo: 99514
SeqNo: 1957107
MBLKSampType: TestCode: 8260WATERP
1,1-Dichloroethene 0.50NDcis-1,2-Dichloroethene 0.50NDTetrachloroethene 0.50NDtrans-1,2-Dichloroethene 0.50NDTrichloroethene 0.50NDVinyl chloride 0.50ND Surr: 1,2-Dichloroethane-d4 25.00 90.0 78 12522.510 Surr: 4-Bromofluorobenzene 25.00 101 80 12025.230 Surr: Dibromofluoromethane 25.00 95.1 80 12223.780 Surr: Toluene-d8 25.00 101 80 12025.260
Qualifiers:
B Analyte detected in the associated Method Blank E Value above quantitation range H Holding times for preparation or analysis exceeded
ND Not Detected at the Reporting Limit R RPD outside accepted recovery limits S Spike/Surrogate outside of limits due to matrix interference
DO Surrogate Diluted Out Calculations are based on raw values
43 of 45

NEVADA 3151 W. Post Rd., Las Vegas, NV 89118
P: 702.307.2659 F: 702.307.2691
“Serving Clients with Passion and Professionalism”
CALIFORNIA 11060 Artesia Blvd., Ste C, Cerritos, CA 90703
P: 562.219.7435 F: 562.219.7436
Project: Maryland Square, Z085000030
CLIENT: Cardno ATC
Work Order: N014984ANALYTICAL QC SUMMARY REPORT
TestCode: 8260WATERP
Sample ID: P150319LCS
Batch ID: P15VW047 TestNo: EPA 8260B Analysis Date: 3/19/2015
Prep Date:
Analyte Result SPK value SPK Ref Val %REC RPD Ref Val %RPDLowLimit HighLimit RPDLimit Qual
Units: µg/L
PQL
Client ID: LCSW
RunNo: 99529
SeqNo: 1957481
LCSSampType: TestCode: 8260WATERP
1,1-Dichloroethene 20.00 108 71 1270.50 021.610cis-1,2-Dichloroethene 20.00 94.8 80 1200.50 018.970Tetrachloroethene 20.00 109 80 1200.50 021.720trans-1,2-Dichloroethene 20.00 93.0 78 1260.50 018.610Trichloroethene 20.00 111 80 1200.50 022.220Vinyl chloride 20.00 90.4 70 1350.50 018.070 Surr: 1,2-Dichloroethane-d4 25.00 92.7 78 12523.180 Surr: 4-Bromofluorobenzene 25.00 103 80 12025.680 Surr: Dibromofluoromethane 25.00 95.2 80 12223.810 Surr: Toluene-d8 25.00 102 80 12025.590
Sample ID: N015021-001DMS
Batch ID: P15VW047 TestNo: EPA 8260B Analysis Date: 3/19/2015
Prep Date:
Analyte Result SPK value SPK Ref Val %REC RPD Ref Val %RPDLowLimit HighLimit RPDLimit Qual
Units: µg/L
PQL
Client ID: ZZZZZZ
RunNo: 99529
SeqNo: 1957482
MSSampType: TestCode: 8260WATERP
1,1-Dichloroethene 20.00 112 62 1350.50 022.350cis-1,2-Dichloroethene 20.00 95.7 73 1250.50 019.140Tetrachloroethene 20.00 108 71 1230.50 021.530trans-1,2-Dichloroethene 20.00 96.2 64 1320.50 019.230Trichloroethene 20.00 114 79 1210.50 022.750Vinyl chloride 20.00 95.0 64 1340.50 018.990 Surr: 1,2-Dichloroethane-d4 25.00 92.0 78 12523.000 Surr: 4-Bromofluorobenzene 25.00 104 80 12025.920 Surr: Dibromofluoromethane 25.00 94.8 80 12223.690 Surr: Toluene-d8 25.00 102 80 12025.580
Sample ID: N015021-001DMSD
Batch ID: P15VW047 TestNo: EPA 8260B Analysis Date: 3/19/2015
Prep Date:
Analyte Result SPK value SPK Ref Val %REC RPD Ref Val %RPDLowLimit HighLimit RPDLimit Qual
Units: µg/L
PQL
Client ID: ZZZZZZ
RunNo: 99529
SeqNo: 1957483
MSDSampType: TestCode: 8260WATERP
Qualifiers:
B Analyte detected in the associated Method Blank E Value above quantitation range H Holding times for preparation or analysis exceeded
ND Not Detected at the Reporting Limit R RPD outside accepted recovery limits S Spike/Surrogate outside of limits due to matrix interference
DO Surrogate Diluted Out Calculations are based on raw values
44 of 45

NEVADA 3151 W. Post Rd., Las Vegas, NV 89118
P: 702.307.2659 F: 702.307.2691
“Serving Clients with Passion and Professionalism”
CALIFORNIA 11060 Artesia Blvd., Ste C, Cerritos, CA 90703
P: 562.219.7435 F: 562.219.7436
Project: Maryland Square, Z085000030
CLIENT: Cardno ATC
Work Order: N014984ANALYTICAL QC SUMMARY REPORT
TestCode: 8260WATERP
Sample ID: N015021-001DMSD
Batch ID: P15VW047 TestNo: EPA 8260B Analysis Date: 3/19/2015
Prep Date:
Analyte Result SPK value SPK Ref Val %REC RPD Ref Val %RPDLowLimit HighLimit RPDLimit Qual
Units: µg/L
PQL
Client ID: ZZZZZZ
RunNo: 99529
SeqNo: 1957483
MSDSampType: TestCode: 8260WATERP
1,1-Dichloroethene 20.00 110 62 135 200.50 0 22.35 1.1222.100cis-1,2-Dichloroethene 20.00 88.6 73 125 200.50 0 19.14 7.6517.730Tetrachloroethene 20.00 106 71 123 200.50 0 21.53 1.6421.180trans-1,2-Dichloroethene 20.00 90.4 64 132 200.50 0 19.23 6.2218.070Trichloroethene 20.00 112 79 121 200.50 0 22.75 1.6422.380Vinyl chloride 20.00 89.4 64 134 200.50 0 18.99 6.0817.870 Surr: 1,2-Dichloroethane-d4 25.00 92.7 78 125 023.170 Surr: 4-Bromofluorobenzene 25.00 105 80 120 026.220 Surr: Dibromofluoromethane 25.00 96.2 80 122 024.040 Surr: Toluene-d8 25.00 103 80 120 025.690
Sample ID: P150319MB3
Batch ID: P15VW047 TestNo: EPA 8260B Analysis Date: 3/19/2015
Prep Date:
Analyte Result SPK value SPK Ref Val %REC RPD Ref Val %RPDLowLimit HighLimit RPDLimit Qual
Units: µg/L
PQL
Client ID: PBW
RunNo: 99529
SeqNo: 1957486
MBLKSampType: TestCode: 8260WATERP
1,1-Dichloroethene 0.50NDcis-1,2-Dichloroethene 0.50NDTetrachloroethene 0.50NDtrans-1,2-Dichloroethene 0.50NDTrichloroethene 0.50NDVinyl chloride 0.50ND Surr: 1,2-Dichloroethane-d4 25.00 96.7 78 12524.180 Surr: 4-Bromofluorobenzene 25.00 99.5 80 12024.880 Surr: Dibromofluoromethane 25.00 99.7 80 12224.920 Surr: Toluene-d8 25.00 101 80 12025.220
Qualifiers:
B Analyte detected in the associated Method Blank E Value above quantitation range H Holding times for preparation or analysis exceeded
ND Not Detected at the Reporting Limit R RPD outside accepted recovery limits S Spike/Surrogate outside of limits due to matrix interference
DO Surrogate Diluted Out Calculations are based on raw values
45 of 45


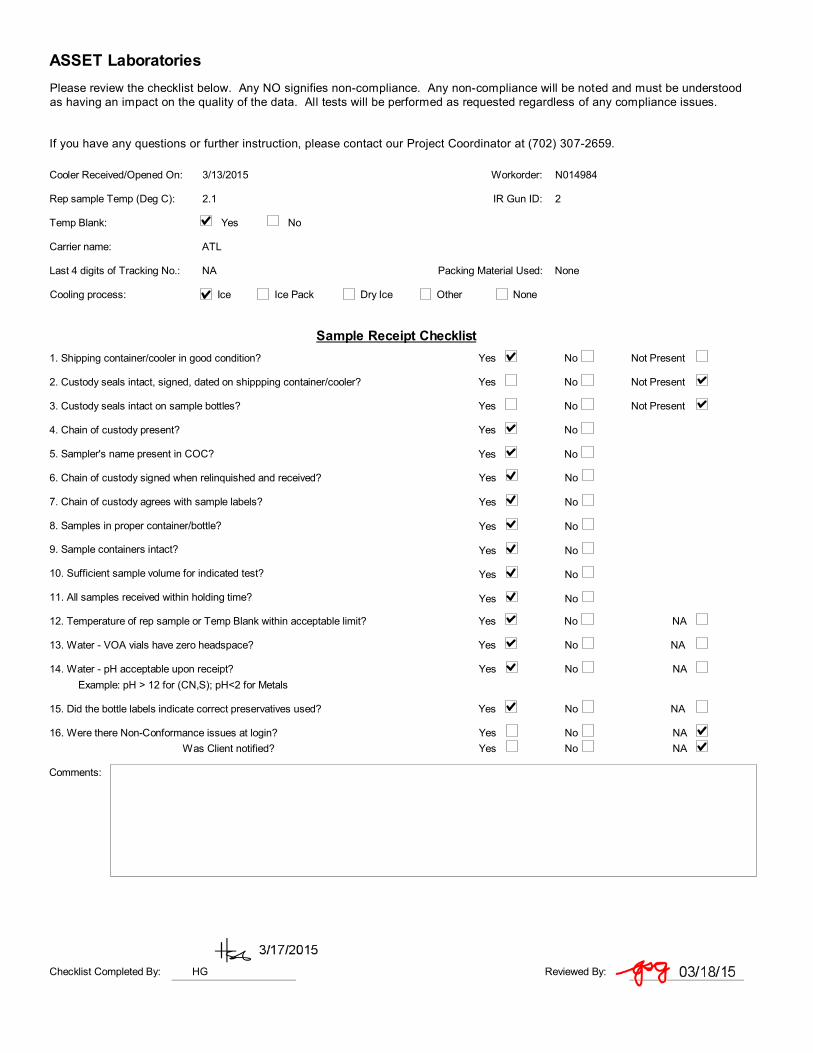
ASSET LaboratoriesPlease review the checklist below. Any NO signifies non-compliance. Any non-compliance will be noted and must be understood as having an impact on the quality of the data. All tests will be performed as requested regardless of any compliance issues.
If you have any questions or further instruction, please contact our Project Coordinator at (702) 307-2659.
Carrier name: ATL
Cooler Received/Opened On: 3/13/2015
Rep sample Temp (Deg C): 2.1 IR Gun ID: 2
Temp Blank: Yes No
Last 4 digits of Tracking No.: NA
Cooling process: Ice Ice Pack Dry Ice Other None
Packing Material Used: None
Workorder: N014984
Sample Receipt Checklist
4. Chain of custody present? Yes No
6. Chain of custody signed when relinquished and received? Yes No
7. Chain of custody agrees with sample labels? Yes No
8. Samples in proper container/bottle? Yes No
9. Sample containers intact? Yes No
10. Sufficient sample volume for indicated test? Yes No
11. All samples received within holding time? Yes No
Yes No NA13. Water - VOA vials have zero headspace?
14. Water - pH acceptable upon receipt? Yes No NAExample: pH > 12 for (CN,S); pH<2 for Metals
1. Shipping container/cooler in good condition? Yes No Not Present
2. Custody seals intact, signed, dated on shippping container/cooler? Yes No Not Present
3. Custody seals intact on sample bottles? Yes No Not Present
5. Sampler's name present in COC? Yes No
12. Temperature of rep sample or Temp Blank within acceptable limit? Yes No NA
Yes No NA15. Did the bottle labels indicate correct preservatives used?
16. Were there Non-Conformance issues at login? Yes No NAWas Client notified? Yes No NA
Comments:
Checklist Completed By: HG Reviewed By:

NEVADA 3151 W. Post Rd., Las Vegas, NV 89118
P: 702.307.2659 F: 702.307.2691
“Serving Clients with Passion and Professionalism”
CALIFORNIA 11060 Artesia Blvd., Ste C, Cerritos, CA 90703
P: 562.219.7435 F: 562.219.7436
April 22, 2015
Cardno ATC
Andrew Stuart
Attention: Andrew Stuart
RE: Maryland Square, Z085000030
Workorder No.: N014984FAX:
TEL: (702) 990-9300
7115 Amigo Street Suite 100
Las Vegas, NV 89119
CA-ELAP No.: 2676
NV Cert. No.: NV-00922
This is an amended report. Please disregard all previous documentation that corresponds to the page(s) enclosed.
Thank you for the opportunity to service the needs of your company.
Please feel free to call me at (702) 307-2659 if I can be of further assistance to your company.
Sincerely,
Glen Gesmundo
QA Manager
Enclosed are the results for sample(s) received on March 13, 2015 by ASSET Laboratories . The sample(s) are tested for the parameters as indicated in the enclosed chain of custody in accordance with the applicable laboratory certifications.
The cover letter is an integral part of this analytical report. This Laboratory Report cannot be reproduced in part or in its entirety without written permission from the client and Advanced Technology Laboratories - Las Vegas.
01 of 31

NEVADA 3151 W. Post Rd., Las Vegas, NV 89118
P: 702.307.2659 F: 702.307.2691
“Serving Clients with Passion and Professionalism”
CALIFORNIA 11060 Artesia Blvd., Ste C, Cerritos, CA 90703
P: 562.219.7435 F: 562.219.7436
Project: Maryland Square, Z085000030
Client Sample ID: MW-5
Collection Date: 3/11/2015 2:05:00 PM
Matrix: GROUNDWATER
CLIENT: Cardno ATC
Lab Order: N014984
Lab ID: N014984-004
ASSET Laboratories Print Date: 22-Apr-15
Analyses Result Qual Units Date AnalyzedDFPQLMDL
ANALYTICAL RESULTS
VOLATILE ORGANIC COMPOUNDS BY GC/MSEPA 8260B
Analyst: QBMRunID: MS5_150316B P15VW045QC Batch: PrepDate:
1,1,1,2-Tetrachloroethane 0.50 µg/L 1ND 0.068 3/17/2015 07:43 AM1,1,1-Trichloroethane 0.50 µg/L 1ND 0.072 3/17/2015 07:43 AM1,1,2,2-Tetrachloroethane 0.50 µg/L 1ND 0.10 3/17/2015 07:43 AM1,1,2-Trichloroethane 0.50 µg/L 1ND 0.042 3/17/2015 07:43 AM1,1-Dichloroethane 0.50 µg/L 1ND 0.054 3/17/2015 07:43 AM1,1-Dichloroethene 0.50 µg/L 1ND 0.16 3/17/2015 07:43 AM1,1-Dichloropropene 0.50 µg/L 1ND 0.073 3/17/2015 07:43 AM1,2,3-Trichlorobenzene 0.50 µg/L 1ND 0.077 3/17/2015 07:43 AM1,2,3-Trichloropropane 0.50 µg/L 1ND 0.071 3/17/2015 07:43 AM1,2,4-Trichlorobenzene 0.50 µg/L 1ND 0.10 3/17/2015 07:43 AM1,2,4-Trimethylbenzene 0.50 µg/L 1ND 0.036 3/17/2015 07:43 AM1,2-Dibromo-3-chloropropane 1.0 µg/L 1ND 0.23 3/17/2015 07:43 AM1,2-Dibromoethane 0.50 µg/L 1ND 0.036 3/17/2015 07:43 AM1,2-Dichlorobenzene 0.50 µg/L 1ND 0.048 3/17/2015 07:43 AM1,2-Dichloroethane 0.50 µg/L 1ND 0.044 3/17/2015 07:43 AM1,2-Dichloropropane 0.50 µg/L 1ND 0.094 3/17/2015 07:43 AM1,3,5-Trimethylbenzene 0.50 µg/L 1ND 0.054 3/17/2015 07:43 AM1,3-Dichlorobenzene 0.50 µg/L 1ND 0.061 3/17/2015 07:43 AM1,3-Dichloropropane 0.50 µg/L 1ND 0.077 3/17/2015 07:43 AM1,4-Dichlorobenzene 0.50 µg/L 1ND 0.078 3/17/2015 07:43 AM2,2-Dichloropropane 0.50 µg/L 1ND 0.061 3/17/2015 07:43 AM2-Butanone 5.0 µg/L 1ND 0.70 3/17/2015 07:43 AM2-Chlorotoluene 0.50 µg/L 1ND 0.054 3/17/2015 07:43 AM4-Chlorotoluene 0.50 µg/L 1ND 0.039 3/17/2015 07:43 AM4-Isopropyltoluene 0.50 µg/L 1ND 0.044 3/17/2015 07:43 AMBenzene 0.50 µg/L 1ND 0.048 3/17/2015 07:43 AMBromobenzene 0.50 µg/L 1ND 0.054 3/17/2015 07:43 AMBromodichloromethane 0.50 µg/L 1ND 0.048 3/17/2015 07:43 AMBromoform 0.50 µg/L 1ND 0.061 3/17/2015 07:43 AMBromomethane 1.0 µg/L 1ND 0.073 3/17/2015 07:43 AMCarbon tetrachloride 0.50 µg/L 1ND 0.057 3/17/2015 07:43 AMChlorobenzene 0.50 µg/L 1ND 0.028 3/17/2015 07:43 AMChloroethane 1.0 µg/L 1ND 0.099 3/17/2015 07:43 AMChloroform 0.50 µg/L 16.5 0.048 3/17/2015 07:43 AMChloromethane 0.50 µg/L 1ND 0.043 3/17/2015 07:43 AMcis-1,2-Dichloroethene 0.50 µg/L 11.2 0.057 3/17/2015 07:43 AM
Qualifiers: B Analyte detected in the associated Method Blank E Value above quantitation range
H Holding times for preparation or analysis exceeded ND Not Detected at the Reporting Limit
S Spike/Surrogate outside of limits due to matrix interference Results are wet unless otherwise specified
DO Surrogate Diluted Out
02 of 31

NEVADA 3151 W. Post Rd., Las Vegas, NV 89118
P: 702.307.2659 F: 702.307.2691
“Serving Clients with Passion and Professionalism”
CALIFORNIA 11060 Artesia Blvd., Ste C, Cerritos, CA 90703
P: 562.219.7435 F: 562.219.7436
Project: Maryland Square, Z085000030
Client Sample ID: MW-5
Collection Date: 3/11/2015 2:05:00 PM
Matrix: GROUNDWATER
CLIENT: Cardno ATC
Lab Order: N014984
Lab ID: N014984-004
ASSET Laboratories Print Date: 22-Apr-15
Analyses Result Qual Units Date AnalyzedDFPQLMDL
ANALYTICAL RESULTS
VOLATILE ORGANIC COMPOUNDS BY GC/MSEPA 8260B
Analyst: QBMRunID: MS5_150316B P15VW045QC Batch: PrepDate:
Dibromochloromethane 0.50 µg/L 1ND 0.057 3/17/2015 07:43 AMDibromomethane 0.50 µg/L 1ND 0.11 3/17/2015 07:43 AMDichlorodifluoromethane 0.50 µg/L 1ND 0.054 3/17/2015 07:43 AMEthylbenzene 0.50 µg/L 1ND 0.036 3/17/2015 07:43 AMFreon-113 0.50 µg/L 1ND 0.15 3/17/2015 07:43 AMHexachlorobutadiene 0.50 µg/L 1ND 0.070 3/17/2015 07:43 AMIsopropylbenzene 0.50 µg/L 1ND 0.041 3/17/2015 07:43 AMm,p-Xylene 1.0 µg/L 1ND 0.14 3/17/2015 07:43 AMMethylene chloride 2.0 µg/L 1ND 0.28 3/17/2015 07:43 AMMTBE 0.50 µg/L 1ND 0.098 3/17/2015 07:43 AMn-Butylbenzene 0.50 µg/L 1ND 0.076 3/17/2015 07:43 AMn-Propylbenzene 0.50 µg/L 1ND 0.049 3/17/2015 07:43 AMNaphthalene 0.50 µg/L 1ND 0.062 3/17/2015 07:43 AMo-Xylene 0.50 µg/L 1ND 0.042 3/17/2015 07:43 AMsec-Butylbenzene 0.50 µg/L 1ND 0.036 3/17/2015 07:43 AMStyrene 0.50 µg/L 1ND 0.040 3/17/2015 07:43 AMtert-Butylbenzene 0.50 µg/L 1ND 0.040 3/17/2015 07:43 AMTetrachloroethene 10 µg/L 20790 2.3 3/18/2015 11:08 PMToluene 0.50 µg/L 1ND 0.025 3/17/2015 07:43 AMtrans-1,2-Dichloroethene 0.50 µg/L 1ND 0.074 3/17/2015 07:43 AMTrichloroethene 0.50 µg/L 13.7 0.074 3/17/2015 07:43 AMTrichlorofluoromethane 0.50 µg/L 1ND 0.034 3/17/2015 07:43 AMVinyl chloride 0.50 µg/L 1ND 0.044 3/17/2015 07:43 AMXylenes, Total 1.5 µg/L 1ND 1.5 3/17/2015 07:43 AM Surr: 1,2-Dichloroethane-d4 78-125 %REC 1102 0 3/17/2015 07:43 AM Surr: 1,2-Dichloroethane-d4 78-125 %REC 2092.6 0 3/18/2015 11:08 PM Surr: 4-Bromofluorobenzene 80-120 %REC 199.0 0 3/17/2015 07:43 AM Surr: 4-Bromofluorobenzene 80-120 %REC 2098.9 0 3/18/2015 11:08 PM Surr: Dibromofluoromethane 80-122 %REC 2098.5 0 3/18/2015 11:08 PM Surr: Dibromofluoromethane 80-122 %REC 1105 0 3/17/2015 07:43 AM Surr: Toluene-d8 80-120 %REC 2099.9 0 3/18/2015 11:08 PM Surr: Toluene-d8 80-120 %REC 1100 0 3/17/2015 07:43 AM
Qualifiers: B Analyte detected in the associated Method Blank E Value above quantitation range
H Holding times for preparation or analysis exceeded ND Not Detected at the Reporting Limit
S Spike/Surrogate outside of limits due to matrix interference Results are wet unless otherwise specified
DO Surrogate Diluted Out
03 of 31

NEVADA 3151 W. Post Rd., Las Vegas, NV 89118
P: 702.307.2659 F: 702.307.2691
“Serving Clients with Passion and Professionalism”
CALIFORNIA 11060 Artesia Blvd., Ste C, Cerritos, CA 90703
P: 562.219.7435 F: 562.219.7436
Project: Maryland Square, Z085000030
Client Sample ID: MW-6
Collection Date: 3/12/2015 2:32:00 PM
Matrix: GROUNDWATER
CLIENT: Cardno ATC
Lab Order: N014984
Lab ID: N014984-005
ASSET Laboratories Print Date: 22-Apr-15
Analyses Result Qual Units Date AnalyzedDFPQLMDL
ANALYTICAL RESULTS
VOLATILE ORGANIC COMPOUNDS BY GC/MSEPA 8260B
Analyst: QBMRunID: MS5_150319A P15VW047QC Batch: PrepDate:
1,1,1,2-Tetrachloroethane 1.0 µg/L 2ND 0.14 3/19/2015 09:20 PM1,1,1-Trichloroethane 1.0 µg/L 2ND 0.14 3/19/2015 09:20 PM1,1,2,2-Tetrachloroethane 1.0 µg/L 2ND 0.20 3/19/2015 09:20 PM1,1,2-Trichloroethane 1.0 µg/L 2ND 0.084 3/19/2015 09:20 PM1,1-Dichloroethane 1.0 µg/L 2ND 0.11 3/19/2015 09:20 PM1,1-Dichloroethene 1.0 µg/L 2ND 0.33 3/19/2015 09:20 PM1,1-Dichloropropene 1.0 µg/L 2ND 0.15 3/19/2015 09:20 PM1,2,3-Trichlorobenzene 1.0 µg/L 2ND 0.15 3/19/2015 09:20 PM1,2,3-Trichloropropane 1.0 µg/L 2ND 0.14 3/19/2015 09:20 PM1,2,4-Trichlorobenzene 1.0 µg/L 2ND 0.21 3/19/2015 09:20 PM1,2,4-Trimethylbenzene 1.0 µg/L 2ND 0.072 3/19/2015 09:20 PM1,2-Dibromo-3-chloropropane 2.0 µg/L 2ND 0.47 3/19/2015 09:20 PM1,2-Dibromoethane 1.0 µg/L 2ND 0.072 3/19/2015 09:20 PM1,2-Dichlorobenzene 1.0 µg/L 2ND 0.096 3/19/2015 09:20 PM1,2-Dichloroethane 1.0 µg/L 2ND 0.088 3/19/2015 09:20 PM1,2-Dichloropropane 1.0 µg/L 2ND 0.19 3/19/2015 09:20 PM1,3,5-Trimethylbenzene 1.0 µg/L 2ND 0.11 3/19/2015 09:20 PM1,3-Dichlorobenzene 1.0 µg/L 2ND 0.12 3/19/2015 09:20 PM1,3-Dichloropropane 1.0 µg/L 2ND 0.15 3/19/2015 09:20 PM1,4-Dichlorobenzene 1.0 µg/L 2ND 0.16 3/19/2015 09:20 PM2,2-Dichloropropane 1.0 µg/L 2ND 0.12 3/19/2015 09:20 PM2-Butanone 10 µg/L 2ND 1.4 3/19/2015 09:20 PM2-Chlorotoluene 1.0 µg/L 2ND 0.11 3/19/2015 09:20 PM4-Chlorotoluene 1.0 µg/L 2ND 0.078 3/19/2015 09:20 PM4-Isopropyltoluene 1.0 µg/L 2ND 0.088 3/19/2015 09:20 PMBenzene 1.0 µg/L 2ND 0.096 3/19/2015 09:20 PMBromobenzene 1.0 µg/L 2ND 0.11 3/19/2015 09:20 PMBromodichloromethane 1.0 µg/L 2ND 0.096 3/19/2015 09:20 PMBromoform 1.0 µg/L 2ND 0.12 3/19/2015 09:20 PMBromomethane 2.0 µg/L 2ND 0.15 3/19/2015 09:20 PMCarbon tetrachloride 1.0 µg/L 2ND 0.11 3/19/2015 09:20 PMChlorobenzene 1.0 µg/L 2ND 0.056 3/19/2015 09:20 PMChloroethane 2.0 µg/L 2ND 0.20 3/19/2015 09:20 PMChloroform 1.0 µg/L 24.3 0.096 3/19/2015 09:20 PMChloromethane 1.0 µg/L 2ND 0.086 3/19/2015 09:20 PMcis-1,2-Dichloroethene 1.0 µg/L 22.3 0.11 3/19/2015 09:20 PM
Qualifiers: B Analyte detected in the associated Method Blank E Value above quantitation range
H Holding times for preparation or analysis exceeded ND Not Detected at the Reporting Limit
S Spike/Surrogate outside of limits due to matrix interference Results are wet unless otherwise specified
DO Surrogate Diluted Out
04 of 31

NEVADA 3151 W. Post Rd., Las Vegas, NV 89118
P: 702.307.2659 F: 702.307.2691
“Serving Clients with Passion and Professionalism”
CALIFORNIA 11060 Artesia Blvd., Ste C, Cerritos, CA 90703
P: 562.219.7435 F: 562.219.7436
Project: Maryland Square, Z085000030
Client Sample ID: MW-6
Collection Date: 3/12/2015 2:32:00 PM
Matrix: GROUNDWATER
CLIENT: Cardno ATC
Lab Order: N014984
Lab ID: N014984-005
ASSET Laboratories Print Date: 22-Apr-15
Analyses Result Qual Units Date AnalyzedDFPQLMDL
ANALYTICAL RESULTS
VOLATILE ORGANIC COMPOUNDS BY GC/MSEPA 8260B
Analyst: QBMRunID: MS5_150319A P15VW047QC Batch: PrepDate:
Dibromochloromethane 1.0 µg/L 2ND 0.11 3/19/2015 09:20 PMDibromomethane 1.0 µg/L 2ND 0.22 3/19/2015 09:20 PMDichlorodifluoromethane 1.0 µg/L 2ND 0.11 3/19/2015 09:20 PMEthylbenzene 1.0 µg/L 2ND 0.072 3/19/2015 09:20 PMFreon-113 1.0 µg/L 2ND 0.31 3/19/2015 09:20 PMHexachlorobutadiene 1.0 µg/L 2ND 0.14 3/19/2015 09:20 PMIsopropylbenzene 1.0 µg/L 2ND 0.082 3/19/2015 09:20 PMm,p-Xylene 2.0 µg/L 2ND 0.27 3/19/2015 09:20 PMMethylene chloride 4.0 µg/L 2ND 0.56 3/19/2015 09:20 PMMTBE 1.0 µg/L 2ND 0.20 3/19/2015 09:20 PMn-Butylbenzene 1.0 µg/L 2ND 0.15 3/19/2015 09:20 PMn-Propylbenzene 1.0 µg/L 2ND 0.098 3/19/2015 09:20 PMNaphthalene 1.0 µg/L 2ND 0.12 3/19/2015 09:20 PMo-Xylene 1.0 µg/L 2ND 0.084 3/19/2015 09:20 PMsec-Butylbenzene 1.0 µg/L 2ND 0.072 3/19/2015 09:20 PMStyrene 1.0 µg/L 2ND 0.080 3/19/2015 09:20 PMtert-Butylbenzene 1.0 µg/L 2ND 0.080 3/19/2015 09:20 PMTetrachloroethene 50 µg/L 1003300 12 3/18/2015 11:33 PMToluene 1.0 µg/L 2ND 0.050 3/19/2015 09:20 PMtrans-1,2-Dichloroethene 1.0 µg/L 2ND 0.15 3/19/2015 09:20 PMTrichloroethene 1.0 µg/L 29.3 0.15 3/19/2015 09:20 PMTrichlorofluoromethane 1.0 µg/L 2ND 0.068 3/19/2015 09:20 PMVinyl chloride 1.0 µg/L 2ND 0.088 3/19/2015 09:20 PMXylenes, Total 3.0 µg/L 2ND 3.0 3/19/2015 09:20 PM Surr: 1,2-Dichloroethane-d4 78-125 %REC 10094.2 0 3/18/2015 11:33 PM Surr: 1,2-Dichloroethane-d4 78-125 %REC 299.9 0 3/19/2015 09:20 PM Surr: 4-Bromofluorobenzene 80-120 %REC 2100 0 3/19/2015 09:20 PM Surr: 4-Bromofluorobenzene 80-120 %REC 100101 0 3/18/2015 11:33 PM Surr: Dibromofluoromethane 80-122 %REC 2103 0 3/19/2015 09:20 PM Surr: Dibromofluoromethane 80-122 %REC 10097.8 0 3/18/2015 11:33 PM Surr: Toluene-d8 80-120 %REC 2101 0 3/19/2015 09:20 PM Surr: Toluene-d8 80-120 %REC 10099.8 0 3/18/2015 11:33 PM
Qualifiers: B Analyte detected in the associated Method Blank E Value above quantitation range
H Holding times for preparation or analysis exceeded ND Not Detected at the Reporting Limit
S Spike/Surrogate outside of limits due to matrix interference Results are wet unless otherwise specified
DO Surrogate Diluted Out
05 of 31
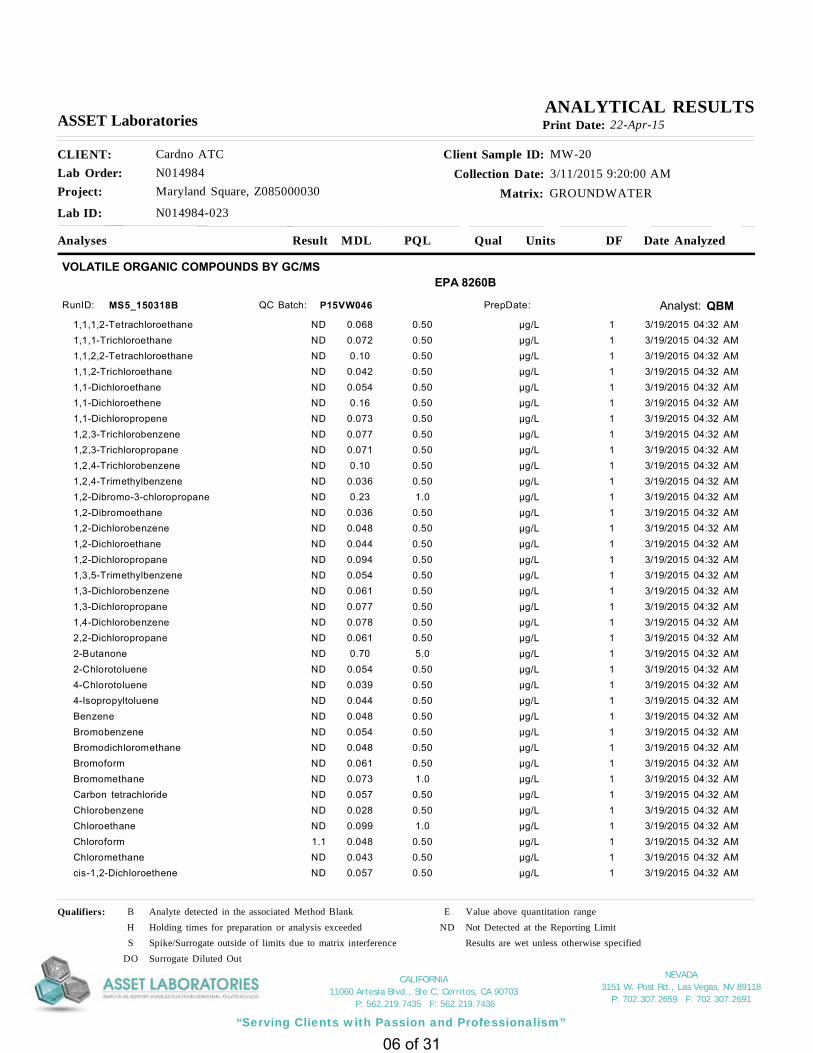
NEVADA 3151 W. Post Rd., Las Vegas, NV 89118
P: 702.307.2659 F: 702.307.2691
“Serving Clients with Passion and Professionalism”
CALIFORNIA 11060 Artesia Blvd., Ste C, Cerritos, CA 90703
P: 562.219.7435 F: 562.219.7436
Project: Maryland Square, Z085000030
Client Sample ID: MW-20
Collection Date: 3/11/2015 9:20:00 AM
Matrix: GROUNDWATER
CLIENT: Cardno ATC
Lab Order: N014984
Lab ID: N014984-023
ASSET Laboratories Print Date: 22-Apr-15
Analyses Result Qual Units Date AnalyzedDFPQLMDL
ANALYTICAL RESULTS
VOLATILE ORGANIC COMPOUNDS BY GC/MSEPA 8260B
Analyst: QBMRunID: MS5_150318B P15VW046QC Batch: PrepDate:
1,1,1,2-Tetrachloroethane 0.50 µg/L 1ND 0.068 3/19/2015 04:32 AM1,1,1-Trichloroethane 0.50 µg/L 1ND 0.072 3/19/2015 04:32 AM1,1,2,2-Tetrachloroethane 0.50 µg/L 1ND 0.10 3/19/2015 04:32 AM1,1,2-Trichloroethane 0.50 µg/L 1ND 0.042 3/19/2015 04:32 AM1,1-Dichloroethane 0.50 µg/L 1ND 0.054 3/19/2015 04:32 AM1,1-Dichloroethene 0.50 µg/L 1ND 0.16 3/19/2015 04:32 AM1,1-Dichloropropene 0.50 µg/L 1ND 0.073 3/19/2015 04:32 AM1,2,3-Trichlorobenzene 0.50 µg/L 1ND 0.077 3/19/2015 04:32 AM1,2,3-Trichloropropane 0.50 µg/L 1ND 0.071 3/19/2015 04:32 AM1,2,4-Trichlorobenzene 0.50 µg/L 1ND 0.10 3/19/2015 04:32 AM1,2,4-Trimethylbenzene 0.50 µg/L 1ND 0.036 3/19/2015 04:32 AM1,2-Dibromo-3-chloropropane 1.0 µg/L 1ND 0.23 3/19/2015 04:32 AM1,2-Dibromoethane 0.50 µg/L 1ND 0.036 3/19/2015 04:32 AM1,2-Dichlorobenzene 0.50 µg/L 1ND 0.048 3/19/2015 04:32 AM1,2-Dichloroethane 0.50 µg/L 1ND 0.044 3/19/2015 04:32 AM1,2-Dichloropropane 0.50 µg/L 1ND 0.094 3/19/2015 04:32 AM1,3,5-Trimethylbenzene 0.50 µg/L 1ND 0.054 3/19/2015 04:32 AM1,3-Dichlorobenzene 0.50 µg/L 1ND 0.061 3/19/2015 04:32 AM1,3-Dichloropropane 0.50 µg/L 1ND 0.077 3/19/2015 04:32 AM1,4-Dichlorobenzene 0.50 µg/L 1ND 0.078 3/19/2015 04:32 AM2,2-Dichloropropane 0.50 µg/L 1ND 0.061 3/19/2015 04:32 AM2-Butanone 5.0 µg/L 1ND 0.70 3/19/2015 04:32 AM2-Chlorotoluene 0.50 µg/L 1ND 0.054 3/19/2015 04:32 AM4-Chlorotoluene 0.50 µg/L 1ND 0.039 3/19/2015 04:32 AM4-Isopropyltoluene 0.50 µg/L 1ND 0.044 3/19/2015 04:32 AMBenzene 0.50 µg/L 1ND 0.048 3/19/2015 04:32 AMBromobenzene 0.50 µg/L 1ND 0.054 3/19/2015 04:32 AMBromodichloromethane 0.50 µg/L 1ND 0.048 3/19/2015 04:32 AMBromoform 0.50 µg/L 1ND 0.061 3/19/2015 04:32 AMBromomethane 1.0 µg/L 1ND 0.073 3/19/2015 04:32 AMCarbon tetrachloride 0.50 µg/L 1ND 0.057 3/19/2015 04:32 AMChlorobenzene 0.50 µg/L 1ND 0.028 3/19/2015 04:32 AMChloroethane 1.0 µg/L 1ND 0.099 3/19/2015 04:32 AMChloroform 0.50 µg/L 11.1 0.048 3/19/2015 04:32 AMChloromethane 0.50 µg/L 1ND 0.043 3/19/2015 04:32 AMcis-1,2-Dichloroethene 0.50 µg/L 1ND 0.057 3/19/2015 04:32 AM
Qualifiers: B Analyte detected in the associated Method Blank E Value above quantitation range
H Holding times for preparation or analysis exceeded ND Not Detected at the Reporting Limit
S Spike/Surrogate outside of limits due to matrix interference Results are wet unless otherwise specified
DO Surrogate Diluted Out
06 of 31

NEVADA 3151 W. Post Rd., Las Vegas, NV 89118
P: 702.307.2659 F: 702.307.2691
“Serving Clients with Passion and Professionalism”
CALIFORNIA 11060 Artesia Blvd., Ste C, Cerritos, CA 90703
P: 562.219.7435 F: 562.219.7436
Project: Maryland Square, Z085000030
Client Sample ID: MW-20
Collection Date: 3/11/2015 9:20:00 AM
Matrix: GROUNDWATER
CLIENT: Cardno ATC
Lab Order: N014984
Lab ID: N014984-023
ASSET Laboratories Print Date: 22-Apr-15
Analyses Result Qual Units Date AnalyzedDFPQLMDL
ANALYTICAL RESULTS
VOLATILE ORGANIC COMPOUNDS BY GC/MSEPA 8260B
Analyst: QBMRunID: MS5_150318B P15VW046QC Batch: PrepDate:
Dibromochloromethane 0.50 µg/L 1ND 0.057 3/19/2015 04:32 AMDibromomethane 0.50 µg/L 1ND 0.11 3/19/2015 04:32 AMDichlorodifluoromethane 0.50 µg/L 1ND 0.054 3/19/2015 04:32 AMEthylbenzene 0.50 µg/L 1ND 0.036 3/19/2015 04:32 AMFreon-113 0.50 µg/L 1ND 0.15 3/19/2015 04:32 AMHexachlorobutadiene 0.50 µg/L 1ND 0.070 3/19/2015 04:32 AMIsopropylbenzene 0.50 µg/L 1ND 0.041 3/19/2015 04:32 AMm,p-Xylene 1.0 µg/L 1ND 0.14 3/19/2015 04:32 AMMethylene chloride 2.0 µg/L 1ND 0.28 3/19/2015 04:32 AMMTBE 0.50 µg/L 1ND 0.098 3/19/2015 04:32 AMn-Butylbenzene 0.50 µg/L 1ND 0.076 3/19/2015 04:32 AMn-Propylbenzene 0.50 µg/L 1ND 0.049 3/19/2015 04:32 AMNaphthalene 0.50 µg/L 1ND 0.062 3/19/2015 04:32 AMo-Xylene 0.50 µg/L 1ND 0.042 3/19/2015 04:32 AMsec-Butylbenzene 0.50 µg/L 1ND 0.036 3/19/2015 04:32 AMStyrene 0.50 µg/L 1ND 0.040 3/19/2015 04:32 AMtert-Butylbenzene 0.50 µg/L 1ND 0.040 3/19/2015 04:32 AMTetrachloroethene 10 µg/L 20680 2.3 3/19/2015 05:38 PMToluene 0.50 µg/L 1ND 0.025 3/19/2015 04:32 AMtrans-1,2-Dichloroethene 0.50 µg/L 1ND 0.074 3/19/2015 04:32 AMTrichloroethene 0.50 µg/L 12.3 0.074 3/19/2015 04:32 AMTrichlorofluoromethane 0.50 µg/L 1ND 0.034 3/19/2015 04:32 AMVinyl chloride 0.50 µg/L 1ND 0.044 3/19/2015 04:32 AMXylenes, Total 1.5 µg/L 1ND 1.5 3/19/2015 04:32 AM Surr: 1,2-Dichloroethane-d4 78-125 %REC 198.2 0 3/19/2015 04:32 AM Surr: 1,2-Dichloroethane-d4 78-125 %REC 2096.7 0 3/19/2015 05:38 PM Surr: 4-Bromofluorobenzene 80-120 %REC 2098.6 0 3/19/2015 05:38 PM Surr: 4-Bromofluorobenzene 80-120 %REC 197.6 0 3/19/2015 04:32 AM Surr: Dibromofluoromethane 80-122 %REC 199.3 0 3/19/2015 04:32 AM Surr: Dibromofluoromethane 80-122 %REC 20101 0 3/19/2015 05:38 PM Surr: Toluene-d8 80-120 %REC 199.0 0 3/19/2015 04:32 AM Surr: Toluene-d8 80-120 %REC 20102 0 3/19/2015 05:38 PM
Qualifiers: B Analyte detected in the associated Method Blank E Value above quantitation range
H Holding times for preparation or analysis exceeded ND Not Detected at the Reporting Limit
S Spike/Surrogate outside of limits due to matrix interference Results are wet unless otherwise specified
DO Surrogate Diluted Out
07 of 31

NEVADA 3151 W. Post Rd., Las Vegas, NV 89118
P: 702.307.2659 F: 702.307.2691
“Serving Clients with Passion and Professionalism”
CALIFORNIA 11060 Artesia Blvd., Ste C, Cerritos, CA 90703
P: 562.219.7435 F: 562.219.7436
22-Apr-15Date:ASSET Laboratories
Project: Maryland Square, Z085000030
CLIENT: Cardno ATC
Work Order: N014984ANALYTICAL QC SUMMARY REPORT
TestCode: 8260WATERP
Sample ID: P150316LCS2
Batch ID: P15VW045 TestNo: EPA 8260B Analysis Date: 3/16/2015
Prep Date:
Analyte Result SPK value SPK Ref Val %REC RPD Ref Val %RPDLowLimit HighLimit RPDLimit Qual
Units: µg/L
PQL
Client ID: LCSW
RunNo: 99470
SeqNo: 1954334
LCSSampType: TestCode: 8260WATERP
1,1,1,2-Tetrachloroethane 20.00 109 80 1210.50 021.8001,1,1-Trichloroethane 20.00 107 77 1220.50 021.4501,1,2,2-Tetrachloroethane 20.00 84.4 77 1230.50 016.8701,1,2-Trichloroethane 20.00 98.2 87 1200.50 019.6301,1-Dichloroethane 20.00 90.4 72 1270.50 018.0901,1-Dichloroethene 20.00 108 71 1270.50 021.6601,1-Dichloropropene 20.00 104 87 1200.50 020.7101,2,3-Trichlorobenzene 20.00 104 77 1240.50 020.8201,2,3-Trichloropropane 20.00 84.6 77 1200.50 016.9301,2,4-Trichlorobenzene 20.00 103 76 1220.50 020.6001,2,4-Trimethylbenzene 20.00 96.0 85 1200.50 019.2001,2-Dibromo-3-chloropropane 20.00 102 67 1251.0 020.3501,2-Dibromoethane 20.00 106 80 1200.50 021.2901,2-Dichlorobenzene 20.00 97.1 80 1200.50 019.4201,2-Dichloroethane 20.00 102 80 1200.50 020.3001,2-Dichloropropane 20.00 90.7 80 1200.50 018.1301,3,5-Trimethylbenzene 20.00 97.3 80 1200.50 019.4501,3-Dichlorobenzene 20.00 98.3 80 1200.50 019.6601,3-Dichloropropane 20.00 91.8 80 1200.50 018.3501,4-Dichlorobenzene 20.00 97.4 80 1200.50 019.4702,2-Dichloropropane 20.00 100 53 1420.50 020.0602-Butanone 200.0 76.7 23 1755.0 0153.4102-Chlorotoluene 20.00 91.5 80 1200.50 018.3004-Chlorotoluene 20.00 92.8 80 1200.50 018.5604-Isopropyltoluene 20.00 99.0 80 1200.50 019.790Benzene 20.00 97.6 80 1200.50 019.520Bromobenzene 20.00 98.6 80 1200.50 019.730Bromodichloromethane 20.00 104 80 1200.50 020.730Bromoform 20.00 112 72 1330.50 022.410
Qualifiers:
B Analyte detected in the associated Method Blank E Value above quantitation range H Holding times for preparation or analysis exceeded
ND Not Detected at the Reporting Limit R RPD outside accepted recovery limits S Spike/Surrogate outside of limits due to matrix interference
DO Surrogate Diluted Out Calculations are based on raw values
08 of 31

NEVADA 3151 W. Post Rd., Las Vegas, NV 89118
P: 702.307.2659 F: 702.307.2691
“Serving Clients with Passion and Professionalism”
CALIFORNIA 11060 Artesia Blvd., Ste C, Cerritos, CA 90703
P: 562.219.7435 F: 562.219.7436
Project: Maryland Square, Z085000030
CLIENT: Cardno ATC
Work Order: N014984ANALYTICAL QC SUMMARY REPORT
TestCode: 8260WATERP
Sample ID: P150316LCS2
Batch ID: P15VW045 TestNo: EPA 8260B Analysis Date: 3/16/2015
Prep Date:
Analyte Result SPK value SPK Ref Val %REC RPD Ref Val %RPDLowLimit HighLimit RPDLimit Qual
Units: µg/L
PQL
Client ID: LCSW
RunNo: 99470
SeqNo: 1954334
LCSSampType: TestCode: 8260WATERP
Bromomethane 20.00 49.0 19 1781.0 09.800Carbon tetrachloride 20.00 130 72 1310.50 025.900Chlorobenzene 20.00 96.8 80 1200.50 019.360Chloroethane 20.00 136 66 1401.0 027.300Chloroform 20.00 94.8 77 1200.50 018.960Chloromethane 20.00 70.8 47 1540.50 014.160cis-1,2-Dichloroethene 20.00 96.0 80 1200.50 019.200Dibromochloromethane 20.00 111 80 1220.50 022.190Dibromomethane 20.00 101 80 1200.50 020.290Dichlorodifluoromethane 20.00 114 53 1660.50 022.740Ethylbenzene 20.00 94.5 80 1200.50 018.900Freon-113 20.00 113 71 1290.50 022.540Hexachlorobutadiene 20.00 112 79 1230.50 022.390Isopropylbenzene 20.00 95.1 80 1200.50 019.020m,p-Xylene 40.00 99.5 80 1201.0 039.800Methylene chloride 20.00 85.4 71 1242.0 017.090MTBE 20.00 94.1 77 1200.50 018.810n-Butylbenzene 20.00 91.6 80 1270.50 018.310n-Propylbenzene 20.00 92.0 80 1220.50 018.390Naphthalene 20.00 83.6 63 1310.50 016.720o-Xylene 20.00 100 80 1200.50 020.020sec-Butylbenzene 20.00 94.8 80 1200.50 018.950Styrene 20.00 102 80 1200.50 020.300tert-Butylbenzene 20.00 99.3 80 1200.50 019.860Tetrachloroethene 20.00 108 80 1200.50 021.680Toluene 20.00 101 80 1200.50 020.200trans-1,2-Dichloroethene 20.00 94.6 78 1260.50 018.920Trichloroethene 20.00 107 80 1200.50 021.450Trichlorofluoromethane 20.00 123 67 1490.50 024.640Vinyl chloride 20.00 94.5 70 1350.50 018.900
Qualifiers:
B Analyte detected in the associated Method Blank E Value above quantitation range H Holding times for preparation or analysis exceeded
ND Not Detected at the Reporting Limit R RPD outside accepted recovery limits S Spike/Surrogate outside of limits due to matrix interference
DO Surrogate Diluted Out Calculations are based on raw values
09 of 31

NEVADA 3151 W. Post Rd., Las Vegas, NV 89118
P: 702.307.2659 F: 702.307.2691
“Serving Clients with Passion and Professionalism”
CALIFORNIA 11060 Artesia Blvd., Ste C, Cerritos, CA 90703
P: 562.219.7435 F: 562.219.7436
Project: Maryland Square, Z085000030
CLIENT: Cardno ATC
Work Order: N014984ANALYTICAL QC SUMMARY REPORT
TestCode: 8260WATERP
Sample ID: P150316LCS2
Batch ID: P15VW045 TestNo: EPA 8260B Analysis Date: 3/16/2015
Prep Date:
Analyte Result SPK value SPK Ref Val %REC RPD Ref Val %RPDLowLimit HighLimit RPDLimit Qual
Units: µg/L
PQL
Client ID: LCSW
RunNo: 99470
SeqNo: 1954334
LCSSampType: TestCode: 8260WATERP
Xylenes, Total 60.00 99.7 70 1301.5 059.820 Surr: 1,2-Dichloroethane-d4 25.00 93.0 78 12523.250 Surr: 4-Bromofluorobenzene 25.00 103 80 12025.730 Surr: Dibromofluoromethane 25.00 98.4 80 12224.590 Surr: Toluene-d8 25.00 102 80 12025.440
Sample ID: P150316LCSD2
Batch ID: P15VW045 TestNo: EPA 8260B Analysis Date: 3/16/2015
Prep Date:
Analyte Result SPK value SPK Ref Val %REC RPD Ref Val %RPDLowLimit HighLimit RPDLimit Qual
Units: µg/L
PQL
Client ID: LCSS02
RunNo: 99470
SeqNo: 1954335
LCSDSampType: TestCode: 8260WATERP
1,1,1,2-Tetrachloroethane 20.00 112 80 121 200.50 0 21.80 2.4022.3301,1,1-Trichloroethane 20.00 106 77 122 200.50 0 21.45 1.4121.1501,1,2,2-Tetrachloroethane 20.00 85.4 77 123 200.50 0 16.87 1.3017.0901,1,2-Trichloroethane 20.00 99.7 87 120 200.50 0 19.63 1.5719.9401,1-Dichloroethane 20.00 92.0 72 127 200.50 0 18.09 1.7018.4001,1-Dichloroethene 20.00 109 71 127 200.50 0 21.66 0.46121.7601,1-Dichloropropene 20.00 103 87 120 200.50 0 20.71 0.82420.5401,2,3-Trichlorobenzene 20.00 102 77 124 200.50 0 20.82 1.7020.4701,2,3-Trichloropropane 20.00 82.5 77 120 200.50 0 16.93 2.6316.4901,2,4-Trichlorobenzene 20.00 104 76 122 200.50 0 20.60 0.67720.7401,2,4-Trimethylbenzene 20.00 96.0 85 120 200.50 0 19.20 0.052119.2101,2-Dibromo-3-chloropropane 20.00 102 67 125 201.0 0 20.35 0.44120.4401,2-Dibromoethane 20.00 109 80 120 200.50 0 21.29 2.5021.8301,2-Dichlorobenzene 20.00 95.4 80 120 200.50 0 19.42 1.7719.0801,2-Dichloroethane 20.00 104 80 120 200.50 0 20.30 2.0520.7201,2-Dichloropropane 20.00 92.1 80 120 200.50 0 18.13 1.5918.4201,3,5-Trimethylbenzene 20.00 95.2 80 120 200.50 0 19.45 2.1319.0401,3-Dichlorobenzene 20.00 96.6 80 120 200.50 0 19.66 1.8019.3101,3-Dichloropropane 20.00 92.6 80 120 200.50 0 18.35 0.86818.5101,4-Dichlorobenzene 20.00 96.3 80 120 200.50 0 19.47 1.0819.260
Qualifiers:
B Analyte detected in the associated Method Blank E Value above quantitation range H Holding times for preparation or analysis exceeded
ND Not Detected at the Reporting Limit R RPD outside accepted recovery limits S Spike/Surrogate outside of limits due to matrix interference
DO Surrogate Diluted Out Calculations are based on raw values
10 of 31

NEVADA 3151 W. Post Rd., Las Vegas, NV 89118
P: 702.307.2659 F: 702.307.2691
“Serving Clients with Passion and Professionalism”
CALIFORNIA 11060 Artesia Blvd., Ste C, Cerritos, CA 90703
P: 562.219.7435 F: 562.219.7436
Project: Maryland Square, Z085000030
CLIENT: Cardno ATC
Work Order: N014984ANALYTICAL QC SUMMARY REPORT
TestCode: 8260WATERP
Sample ID: P150316LCSD2
Batch ID: P15VW045 TestNo: EPA 8260B Analysis Date: 3/16/2015
Prep Date:
Analyte Result SPK value SPK Ref Val %REC RPD Ref Val %RPDLowLimit HighLimit RPDLimit Qual
Units: µg/L
PQL
Client ID: LCSS02
RunNo: 99470
SeqNo: 1954335
LCSDSampType: TestCode: 8260WATERP
2,2-Dichloropropane 20.00 97.6 53 142 200.50 0 20.06 2.7819.5102-Butanone 200.0 82.4 23 175 205.0 0 153.4 7.15164.7902-Chlorotoluene 20.00 91.5 80 120 200.50 0 18.30 018.3004-Chlorotoluene 20.00 90.4 80 120 200.50 0 18.56 2.6218.0804-Isopropyltoluene 20.00 98.6 80 120 200.50 0 19.79 0.35419.720Benzene 20.00 98.4 80 120 200.50 0 19.52 0.81619.680Bromobenzene 20.00 99.2 80 120 200.50 0 19.73 0.55619.840Bromodichloromethane 20.00 108 80 120 200.50 0 20.73 3.8821.550Bromoform 20.00 117 72 133 200.50 0 22.41 4.5423.450Bromomethane 20.00 54.4 19 178 201.0 0 9.800 10.510.890Carbon tetrachloride 20.00 131 72 131 200.50 0 25.90 0.76926.100Chlorobenzene 20.00 97.8 80 120 200.50 0 19.36 1.0319.560Chloroethane 20.00 132 66 140 201.0 0 27.30 3.5026.360Chloroform 20.00 95.3 77 120 200.50 0 18.96 0.52619.060Chloromethane 20.00 71.2 47 154 200.50 0 14.16 0.49314.230cis-1,2-Dichloroethene 20.00 93.3 80 120 200.50 0 19.20 2.8518.660Dibromochloromethane 20.00 114 80 122 200.50 0 22.19 2.4522.740Dibromomethane 20.00 104 80 120 200.50 0 20.29 2.4820.800Dichlorodifluoromethane 20.00 114 53 166 200.50 0 22.74 0.39522.830Ethylbenzene 20.00 96.1 80 120 200.50 0 18.90 1.6819.220Freon-113 20.00 114 71 129 200.50 0 22.54 1.1022.790Hexachlorobutadiene 20.00 109 79 123 200.50 0 22.39 2.3521.870Isopropylbenzene 20.00 95.2 80 120 200.50 0 19.02 0.10519.040m,p-Xylene 40.00 101 80 120 201.0 0 39.80 1.5040.400Methylene chloride 20.00 85.9 71 124 202.0 0 17.09 0.52517.180MTBE 20.00 94.2 77 120 200.50 0 18.81 0.15918.840n-Butylbenzene 20.00 91.0 80 127 200.50 0 18.31 0.60318.200n-Propylbenzene 20.00 90.4 80 122 200.50 0 18.39 1.7618.070Naphthalene 20.00 84.8 63 131 200.50 0 16.72 1.4816.970o-Xylene 20.00 101 80 120 200.50 0 20.02 0.54820.130
Qualifiers:
B Analyte detected in the associated Method Blank E Value above quantitation range H Holding times for preparation or analysis exceeded
ND Not Detected at the Reporting Limit R RPD outside accepted recovery limits S Spike/Surrogate outside of limits due to matrix interference
DO Surrogate Diluted Out Calculations are based on raw values
11 of 31
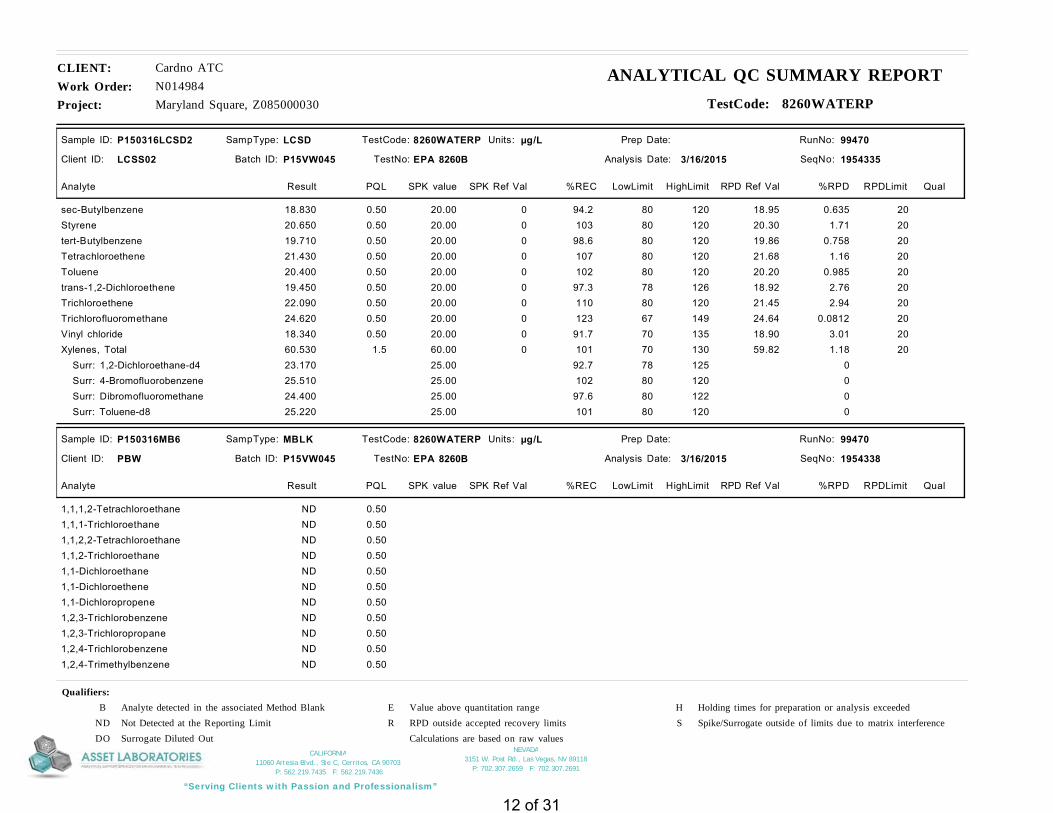
NEVADA 3151 W. Post Rd., Las Vegas, NV 89118
P: 702.307.2659 F: 702.307.2691
“Serving Clients with Passion and Professionalism”
CALIFORNIA 11060 Artesia Blvd., Ste C, Cerritos, CA 90703
P: 562.219.7435 F: 562.219.7436
Project: Maryland Square, Z085000030
CLIENT: Cardno ATC
Work Order: N014984ANALYTICAL QC SUMMARY REPORT
TestCode: 8260WATERP
Sample ID: P150316LCSD2
Batch ID: P15VW045 TestNo: EPA 8260B Analysis Date: 3/16/2015
Prep Date:
Analyte Result SPK value SPK Ref Val %REC RPD Ref Val %RPDLowLimit HighLimit RPDLimit Qual
Units: µg/L
PQL
Client ID: LCSS02
RunNo: 99470
SeqNo: 1954335
LCSDSampType: TestCode: 8260WATERP
sec-Butylbenzene 20.00 94.2 80 120 200.50 0 18.95 0.63518.830Styrene 20.00 103 80 120 200.50 0 20.30 1.7120.650tert-Butylbenzene 20.00 98.6 80 120 200.50 0 19.86 0.75819.710Tetrachloroethene 20.00 107 80 120 200.50 0 21.68 1.1621.430Toluene 20.00 102 80 120 200.50 0 20.20 0.98520.400trans-1,2-Dichloroethene 20.00 97.3 78 126 200.50 0 18.92 2.7619.450Trichloroethene 20.00 110 80 120 200.50 0 21.45 2.9422.090Trichlorofluoromethane 20.00 123 67 149 200.50 0 24.64 0.081224.620Vinyl chloride 20.00 91.7 70 135 200.50 0 18.90 3.0118.340Xylenes, Total 60.00 101 70 130 201.5 0 59.82 1.1860.530 Surr: 1,2-Dichloroethane-d4 25.00 92.7 78 125 023.170 Surr: 4-Bromofluorobenzene 25.00 102 80 120 025.510 Surr: Dibromofluoromethane 25.00 97.6 80 122 024.400 Surr: Toluene-d8 25.00 101 80 120 025.220
Sample ID: P150316MB6
Batch ID: P15VW045 TestNo: EPA 8260B Analysis Date: 3/16/2015
Prep Date:
Analyte Result SPK value SPK Ref Val %REC RPD Ref Val %RPDLowLimit HighLimit RPDLimit Qual
Units: µg/L
PQL
Client ID: PBW
RunNo: 99470
SeqNo: 1954338
MBLKSampType: TestCode: 8260WATERP
1,1,1,2-Tetrachloroethane 0.50ND1,1,1-Trichloroethane 0.50ND1,1,2,2-Tetrachloroethane 0.50ND1,1,2-Trichloroethane 0.50ND1,1-Dichloroethane 0.50ND1,1-Dichloroethene 0.50ND1,1-Dichloropropene 0.50ND1,2,3-Trichlorobenzene 0.50ND1,2,3-Trichloropropane 0.50ND1,2,4-Trichlorobenzene 0.50ND1,2,4-Trimethylbenzene 0.50ND
Qualifiers:
B Analyte detected in the associated Method Blank E Value above quantitation range H Holding times for preparation or analysis exceeded
ND Not Detected at the Reporting Limit R RPD outside accepted recovery limits S Spike/Surrogate outside of limits due to matrix interference
DO Surrogate Diluted Out Calculations are based on raw values
12 of 31

NEVADA 3151 W. Post Rd., Las Vegas, NV 89118
P: 702.307.2659 F: 702.307.2691
“Serving Clients with Passion and Professionalism”
CALIFORNIA 11060 Artesia Blvd., Ste C, Cerritos, CA 90703
P: 562.219.7435 F: 562.219.7436
Project: Maryland Square, Z085000030
CLIENT: Cardno ATC
Work Order: N014984ANALYTICAL QC SUMMARY REPORT
TestCode: 8260WATERP
Sample ID: P150316MB6
Batch ID: P15VW045 TestNo: EPA 8260B Analysis Date: 3/16/2015
Prep Date:
Analyte Result SPK value SPK Ref Val %REC RPD Ref Val %RPDLowLimit HighLimit RPDLimit Qual
Units: µg/L
PQL
Client ID: PBW
RunNo: 99470
SeqNo: 1954338
MBLKSampType: TestCode: 8260WATERP
1,2-Dibromo-3-chloropropane 1.0ND1,2-Dibromoethane 0.50ND1,2-Dichlorobenzene 0.50ND1,2-Dichloroethane 0.50ND1,2-Dichloropropane 0.50ND1,3,5-Trimethylbenzene 0.50ND1,3-Dichlorobenzene 0.50ND1,3-Dichloropropane 0.50ND1,4-Dichlorobenzene 0.50ND2,2-Dichloropropane 0.50ND2-Butanone 5.0ND2-Chlorotoluene 0.50ND4-Chlorotoluene 0.50ND4-Isopropyltoluene 0.50NDBenzene 0.50NDBromobenzene 0.50NDBromodichloromethane 0.50NDBromoform 0.50NDBromomethane 1.0NDCarbon tetrachloride 0.50NDChlorobenzene 0.50NDChloroethane 1.0NDChloroform 0.50NDChloromethane 0.50NDcis-1,2-Dichloroethene 0.50NDDibromochloromethane 0.50NDDibromomethane 0.50NDDichlorodifluoromethane 0.50NDEthylbenzene 0.50NDFreon-113 0.50ND
Qualifiers:
B Analyte detected in the associated Method Blank E Value above quantitation range H Holding times for preparation or analysis exceeded
ND Not Detected at the Reporting Limit R RPD outside accepted recovery limits S Spike/Surrogate outside of limits due to matrix interference
DO Surrogate Diluted Out Calculations are based on raw values
13 of 31

NEVADA 3151 W. Post Rd., Las Vegas, NV 89118
P: 702.307.2659 F: 702.307.2691
“Serving Clients with Passion and Professionalism”
CALIFORNIA 11060 Artesia Blvd., Ste C, Cerritos, CA 90703
P: 562.219.7435 F: 562.219.7436
Project: Maryland Square, Z085000030
CLIENT: Cardno ATC
Work Order: N014984ANALYTICAL QC SUMMARY REPORT
TestCode: 8260WATERP
Sample ID: P150316MB6
Batch ID: P15VW045 TestNo: EPA 8260B Analysis Date: 3/16/2015
Prep Date:
Analyte Result SPK value SPK Ref Val %REC RPD Ref Val %RPDLowLimit HighLimit RPDLimit Qual
Units: µg/L
PQL
Client ID: PBW
RunNo: 99470
SeqNo: 1954338
MBLKSampType: TestCode: 8260WATERP
Hexachlorobutadiene 0.50NDIsopropylbenzene 0.50NDm,p-Xylene 1.0NDMethylene chloride 2.00.310MTBE 0.50NDn-Butylbenzene 0.50NDn-Propylbenzene 0.50NDNaphthalene 0.50NDo-Xylene 0.50NDsec-Butylbenzene 0.50NDStyrene 0.50NDtert-Butylbenzene 0.50NDTetrachloroethene 0.50NDToluene 0.50NDtrans-1,2-Dichloroethene 0.50NDTrichloroethene 0.50NDTrichlorofluoromethane 0.50NDVinyl chloride 0.50NDXylenes, Total 1.5ND Surr: 1,2-Dichloroethane-d4 25.00 96.3 78 12524.080 Surr: 4-Bromofluorobenzene 25.00 98.0 80 12024.490 Surr: Dibromofluoromethane 25.00 99.6 80 12224.900 Surr: Toluene-d8 25.00 99.6 80 12024.910
Qualifiers:
B Analyte detected in the associated Method Blank E Value above quantitation range H Holding times for preparation or analysis exceeded
ND Not Detected at the Reporting Limit R RPD outside accepted recovery limits S Spike/Surrogate outside of limits due to matrix interference
DO Surrogate Diluted Out Calculations are based on raw values
14 of 31

NEVADA 3151 W. Post Rd., Las Vegas, NV 89118
P: 702.307.2659 F: 702.307.2691
“Serving Clients with Passion and Professionalism”
CALIFORNIA 11060 Artesia Blvd., Ste C, Cerritos, CA 90703
P: 562.219.7435 F: 562.219.7436
Project: Maryland Square, Z085000030
CLIENT: Cardno ATC
Work Order: N014984ANALYTICAL QC SUMMARY REPORT
TestCode: 8260WATERP
Sample ID: P150318LCS2
Batch ID: P15VW046 TestNo: EPA 8260B Analysis Date: 3/18/2015
Prep Date:
Analyte Result SPK value SPK Ref Val %REC RPD Ref Val %RPDLowLimit HighLimit RPDLimit Qual
Units: µg/L
PQL
Client ID: LCSW
RunNo: 99514
SeqNo: 1957103
LCSSampType: TestCode: 8260WATERP
1,1,1,2-Tetrachloroethane 20.00 110 80 1210.50 021.9501,1,1-Trichloroethane 20.00 102 77 1220.50 020.4701,1,2,2-Tetrachloroethane 20.00 81.6 77 1230.50 016.3101,1,2-Trichloroethane 20.00 100 87 1200.50 020.0901,1-Dichloroethane 20.00 90.0 72 1270.50 017.9901,1-Dichloroethene 20.00 109 71 1270.50 021.7301,1-Dichloropropene 20.00 104 87 1200.50 020.7601,2,3-Trichlorobenzene 20.00 101 77 1240.50 020.1801,2,3-Trichloropropane 20.00 80.6 77 1200.50 016.1101,2,4-Trichlorobenzene 20.00 104 76 1220.50 020.8701,2,4-Trimethylbenzene 20.00 97.5 85 1200.50 019.5001,2-Dibromo-3-chloropropane 20.00 97.8 67 1251.0 019.5501,2-Dibromoethane 20.00 108 80 1200.50 021.6001,2-Dichlorobenzene 20.00 95.8 80 1200.50 019.1601,2-Dichloroethane 20.00 100 80 1200.50 020.0101,2-Dichloropropane 20.00 92.6 80 1200.50 018.5201,3,5-Trimethylbenzene 20.00 97.9 80 1200.50 019.5701,3-Dichlorobenzene 20.00 98.9 80 1200.50 019.7801,3-Dichloropropane 20.00 92.6 80 1200.50 018.5101,4-Dichlorobenzene 20.00 95.8 80 1200.50 019.1502,2-Dichloropropane 20.00 107 53 1420.50 021.4202-Butanone 200.0 88.3 23 1755.0 0176.6302-Chlorotoluene 20.00 92.0 80 1200.50 018.4004-Chlorotoluene 20.00 92.2 80 1200.50 018.4304-Isopropyltoluene 20.00 102 80 1200.50 020.440Benzene 20.00 100 80 1200.50 019.990Bromobenzene 20.00 97.9 80 1200.50 019.580Bromodichloromethane 20.00 103 80 1200.50 020.620Bromoform 20.00 111 72 1330.50 022.130Bromomethane 20.00 73.5 19 1781.0 014.700
Qualifiers:
B Analyte detected in the associated Method Blank E Value above quantitation range H Holding times for preparation or analysis exceeded
ND Not Detected at the Reporting Limit R RPD outside accepted recovery limits S Spike/Surrogate outside of limits due to matrix interference
DO Surrogate Diluted Out Calculations are based on raw values
15 of 31

NEVADA 3151 W. Post Rd., Las Vegas, NV 89118
P: 702.307.2659 F: 702.307.2691
“Serving Clients with Passion and Professionalism”
CALIFORNIA 11060 Artesia Blvd., Ste C, Cerritos, CA 90703
P: 562.219.7435 F: 562.219.7436
Project: Maryland Square, Z085000030
CLIENT: Cardno ATC
Work Order: N014984ANALYTICAL QC SUMMARY REPORT
TestCode: 8260WATERP
Sample ID: P150318LCS2
Batch ID: P15VW046 TestNo: EPA 8260B Analysis Date: 3/18/2015
Prep Date:
Analyte Result SPK value SPK Ref Val %REC RPD Ref Val %RPDLowLimit HighLimit RPDLimit Qual
Units: µg/L
PQL
Client ID: LCSW
RunNo: 99514
SeqNo: 1957103
LCSSampType: TestCode: 8260WATERP
Carbon tetrachloride 20.00 127 72 1310.50 025.340Chlorobenzene 20.00 97.4 80 1200.50 019.470Chloroethane 20.00 129 66 1401.0 025.750Chloroform 20.00 94.2 77 1200.50 018.840Chloromethane 20.00 95.4 47 1540.50 019.080cis-1,2-Dichloroethene 20.00 95.8 80 1200.50 019.160Dibromochloromethane 20.00 110 80 1220.50 022.070Dibromomethane 20.00 100 80 1200.50 020.020Dichlorodifluoromethane 20.00 108 53 1660.50 021.550Ethylbenzene 20.00 96.2 80 1200.50 019.250Freon-113 20.00 110 71 1290.50 021.900Hexachlorobutadiene 20.00 111 79 1230.50 022.120Isopropylbenzene 20.00 98.6 80 1200.50 019.720m,p-Xylene 40.00 102 80 1201.0 040.820Methylene chloride 20.00 86.7 71 1242.0 017.330MTBE 20.00 93.0 77 1200.50 018.600n-Butylbenzene 20.00 95.0 80 1270.50 018.990n-Propylbenzene 20.00 92.7 80 1220.50 018.540Naphthalene 20.00 81.8 63 1310.50 016.360o-Xylene 20.00 102 80 1200.50 020.490sec-Butylbenzene 20.00 96.6 80 1200.50 019.310Styrene 20.00 104 80 1200.50 020.710tert-Butylbenzene 20.00 101 80 1200.50 020.240Tetrachloroethene 20.00 110 80 1200.50 022.060Toluene 20.00 104 80 1200.50 020.860trans-1,2-Dichloroethene 20.00 97.2 78 1260.50 019.430Trichloroethene 20.00 112 80 1200.50 022.490Trichlorofluoromethane 20.00 118 67 1490.50 023.610Vinyl chloride 20.00 95.2 70 1350.50 019.040Xylenes, Total 60.00 102 70 1301.5 061.310
Qualifiers:
B Analyte detected in the associated Method Blank E Value above quantitation range H Holding times for preparation or analysis exceeded
ND Not Detected at the Reporting Limit R RPD outside accepted recovery limits S Spike/Surrogate outside of limits due to matrix interference
DO Surrogate Diluted Out Calculations are based on raw values
16 of 31

NEVADA 3151 W. Post Rd., Las Vegas, NV 89118
P: 702.307.2659 F: 702.307.2691
“Serving Clients with Passion and Professionalism”
CALIFORNIA 11060 Artesia Blvd., Ste C, Cerritos, CA 90703
P: 562.219.7435 F: 562.219.7436
Project: Maryland Square, Z085000030
CLIENT: Cardno ATC
Work Order: N014984ANALYTICAL QC SUMMARY REPORT
TestCode: 8260WATERP
Sample ID: P150318LCS2
Batch ID: P15VW046 TestNo: EPA 8260B Analysis Date: 3/18/2015
Prep Date:
Analyte Result SPK value SPK Ref Val %REC RPD Ref Val %RPDLowLimit HighLimit RPDLimit Qual
Units: µg/L
PQL
Client ID: LCSW
RunNo: 99514
SeqNo: 1957103
LCSSampType: TestCode: 8260WATERP
Surr: 1,2-Dichloroethane-d4 25.00 88.2 78 12522.060 Surr: 4-Bromofluorobenzene 25.00 103 80 12025.760 Surr: Dibromofluoromethane 25.00 95.3 80 12223.830 Surr: Toluene-d8 25.00 103 80 12025.820
Sample ID: P150318LCSD2
Batch ID: P15VW046 TestNo: EPA 8260B Analysis Date: 3/18/2015
Prep Date:
Analyte Result SPK value SPK Ref Val %REC RPD Ref Val %RPDLowLimit HighLimit RPDLimit Qual
Units: µg/L
PQL
Client ID: LCSS02
RunNo: 99514
SeqNo: 1957104
LCSDSampType: TestCode: 8260WATERP
1,1,1,2-Tetrachloroethane 20.00 110 80 121 200.50 0 21.95 021.9501,1,1-Trichloroethane 20.00 106 77 122 200.50 0 20.47 3.9321.2901,1,2,2-Tetrachloroethane 20.00 83.8 77 123 200.50 0 16.31 2.7216.7601,1,2-Trichloroethane 20.00 97.2 87 120 200.50 0 20.09 3.3419.4301,1-Dichloroethane 20.00 90.4 72 127 200.50 0 17.99 0.55418.0901,1-Dichloroethene 20.00 107 71 127 200.50 0 21.73 1.8121.3401,1-Dichloropropene 20.00 105 87 120 200.50 0 20.76 1.2421.0201,2,3-Trichlorobenzene 20.00 103 77 124 200.50 0 20.18 1.7220.5301,2,3-Trichloropropane 20.00 81.4 77 120 200.50 0 16.11 1.1116.2901,2,4-Trichlorobenzene 20.00 106 76 122 200.50 0 20.87 1.2421.1301,2,4-Trimethylbenzene 20.00 98.4 85 120 200.50 0 19.50 0.86819.6701,2-Dibromo-3-chloropropane 20.00 100 67 125 201.0 0 19.55 2.3320.0101,2-Dibromoethane 20.00 110 80 120 200.50 0 21.60 2.2422.0901,2-Dichlorobenzene 20.00 97.6 80 120 200.50 0 19.16 1.9119.5301,2-Dichloroethane 20.00 99.5 80 120 200.50 0 20.01 0.55119.9001,2-Dichloropropane 20.00 94.8 80 120 200.50 0 18.52 2.3018.9501,3,5-Trimethylbenzene 20.00 97.5 80 120 200.50 0 19.57 0.35819.5001,3-Dichlorobenzene 20.00 99.4 80 120 200.50 0 19.78 0.50419.8801,3-Dichloropropane 20.00 93.0 80 120 200.50 0 18.51 0.43118.5901,4-Dichlorobenzene 20.00 97.6 80 120 200.50 0 19.15 1.9619.5302,2-Dichloropropane 20.00 107 53 142 200.50 0 21.42 0.37421.340
Qualifiers:
B Analyte detected in the associated Method Blank E Value above quantitation range H Holding times for preparation or analysis exceeded
ND Not Detected at the Reporting Limit R RPD outside accepted recovery limits S Spike/Surrogate outside of limits due to matrix interference
DO Surrogate Diluted Out Calculations are based on raw values
17 of 31

NEVADA 3151 W. Post Rd., Las Vegas, NV 89118
P: 702.307.2659 F: 702.307.2691
“Serving Clients with Passion and Professionalism”
CALIFORNIA 11060 Artesia Blvd., Ste C, Cerritos, CA 90703
P: 562.219.7435 F: 562.219.7436
Project: Maryland Square, Z085000030
CLIENT: Cardno ATC
Work Order: N014984ANALYTICAL QC SUMMARY REPORT
TestCode: 8260WATERP
Sample ID: P150318LCSD2
Batch ID: P15VW046 TestNo: EPA 8260B Analysis Date: 3/18/2015
Prep Date:
Analyte Result SPK value SPK Ref Val %REC RPD Ref Val %RPDLowLimit HighLimit RPDLimit Qual
Units: µg/L
PQL
Client ID: LCSS02
RunNo: 99514
SeqNo: 1957104
LCSDSampType: TestCode: 8260WATERP
2-Butanone 200.0 73.1 23 175 205.0 0 176.6 18.9146.1802-Chlorotoluene 20.00 92.6 80 120 200.50 0 18.40 0.70418.5304-Chlorotoluene 20.00 92.5 80 120 200.50 0 18.43 0.32518.4904-Isopropyltoluene 20.00 101 80 120 200.50 0 20.44 0.98320.240Benzene 20.00 98.4 80 120 200.50 0 19.99 1.5119.690Bromobenzene 20.00 101 80 120 200.50 0 19.58 2.9220.160Bromodichloromethane 20.00 105 80 120 200.50 0 20.62 1.8721.010Bromoform 20.00 111 72 133 200.50 0 22.13 0.72022.290Bromomethane 20.00 76.2 19 178 201.0 0 14.70 3.6115.240Carbon tetrachloride 20.00 127 72 131 200.50 0 25.34 0.55125.480Chlorobenzene 20.00 97.9 80 120 200.50 0 19.47 0.56319.580Chloroethane 20.00 129 66 140 201.0 0 25.75 0.38825.850Chloroform 20.00 93.3 77 120 200.50 0 18.84 0.96018.660Chloromethane 20.00 92.6 47 154 200.50 0 19.08 3.0318.510cis-1,2-Dichloroethene 20.00 96.2 80 120 200.50 0 19.16 0.41719.240Dibromochloromethane 20.00 108 80 122 200.50 0 22.07 1.8321.670Dibromomethane 20.00 97.8 80 120 200.50 0 20.02 2.3219.560Dichlorodifluoromethane 20.00 105 53 166 200.50 0 21.55 2.8720.940Ethylbenzene 20.00 97.2 80 120 200.50 0 19.25 0.93119.430Freon-113 20.00 112 71 129 200.50 0 21.90 2.7022.500Hexachlorobutadiene 20.00 112 79 123 200.50 0 22.12 0.94522.330Isopropylbenzene 20.00 98.2 80 120 200.50 0 19.72 0.40719.640m,p-Xylene 40.00 100 80 120 201.0 0 40.82 1.5640.190Methylene chloride 20.00 85.9 71 124 202.0 0 17.33 0.92817.170MTBE 20.00 93.0 77 120 200.50 0 18.60 0.053818.590n-Butylbenzene 20.00 93.6 80 127 200.50 0 18.99 1.4318.720n-Propylbenzene 20.00 93.4 80 122 200.50 0 18.54 0.75218.680Naphthalene 20.00 81.3 63 131 200.50 0 16.36 0.61316.260o-Xylene 20.00 103 80 120 200.50 0 20.49 0.97120.690sec-Butylbenzene 20.00 96.9 80 120 200.50 0 19.31 0.31019.370
Qualifiers:
B Analyte detected in the associated Method Blank E Value above quantitation range H Holding times for preparation or analysis exceeded
ND Not Detected at the Reporting Limit R RPD outside accepted recovery limits S Spike/Surrogate outside of limits due to matrix interference
DO Surrogate Diluted Out Calculations are based on raw values
18 of 31

NEVADA 3151 W. Post Rd., Las Vegas, NV 89118
P: 702.307.2659 F: 702.307.2691
“Serving Clients with Passion and Professionalism”
CALIFORNIA 11060 Artesia Blvd., Ste C, Cerritos, CA 90703
P: 562.219.7435 F: 562.219.7436
Project: Maryland Square, Z085000030
CLIENT: Cardno ATC
Work Order: N014984ANALYTICAL QC SUMMARY REPORT
TestCode: 8260WATERP
Sample ID: P150318LCSD2
Batch ID: P15VW046 TestNo: EPA 8260B Analysis Date: 3/18/2015
Prep Date:
Analyte Result SPK value SPK Ref Val %REC RPD Ref Val %RPDLowLimit HighLimit RPDLimit Qual
Units: µg/L
PQL
Client ID: LCSS02
RunNo: 99514
SeqNo: 1957104
LCSDSampType: TestCode: 8260WATERP
Styrene 20.00 104 80 120 200.50 0 20.71 0.86520.890tert-Butylbenzene 20.00 100 80 120 200.50 0 20.24 1.0920.020Tetrachloroethene 20.00 107 80 120 200.50 0 22.06 3.0421.400Toluene 20.00 102 80 120 200.50 0 20.86 1.8420.480trans-1,2-Dichloroethene 20.00 96.4 78 126 200.50 0 19.43 0.82719.270Trichloroethene 20.00 112 80 120 200.50 0 22.49 0.089022.470Trichlorofluoromethane 20.00 117 67 149 200.50 0 23.61 1.2423.320Vinyl chloride 20.00 95.7 70 135 200.50 0 19.04 0.47219.130Xylenes, Total 60.00 101 70 130 201.5 0 61.31 0.70460.880 Surr: 1,2-Dichloroethane-d4 25.00 88.0 78 125 022.010 Surr: 4-Bromofluorobenzene 25.00 105 80 120 026.250 Surr: Dibromofluoromethane 25.00 96.7 80 122 024.180 Surr: Toluene-d8 25.00 102 80 120 025.390
Sample ID: P150318MB7
Batch ID: P15VW046 TestNo: EPA 8260B Analysis Date: 3/18/2015
Prep Date:
Analyte Result SPK value SPK Ref Val %REC RPD Ref Val %RPDLowLimit HighLimit RPDLimit Qual
Units: µg/L
PQL
Client ID: PBW
RunNo: 99514
SeqNo: 1957107
MBLKSampType: TestCode: 8260WATERP
1,1,1,2-Tetrachloroethane 0.50ND1,1,1-Trichloroethane 0.50ND1,1,2,2-Tetrachloroethane 0.50ND1,1,2-Trichloroethane 0.50ND1,1-Dichloroethane 0.50ND1,1-Dichloroethene 0.50ND1,1-Dichloropropene 0.50ND1,2,3-Trichlorobenzene 0.50ND1,2,3-Trichloropropane 0.50ND1,2,4-Trichlorobenzene 0.50ND1,2,4-Trimethylbenzene 0.50ND1,2-Dibromo-3-chloropropane 1.0ND
Qualifiers:
B Analyte detected in the associated Method Blank E Value above quantitation range H Holding times for preparation or analysis exceeded
ND Not Detected at the Reporting Limit R RPD outside accepted recovery limits S Spike/Surrogate outside of limits due to matrix interference
DO Surrogate Diluted Out Calculations are based on raw values
19 of 31

NEVADA 3151 W. Post Rd., Las Vegas, NV 89118
P: 702.307.2659 F: 702.307.2691
“Serving Clients with Passion and Professionalism”
CALIFORNIA 11060 Artesia Blvd., Ste C, Cerritos, CA 90703
P: 562.219.7435 F: 562.219.7436
Project: Maryland Square, Z085000030
CLIENT: Cardno ATC
Work Order: N014984ANALYTICAL QC SUMMARY REPORT
TestCode: 8260WATERP
Sample ID: P150318MB7
Batch ID: P15VW046 TestNo: EPA 8260B Analysis Date: 3/18/2015
Prep Date:
Analyte Result SPK value SPK Ref Val %REC RPD Ref Val %RPDLowLimit HighLimit RPDLimit Qual
Units: µg/L
PQL
Client ID: PBW
RunNo: 99514
SeqNo: 1957107
MBLKSampType: TestCode: 8260WATERP
1,2-Dibromoethane 0.50ND1,2-Dichlorobenzene 0.50ND1,2-Dichloroethane 0.50ND1,2-Dichloropropane 0.50ND1,3,5-Trimethylbenzene 0.50ND1,3-Dichlorobenzene 0.50ND1,3-Dichloropropane 0.50ND1,4-Dichlorobenzene 0.50ND2,2-Dichloropropane 0.50ND2-Butanone 5.0ND2-Chlorotoluene 0.50ND4-Chlorotoluene 0.50ND4-Isopropyltoluene 0.50NDBenzene 0.50NDBromobenzene 0.50NDBromodichloromethane 0.50NDBromoform 0.50NDBromomethane 1.0NDCarbon tetrachloride 0.50NDChlorobenzene 0.50NDChloroethane 1.0NDChloroform 0.500.050Chloromethane 0.500.170cis-1,2-Dichloroethene 0.50NDDibromochloromethane 0.50NDDibromomethane 0.50NDDichlorodifluoromethane 0.50NDEthylbenzene 0.50NDFreon-113 0.50NDHexachlorobutadiene 0.50ND
Qualifiers:
B Analyte detected in the associated Method Blank E Value above quantitation range H Holding times for preparation or analysis exceeded
ND Not Detected at the Reporting Limit R RPD outside accepted recovery limits S Spike/Surrogate outside of limits due to matrix interference
DO Surrogate Diluted Out Calculations are based on raw values
20 of 31

NEVADA 3151 W. Post Rd., Las Vegas, NV 89118
P: 702.307.2659 F: 702.307.2691
“Serving Clients with Passion and Professionalism”
CALIFORNIA 11060 Artesia Blvd., Ste C, Cerritos, CA 90703
P: 562.219.7435 F: 562.219.7436
Project: Maryland Square, Z085000030
CLIENT: Cardno ATC
Work Order: N014984ANALYTICAL QC SUMMARY REPORT
TestCode: 8260WATERP
Sample ID: P150318MB7
Batch ID: P15VW046 TestNo: EPA 8260B Analysis Date: 3/18/2015
Prep Date:
Analyte Result SPK value SPK Ref Val %REC RPD Ref Val %RPDLowLimit HighLimit RPDLimit Qual
Units: µg/L
PQL
Client ID: PBW
RunNo: 99514
SeqNo: 1957107
MBLKSampType: TestCode: 8260WATERP
Isopropylbenzene 0.50NDm,p-Xylene 1.0NDMethylene chloride 2.00.490MTBE 0.50NDn-Butylbenzene 0.50NDn-Propylbenzene 0.50NDNaphthalene 0.50NDo-Xylene 0.50NDsec-Butylbenzene 0.50NDStyrene 0.50NDtert-Butylbenzene 0.50NDTetrachloroethene 0.50NDToluene 0.500.030trans-1,2-Dichloroethene 0.50NDTrichloroethene 0.50NDTrichlorofluoromethane 0.50NDVinyl chloride 0.50NDXylenes, Total 1.5ND Surr: 1,2-Dichloroethane-d4 25.00 90.0 78 12522.510 Surr: 4-Bromofluorobenzene 25.00 101 80 12025.230 Surr: Dibromofluoromethane 25.00 95.1 80 12223.780 Surr: Toluene-d8 25.00 101 80 12025.260
Qualifiers:
B Analyte detected in the associated Method Blank E Value above quantitation range H Holding times for preparation or analysis exceeded
ND Not Detected at the Reporting Limit R RPD outside accepted recovery limits S Spike/Surrogate outside of limits due to matrix interference
DO Surrogate Diluted Out Calculations are based on raw values
21 of 31
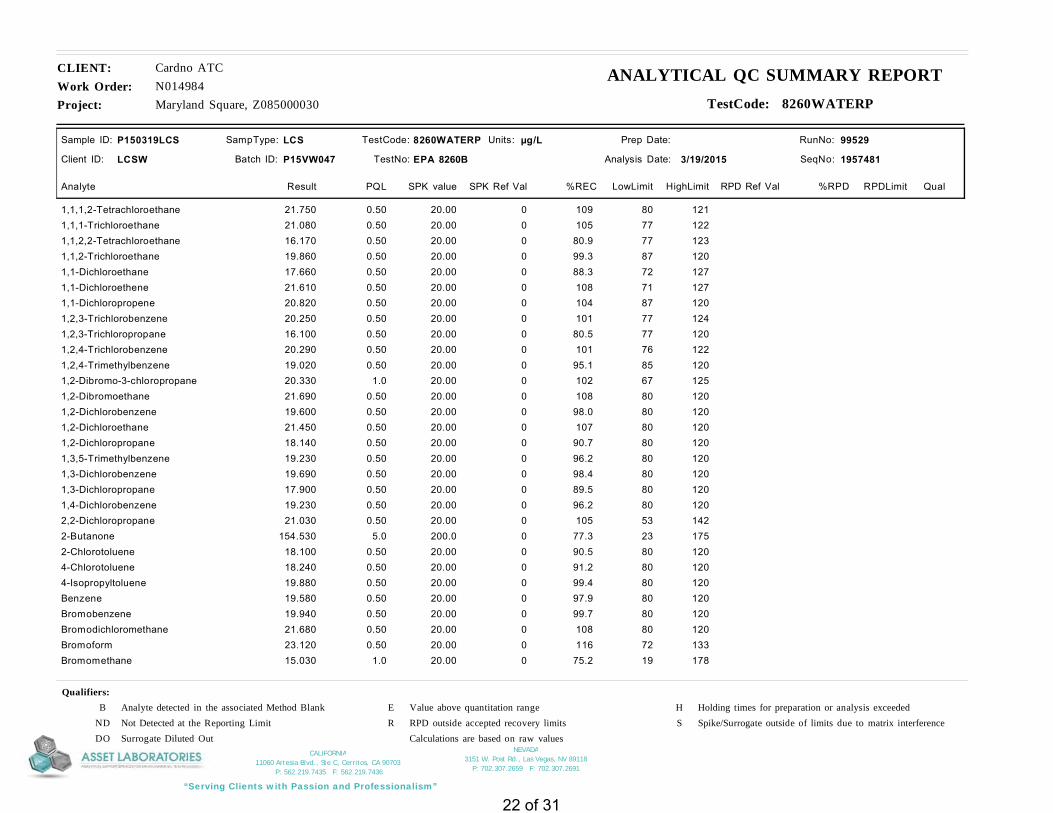
NEVADA 3151 W. Post Rd., Las Vegas, NV 89118
P: 702.307.2659 F: 702.307.2691
“Serving Clients with Passion and Professionalism”
CALIFORNIA 11060 Artesia Blvd., Ste C, Cerritos, CA 90703
P: 562.219.7435 F: 562.219.7436
Project: Maryland Square, Z085000030
CLIENT: Cardno ATC
Work Order: N014984ANALYTICAL QC SUMMARY REPORT
TestCode: 8260WATERP
Sample ID: P150319LCS
Batch ID: P15VW047 TestNo: EPA 8260B Analysis Date: 3/19/2015
Prep Date:
Analyte Result SPK value SPK Ref Val %REC RPD Ref Val %RPDLowLimit HighLimit RPDLimit Qual
Units: µg/L
PQL
Client ID: LCSW
RunNo: 99529
SeqNo: 1957481
LCSSampType: TestCode: 8260WATERP
1,1,1,2-Tetrachloroethane 20.00 109 80 1210.50 021.7501,1,1-Trichloroethane 20.00 105 77 1220.50 021.0801,1,2,2-Tetrachloroethane 20.00 80.9 77 1230.50 016.1701,1,2-Trichloroethane 20.00 99.3 87 1200.50 019.8601,1-Dichloroethane 20.00 88.3 72 1270.50 017.6601,1-Dichloroethene 20.00 108 71 1270.50 021.6101,1-Dichloropropene 20.00 104 87 1200.50 020.8201,2,3-Trichlorobenzene 20.00 101 77 1240.50 020.2501,2,3-Trichloropropane 20.00 80.5 77 1200.50 016.1001,2,4-Trichlorobenzene 20.00 101 76 1220.50 020.2901,2,4-Trimethylbenzene 20.00 95.1 85 1200.50 019.0201,2-Dibromo-3-chloropropane 20.00 102 67 1251.0 020.3301,2-Dibromoethane 20.00 108 80 1200.50 021.6901,2-Dichlorobenzene 20.00 98.0 80 1200.50 019.6001,2-Dichloroethane 20.00 107 80 1200.50 021.4501,2-Dichloropropane 20.00 90.7 80 1200.50 018.1401,3,5-Trimethylbenzene 20.00 96.2 80 1200.50 019.2301,3-Dichlorobenzene 20.00 98.4 80 1200.50 019.6901,3-Dichloropropane 20.00 89.5 80 1200.50 017.9001,4-Dichlorobenzene 20.00 96.2 80 1200.50 019.2302,2-Dichloropropane 20.00 105 53 1420.50 021.0302-Butanone 200.0 77.3 23 1755.0 0154.5302-Chlorotoluene 20.00 90.5 80 1200.50 018.1004-Chlorotoluene 20.00 91.2 80 1200.50 018.2404-Isopropyltoluene 20.00 99.4 80 1200.50 019.880Benzene 20.00 97.9 80 1200.50 019.580Bromobenzene 20.00 99.7 80 1200.50 019.940Bromodichloromethane 20.00 108 80 1200.50 021.680Bromoform 20.00 116 72 1330.50 023.120Bromomethane 20.00 75.2 19 1781.0 015.030
Qualifiers:
B Analyte detected in the associated Method Blank E Value above quantitation range H Holding times for preparation or analysis exceeded
ND Not Detected at the Reporting Limit R RPD outside accepted recovery limits S Spike/Surrogate outside of limits due to matrix interference
DO Surrogate Diluted Out Calculations are based on raw values
22 of 31
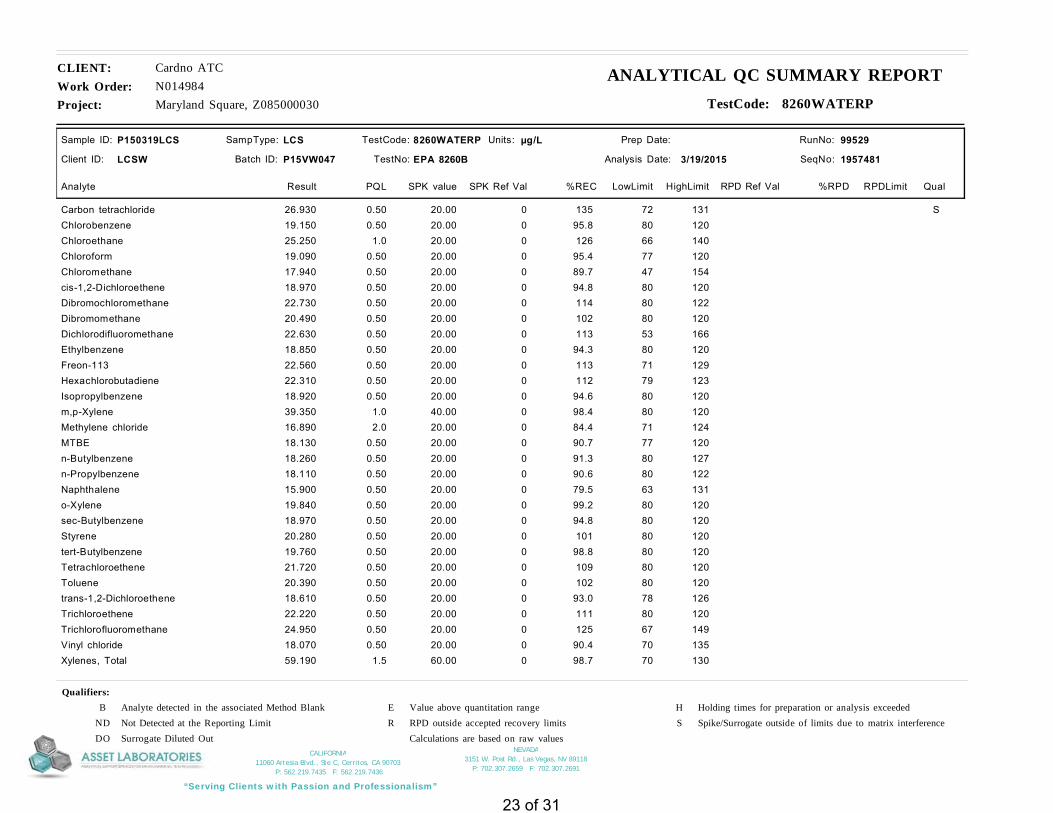
NEVADA 3151 W. Post Rd., Las Vegas, NV 89118
P: 702.307.2659 F: 702.307.2691
“Serving Clients with Passion and Professionalism”
CALIFORNIA 11060 Artesia Blvd., Ste C, Cerritos, CA 90703
P: 562.219.7435 F: 562.219.7436
Project: Maryland Square, Z085000030
CLIENT: Cardno ATC
Work Order: N014984ANALYTICAL QC SUMMARY REPORT
TestCode: 8260WATERP
Sample ID: P150319LCS
Batch ID: P15VW047 TestNo: EPA 8260B Analysis Date: 3/19/2015
Prep Date:
Analyte Result SPK value SPK Ref Val %REC RPD Ref Val %RPDLowLimit HighLimit RPDLimit Qual
Units: µg/L
PQL
Client ID: LCSW
RunNo: 99529
SeqNo: 1957481
LCSSampType: TestCode: 8260WATERP
Carbon tetrachloride 20.00 135 72 131 S0.50 026.930Chlorobenzene 20.00 95.8 80 1200.50 019.150Chloroethane 20.00 126 66 1401.0 025.250Chloroform 20.00 95.4 77 1200.50 019.090Chloromethane 20.00 89.7 47 1540.50 017.940cis-1,2-Dichloroethene 20.00 94.8 80 1200.50 018.970Dibromochloromethane 20.00 114 80 1220.50 022.730Dibromomethane 20.00 102 80 1200.50 020.490Dichlorodifluoromethane 20.00 113 53 1660.50 022.630Ethylbenzene 20.00 94.3 80 1200.50 018.850Freon-113 20.00 113 71 1290.50 022.560Hexachlorobutadiene 20.00 112 79 1230.50 022.310Isopropylbenzene 20.00 94.6 80 1200.50 018.920m,p-Xylene 40.00 98.4 80 1201.0 039.350Methylene chloride 20.00 84.4 71 1242.0 016.890MTBE 20.00 90.7 77 1200.50 018.130n-Butylbenzene 20.00 91.3 80 1270.50 018.260n-Propylbenzene 20.00 90.6 80 1220.50 018.110Naphthalene 20.00 79.5 63 1310.50 015.900o-Xylene 20.00 99.2 80 1200.50 019.840sec-Butylbenzene 20.00 94.8 80 1200.50 018.970Styrene 20.00 101 80 1200.50 020.280tert-Butylbenzene 20.00 98.8 80 1200.50 019.760Tetrachloroethene 20.00 109 80 1200.50 021.720Toluene 20.00 102 80 1200.50 020.390trans-1,2-Dichloroethene 20.00 93.0 78 1260.50 018.610Trichloroethene 20.00 111 80 1200.50 022.220Trichlorofluoromethane 20.00 125 67 1490.50 024.950Vinyl chloride 20.00 90.4 70 1350.50 018.070Xylenes, Total 60.00 98.7 70 1301.5 059.190
Qualifiers:
B Analyte detected in the associated Method Blank E Value above quantitation range H Holding times for preparation or analysis exceeded
ND Not Detected at the Reporting Limit R RPD outside accepted recovery limits S Spike/Surrogate outside of limits due to matrix interference
DO Surrogate Diluted Out Calculations are based on raw values
23 of 31

NEVADA 3151 W. Post Rd., Las Vegas, NV 89118
P: 702.307.2659 F: 702.307.2691
“Serving Clients with Passion and Professionalism”
CALIFORNIA 11060 Artesia Blvd., Ste C, Cerritos, CA 90703
P: 562.219.7435 F: 562.219.7436
Project: Maryland Square, Z085000030
CLIENT: Cardno ATC
Work Order: N014984ANALYTICAL QC SUMMARY REPORT
TestCode: 8260WATERP
Sample ID: P150319LCS
Batch ID: P15VW047 TestNo: EPA 8260B Analysis Date: 3/19/2015
Prep Date:
Analyte Result SPK value SPK Ref Val %REC RPD Ref Val %RPDLowLimit HighLimit RPDLimit Qual
Units: µg/L
PQL
Client ID: LCSW
RunNo: 99529
SeqNo: 1957481
LCSSampType: TestCode: 8260WATERP
Surr: 1,2-Dichloroethane-d4 25.00 92.7 78 12523.180 Surr: 4-Bromofluorobenzene 25.00 103 80 12025.680 Surr: Dibromofluoromethane 25.00 95.2 80 12223.810 Surr: Toluene-d8 25.00 102 80 12025.590
Sample ID: N015021-001DMS
Batch ID: P15VW047 TestNo: EPA 8260B Analysis Date: 3/19/2015
Prep Date:
Analyte Result SPK value SPK Ref Val %REC RPD Ref Val %RPDLowLimit HighLimit RPDLimit Qual
Units: µg/L
PQL
Client ID: ZZZZZZ
RunNo: 99529
SeqNo: 1957482
MSSampType: TestCode: 8260WATERP
1,1,1,2-Tetrachloroethane 20.00 115 76 1270.50 022.9201,1,1-Trichloroethane 20.00 108 72 1250.50 021.6701,1,2,2-Tetrachloroethane 20.00 83.2 75 1260.50 016.6401,1,2-Trichloroethane 20.00 103 80 1200.50 020.6301,1-Dichloroethane 20.00 89.5 69 1280.50 017.9001,1-Dichloroethene 20.00 112 62 1350.50 022.3501,1-Dichloropropene 20.00 105 75 1230.50 021.0801,2,3-Trichlorobenzene 20.00 104 66 1290.50 020.9001,2,3-Trichloropropane 20.00 84.3 73 1240.50 016.8601,2,4-Trichlorobenzene 20.00 106 63 1310.50 021.1601,2,4-Trimethylbenzene 20.00 98.6 62 1310.50 019.7301,2-Dibromo-3-chloropropane 20.00 105 66 1261.0 020.9901,2-Dibromoethane 20.00 111 80 1260.50 022.2301,2-Dichlorobenzene 20.00 99.0 80 1200.50 019.8001,2-Dichloroethane 20.00 104 80 1210.50 020.8401,2-Dichloropropane 20.00 90.9 79 1200.50 018.1701,3,5-Trimethylbenzene 20.00 99.4 69 1280.50 019.8701,3-Dichlorobenzene 20.00 101 80 1200.50 020.1301,3-Dichloropropane 20.00 90.2 80 1200.50 018.0301,4-Dichlorobenzene 20.00 99.0 80 1200.50 019.8102,2-Dichloropropane 20.00 105 56 1440.50 020.910
Qualifiers:
B Analyte detected in the associated Method Blank E Value above quantitation range H Holding times for preparation or analysis exceeded
ND Not Detected at the Reporting Limit R RPD outside accepted recovery limits S Spike/Surrogate outside of limits due to matrix interference
DO Surrogate Diluted Out Calculations are based on raw values
24 of 31

NEVADA 3151 W. Post Rd., Las Vegas, NV 89118
P: 702.307.2659 F: 702.307.2691
“Serving Clients with Passion and Professionalism”
CALIFORNIA 11060 Artesia Blvd., Ste C, Cerritos, CA 90703
P: 562.219.7435 F: 562.219.7436
Project: Maryland Square, Z085000030
CLIENT: Cardno ATC
Work Order: N014984ANALYTICAL QC SUMMARY REPORT
TestCode: 8260WATERP
Sample ID: N015021-001DMS
Batch ID: P15VW047 TestNo: EPA 8260B Analysis Date: 3/19/2015
Prep Date:
Analyte Result SPK value SPK Ref Val %REC RPD Ref Val %RPDLowLimit HighLimit RPDLimit Qual
Units: µg/L
PQL
Client ID: ZZZZZZ
RunNo: 99529
SeqNo: 1957482
MSSampType: TestCode: 8260WATERP
2-Butanone 200.0 71.8 4 1635.0 0143.6902-Chlorotoluene 20.00 92.6 79 1200.50 018.5104-Chlorotoluene 20.00 94.4 79 1200.50 018.8704-Isopropyltoluene 20.00 102 70 1280.50 020.360Benzene 20.00 98.4 80 1200.50 019.680Bromobenzene 20.00 101 80 1200.50 020.280Bromodichloromethane 20.00 111 80 1240.50 0.450022.580Bromoform 20.00 123 66 1390.50 024.510Bromomethane 20.00 82.2 18 1741.0 016.430Carbon tetrachloride 20.00 138 59 1440.50 027.560Chlorobenzene 20.00 97.0 80 1200.50 019.410Chloroethane 20.00 136 62 1451.0 027.160Chloroform 20.00 95.1 74 1200.50 8.05027.060Chloromethane 20.00 91.0 37 1570.50 0.170018.370cis-1,2-Dichloroethene 20.00 95.7 73 1250.50 019.140Dibromochloromethane 20.00 115 77 1300.50 0.330023.300Dibromomethane 20.00 105 70 1320.50 020.990Dichlorodifluoromethane 20.00 113 47 1590.50 022.540Ethylbenzene 20.00 96.9 79 1200.50 019.380Freon-113 20.00 112 64 1320.50 022.350Hexachlorobutadiene 20.00 115 66 1280.50 023.050Isopropylbenzene 20.00 97.8 78 1200.50 019.550m,p-Xylene 40.00 101 80 1201.0 040.240Methylene chloride 20.00 82.7 65 1222.0 016.540MTBE 20.00 93.4 71 1250.50 018.670n-Butylbenzene 20.00 95.0 65 1340.50 019.000n-Propylbenzene 20.00 93.0 78 1210.50 018.600Naphthalene 20.00 81.4 52 1370.50 016.270o-Xylene 20.00 101 80 1200.50 020.260sec-Butylbenzene 20.00 96.1 76 1220.50 019.220
Qualifiers:
B Analyte detected in the associated Method Blank E Value above quantitation range H Holding times for preparation or analysis exceeded
ND Not Detected at the Reporting Limit R RPD outside accepted recovery limits S Spike/Surrogate outside of limits due to matrix interference
DO Surrogate Diluted Out Calculations are based on raw values
25 of 31

NEVADA 3151 W. Post Rd., Las Vegas, NV 89118
P: 702.307.2659 F: 702.307.2691
“Serving Clients with Passion and Professionalism”
CALIFORNIA 11060 Artesia Blvd., Ste C, Cerritos, CA 90703
P: 562.219.7435 F: 562.219.7436
Project: Maryland Square, Z085000030
CLIENT: Cardno ATC
Work Order: N014984ANALYTICAL QC SUMMARY REPORT
TestCode: 8260WATERP
Sample ID: N015021-001DMS
Batch ID: P15VW047 TestNo: EPA 8260B Analysis Date: 3/19/2015
Prep Date:
Analyte Result SPK value SPK Ref Val %REC RPD Ref Val %RPDLowLimit HighLimit RPDLimit Qual
Units: µg/L
PQL
Client ID: ZZZZZZ
RunNo: 99529
SeqNo: 1957482
MSSampType: TestCode: 8260WATERP
Styrene 20.00 96.0 43 1450.50 019.200tert-Butylbenzene 20.00 101 78 1200.50 020.180Tetrachloroethene 20.00 108 71 1230.50 021.530Toluene 20.00 103 80 1200.50 0.0300020.690trans-1,2-Dichloroethene 20.00 96.2 64 1320.50 019.230Trichloroethene 20.00 114 79 1210.50 022.750Trichlorofluoromethane 20.00 125 65 1440.50 025.070Vinyl chloride 20.00 95.0 64 1340.50 018.990Xylenes, Total 60.00 101 70 1301.5 060.500 Surr: 1,2-Dichloroethane-d4 25.00 92.0 78 12523.000 Surr: 4-Bromofluorobenzene 25.00 104 80 12025.920 Surr: Dibromofluoromethane 25.00 94.8 80 12223.690 Surr: Toluene-d8 25.00 102 80 12025.580
Sample ID: N015021-001DMSD
Batch ID: P15VW047 TestNo: EPA 8260B Analysis Date: 3/19/2015
Prep Date:
Analyte Result SPK value SPK Ref Val %REC RPD Ref Val %RPDLowLimit HighLimit RPDLimit Qual
Units: µg/L
PQL
Client ID: ZZZZZZ
RunNo: 99529
SeqNo: 1957483
MSDSampType: TestCode: 8260WATERP
1,1,1,2-Tetrachloroethane 20.00 111 76 127 200.50 0 22.92 2.9222.2601,1,1-Trichloroethane 20.00 106 72 125 200.50 0 21.67 1.9621.2501,1,2,2-Tetrachloroethane 20.00 79.9 75 126 200.50 0 16.64 4.0515.9801,1,2-Trichloroethane 20.00 101 80 120 200.50 0 20.63 2.3520.1501,1-Dichloroethane 20.00 85.7 69 128 200.50 0 17.90 4.3417.1401,1-Dichloroethene 20.00 110 62 135 200.50 0 22.35 1.1222.1001,1-Dichloropropene 20.00 104 75 123 200.50 0 21.08 1.2920.8101,2,3-Trichlorobenzene 20.00 98.2 66 129 200.50 0 20.90 6.2219.6401,2,3-Trichloropropane 20.00 79.8 73 124 200.50 0 16.86 5.4815.9601,2,4-Trichlorobenzene 20.00 98.1 63 131 200.50 0 21.16 7.5519.6201,2,4-Trimethylbenzene 20.00 91.7 62 131 200.50 0 19.73 7.3618.3301,2-Dibromo-3-chloropropane 20.00 92.1 66 126 201.0 0 20.99 13.018.420
Qualifiers:
B Analyte detected in the associated Method Blank E Value above quantitation range H Holding times for preparation or analysis exceeded
ND Not Detected at the Reporting Limit R RPD outside accepted recovery limits S Spike/Surrogate outside of limits due to matrix interference
DO Surrogate Diluted Out Calculations are based on raw values
26 of 31

NEVADA 3151 W. Post Rd., Las Vegas, NV 89118
P: 702.307.2659 F: 702.307.2691
“Serving Clients with Passion and Professionalism”
CALIFORNIA 11060 Artesia Blvd., Ste C, Cerritos, CA 90703
P: 562.219.7435 F: 562.219.7436
Project: Maryland Square, Z085000030
CLIENT: Cardno ATC
Work Order: N014984ANALYTICAL QC SUMMARY REPORT
TestCode: 8260WATERP
Sample ID: N015021-001DMSD
Batch ID: P15VW047 TestNo: EPA 8260B Analysis Date: 3/19/2015
Prep Date:
Analyte Result SPK value SPK Ref Val %REC RPD Ref Val %RPDLowLimit HighLimit RPDLimit Qual
Units: µg/L
PQL
Client ID: ZZZZZZ
RunNo: 99529
SeqNo: 1957483
MSDSampType: TestCode: 8260WATERP
1,2-Dibromoethane 20.00 107 80 126 200.50 0 22.23 4.0921.3401,2-Dichlorobenzene 20.00 93.5 80 120 200.50 0 19.80 5.7118.7001,2-Dichloroethane 20.00 103 80 121 200.50 0 20.84 1.3020.5701,2-Dichloropropane 20.00 90.0 79 120 200.50 0 18.17 0.99617.9901,3,5-Trimethylbenzene 20.00 92.7 69 128 200.50 0 19.87 6.9318.5401,3-Dichlorobenzene 20.00 94.4 80 120 200.50 0 20.13 6.4618.8701,3-Dichloropropane 20.00 88.3 80 120 200.50 0 18.03 2.0717.6601,4-Dichlorobenzene 20.00 91.7 80 120 200.50 0 19.81 7.7118.3402,2-Dichloropropane 20.00 101 56 144 200.50 0 20.91 3.0620.2802-Butanone 200.0 71.0 4 163 205.0 0 143.7 1.13142.0702-Chlorotoluene 20.00 86.6 79 120 200.50 0 18.51 6.6417.3204-Chlorotoluene 20.00 87.2 79 120 200.50 0 18.87 7.8217.4504-Isopropyltoluene 20.00 94.6 70 128 200.50 0 20.36 7.3318.920Benzene 20.00 97.2 80 120 200.50 0 19.68 1.2319.440Bromobenzene 20.00 95.6 80 120 200.50 0 20.28 5.9419.110Bromodichloromethane 20.00 105 80 124 200.50 0.4500 22.58 5.1821.440Bromoform 20.00 117 66 139 200.50 0 24.51 4.9323.330Bromomethane 20.00 79.8 18 174 201.0 0 16.43 2.9615.950Carbon tetrachloride 20.00 136 59 144 200.50 0 27.56 1.6127.120Chlorobenzene 20.00 94.1 80 120 200.50 0 19.41 3.0918.820Chloroethane 20.00 125 62 145 201.0 0 27.16 8.1625.030Chloroform 20.00 92.6 74 120 200.50 8.050 27.06 1.8626.560Chloromethane 20.00 88.2 37 157 200.50 0.1700 18.37 3.1017.810cis-1,2-Dichloroethene 20.00 88.6 73 125 200.50 0 19.14 7.6517.730Dibromochloromethane 20.00 114 77 130 200.50 0.3300 23.30 0.81923.110Dibromomethane 20.00 106 70 132 200.50 0 20.99 0.52321.100Dichlorodifluoromethane 20.00 109 47 159 200.50 0 22.54 3.5221.760Ethylbenzene 20.00 91.4 79 120 200.50 0 19.38 5.7918.290Freon-113 20.00 110 64 132 200.50 0 22.35 1.4422.030Hexachlorobutadiene 20.00 104 66 128 200.50 0 23.05 10.620.740
Qualifiers:
B Analyte detected in the associated Method Blank E Value above quantitation range H Holding times for preparation or analysis exceeded
ND Not Detected at the Reporting Limit R RPD outside accepted recovery limits S Spike/Surrogate outside of limits due to matrix interference
DO Surrogate Diluted Out Calculations are based on raw values
27 of 31

NEVADA 3151 W. Post Rd., Las Vegas, NV 89118
P: 702.307.2659 F: 702.307.2691
“Serving Clients with Passion and Professionalism”
CALIFORNIA 11060 Artesia Blvd., Ste C, Cerritos, CA 90703
P: 562.219.7435 F: 562.219.7436
Project: Maryland Square, Z085000030
CLIENT: Cardno ATC
Work Order: N014984ANALYTICAL QC SUMMARY REPORT
TestCode: 8260WATERP
Sample ID: N015021-001DMSD
Batch ID: P15VW047 TestNo: EPA 8260B Analysis Date: 3/19/2015
Prep Date:
Analyte Result SPK value SPK Ref Val %REC RPD Ref Val %RPDLowLimit HighLimit RPDLimit Qual
Units: µg/L
PQL
Client ID: ZZZZZZ
RunNo: 99529
SeqNo: 1957483
MSDSampType: TestCode: 8260WATERP
Isopropylbenzene 20.00 91.1 78 120 200.50 0 19.55 7.0418.220m,p-Xylene 40.00 97.2 80 120 201.0 0 40.24 3.4938.860Methylene chloride 20.00 79.5 65 122 202.0 0 16.54 3.9515.900MTBE 20.00 90.1 71 125 200.50 0 18.67 3.5418.020n-Butylbenzene 20.00 88.6 65 134 200.50 0 19.00 6.9717.720n-Propylbenzene 20.00 86.4 78 121 200.50 0 18.60 7.3617.280Naphthalene 20.00 76.9 52 137 200.50 0 16.27 5.6215.380o-Xylene 20.00 99.0 80 120 200.50 0 20.26 2.3519.790sec-Butylbenzene 20.00 90.6 76 122 200.50 0 19.22 5.9518.110Styrene 20.00 95.1 43 145 200.50 0 19.20 0.99519.010tert-Butylbenzene 20.00 95.2 78 120 200.50 0 20.18 5.7619.050Tetrachloroethene 20.00 106 71 123 200.50 0 21.53 1.6421.180Toluene 20.00 101 80 120 200.50 0.03000 20.69 1.9520.290trans-1,2-Dichloroethene 20.00 90.4 64 132 200.50 0 19.23 6.2218.070Trichloroethene 20.00 112 79 121 200.50 0 22.75 1.6422.380Trichlorofluoromethane 20.00 121 65 144 200.50 0 25.07 3.3724.240Vinyl chloride 20.00 89.4 64 134 200.50 0 18.99 6.0817.870Xylenes, Total 60.00 97.8 70 130 201.5 0 60.50 3.1158.650 Surr: 1,2-Dichloroethane-d4 25.00 92.7 78 125 023.170 Surr: 4-Bromofluorobenzene 25.00 105 80 120 026.220 Surr: Dibromofluoromethane 25.00 96.2 80 122 024.040 Surr: Toluene-d8 25.00 103 80 120 025.690
Sample ID: P150319MB3
Batch ID: P15VW047 TestNo: EPA 8260B Analysis Date: 3/19/2015
Prep Date:
Analyte Result SPK value SPK Ref Val %REC RPD Ref Val %RPDLowLimit HighLimit RPDLimit Qual
Units: µg/L
PQL
Client ID: PBW
RunNo: 99529
SeqNo: 1957486
MBLKSampType: TestCode: 8260WATERP
1,1,1,2-Tetrachloroethane 0.50ND1,1,1-Trichloroethane 0.50ND1,1,2,2-Tetrachloroethane 0.50ND
Qualifiers:
B Analyte detected in the associated Method Blank E Value above quantitation range H Holding times for preparation or analysis exceeded
ND Not Detected at the Reporting Limit R RPD outside accepted recovery limits S Spike/Surrogate outside of limits due to matrix interference
DO Surrogate Diluted Out Calculations are based on raw values
28 of 31

NEVADA 3151 W. Post Rd., Las Vegas, NV 89118
P: 702.307.2659 F: 702.307.2691
“Serving Clients with Passion and Professionalism”
CALIFORNIA 11060 Artesia Blvd., Ste C, Cerritos, CA 90703
P: 562.219.7435 F: 562.219.7436
Project: Maryland Square, Z085000030
CLIENT: Cardno ATC
Work Order: N014984ANALYTICAL QC SUMMARY REPORT
TestCode: 8260WATERP
Sample ID: P150319MB3
Batch ID: P15VW047 TestNo: EPA 8260B Analysis Date: 3/19/2015
Prep Date:
Analyte Result SPK value SPK Ref Val %REC RPD Ref Val %RPDLowLimit HighLimit RPDLimit Qual
Units: µg/L
PQL
Client ID: PBW
RunNo: 99529
SeqNo: 1957486
MBLKSampType: TestCode: 8260WATERP
1,1,2-Trichloroethane 0.50ND1,1-Dichloroethane 0.50ND1,1-Dichloroethene 0.50ND1,1-Dichloropropene 0.50ND1,2,3-Trichlorobenzene 0.50ND1,2,3-Trichloropropane 0.50ND1,2,4-Trichlorobenzene 0.50ND1,2,4-Trimethylbenzene 0.50ND1,2-Dibromo-3-chloropropane 1.0ND1,2-Dibromoethane 0.50ND1,2-Dichlorobenzene 0.50ND1,2-Dichloroethane 0.50ND1,2-Dichloropropane 0.50ND1,3,5-Trimethylbenzene 0.50ND1,3-Dichlorobenzene 0.50ND1,3-Dichloropropane 0.50ND1,4-Dichlorobenzene 0.50ND2,2-Dichloropropane 0.50ND2-Butanone 5.0ND2-Chlorotoluene 0.50ND4-Chlorotoluene 0.50ND4-Isopropyltoluene 0.50NDBenzene 0.50NDBromobenzene 0.50NDBromodichloromethane 0.50NDBromoform 0.50NDBromomethane 1.0NDCarbon tetrachloride 0.50NDChlorobenzene 0.50NDChloroethane 1.0ND
Qualifiers:
B Analyte detected in the associated Method Blank E Value above quantitation range H Holding times for preparation or analysis exceeded
ND Not Detected at the Reporting Limit R RPD outside accepted recovery limits S Spike/Surrogate outside of limits due to matrix interference
DO Surrogate Diluted Out Calculations are based on raw values
29 of 31

NEVADA 3151 W. Post Rd., Las Vegas, NV 89118
P: 702.307.2659 F: 702.307.2691
“Serving Clients with Passion and Professionalism”
CALIFORNIA 11060 Artesia Blvd., Ste C, Cerritos, CA 90703
P: 562.219.7435 F: 562.219.7436
Project: Maryland Square, Z085000030
CLIENT: Cardno ATC
Work Order: N014984ANALYTICAL QC SUMMARY REPORT
TestCode: 8260WATERP
Sample ID: P150319MB3
Batch ID: P15VW047 TestNo: EPA 8260B Analysis Date: 3/19/2015
Prep Date:
Analyte Result SPK value SPK Ref Val %REC RPD Ref Val %RPDLowLimit HighLimit RPDLimit Qual
Units: µg/L
PQL
Client ID: PBW
RunNo: 99529
SeqNo: 1957486
MBLKSampType: TestCode: 8260WATERP
Chloroform 0.50NDChloromethane 0.500.170cis-1,2-Dichloroethene 0.50NDDibromochloromethane 0.50NDDibromomethane 0.50NDDichlorodifluoromethane 0.50NDEthylbenzene 0.50NDFreon-113 0.50NDHexachlorobutadiene 0.50NDIsopropylbenzene 0.50NDm,p-Xylene 1.0NDMethylene chloride 2.00.600MTBE 0.50NDn-Butylbenzene 0.50NDn-Propylbenzene 0.50NDNaphthalene 0.50NDo-Xylene 0.50NDsec-Butylbenzene 0.50NDStyrene 0.50NDtert-Butylbenzene 0.50NDTetrachloroethene 0.50NDToluene 0.500.030trans-1,2-Dichloroethene 0.50NDTrichloroethene 0.50NDTrichlorofluoromethane 0.50NDVinyl chloride 0.50NDXylenes, Total 1.5ND Surr: 1,2-Dichloroethane-d4 25.00 96.7 78 12524.180 Surr: 4-Bromofluorobenzene 25.00 99.5 80 12024.880 Surr: Dibromofluoromethane 25.00 99.7 80 12224.920
Qualifiers:
B Analyte detected in the associated Method Blank E Value above quantitation range H Holding times for preparation or analysis exceeded
ND Not Detected at the Reporting Limit R RPD outside accepted recovery limits S Spike/Surrogate outside of limits due to matrix interference
DO Surrogate Diluted Out Calculations are based on raw values
30 of 31

NEVADA 3151 W. Post Rd., Las Vegas, NV 89118
P: 702.307.2659 F: 702.307.2691
“Serving Clients with Passion and Professionalism”
CALIFORNIA 11060 Artesia Blvd., Ste C, Cerritos, CA 90703
P: 562.219.7435 F: 562.219.7436
Project: Maryland Square, Z085000030
CLIENT: Cardno ATC
Work Order: N014984ANALYTICAL QC SUMMARY REPORT
TestCode: 8260WATERP
Sample ID: P150319MB3
Batch ID: P15VW047 TestNo: EPA 8260B Analysis Date: 3/19/2015
Prep Date:
Analyte Result SPK value SPK Ref Val %REC RPD Ref Val %RPDLowLimit HighLimit RPDLimit Qual
Units: µg/L
PQL
Client ID: PBW
RunNo: 99529
SeqNo: 1957486
MBLKSampType: TestCode: 8260WATERP
Surr: Toluene-d8 25.00 101 80 12025.220
Qualifiers:
B Analyte detected in the associated Method Blank E Value above quantitation range H Holding times for preparation or analysis exceeded
ND Not Detected at the Reporting Limit R RPD outside accepted recovery limits S Spike/Surrogate outside of limits due to matrix interference
DO Surrogate Diluted Out Calculations are based on raw values
31 of 31

Maryland Square PCE Site
APPENDIX C MANN-KENDALL TREND TEST FOR PLUME STABILITY

Evaluation Date: Job ID:Facility Name: Constituent:
Conducted By: Concentration Units: µg/L
Sampling Point ID: MW-1 MW-2 MW-3 MW-5 MW-6 MW-7 MW-8Sampling Sampling
Event Date1 Aug 00 2,3002 Oct 00 3,000 98 100 2,2003 Sep 02 2,000 3,000 0.25 110 1,000 0.25 5.44 May 03 870 1,400 6.9 240 710 1.7 3.25 Sep 03 2,300 1,700 12 220 1,300 2 3.76 Jan 04 1,700 1,700 6.7 370 2,400 11 4.77 May 05 3,500 2,050 0.25 146 2,090 0.25 5.68 Sep 05 1,700 890 3.39 Dec 05 820 1,600 0.25 93 530 1.2 3.610 Mar 06 420 1.511 Jun 06 0.25 220 1,100 2.2 2.612 Oct 06 1,100 1,900 0.25 67 1,300 2.9 3.413 Dec 06 1,300 1,300 1.2 130 810 2.1 4.314 Jun 07 450 1,400 0.25 550 1,300 1.1 2.815 Dec 07 710 1,000 1.4 170 1,500 1.3 2.816 Jun 08 260 900 400 1,90017 Oct 08 460 960 6.5 340 2,000 2.5 3.718 Jun 09 590 880 700 2,80019 Nov 09 390 530 5.1 520 2,100 7.9 2.820 Jun 10 400 570 550 2,50021 Nov 10 430 560 5.8 360 2,300 2.0 422 Jun 11 460 680 670 2,40023 Nov 11 410 610 16 540 2,900 8.924 Mar 12 370 800 3,50025 Jun 12 410 490 25 520 1,700 10 3.526 Sep 12 390 340 3,00027 Mar 13 260 580 12 530 2,600 10 1.528 Jun 13 240 600 2,40029 Sep 13 240 830 2,50030 Nov 13 270 720 690 3,100 8.4 2.231 Jun 14 350 780 3,00032 Sep 14 96 350 700 4.733 Nov 14 240 740 3,30034 Mar 15 210 550 13 790 3,300 17 2.435Coefficient of Variation: 1.00 0.61 1.99 0.56 0.43 0.96 0.31
Mann-Kendall Statistic (S): -367 -184 41 261 257 106 -65Confidence Factor: >99.9% >99.9% 91.8% >99.9% >99.9% 99.9% 99.3%
Concentration Trend: Decreasing Decreasing Prob. Increasing Increasing Increasing Increasing Decreasing
Notes: 1. At least four independent sampling events per well are required for calculating the trend. Methodology is valid for 4 to 40 samples.2. Confidence in Trend = Confidence (in percent) that constituent concentration is increasing (S>0) or decreasing (S<0): >95% = Increasing or Decreasing;
≥ 90% = Probably Increasing or Probably Decreasing; < 90% and S>0 = No Trend; < 90%, S≤0, and COV ≥ 1 = No Trend; < 90% and COV < 1 = Stable. 3. Methodology based on "MAROS: A Decision Support System for Optimizing Monitoring Plans", J.J. Aziz, M. Ling, H.S. Rifai, C.J. Newell, and J.R. Gonzales,
Ground Water , 41(3):355-367, 2003.
DISCLAIMER: The GSI Mann-Kendall Toolkit is available "as is". Considerable care has been exercised in preparing this software product; however, no party, including withoutlimitation GSI Environmental Inc., makes any representation or warranty regarding the accuracy, correctness, or completeness of the information contained herein, and no suchparty shall be liable for any direct, indirect, consequential, incidental or other damages resulting from the use of this product or the information contained herein. Information inthis publication is subject to change without notice. GSI Environmental Inc., disclaims any responsibility or obligation to update the information contained herein.
GSI Environmental Inc., www.gsi-net.com
PCE CONCENTRATION (µg/L)
15-Apr-14Maryland Square PCE Site PCE
GSI MANN-KENDALL TOOLKITfor Constituent Trend Analysis
Cardno ATC
Z085000030
0.1
1
10
100
1000
07/98 04/01 01/04 10/06 07/09 04/12 12/14 09/17
Con
cent
ratio
n (µ
g/L)
Sampling Date
MW-1
MW-2
MW-3
MW-5
MW-6
MW-7
MW-8

Evaluation Date: Job ID:Facility Name: Constituent:
Conducted By: Concentration Units: µg/L
Sampling Point ID: MW-9 MW-10 MW-12 MW-13 MW-14 MW-15 MW-17Sampling Sampling
Event Date1 Sep 02 670 0.25 0.252 May 03 59 0.25 1.3 21003 Sep 03 9 15 14 2,800 1900 5.24 Jan 04 10 0.25 6.1 2,700 2100 2.75 May 05 353 0.25 0.25 5,310 2,920 0.25 5206 Sep 05 64 0.25 1.1 2,600 3.67 Dec 05 190 0.25 1.2 3,400 3,400 5 4708 Mar 06 0.25 0.25 1.1 3,700 2,500 4.59 Jun 06 0.25 2,900 1,800 4.4
10 Oct 06 160 0.25 0.25 2,800 1,900 3.3 130011 Dec 06 45 0.25 1.4 3,200 3,500 3.7 71012 Mar 07 1 2,500 1,900 44013 Jun 07 170 0.25 3,700 1,700 3 30014 Sep 07 0.25 2,000 650 38015 Dec 07 110 0.25 2,500 1,500 3 48016 Mar 08 117 Jun 08 2,300 1,500 36018 Oct 08 12 0.25 2 2,600 1,500 7.8 29019 Jun 09 13 2,200 1,900 27020 Nov 09 6 0.25 1.2 1,700 1,200 3 31021 Jun 10 7 1,600 1,500 27022 Nov 10 4 0.25 0.76 1,900 1,500 2.5 24023 Jun 11 2 1,600 1,700 35024 Nov 11 5.6 0.25 0.95 1,700 1,700 3.5 35025 May 12 5.2 1,600 32026 Jun 12 5.7 0.9 1.2 1,500 1,400 4.2 26027 Sep 12 3.7 1,300 25028 Mar 13 6.6 0.25 0.65 1,300 1,900 2.7 19029 Jun 13 9.8 1,300 15030 Sep 13 6.6 1,400 13031 Nov 13 11.0 0.86 1,800 1,500 12032 Jun 1433 Sep 14 7.9 640 33034 Nov 1435 Mar 15 9.7 0.25 0.77 1,700 1,900 3.6 653637383940
Coefficient of Variation: 2.04 3.00 1.75 0.39 0.38 0.41 0.69Mann-Kendall Statistic (S): -126 -1 -26 -215 -171 -22 -208
Confidence Factor: 99.4% 50.0% 78.9% >99.9% 99.9% 78.4% >99.9%Concentration Trend: Decreasing No Trend No Trend Decreasing Decreasing Stable Decreasing
Notes: 1. At least four independent sampling events per well are required for calculating the trend. Methodology is valid for 4 to 40 samples.2. Confidence in Trend = Confidence (in percent) that constituent concentration is increasing (S>0) or decreasing (S<0): >95% = Increasing or Decreasing;
≥ 90% = Probably Increasing or Probably Decreasing; < 90% and S>0 = No Trend; < 90%, S≤0, and COV ≥ 1 = No Trend; < 90% and COV < 1 = Stable. 3. Methodology based on "MAROS: A Decision Support System for Optimizing Monitoring Plans", J.J. Aziz, M. Ling, H.S. Rifai, C.J. Newell, and J.R. Gonzales,
Ground Water , 41(3):355-367, 2003.
DISCLAIMER: The GSI Mann-Kendall Toolkit is available "as is". Considerable care has been exercised in preparing this software product; however, no party, including withoutlimitation GSI Environmental Inc., makes any representation or warranty regarding the accuracy, correctness, or completeness of the information contained herein, and no suchparty shall be liable for any direct, indirect, consequential, incidental or other damages resulting from the use of this product or the information contained herein. Information inthis publication is subject to change without notice. GSI Environmental Inc., disclaims any responsibility or obligation to update the information contained herein.
GSI Environmental Inc., www.gsi-net.com
PCE CONCENTRATION (µg/L)
15-Apr-14Maryland Square PCE Site PCE
GSI MANN-KENDALL TOOLKITfor Constituent Trend Analysis
Cardno ATC
Z085000030
0.1
1
10
100
1000
10000
04/01 01/04 10/06 07/09 04/12 12/14 09/17
Con
cent
ratio
n (µ
g/L)
Sampling Date
MW-9
MW-10
MW-12
MW-13
MW-14
MW-15
MW-17

Evaluation Date: Job ID:Facility Name: Constituent:
Conducted By: Concentration Units: µg/L
Sampling Point ID: MW-18 MW-19 MW-20 MW-21 MW-23 MW-24 MW-25Sampling Sampling
Event Date1 Sep 03 1,100 1,800 512 Jan 04 1,200 290 553 May 05 1,600 873 1,460 30 1,430 0.25 9934 Sep 05 1,700 19 4.3 9205 Dec 05 2,400 1,300 1,800 16 1,900 6.7 1,0006 Mar 06 1,700 43 6.5 9707 Jun 06 1,600 910 2,100 32 1,500 5.6 9608 Oct 06 2,100 840 2,000 23 2,000 2.6 1,3009 Dec 06 1,400 1,200 2,500 39 2,100 2.6 1,200
10 Mar 07 1,400 890 1,500 2.1 1.0 67011 Jun 07 1,300 870 1,300 28 1,300 0.25 96012 Sep 07 930 510 730 750 56013 Dec 07 1,400 990 1,400 83 1,200 78014 Mar 08 1,800 1,200 1,600 1,400 89015 Jun 08 1,200 930 1,200 1,100 63016 Oct 08 950 1,300 1,000 20 1,300 6.1 73017 Feb 09 1,500 830 1,100 77018 Jun 09 3,500 1,400 1,100 1,400 88019 Sep 09 1,200 880 940 1,200 77020 Nov 09 1,400 580 640 11 880 2.9 57021 Feb 10 1,600 990 990 1,000 46022 Jun 10 1,100 930 780 900 55023 Oct 10 1,300 420 340 1,100 76024 Nov 10 1,200 840 890 13 970 0.81 55025 Mar 11 1,000 880 800 1,100 42026 Jun 11 1,300 1,000 740 970 70027 Sep 11 1,300 950 680 1,000 68028 Nov 11 1,100 1,100 800 13 1,100 0.95 74029 Jun 12 1,300 1,000 660 9.4 950 1.3 66030 Mar 13 1,200 520 290 8.4 960 1.3 66031 Jun 13 530 66032 Sep 13 840 57033 Nov 13 780 440 530 900 70034 Jun 14 1,100 850 78035 Sep 14 620 120 55036 Nov 14 1,100 870 59037 Mar 15 1,200 930 680 11.0 740 0.58 640383940
Coefficient of Variation: 0.37 0.28 0.53 0.71 0.40 0.86 0.27Mann-Kendall Statistic (S): -252 -80 -293 -85 -253 -39 -246
Confidence Factor: >99.9% 92.0% >99.9% 100.0% >99.9% 95.7% >99.9%Concentration Trend: Decreasing Prob. Decreasing Decreasing Decreasing Decreasing Decreasing Decreasing
Notes: 1. At least four independent sampling events per well are required for calculating the trend. Methodology is valid for 4 to 40 samples.2. Confidence in Trend = Confidence (in percent) that constituent concentration is increasing (S>0) or decreasing (S<0): >95% = Increasing or Decreasing;
≥ 90% = Probably Increasing or Probably Decreasing; < 90% and S>0 = No Trend; < 90%, S≤0, and COV ≥ 1 = No Trend; < 90% and COV < 1 = Stable. 3. Methodology based on "MAROS: A Decision Support System for Optimizing Monitoring Plans", J.J. Aziz, M. Ling, H.S. Rifai, C.J. Newell, and J.R. Gonzales,
Ground Water , 41(3):355-367, 2003.
DISCLAIMER: The GSI Mann-Kendall Toolkit is available "as is". Considerable care has been exercised in preparing this software product; however, no party, including withoutlimitation GSI Environmental Inc., makes any representation or warranty regarding the accuracy, correctness, or completeness of the information contained herein, and no suchparty shall be liable for any direct, indirect, consequential, incidental or other damages resulting from the use of this product or the information contained herein. Information inthis publication is subject to change without notice. GSI Environmental Inc., disclaims any responsibility or obligation to update the information contained herein.
GSI Environmental Inc., www.gsi-net.com
PCE CONCENTRATION (µg/L)
15-Apr-14Maryland Square PCE Site PCE
GSI MANN-KENDALL TOOLKITfor Constituent Trend Analysis
Cardno ATC
Z085000030
0.1
1
10
100
1000
10000
09/02 01/04 05/05 10/06 02/08 07/09 11/10 04/12 08/13 12/14 05/16
Con
cent
ratio
n (µ
g/L)
Sampling Date
MW-18
MW-19
MW-20
MW-21
MW-23
MW-24
MW-25
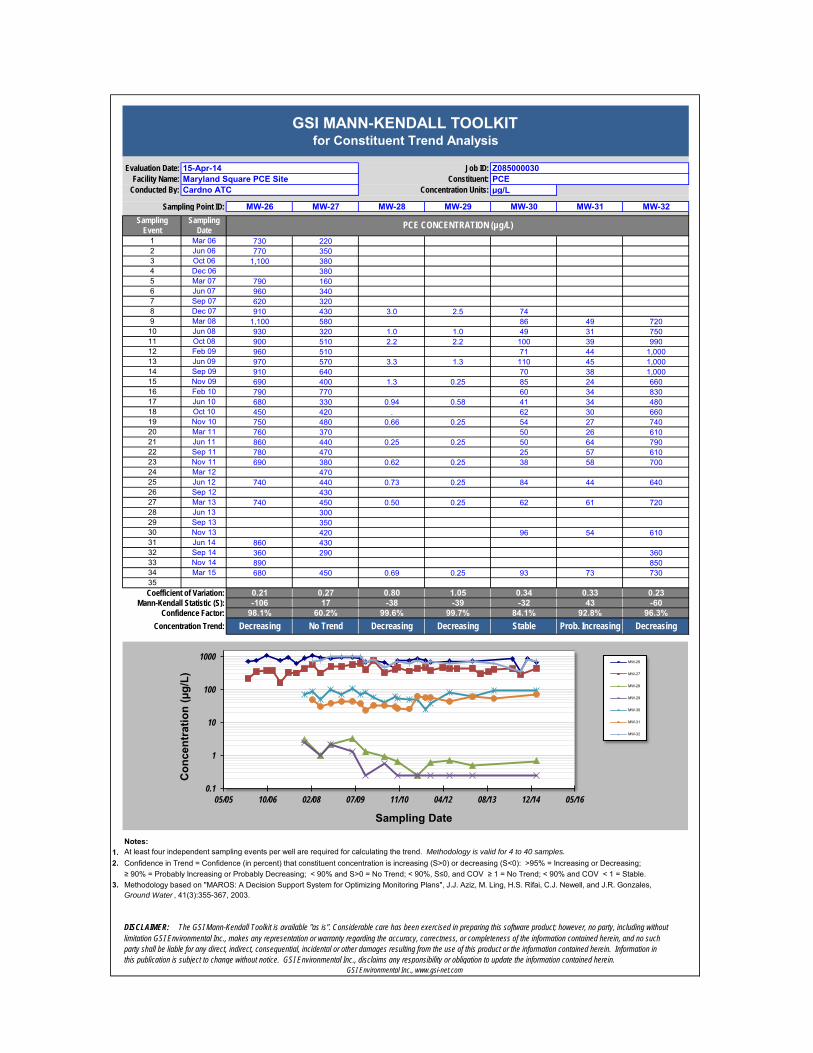
Evaluation Date: Job ID:Facility Name: Constituent:
Conducted By: Concentration Units: µg/L
Sampling Point ID: MW-26 MW-27 MW-28 MW-29 MW-30 MW-31 MW-32Sampling Sampling
Event Date1 Mar 06 730 2202 Jun 06 770 3503 Oct 06 1,100 3804 Dec 06 3805 Mar 07 790 1606 Jun 07 960 3407 Sep 07 620 3208 Dec 07 910 430 3.0 2.5 749 Mar 08 1,100 580 86 49 72010 Jun 08 930 320 1.0 1.0 49 31 75011 Oct 08 900 510 2.2 2.2 100 39 99012 Feb 09 960 510 71 44 1,00013 Jun 09 970 570 3.3 1.3 110 45 1,00014 Sep 09 910 640 70 38 1,00015 Nov 09 690 400 1.3 0.25 85 24 66016 Feb 10 790 770 60 34 83017 Jun 10 680 330 0.94 0.58 41 34 48018 Oct 10 450 420 . 62 30 66019 Nov 10 750 480 0.66 0.25 54 27 74020 Mar 11 760 370 50 26 61021 Jun 11 860 440 0.25 0.25 50 64 79022 Sep 11 780 470 25 57 61023 Nov 11 690 380 0.62 0.25 38 58 70024 Mar 12 47025 Jun 12 740 440 0.73 0.25 84 44 64026 Sep 12 43027 Mar 13 740 450 0.50 0.25 62 61 72028 Jun 13 30029 Sep 13 35030 Nov 13 420 96 54 61031 Jun 14 860 43032 Sep 14 360 290 36033 Nov 14 890 85034 Mar 15 680 450 0.69 0.25 93 73 73035Coefficient of Variation: 0.21 0.27 0.80 1.05 0.34 0.33 0.23
Mann-Kendall Statistic (S): -106 17 -38 -39 -32 43 -60Confidence Factor: 98.1% 60.2% 99.6% 99.7% 84.1% 92.8% 96.3%
Concentration Trend: Decreasing No Trend Decreasing Decreasing Stable Prob. Increasing Decreasing
Notes: 1. At least four independent sampling events per well are required for calculating the trend. Methodology is valid for 4 to 40 samples.2. Confidence in Trend = Confidence (in percent) that constituent concentration is increasing (S>0) or decreasing (S<0): >95% = Increasing or Decreasing;
≥ 90% = Probably Increasing or Probably Decreasing; < 90% and S>0 = No Trend; < 90%, S≤0, and COV ≥ 1 = No Trend; < 90% and COV < 1 = Stable. 3. Methodology based on "MAROS: A Decision Support System for Optimizing Monitoring Plans", J.J. Aziz, M. Ling, H.S. Rifai, C.J. Newell, and J.R. Gonzales,
Ground Water , 41(3):355-367, 2003.
DISCLAIMER: The GSI Mann-Kendall Toolkit is available "as is". Considerable care has been exercised in preparing this software product; however, no party, including withoutlimitation GSI Environmental Inc., makes any representation or warranty regarding the accuracy, correctness, or completeness of the information contained herein, and no suchparty shall be liable for any direct, indirect, consequential, incidental or other damages resulting from the use of this product or the information contained herein. Information inthis publication is subject to change without notice. GSI Environmental Inc., disclaims any responsibility or obligation to update the information contained herein.
GSI Environmental Inc., www.gsi-net.com
PCE CONCENTRATION (µg/L)
15-Apr-14Maryland Square PCE Site PCE
GSI MANN-KENDALL TOOLKITfor Constituent Trend Analysis
Cardno ATC
Z085000030
0.1
1
10
100
1000
05/05 10/06 02/08 07/09 11/10 04/12 08/13 12/14 05/16
Con
cent
ratio
n (µ
g/L)
Sampling Date
MW-26
MW-27
MW-28
MW-29
MW-30
MW-31
MW-32

Evaluation Date: Job ID:Facility Name: Constituent:
Conducted By: Concentration Units: µg/L
Sampling Point ID: MW-33 MW-34 MW-35 MW-36 MW-37 MW-38 MW-39Sampling Sampling
Event Date1 Mar 08 2.42 Jun 08 1.03 Oct 08 3.44 Feb 09 0.255 Jun 09 0.256 Sep 09 3.37 Nov 09 1.48 Feb 10 0.259 Jun 10 0.2510 Oct 10 0.2511 Nov 10 0.2512 Mar 11 0.2513 Jun 11 0.2514 Sep 11 0.25 910 41015 Nov 11 0.25 1,000 63016 Mar 12 1,000 580 160 3617 Jun 12 0.25 860 530 130 34 5.8 25018 Sep 12 730 520 130 32 5.7 24019 Nov 12 550 480 150 31 5.9 27020 Mar 13 0.25 550 340 160 34 7.3 28021 Jun 13 380 250 110 37 7.8 21022 Sep 13 440 250 140 40 6.6 25023 Nov-13 0.25 500 310 130 33 7.0 26024 Jun 14 5.4 12025 Sep 14 5.8 12026 Nov 14 8.227 Mar 15 0.25 370 180 150 35 6.0 160282930
Coefficient of Variation: 1.34 0.37 0.37 0.12 0.08 0.15 0.28Mann-Kendall Statistic (S): -62 -43 -40 -3 5 10 -17
Confidence Factor: 98.5% >99.9% 100.0% 58.0% 65.7% 75.3% 92.2%Concentration Trend: Decreasing Decreasing Decreasing Stable No Trend No Trend Prob. Decreasing
Notes: 1. At least four independent sampling events per well are required for calculating the trend. Methodology is valid for 4 to 40 samples.2. Confidence in Trend = Confidence (in percent) that constituent concentration is increasing (S>0) or decreasing (S<0): >95% = Increasing or Decreasing;
≥ 90% = Probably Increasing or Probably Decreasing; < 90% and S>0 = No Trend; < 90%, S≤0, and COV ≥ 1 = No Trend; < 90% and COV < 1 = Stable. 3. Methodology based on "MAROS: A Decision Support System for Optimizing Monitoring Plans", J.J. Aziz, M. Ling, H.S. Rifai, C.J. Newell, and J.R. Gonzales,
Ground Water , 41(3):355-367, 2003.
DISCLAIMER: The GSI Mann-Kendall Toolkit is available "as is". Considerable care has been exercised in preparing this software product; however, no party, including withoutlimitation GSI Environmental Inc., makes any representation or warranty regarding the accuracy, correctness, or completeness of the information contained herein, and no suchparty shall be liable for any direct, indirect, consequential, incidental or other damages resulting from the use of this product or the information contained herein. Information inthis publication is subject to change without notice. GSI Environmental Inc., disclaims any responsibility or obligation to update the information contained herein.
GSI Environmental Inc., www.gsi-net.com
PCE CONCENTRATION (µg/L)
15-Apr-14Maryland Square PCE Site PCE
GSI MANN-KENDALL TOOLKITfor Constituent Trend Analysis
Cardno ATC
Z085000030
0.1
1
10
100
1000
10/06 02/08 07/09 11/10 04/12 08/13 12/14 05/16
Con
cent
ratio
n (µ
g/L)
Sampling Date
MW-33
MW-34
MW-35
MW-36
MW-37
MW-38
MW-39

Evaluation Date: Job ID:Facility Name: Constituent:
Conducted By: Concentration Units: µg/L
Sampling Point ID: MW-40 CMT 30 MW-40 CMT 35 MW-40 CMT 40 MW-40 CMT 45 MW-40 CMT50 MW-40 CMT 55 MW-40 CMT 60Sampling Sampling
Event Date1 Nov 12 340 260 320 280 300 930 1,4002 Mar 13 4.7 48 270 310 280 390 1,2003 Jun 13 10 3.6 53 47 64 200 1,0004 Sep 13 2.1 7.9 37 110 24 38 205 Nov-13 1.3 12 51 77 120 110 1906 Jun 14 3.2 250 7507 Sep 14 4.6 240 7008 Nov 14 35 150 1,0009 Mar 15 14 13 100 120 160 430 1901011121314151617181920
Coefficient of Variation: 2.40 1.05 0.90 0.54 0.71 0.73 0.68Mann-Kendall Statistic (S): 0 2 -7 -6 -5 0 -14
Confidence Factor: 46.0% 59.2% 86.4% 69.4% 76.5% 40.8% 91.0%Concentration Trend: No Trend No Trend Stable Stable Stable Stable Prob. Decreasing
Notes: 1. At least four independent sampling events per well are required for calculating the trend. Methodology is valid for 4 to 40 samples.2. Confidence in Trend = Confidence (in percent) that constituent concentration is increasing (S>0) or decreasing (S<0): >95% = Increasing or Decreasing;
≥ 90% = Probably Increasing or Probably Decreasing; < 90% and S>0 = No Trend; < 90%, S≤0, and COV ≥ 1 = No Trend; < 90% and COV < 1 = Stable. 3. Methodology based on "MAROS: A Decision Support System for Optimizing Monitoring Plans", J.J. Aziz, M. Ling, H.S. Rifai, C.J. Newell, and J.R. Gonzales,
Ground Water , 41(3):355-367, 2003.
DISCLAIMER: The GSI Mann-Kendall Toolkit is available "as is". Considerable care has been exercised in preparing this software product; however, no party, including withoutlimitation GSI Environmental Inc., makes any representation or warranty regarding the accuracy, correctness, or completeness of the information contained herein, and no suchparty shall be liable for any direct, indirect, consequential, incidental or other damages resulting from the use of this product or the information contained herein. Information inthis publication is subject to change without notice. GSI Environmental Inc., disclaims any responsibility or obligation to update the information contained herein.
PCE CONCENTRATION (µg/L)
GSI Environmental Inc., www.gsi-net.com
GSI MANN-KENDALL TOOLKITfor Constituent Trend Analysis
15-Apr-14 Z085000030Maryland Square PCE Site PCECardno ATC
1
10
100
1000
07/12 10/12 01/13 05/13 08/13 11/13 03/14 06/14 09/14 12/14 04/15 07/15
Con
cent
ratio
n (µ
g/L)
Sampling Date
MW-40CMT 30
MW-40CMT 35
MW-40CMT 40
MW-40CMT 45
MW-40CMT50
MW-40CMT 55
MW-40CMT 60

Evaluation Date: Job ID:Facility Name: Constituent:
Conducted By: Concentration Units: µg/L
Sampling Point ID: MW-14I MW-6D1 MW-6D2 MW-6D3 MW-19D1 MW-19D2 MW-19D3Sampling Sampling
Event Date1 Mar 13 7,200 0.25 0.25 0.25 300 170 0.502 Jun 13 5,500 0.25 0.25 0.25 690 0.25 0.683 Sep 13 3,700 58 33 2.0 990 0.25 7104 Nov-13 10,000 3.2 3.3 3.0 620 0.25 1605 Jun 14 9,800 0.67 730 6.0 406 Sep 14 9,300 120 10 240 10 7107 Nov 14 11,000 21 1,000 39 1908 Mar 15 11,000 3.0 3.2 32 210 44 4191011121314151617181920
Coefficient of Variation: 0.32 1.53 1.76 1.56 0.53 1.34 1.31Mann-Kendall Statistic (S): 15 3 3 14 -2 18 9
Confidence Factor: 95.8% 61.4% 67.5% 99.6% 54.8% 99.7% 83.2%Concentration Trend: Increasing No Trend No Trend Increasing Stable Increasing No Trend
Notes: 1. At least four independent sampling events per well are required for calculating the trend. Methodology is valid for 4 to 40 samples.2. Confidence in Trend = Confidence (in percent) that constituent concentration is increasing (S>0) or decreasing (S<0): >95% = Increasing or Decreasing;
≥ 90% = Probably Increasing or Probably Decreasing; < 90% and S>0 = No Trend; < 90%, S≤0, and COV ≥ 1 = No Trend; < 90% and COV < 1 = Stable. 3. Methodology based on "MAROS: A Decision Support System for Optimizing Monitoring Plans", J.J. Aziz, M. Ling, H.S. Rifai, C.J. Newell, and J.R. Gonzales,
Ground Water , 41(3):355-367, 2003.
DISCLAIMER: The GSI Mann-Kendall Toolkit is available "as is". Considerable care has been exercised in preparing this software product; however, no party, including withoutlimitation GSI Environmental Inc., makes any representation or warranty regarding the accuracy, correctness, or completeness of the information contained herein, and no suchparty shall be liable for any direct, indirect, consequential, incidental or other damages resulting from the use of this product or the information contained herein. Information inthis publication is subject to change without notice. GSI Environmental Inc., disclaims any responsibility or obligation to update the information contained herein.
PCE CONCENTRATION (µg/L)
GSI Environmental Inc., www.gsi-net.com
GSI MANN-KENDALL TOOLKITfor Constituent Trend Analysis
15-Apr-14 Z085000030Maryland Square PCE Site PCECardno ATC
0.1
1
10
100
1000
01/13 05/13 08/13 11/13 03/14 06/14 09/14 12/14 04/15
Con
cent
ratio
n (µ
g/L)
Sampling Date
MW-14I
MW-6D1
MW-6D2
MW-6D3
MW-19D1
MW-19D2
MW-19D3

Evaluation Date: Job ID:Facility Name: Constituent:
Conducted By: Concentration Units: µg/L
Sampling Point ID: MW-19I MW-20D1 MW-20D2 MW-20D3 MW-41 MW-42 MW-43Sampling Sampling
Event Date1 Sep 12 6902 Jun 13 0.25 110 64 0.253 Sep 13 0.25 100 210 25 1.7 0.53 0.254 Nov-13 0.25 260 160 62 2.6 0.60 0.255 Jun 14 0.25 120 2.8 0.58 0.256 Sep 14 0.25 160 140 10 2.8 0.53 0.257 Nov 14 0.25 410 3.7 0.71 0.258 Mar 15 0.62 340 230 0.25 3.5 0.62 0.2591011121314151617181920
Coefficient of Variation: 2.82 0.53 0.59 1.33 0.25 0.11 0.00Mann-Kendall Statistic (S): -1 6 9 -1 12 6 0
Confidence Factor: 50.0% 88.3% 88.1% 50.0% 98.2% 81.5% 39.3%Concentration Trend: No Trend No Trend No Trend No Trend Increasing No Trend Stable
Notes: 1. At least four independent sampling events per well are required for calculating the trend. Methodology is valid for 4 to 40 samples.2. Confidence in Trend = Confidence (in percent) that constituent concentration is increasing (S>0) or decreasing (S<0): >95% = Increasing or Decreasing;
≥ 90% = Probably Increasing or Probably Decreasing; < 90% and S>0 = No Trend; < 90%, S≤0, and COV ≥ 1 = No Trend; < 90% and COV < 1 = Stable. 3. Methodology based on "MAROS: A Decision Support System for Optimizing Monitoring Plans", J.J. Aziz, M. Ling, H.S. Rifai, C.J. Newell, and J.R. Gonzales,
Ground Water , 41(3):355-367, 2003.
DISCLAIMER: The GSI Mann-Kendall Toolkit is available "as is". Considerable care has been exercised in preparing this software product; however, no party, including withoutlimitation GSI Environmental Inc., makes any representation or warranty regarding the accuracy, correctness, or completeness of the information contained herein, and no suchparty shall be liable for any direct, indirect, consequential, incidental or other damages resulting from the use of this product or the information contained herein. Information inthis publication is subject to change without notice. GSI Environmental Inc., disclaims any responsibility or obligation to update the information contained herein.
PCE CONCENTRATION (µg/L)
GSI Environmental Inc., www.gsi-net.com
GSI MANN-KENDALL TOOLKITfor Constituent Trend Analysis
15-Apr-14 Z085000030Maryland Square PCE Site PCECardno ATC
0.1
1
10
100
1000
04/12 10/12 05/13 11/13 06/14 12/14 07/15
Con
cent
ratio
n (µ
g/L)
Sampling Date
MW-19I
MW-20D1
MW-20D2
MW-20D3
MW-41
MW-42
MW-43