first quarter 2016 results - ubs.com · and market developments on the financial pos ition or ......
TRANSCRIPT
May 3, 2016
First quarter 2016 results
1
Cautionary statement regarding forward-looking statementsThis presentation contains statements that constitute “forward-looking statements,” including but not limited to management’s outlook for UBS’s financial performance and statements relating to the anticipated effect of transactions and strategic initiatives on UBS’s business and future development. While these forward-looking statements represent UBS’s judgments and expectations concerning the matters described, a number of risks, uncertainties and other important factors could cause actual developments and results to differ materially from UBS’s expectations. These factors include, but are not limited to: (i) the degree to which UBS is successful in executing its announced strategic plans, including its cost reduction and efficiency initiatives and its targets for risk-weighted assets (RWA) and leverage ratio denominator (LRD), and the degree to which UBS is successful in implementing changes to its wealth management businesses to meet changing market, regulatory and other conditions; (ii) the continuing low or negative interest rate environment, developments in the macroeconomic climate and in the markets in which UBS operates or to which it is exposed, including movements in securities prices or liquidity, credit spreads, and currency exchange rates, and the effect of economic conditions and market developments on the financial position or creditworthiness of UBS’s clients and counterparties; (iii) changes in the availability of capital and funding, including any changes in UBS’s credit spreads and ratings, as well as availability and cost of funding to meet requirements for debt that will be eligible for total loss-absorbing capacity (TLAC) requirements, or loss-absorbing capital; (iv) changes in or the implementation of financial legislation and regulation in Switzerland, the US, the UK and other financial centers that may impose, or result in, more stringent capital, TLAC, leverage ratio, liquidity and funding requirements, incremental tax requirements, additional levies, limitations on permitted activities, constraints on remuneration or other measures, and the effect this would have on UBS’s business activities; (v) uncertainty as to when and to what degree the Swiss Financial Market Supervisory Authority (FINMA) will approve a limited reduction of capital or gone concern requirements due to measures to reduce resolvability risk; (vi) the degree to which UBS is successful in implementing further changes to its legal structure to improve its resolvability and meet related regulatory requirements, including changes in legal structure and reporting required to implement US enhanced prudential standards, implementing a service company model, the transfer of the Asset Management business to a holding company, and the potential need to make further changes to the legal structure or booking model of UBS Group in response to legal and regulatory requirements relating to capital requirements, resolvability requirements and proposals in Switzerland and other countries for mandatory structural reform of banks and the extent to which such changes have the intended effects; (vii) changes in UBS’s competitive position, including whether differences in regulatory capital and other requirements among the major financial centers will adversely affect UBS’s ability to compete in certain lines of business; (viii) changes in the standards of conduct applicable to our businesses that may result from new regulation or new enforcement of existing standards, including proposed measures to impose new and enhanced duties when interacting with customers and in the execution and handling of customer transactions; (ix) the liability to which UBS may be exposed, or possible constraints or sanctions that regulatory authorities might impose on UBS, due to litigation, contractual claims and regulatory investigations, including the potential for disqualification from certain businesses or loss of licenses or privileges as a result of regulatory or other governmental sanctions, as well as the effect that litigation, regulatory and similar matters have on the operational component of our RWA; (x) the effects on UBS’s cross-border banking business of tax or regulatory developments and of possible changes in UBS’s policies and practices relating to this business; (xi) UBS’s ability to retain and attract the employees necessary to generate revenues and to manage, support and control its businesses, which may be affected by competitive factors including differences in compensation practices; (xii) changes in accounting or tax standards or policies, and determinations or interpretations affecting the recognition of gain or loss, the valuation of goodwill, the recognition of deferred tax assets and other matters; (xiii) limitations on the effectiveness of UBS’s internal processes for risk management, risk control, measurement and modeling, and of financial models generally; (xiv) whether UBS will be successful in keeping pace with competitors in updating its technology, particularly in trading businesses; (xv) the occurrence of operational failures, such as fraud, misconduct, unauthorized trading, financial crime, cyber-attacks, and systems failures; (xvi) restrictions on the ability of UBS Group AG to make payments or distributions, including due to restrictions on the ability of its subsidiaries to make loans or distributions, directly or indirectly, or, in the case of financial difficulties, due to the exercise by FINMA of its broad statutory powers in relation to protective measures, restructuring and liquidation proceedings; (xvii) the degree to which changes in regulation, capital or legal structure, financial results or other factors, including methodology, assumptions and stress scenarios, may affect UBS’s ability to maintain its stated capital return objective; and (xviii) the effect that these or other factors or unanticipated events may have on our reputation and the additional consequences that this may have on our business and performance. The sequence in which the factors above are presented is not indicative of their likelihood of occurrence or the potential magnitude of their consequences. Our business and financial performance could be affected by other factors identified in our past and future filings and reports, including those filed with the SEC. More detailed information about those factors is set forth in documents furnished by UBS and filings made by UBS with the SEC, including UBS’s Annual Report on Form 20-F for the year ended 31 December 2015. UBS is not under any obligation to (and expressly disclaims any obligation to) update or alter its forward-looking statements, whether as a result of new information, future events, or otherwise.
Disclaimer: This presentation and the information contained herein are provided solely for information purposes, and are not to be construed as a solicitation of an offer to buy or sell any securities or other financial instruments in Switzerland, the United States or any other jurisdiction. No investment decision relating to securities of or relating to UBS Group AG, UBS AG or their affiliates should be made on the basis of this document. Refer to first quarter 2016 report and its Annual Report on Form 20-F for the year ended 31 December 2015. No representation or warranty is made or implied concerning, and UBS assumes no responsibility for, the accuracy, completeness, reliability or comparability of the information contained herein relating to third parties, which is based solely on publicly available information. UBS undertakes no obligation to update the information contained herein.

2
1Q16 resultsResilient adjusted PBT CHF 1.4 billion in challenging market conditions
Group
Net profit attributable to UBS Group AG shareholders CHF 707 million, diluted EPS CHF 0.18
Reported profit before tax (PBT) CHF 978 million, adjusted PBT CHF 1,366 million
Adjusted return on tangible equity 8.5%
Basel III fully applied CET1 capital ratio 14.0% and Swiss SRB fully applied leverage ratio 5.4%
Business divisions1
Wealth Management: PBT CHF 636 million; NNM CHF 15.5 billion– Resilient performance; strong net inflows with continued focus on quality
Wealth Management Americas: PBT USD 245 million; NNM USD 13.6 billion– Strong net inflows, record net interest income and maintained industry-leading FA productivity
Personal & Corporate Banking: PBT CHF 422 million– Higher PBT and highest net new business volume growth rate for personal banking business since 1Q12
Asset Management: PBT CHF 110 million; NNM outflows excluding money market CHF 5.9 billion– Lower performance fees reflecting market conditions
Investment Bank: PBT CHF 370 million– Disciplined resource management and returns comfortably above cost of equity
Corporate Center: Pre-tax loss of CHF 417 million – Continued reduction in Non-core and Legacy Portfolio LRD
1 Adjusted numbers unless otherwise indicated, refer to slide 27 for details about adjusted numbers, Basel III numbers and FX rates in this presentation
3
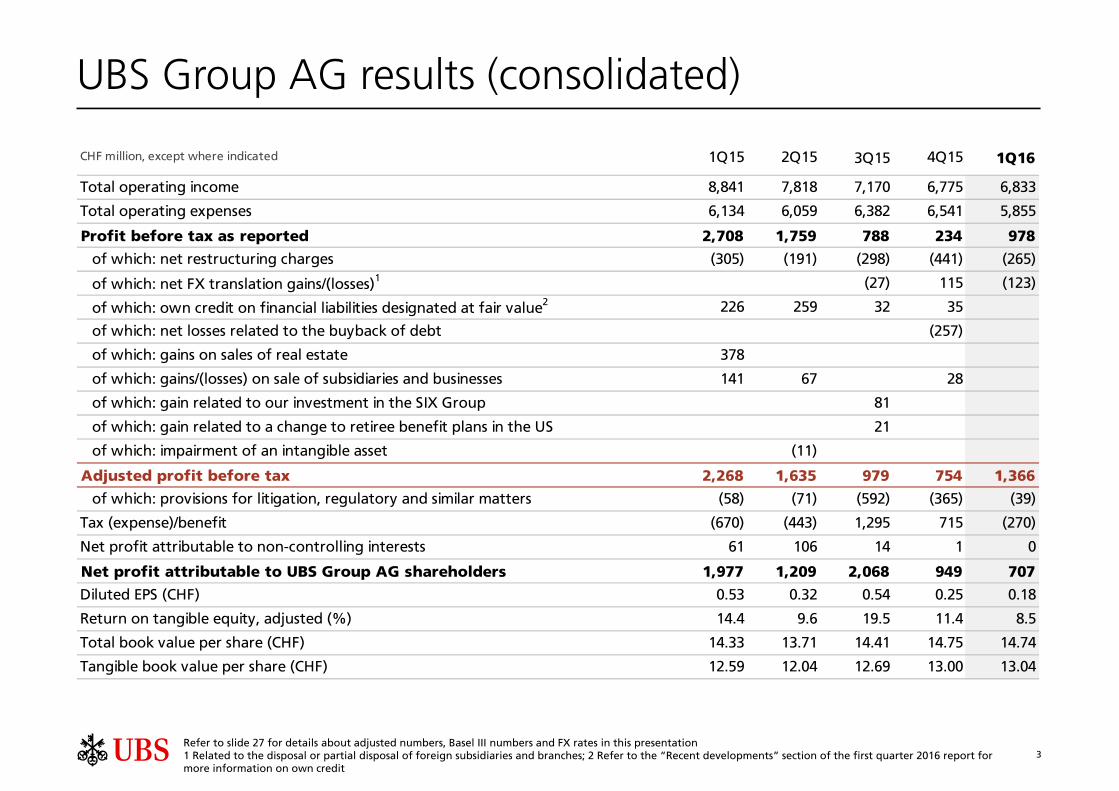
CHF million, except where indicated 1Q15 2Q15 3Q15 4Q15 1Q16
Total operating income 8,841 7,818 7,170 6,775 6,833
Total operating expenses 6,134 6,059 6,382 6,541 5,855
Profit before tax as reported 2,708 1,759 788 234 978
of which: net restructuring charges (305) (191) (298) (441) (265)
of which: net FX translation gains/(losses)1 (27) 115 (123)
of which: own credit on financial liabilities designated at fair value2 226 259 32 35
of which: net losses related to the buyback of debt (257)
of which: gains on sales of real estate 378
of which: gains/(losses) on sale of subsidiaries and businesses 141 67 28
of which: gain related to our investment in the SIX Group 81
of which: gain related to a change to retiree benefit plans in the US 21
of which: impairment of an intangible asset (11)
Adjusted profit before tax 2,268 1,635 979 754 1,366
of which: provisions for litigation, regulatory and similar matters (58) (71) (592) (365) (39)
Tax (expense)/benefit (670) (443) 1,295 715 (270)
Net profit attributable to non-controlling interests 61 106 14 1 0
Net profit attributable to UBS Group AG shareholders 1,977 1,209 2,068 949 707
Diluted EPS (CHF) 0.53 0.32 0.54 0.25 0.18
Return on tangible equity, adjusted (%) 14.4 9.6 19.5 11.4 8.5
Total book value per share (CHF) 14.33 13.71 14.41 14.75 14.74
Tangible book value per share (CHF) 12.59 12.04 12.69 13.00 13.04
Refer to slide 27 for details about adjusted numbers, Basel III numbers and FX rates in this presentation 1 Related to the disposal or partial disposal of foreign subsidiaries and branches; 2 Refer to the “Recent developments” section of the first quarter 2016 report for more information on own credit
UBS Group AG results (consolidated)

4Adjusted numbers unless otherwise indicated, refer to slide 27 for details about adjusted numbers, Basel III numbers and FX rates in this presentation1 General and administrative; 2 Depreciation and impairment of property, equipment and software as well as amortization and impairment of intangible assets; 3 Including net expenses for provisions for litigation, regulatory and similar matters of CHF 291 million in 2Q14 and CHF 79 million in 4Q15
Operating expenses
Profit before tax
897 922 978 986 949 976 960 935 901
496 518 569 583 560 568 600 598 579
542 472 479 436 589 459 366 364 4021,8851,8971,9432,0242,1062,0042,0311,9211,943
620 600 624 605 658 638 612 606 613
480517
507 557 482 492 513536
521
1,285 1,2481,393
1,2451,2551,2501,3111,2641,528
636698769
856694
767659
5053
3933
C/I ratio
Operating income CHF 1,885 million
Transaction-based income increased primarily in Asia Pacific but remained well below seasonal trends; 4Q15 included a CHF 45 million fee received from Personal & Corporate Banking for the shift of certain clients
Net interest income declined mainly on lower allocations from Group ALM
Recurring net fee income declined and primarily reflected decreases in invested assets
Operating expenses CHF 1,248 million
G&A expenses decreased, mainly as net expenses for provisions for litigation, regulatory and similar matters decreased by CHF 79 million to zero
PBT CHF 636 million, 66% cost/income ratio
66% 80% 62% 65% 62%59% 73%64%
3Q14 1Q15 3Q15 4Q15 1Q161Q14 2Q14 4Q14 2Q15
72% 75% 76% 78% 76%72% 81%80%
CH
F m
illio
nC
HF
mill
ion
CH
F m
illio
n
Wealth Management
Transaction-basedNet interest Recurring net fee
OtherCredit loss (expense)/recovery
Services from other business divisions and Corporate CenterG&A1 and other2
Personnel
Operating income
Recurringincome
185 412 133 149 109 126 121 251 115
79%
66%
Resilient performance despite lowest first quarter transactional revenues on record

5Adjusted numbers unless otherwise indicated, refer to slide 27 for details about adjusted numbers, Basel III numbers and FX rates in this presentation1 Adjusted for outflows of CHF 6.6 billion in 2Q15 and CHF 3.3 billion in 3Q15 related to the WM balance sheet and capital optimization program
Annualizedgrowth rate
InvestedassetsCHF billion
Marginsbps
6.5%
(1.5%)
1.5%
3.5%
5.8%
1.2%
4.2%4.8%4.9%
925947919945970987966928899
87 84 83 8186 8582 86 81
NNM CHF 15.5 billion, despite moderate deleveraging, with net inflows from all regions, particularly in Asia Pacific
Invested assets CHF 925 billion declined mainly due to CHF 18 billion currency translation effects and CHF 17 billion negative market performance, partly offset by NNM inflows
Discretionary and advisory mandate penetration 27.0% up from 26.4%, with CHF 6.9 billion net new mandates
Net margin 27 bps
NNM CHF 15.5 billion, highest since 2007 with continued focus on high-quality inflows
CHF billion
Gross margin Net margin
Net newmoney1
3Q14 1Q15 3Q15 4Q15 1Q161Q14 2Q14 4Q14 2Q15
LoansCHF billion
102.2 105.3 111.7 112.7 110.9110.8 105.2109.0 Gross loans CHF 102.4 billion, mainly reflecting foreign currency translation effects and deleveraging
Wealth Management
10.9 10.7 9.8 3.0 8.414.4 (3.4)3.5
3017
32 3528 32 3022 27
15.5
102.4
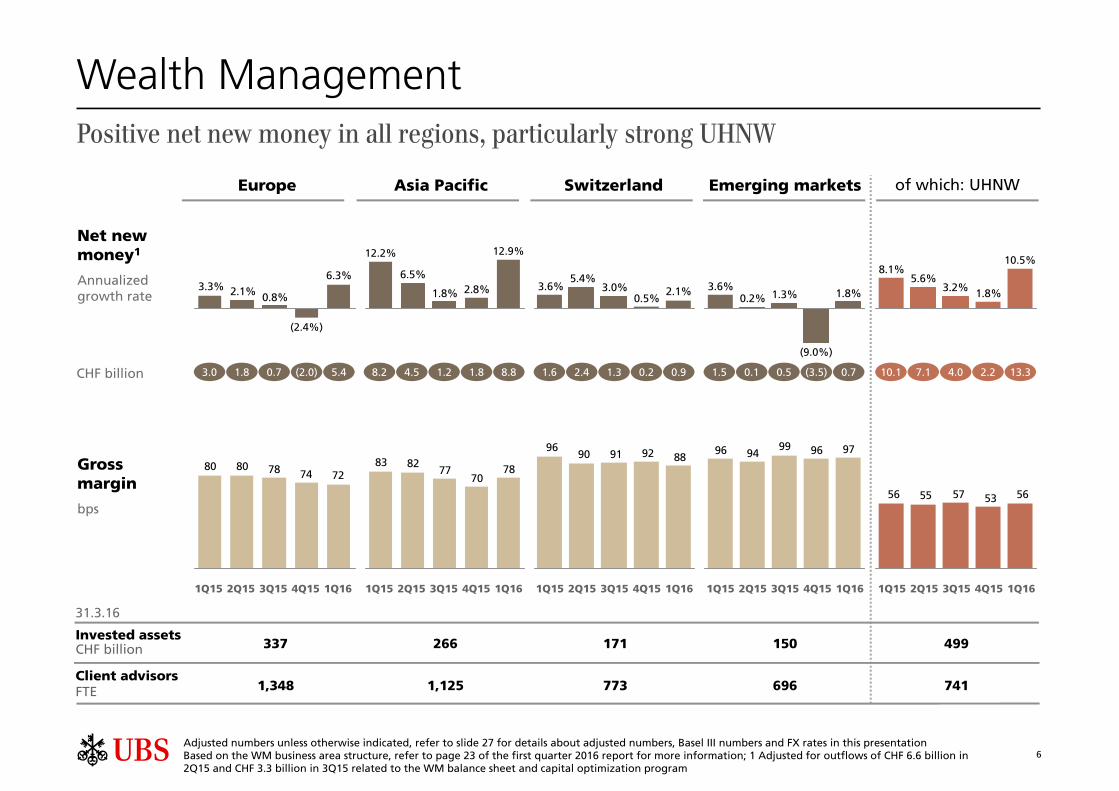
6Adjusted numbers unless otherwise indicated, refer to slide 27 for details about adjusted numbers, Basel III numbers and FX rates in this presentation Based on the WM business area structure, refer to page 23 of the first quarter 2016 report for more information; 1 Adjusted for outflows of CHF 6.6 billion in 2Q15 and CHF 3.3 billion in 3Q15 related to the WM balance sheet and capital optimization program
Invested assetsCHF billion
1,348 696 741Client advisorsFTE
31.3.16
1,125 773
499337 266 171 150
Europe SwitzerlandAsia Pacific Emerging markets of which: UHNW
Net newmoney1
Annualizedgrowth rate
Grossmargin
bps
6.3%
0.8%2.1%3.3%
(2.4%)
1Q15 3Q15 4Q15 1Q162Q15 1Q15 3Q15 4Q15 1Q162Q15 1Q15 3Q15 4Q15 1Q162Q15 1Q15 3Q15 4Q15 1Q162Q15 1Q15 3Q15 4Q15 1Q162Q15
2.8%1.8%
6.5%
12.9%12.2%
2.1%0.5%
3.0%5.4%
3.6%1.8%1.3%0.2%
3.6%
(9.0%)
1.8%3.2%5.6%
8.1%10.5%
7478808072 70
778283
7888929190
96 9796999496
5653575556
Positive net new money in all regions, particularly strong UHNW
Wealth Management
CHF billion 1.8 0.73.0 4.5 1.28.2 2.4 1.31.6 0.1 0.51.5 7.1 4.010.1(2.0) 1.8 0.2 (3.5) 2.25.4 8.8 0.9 0.7 13.3

7
1,119 1,163 1,197 1,187 1,186 1,217 1,231 1,160 1,182
250 261 276 280 277 301 311 326 351472 464 441 448 432 425 381 376 361
1,8991,8741,9311,9471,9011,9241,9191,8981,865
Wealth Management Americas
Operating expenses
Profit before tax
245287
231293
233267246
284
631
C/I ratio
3Q14 1Q15 3Q15 4Q15 1Q161Q14 2Q14 4Q14 2Q15
Solid performance with record net interest income
USD
mill
ion
USD
mill
ion
86% 87% 86% 88% 88%85% 97%85%
1,146 1,186 1,198 1,218 1,185 1,199 1,198 1,185 1,209
1,6551,810
1,6441,7171,6081,6911,6511,6521,582
Services from other business divisions and Corporate CenterG&A and otherPersonnel
Operating income USD 1,899 million
Transaction-based income declined due to lower client activity
Net interest income increased mainly due to higher interest rates
Recurring net fee income increased mainly due to higher managed account fees, which were calculated on increased invested asset levels at the end of the prior quarter
USD
mill
ion
Transaction-basedNet interest Recurring net fee
74% 75% 77% 76% 78%77% 79%80%
OtherCredit loss (expense)/recovery
Operating income
Recurringincome
Operating expenses USD 1,655 million
Charges for services increased as the previous quarter included a Corporate Center – Services cost agreement credit of USD 36 million
G&A expenses declined mainly due to USD 215 million lower net expenses for provisions for litigation, regulatory and similar matters
Personnel expenses increased mainly due to a new healthcare benefit plan and higher expenses for variable compensation
Adjusted numbers unless otherwise indicated, refer to slide 27 for details about adjusted numbers, Basel III numbers and FX rates in this presentation1 Including USD 233 million net expenses for provisions for litigation, regulatory and similar matters
283 300 288 306 284 291153 166 165 167 140 227
275172 362
263 287158
PBT USD 245 million, 87% cost/income ratio
81%
87%
8
Wealth Management Americas
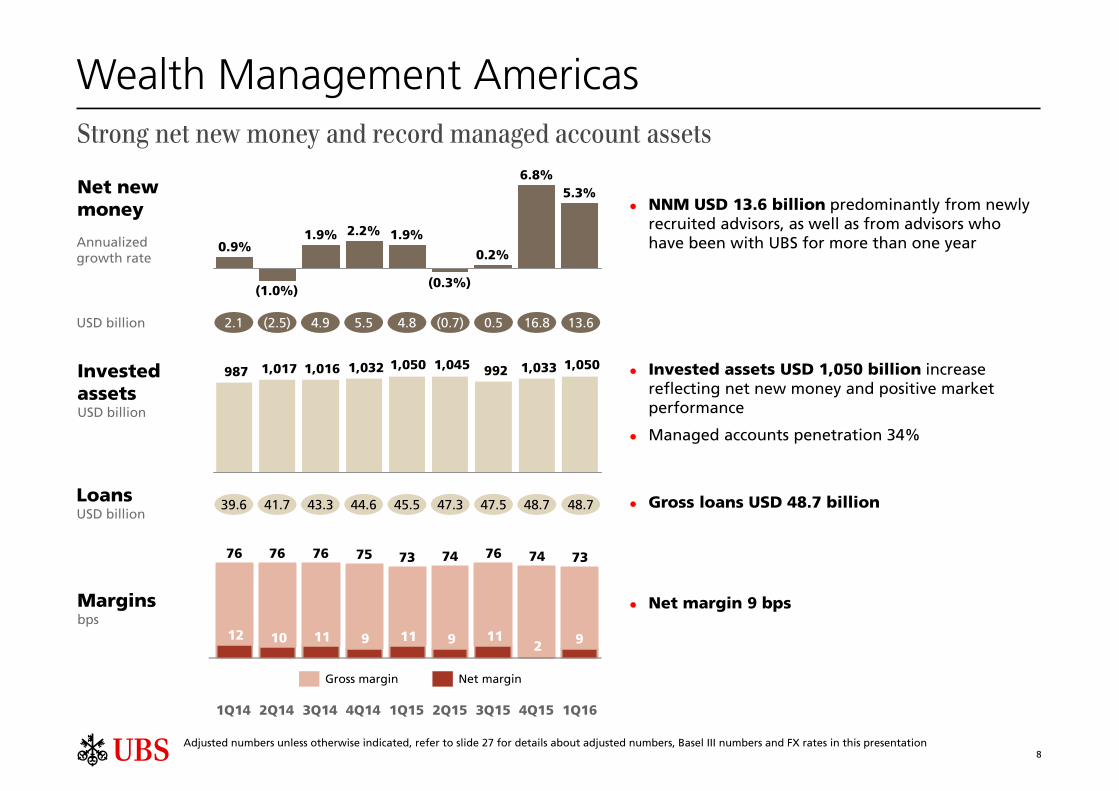
Annualizedgrowth rate
5.3%6.8%
0.2%
(0.3%)
1.9%2.2%1.9%
(1.0%)
0.9%
7476747375767676 73
NNM USD 13.6 billion predominantly from newly recruited advisors, as well as from advisors who have been with UBS for more than one year
Invested assets USD 1,050 billion increase reflecting net new money and positive market performance
Managed accounts penetration 34%
Net margin 9 bps
Strong net new money and record managed account assets
USD billion 2.1 (2.5) 4.9 5.5 (0.7)4.8 16.80.5
Gross margin Net margin
Net newmoney
3Q14 1Q15 3Q15 4Q15 1Q161Q14 2Q14 4Q14 2Q15
InvestedassetsUSD billion
1,0501,0339921,0451,0501,0321,0161,017987
LoansUSD billion
39.6 41.7 43.3 44.6 47.345.5 48.747.5
Marginsbps
Gross loans USD 48.7 billion
Adjusted numbers unless otherwise indicated, refer to slide 27 for details about adjusted numbers, Basel III numbers and FX rates in this presentation
12 10 911 911 112
13.6
48.7
9

9
1,0371,068 1,079 1,091 1,088
1,118 1,1111,061 1,064
1,0501,0339921,0451,0501,0321,0161,017987
Industry leading productivity per advisor for revenue and invested assets
Invested assets and FA productivity Net interest income and lending
Invested assets per FA (USD million)
Annualized revenue per FA (USD thousand)
Credit loss (expense)/recovery (USD million)
Net interest income (USD million)
Invested assets
USD
bill
ion
3Q14 1Q15 3Q15 4Q15 1Q161Q14 2Q14 4Q14 2Q15
USD
bill
ion
Loans, gross
48.748.747.547.345.544.643.341.739.6
3Q14 1Q15 3Q15 4Q15 1Q161Q14 2Q14 4Q14 2Q15
19 (2) (1) 0 00 0(3)
USD
bill
ion
139 143 143147 150 150
142 145 147
250 261 276 280 277301 311 326
351
Wealth Management Americas
Adjusted numbers unless otherwise indicated, refer to slide 27 for details about adjusted numbers, Basel III numbers and FX rates in this presentation
7,113 7,119 7,114 6,997 6,9486,982 7,1406,989
Financial advisors (FTEs)
7,145
(1)
10
224 214 219 190 225 221 213 211 213
244 256 238 277 252 249 243 234 264
557512 519536538536571532 541
Operating income
Operating expenses
Profit before tax
523 541 563 557 568 560 566 576
234 247 267 273 284 241 238 196
139136135134133140138144 139
560
244
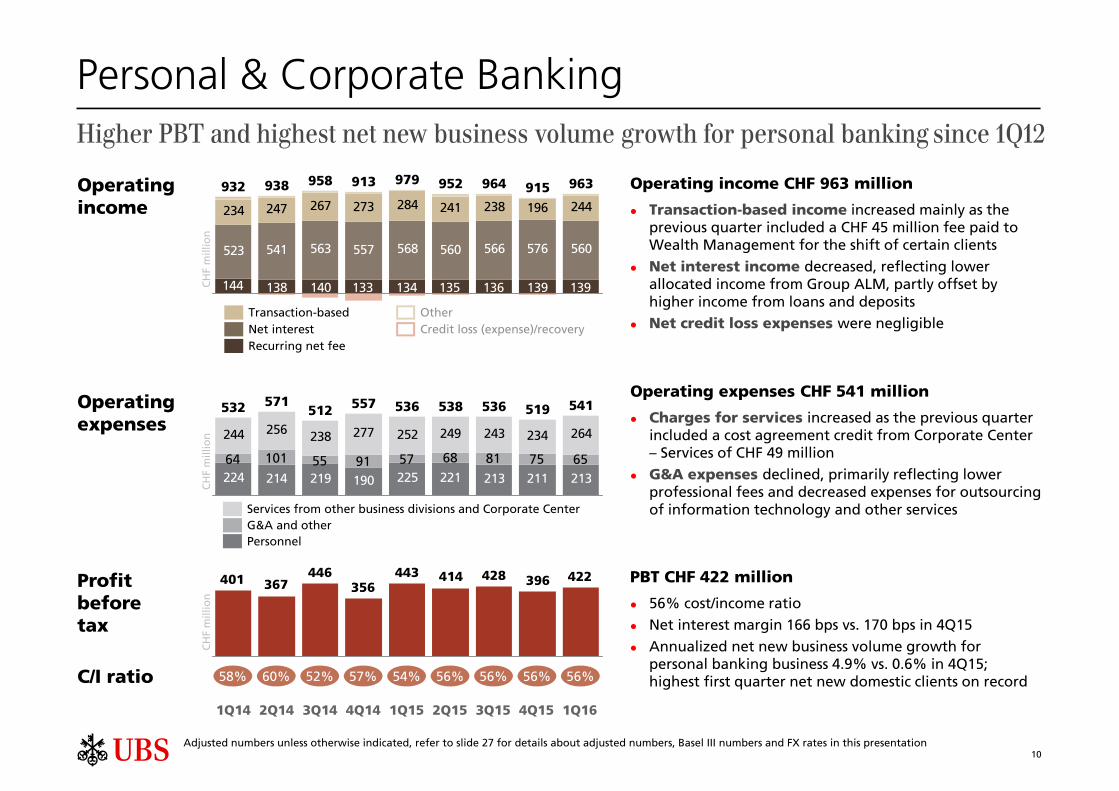
964952979913958938932 915 963
422396428414443356
446367401
C/I ratio 58% 60% 52% 57% 56%54% 56%56%
Higher PBT and highest net new business volume growth for personal banking since 1Q12
3Q14 1Q15 3Q15 4Q15 1Q161Q14 2Q14 4Q14 2Q15
CH
F m
illio
nC
HF
mill
ion
CH
F m
illio
n
Operating income CHF 963 million
Transaction-based income increased mainly as the previous quarter included a CHF 45 million fee paid to Wealth Management for the shift of certain clients
Net interest income decreased, reflecting lower allocated income from Group ALM, partly offset by higher income from loans and deposits
Net credit loss expenses were negligible
Operating expenses CHF 541 million
Charges for services increased as the previous quarter included a cost agreement credit from Corporate Center – Services of CHF 49 million
G&A expenses declined, primarily reflecting lower professional fees and decreased expenses for outsourcing of information technology and other services
PBT CHF 422 million
56% cost/income ratio
Net interest margin 166 bps vs. 170 bps in 4Q15
Annualized net new business volume growth for personal banking business 4.9% vs. 0.6% in 4Q15; highest first quarter net new domestic clients on record
Personal & Corporate Banking
Transaction-basedNet interest Recurring net fee
OtherCredit loss (expense)/recovery
Services from other business divisions and Corporate CenterG&A and otherPersonnel
Adjusted numbers unless otherwise indicated, refer to slide 27 for details about adjusted numbers, Basel III numbers and FX rates in this presentation
64 101 55 91 57 68 81 75
56%
65

11
Asset Management
Operating expenses
Profit before tax
404 427 462 463 443 456 479 468 446
6846823
51244
50223
47620
51149734
48927
46538
45147
110153137134
186
124151
107126
C/I ratio 72% 77% 69% 75% 72%64% 70%73%
3Q14 1Q15 3Q15 4Q15 1Q161Q14 2Q14 4Q14 2Q15
Lower performance fees reflecting market conditions
Performance fees Net management fees
Net new money ex. MM
13.0 11.6 3.8 (5.8) 8.37.5 (8.9)(7.6)
NNM outflows excluding money market CHF 5.9 billion, including a CHF 7.2 billion pricing-related outflow from one client and CHF 3.8 billion of outflows driven by client liquidity needs, both from lower-margin passive products
CH
F m
illio
nC
HF
mill
ion
CH
F m
illio
n
Operating income CHF 468 million
Performance fees decreased mainly in Equities, Multi-Asset & O'Connor
Net management fees decreased reflecting the reduced revenues from Fund Services following the sale of AFS
Operating expenses CHF 358 million
Charges for services increased primarily as the previous quarter included a cost agreement credit from Corporate Center – Services of CHF 13 million
Personnel expenses decreased primarily due to lower expenses for variable compensation
PBT CHF 110 million
76% cost/income ratio
Invested assets CHF 628 billion
Net margin 7 bps vs. 10 bps in 4Q15
Gross margin 29 bps vs. 32 bps in 4Q15
148 153 166 160 167 175 188 196 182
69 94 61 89 57 57 58 59 56108 110 111 123
102 110 119 104 120
358359365342325373
338357325
Services from other business divisions and Corporate CenterG&A and otherPersonnel
Adjusted numbers unless otherwise indicated, refer to slide 27 for details about adjusted numbers, Basel III numbers and FX rates in this presentation
76%
(5.9)
Operating income
12
(1,221)
370223
614617836
276548559 4661
Adjusted numbers unless otherwise indicated, refer to slide 27 for details about adjusted numbers, Basel III numbers and FX rates in this presentation1 Profit before tax excluding CHF 1,687 million net expenses for litigation, regulatory and similar matters
Operating expenses
Profit before tax
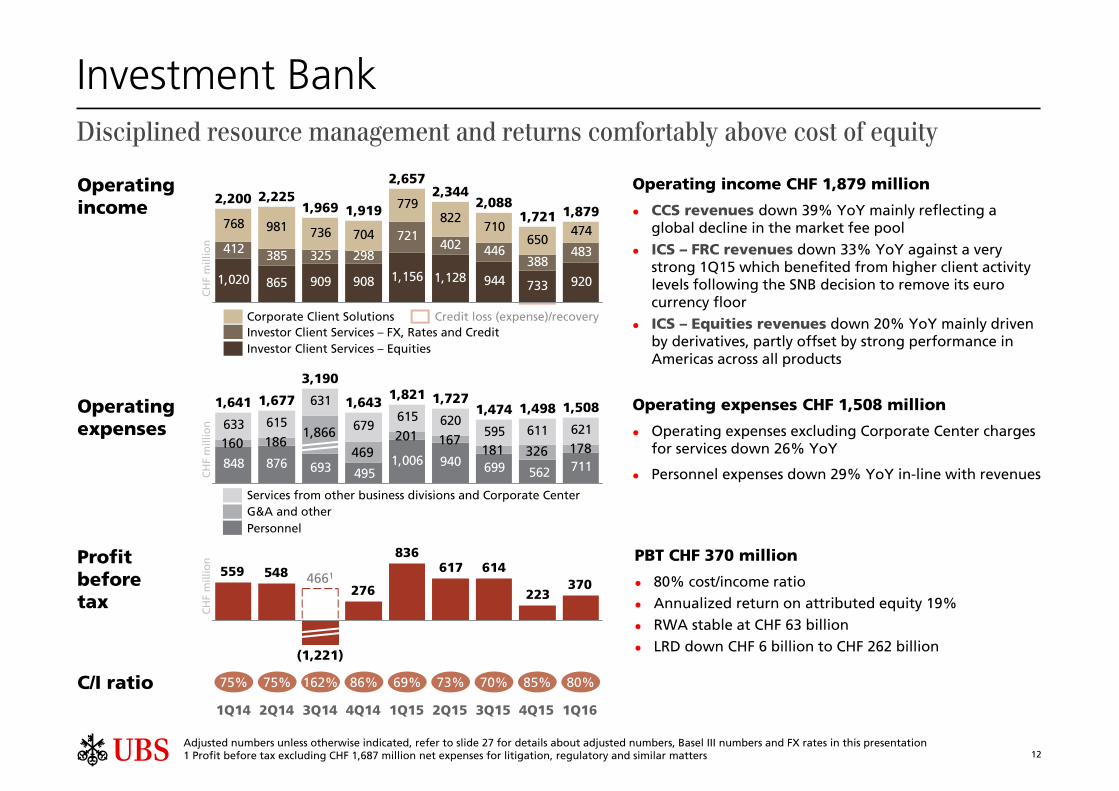
1,020 865 909 908 1,156 1,128 944 733 920
412 385 325 298
721402 446
388483
768 981 736 704
779822
710650
4741,8791,721
2,0882,344
2,657
1,9191,9692,2252,200
C/I ratio 75% 75% 162% 86% 73%69% 85%70%
Disciplined resource management and returns comfortably above cost of equity
Corporate Client SolutionsInvestor Client Services – FX, Rates and Credit Investor Client Services – Equities
3Q14 1Q15 3Q15 4Q15 1Q161Q14 2Q14 4Q14 2Q15
CH
F m
illio
nC
HF
mill
ion
CH
F m
illio
n
Operating income CHF 1,879 million
CCS revenues down 39% YoY mainly reflecting a global decline in the market fee pool
ICS – FRC revenues down 33% YoY against a very strong 1Q15 which benefited from higher client activity levels following the SNB decision to remove its euro currency floor
ICS – Equities revenues down 20% YoY mainly driven by derivatives, partly offset by strong performance in Americas across all products
Operating expenses CHF 1,508 million
Operating expenses excluding Corporate Center charges for services down 26% YoY
Personnel expenses down 29% YoY in-line with revenues
PBT CHF 370 million
80% cost/income ratio
Annualized return on attributed equity 19%
RWA stable at CHF 63 billion
LRD down CHF 6 billion to CHF 262 billion
Investment Bank
848 876 693 1,006 940 699 711
633 615
631
679615 620
595 611 621
562495
1,5081,4981,4741,821 1,7271,643
3,190
1,6771,641
Services from other business divisions and Corporate CenterG&A and otherPersonnel
160 186469
201 1671,866181 326
Credit loss (expense)/recovery
80%
178
Operating income
13
Services
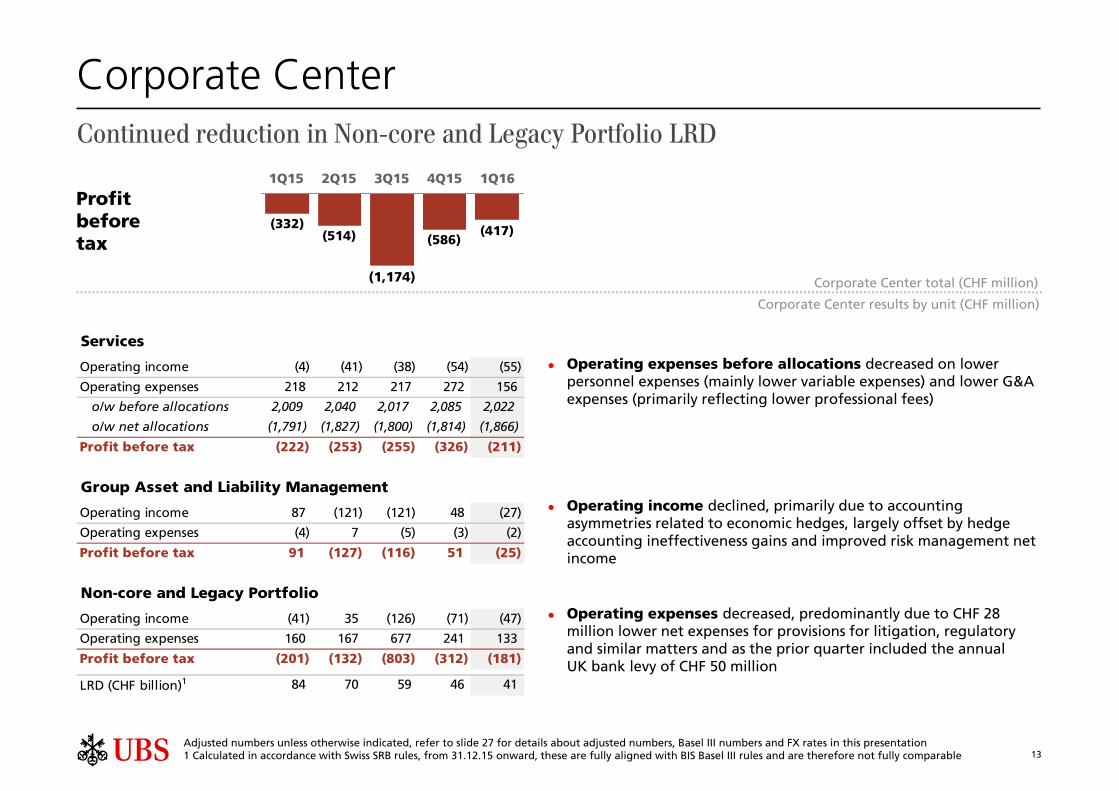
Operating income (4) (41) (38) (54) (55)
Operating expenses 218 212 217 272 156
o/w before allocations 2,009 2,040 2,017 2,085 2,022
o/w net allocations (1,791) (1,827) (1,800) (1,814) (1,866)
Profit before tax (222) (253) (255) (326) (211)
Group Asset and Liability Management
Operating income 87 (121) (121) 48 (27)
Operating expenses (4) 7 (5) (3) (2)
Profit before tax 91 (127) (116) 51 (25)
Non-core and Legacy Portfolio
Operating income (41) 35 (126) (71) (47)
Operating expenses 160 167 677 241 133
Profit before tax (201) (132) (803) (312) (181)
LRD (CHF billion)1 84 70 59 46 41
Adjusted numbers unless otherwise indicated, refer to slide 27 for details about adjusted numbers, Basel III numbers and FX rates in this presentation1 Calculated in accordance with Swiss SRB rules, from 31.12.15 onward, these are fully aligned with BIS Basel III rules and are therefore not fully comparable
Operating expenses before allocations decreased on lower personnel expenses (mainly lower variable expenses) and lower G&A expenses (primarily reflecting lower professional fees)
Operating income declined, primarily due to accounting asymmetries related to economic hedges, largely offset by hedge accounting ineffectiveness gains and improved risk management net income
Continued reduction in Non-core and Legacy Portfolio LRD
Operating expenses decreased, predominantly due to CHF 28 million lower net expenses for provisions for litigation, regulatory and similar matters and as the prior quarter included the annual UK bank levy of CHF 50 million
(417)(586)(514)
(332)
(1,174)
Profit before tax
1Q15 3Q15 4Q15 1Q162Q15
Corporate Center results by unit (CHF million)
Corporate Center total (CHF million)
Corporate Center
14
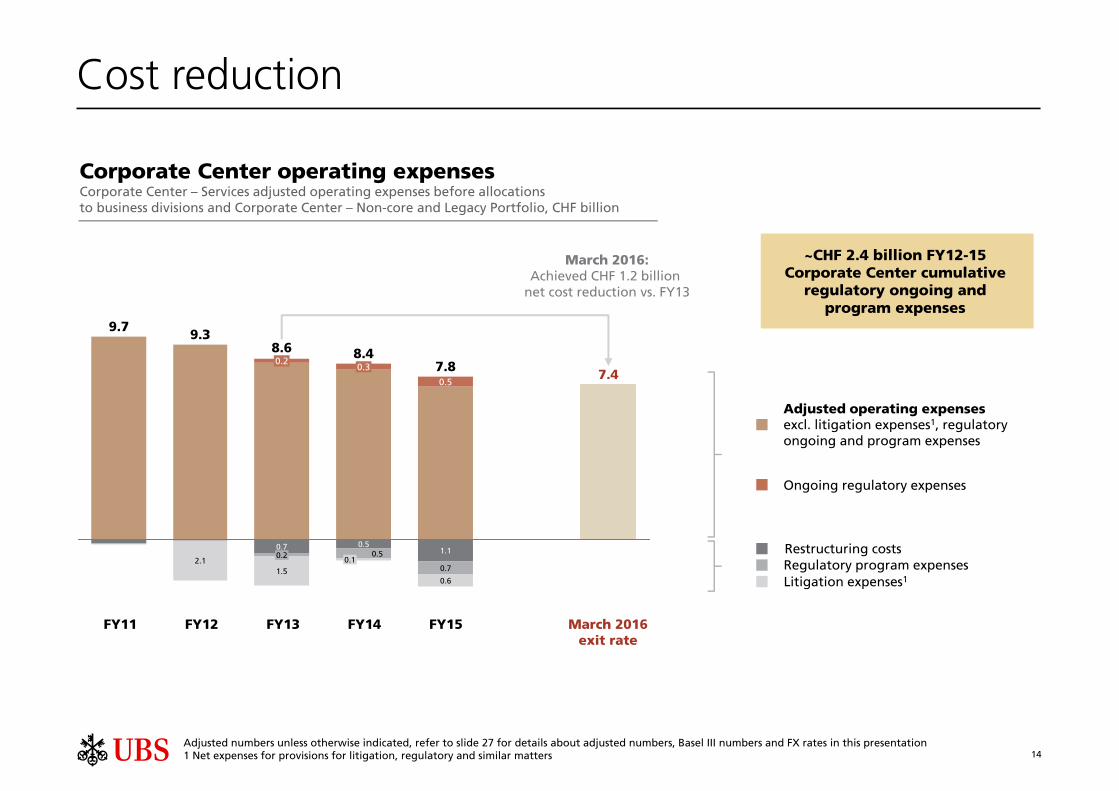
Cost reduction
Adjusted numbers unless otherwise indicated, refer to slide 27 for details about adjusted numbers, Basel III numbers and FX rates in this presentation1 Net expenses for provisions for litigation, regulatory and similar matters
7.80.5
8.40.3
8.60.2
9.39.7
7.4
Corporate Center operating expensesCorporate Center – Services adjusted operating expenses before allocations to business divisions and Corporate Center – Non-core and Legacy Portfolio, CHF billion
Ongoing regulatory expenses
Adjusted operating expenses excl. litigation expenses1, regulatory ongoing and program expenses
Regulatory program expensesRestructuring costs
Litigation expenses1
~CHF 2.4 billion FY12-15 Corporate Center cumulative
regulatory ongoing and program expenses
0.6
0.7
1.10.1
0.50.5
1.5
0.20.7
2.1
FY11 FY12 FY13 FY14 FY15 March 2016exit rate
March 2016:Achieved CHF 1.2 billion
net cost reduction vs. FY13
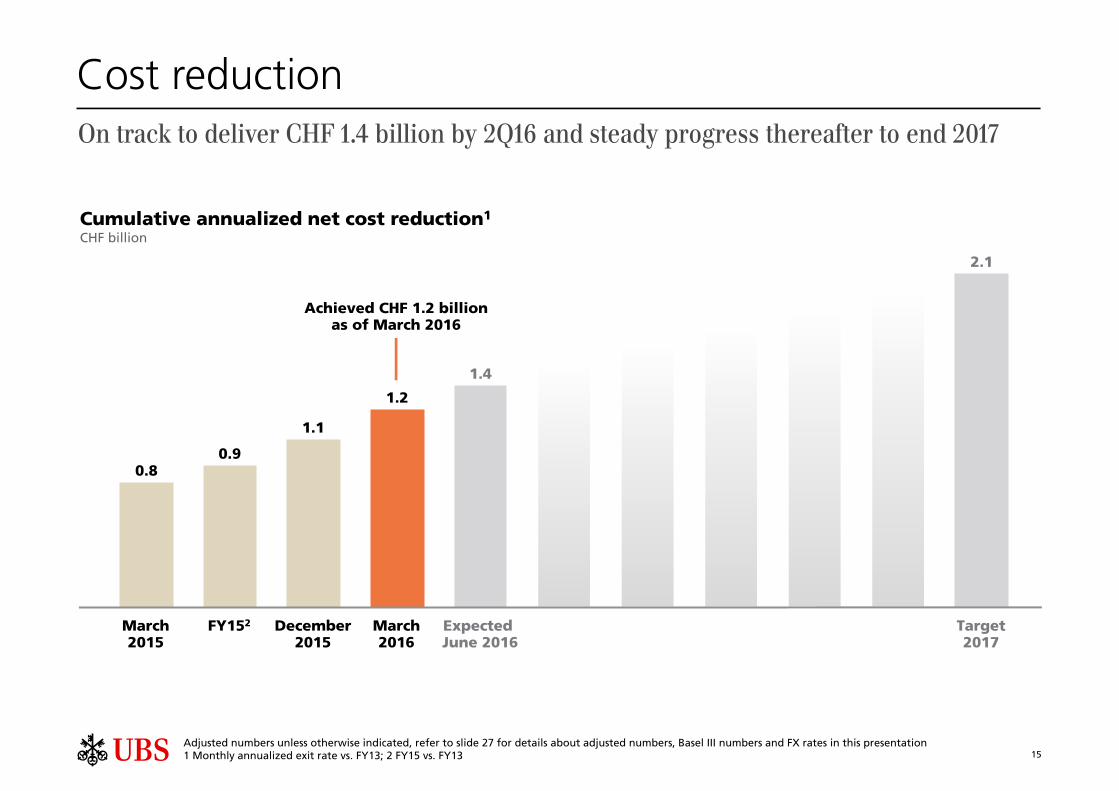
15
1.4
2.1
1.2
1.1
0.90.8
Cumulative annualized net cost reduction1
CHF billion
March2016
Achieved CHF 1.2 billionas of March 2016
December2015
Cost reduction
Adjusted numbers unless otherwise indicated, refer to slide 27 for details about adjusted numbers, Basel III numbers and FX rates in this presentation1 Monthly annualized exit rate vs. FY13; 2 FY15 vs. FY13
On track to deliver CHF 1.4 billion by 2Q16 and steady progress thereafter to end 2017
March2015
FY152 Expected June 2016
Target2017

16
Cost reduction initiatives 2Q16 to end-2017
Cost reductionStructural initiatives to achieve our CHF 2.1 billion net cost reduction target and mitigate the impact of regulatory demand …
Corporate Center
On-going structural cost reduction program to be completed by end-2017
Actions across workforce & footprint, organization, processes and technology
Additional cross-functional efficiency measures
Corporate Center and business divisions front-to-back, e.g.:
Alignment of Wealth Management and Wealth Management Americas platforms
Simplification of processes
Third-party expense management (supply and demand)
… as well as tactical actions to address cyclical headwinds

17
Basel III CET1 capital ratio1
Fully applied, CHF billionSwiss SRB leverage ratioFully applied, CHF billion
CET1capital
RWA
29.6 30.3 30.9 30.0
216 210 216 208
Totalcapital
LRD2
44.5 44.6 47.6 47.4
977 944 946 898
Capital and leverage ratiosStrong capital position with 14.0% Basel III CET1 ratio and 5.4% Swiss SRB leverage ratio
14.5%14.3%14.4%13.7% 14.0%
10.0%
1Q164Q153Q152Q151Q15
2019requirement
3.3% 3.3% 3.3%
2Q15
4.7%
3.2%
1Q15
4.6%
3.0%
4Q15
5.3%
3Q15
5.0% 5.4%
1Q16
CET1
4.2% AT1 + T2
Current Swiss SRB regulation3
Refer to slide 27 for details about adjusted numbers, Basel III numbers and FX rates in this presentation; 1 As of 31.3.16, our post-stress fully applied Basel III CET1 capital ratio exceeded 10%; 2 Calculated in accordance with Swiss SRB rules, from 31.12.15 onward, these are fully aligned with BIS Basel III rules and are therefore not fully comparable; 3 Numbers presented on this slide do not reflect the new capital requirements for Swiss systemically relevant banks as proposed by the Swiss Federal Council in October 2015
2019requirement
29.9
214
48.6
906

Appendix

19
Personal & CorporateBanking
Net new business volume growth rate
Net interest margin
Adjusted cost/income ratio
1-4% (personal banking)
140-180 bps
50-60%
Asset ManagementNet new money growth rate
Adjusted cost/income ratio
Adjusted annual pre-tax profit
3-5% excluding money market flows
60-70%
CHF 1 billion in the medium term
Refer to slide 27 for details about adjusted numbers, Basel III numbers and FX rates in this presentationRefer to page 36-37 of the Annual Report 2015 report for detail
Wealth ManagementAmericas
Net new money growth rate
Adjusted cost/income ratio
2-4%
75-85%
Wealth ManagementNet new money growth rate
Adjusted cost/income ratio
3-5%
55-65%10-15% annual adjusted pre-tax profit growth for combined businesses through the cycle
Ranges for sustainable performance over the cycle
Group and business division targets and expectations
Investment Bank
Adjusted annual pre-tax RoAE
Adjusted cost/income ratio
RWA (fully applied)
BIS Basel III LRD (fully applied)
>15%
70-80%
Expectation: around CHF 85 billion short/medium term
Expectation: around CHF 325 billion short/medium term
Group
Net cost reduction
Adjusted cost/income ratio
Adjusted return on tangible equity
Basel III CET1 ratio (fully applied)
RWA (fully applied)
LRD (fully applied)
CHF 2.1 billion by end 2017
60-70%, expectation: 65-75% short/medium term
>15%, expectation: approximately at 2015 level in 2016, approximately 15% in 2017 and >15% in 2018
at least 13%
Expectation: around CHF 250 billion short/medium term
Expectation: around CHF 950 billion short/medium term

20
Group ALM operating income
Refer to slide 27 for details about adjusted numbers, Basel III numbers and FX rates in this presentationRefer to the "Corporate Center – Group Asset and Liability Management" section of the first quarter 2016 report for details
Business division-aligned risk management includes managing the interest rate risk in the banking book on behalf of Wealth Management and Personal & Corporate Banking and high-quality liquid asset (HQLA) portfolios on behalf of specific business divisions
1
2
3
Capital investment and issuance includes managing the Group's equity and capital instruments, including instruments that will contribute to our total loss-absorbing capacity (TLAC)
Group structural risk management includes activities performed to meet overall Group-wide risk management objectives such as managing the Group’s HQLA and long-term debt portfolios
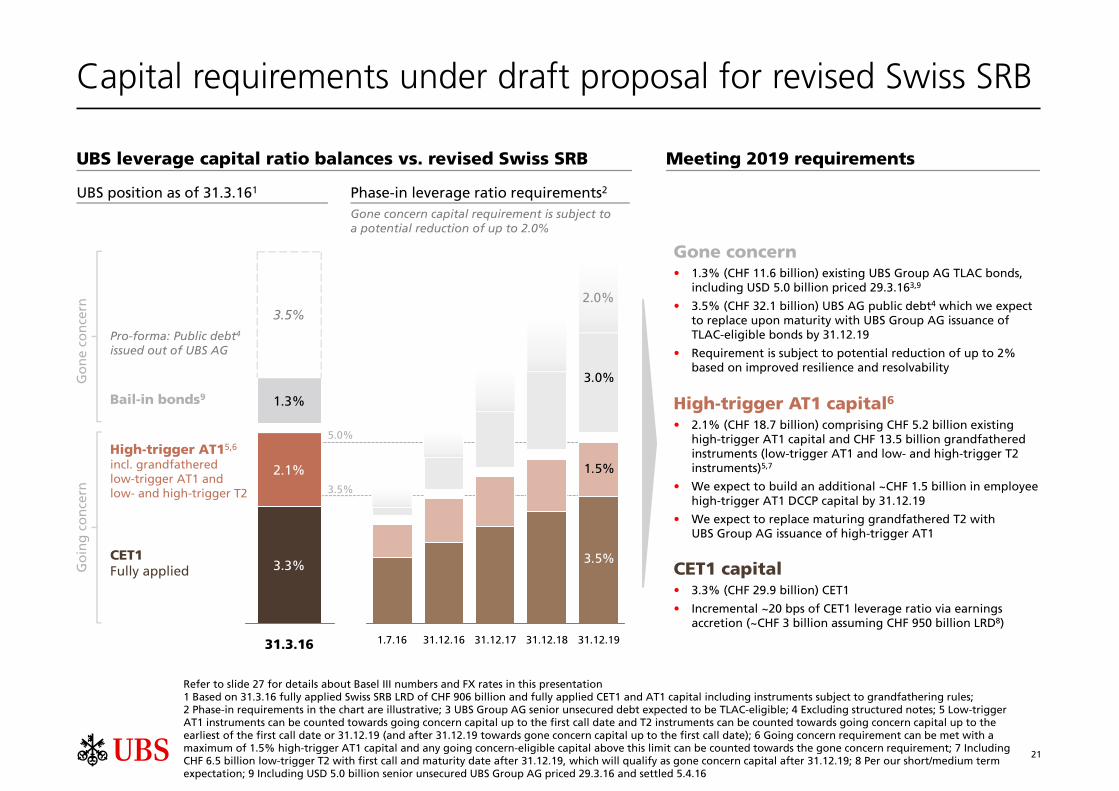
21
31.3.16
3.3%
2.1%
1.3%
3.5%
Bail-in bonds9
High-trigger AT15,6
incl. grandfathered low-trigger AT1 and low- and high-trigger T2
CET1Fully applied
Refer to slide 27 for details about Basel III numbers and FX rates in this presentation 1 Based on 31.3.16 fully applied Swiss SRB LRD of CHF 906 billion and fully applied CET1 and AT1 capital including instruments subject to grandfathering rules; 2 Phase-in requirements in the chart are illustrative; 3 UBS Group AG senior unsecured debt expected to be TLAC-eligible; 4 Excluding structured notes; 5 Low-trigger AT1 instruments can be counted towards going concern capital up to the first call date and T2 instruments can be counted towards going concern capital up to the earliest of the first call date or 31.12.19 (and after 31.12.19 towards gone concern capital up to the first call date); 6 Going concern requirement can be met with a maximum of 1.5% high-trigger AT1 capital and any going concern-eligible capital above this limit can be counted towards the gone concern requirement; 7 Including CHF 6.5 billion low-trigger T2 with first call and maturity date after 31.12.19, which will qualify as gone concern capital after 31.12.19; 8 Per our short/medium term expectation; 9 Including USD 5.0 billion senior unsecured UBS Group AG priced 29.3.16 and settled 5.4.16
3.5%
1.5%
3.0%
31.12.1931.12.1831.12.1731.12.161.7.16
UBS position as of 31.3.161 Phase-in leverage ratio requirements2
CET1 capital • 3.3% (CHF 29.9 billion) CET1
• Incremental ~20 bps of CET1 leverage ratio via earnings accretion (~CHF 3 billion assuming CHF 950 billion LRD8)
High-trigger AT1 capital6• 2.1% (CHF 18.7 billion) comprising CHF 5.2 billion existing
high-trigger AT1 capital and CHF 13.5 billion grandfathered instruments (low-trigger AT1 and low- and high-trigger T2 instruments)5,7
• We expect to build an additional ~CHF 1.5 billion in employee high-trigger AT1 DCCP capital by 31.12.19
• We expect to replace maturing grandfathered T2 with UBS Group AG issuance of high-trigger AT1
Gone concern• 1.3% (CHF 11.6 billion) existing UBS Group AG TLAC bonds,
including USD 5.0 billion priced 29.3.163,9
• 3.5% (CHF 32.1 billion) UBS AG public debt4 which we expect to replace upon maturity with UBS Group AG issuance of TLAC-eligible bonds by 31.12.19
• Requirement is subject to potential reduction of up to 2% based on improved resilience and resolvability
5.0%
Meeting 2019 requirementsUBS leverage capital ratio balances vs. revised Swiss SRB
Pro-forma: Public debt4
issued out of UBS AG
3.5%
Gone concern capital requirement is subject to a potential reduction of up to 2.0%
Capital requirements under draft proposal for revised Swiss SRB
2.0%
Go
ne
con
cern
Go
ing
co
nce
rn

22
Corporate Center – Non-core and Legacy Portfolio
LRD1
CHF billion
RWACHF billion
Refer to slide 27 for details about Basel III numbers and FX rates in this presentation1 Calculated in accordance with Swiss SRB rules, from 31.12.15 onward, these are fully aligned with BIS Basel III rules and are therefore not fully comparable; 2 Pro-forma estimate based on period-end balance; 3 Pro-forma estimate excluding any further unwind activity based on 31.3.16 data, assuming positions are held to maturity. LRD balances can vary materially due to market movements, changes in regulation, changes in margin requirements and other factors
1Q164Q153Q152Q151Q154Q12
~2932
4Q19
~24
4Q18
~26
4Q17
~32
4Q16
~38
LRD1 and RWA by categoryCHF billion, 31.3.16
Operational risk
Other 10.6
Muni swaps and options 2.4
APS/ARS 2.6
Securitizations 1.6
Credit 6.7
Rates 17.2
LRD: natural decay1,3
CHF billion
21.5
2.6
0.5
0.8
1.3
0.5
4.3
LRD CHF 41 billion RWA CHF 32 billion
8470
16
2020 20 22
111012 12
21
14
4Q15
31
3Q15
32
2Q15
32
1Q15
36
4Q12
103
88
1Q16
32
Operational riskCredit and market risk
5946 41

23
Oil and gas exposures
Oil and gas net banking products exposure1 CHF billion
NorthAmerica
Otherregions
By geography
CHF 5.5 billion
89%
11%
Investmentgrade
Otherrating
grades
By rating
CHF 5.5 billion
54%
46%
Mid-stream 2.3
Services and supply 0.3
Exploration and production 1.6
Refining 0.8
Integrated 0.4
By segment
CHF 5.5 billion
42%
30%
14%
8%
6%
1 As of 31.3.16, total funded and unfunded net banking products exposure to the oil and gas sector, recorded within the Investment Bank2 Refer to page 55 of the first quarter 2016 report for more information
As of 31.3.16, our total funded and unfunded net banking products exposure to the oil and gas sector was CHF 5.5 billion, CHF 0.6 billion lower than on 31.12.15, with CHF 0.4 billion of the reduction in the exploration and production and the services and supply sub-sectors
About half of the CHF 5.5 billion exposure was related to the integrated and mid-stream segments, which are generally expected to be less affected by low oil and gas prices
Additional specific and collective allowances of CHF 17 million were recognized against these oil and gas exposures in 1Q16 in the Investment Bank, bringing the total allowances against these exposures to CHF 56 million
Using an assumed average oil price of USD 25 per barrel through the end of 2017, we estimate that we could incur an additional credit loss expense of approximately CHF 100 million, exclusive of any gains from our risk management activities2
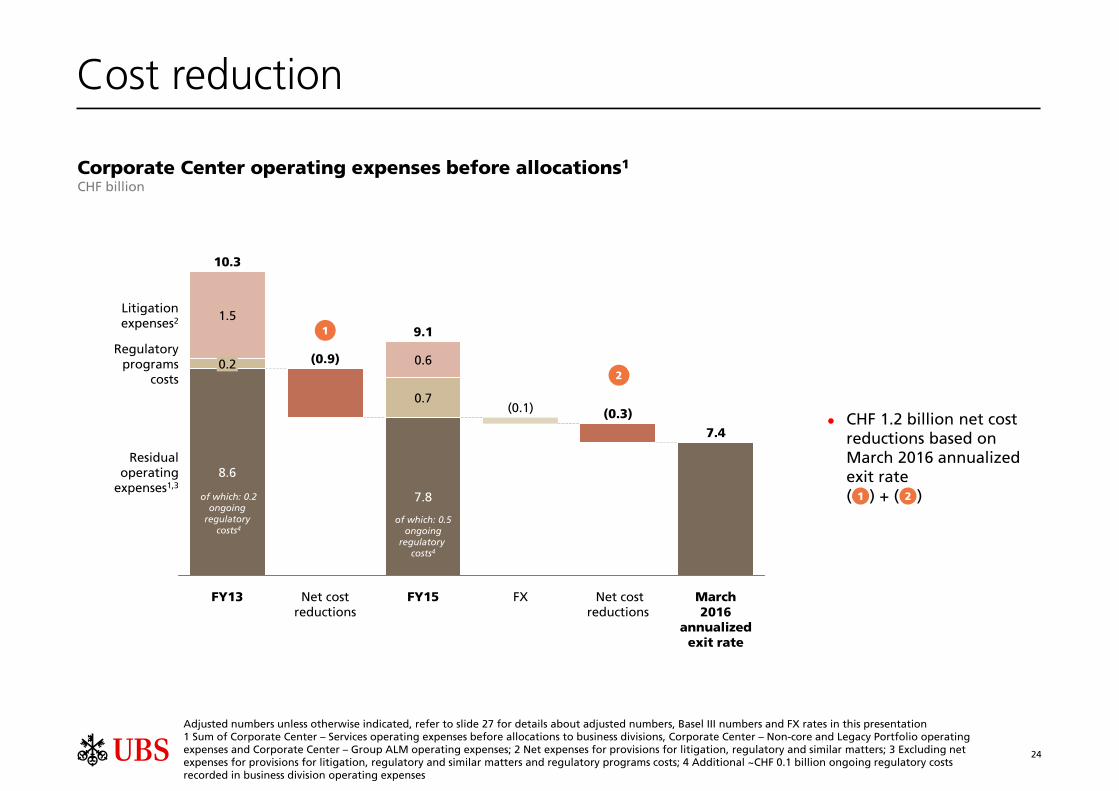
24
(0.1)
FXFY13
10.3
8.6
0.2
1.5
Net costreductions
(0.9)
March 2016
annualizedexit rate
Residualoperating
expenses1,3
Regulatoryprograms
costs
Litigationexpenses2
7.4
Net cost reductions
(0.3)
FY15
9.1
7.8
0.7
0.6
Cost reduction
1
2
Corporate Center operating expenses before allocations1
CHF billion
of which: 0.2ongoing
regulatory costs4
of which: 0.5ongoing
regulatory costs4
Adjusted numbers unless otherwise indicated, refer to slide 27 for details about adjusted numbers, Basel III numbers and FX rates in this presentation1 Sum of Corporate Center – Services operating expenses before allocations to business divisions, Corporate Center – Non-core and Legacy Portfolio operating expenses and Corporate Center – Group ALM operating expenses; 2 Net expenses for provisions for litigation, regulatory and similar matters; 3 Excluding net expenses for provisions for litigation, regulatory and similar matters and regulatory programs costs; 4 Additional ~CHF 0.1 billion ongoing regulatory costs recorded in business division operating expenses
CHF 1.2 billion net cost reductions based on March 2016 annualized exit rate( ) + ( )1 2

25
CHF billion
4Q15 1Q16 4Q15 1Q16 4Q15 1Q16 4Q15 1Q16 4Q15 1Q16 4Q15 1Q16
WM 0.1 0.1 0.5 0.5 0.9 0.9 0.4 0.4 0.0 0.0 1.9 1.9
WMA 1.9 1.9 - - - - - - - - 1.9 1.9
P&C - - - - - - 0.9 1.0 - - 0.9 1.0
AM 0.2 0.1 0.1 0.1 0.1 0.1 0.2 0.1 - - 0.5 0.5
IB 0.6 0.7 0.4 0.5 0.5 0.5 0.2 0.2 (0.0) (0.0) 1.7 1.9
CC - - - - - - - - (0.1) (0.1) (0.1) (0.1)
Group 2.8 2.8 1.0 1.1 1.5 1.5 1.6 1.7 (0.0) (0.1) 6.9 7.0
WM 0.1 0.1 0.4 0.3 0.8 0.6 0.2 0.2 0.0 0.0 1.4 1.2
WMA 1.8 1.6 - - - - - - - - 1.8 1.6
P&C - - - - - - 0.5 0.5 - - 0.5 0.5
AM 0.1 0.1 0.1 0.1 0.1 0.1 0.1 0.1 (0.0) 0.0 0.4 0.4
IB 0.4 0.5 0.4 0.4 0.6 0.5 0.1 0.1 (0.0) (0.0) 1.5 1.5
CC - - - - - - - - 0.5 0.3 0.5 0.3
Group 2.5 2.3 0.8 0.8 1.4 1.2 0.9 1.0 0.5 0.3 6.1 5.6
WM 0.0 0.0 0.1 0.2 0.1 0.3 0.2 0.2 0.0 (0.0) 0.5 0.6
WMA 0.1 0.2 - - - - - - - - 0.1 0.2
P&C - - - - - - 0.4 0.4 - - 0.4 0.4
AM 0.0 0.0 0.0 0.0 0.0 0.0 0.1 0.1 0.0 (0.0) 0.2 0.1
IB 0.1 0.2 0.0 0.1 (0.0) 0.1 0.1 0.1 0.0 (0.0) 0.2 0.4
CC - - - - - - - - (0.6) (0.4) (0.6) (0.4)
Group 0.3 0.5 0.2 0.3 0.1 0.3 0.7 0.7 (0.5) (0.4) 0.8 1.4
Operatingexpenses
Profit before tax
Americas Asia Pacific EMEA Switzerland Global1 Total
Operating income
Adjusted numbers unless otherwise indicated, refer to slide 27 for details about adjusted numbers, Basel III numbers and FX rates in this presentation1 Refers to items managed globally
Regional performance – 1Q16

26
Adjusting items FY14 FY15 1Q14 2Q14 3Q14 4Q14 1Q15 2Q15 3Q15 4Q15 1Q16
CHF million
Operating income as reported (Group) 28,027 30,605 7,258 7,147 6,876 6,746 8,841 7,818 7,170 6,775 6,833
of which:
Gains/(losses) on sale of subsidiaries and businesses WM 169 141 56 (28)AM 56 56
WM 15 15 P&C 66 66
Gain from the partial sales of our investment in Markit IB 43 11 43 11
Impairment of a financial asset available for sale IB (48) (48)Own credit on financial liabilities designated at FV CC - Group ALM 292 553 88 72 61 70 226 259 32 35 Net FX translation gains/(losses) from the disposal of subsidiaries CC - Group ALM 88 (27) 115 (123)Gains on sales of real estate CC - Services 44 378 23 1 20 378
Net losses related to the buyback of debt CC - Group ALM (257) (257)
Operating income adjusted (Group) 27,696 29,526 7,147 7,031 6,863 6,656 8,096 7,492 7,084 6,854 6,956
Operating expenses as reported (Group) 25,567 25,116 5,865 5,929 7,430 6,342 6,134 6,059 6,382 6,541 5,855
of which:
WM 185 323 40 38 60 48 46 69 74 133 79
WMA 55 137 10 7 15 23 24 24 39 50 33 P&C 64 101 15 13 20 16 16 17 28 41 23 AM 50 82 4 2 5 39 18 4 23 38 20 IB 261 396 124 27 50 60 70 66 118 143 117
CC - Services 30 140 2 4 16 8 119 0 2 19 (8)
CC - NCL1 31 56 9 (2) 10 14 11 13 15 17 2 WMA (9) (21) (3) (7) (21)
AM (8) (8)IB (20) (19) (1)
CC - NCL1 (3) (3)Impairment of an intangible asset IB 11 11
Operating expenses adjusted (Group) 24,931 23,891 5,661 5,840 7,287 6,142 5,829 5,857 6,105 6,100 5,590
Operating profit/(loss) before tax as reported 2,461 5,489 1,393 1,218 (554) 404 2,708 1,759 788 234 978
Operating profit/(loss) before tax adjusted 2,766 5,635 1,486 1,191 (424) 514 2,268 1,635 979 754 1,366
Net restructuring charges
Credit related to changes to retiree benefit plans in the US
Gain related to our investment in the SIX Group
Adjusted numbers unless otherwise indicated, refer to slide 27 for details about adjusted numbers, Basel III numbers and FX rates in this presentationRefer to page 9 of the first quarter 2016 report for an overview of adjusted numbers; 1 Non-core and Legacy Portfolio
Adjusted results

27
Use of adjusted numbersUnless otherwise indicated, “adjusted” figures exclude the adjustment items listed on the previous slide, to the extent applicable, on a Group and business division level. Adjusted results are a non-GAAP financial measure as defined by SEC regulations. Refer to page 9 of the first quarter 2016 report which is available in the section "Quarterly reporting" at www.ubs.com/investors for an overview of adjusted numbers.
If applicable for a given adjusted KPI (i.e., adjusted return on tangible equity), adjustment items are calculated on an after-tax basis by applying an indicative tax rate. Refer to page 15 of the first quarter 2016 report for more information.
Basel III RWA, Basel III capital and Basel III liquidity ratiosBasel III numbers are based on the BIS Basel III framework, as applicable for Swiss Systemically relevant banks (SRB). Numbers in the presentation are Swiss SRB Basel III numbers unless otherwise stated.
Basel III risk-weighted assets in this presentation are calculated on the basis of Basel III fully applied unless otherwise stated. Our RWA under BIS Basel III are the same as under Swiss SRB Basel III.
Leverage ratio and leverage ratio denominator in this presentation are calculated on the basis of fully applied Swiss SRB rules, unless otherwise stated. From 31.12.15 onward, these are fully aligned with BIS Basel III rules. Prior period figures are calculated in accordance with former Swiss SRB rules and are therefore not comparable.
Refer to the “Capital Management” section in the first quarter 2016 report for more information.
Currency translationMonthly income statement items of foreign operations with a functional currency other than Swiss francs are translated with month-end rates into Swiss francs.
RoundingNumbers presented throughout this presentation may not add up precisely to the totals provided in the tables and text. Percentages, percent changes and absolute variances are calculated based on rounded figures displayed in the tables and text and may not precisely reflect the percentages, percent changes and absolute variances that would be derived based on figures that are not rounded.
TablesWithin tables, blank fields generally indicate that the field is not applicable or not meaningful, or that information is not available as of the relevant date or for the relevant period. Zero values generally indicate that the respective figure is zero on an actual or rounded basis.
Important information related to this presentation