first quarter 2017 results and key metrics · pdf file3 citigroup’s operating expenses...
TRANSCRIPT

1
CEO COMMENTARY
Citi CEO Michael Corbat said,
“The momentum we saw across
many of our businesses towards
the end of last year carried into
the first quarter, resulting in
significantly better overall
performance than a year ago.
Revenues increased in both our
consumer and institutional lines
of business, most notably in
areas where we have been
investing such as Equities, U.S.
Cards and Mexico. We grew
loans and deposits and achieved
an efficiency ratio of just under
58%, an ROA of 91bps and a
ROTCE ex-DTA of over 10%,
showing good progress towards
achieving our near-term financial
targets.
“Through our earnings and the
utilization of $800 million in
Deferred Tax Assets, we
generated $5.5 billion of total
regulatory capital before
returning $2.2 billion to our
shareholders. Our CET 1 Capital
ratio rose to 12.8% and we could
not be more committed to
continuing to increase the capital
we return to our shareholders,”
Mr. Corbat concluded.
For Immediate Release
Citigroup Inc. (NYSE: C)
April 13, 2017
FIRST QUARTER 2017 RESULTS AND KEY METRICS
EARNINGS PER SHARE OF $1.35
NET INCOME OF $4.1 BILLION
REVENUES OF $18.1 BILLION
RETURNED $2.2 BILLION OF CAPITAL TO COMMON SHAREHOLDERS
REPURCHASED 30 MILLION COMMON SHARES
BOOK VALUE PER SHARE OF $75.86 TANGIBLE BOOK VALUE PER SHARE OF $65.946
New York, April 13, 2017 – Citigroup Inc. today reported net income for the first quarter 2017 of $4.1 billion, or $1.35 per diluted share, on revenues of $18.1 billion. This compared to net income of $3.5 billion, or $1.10 per diluted share, on revenues of $17.6 billion for the first quarter 2016.
Revenues increased 3% from the prior year period, driven by growth in both the Institutional Clients Group (ICG) and Global Consumer Banking (GCB), partially offset by lower revenues in Corporate / Other primarily due to the continued wind down of legacy assets. Net income of $4.1 billion increased 17%, driven by the higher revenues and lower cost of credit. Earnings per share of $1.35 increased 23% from $1.10 per diluted share in the prior year period, driven by the growth in net income and a 6% reduction in average diluted shares outstanding. These results were impacted by episodic items recorded in Corporate / Other described below, which on a net basis benefitted earnings by roughly $0.08 per share in the first quarter 2017.
In the discussion throughout the remainder of this press release, percentage comparisons are calculated for the first quarter 2017 versus the first quarter 2016, unless otherwise specified.
Efficiency Ratio
58%1
ROE: 7.4%
RoTCE ex. DTA: 10.2%2
CET1 Capital Ratio
12.8%3
SLR
7.3%4
Payout Ratio
59%5
2
Citigroup
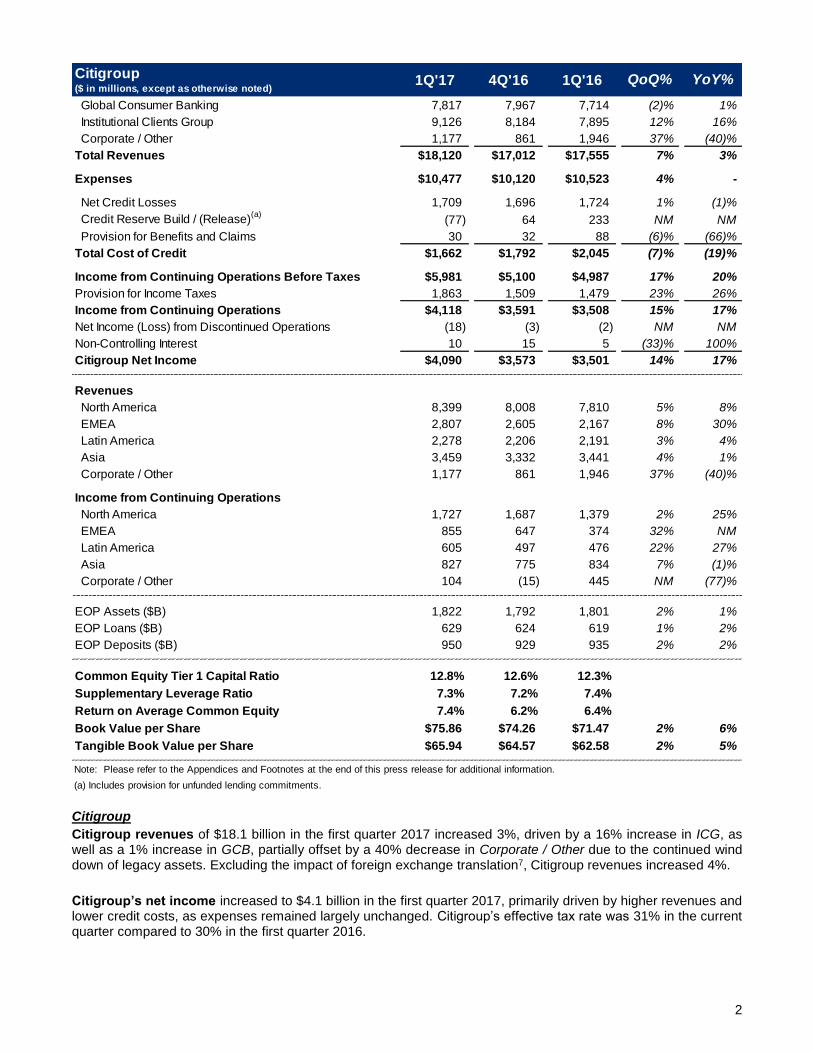
Citigroup revenues of $18.1 billion in the first quarter 2017 increased 3%, driven by a 16% increase in ICG, as well as a 1% increase in GCB, partially offset by a 40% decrease in Corporate / Other due to the continued wind down of legacy assets. Excluding the impact of foreign exchange translation7, Citigroup revenues increased 4%.
Citigroup’s net income increased to $4.1 billion in the first quarter 2017, primarily driven by higher revenues and lower credit costs, as expenses remained largely unchanged. Citigroup’s effective tax rate was 31% in the current quarter compared to 30% in the first quarter 2016.
1Q'17 4Q'16 1Q'16 QoQ% YoY%
Global Consumer Banking 7,817 7,967 7,714 (2)% 1%
Institutional Clients Group 9,126 8,184 7,895 12% 16%
Corporate / Other 1,177 861 1,946 37% (40)%
$18,120 $17,012 $17,555 7% 3%
$10,477 $10,120 $10,523 4% -
Net Credit Losses 1,709 1,696 1,724 1% (1)%
Credit Reserve Build / (Release)(a)
(77) 64 233 NM NM
Provision for Benefits and Claims 30 32 88 (6)% (66)%
$1,662 $1,792 $2,045 (7)% (19)%
$5,981 $5,100 $4,987 17% 20%
1,863 1,509 1,479 23% 26%
$4,118 $3,591 $3,508 15% 17%
(18) (3) (2) NM NM
10 15 5 (33)% 100%
$4,090 $3,573 $3,501 14% 17%
North America 8,399 8,008 7,810 5% 8%
EMEA 2,807 2,605 2,167 8% 30%
Latin America 2,278 2,206 2,191 3% 4%
Asia 3,459 3,332 3,441 4% 1%
Corporate / Other 1,177 861 1,946 37% (40)%
North America 1,727 1,687 1,379 2% 25%
EMEA 855 647 374 32% NM
Latin America 605 497 476 22% 27%
Asia 827 775 834 7% (1)%
Corporate / Other 104 (15) 445 NM (77)%
1,822 1,792 1,801 2% 1%
629 624 619 1% 2%
950 929 935 2% 2%
12.8% 12.6% 12.3%
7.3% 7.2% 7.4%
7.4% 6.2% 6.4%
$75.86 $74.26 $71.47 2% 6%
$65.94 $64.57 $62.58 2% 5%
Note: Please refer to the Appendices and Footnotes at the end of this press release for additional information.
(a) Includes provision for unfunded lending commitments.
Supplementary Leverage Ratio
Return on Average Common Equity
Book Value per Share
Tangible Book Value per Share
Citigroup($ in millions, except as otherwise noted)
Income from Continuing Operations
Common Equity Tier 1 Capital Ratio
Total Revenues
Expenses
Total Cost of Credit
Citigroup Net Income
Income from Continuing Operations Before Taxes
Provision for Income Taxes
Net Income (Loss) from Discontinued Operations
Non-Controlling Interest
EOP Assets ($B)
EOP Loans ($B)
EOP Deposits ($B)
Revenues
Income from Continuing Operations

3
Citigroup’s operating expenses were largely unchanged at $10.5 billion in the first quarter 2017. In constant dollars, operating expenses increased by 1%, mainly driven by higher performance-related compensation and higher business volumes, mostly offset by lower repositioning costs, as investments were largely funded through efficiency savings.
Citigroup’s cost of credit in the first quarter 2017 was $1.7 billion, a 19% decrease, largely driven by a loan loss reserve release of $77 million, compared to a build of $233 million in the prior year period driven by energy-related exposures in ICG. A decline in the provision for benefits and claims and a modest decline in net credit losses also contributed to the lower cost of credit.
Citigroup’s allowance for loan losses was $12.0 billion at quarter end, or 1.93% of total loans, compared to $12.7 billion, or 2.07% of total loans, at the end of the prior year period. Total non-accrual assets declined 11% from the prior year period to $5.5 billion. Consumer non-accrual loans declined 18% to $3.0 billion. Corporate non-accrual loans increased 1% to $2.3 billion but were down 3% from the prior quarter.
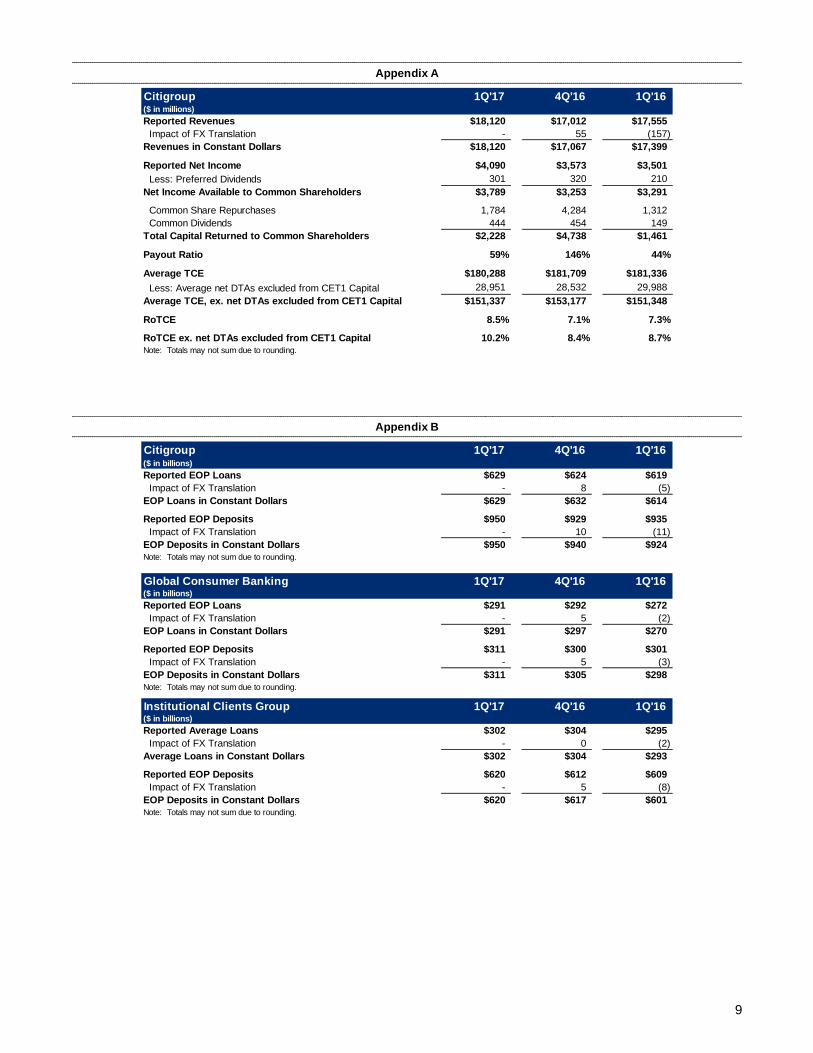
Citigroup’s end of period loans were $629 billion as of quarter end, up 2% from the prior year period. In constant dollars, Citigroup’s end of period loans also grew 2%, as 8% growth in GCB and 3% growth in ICG was partially offset by the continued wind down of legacy assets in Corporate / Other.
Citigroup’s deposits were $950 billion as of quarter end, up 2%. In constant dollars, Citigroup deposits were up 3%, driven by a 4% increase in GCB deposits and a 3% increase in ICG deposits, slightly offset by a decline in Corporate / Other deposits.
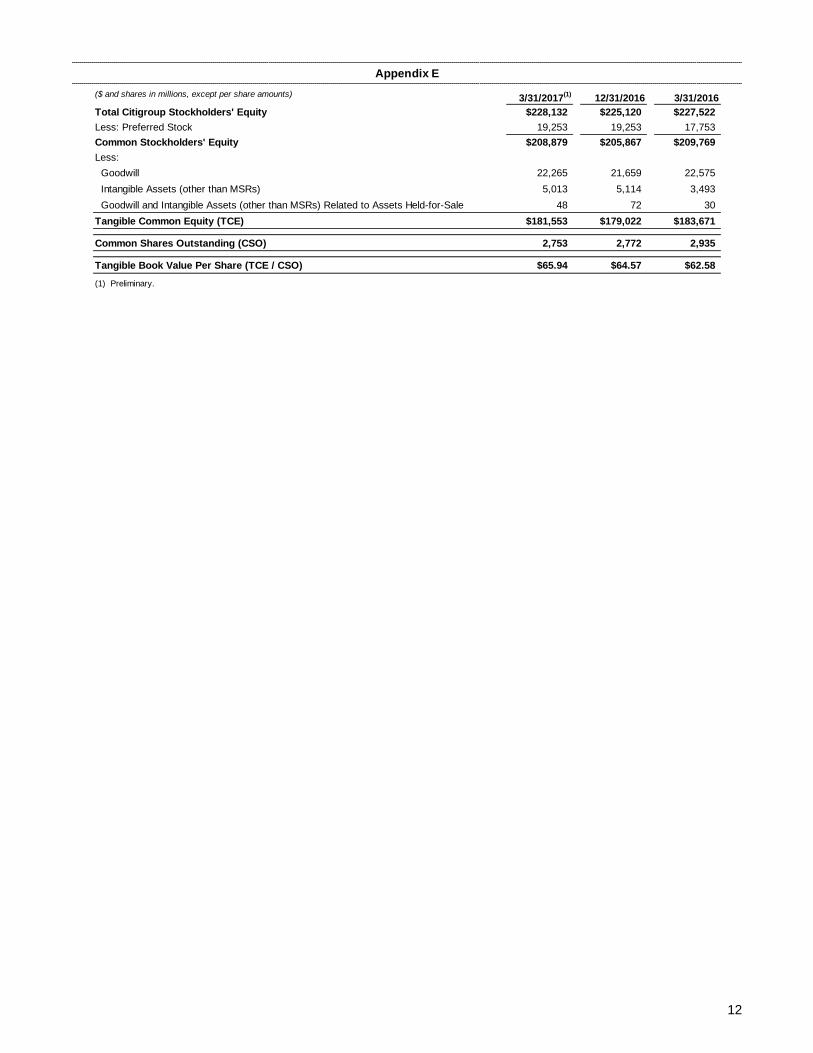
Citigroup’s book value per share was $75.86 and tangible book value per share was $65.94, each at quarter end, representing a 6% and 5% increase respectively. At quarter end, Citigroup’s Common Equity Tier 1 Capital ratio was 12.8%, up from 12.3% in the prior year period, driven primarily by earnings partially offset by capital return. Citigroup’s Supplementary Leverage Ratio for the first quarter 2017 was 7.3%, down from 7.4% in the prior year period, as an increase in Tier 1 Capital was more than offset by an increase in Total Leverage Exposure. During the first quarter 2017, Citigroup repurchased approximately 30 million common shares and returned a total of approximately $2.2 billion to common shareholders in the form of common share repurchases and dividends.

4
Global Consumer Banking
GCB revenues of $7.8 billion increased 1%. In constant dollars, revenues increased 3%, driven by a 2% increase in North America GCB and a 3% increase in international GCB.
GCB net income decreased 16% to $1.0 billion, as the higher revenues were more than offset by higher cost of credit. Operating expenses were largely flat at $4.4 billion, and increased 1% in constant dollars, driven by the addition of the Costco portfolio, volume growth and continued investments, partially offset by ongoing efficiency savings and lower repositioning costs.
North America GCB revenues of $4.9 billion increased 2%, with higher revenues in Citi-branded cards partially offset by declines in retail services and retail banking. Citi-branded cards revenues of $2.1 billion increased 13%, reflecting the addition of the Costco portfolio and modest organic growth, offset by the impact of day count. Citi retail services revenues of $1.6 billion were down 5% driven by the absence of gains on the sales of two portfolios sold in first quarter 2016. Retail banking revenues declined 3% mainly due to lower mortgage revenues partially offset by growth in average loans, deposits and assets under management.
North America GCB net income was $627 million, down 25%, driven by higher cost of credit and higher operating expenses, partially offset by the higher revenues. Operating expenses increased 3% to $2.6 billion, primarily driven by the addition of the Costco portfolio, volume growth and continued investments, partially offset by efficiency savings and lower repositioning costs.
North America GCB cost of credit increased 33% to $1.4 billion. The net loan loss reserve build in the first quarter 2017 was $159 million, compared to a build of $79 million in the prior year period, largely supporting volume growth. Net credit losses of $1.2 billion increased 28%, driven by the Costco portfolio acquisition, organic volume growth and seasoning, and the impact of changes in collection processes in the cards businesses.
1Q'17 4Q'16 1Q'16 QoQ% YoY%
North America 4,944 5,059 4,830 (2)% 2%
Latin America 1,151 1,212 1,229 (5)% (6)%
Asia(a)
1,722 1,696 1,655 2% 4%
$7,817 $7,967 $7,714 (2)% 1%
$4,415 $4,356 $4,401 1% -
Net Credit Losses 1,603 1,516 1,371 6% 17%
Credit Reserve Build / (Release)(b)
183 161 86 14% NM
Provision for Benefits and Claims 29 32 28 (9)% 4%
$1,815 $1,709 $1,485 6% 22%
$1,002 $1,224 $1,192 (18)% (16)%
North America 627 810 833 (23)% (25)%
Latin America 130 154 146 (16)% (11)%
Asia(a)
246 261 215 (6)% 14%
139 138 140 1% (1)%
304 301 294 1% 3%
147 138 140 7% 5%
151 149 131 1% 15%
112 125 85 (10)% 33%
Note: Please refer to the Appendices and Footnotes at the end of this press release for additional information.
(a) Asia GCB includes the results of operations of GCB activities in certain EMEA countries for all periods presented.
(b) Includes provision for unfunded lending commitments.
Investment AUMs
Cards Purchase Sales
Income from Continuing Operations
Key Indicators ($B)
Cards Average Loans
Retail Banking Average Loans
Retail Banking Average Deposits
Global Consumer Banking($ in millions, except as otherwise noted)
Total Revenues
Expenses
Total Cost of Credit
Net Income

5
International GCB revenues were largely unchanged at $2.9 billion. In constant dollars, revenues increased 3%. On such basis, revenues in Latin America GCB of $1.2 billion increased 4%, driven by growth in retail loans and deposits, as well as improved deposit spreads, partially offset by lower cards revenues. Revenues in Asia GCB of $1.7 billion increased 3%, driven by improvement in cards and wealth management revenues, partially offset by lower retail lending revenues.
International GCB net income increased 4% to $375 million. In constant dollars, net income increased 12%, driven by the higher revenue and lower expenses, partially offset by higher credit costs. Operating expenses decreased 3% on a reported basis and were 1% lower versus the prior year period in constant dollars. Credit costs decreased 1% on a reported basis and increased 6% in constant dollars. On such basis, the net loan loss reserve build was $24 million, compared to $2 million in the prior year period, net credit losses decreased by 1% and the net credit loss rate was 1.58% of average loans, increasing from 1.55% in the prior year period.
Institutional Clients Group
ICG revenues of $9.1 billion increased 16%, driven by both Banking and Markets and Securities Services revenues.
Banking revenues of $4.4 billion increased 13% (including gain / (loss) on loan hedges)8. Excluding gain / (loss) on loan hedges in Corporate Lending, Banking revenues of $4.5 billion increased 14%. Treasury and Trade
1Q'17 4Q'16 1Q'16 QoQ% YoY%
Treasury & Trade Solutions 2,075 2,009 1,903 3% 9%
Investment Banking 1,214 1,131 873 7% 39%
Private Bank 744 671 684 11% 9%
Corporate Lending(a)
434 448 448 (3)% (3)%
Total Banking 4,467 4,259 3,908 5% 14%
Fixed Income Markets 3,622 2,957 3,051 22% 19%
Equity Markets 769 685 697 12% 10%
Securities Services 543 529 561 3% (3)%
Other (160) (139) (256) (15)% 38%
Total Markets & Securities Services 4,774 4,032 4,053 18% 18%
$9,241 $8,291 $7,961 11% 16%
Gain / (Loss) on Loan Hedges (115) (107) (66) (7)% (74)%
$9,126 $8,184 $7,895 12% 16%
$4,945 $4,634 $4,872 7% 1%
Net Credit Losses 25 119 211 (79)% (88)%
Credit Reserve Build / (Release)(b)
(230) (15) 179 NM NM
$(205) $104 $390 NM NM
$2,996 $2,369 $1,859 26% 61%
North America 3,455 2,949 2,980 17% 16%
EMEA 2,807 2,605 2,167 8% 30%
Latin America 1,127 994 962 13% 17%
Asia 1,737 1,636 1,786 6% (3)%
North America 1,100 877 546 25% NM
EMEA 855 647 374 32% NM
Latin America 475 343 330 38% 44%
Asia 581 514 619 13% (6)%
Note: Please refer to the Appendices and Footnotes at the end of this press release for additional information.
(a) Excludes gain / (loss) on hedges related to accrual loans. For additional information, please refer to Footnote 8.
(b) Includes provision for unfunded lending commitments.
Income from Continuing Operations
Total Cost of Credit
Net Income
Institutional Clients Group($ in millions)
Product Revenues(a)
Total Revenues
Expenses
Revenues

6
Solutions (TTS) revenues of $2.1 billion increased 9%, reflecting strong fee growth, higher volumes and improved spreads. Investment Banking revenues of $1.2 billion were up 39% versus the prior year period. Advisory revenues increased 8% to $246 million, debt underwriting revenues increased 39% to $733 million, and equity underwriting revenues nearly doubled to $235 million. Private Bank revenues increased 9% to $744 million, driven by loan and deposit growth and improved spreads. Corporate Lending revenues of $434 million declined 3% (excluding gain / (loss) on loan hedges) on lower average volumes.
Markets and Securities Services revenues of $4.8 billion increased 18%. Fixed Income Markets revenues of $3.6 billion in the first quarter 2017 increased 19%, driven by both rates and currencies as well as spread products. Equity Markets revenues of $769 million increased 10%, driven by an improvement in derivatives. Securities Services revenues of $543 million decreased 3% driven by prior period divestitures; however, excluding the divestitures, revenue increased 12% driven by higher deposit balances and growth in assets under custody.
ICG net income of $3.0 billion increased 61%, driven by the higher revenues and lower cost of credit partially offset by higher operating expenses. ICG operating expenses increased 1% to $4.9 billion, as higher performance-based compensation was partially offset by lower repositioning costs and a benefit from foreign exchange translation. ICG cost of credit was a net benefit of $205 million, compared to a cost of $390 million in the prior year period. ICG cost of credit included net credit losses of $25 million ($211 million in the prior year period) and a net loan loss reserve release of $230 million (net loan loss reserve build of $179 million in the prior year period largely for the energy-related exposures). The improvement in cost of credit was driven by net ratings upgrades and continued stability in commodity prices.
ICG average loans grew 2% to $302 billion. In constant dollars, average loans increased 3%.
ICG end of period deposits increased 2% to $620 billion. In constant dollars, end of period deposits grew 3%.
Corporate / Other
Corporate / Other revenues of $1.2 billion decreased 40% from the prior year period, driven by legacy asset run-off and divestiture activity, as well as lower revenue from treasury-related hedging activity. The current quarter revenue included approximately $750 million of gains on asset sales which more than offset a roughly $300 million charge related to the previously announced exit of Citigroup’s U.S. mortgage servicing operations. As of the end of the first quarter 2017, Corporate / Other assets were $96 billion, 23% below the prior year period and 7% below the prior quarter, primarily reflecting the continued wind down of legacy assets.
Corporate / Other net income was $92 million, compared to $450 million in the prior year period, reflecting the lower revenue, partially offset by lower operating expenses and lower cost of credit. Corporate / Other operating expenses declined 11% to $1.1 billion, primarily driven by the wind-down of legacy assets, partially offset by approximately $100 million of episodic expenses related to the exit of Citigroup’s U.S. mortgage servicing operations.
1Q'17 4Q'16 1Q'16 QoQ% YoY%
$1,177 $861 $1,946 37% (40)%
$1,117 $1,130 $1,250 (1)% (11)%
Net Credit Losses 81 61 142 33% (43)%
Credit Reserve Build / (Release)(a)
(30) (82) (32) 63% 6%
Provision for Benefits and Claims 1 - 60 100% (98)%
$52 $(21) $170 NM (69)%
$92 $(20) $450 NM (80)%
96 103 124 (7)% (23)%
29 33 45 (12)% (35)%
19 18 25 7% (23)%
(a) Includes provision for unfunded lending commitments.
EOP Loans ($B)
EOP Deposits ($B)
EOP Assets ($B)
Corporate / Other($ in millions, except as otherwise noted)
Revenues
Expenses
Total Cost of Credit
Net Income

7
Corporate / Other cost of credit was $52 million compared to $170 million in the prior year period. Net credit losses declined 43% to $81 million, reflecting the impact of ongoing divestiture activity as well as continued improvement in the North America mortgage portfolio, and the provision for benefits and claims declined by $59 million to $1 million reflecting lower insurance-related assets. The net loan loss reserve release was largely unchanged.

8
Citigroup will host a conference call today at 11:30 AM (ET). A live webcast of the presentation, as well as financial results and presentation materials, will be available at http://www.citigroup.com/citi/investor. Dial-in numbers for the conference call are as follows: (866) 516-9582 in the U.S. and Canada; (973) 409-9210 outside of the U.S. and Canada. The conference code for both numbers is 32140614.
Citigroup, the leading global bank, has approximately 200 million customer accounts and does business in more than 160 countries and jurisdictions. Citigroup provides consumers, corporations, governments and institutions with a broad range of financial products and services, including consumer banking and credit, corporate and investment banking, securities brokerage, transaction services, and wealth management.
Additional information may be found at www.citigroup.com | Twitter: @Citi | YouTube: www.youtube.com/citi | Blog: http://blog.citigroup.com | Facebook: www.facebook.com/citi | LinkedIn: www.linkedin.com/company/citi
Additional financial, statistical, and business-related information, as well as business and segment trends, is included in a Quarterly Financial Data Supplement. Both this earnings release and Citigroup’s First Quarter 2017 Quarterly Financial Data Supplement are available on Citigroup’s website at www.citigroup.com.
Certain statements in this release are “forward-looking statements” within the meaning of the rules and regulations of the U.S. Securities and Exchange Commission (SEC). These statements are based on management’s current expectations and are subject to uncertainty and changes in circumstances. These statements are not guarantees of future results or occurrences. Actual results and capital and other financial condition may differ materially from those included in these statements due to a variety of factors, including the precautionary statements included in this release and those contained in Citigroup’s filings with the SEC, including without limitation the “Risk Factors” section of Citigroup’s 2016 Annual Report on Form 10-K. Any forward-looking statements made by or on behalf of Citigroup speak only as to the date they are made, and Citigroup does not undertake to update forward-looking statements to reflect the impact of circumstances or events that arise after the date the forward-looking statements were made.
Contacts:
Press: Mark Costiglio (212) 559-4114 Investors: Susan Kendall (212) 559-2718
Fixed Income Investors: Thomas Rogers (212) 559-5091
9
Citigroup 1Q'17 4Q'16 1Q'16($ in millions)
Reported Revenues $18,120 $17,012 $17,555
Impact of FX Translation - 55 (157)
Revenues in Constant Dollars $18,120 $17,067 $17,399
Reported Net Income $4,090 $3,573 $3,501
Less: Preferred Dividends 301 320 210
Net Income Available to Common Shareholders $3,789 $3,253 $3,291
Common Share Repurchases 1,784 4,284 1,312
Common Dividends 444 454 149
Total Capital Returned to Common Shareholders $2,228 $4,738 $1,461
Payout Ratio 59% 146% 44%
Average TCE $180,288 $181,709 $181,336
Less: Average net DTAs excluded from CET1 Capital 28,951 28,532 29,988
Average TCE, ex. net DTAs excluded from CET1 Capital $151,337 $153,177 $151,348
RoTCE 8.5% 7.1% 7.3%
RoTCE ex. net DTAs excluded from CET1 Capital 10.2% 8.4% 8.7%
Appendix A
Note: Totals may not sum due to rounding.
Citigroup 1Q'17 4Q'16 1Q'16($ in billions)
Reported EOP Loans $629 $624 $619
Impact of FX Translation - 8 (5)
EOP Loans in Constant Dollars $629 $632 $614
Reported EOP Deposits $950 $929 $935
Impact of FX Translation - 10 (11)
EOP Deposits in Constant Dollars $950 $940 $924
Global Consumer Banking 1Q'17 4Q'16 1Q'16($ in billions)
Reported EOP Loans $291 $292 $272
Impact of FX Translation - 5 (2)
EOP Loans in Constant Dollars $291 $297 $270
Reported EOP Deposits $311 $300 $301
Impact of FX Translation - 5 (3)
EOP Deposits in Constant Dollars $311 $305 $298
Institutional Clients Group 1Q'17 4Q'16 1Q'16($ in billions)
Reported Average Loans $302 $304 $295
Impact of FX Translation - 0 (2)
Average Loans in Constant Dollars $302 $304 $293
Reported EOP Deposits $620 $612 $609
Impact of FX Translation - 5 (8)
EOP Deposits in Constant Dollars $620 $617 $601
Note: Totals may not sum due to rounding.
Note: Totals may not sum due to rounding.
Note: Totals may not sum due to rounding.
Appendix B

10
International Consumer Banking 1Q'17 4Q'16 1Q'16($ in millions)
Reported Revenues $2,873 $2,908 $2,884
Impact of FX Translation - 29 (103)
Revenues in Constant Dollars $2,873 $2,937 $2,781
Reported Expenses $1,839 $1,819 $1,901
Impact of FX Translation - 19 (42)
Expenses in Constant Dollars $1,839 $1,838 $1,859
Reported Credit Costs $460 $479 $464
Impact of FX Translation - 6 (30)
Credit Costs in Constant Dollars $460 $485 $434
Reported Net Income $375 $413 $359
Impact of FX Translation - 3 (25)
Net Income in Constant Dollars $375 $416 $334
Latin America Consumer Banking 1Q'17 4Q'16 1Q'16($ in millions)
Reported Revenues $1,151 $1,212 $1,229
Impact of FX Translation - 8 (122)
Revenues in Constant Dollars $1,151 $1,220 $1,107
Reported Expenses $659 $688 $718
Impact of FX Translation - 4 (57)
Expenses in Constant Dollars $659 $692 $661
Asia Consumer Banking(1) 1Q'17 4Q'16 1Q'16
($ in millions)
Reported Revenues $1,722 $1,696 $1,655
Impact of FX Translation - 21 19
Revenues in Constant Dollars $1,722 $1,717 $1,674
Reported Expenses $1,180 $1,131 $1,183
Impact of FX Translation - 15 15
Expenses in Constant Dollars $1,180 $1,146 $1,198
Appendix B (Cont.)
(1) Asia GCB includes the results of operations in EMEA GCB for all periods presented.
Note: Totals may not sum due to rounding.
Note: Totals may not sum due to rounding.
Note: Totals may not sum due to rounding.

11
($ in millions) 3/31/2017(1)
12/31/2016 3/31/2016
$209,063 $206,051 $209,947
133 129 143
(562) (560) (300)
(173) (61) 562
21,448 20,858 21,935
4,738 4,876 3,332
836 857 870
21,077 21,337 23,414
8,997 9,357 7,254
Common Equity Tier 1 Capital (CET1) $152,835 $149,516 $153,023
Risk-Weighted Assets (RWA) $1,193,983 $1,189,680 $1,239,575
Common Equity Tier 1 Capital Ratio (CET1 / RWA) 12.8% 12.6% 12.3%
Note:
(1) Preliminary
(2)
(3)
(4)
(5)
(6) Assets subject to 10% / 15% limitations include MSRs, DTAs arising from temporary differences and significant common stock investments in unconsolidated
financial institutions. For all periods presented, the deduction related only to DTAs arising from temporary differences that exceeded the 10% limitation.
Citi's Common Equity Tier 1 Capital ratio and related components reflect full implementation of the U.S. Basel III rules. Risk-weighted assets are based on the Basel
III Advanced Approaches for determining total risk-weighted assets
Excludes issuance costs related to outstanding preferred stock in accordance with Federal Reserve Board regulatory reporting requirements
Common Equity Tier 1 Capital is adjusted for accumulated net unrealized gains (losses) on cash flow hedges included in accumulated other comprehensive income
that relate to the hedging of items not recognized at fair value on the balance sheet.
Includes goodwill “embedded” in the valuation of significant common stock investments in unconsolidated financial institutions.
The cumulative impact of changes in Citigroup’s own creditworthiness in valuing liabilities for which the fair value option has been elected and own-credit valuation
adjustments on derivatives are excluded from Common Equity Tier 1 Capital, in accordance with the U.S. Basel III rules
Appendix C
Citigroup Common Stockholders' Equity(2)
Add: Qualifying noncontrolling interests
Regulatory Capital Adjustments and Deductions:
Less:
Accumulated net unrealized losses on cash flow hedges, net of tax(3)
Cumulative unrealized net gain (loss) related to changes in fair value of financial
liabilities attributable to own creditworthiness, net of tax(4)
Intangible Assets:
Goodwill, net of related deferred tax liabilities (DTLs)
(5)
Identifiable intangible assets other than mortgage servicing rights (MSRs),
net of related DTLs
Defined benefit pension plan net assets
Deferred tax assets (DTAs) arising from net operating loss, foreign tax credit
and general business credit carry-forwards
Excess over 10% / 15% limitations for other DTAs, certain common stock
investments and MSRs(6)
($ in millions) 3/31/2017(1)
12/31/2016 3/31/2016
Common Equity Tier 1 Capital (CET1) $152,835 $149,516 $153,023
Additional Tier 1 Capital (AT1)(2)
19,756 19,874 18,119
Total Tier 1 Capital (T1C) (CET1 + AT1) $172,591 $169,390 $171,142
Total Leverage Exposure (TLE) $2,364,242 $2,345,391 $2,300,427
Supplementary Leverage Ratio (T1C / TLE) 7.3% 7.2% 7.4%
(2) Additional Tier 1 Capital primarily includes qualifying noncumulative perpetual preferred stock and qualifying trust preferred securities.
(1) Preliminary.
Note: Citi's Supplementary Leverage Ratio and related components reflect full implementation of the U.S. Basel III rules.
Appendix D
12
($ and shares in millions, except per share amounts) 3/31/2017(1)
12/31/2016 3/31/2016
Total Citigroup Stockholders' Equity $228,132 $225,120 $227,522
Less: Preferred Stock 19,253 19,253 17,753
Common Stockholders' Equity $208,879 $205,867 $209,769
Less:
Goodwill 22,265 21,659 22,575
Intangible Assets (other than MSRs) 5,013 5,114 3,493
Goodwill and Intangible Assets (other than MSRs) Related to Assets Held-for-Sale 48 72 30
Tangible Common Equity (TCE) $181,553 $179,022 $183,671
Common Shares Outstanding (CSO) 2,753 2,772 2,935
Tangible Book Value Per Share (TCE / CSO) $65.94 $64.57 $62.58
Appendix E
(1) Preliminary.

13
1 Citigroup’s total expenses divided by total revenues.
2 Preliminary. Return on average tangible common equity (RoTCE) excluding deferred tax assets (DTAs) is a non-GAAP financial measure. The amount that is excluded from average tangible common equity represents the average net DTAs excluded for purposes of calculating Citigroup’s Common Equity Tier 1 (CET1) Capital under full implementation of the U.S Basel III rules. For the components of the calculation, see Appendix A.
3 Preliminary. Citigroup’s CET1 Capital ratio, which reflects full implementation of the U.S. Basel III rules, is a non-GAAP financial measure. For the composition of Citigroup’s CET1 Capital and ratio, see Appendix C.
4 Preliminary. Citigroup's Supplementary Leverage Ratio (SLR), which reflects full implementation of the U.S. Basel III rules, is a non-GAAP financial measure. For the composition of Citigroup’s SLR, see Appendix D. 5 Citigroup’s payout ratio is the sum of common dividends and common share repurchases divided by net income available to common shareholders. For the components of the calculation, see Appendix A.
6 Preliminary. Citigroup’s tangible book value per share is a non-GAAP financial measure. For a reconciliation of this measure to reported results, see Appendix E.
7 Results of operations excluding the impact of foreign exchange translation (constant dollar basis) are non-GAAP financial measures. For a reconciliation of these measures to reported results, see Appendices A and B. 8 Hedges on accrual loans reflect the mark-to-market on credit derivatives used to hedge the corporate accrual loan portfolio. The fixed premium cost of these hedges is included in (netted against) the core lending revenues. Results of operations excluding the impact of gain / (loss) on loan hedges are non-GAAP financial measures.