first quarter 2018 - nordea.com management... · sara helweg-larsen, head of group communications,...
TRANSCRIPT

First Quarter 2018

Nordea First Quarter 2018
1
Q1
Interim Management Statement First Quarter Results 2018
CEO Casper von Koskull’s comments on the results:“2016 and 2017 were characterised by significant investments to improve our compliance and risk operations as well as a de-risking of the bank. These activities have had a meaningful impact on both revenues and costs. Furthermore, this has led to a situation where we have been more internally focused and we now need to get back to focusing more on our customer business. I am satisfied to say that we are now through the most important parts of the de-risking, the risk reduction in Russia, Shipping, Oil and Offshore progressing well, and our International Private Banking arm being divested.
In the first quarter of 2018 we delivered on our cost reductions, our credit quality is the strongest since 2007 and our capital ratios have never been higher. We are confident that net profit will grow in 2018 compared to 2017, as previously stated. As the underlying revenues in the first quarter were softer than expected it is more challenging to reach our full-year revenue guidance. We will therefore have an increased focus on improving the business momentum, while at the same time maintaining our risk and compliance discipline. We reiterate our cost target for 2018 of EUR 4.9bn.”
(For further viewpoints, see CEO comments on page 2)
First quarter 2018 vs. First quarter 2017
(First quarter 2018 vs. Fourth quarter 2017) Total operating income -6%, in local currencies -4% (+4%,
in local currencies +4%) Total expenses -3%, in local currencies -1% (-11%, in local
currencies -11%) Operating profit -3%, in local currencies -1% (+34%, in local
currencies +35%) Common Equity Tier 1 capital ratio 19.8%, up from 18.8%
(up from 19.5%) Cost/income ratio up to 52% from 51% (down 9% points
from 61%) Loan loss ratio of 7 bps, down from 14 bps (down 2 bps
from 9 bps) Return on equity 10.0%, down from 10.3% (up 2.3% points
from 7.7%) Diluted EPS EUR 0.20 vs. EUR 0.21 (EUR 0.20 vs. EUR
0.15)
Summary key figuresQ1 Q4 Local Q1 Local
2018 2017 Chg % curr. % 2017 Chg % curr. %EURmNet interest income 1,053 1,109 -5 -5 1,197 -12 -9Total operating income 2,315 2,228 4 4 2,461 -6 -4Profit before loan losses 1,110 867 28 28 1,215 -9 -7Net loan losses -40 -71 -44 -43 -113 -65 -63Operating profit 1,070 796 34 35 1,102 -3 -1Diluted earnings per share, EUR 0.20 0.15 0.21ROE, % 10.0 7.7 10.3Exchange rates used for Q1 2018 for income statement items are for DKK 7.4468, NOK 9.6366 and SEK 9.9765.
For further information:Casper von Koskull, President and Group CEO, +46 10 157 10 20Christopher Rees, Group CFO, +45 5547 2377
Rodney Alfvén, Head of Investor Relations, +46 72 235 05 15Sara Helweg-Larsen, Head of Group Communications, +45 2214 0000
19.8CET 1 capital ratio (%)
We build strong and close relationships through our engagement with customers and society. Whenever people strive to reach their goals and realise their dreams, we are there to provide relevant financial solutions. We are the largest bank in the Nordic region and among the ten largest financial groups in Europe in terms of total market capitalisation with around 11 million customers. The Nordea share is listed on the Nasdaq Stockholm, Nasdaq Helsinki and Nasdaq Copenhagen exchanges. Read more about us on nordea.com.
1,070Total operating profit,
Q1 2018 (EURm)

Nordea First Quarter 2018
2
Q1
CEO comment Economic environmentAfter an exceptionally stable situation on the financial markets in 2017, 2018 has started with higher volatility. The synchronised growth in the Nordic markets continued. Geopolitical factors continued to challenge globalisation trends, however, we have seen that geopolitical concerns start to create volatility in the market. Additionally, there are early signs that the business cycle is starting to reach a peak level, and just as in 2017, Nordea continues to focus on disciplined lending underwriting principles and we are well prepared to handle a situation with lower growth.Financial outcomeTotal revenues decreased 4% in local currencies compared to the first quarter of 2017 but increased 4% in local currencies compared to last quarter. Net interest income decreased 9% in local currencies compared to the first quarter of 2017 mainly due to de-risking, deconsolidation of the Baltics and lower revenues from Treasury. Fee and commission income was down 9% in local currencies compared to the first quarter of 2017, mainly driven by lower corporate and institutional activities and lower AuM. Net flow was negative at EUR 3.6bn compared to a positive net flow of EUR 1.3bn in the first quarter of 2017. The net result from items at fair value increased 17% in local currencies to EUR 441m from EUR 375m in the first quarter of 2017 and 90% in local currencies compared to last quarter.Costs decreased by 1% compared to the first quarter of 2017 and total cash spending decreased by 7%. Credit quality continued to improve and our loan losses are at the lowest level since 2007. We reiterate our guidance on loan losses which are expected to be below the long-term average in the coming quarters.Our reported Common Equity Tier 1 (CET1) ratio increased to 19.8%, compared to 18.8% a year ago, and the management buffer has again reached an all-time-high level of 230 bps, well above our target level of 50-150 bps. The Swedish Financial Supervisory Authority has proposed to change method for the application of the mortgage risk weight floors of 25% from Pillar 2 to Pillar 1. We think this is structurally right as it will then be possible to compare different banks’ CET1 ratios. In the aftermath of this change, Nordea will have the highest CET1 ratio in Europe as well as the highest CET1 ratio requirements.Delivering value to our customersOf all our advisory meetings, 30% are held online and we expect this trend to continue. We have also launched our digital savings adviser Nora that provides customers with digital savings advice 24/7. 70% of the customers in Sweden who started to save through Nora have not previously saved with Nordea.Nordea has joined the we.trade consortium as founding partner. The consortium is, in conjunction with IBM, developing a platform based on distributed ledger technology (DLT) that aims at making domestic and cross-border commerce easier, safer and more efficient for companies. This is the first blockchain-based trade finance platform as such, marking a milestone in the practical adoption of DLT in the financial industry.Nordea Funds’ performance has been acknowledged with awards in all Nordic markets. In Denmark Nordea Invest was the fund company receiving most awards in the annual Dansk
Aktionærforening award ceremony. In Norway, Sweden and Finland the Nordea Nordic Small Cap funds were granted the best Nordic equity fund award.Our corporate and investment banking franchise has shown a strong performance, leveraging its full service offering in the DKK 68bn public takeover offer for TDC, as well as the SEK 98bn merger of Tele2/Com Hem and furthermore in the three largest 2018 European IPOs to date. This is a testament to our increasing client centricity and confirmed our No 1 pan-Nordic service offering.Delivering on our Group TransformationOn 15 March 2018, Nordea’s shareholders approved the re-domiciliation of the parent company from Sweden to Finland with a large majority of 95.8% of the votes.Our investment in strengthening compliance is delivering stronger control of financial crime risks, with the introduction of more rigorous standards, KYC quality assurance processes and sanctions screening capability. It also ensured we were well prepared for the implementation of the complex MIFID II legislation this past quarter. Overall, Nordea is significantly and systematically reducing its compliance risks: we anticipate that 2018 will see our most critical financial crime priorities achieved and related pending regulatory investigations resolved.Since late February, new savings and term deposit accounts for Finnish household customers are being opened on the new core banking platform. The majority of the accounts are being opened online via Netbank and soon our customers will also have the ability to open these via the Nordea mobile app. Additionally, we have started the roll-out of a completely new mobile banking app with Finland as the first country. The roll-out is gradual and will proceed during April and May. Currently, the new app is available for 40% of Android customers in Google Pay and has been downloaded by more than 60,000 customers. The rollout will proceed during coming weeks and the app will be made available in App Store. Earlier this month, we migrated just under 250,000 existing savings accounts belonging to household customers onto the new core banking platform and the remaining accounts will be migrated in the coming weeks. In February, we also progressed the roll-out of our new and simplified collateral management module in Norway and have migrated collateral worth NOK 30bn onto the platform. Collateral migrations in Norway will continue throughout 2018. We are more compliant with all euro payments (SEPA Credit Transfer Interbank payments) which are now running on one Global Payment Engine. We have also reduced complexity by closing close to 190 applications linked to our data warehouse simplification stream. Local data warehouses in Norway have now been closed. 2016 and 2017 were characterised by significant investments to improve our compliance and risk operations as well as a de-risking of the bank. These activities have had a meaningful impact on both revenues and costs. In the first quarter of 2018 we delivered on our cost reductions, our credit quality is the strongest since 2007 and our capital ratios have never been higher. We are confident that net profit will grow in 2018 compared to 2017, as previously stated. As the underlying revenues in the first quarter were softer than expected it is more challenging to reach our full-year revenue guidance. We will therefore have an increased focus on improving the business momentum, while at the same time maintaining our risk and compliance discipline. We reiterate our cost target for 2018 of EUR 4.9bn.
Casper von KoskullPresident and Group CEO

Nordea First Quarter 2018
3
Q1
Income statementQ1 Q4 Local Q1 Local
2018 2017 Chg % curr. % 2017 Chg % curr. %EURmNet interest income 1,053 1,109 -5 -5 1,197 -12 -9Net fee and commission income 770 839 -8 -8 866 -11 -9Net result from items at fair value 441 235 88 90 375 18 17Profit from associated undertakings and jointventures accounted for under the equity method 28 16 75 75 4 600 600Other operating income 23 29 -21 -21 19 21 28Total operating income 2,315 2,228 4 4 2,461 -6 -4
Staff costs -798 -861 -7 -7 -799 0 2Other expenses -336 -425 -21 -20 -387 -13 -11Depreciation, amortisation and impairmentcharges of tangible and intangible assets -71 -75 -5 -5 -60 18 20Total operating expenses -1,205 -1,361 -11 -11 -1,246 -3 -1
Profit before loan losses 1,110 867 28 28 1,215 -9 -7
Net loan losses -40 -71 -44 -43 -113 -65 -63Operating profit 1,070 796 34 35 1,102 -3 -1
Income tax expense -250 -167 50 58 -258 -3 0Net profit for the period 820 629 30 29 844 -3 -1
Business volumes, key items131 Mar 31 Dec Local 31 Mar Local
2018 2017 Chg % curr. % 2017 Chg % curr. %EURbn
Loans to the public 310.9 310.2 0 1 320.1 -3 1Loans to the public, excl. repos 287.5 293.9 -2 -1 299.2 -4 0Deposits and borrowings from the public 174.0 172.4 1 2 190.9 -9 -5Deposits from the public, excl. repos 161.0 165.4 -3 -1 178.1 -10 -6Total assets 580.2 581.6 0 0 650.3 -11 -9Assets under management 320.1 330.4 -3 330.1 -3Equity 31.1 33.3 -7 31.1 0
Ratios and key figures2Q1 Q4 Q1
2018 2017 Chg % 2017 Chg %Diluted earnings per share, EUR 0.20 0.15 33 0.21 -5EPS, rolling 12 months up to period end, EUR 0.74 0.75 -1 0.95 -22Share price1, EUR 8.66 10.09 -14 10.73 -19Total shareholders' return, % -3.9 -5.0 -22 6.7 -158Equity per share1, EUR 7.65 8.21 -7 7.65 0Potential shares outstanding1, million 4,050 4,050 0 4,050 0Weighted average number of diluted shares, mn 4,038 4,039 0 4,039 0Return on equity, % 10.0 7.7 30 10.3 -3Cost/income ratio, % 52 61 -15 51 2ROCAR3, % 12.3 9.2 34 12.6 -2Loan loss ratio, basis points4 7 9 -22 14 -50Common Equity Tier 1 capital ratio, excl. Basel I floor1,5, % 19.8 19.5 2 18.8 5Tier 1 capital ratio, excl. Basel I floor1,5, % 22.2 22.3 0 21.0 6Total capital ratio, excl. Basel I floor1,5, % 25.2 25.2 0 24.3 3Tier 1 capital1,5, EURbn 27.3 28.0 -3 28.1 -3Risk exposure amount excl. Basel I floor5, EURbn 123 126 -2 134 -8Number of employees (FTEs)1 30,082 30,399 -1 31,640 -5Economic capital1, EURbn 26.2 26.7 -2 28.9 -91 End of period.2 For more detailed information regarding ratios and key figures defined as Alternative performance measures, see www.nordea.com/en/investor-relations/.3 ROCAR Q1 2017 restated due to changed definition of average Economic Capital.4 Including Loans to the public reported in Assets held for sale in Q1.5 Including the result for the period.

Nordea First Quarter 2018
4
Q1
Table of contentsMacroeconomy and financial markets ..........................................................................................5
Group results and performance
First quarter 2018.................................................................................................................................................. 6
Net interest income............................................................................................................................6
Net fee and commission income......................................................................................................7
Net result from items at fair value....................................................................................................8
Total operating income .....................................................................................................................8
Total expenses...................................................................................................................................9
Net loan losses and credit portfolio...............................................................................................10
Profit.................................................................................................................................................. 11
First quarter 2018 compared to first quarter 2017 ...........................................................................................11
Other information................................................................................................................................................ 12
Capital position and risk exposure amount (REA) .......................................................................12
Regulatory developments ...............................................................................................................12
Balance sheet...................................................................................................................................13
Nordea’s funding and liquidity operations....................................................................................13
Market risk ........................................................................................................................................13
Update on Nordea to re-domicile to Banking union .....................................................................14
Update on sale of Nordea Liv & Pension Denmark ......................................................................14
Update on sale of collection portfolio in Denmark .......................................................................14
Sale of International Private Banking in Luxembourg .................................................................14
IFRS 9: Final quantitative impact ...................................................................................................14
Divestment of shares in UC AB ......................................................................................................14
Quarterly development, Group ..........................................................................................................................15
Financial statements
Nordea Group...................................................................................................................................................... 16
Nordea Bank AB (publ).......................................................................................................................................25

Nordea First Quarter 2018
5
Q1
Macroeconomy and financial markets The first quarter of 2018 started calmly and with a strong performance in equities, but volatility picked up sharply entering February, as developed market equities dropped on the back of higher US wage data and their implications for a tighter future monetary policy stance by the US Federal Reserve. Equity markets decreased further as the US announced they would impose trade tariffs, after which China responded with similar retaliatory measures, escalating fears of a global trade war. Geopolitical tensions on the Korean peninsula abated after North Korea opened up for talks with the US on denuclearisation, which the US accepted. The US Federal Reserve held its first meeting with new chairman Jerome Powell in March and hiked interest rates by 0.25% point in accordance with market expectations. US inflation rose to 1.6% in February, up from 1.5% in January. The 10-year US government bond yield increased from 2.41% to 2.79% over the quarter, while the US S&P 500 equity index eventually ended the quarter 1.22% lower, 8% below its intra-quarter highs. In Europe, the ECB left interest rates unchanged at the March meeting in accordance with market expectations. On 4 March, the Italian election resulted in a hung parliament and negotiations continued over the quarter’s end. Markets interpreted the results as positive as none of the populist parties gained an outright majority. The Italian 10-year government bond yield tightened against the German 10-year government bond yield by 33 bps over the quarter. The Italian FTSE MIB equity index, consisting of the 40 most liquid and highly capitalised stocks listed on the Italian stock exchange, ended the quarter 1.45% lower. In Germany, a grand coalition was formed, which allowed Angela Merkel to continue as chancellor. On the data front Euro-zone inflation came in at 1.4% (y/y) in March, up from 1.1% (y/y) in February. The Eurostoxx 50 index declined 4.1% (q/q) and the German 10-year government bond yield decreased by 3 bps over the quarter to 0.49%. The EUR continued its strengthening trend against the USD, increasing from 1.201 to 1.230 over the quarter. In China, it was decided at the annual National People’s Congress to cast aside presidential term limits from the constitution, effectively allowing President Xi Jinping to remain in office indefinitely. The MSCI Emerging Market Equities Index ended the quarter 0.93% higher. Brent crude oil rose 5.4% to USD 69.3/bbl.
DenmarkDanish GDP grew by 2.2% (y/y) in 2017. This was the highest annual growth rate since 2006. Employment continued to increase as a result of the healthy expansion in the Danish economy. However, average hourly earnings in the private sector increased by just below 2% (y/y) and inflation remained low. In 2017, prices for single-family houses increased by 3.9%, while owner-occupied flats were 5.9% higher. Residential investment increased by 6.2%. Leading indicators gave mixed signals on growth in Q1 2018. Exports have been falling which probably can be partly related to an appreciation of the trade-weighted DKK of around 5% since 2015. On the other hand, manufacturing production has been higher, and both consumer and business confidence indicators point to solid domestic demand. The Danish central bank maintained its -0.65% deposit rate in Q1 2018 and did not intervene in the foreign exchange market. Danish equities fell by 2.7% during the quarter while the 10-year swap rate increased by 8 bps to 1.14%.
FinlandThe Finnish economy expanded by 2.7% (y/y) in 2017. Indicators pointed towards strong growth in the first quarter of 2018 as well. Demand among the main trading partners remained robust and the strong export growth continued. Domestic demand remained strong, mainly due to high consumer confidence, improving employment and low inflation. Growth in construction and machinery investment looked set to slow in Q1, from high levels. There was no sign of the economic expansion spilling over into price pressures during the quarter, as core inflation remained clearly below 1% (y/y). Finnish equity markets gained 1.3% despite the equity market turbulence. The Finnish 10-year government bond yield ended 3 bps lower at 0.60%.
NorwayThe Norwegian economy continued to expand at a healthy pace in the fourth quarter of 2017. Growth continued on its trend through 2017 of 0.6-0.7% (q/q) and forward-looking indicators pointed towards a slight uptick in H1 2018. Employment growth picked up, which supported private consumption. Oil investments rose again and the still weak NOK meant that mainland export industries could take advantage of the synchronised global upswing. Unemployment continued to decrease throughout the country. Recent data also showed that the correction down in house prices was over. Norges Bank kept its key policy rate unchanged at 0.5% at its March meeting as widely anticipated, but the forecast for the first rate hike was moved forward from December to September this year. A lowering of the inflation target from 2.5% to 2 % contributed to this, as did a better outlook and higher forward rates abroad. The 2-year swap rate increased by 37 bps to 1.50% in Q1, while the 10-year swap rate increased by 30 bps to 2.24%. The NOK was 2.4% stronger in trade-weighted terms in Q1 and equities were down by 1%.
SwedenThe Swedish economy showed good growth in the fourth quarter of 2017 with GDP growing by 0.9% (q/q) and 3.3% (y/y). It was mainly net exports that contributed to growth, by 0.6% point (q/q), while private consumption added 0.3% point to GDP. On the other hand, investments in fixed capital fell by 1.3% (q/q), shaving off 0.3% point from GDP. Housing investments slowed markedly in the fourth quarter on the back of negative housing market developments. Indicators for GDP growth for the first quarter were mixed. Employment remained on the strong trend, rising 0.3% (q/q) in the fourth quarter, and the upturn has continued in the beginning of 2018, while unemployment has dropped. Higher energy prices have boosted CPIF inflation, which has been hovering around the 2% target in the first quarter. However, excluding energy the inflation trend remains modest. The Riksbank left the repo rate unchanged at -0.5% at the February meeting, but lowered its inflation forecast for the coming year. It did not change the repo rate path but changed the wording in the press release, postponing the first rate hike to the second half of 2018 from previously mid-2018. The trade-weighted SEK weakened by 4% and Swedish equities were down by 2.6% in the first quarter. The 10-year government bond yield declined to 0.67%, 10 bps lower compared to the previous quarter.

Nordea First Quarter 2018
6
Q1
Group results and performanceFirst quarter 2018 Net interest incomeNet interest income in local currencies decreased 5% from the previous quarter mainly due to higher deposit guarantee fees, a lower day count and lower mortgage margins. Lending margins decreased in Personal Banking and Commercial & Business Banking while deposit margins were up following market interest rate changes.
Net interest income for Personal Banking was down 4% in local currencies from the previous quarter, driven by higher deposit guarantee fees, decreased margins and fewer interest days.
Net interest income for Commercial & Business Banking was up 4% in local currencies from the previous quarter driven by a changed model for Fund Transfer Pricing between the business area and Treasury and slightly higher margins in Sweden.
Net interest income in Wholesale Banking was up 16% in local currencies from the previous quarter due to a changed model for Fund Transfer Pricing between the business area and Treasury and higher yield fees following IFRS 15.
Net interest income in Wealth Management was down 22% in the quarter from the previous quarter driven by lower lending volumes.
Net interest income in Group Functions and Other was EUR 55m compared to EUR 115m from the previous quarter due to a change in Fund Transfer Pricing model, slightly higher funding costs, as well as higher deposit guarantee and resolution fees.
Lending volumesLoans to the public in local currencies, excluding repos, were down 2% from the previous quarter. Average lending volumes in local currencies were largely unchanged in Personal Banking as lower volumes in Sweden were offset by higher volumes in Norway and Finland. Volumes were slightly up in Commercial & Business Banking and down in Wholesale Banking and Wealth Management.
Deposit volumesTotal deposits from the public in local currencies, excluding repos, decreased by 1% from the previous quarter driven by lower volumes in Wholesale Banking. Average deposit volumes were down in all business areas with the exception of Commercial & Business Banking where deposit volumes were slightly up.
Net interest income per business area Local currency
Q118 Q417 Q317 Q217 Q117 Q1/Q4 Q1/Q1 Q1/Q4 Q1/Q1EURmPersonal Banking 498 525 537 520 527 -5% -6% -4% -2%Commercial & Business Banking 292 282 285 287 282 4% 4% 4% 6%Wholesale Banking 190 164 185 190 200 16% -5% 16% 1%Wealth Management 18 23 24 25 25 -22% -28% -22% -29%Group Functions and other 55 115 154 153 163 - - - -Total Group 1,053 1,109 1,185 1,175 1,197 -5% -12% -5% -9%
Change in Net interest income
Q1/Q4Jan-Mar
18/17EURmNII beginning of period 1,109 1,197Margin driven NII 0 -25 Lending margin -8 -27 Deposit margin 8 2Volume driven NII -4 -13 Lending volume -3 -11 Deposit volume -1 -2Day count -28 0Other1,2 -24 -106NII end of period 1,053 1,0531 of which FX -3 -402 of which Baltics - -28

Nordea First Quarter 2018
7
Q1
Net fee and commission income Net fee and commission income decreased by 8% in local currencies from the previous quarter driven by lower asset management income due to performance fees in Q4, the transfer of yield fees to net interest income, lower volumes in assets under management and lower activity in Equity Capital Markets and advisory.
Savings and investment commissionsNet fee and commission income from savings and investments decreased by 11% in local currencies from the previous quarter to EUR 485m. AuM decreased to EUR 320.1bn at the end of the quarter.
Net flow was negative and amounted to EUR -3.6bn compared to EUR -1.0bn in the previous quarter. AuM in Q1 was impacted by negative stock markets, the transfer of customers to Personal Banking and seasonality.
Payments and cards and lending-related commissionsLending-related net fee and commission income decreased 12% in local currencies from the previous quarter to EUR 129m in line with lending developments but also impacted by IFRS 15. Payments and cards net fee and commission income was up 5% in local currencies to EUR 130m from the previous quarter driven by higher customer activity in cash management.
Net fee and commission income per business area Local currency
Q118 Q417 Q317 Q217 Q117 Q1/Q4 Q1/Q1 Q1/Q4 Q1/Q1EURmPersonal Banking 172 160 177 182 187 8% -8% 7% -7%Commercial & Business Banking 116 125 110 127 113 -7% 3% -7% 5%Wholesale Banking 121 132 140 133 167 -8% -28% -8% -25%Wealth Management 371 427 389 409 402 -13% -8% -13% -8%Group Functions and other -10 -5 -2 -1 -3 - - - -Total Group 770 839 814 850 866 -8% -11% -8% -9%
Net fee and commission income per category Local currency
Q118 Q417 Q317 Q217 Q117 Q1/Q4 Q1/Q1 Q1/Q4 Q1/Q1EURmSavings and investments, net 485 547 524 539 556 -11% -13% -11% -12%Payments and cards, net 130 124 137 148 126 5% 3% 5% 6%Lending-related, net 129 147 149 151 161 -12% -20% -12% -17%Other commissions, net 26 21 4 12 23 - - - -Total Group 770 839 814 850 866 -8% -11% -8% -9%
Assets under Management (AuM), volumes and net inflowNet
inflowQ118 Q417 Q317 Q217 Q117 Q118
EURbnNordic Retail funds 58.6 61.5 61.2 60.6 60.7 -0.3Private Banking 96.1 98.9 101.8 102.9 101.6 -1.3Institutional sales 92.5 96.2 94.6 94.4 93.8 -2.0Life & Pensions 72.9 73.8 73.3 74.2 74.0 0Total 320.1 330.4 330.9 332.1 330.1 -3.6

Nordea First Quarter 2018
8
Q1
Net result from items at fair value The net result from items at fair value increased by 88% from the previous quarter to EUR 441m and increased 18% from the same quarter in 2017. A change of the margin reset frequency assumption in the fair value model covering a loan portfolio in Denmark had a positive impact of EUR 135m in the quarter. Other fair value adjustment had a zero impact (negative impact of EUR 41m in Q4 2017).
Capital Markets income for customers in Wholesale Banking, Personal Banking, Commercial & Business Banking and Private BankingCustomer-driven capital markets activities in the customer business were 63% higher than in the previous quarter. The net fair value result for the business units increased to EUR 292m, from EUR 179m in the previous quarter. The underlying business level in Q1 was negatively affected by new regulation (MiFID II) and lower customer activity.
Life & PensionsThe net result from items at fair value for Life & Pensions decreased EUR 13m from the previous quarter to EUR 49m.
Wholesale Banking otherThe net fair value result for Wholesale Banking other, i.e. income from managing the risks inherent in customer transactions, increased to EUR 92m from EUR -16m in the previous quarter.
Group Functions and OtherThe net fair value result in Group Functions and Other decreased to EUR 8m (from EUR 10m in the previous quarter).
Net result from items at fair value per area
Q118 Q417 Q317 Q217 Q117 Q1/Q4 Q1/Q1EURmPersonal Banking 91 15 15 17 15Commercial & Business Banking 120 58 62 74 67 79%Wholesale Banking customer units 69 99 70 51 100 -30% -31%Wealth Mgmt. excl. Life 12 7 6 10 21 71% -43%Wholesale Banking excl. Customer units 92 -16 103 127 91 1%Life & Pensions 49 62 51 57 59 -21% -17%Group Functions and other 8 10 50 25 22 - -Total Group 441 235 357 361 375 88% 18%
Equity method Income from companies accounted for under the equity method was EUR 28m, up from EUR 16m in the previous quarter with VISA amounting to EUR 4m (EUR 7m in Q4 2017) and Luminor contributing EUR 18m (EUR 2m in Q4 2017).
Other operating incomeOther operating income was EUR 23m, down from EUR 29m in the previous quarter.
Total operating incomeTotal income increased by 4% in local currencies from the previous quarter to EUR 2,315m.
Total operating income per business area
Local currencyQ118 Q417 Q317 Q217 Q117 Q1/Q4 Q1/Q1 Q1/Q4 Q1/Q1
EURmPersonal Banking 769 699 729 725 730 10% 5% 11% 8%Commercial & Business Banking 536 474 464 496 483 13% 11% 14% 14%Wholesale Banking 472 379 498 501 562 25% -16% 25% -14%Wealth Management 454 525 476 507 512 -14% -11% -14% -11%Group Functions and other 84 151 206 178 174 - - - -Total Group 2,315 2,228 2,373 2,407 2,461 4% -6% 4% -4%

Nordea First Quarter 2018
9
Q1
Total expenses Total expenses in the first quarter amounted to EUR 1,205m, down 11% from the previous quarter and down 1% from the first quarter of 2017 in local currencies. The first quarter included transformation costs of EUR 18m (EUR 146m in Q4 2017). Excluding these costs, the decrease from the previous quarter was 2% mostly due to periodisation.
Staff costs were down 7% in local currencies from the previous quarter and up 2% from the same period in 2017 in local currencies. The first quarter included transformation costs of EUR 18m compared to EUR 134m in Q4 2017.
Other expenses were down 20% in local currencies from the previous quarter, mainly driven by cost savings initiatives. No transformation costs were booked in the first quarter compared to EUR 11m in Q4 2017.
Depreciations was down 5% in local currencies from the previous quarter and up 20% from the same quarter of 2017.No transformation costs were booked in the first quarter compared to EUR 1m in Q4 2017.
The number of employees (FTEs) at the end of the first quarter was 30,082, which is a decrease of 1% or 317 from the previous quarter and down 5% from the same quarter of 2017. The decrease versus Q4 2017 stems from Personal Banking, Commercial & Business Banking and Wholesale Banking, which is offset by Group Corporate Centre and Wealth Management. The large decrease versus Q1 2017 stems from FTEs transferred to Luminor.
Expenses related to Group projects, Compliance and Risk that affected the P&L were EUR 118m, compared to EUR 143m in the previous quarter. In addition, EUR 62m was capitalised from Group projects compared to EUR 72m in the previous quarter.
Provisions for performance-related salaries in the firstquarter were EUR 53m, compared to EUR 62m in theprevious quarter.
The cost/income ratio was down to 52% in the first quarter, compared to the previous quarter (61%) but up compared to the first quarter of 2017 (51%).
Total operating expenses
Local currencyQ118 Q417 Q317 Q217 Q117 Q1/Q4 Q1/Q1 Q1/Q4 Q1/Q1
EURmStaff costs -798 -861 -757 -795 -799 -7% 0% -7% 2%Other expenses -336 -425 -377 -433 -387 -21% -13% -20% -11%Depreciations -71 -75 -70 -63 -60 -5% 18% -5% 20%Total Group -1,205 -1,361 -1,204 -1,291 -1,246 -11% -3% -11% -1%
Total operating expenses per business area Local currency
Q118 Q417 Q317 Q217 Q117 Q1/Q4 Q1/Q1 Q1/Q4 Q1/Q1EURmPersonal Banking -429 -450 -409 -435 -426 -5% 1% -4% 3%Commercial & Business Banking -286 -340 -284 -290 -289 -16% -1% -15% 2%Wholesale Banking -233 -247 -222 -228 -236 -6% -1% -6% 3%Wealth Management -213 -222 -207 -234 -216 -4% -1% -4% -3%Group Functions and other -44 -102 -82 -104 -79 - - - -Total Group -1,205 -1,361 -1,204 -1,291 -1,246 -11% -3% -11% -1%
Currency fluctuation effects
Q1/Q4 Q1/Q1Jan-Mar
18/17%-pointsIncome 0 -2 -2Expenses 0 -3 -3Operating profit 0 -2 -2Loan and deposit volumes -1 -3 -3
Nordea First Quarter 2018
10
Q1
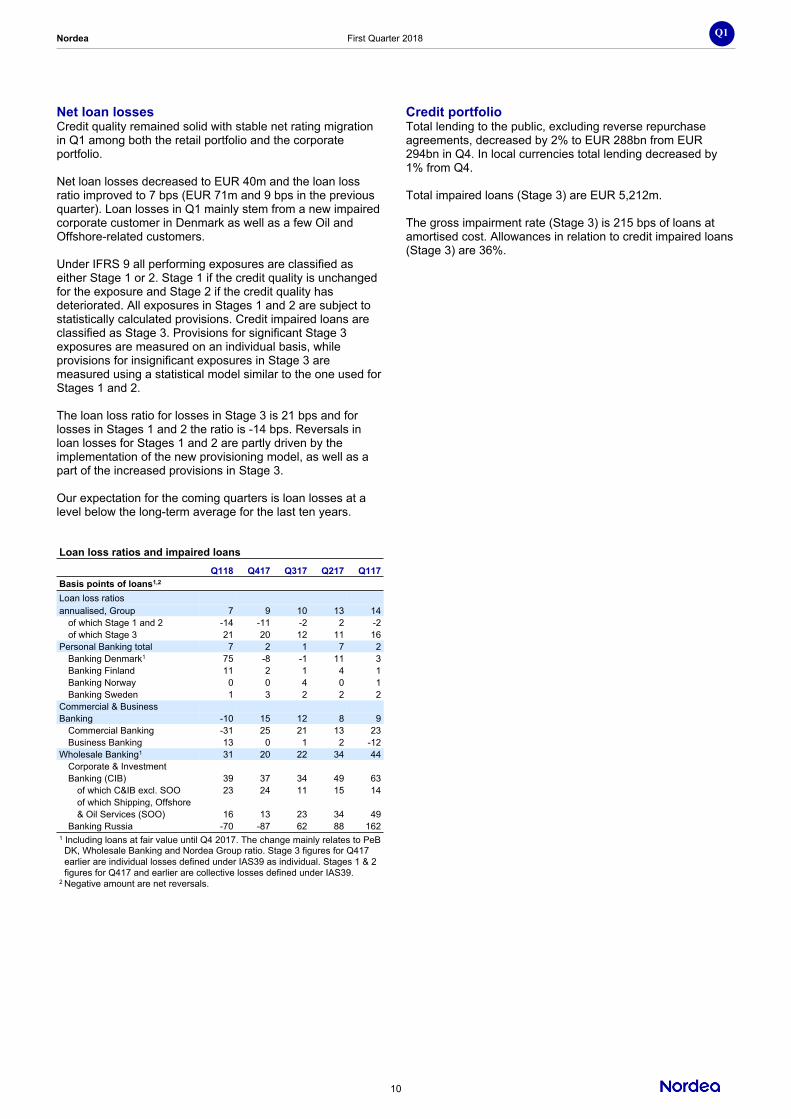
Net loan losses Credit quality remained solid with stable net rating migration in Q1 among both the retail portfolio and the corporate portfolio.
Net loan losses decreased to EUR 40m and the loan loss ratio improved to 7 bps (EUR 71m and 9 bps in the previous quarter). Loan losses in Q1 mainly stem from a new impaired corporate customer in Denmark as well as a few Oil and Offshore-related customers.
Under IFRS 9 all performing exposures are classified as either Stage 1 or 2. Stage 1 if the credit quality is unchanged for the exposure and Stage 2 if the credit quality has deteriorated. All exposures in Stages 1 and 2 are subject to statistically calculated provisions. Credit impaired loans are classified as Stage 3. Provisions for significant Stage 3 exposures are measured on an individual basis, while provisions for insignificant exposures in Stage 3 are measured using a statistical model similar to the one used for Stages 1 and 2.
The loan loss ratio for losses in Stage 3 is 21 bps and for losses in Stages 1 and 2 the ratio is -14 bps. Reversals in loan losses for Stages 1 and 2 are partly driven by the implementation of the new provisioning model, as well as a part of the increased provisions in Stage 3.
Our expectation for the coming quarters is loan losses at a level below the long-term average for the last ten years.
Credit portfolioTotal lending to the public, excluding reverse repurchase agreements, decreased by 2% to EUR 288bn from EUR294bn in Q4. In local currencies total lending decreased by 1% from Q4.
Total impaired loans (Stage 3) are EUR 5,212m.
The gross impairment rate (Stage 3) is 215 bps of loans at amortised cost. Allowances in relation to credit impaired loans (Stage 3) are 36%.
Loan loss ratios and impaired loansQ118 Q417 Q317 Q217 Q117
Basis points of loans1,2
Loan loss ratiosannualised, Group 7 9 10 13 14
of which Stage 1 and 2 -14 -11 -2 2 -2of which Stage 3 21 20 12 11 16
Personal Banking total 7 2 1 7 2Banking Denmark1 75 -8 -1 11 3Banking Finland 11 2 1 4 1Banking Norway 0 0 4 0 1Banking Sweden 1 3 2 2 2
Commercial & BusinessBanking -10 15 12 8 9
Commercial Banking -31 25 21 13 23Business Banking 13 0 1 2 -12
Wholesale Banking1 31 20 22 34 44Corporate & InvestmentBanking (CIB) 39 37 34 49 63
of which C&IB excl. SOO 23 24 11 15 14of which Shipping, Offshore& Oil Services (SOO) 16 13 23 34 49
Banking Russia -70 -87 62 88 1621 Including loans at fair value until Q4 2017. The change mainly relates to PeB DK, Wholesale Banking and Nordea Group ratio. Stage 3 figures for Q417 and earlier are individual losses defined under IAS39 as individual. Stages 1 & 2 figures for Q417 and earlier are collective losses defined under IAS39.2 Negative amount are net reversals.

Nordea First Quarter 2018
11
Q1
ProfitOperating profitOperating profit increased to EUR 1,070m, up 35% in local currencies compared to the previous quarter, and down 1% compared to the same quarter of 2017.
TaxesIncome tax expense was EUR 250m compared to EUR 167m in the previous quarter. The effective tax rate was 23.2%, compared to 20.8% in the previous quarter and 23.5% in the first quarter last year.
Net profitNet profit increased 29% in local currencies from the previous quarter to EUR 820m. Return on equity was 10.0%, up from 7.7% in the previous quarter.
Diluted earnings per share were EUR 0.20 (EUR 0.15 in the previous quarter).
Operating profit per business area
Local currencyQ118 Q417 Q317 Q217 Q117 Q1/Q4 Q1/Q1 Q1/Q4 Q1/Q1
EURmPersonal Banking 321 240 315 266 297 34% 8% 35% 12%Commercial & Business Banking 267 105 155 189 177 - 51% - 53%Wholesale Banking 204 97 236 209 236 - -14% - -13%Wealth Management 241 303 269 273 296 -20% -19% -20% -19%Group Functions and other 37 51 115 73 96 - - - -Total Group 1,070 796 1,090 1,010 1,102 34% -3% 35% -1%
First quarter 2018 compared to first quarter 2017 Total income was down 4% in local currencies and 6% in EUR from the prior year and operating profit was down 1% in local currencies and 3% in EUR from the previous year.
IncomeNet interest income was down 9% in local currencies and 12% in EUR from 2017. Average lending volumes in business areas in local currencies were down by 4% compared to 2017 driven by lower volumes in Wholesale Banking and deposit volumes were down by 6% predominantly in Wholesale Banking.
Net fee and commission income decreased 9% in local currencies and 11% in EUR from the previous year.
Net result from items at fair value increased in local currencies by 17% and by 18% in EUR from 2017.
ExpensesTotal expenses were down 1% in local currencies and 3% in EUR from the previous year and amounted to EUR 1,205m.
Staff costs were up 2% in local currencies and unchanged in EUR.
Net loan lossesNet loan loss provisions decreased to EUR 40m, corresponding to a loan loss ratio of 7 bps (down from 14 bps in 2017).
Net profitNet profit decreased 1% in local currencies and 3% in EUR and amounted to EUR 820m.
Currency fluctuation impactCurrency fluctuations had a negative effect on income and operating profit of 2% points and a negative effect of 3% points on expenses and on loan and deposit volumes compared to a year ago.

Nordea First Quarter 2018
12
Q1
Other informationCapital position and risk exposure amount (REA) The Nordea Group’s Basel III Common Equity Tier 1 (CET1) capital ratio increased to 19.8% at the end of the first quarter 2018 compared to 19.5% at the end of the fourth quarter 2017. Risk exposure amount, REA, decreased by EUR 3.1bn. The decrease was mainly driven by improved credit quality in the IRB credit risk portfolio as well as effects due to FX movements. CET1 capital decreased EUR 0.2bn mainly due to FX effects. In total, the FX movements had a positive effect on the CET1 ratio.
The tier 1 capital ratio remained flat at 22.3% compared to the previous quarter and the total capital ratio remained flat at 25.2% compared to the previous quarter.
At the end of the first quarter 2018, the CET1 capital was EUR 24.3bn, the tier 1 capital was EUR 27.3bn and the own funds were EUR 30.9bn.
The CRR leverage ratio decreased to 5.1%, compared to 5.2% in the previous quarter.
Economic Capital (EC) was EUR 26.2bn at the end of the first quarter, a decrease by EUR 0.5bn compared to the fourth quarter last year. Decreases in the Nordea Life & Pension component, IRB shortfall and credit risk REA were somewhat offset by increases following the annual update of the framework.
The Group’s Internal Capital Requirement (ICR) was at the end of the first quarter EUR 13.0bn. The decrease is mainly driven by a reduction of credit risk and updated stress test figures for 2018. The ICR should be compared to own funds, which were EUR 30.9bn. The ICR is calculated based on a Pillar I plus Pillar II approach. For more detailed information about the ICR methodology see the Capital and Risk Management Report.
Capital ratiosQ118 Q417 Q317 Q217 Q117
%CRR/CRDIVCET 1 cap. ratio 19.8 19.5 19.2 19.2 18.8Tier 1 capital ratio 22.3 22.3 21.4 21.4 21.0Total capital ratio 25.2 25.2 24.5 24.6 24.3
Regulatory developmentsThe Swedish FSA, on 31 January, issued a consultation paper on an amendment to its Pillar 2 method for the interest rate risk in the banking book. The amendment is, according to the Swedish FSA, a minor adjustment which removes own credit spreads from the calculation. The consultation period ended on 28 February.
On 28 March, the Swedish FSA published a consultation paper to change the method it currently uses to apply the current risk weight floor for Swedish mortgages through Pillar 2 by replacing it with a requirement in Pillar 1 within the framework of Article 458 of the CRR. The change is proposed to enter into force on 31 December 2018. The consultation period runs until 30 April 2018.
Risk exposure amount, REA (EURbn), quarterly
Common equity tier 1 (CET 1) capital ratio, changes in the quarter

Nordea First Quarter 2018
13
Q1
Balance sheet Total assets in the balance sheet were unchanged and amounted to EUR 580bn in the quarter. Both loans to credit institutions and the asset values of derivatives were EUR 8bn and EUR 4bn, respectively, lower than in the previous period.
Loans to the public were unchanged in the quarter and amounted to EUR 311bn compared to EUR 310bn in the previous quarter.
Other assets decreased by EUR 5bn from the previous quarter.
Balance sheet data
Q118 Q417 Q317 Q217 Q117EURbnLoans to credit institutions 17 9 14 21 19Loans to the public 311 310 314 315 320Derivatives 42 46 49 53 56Interest-bearing securities 73 75 88 91 93Other assets 137 142 150 163 162Total assets 580 582 615 643 650
Deposits from credit inst. 50 40 54 70 70Deposits from the public 174 172 182 190 191Debt securities in issue 175 179 183 185 188Derivatives 38 43 45 53 56Other liabilities 112 114 118 114 113Total equity 31 33 32 31 31Total liabilities and equity 580 582 615 643 650
Nordea’s funding and liquidity operationsNordea issued approximately EUR 7bn in long-term funding in the first quarter (excluding Danish covered bonds and subordinated notes), of which approximately EUR 5bn was issued in covered bonds and approximately EUR 2bn was issued in senior unsecured bonds. Public benchmark transactions during the quarter included a 4-year EUR 1bn floating rate senior unsecured bond issued by Nordea Bank AB, a EUR 2bn dual tranche (5-year and 15-year tenor) fixed rate covered bond issued by Nordea Mortgage Bank and a 5.25-year NOK 5bn floating rate covered bond issued by Nordea Eiendomskreditt.
Nordea’s long-term funding portion of total funding was approximately 83% at the end of the first quarter.
The issuance of Senior Non-Preferred (SNP) debt is likely to commence during 2018. Should Nordea wish to start issuing SNP before the EU’s Credit Hierarchy Directive is implemented either in Sweden or Finland, Nordea could use a contractual SNP solution that would ensure alignment with the local framework once implemented.
Short-term liquidity risk is measured using several metrics and the Liquidity Coverage Ratio (LCR) is one such metric. The LCR for the Nordea Group was, according to the CRR LCR definition, 174% at the end of the first quarter. The LCR in EUR was 192% and in USD 180% at the end of the first quarter. The liquidity buffer is composed of highly liquid central bank eligible securities and cash with characteristics similar to CRD IV high quality liquid assets and amounted to EUR 91bn at the end of the first quarter (EUR 99bn at the end of the fourth quarter).
The long-term liquidity risk is measured as Net StableFunding Ratio (NSFR). At the end of the first quarter 2018,Nordea’s NSFR was 103.5%. Funding and liquidity data
Q118 Q417 Q317 Q217 Q117Long-term funding portion 83% 81% 81% 80% 81%LCR total 174% 147% 143% 141% 142%LCR EUR 192% 257% 187% 203% 185%LCR USD 180% 170% 161% 165% 150%
Market risk Total market risk, measured as Value at Risk, in the trading book was EUR 13m, an increase from the previous quarter (EUR 11m).
Trading bookQ118 Q417 Q317 Q217 Q117
EURmTotal risk, VaR 13 11 13 10 9Interest rate risk, VaR 13 10 10 12 9Equity risk, VaR 1 3 2 4 3Foreign exchange risk, VaR 2 5 9 2 5Credit spread risk, VaR 4 4 5 5 7Diversification effect 39% 50% 48% 59% 62%
Total market risk, measured as Value at Risk, in the banking book decreased to EUR 37m (EUR 45m in the previous quarter) due mainly to a reduction in asset swap spread risk in the liquid asset buffer.
Banking bookQ118 Q417 Q317 Q217 Q117
EURmTotal risk, VaR 37 46 47 52 63Interest rate risk, VaR 38 47 48 53 63Equity risk, VaR 5 3 4 4 2Foreign exchange risk, VaR 3 3 2 2 2Credit spread risk, VaR 1 1 1 1 1Diversification effect 20% 15% 14% 14% 7%
Nordea share and ratingsNordea’s share price as at the end of Q1 2018 and ratings as at the end of Q1 2018.
Nasdaq STO (SEK)
Nasdaq COP (DKK)
Nasdaq HEL (EUR)
12/30/2016 101.30 78.65 10.603/31/2017 102.30 79.90 10.726/30/2017 107.20 83.15 11.149/30/2017 110.40 85.15 11.44
12/31/2017 99.30 75.20 10.13/31/2018 89.10 63.12 8.61
Moody's Standard&Poor's FitchShort Long Short Long Short LongP-1 Aa3 A-1+ AA- F1+ AA-

Nordea First Quarter 2018
14
Q1
Update on Nordea to re-domicile to Banking union On 6 September 2017, the Board of Directors of Nordea Bank AB (publ) initiated a process to re-domicile the parent company from Sweden to Finland. The Board of Directors of each of Nordea Bank AB (publ) and the newly established and wholly-owned Finnish company Nordea Holding Abp on 25 October 2017 signed a joint cross-border merger plan that was presented to the shareholders on 15 March 2018 at the AGM 2018 for their approval. The AGM 2018 voted in favour of the merger proposal with 95.8% of the votes.
The execution of the merger is further conditional upon e.g. receiving the requisite regulatory approvals. The merger, and consequently the re-domiciliation, is planned to be effected during the second half of 2018, tentatively on 1 October 2018. The merger plan and a prospectus can be found on www.nordea.com.
Update on sale of Nordea Liv & Pension Denmark In Q4 2017, Nordea announced that Foreningen Norliv will purchase an additional 45% of the share capital in Danish Nordea Liv & Pension, livforsikringsselskab A/S conditional on approval by the Danish FSA and the antitrust authorities. The transaction was closed on 16 April 2018 and will generate a post-tax capital gain of EUR 142m to be recognised in Q2 2018. The remaining holding in the associated company (30%) will be remeasured to fair value and will lead to an additional post-tax gain of EUR 108m for the Nordea Group to be recognised in Q2 2018.
Update on sale of collection portfolio in DenmarkIn Q4 2017 Nordea signed an agreement to divest a portfolio of non-performing loans in Denmark. The portfolio consists of around 40,000 claims, the principal value amounts to approximately EUR 500m and the transaction is expected to generate a capital gain of roughly EUR 40-50m. Should the loans not fulfil contractual terms, buyers will be compensated. The financial effects are expected to be accounted for in the income statement in 2018 as the loan documentation is transferred to the buyers. EUR 9m was recognised in “Net result from items at fair value” in Q1 2018.
Sale of International Private Banking in LuxembourgNordea has communicated the sale of certain assets and liabilities and the transfer of certain employees of its International Private Banking arm in Luxembourg to UBS. In the Q1 2018 report, assets and liabilities in scope are reclassified to “Assets/Liabilities held for sale”. The closing is scheduled for H2 2018.
IFRS 9: Final quantitative impactFrom 1 January 2018, IFRS 9 “Financial instruments” covering classification and measurement, impairment and general hedge accounting is effective. The impact on the Common Equity Tier 1 capital ratio, after adjustment of the shortfall deduction and before transition rules, was insignificant. (More details in Note 1 on page 20.)
Divestment of shares in UC ABThe Finnish credit information company Asiakastieto Group Plc (“Asiakastieto”) listed on NASDAQ Helsinki has entered into an agreement with all owners of UC AB (“UC”), including Nordea, to acquire UC at a price amounting to approximately EUR 340m. Nordea owns 26.1 % of the shares in UC and will receive 2,303,315 shares in Asiakastieto, equivalent to 9.6 % of the shares in the company after completion of the transaction, and approximately EUR 26m in cash. The transaction results in a capital gain amounting to approximately EUR 86m for Nordea, expected to be recognised in the result in Q2 2018, based on Asiakastieto’s share price as at 23 April 2018 of 27.30 euro. The transaction is conditional on a decision by an extraordinary general meeting of Asiakastieto to, among other things, mandate the board of directors to issue new shares (to be subscribed for by Nordea and the other sellers), relevant approval from competition authorities and certain other conditions.

Nordea First Quarter 2018
15
Q1
Quarterly development, GroupQ1 Q4 Q3 Q2 Q1
2018 2017 2017 2017 2017EURmNet interest income 1,053 1,109 1,185 1,175 1,197Net fee and commission income 770 839 814 850 866Net result from items at fair value 441 235 357 361 375Profit from associated undertakings and joint ventures accounted for under the equity method 28 16 3 0 4Other operating income 23 29 14 21 19Total operating income 2,315 2,228 2,373 2,407 2,461
General administrative expenses:Staff costs -798 -861 -757 -795 -799Other expenses -336 -425 -377 -433 -387
Depreciation, amortisation and impairment charges of tangible and intangible assets -71 -75 -70 -63 -60Total operating expenses -1,205 -1,361 -1,204 -1,291 -1,246
Profit before loan losses 1,110 867 1,169 1,116 1,215
Net loan losses -40 -71 -79 -106 -113Operating profit 1,070 796 1,090 1,010 1,102
Income tax expense -250 -167 -258 -267 -258Net profit for the period 820 629 832 743 844
Diluted earnings per share (DEPS), EUR 0.20 0.15 0.21 0.18 0.21DEPS, rolling 12 months up to period end, EUR 0.74 0.75 0.87 0.88 0.95

Nordea First Quarter 2018
16
Q1
Income statementQ1 Q1 Full year
2018 2017 2017EURm
Operating incomeInterest income 1,726 1,912 7,575Interest expense -673 -715 -2,909Net interest income 1,053 1,197 4,666Fee and commission income 980 1,082 4,232Fee and commission expense -210 -216 -863Net fee and commission income 770 866 3,369Net result from items at fair value 441 375 1,328Profit from associated undertakings and joint ventures accounted for under the equity method 28 4 23Other operating income 23 19 83Total operating income 2,315 2,461 9,469Operating expensesGeneral administrative expenses:
Staff costs -798 -799 -3,212Other expenses -336 -387 -1,622
Depreciation, amortisation and impairment charges of tangible and intangible assets -71 -60 -268Total operating expenses -1,205 -1,246 -5,102
Profit before loan losses 1,110 1,215 4,367Net loan losses -40 -113 -369Operating profit 1,070 1,102 3,998Income tax expense -250 -258 -950Net profit for the period 820 844 3,048Attributable to:Shareholders of Nordea Bank AB (publ) 809 839 3,031Additional Tier 1 capital holders 7 - -Non-controlling interests 4 5 17Total 820 844 3,048Basic earnings per share, EUR 0.20 0.21 0.75Diluted earnings per share, EUR 0.20 0.21 0.75
Statement of comprehensive incomeQ1 Q1 Full year
2018 2017 2017EURm
Net profit for the period 820 844 3,048Items that may be reclassified subsequently to the income statementCurrency translation differences during the period -100 67 -511Tax on currency translation differences during the period 16 74 3Hedging of net investments in foreign operations:
Valuation gains/losses during the period 4 18 175Tax on valuation gains/losses during the period 0 -4 -37
Fair value through other comprehensive income1:Valuation gains/losses during the period, net of recycling 7 - -Tax on valuation gains/losses during the period -2 - -
Available for sale investments1:Valuation gains/losses during the period, net of recycling - 28 31Tax on valuation gains/losses during the period - -7 -8
Cash flow hedges:Valuation gains/losses during the period, net of recycling 11 -82 -107Tax on valuation gains/losses during the period -2 19 24
Items that may not be reclassified subsequently to the income statementChanges in own credit risk related to liabilities classified as fair value option:
Valuation gains/losses during the period 5 - -Tax on valuation gains/losses during the period -1 - -
Defined benefit plans:Remeasurement of defined benefit plans -35 18 -115Tax on remeasurement of defined benefit plans 7 -4 25
Other comprehensive income, net of tax -90 127 -520
Total comprehensive income 730 971 2,528Attributable to:Shareholders of Nordea Bank AB (publ) 719 966 2,511Additional Tier 1 capital holders 7 - -Non-controlling interests 4 5 17Total 730 971 2,5281 Valuation gains/losses related to hedged risks under fair value hedge accounting are accounted for directly in the income statement.
Nordea First Quarter 2018
17
Q1
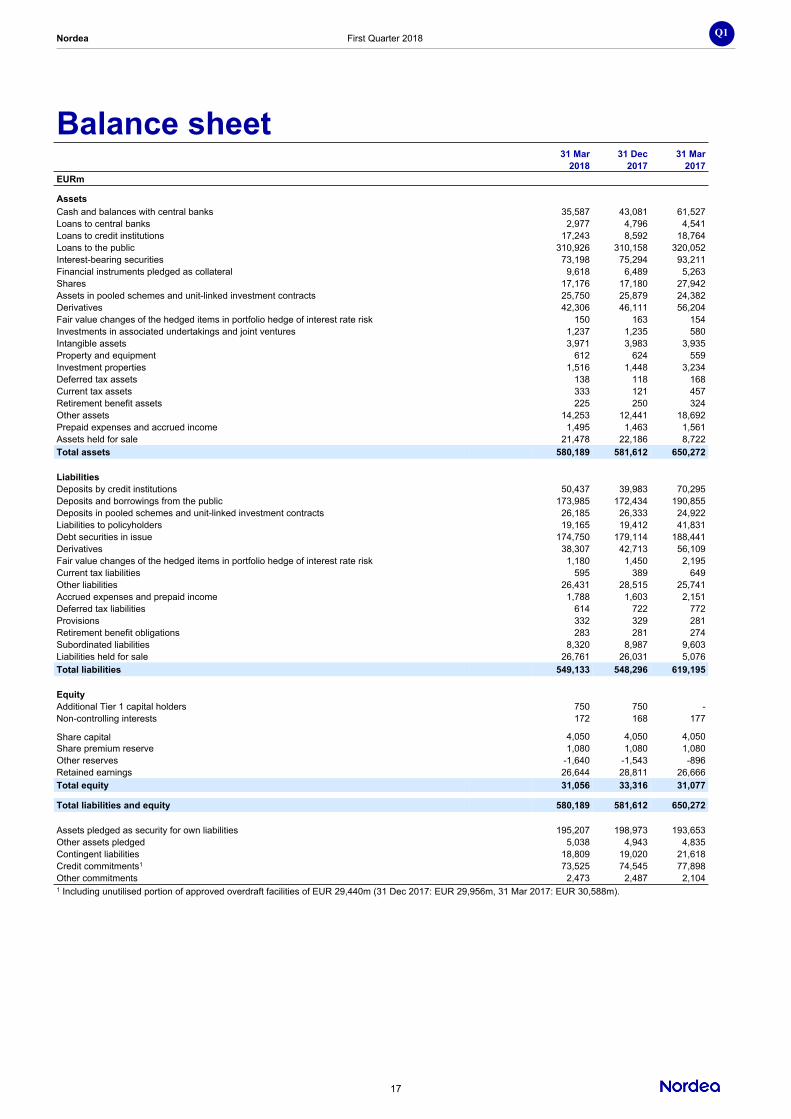
Balance sheet31 Mar 31 Dec 31 Mar
Note 2018 2017 2017EURm
AssetsCash and balances with central banks 35,587 43,081 61,527Loans to central banks 7 2,977 4,796 4,541Loans to credit institutions 7 17,243 8,592 18,764Loans to the public 7 310,926 310,158 320,052Interest-bearing securities 73,198 75,294 93,211Financial instruments pledged as collateral 9,618 6,489 5,263Shares 17,176 17,180 27,942Assets in pooled schemes and unit-linked investment contracts 25,750 25,879 24,382Derivatives 42,306 46,111 56,204Fair value changes of the hedged items in portfolio hedge of interest rate risk 150 163 154Investments in associated undertakings and joint ventures 1,237 1,235 580Intangible assets 3,971 3,983 3,935Property and equipment 612 624 559Investment properties 1,516 1,448 3,234Deferred tax assets 138 118 168Current tax assets 333 121 457Retirement benefit assets 225 250 324Other assets 14,253 12,441 18,692Prepaid expenses and accrued income 1,495 1,463 1,561Assets held for sale 12 21,478 22,186 8,722Total assets 580,189 581,612 650,272
LiabilitiesDeposits by credit institutions 50,437 39,983 70,295Deposits and borrowings from the public 173,985 172,434 190,855Deposits in pooled schemes and unit-linked investment contracts 26,185 26,333 24,922Liabilities to policyholders 19,165 19,412 41,831Debt securities in issue 174,750 179,114 188,441Derivatives 38,307 42,713 56,109Fair value changes of the hedged items in portfolio hedge of interest rate risk 1,180 1,450 2,195Current tax liabilities 595 389 649Other liabilities 26,431 28,515 25,741Accrued expenses and prepaid income 1,788 1,603 2,151Deferred tax liabilities 614 722 772Provisions 332 329 281Retirement benefit obligations 283 281 274Subordinated liabilities 8,320 8,987 9,603Liabilities held for sale 12 26,761 26,031 5,076Total liabilities 549,133 548,296 619,195
EquityAdditional Tier 1 capital holders 750 750 -Non-controlling interests 172 168 177
Share capital 4,050 4,050 4,050Share premium reserve 1,080 1,080 1,080Other reserves -1,640 -1,543 -896Retained earnings 26,644 28,811 26,666Total equity 31,056 33,316 31,077
Total liabilities and equity 580,189 581,612 650,272
Assets pledged as security for own liabilities 195,207 198,973 193,653Other assets pledged 5,038 4,943 4,835Contingent liabilities 18,809 19,020 21,618Credit commitments1 73,525 74,545 77,898Other commitments 2,473 2,487 2,1041 Including unutilised portion of approved overdraft facilities of EUR 29,440m (31 Dec 2017: EUR 29,956m, 31 Mar 2017: EUR 30,588m).

Nordea First Quarter 2018
18
Q1
Statement of changes in equityAttributable to shareholders of Nordea Bank AB (publ)
Other reserves:
Share capital1
Share premium
reserve
Trans-lation of foreign opera-
tions
Cash flow
hedges
Fair value
through other
compre-hensive income2
Defined benefit
plans
Changes in own
credit risk related to liabilities
classified as fair value
optionRetained earnings Total
Addi-tional Tier 1
capital holders
Non-cont-
rolling interests
Total equity
EURmBalance at 1 Jan 2018 4,050 1,080 -1,720 -46 103 120 - 28,811 32,398 750 168 33,316Restatement due to changedaccounting policy, net of tax3 - - - - 1 - -8 -237 -244 - - -244Restated openingbalance at 1 Jan 2018 4,050 1,080 -1,720 -46 104 120 -8 28,574 32,154 750 168 33,072Net profit for the period - - - - - - - 809 809 7 4 820Other comprehensiveincome, net of tax - - -80 9 5 -28 4 - -90 - - -90Total comprehensive income - - -80 9 5 -28 4 809 719 7 4 730Paid interest on AT1 capital - - - - - - - - - -7 - -7Dividend 2017 - - - - - - - -2,747 -2,747 - - -2,747Divestment of own shares4 - - - - - - - 8 8 - - 8Balance at 31 Mar 2018 4,050 1,080 -1,800 -37 109 92 -4 26,644 30,134 750 172 31,056
Attributable to shareholders of Nordea Bank AB (publ)Other reserves:
Share capital1
Share premium
reserve
Trans-lation of foreign opera-
tions
Cash flow
hedges
Available for sale invest-ments
Defined benefit
plansRetained earnings Total
Addi-tional Tier 1
capital holders
Non-cont-
rolling interests
Total equity
EURmBalance at 1 Jan 2017 4,050 1,080 -1,350 37 80 210 28,302 32,409 - 1 32,410Net profit for the period - - - - - - 3,031 3,031 - 17 3,048Other comprehensiveincome, net of tax - - -370 -83 23 -90 - -520 - - -520Total comprehensive income - - -370 -83 23 -90 3,031 2,511 - 17 2,528Issuance of AdditionalTier 1 capital - - - - - - -6 -6 750 - 744Dividend for 2016 - - - - - - -2,625 -2,625 - - -2,625Purchase of own shares4 - - - - - - -12 -12 - - -12Change in non-controlling interests5 - - - - - - 121 121 - 150 271Balance at 31 Dec 2017 4,050 1,080 -1,720 -46 103 120 28,811 32,398 750 168 33,316
Attributable to shareholders of Nordea Bank AB (publ)Other reserves:
Share capital1
Share premium
reserve
Trans-lation of foreign opera-
tions
Cash flow
hedges
Available for sale invest-ments
Defined benefit
plansRetained earnings Total
Non-cont-
rolling interests
Total equity
EURmBalance at 1 Jan 2017 4,050 1,080 -1,350 37 80 210 28,302 32,409 1 32,410Net profit for the period - - - - - - 839 839 5 844Other comprehensiveincome, net of tax - - 155 -63 21 14 - 127 - 127Total comprehensive income - - 155 -63 21 14 839 966 5 971Dividend for 2016 - - - - - - -2,625 -2,625 - -2,625Divestment of own shares4 - - - - - - 28 28 - 28Change in non-controlling interests5 - - - - - - 122 122 171 293Balance at 31 Mar 2017 4,050 1,080 -1,195 -26 101 224 26,666 30,900 177 31,0771 Total shares registered were 4,050 million (31 Dec 2017: 4,050 million, 31 Mar 2017: 4,050 million).2 Due to the implementation of IFRS 9 the Available for sale (AFS) category does no longer exists and the assets are instead classified as Fair value through other comprehensive income (FVOCI). Hence, the opening balance 2018 for the FVOCI-reserve is the closing balance 2017 for the AFS-reserve. 3 Related to IFRS 9 and IFRS 15. See Note 1 for more information.4 Refers to the change in the holding of own shares related to the Long Term Incentive Programme, trading portfolio and Nordea's shares within portfolio schemes in Denmark. The number of own shares at 31 Mar 2018 was 12.9 million (31 Dec 2017: 13.7 million, 31 Mar 2017: 11.0 million). The total holdings of own shares related to LTIP were 10.2 million (31 Dec 2017: 10.2 million, 31 Mar 2017: 10.9 million). 5 Refers to the sale of 25% of Nordea Liv & Pension, Livforsikringsselskab A/S in Denmark.

Nordea First Quarter 2018
19
Q1
Cash flow statement, condensed Jan-Mar Jan-Mar Full year
2018 2017 2017EURm
Operating activitiesOperating profit 1,070 1,102 3,998Adjustments for items not included in cash flow 420 1,391 3,514Income taxes paid -378 -331 -950Cash flow from operating activities before changes in operating assets and liabilities 1,112 2,162 6,562Changes in operating assets and liabilities -3,751 27,468 5,712Cash flow from operating activities -2,639 29,630 12,274
Investing activitiesSale of business operations - - 228Investments in/sale of associated undertakings and joint ventures - - -937Acqusition/sale of property and equipment -13 -19 -118Acqusition/sale of intangible assets -119 -172 -643Net investments in debt securities, held to maturity - -169 -8Sale/acqusition of other financial fixed assets -2 35 -21Cash flow from investing activities -134 -325 -1,499
Financing activitiesAmortised subordinated liabilities -500 -750 -750Divestment of own shares including change in trading portfolio 8 28 -12Dividend paid -2,747 -2,625 -2,625Issued Additional Tier 1 capital - - 750Paid interest on Additional Tier 1 capital -7 - -Cash flow from financing activities -3,246 -3,347 -2,637
Cash flow for the period -6,019 25,958 8,138
Cash and cash equivalents 31 Mar 31 Mar 31 Dec2018 2017 2017
EURmCash and cash equivalents at beginning of the period 46,213 41,860 41,860Translation difference -1,298 -405 -3,785Cash and cash equivalents at end of the period 38,896 67,413 46,213Change -6,019 25,958 8,138
The following items are included in cash and cash equivalents: Cash and balances with central banks 35,587 61,527 43,081Loans to central banks 1,827 3,937 2,004Loans to credit institutions 942 1,815 779Assets held for sale 540 134 349Total cash and cash equivalents 38,896 67,413 46,213
Cash comprises legal tender and bank notes in foreign currencies. Balances with central banks consist of deposits in accounts with central banks and postal girosystems under government authority, where the following conditions are fulfilled:
- the central bank or the postal giro system is domiciled in the country where the institution is established.- the balance on the account is readily available at any time.
Loans to credit institutions, payable on demand include liquid assets not represented by bonds or other interest-bearing securities.

Nordea First Quarter 2018
20
Q1
Notes to the financial statementsNote 1 Accounting policies
The information presented in this Interim Management Statement follows the guidelines for Interim Management Statements issued by Nasdaq OMX. This Interim Management Statement is not presented in accordance with IAS 34 “Interim Financial Reporting”.
The accounting policies and methods of computation are largely the same as for the Annual Report 2017. For more information see Note G1 in the Annual Report 2017. For changes implemented during 2018, see “Changed accounting policies and presentation” below.
Changed accounting policies and presentationThe following new and amended standards were implemented by Nordea 1 January 2018:
IFRS 9 ”Financial instruments”The new standard IFRS 9 “Financial instruments” covers classification and measurement, impairment and general hedge accounting and replaces the earlier requirements covering these areas in IAS 39. The classification, measurement and impairment requirements in IFRS 9 were implemented by Nordea as from 1 January 2018. Nordea continues to use the IAS 39 hedge accounting requirements.
The total negative impact on equity from IFRS 9 amounts to EUR 183m after tax and was recognised as an opening balance adjustment 1 January 2018. For more information about the IFRS 9 transition impact on 1 January 2018, and the accounting principles applied by Nordea as from 1 January 2018 for classification, measurement and impairment of financial instruments, see Note G49 in the Annual Report for 2017. Nordea has not restated the comparative figures for 2017.
IFRS 15 “Revenue from Contracts with Customers”The new standard IFRS 15 “Financial instruments” outlines a single comprehensive model of accounting for revenue arising from contracts with customers and supersedes current revenue recognition standards and interpretations within IFRS, such as IAS 18 “Revenue”. The standard does not apply to financial instruments, insurance contracts or lease contracts.
The standard was implemented by Nordea as from 1 January 2018 using the modified retrospective approach, meaning that the cumulative effect of the change was recognised as an adjustment to equity in the opening balance 2018. Comparable figures for 2017 were not restated.
The new standard had an impact on Nordea’s accounting policies for loan origination fees, as such fees are amortised as part of the effective interest of the underlying exposures to a larger extent than before. The total negative impact on equity from IFRS 15 amounts to EUR 61m after tax and was recognised as an opening balance adjustment 1 January 2018.
Other amendmentsThe following new and amended standards issued by IASB were implemented by Nordea 1 January 2018 but have not had any significant impact on the financial statements:• Amendment to IFRS 4: Applying IFRS 9 Financial
Instruments with IFRS 4 Insurance Contracts• Amendments to IFRS 2: Classification and
Measurement of Share based Payment Transactions• Amendments to IAS 40: Transfers of Investment
Property• Annual Improvements to IFRS Standards 2014-2016
Cycle
Amendments have been made in the Swedish Annual Accounts Act for Credit Institutions and Securities Companies (1995:1559). These amendments were implemented 1 January 2018 but have not had any significant impact on Nordea’s financial statements. In addition, the Swedish Financial Supervisory Authority has amended the accounting regulation FFFS 2008:25 by issuing FFFS 2017:18 and the Swedish Financial Reporting Board has amended the accounting recommendation for groups by issuing “RFR 1 Supplementary Accounting Rules for Groups – January 2018. Those amendments were implemented by Nordea 1 January 2018 but have not had any significant impact on Nordea’s financial statements.
Disposal groups held for saleFor information about disposal groups held for sale, see Note G42 “Disposal groups held for sale” in the Annual Report for 2017. During the first quarter the disposal group related to Nordea’s Luxembourg-based private banking business was reclassified to “Assets/Liabilities held for sale” on the balance sheet.
Determination of fair value for items measured at fair value on the balance sheetNordea has during the first quarter, in comparison with the description in Note G40 in the Annual Report for 2017, changed the margin reset frequency assumption in the fair value model covering a loan portfolio in Denmark. The change generated a pre-tax gain of EUR 135m accounted for as “Net result from items at fair value” in the income statement. Exchange rates
Jan-Mar Jan-Dec Jan-Mar2018 2017 2017
EUR 1 = SEKIncome statement (average) 9.9765 9.6378 9.5053Balance sheet (at end of period) 10.2843 9.8438 9.5322
EUR 1 = DKKIncome statement (average) 7.4468 7.4387 7.4352Balance sheet (at end of period) 7.4530 7.4449 7.4379
EUR 1 = NOKIncome statement (average) 9.6366 9.3317 8.9883Balance sheet (at end of period) 9.6770 9.8403 9.1683
EUR 1 = RUBIncome statement (average) 69.9590 65.9190 62.5730Balance sheet (at end of period) 70.8897 69.3920 60.3130

Nordea First Quarter 2018
21
Q1
Note 2 Net loan lossesQ1
20181
EURmNet loan losses, stage 1 11Net loan losses, stage 2 70Net loan losses, non-defaulted 81
Stage 3, defaultedNet loan losses, individually assessed, collectively calculated -71Realised loan losses -108Decrease of provisions to cover realised loan losses 82Recoveries on previous realised loan losses 9New/increase in provisions -127Reversals of provisions 94Net loan losses, defaulted -121
Net loan losses -40
Key ratiosQ1
20181
Loan loss ratio, basis points 7- of which stage 1 -2- of which stage 2 -12- of which stage 3 21
Q1 Jan-Dec20172 20172
EURmRealised loan losses -104 -435Decrease of provisions to cover realised loan losses 69 309Recoveries on previous realised loan losses 11 54New/increase in provisions -275 -1,001Reversal of provisions 186 704Net loan losses -113 -369
Key ratiosQ1 Jan-Dec
20172 20172
Loan loss ratio, basis points 14 12- of which individual 16 15- of which collective -2 -3
1 Based on IFRS 9.2 Based on IAS 39.
Nordea First Quarter 2018
22
Q1
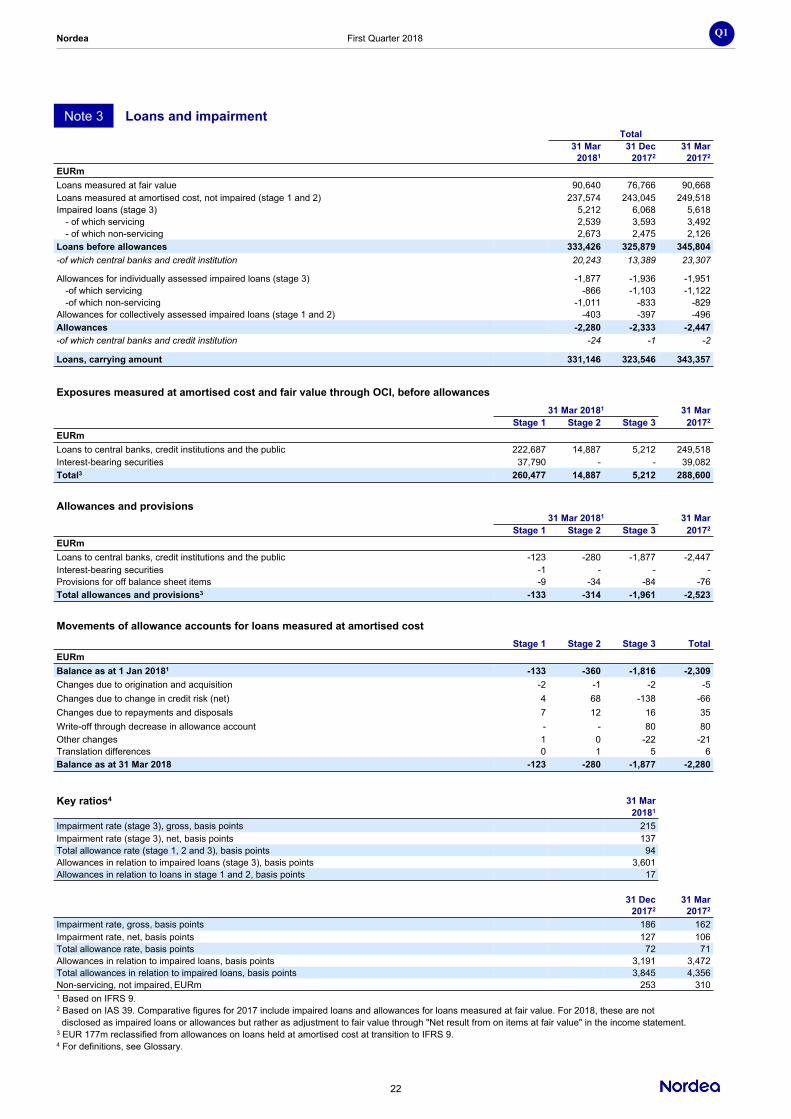
Note 3 Loans and impairmentTotal
31 Mar 31 Dec 31 Mar20181 20172 20172
EURmLoans measured at fair value 90,640 76,766 90,668Loans measured at amortised cost, not impaired (stage 1 and 2) 237,574 243,045 249,518Impaired loans (stage 3) 5,212 6,068 5,618
- of which servicing 2,539 3,593 3,492- of which non-servicing 2,673 2,475 2,126
Loans before allowances 333,426 325,879 345,804-of which central banks and credit institution 20,243 13,389 23,307
Allowances for individually assessed impaired loans (stage 3) -1,877 -1,936 -1,951-of which servicing -866 -1,103 -1,122-of which non-servicing -1,011 -833 -829
Allowances for collectively assessed impaired loans (stage 1 and 2) -403 -397 -496Allowances -2,280 -2,333 -2,447-of which central banks and credit institution -24 -1 -2
Loans, carrying amount 331,146 323,546 343,357
Exposures measured at amortised cost and fair value through OCI, before allowances31 Mar 20181 31 Mar
Stage 1 Stage 2 Stage 3 20172
EURmLoans to central banks, credit institutions and the public 222,687 14,887 5,212 249,518Interest-bearing securities 37,790 - - 39,082Total3 260,477 14,887 5,212 288,600
Allowances and provisions31 Mar 20181 31 Mar
Stage 1 Stage 2 Stage 3 20172
EURmLoans to central banks, credit institutions and the public -123 -280 -1,877 -2,447Interest-bearing securities -1 - - -Provisions for off balance sheet items -9 -34 -84 -76Total allowances and provisions3 -133 -314 -1,961 -2,523
Movements of allowance accounts for loans measured at amortised costStage 1 Stage 2 Stage 3 Total
EURmBalance as at 1 Jan 20181 -133 -360 -1,816 -2,309Changes due to origination and acquisition -2 -1 -2 -5Changes due to change in credit risk (net) 4 68 -138 -66Changes due to repayments and disposals 7 12 16 35Write-off through decrease in allowance account - - 80 80Other changes 1 0 -22 -21Translation differences 0 1 5 6Balance as at 31 Mar 2018 -123 -280 -1,877 -2,280
Key ratios4 31 Mar20181
Impairment rate (stage 3), gross, basis points 215Impairment rate (stage 3), net, basis points 137Total allowance rate (stage 1, 2 and 3), basis points 94Allowances in relation to impaired loans (stage 3), basis points 3,601Allowances in relation to loans in stage 1 and 2, basis points 17
31 Dec 31 Mar20172 20172
Impairment rate, gross, basis points 186 162Impairment rate, net, basis points 127 106Total allowance rate, basis points 72 71Allowances in relation to impaired loans, basis points 3,191 3,472Total allowances in relation to impaired loans, basis points 3,845 4,356Non-servicing, not impaired, EURm 253 3101 Based on IFRS 9.2 Based on IAS 39. Comparative figures for 2017 include impaired loans and allowances for loans measured at fair value. For 2018, these are not disclosed as impaired loans or allowances but rather as adjustment to fair value through "Net result from on items at fair value" in the income statement.3 EUR 177m reclassified from allowances on loans held at amortised cost at transition to IFRS 9.4 For definitions, see Glossary.

Nordea First Quarter 2018
23
Q1
Note 4 Classification of financial instruments
Fair value through profit or loss (FVPL)
Amortised cost (AC) Mandatorily
Designated at fair value
through profit or loss (Fair
value option)
Derivatives used for hedging
Fair value through
other com-prehensive
income (FVOCI) Total
EURmFinancial assetsCash and balances with central banks 35,587 - - - - 35,587Loans to central banks 2,642 335 - - - 2,977Loans to credit institutions 7,625 9,618 - - - 17,243Loans to the public 230,239 80,687 - - - 310,926Interest-bearing securities 3,247 27,645 7,764 - 34,542 73,198Financial instruments pledged as collateral - 9,618 - - - 9,618Shares - 17,176 - - - 17,176Assets in pooled schemes and unit-linkedinvestment contracts - 25,160 437 - - 25,597Derivatives - 40,550 - 1,756 - 42,306Fair value changes of the hedged items inportfolio hedge of interest rate risk 150 - - - - 150Other assets 2,914 10,463 - - - 13,377Prepaid expenses and accrued income 1,064 - - - - 1,064Total 31 Mar 2018 283,468 221,252 8,201 1,756 34,542 549,219
Total 1 Jan 20181 295,746 208,039 8,331 1,696 36,342 550,154
Fair value through profit or loss (FVPL)
Amortised cost (AC) Mandatorily
Designated at fair value
through profit or loss (Fair
value option)
Derivatives used for hedging Total
EURmFinancial liabilitiesDeposits by credit institutions 33,619 16,818 - - 50,437Deposits and borrowings from the public 157,185 16,800 - - 173,985Deposits in pooled schemes and unit-linkedinvestment contracts - - 26,185 - 26,185Liabilities to policyholders - - 3,359 - 3,359Debt securities in issue 120,238 - 54,512 - 174,750Derivatives - 37,073 - 1,234 38,307Fair value changes of the hedged items inportfolio hedge of interest rate risk 1,180 - - - 1,180Other liabilities 2,304 22,539 - - 24,843Accrued expenses and prepaid income 352 - - - 352Subordinated liabilities 8,320 - - - 8,320Total 31 Mar 2018 323,198 93,230 84,056 1,234 501,718
Total 1 Jan 20181 333,435 81,008 86,451 1,106 502,0001 In Note G49 "Classification of asset and liabilities under IFRS 9" in the Annual report 2017, the assets and liabilities per 1 January 2018 were presented in accordance with IFRS 9 and as stated the classification of the decrease of net tax liabilities of EUR 46m due to IFRS 9 on assets and liabilities remained to be confirmed. The correct classification has now been determined and resulted in an increase of Deferred tax assets and Deferred tax liabilities, both classified as non financial asset/liabilities, of EUR 41m compared to the amounts presented in Note G49. In addition, the effect on the opening balance 1 January 2018 due to IFRS 15 has been added and resulted in a decrease of Loans classified at amortised cost of EUR 79m, an increase of Deferred tax assets of EUR 15m and a decrease of Deferred tax liabilities of EUR 3m, both classified as non financial assets/liabilities, compared to the amounts presented in Note G49.

Nordea First Quarter 2018
24
Q1
Note 5 Risks and uncertainties
Nordea is subject to various legal regimes and requirements, including those of the Nordic countries, the European Union and the United States. Governmental authorities that administer and enforce those regimes are regularly conducting investigations with regards to Nordea’s regulatory compliance, including the compliance with anti-money laundering (AML) and economic sanction requirements. The supervisory authorities have during 2016 conducted ongoing investigations with regards to Nordea’s compliance in several areas, e.g. investment advice, AML, external tax rules, competition law and governance and control. The Nordea Group is also responding to inquiries from U.S. governmental authorities regarding historical compliance with certain U.S. financial sanctions during 2008-2014. The outcome of some investigations is pending and it cannot be excluded that these investigations could lead to criticism or sanctions.
In June 2015 the Danish Financial Supervisory Authority investigated how Nordea Bank Danmark A/S had followed the regulations regarding anti-money laundering (AML). The outcome has resulted in criticism and the matter was, in accordance with Danish administrative practice, handed over to the police for further handling and possible sanctions. Nordea has made significant investments to address the deficiencies highlighted by the investigations. Amongst other Nordea established in 2015 the Financial Crime Change Programme and have strengthened the organisation significantly to enhance the AML and sanction management risk frameworks. Nordea has also established the Business Ethics and Values Committee and a culture transformation programme to embed stronger ethical standards into our corporate culture. In addition, the group is investing in enhanced compliance standards, processes and resources in both first and second line of defence.

Nordea First Quarter 2018
25
Q1
Nordea Bank AB (publ)
Income statementQ1 Q1 Full year
2018 2017 2017EURm NoteOperating incomeInterest income 979 1,044 4,155Interest expense -504 -506 -1,824Net interest income 475 538 2,331
Fee and commission income 553 629 2,409Fee and commission expense -101 -98 -407Net fee and commission income 452 531 2,002
Net result from items at fair value 265 327 1,104Dividends -1 466 3,344Other operating income 105 99 476Total operating income 1,296 1,961 9,257
Operating expensesGeneral administrative expenses:
Staff costs -694 -684 -2,768Other expenses -304 -353 -1,469
Depreciation, amortisation and impairment charges of tangible and intangible assets -74 -64 -277Total operating expenses -1,072 -1,101 -4,514
Profit before loan losses 224 860 4,743
Net loan losses -16 -104 -299Impairment of financial non-current assets - - -385Operating profit 208 756 4,059
Appropriations - - 2Income tax expense -68 -79 -551Net profit for period 140 677 3,510

Nordea First Quarter 2018
26
Q1
Nordea Bank AB (publ)Balance sheet
31 Mar 31 Dec 31 Mar2018 2017 2017
EURm
AssetsCash and balances with central banks 35,194 42,637 61,118Treasury bills 16,945 13,493 21,753Loans to credit institutions 64,958 59,765 63,845Loans to the public 156,948 152,739 171,877Interest-bearing securities 41,994 47,950 51,652Financial instruments pledged as collateral 17,106 12,430 10,288Shares 8,106 7,883 10,369Derivatives 43,444 47,688 57,259Fair value changes of the hedged items in portfolio hedge of interest rate risk 67 85 73Investments in group undertakings 12,531 12,532 13,007Investments in associated undertakings and joint ventures 1,039 1,036 80Participating interest in other companies 37 23 10Intangible assets 2,140 2,114 1,822Property and equipment 379 385 329Deferred tax assets 99 84 125Current tax assets 274 58 403Retirement benefit assets 214 196 141Other assets 14,750 15,316 18,815Prepaid expenses and accrued income 1,217 1,128 1,204Total assets 417,442 417,542 484,170
LiabilitiesDeposits by credit institutions 63,894 51,735 80,913Deposits and borrowings from the public 179,607 176,231 198,649Debt securities in issue 67,616 72,460 79,884Derivatives 41,019 46,118 59,563Fair value changes of the hedged items in portfolio hedge of interest rate risk 374 552 915Current tax liabilities 336 158 417Other liabilities 26,317 28,720 24,660Accrued expenses and prepaid income 1,433 1,195 1,749Deferred tax liabilities 52 174 161Provisions 402 412 371Retirement benefit obligations 263 262 282Subordinated liabilities 8,321 8,987 9,476Total liabilities 389,634 387,004 457,040
Untaxed reserves - - 2
EquityAdditional Tier 1 capital holders 750 750 -Share capital 4,050 4,050 4,050Development cost reserve 1,314 1,205 721Share premium reserve 1,080 1,080 1,080Other reserves 67 166 104Retained earnings 20,547 23,287 21,173Total equity 27,808 30,538 27,128
Total liabilities and equity 417,442 417,542 484,170
Assets pledged as security for own liabilities 35,833 36,000 37,738Other assets pledged 5,038 4,943 4,835Contingent liabilities 53,408 54,130 58,647Commitments1 74,310 77,870 80,4251 Including unutilised portion of approved overdraft facilities of EUR 32,455m (31 Dec 2017: EUR 34,725m, 31 Mar 2017: EUR 35,558m).

Nordea First Quarter 2018
27
Q1
GlossaryReturn on equityNet profit for the period as a percentage of average equity for the year. Additional Tier 1 capital, accounted for in equity, is in the calculation considered as being classified as a financial liability. Net profit for the period excludes non-controlling interests and interest expense on Additional Tier 1 capital (discretionary interest accrued). Average equity includes net profit for the period and dividend until paid, and excludes non-controlling interests and Additional Tier 1 capital.
Total shareholders return (TSR)Total shareholders return measured as growth in the value of a shareholding during the year, assuming the dividends are reinvested at the time of the payment to purchase additional shares.
Tier 1 capitalThe Tier 1 capital of an institution consists of the sum of the Common Equity Tier 1 capital and Additional Tier 1 capital of the institution. Common Equity Tier 1 capital includes consolidated shareholders’ equity excluding investments in insurance companies, proposed dividend, deferred tax assets, intangible assets in the banking operations, the full expected shortfall deduction (the negative difference between expected losses and provisions) and finally other deductions such as cash flow hedges.
Tier 1 capital ratioTier 1 capital as a percentage of Risk Exposure Amount. The Common Equity Tier 1 capital ratio is calculated as Common Equity Tier 1 capital as a percentage of Risk Exposure Amount.
Loan loss ratioNet loan losses (annualised) divided by quarterly closing balance of loans to the public (lending) measured at amortised cost.
Impairment rate (Stage 3), grossImpaired loans (Stage 3) before allowances divided by total loans measured at amortised cost before allowances.
Impairment rate (Stage 3), netImpaired loans (Stage 3) after allowances divided by total loans measured at amortised cost before allowances.
Total allowance rate (Stage 1, 2 and 3)Total allowances divided by total loans measured at amortised cost before allowances.
Allowances in relation to credit impaired loans (stage 3)Allowances for impaired loans (stage 3) divided by impaired loans measured at amortised cost (stage 3) before allowances.
Allowance in relation to loans in stage 1 and 2Allowances for not impaired loans (stage 1 and 2) divided by not impaired loans measured at amortised cost (stage 1 and 2) before allowances.
Economic capitalEconomic Capital is Nordea’s internal estimate of required capital and measures the capital required to cover unexpected losses in the course of its business with a certain probability. EC uses advanced internal models to provide a consistent measurement for Credit Risk, Market Risk, Operational Risk, Business Risk and Life Insurance Risk arising from activities in Nordea’s various business areas. The aggregation of risks across the group gives rise to diversification effects resulting from the differences in risk drivers and the improbability that unexpected losses occur simultaneously.
ROCARROCAR, % (Return on Capital at Risk) is defined as Net profit excluding items affecting comparability, in percentage of Economic capital. For Business areas it is defined as Operating profit after standard tax in percentage of Economic Capital.
For a list of further Alternative Performance Measures and business definitions, http://www.nordea.com/en/investor-relations/reports-and-presentations/select-reports-and-presentations/ and the Annual Report.
Nordea First Quarter 2018
28
Q1
For further information A press conference with management will be held on 25
April at 10.00 CET, at Smålandsgatan 17, Stockholm where Casper von Koskull, President and Group CEO, will present the results. The presentation will be conducted in English and can be viewed live (direct link). You can also find the presentation material at www.nordea.com/ir.
After the results presentation, there will be a Q&A session (starting at approximately 10.30 with Christopher Rees, Group CFO and Rodney Alfvén, Head of Investor Relations); please dial +44(0) 330 336 9411 or +46(0) 8 5065 3942 or +358 (0)9 7479 0404 confirmation code 8903308 no later than 09.50 CET.
After the conference an indexed on-demand replay will be available here. A replay will also be available until 2 May by dialing +44 (0) 207 660 0134 or +46 (0) 8 5199 3077 or +358 (0) 9 8171 0562, access code 8903308.
An analyst and investor presentation will be held in London on 26 April at 08.00 local time at ABGSC Offices, St Martin`s Court, 25 Newgate Street, London, EC1A 7AW where Casper von Koskull, President and Group CEO, Christopher Rees, Group CFO, Rodney Alfvén, Head of Investor Relations and Pawel Wyszynski, Senior IR Officer, will participate.
The presentation, including Q&A, is expected to last approximately one hour.
To attend please contact: Rebecca Harris at ABG SC via e-mail: [email protected]
This Interim management statement, an investor presentation and a fact book are available on www.nordea.com.
ContactsCasper von KoskullPresident and Group CEO+46 10 157 10 20
Christopher ReesGroup CFO + 45 55 47 23 77
Rodney AlfvénHead of Investor Relations+46 72 235 05 15
Sara Helweg-LarsenHead of Group Communications+45 22 14 00 00
Financial calendar
Stockholm 25 April 2018
Casper von KoskullPresident and Group CEO
19 July 2018 – Second Quarter Report 2018 (silent period starts 6 July 2018) 24 October 2018 – Third Quarter Report 2018 (silent period starts 5 October 2018)

Nordea First Quarter 2018
29
Q1
Nordea Bank AB (publ) • Smålandsgatan 17 • SE-105 71 Stockholm • www.nordea.com/ir • Tel. 08 614 7800 • Corporate registration No. 516406-0120
This Interim Management Statement has been prepared in accordance with the Nasdaq guidelines for preparing interim management statements.
This Interim Management Statement has not been subject to review by the Auditors.
This Interim Management Statement is published in one additional language version, in Swedish. In the event of any inconsistencies between the Swedish language version and this English version, the English version shall prevail.
The information in this report is such, which Nordea Bank AB (publ) is obliged to make public pursuant to the EU Market Abuse Regulation and the Swedish Securities Markets Act. The information was submitted for publication, through the agency of the contact persons set out above, at 07.00 CET on 25 April 2018.
This Interim Management Statement contains forward-looking statements that reflect management’s current views with respect to certain future events and potential financial performance. Although Nordea believes that the expectations reflected in such forward-looking statements are reasonable, no assurance can be given that such expectations will prove to have been correct. Accordingly, results could differ materially from those set out in the forward-looking statements as a result of various factors. Important factors that may cause such a difference for Nordea include, but are not limited to: (i) the macroeconomic development, (ii) change in the competitive climate, (iii) change in the regulatory environment and other government actions and (iv) change in interest rate and foreign exchange rate levels. This Interim Management Statement does not imply that Nordea has undertaken to revise these forward-looking statements, beyond what is required by applicable law or applicable stock exchange regulations if and when circumstances arise that will lead to changes compared to the date when these statements were provided.
The information provided in this press release is such, which Nordea is required to disclose pursuant to the Swedish Financial Instruments Trading Act (1991:980) and/or the Swedish Securities Markets Act (2007:528).