first quarter 2020 (1q20) · resilient global demand for polyester end-products, resulted in an...
TRANSCRIPT
First Quarter 2020 (1Q20) |
This release contains forward‐looking information based on numerous variables and assumptions that are inherently uncertain. They involve judgments with respect to,
among other things, future economic, competitive and financial market conditions and future business decisions, all of which are difficult or impossible to predict accurately. Accordingly, results could vary from those set forth in this release. The report presents unaudited financial information based on International Financial Reporting Standards (IFRS). Figures are stated in nominal Mexican pesos ($) and in current U.S. Dollars (U.S. $), as indicated. Where applicable, peso amounts were translated into U.S. Dollars using the average exchange rate of the months during which operations were recorded. Financial ratios are calculated in U.S. Dollars. Due to the rounding up of figures, small differences may occur when calculating percent changes from one period to the other.
Monterrey, Mexico. April 16, 2020 – Alpek, S.A.B. de C.V. (BMV: ALPEK)
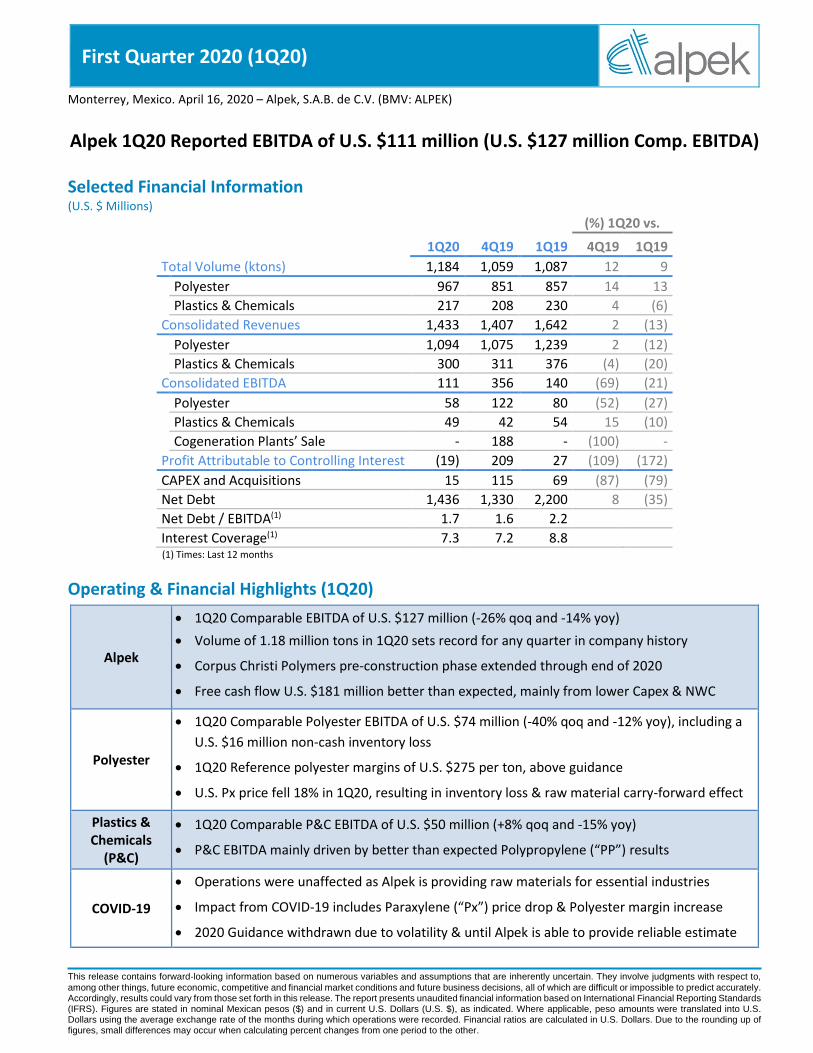
Alpek 1Q20 Reported EBITDA of U.S. $111 million (U.S. $127 million Comp. EBITDA)
Selected Financial Information (U.S. $ Millions)
(%) 1Q20 vs.
1Q20 4Q19 1Q19 4Q19 1Q19
Total Volume (ktons) 1,184 1,059 1,087 12 9
Polyester 967 851 857 14 13
Plastics & Chemicals 217 208 230 4 (6)
Consolidated Revenues 1,433 1,407 1,642 2 (13)
Polyester 1,094 1,075 1,239 2 (12)
Plastics & Chemicals 300 311 376 (4) (20)
Consolidated EBITDA 111 356 140 (69) (21)
Polyester 58 122 80 (52) (27)
Plastics & Chemicals 49 42 54 15 (10)
Cogeneration Plants’ Sale - 188 - (100) -
Profit Attributable to Controlling Interest (19) 209 27 (109) (172)
CAPEX and Acquisitions 15 115 69 (87) (79)
Net Debt 1,436 1,330 2,200 8 (35)
Net Debt / EBITDA(1) 1.7 1.6 2.2
Interest Coverage(1) 7.3 7.2 8.8 (1) Times: Last 12 months
Operating & Financial Highlights (1Q20)
Alpek
• 1Q20 Comparable EBITDA of U.S. $127 million (-26% qoq and -14% yoy)
• Volume of 1.18 million tons in 1Q20 sets record for any quarter in company history
• Corpus Christi Polymers pre-construction phase extended through end of 2020
• Free cash flow U.S. $181 million better than expected, mainly from lower Capex & NWC
Polyester
• 1Q20 Comparable Polyester EBITDA of U.S. $74 million (-40% qoq and -12% yoy), including a
U.S. $16 million non-cash inventory loss
• 1Q20 Reference polyester margins of U.S. $275 per ton, above guidance
• U.S. Px price fell 18% in 1Q20, resulting in inventory loss & raw material carry-forward effect
Plastics & Chemicals
(P&C)
• 1Q20 Comparable P&C EBITDA of U.S. $50 million (+8% qoq and -15% yoy)
• P&C EBITDA mainly driven by better than expected Polypropylene (“PP”) results
COVID-19
• Operations were unaffected as Alpek is providing raw materials for essential industries
• Impact from COVID-19 includes Paraxylene (“Px”) price drop & Polyester margin increase
• 2020 Guidance withdrawn due to volatility & until Alpek is able to provide reliable estimate
First Quarter 2020 (1Q20) |
[email protected] www.alpek.com 2
Message from the CEO
Alpek achieved better-than-expected results across both its business segments in 1Q20, amid a volatile
economic & feedstock price environment largely caused by the effects of the outbreak of Coronavirus (“COVID-19”).
The first cases of COVID-19 were reported during late 2019 in China, where strict measures taken over the next
months, aimed at reducing the virus from spreading, impacted the operation of refineries and polyester producers
in the region. Regarding our industry, these unplanned production cuts resulted in:
• Feedstock Price Reduction – As demand for crude oil in Asia was reduced due to the slow-down in refinery
activity, coupled with the lack of an agreement to reduce global production during 1Q20, average spot
Brent crude oil declined by 49% throughout the quarter. As a result, U.S. reference paraxylene (“Px”)
prices also decreased accordingly by 18% over the same period.
• Polyester Margin Improvement – Lower output from Polyester producers in Asia, combined with a
resilient global demand for polyester end-products, resulted in an increase of integrated Asian polyester
margins of 21% in the first quarter.
Our first priority is toward the safety and well-being of our employees. As such, Alpek has taken preventive
measures including additional hygiene practices, protective gear, health checkpoints, travel restrictions, and
enforced home-office wherever possible.
From an operational perspective, the company produces raw materials for recession-resilient industries,
including food & beverage packaging, consumer goods, and medical supplies. These industries have all been declared
as essential activities in the countries where we have production sites, have continued their operations
uninterrupted, and some customers have even requested higher volume than we expected.
Alpek has also responded to the effects of COVID-19 through prudent financial decisions in 1Q20. The
company reaffirms its focus on financial stability by: Reducing Capex through initiatives such as extending the pre-
construction period of Corpus Christi Polymers (“CCP”), reducing net working capital through better inventory,
supplier, and customer management, as well as decreeing a lower dividend better-in-line with expected EBITDA.
Additionally, the Company has enhanced its cash balance for the next months by drawing on available committed
credit lines.
Notwithstanding the effects caused by COVID-19, Alpek posted a first quarter 2020 Consolidated EBITDA of
U.S. $111 million. In addition to strong Polyester margins and volume, results were also supported by strong
performance from Plastics & Chemicals (“P&C”). Excluding inventory losses, Alpek’s 1Q20 Comparable EBITDA was
U.S. $127 million.
The strong reduction to Px prices observed during 1Q20 also generated a negative raw material carry-forward
effect of U.S. $20 million in the same period. Comparable EBITDA excluding for this effect would have reached
U.S. $147 million in 1Q20, significantly exceeding 2020 Guidance, and only 15% and 12% lower than figures in 4Q19
and 1Q19, respectively.
First Quarter 2020 (1Q20) |
[email protected] www.alpek.com 3
In addition to the previously discussed reduction to crude oil and Px prices, average U.S. propylene (“PGP”)
and styrene contract prices also declined by 12% and 19% during the first quarter, respectively. These price
reductions resulted in a non-cash inventory loss of U.S. $17 million in 1Q20.
1Q20 Polyester segment EBITDA was U.S. $58 million, including a U.S. $16 million non-cash inventory loss.
Adjusting for this effect, 1Q20 Comparable Polyester EBITDA was U.S. $74 million, in line with Guidance, but down
40% and 12% when compared to 4Q19 and 1Q19, respectively. These variations are primarily attributed to lower
margins for contractual volume, non-recurring income from the operation of cogeneration plants in 2019, and a
negative raw material carry-forward effect, which were partially offset by stronger volume.
Plastics & Chemicals segment EBITDA was U.S. $49 million in 1Q20. Adjusting for non-cash inventory losses
of U.S. $1 million, Comparable P&C EBITDA was U.S. $50 million, up 8% quarter-on-quarter and down 15% year on
year. The quarter-on-quarter increase is mainly attributed to strong Polypropylene (“PP”) performance, while the
decrease versus last year is due to higher PP and Expandable Polystyrene (“EPS”) margins at the time.
On the investment front, Capex totaled only U.S. $15 million during the quarter, with most funds used for
minor asset replacements. On March 18th, Alpek announced that Corpus Christi Polymers had extended its pre-
construction period through the end of 2020 and, therefore, the Company would not need to make the U.S. $45
million capital contribution it had included in its Guidance.
During 1Q20, Alpek paid out a dividend of U.S. $143.2 million related to the sale of its Cogeneration assets
approved during an extraordinary Shareholders’ Meeting held on January 20th. It also approved a dividend of
U.S. $81.6 million during its Annual Shareholders’ Meeting on February 27th, currently planned to be paid out on June
1st, 2020, but subject to be reviewed by the Board of Directors in light of current market conditions.
Alpek’s financial position continues to reflect the strength achieved since year-end 2019. As of 1Q20, Net
Debt totaled U.S. $1.436 billion, lower than expected as free cash flow was U.S. $181 million higher than expectations,
mainly from reductions to Capex and net working capital. Leverage ratio (Net Debt to LTM EBITDA) was 1.7 times, up
from 1.6 times, but down from 2.2 times at the close of 4Q19 and 1Q19, respectively.
Overall 1Q20 Comparable EBITDA figures reflect stronger-than-expected Polyester & Polypropylene margins,
record quarterly volume, and favorable exchange rates which reduced SG&A. The results are even stronger if
excluding negative raw material carry-forward effects. While the company’s 1Q results are on track to meet Guidance
figures, Alpek recognizes the volatility surrounding COVID-19 makes it difficult to predict feedstock prices, demand,
and margins over the upcoming months. As such, the company is withdrawing its 2020 Guidance as it better
understands this changing environment. Updated Guidance will be provided as soon as a reliable estimate can be
determined.

First Quarter 2020 (1Q20) |
[email protected] www.alpek.com 4
Results by Business Segment
Polyester (Purified Terephthalic Acid (PTA), Polyethylene Terephthalate (PET), rPET, Polyester fibers – 76% of Alpek’s Net Sales)
First quarter 2020 Polyester revenue was up 2% quarter-on-quarter as higher volume more than offset a
decline in average prices. 1Q20 revenue was down 12% year-on-year mainly due to lower feedstock prices versus
1Q19. Average 1Q20 polyester prices decreased 10% and 22% when compared to 4Q19 and 1Q19, respectively.
Polyester volume was 967 Ktons in 1Q20, up 14% and 13% when compared to 4Q19 and 1Q19, respectively.
This figure represents a record for Alpek in any quarter, with the increase in volume mainly due to strong PET demand
and our recent acquisition of a PET plant in the UK.
1Q20 segment EBITDA was U.S. $58 million, including a U.S. $16 million non-cash inventory loss. Adjusting
for this item, 1Q20 Comparable Polyester EBITDA was U.S. $74 million, down 40% and 12% when compared to 4Q19
and 1Q19, respectively. Comparable Polyester EBITDA, excluding the negative raw material carry-forward effect of
U.S. $20 million in the quarter, would have been U.S. $94 million, and significantly higher than Guidance.
Plastics & Chemicals (P&C) (Polypropylene (PP), Expandable Polystyrene (EPS), Caprolactam (CPL), Other products – 22% of Alpek’s Net Sales)
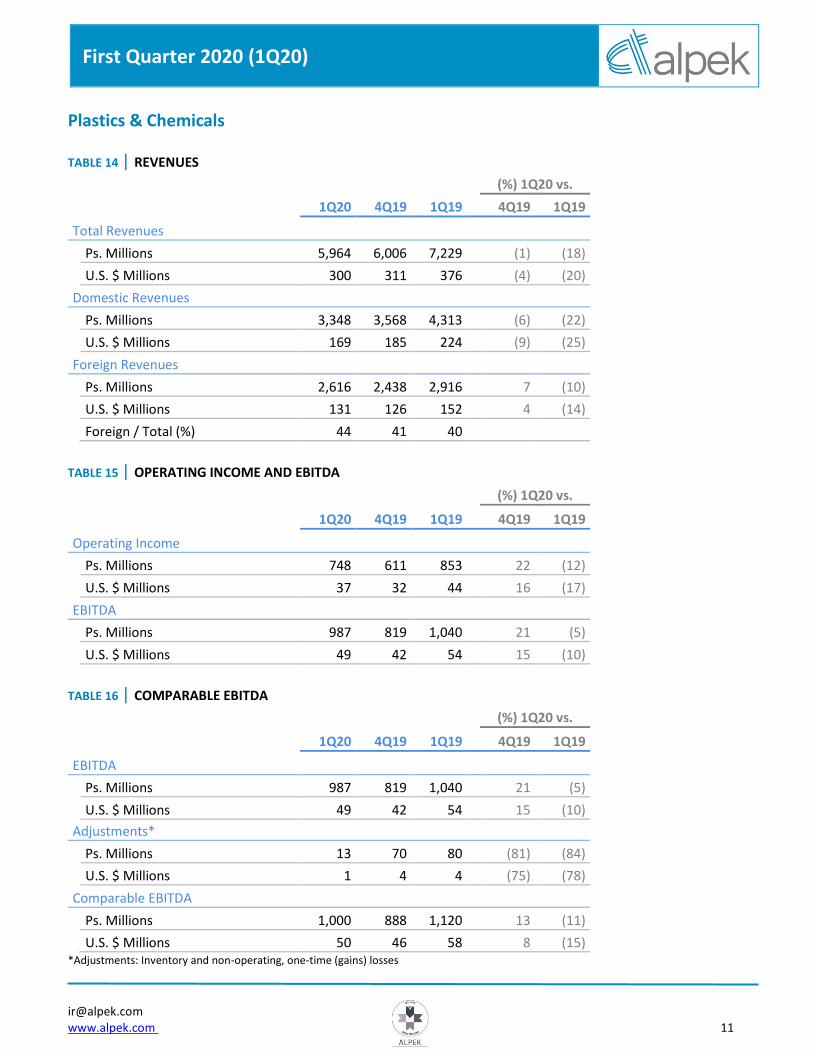
1Q20 P&C revenue was down 4% and 20% quarter-on-quarter and year-on-year, respectively, mainly as a
result of lower average prices. 1Q20 average P&C prices were down 7% and 16% when compared to those of 4Q19
and 1Q19, respectively, reflecting lower prices for feedstocks such as propylene and styrene.
Quarterly P&C volume increased 4% and decreased 6%, when compared to 4Q19 and 1Q19, respectively. The
increase versus 4Q19 was mainly driven by polypropylene while the decrease versus 1Q19 was due to lower
Caprolactam (“CPL”) and Industrial Chemical sales.
Segment EBITDA was U.S. $49 million in 1Q20, including a U.S. $1 million non-cash inventory loss. Adjusting
for the inventory loss, 1Q20 Comparable P&C EBITDA was U.S. $50 million, up 8% quarter-on-quarter and down 15%
year-on-year. The increase versus last quarter was driven by better than expected results from PP, while the
difference versus 1Q19 was due to higher PP and Expandable Polystyrene (“EPS”) margins at the time.

First Quarter 2020 (1Q20) |
[email protected] www.alpek.com 5
Consolidated Financial Results
Net Sales: Net Sales for the first quarter totaled U.S. $1.433 billion, 2% higher than 4Q19, but 13% lower than
1Q19. 1Q20 average consolidated prices were down 9% and 20% quarter-on-quarter and year-on-year, mainly driven
by lower feedstock prices.
EBITDA: 1Q20 Consolidated EBITDA was U.S. $111 million, including a U.S. $17 million non-cash inventory loss.
Adjusting for this item, Comparable Consolidated EBITDA was U.S. $127 million, versus U.S. $172 million and
U.S. $148 million in 4Q19 and 1Q19, respectively.
Profit (Loss) Attributable to Controlling Interest: Loss Attributable to Controlling Interest for the first
quarter of 2020 was U.S. $19 million, compared to the profit of U.S. $209 million in 4Q19 and U.S. $27 million in
1Q19.
Capital Expenditures and Acquisitions (Capex): 1Q20 Capex was U.S. $15 million, compared to
U.S. $115 million and U.S. $69 million in 4Q19 and 1Q19, respectively. Most of these funds were used for minor asset
replacements.
Net Debt: Consolidated Net Debt as of March 31, 2020 was U.S. $1.436 billion. The figure was better than
expected, up 8% and down 35% quarter-on-quarter and year-on-year, respectively. Net Debt increased by U.S. $106
million during 1Q20 as a result of dividend and tax payments. As of March 31,2020, Gross Debt was U.S. $2.006 billion
and Cash was increased to U.S. $570 million by drawing on U.S. $240 million in committed short and long-term credit
lines. Financial ratios as of quarter-end were: Net Debt to EBITDA of 1.7 times and Interest Coverage of 7.3 times.
First Quarter 2020 (1Q20) |
[email protected] www.alpek.com 6
Appendix A - Tables
TABLE 1 | VOLUME (KTONS)
(%) 1Q20 vs.
1Q20 4Q19 1Q19 4Q19 1Q19
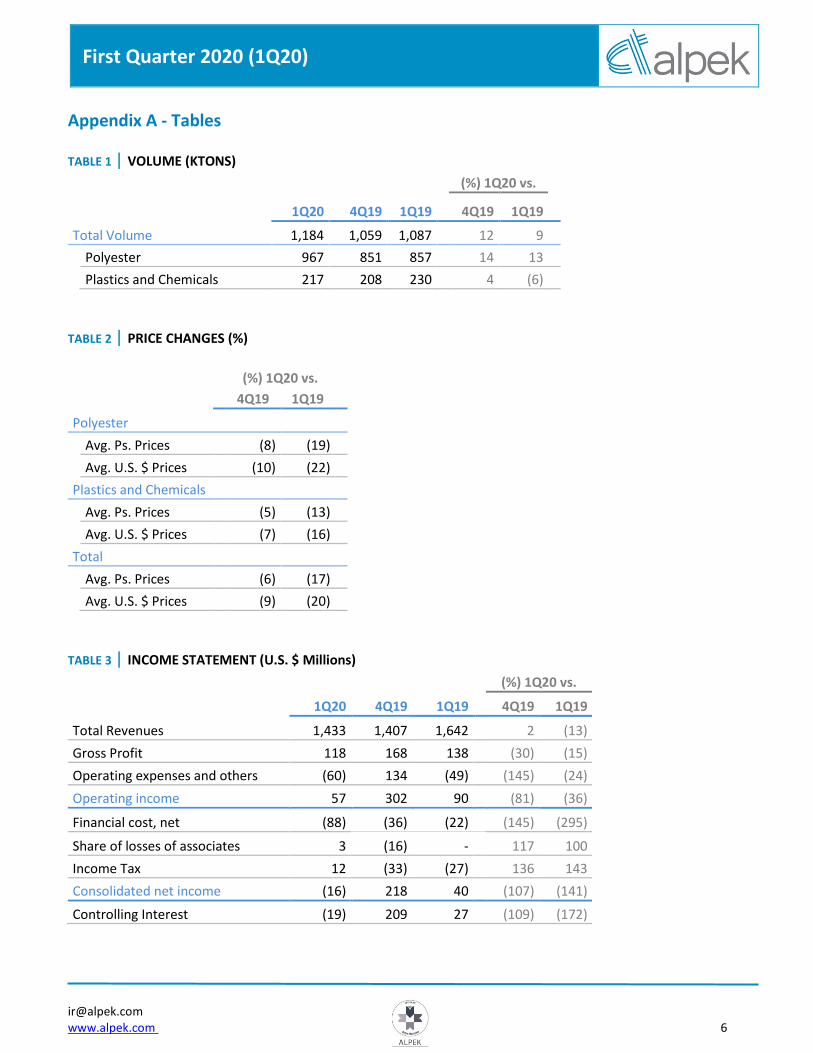
Total Volume 1,184 1,059 1,087 12 9
Polyester 967 851 857 14 13
Plastics and Chemicals 217 208 230 4 (6)
TABLE 2 | PRICE CHANGES (%)
(%) 1Q20 vs. 4Q19 1Q19
Polyester
Avg. Ps. Prices (8) (19)
Avg. U.S. $ Prices (10) (22)
Plastics and Chemicals
Avg. Ps. Prices (5) (13)
Avg. U.S. $ Prices (7) (16)
Total
Avg. Ps. Prices (6) (17)
Avg. U.S. $ Prices (9) (20)
TABLE 3 | INCOME STATEMENT (U.S. $ Millions)
(%) 1Q20 vs.
1Q20 4Q19 1Q19 4Q19 1Q19
Total Revenues 1,433 1,407 1,642 2 (13)
Gross Profit 118 168 138 (30) (15)
Operating expenses and others (60) 134 (49) (145) (24)
Operating income 57 302 90 (81) (36)
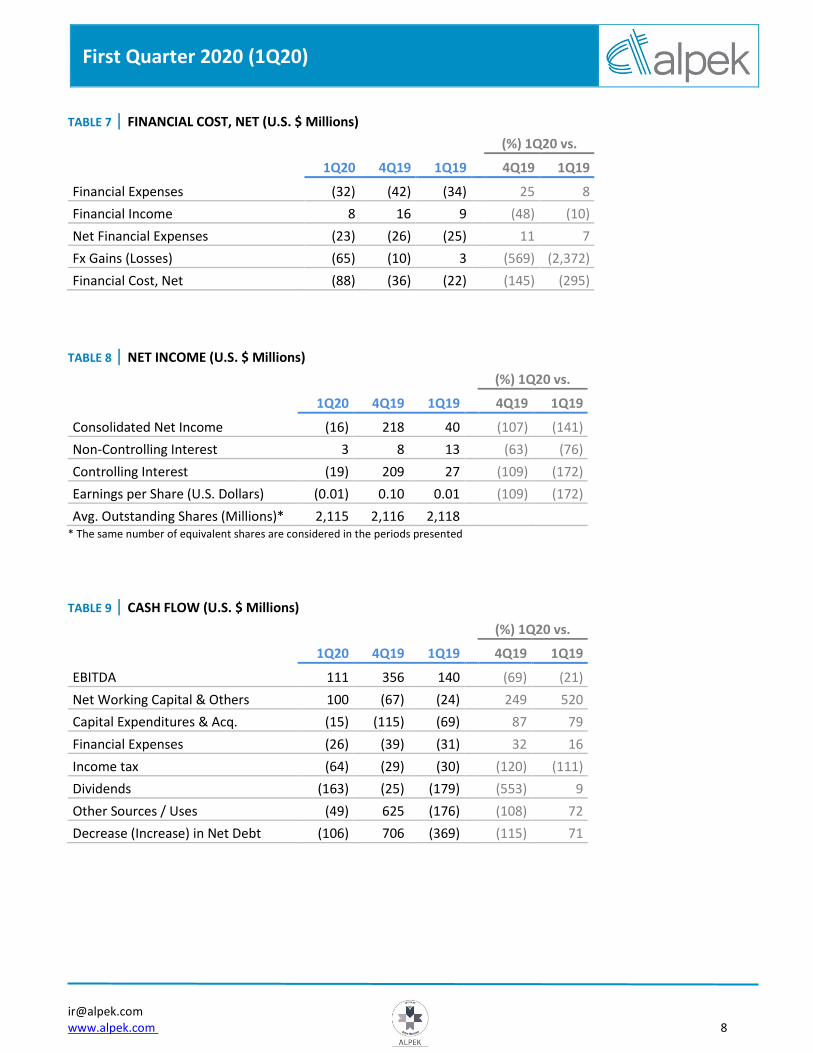
Financial cost, net (88) (36) (22) (145) (295)
Share of losses of associates 3 (16) - 117 100
Income Tax 12 (33) (27) 136 143
Consolidated net income (16) 218 40 (107) (141)
Controlling Interest (19) 209 27 (109) (172)

First Quarter 2020 (1Q20) |
[email protected] www.alpek.com 7
TABLE 4 | REVENUES
(%) 1Q20 vs.
1Q20 4Q19 1Q19 4Q19 1Q19
Total Revenues
Ps. Millions 28,522 27,133 31,567 5 (10)
U.S. $ Millions 1,433 1,407 1,642 2 (13)
Domestic Revenues
Ps. Millions 8,037 7,837 8,776 3 (8)
U.S. $ Millions 405 406 457 - (11)
Foreign Revenues
Ps. Millions 20,485 19,296 22,791 6 (10)
U.S. $ Millions 1,028 1,001 1,186 3 (13)
Foreign / Total (%) 72 71 72
TABLE 5 | OPERATING INCOME AND EBITDA
(%) 1Q20 vs.
1Q20 4Q19 1Q19 4Q19 1Q19
Operating Income
Ps. Millions 1,151 5,834 1,722 (80) (33)
U.S. $ Millions 57 302 90 (81) (36)
EBITDA
Ps. Millions 2,205 6,863 2,684 (68) (18)
U.S. $ Millions 111 356 140 (69) (21)
TABLE 6 | COMPARABLE EBITDA
(%) 1Q20 vs.
1Q20 4Q19 1Q19 4Q19 1Q19
EBITDA
Ps. Millions 2,205 6,863 2,684 (68) (18)
U.S. $ Millions 111 356 140 (69) (21)
Adjustments*
Ps. Millions 337 (3,546) 153 109 120
U.S. $ Millions 17 (184) 8 109 109
Comparable EBITDA
Ps. Millions 2,541 3,317 2,837 (23) (10)
U.S. $ Millions 127 172 148 (26) (14) *Adjustments: Inventory and non-operating, one-time (gains) losses
First Quarter 2020 (1Q20) |
[email protected] www.alpek.com 8
TABLE 7 | FINANCIAL COST, NET (U.S. $ Millions)
(%) 1Q20 vs.
1Q20 4Q19 1Q19 4Q19 1Q19
Financial Expenses (32) (42) (34) 25 8
Financial Income 8 16 9 (48) (10)
Net Financial Expenses (23) (26) (25) 11 7
Fx Gains (Losses) (65) (10) 3 (569) (2,372)
Financial Cost, Net (88) (36) (22) (145) (295)
TABLE 8 | NET INCOME (U.S. $ Millions)
(%) 1Q20 vs.
1Q20 4Q19 1Q19 4Q19 1Q19
Consolidated Net Income (16) 218 40 (107) (141)
Non-Controlling Interest 3 8 13 (63) (76)
Controlling Interest (19) 209 27 (109) (172)
Earnings per Share (U.S. Dollars) (0.01) 0.10 0.01 (109) (172)
Avg. Outstanding Shares (Millions)* 2,115 2,116 2,118 * The same number of equivalent shares are considered in the periods presented
TABLE 9 | CASH FLOW (U.S. $ Millions)
(%) 1Q20 vs.
1Q20 4Q19 1Q19 4Q19 1Q19
EBITDA 111 356 140 (69) (21)
Net Working Capital & Others 100 (67) (24) 249 520
Capital Expenditures & Acq. (15) (115) (69) 87 79
Financial Expenses (26) (39) (31) 32 16
Income tax (64) (29) (30) (120) (111)
Dividends (163) (25) (179) (553) 9
Other Sources / Uses (49) 625 (176) (108) 72
Decrease (Increase) in Net Debt (106) 706 (369) (115) 71

First Quarter 2020 (1Q20) |
[email protected] www.alpek.com 9
TABLE 10 | STATEMENT OF FINANCIAL POSITION & FINANCIAL RATIOS (U.S. $ Millions)
(%) 1Q20 vs.
1Q20 4Q19 1Q19 4Q19 1Q19
Assets
Cash and cash equivalents 570 386 230 48 148
Trade accounts receivable 574 545 699 5 (18)
Inventories 898 953 1,064 (6) (16)
Other current assets 314 428 356 (27) (12)
Total current assets 2,356 2,312 2,348 2 -
Investment in associates and others 441 438 448 1 (1)
Property, plant and equipment, net 1,876 1,968 2,430 (5) (23)
Goodwill and intangible assets, net 193 201 221 (4) (13)
Other non-current assets 604 536 595 13 2
Total assets 5,470 5,455 6,042 - (9)
Liabilities & stockholders' equity
Debt 189 38 692 404 (73)
Suppliers 819 693 871 18 (6)
Other current liabilities 487 348 314 40 55
Total current liabilities 1,496 1,078 1,878 39 (20)
Debt (include debt issuance cost) 1,642 1,491 1,560 10 5
Employees' benefits 55 58 57 (5) (3)
Other long-term liabilities 431 436 476 (1) (9)
Total liabilities 3,623 3,064 3,970 18 (9)
Total stockholders' equity 1,847 2,391 2,072 (23) (11)
Total liabilities & stockholders' equity 5,470 5,455 6,042 - (9)
Net Debt 1,436 1,330 2,200 8 (35)
Net Debt/EBITDA* 1.7 1.6 2.2
Interest Coverage* 7.3 7.2 8.8 * Times: last 12 months

First Quarter 2020 (1Q20) |
[email protected] www.alpek.com 10
Polyester
TABLE 11 | REVENUES
(%) 1Q20 vs.
1Q20 4Q19 1Q19 4Q19 1Q19
Total Revenues
Ps. Millions 21,795 20,731 23,823 5 (9)
U.S. $ Millions 1,094 1,075 1,239 2 (12)
Domestic Revenues
Ps. Millions 4,020 3,895 3,985 3 1
U.S. $ Millions 202 202 207 - (3)
Foreign Revenues
Ps. Millions 17,775 16,836 19,838 6 (10)
U.S. $ Millions 892 873 1,032 2 (14)
Foreign / Total (%) 82 81 83
TABLE 12 | OPERATING INCOME AND EBITDA
(%) 1Q20 vs.
1Q20 4Q19 1Q19 4Q19 1Q19
Operating Income
Ps. Millions 336 1,526 767 (78) (56)
U.S. $ Millions 17 79 40 (78) (57)
EBITDA
Ps. Millions 1,151 2,349 1,541 (51) (25)
U.S. $ Millions 58 122 80 (52) (27)
TABLE 13 | COMPARABLE EBITDA
(%) 1Q20 vs.
1Q20 4Q19 1Q19 4Q19 1Q19
EBITDA
Ps. Millions 1,151 2,349 1,541 (51) (25)
U.S. $ Millions 58 122 80 (52) (27)
Adjustments*
Ps. Millions 324 18 74 1,654 340
U.S. $ Millions 16 1 4 1,546 309
Comparable EBITDA
Ps. Millions 1,475 2,368 1,614 (38) (9)
U.S. $ Millions 74 123 84 (40) (12) *Adjustments: Inventory and non-operating, one-time (gains) losses
First Quarter 2020 (1Q20) |
[email protected] www.alpek.com 11
Plastics & Chemicals
TABLE 14 | REVENUES
(%) 1Q20 vs.
1Q20 4Q19 1Q19 4Q19 1Q19
Total Revenues
Ps. Millions 5,964 6,006 7,229 (1) (18)
U.S. $ Millions 300 311 376 (4) (20)
Domestic Revenues
Ps. Millions 3,348 3,568 4,313 (6) (22)
U.S. $ Millions 169 185 224 (9) (25)
Foreign Revenues
Ps. Millions 2,616 2,438 2,916 7 (10)
U.S. $ Millions 131 126 152 4 (14)
Foreign / Total (%) 44 41 40
TABLE 15 | OPERATING INCOME AND EBITDA
(%) 1Q20 vs.
1Q20 4Q19 1Q19 4Q19 1Q19
Operating Income
Ps. Millions 748 611 853 22 (12)
U.S. $ Millions 37 32 44 16 (17)
EBITDA
Ps. Millions 987 819 1,040 21 (5)
U.S. $ Millions 49 42 54 15 (10)
TABLE 16 | COMPARABLE EBITDA
(%) 1Q20 vs.
1Q20 4Q19 1Q19 4Q19 1Q19
EBITDA
Ps. Millions 987 819 1,040 21 (5)
U.S. $ Millions 49 42 54 15 (10)
Adjustments*
Ps. Millions 13 70 80 (81) (84)
U.S. $ Millions 1 4 4 (75) (78)
Comparable EBITDA
Ps. Millions 1,000 888 1,120 13 (11)
U.S. $ Millions 50 46 58 8 (15) *Adjustments: Inventory and non-operating, one-time (gains) losses
First Quarter 2020 (1Q20) |
[email protected] www.alpek.com 12
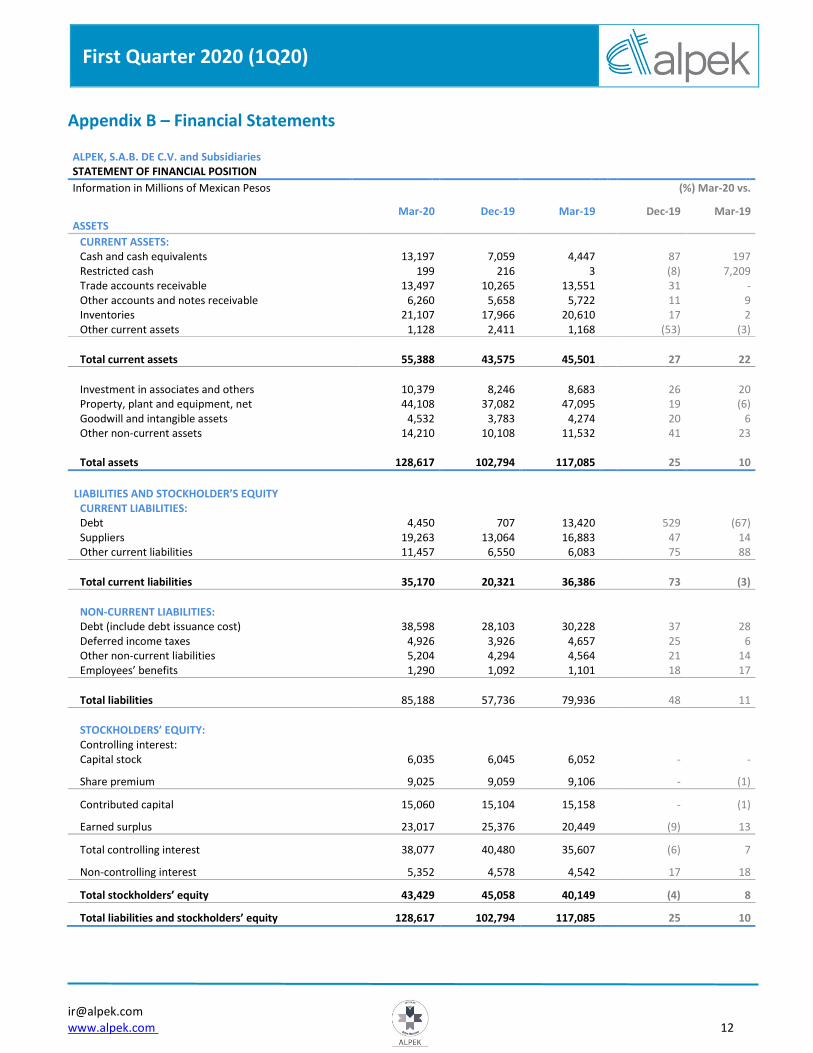
Appendix B – Financial Statements ALPEK, S.A.B. DE C.V. and Subsidiaries STATEMENT OF FINANCIAL POSITION
Information in Millions of Mexican Pesos (%) Mar-20 vs.
Mar-20 Dec-19 Mar-19 Dec-19 Mar-19 ASSETS
CURRENT ASSETS: Cash and cash equivalents 13,197 7,059 4,447 87 197 Restricted cash 199 216 3 (8) 7,209 Trade accounts receivable 13,497 10,265 13,551 31 - Other accounts and notes receivable 6,260 5,658 5,722 11 9 Inventories 21,107 17,966 20,610 17 2 Other current assets 1,128 2,411 1,168 (53) (3)
Total current assets 55,388 43,575 45,501 27 22
Investment in associates and others 10,379 8,246 8,683 26 20 Property, plant and equipment, net 44,108 37,082 47,095 19 (6) Goodwill and intangible assets 4,532 3,783 4,274 20 6 Other non-current assets 14,210 10,108 11,532 41 23 Total assets 128,617 102,794 117,085 25 10
LIABILITIES AND STOCKHOLDER’S EQUITY
CURRENT LIABILITIES: Debt 4,450 707 13,420 529 (67) Suppliers 19,263 13,064 16,883 47 14 Other current liabilities 11,457 6,550 6,083 75 88
Total current liabilities 35,170 20,321 36,386 73 (3)
NON-CURRENT LIABILITIES: Debt (include debt issuance cost) 38,598 28,103 30,228 37 28 Deferred income taxes 4,926 3,926 4,657 25 6 Other non-current liabilities 5,204 4,294 4,564 21 14 Employees’ benefits 1,290 1,092 1,101 18 17
Total liabilities 85,188 57,736 79,936 48 11
STOCKHOLDERS’ EQUITY: Controlling interest: Capital stock 6,035 6,045 6,052 - -
Share premium 9,025 9,059 9,106 - (1)
Contributed capital 15,060 15,104 15,158 - (1)
Earned surplus 23,017 25,376 20,449 (9) 13
Total controlling interest 38,077 40,480 35,607 (6) 7
Non-controlling interest 5,352 4,578 4,542 17 18
Total stockholders’ equity 43,429 45,058 40,149 (4) 8
Total liabilities and stockholders’ equity 128,617 102,794 117,085 25 10

First Quarter 2020 (1Q20) |
[email protected] www.alpek.com 13
ALPEK, S.A.B. DE C.V. and Subsidiaries STATEMENT OF INCOME
Information in Millions of Mexican Pesos (%) 1Q20 vs 1Q20 4Q19 1Q19 4Q19 1Q19
Revenues 28,522 27,133 31,567 5 (10) Domestic 8,037 7,837 8,776 3 (8) Export 20,485 19,296 22,791 6 (10)
Cost of sales (26,175) (23,883) (28,910) (10) 9
Gross profit 2,347 3,250 2,657 (28) (12)
Operating expenses and others (1,196) 2,584 (935) (146) (28)
Operating income 1,151 5,834 1,722 (80) (33) Financial result, net (1,883) (693) (429) (172) (339)
Equity in income of associates and joint ventures 59 (303) (3)
119 1,635
Income before taxes (673) 4,838 1,290 (114) (152) Income taxes 270 (628) (525) 143 151 Consolidated net income (loss) (403) 4,210 765 (110) (153)
Profit (loss) attributable to Controlling interest (453) 4,047 517 (111) (188)
Profit (loss) attributable to Non-controlling interest 50 163 248
(69)
(80)