first quarter 2021 financial report - solvay s.a
TRANSCRIPT

First quarter 2021
Financial report

May 5, 2021 First quarter 2021 financial report 2/24
Inside / regulated information Published on May 5, 2021, at 7:00 a.m.
Forenote Besides IFRS accounts, Solvay also presents alternative performance indicators to provide a more consistent and comparable indication of the Group’s underlying financial performance and financial position, as well as cash flows. These indicators provide a balanced view of the Group’s operations and are considered useful to investors, analysts and credit rating agencies as these measures provide relevant information on the Group’s past or future performance, position or cash flows. These indicators are generally used in the sector it operates in and therefore serve as a useful aid for investors to compare the Group’s performance with its peers. The underlying performance indicators adjust IFRS figures for the non-cash Purchase Price Allocation (PPA) accounting impacts related to acquisitions, for the coupons of perpetual hybrid bonds, classified as equity under IFRS but treated as debt in the underlying statements, for impairments and for other elements that would distort the analysis of the Group’s underlying performance. The comments on the results made on pages 3 to 8 are on an underlying basis, unless otherwise stated.
May 5, 2021 First quarter 2021 financial report 3/24
Underlying business review Highlights
• Net Sales in the first quarter of 2021 were up 1.9% organically driven by strong demand in automotive, with organic sales in Specialty Polymers up 10% year-on-year, exceptional performance in Coatis up 55%, and recovery in the mining industry driving Technology Solutions sales up 15%, whereas sales in composites were 37% lower.
• Net Sales grew 8.6% organically year on year excluding Composites and Oil & Gas, which still face challenges yet have shown sequential improvement versus the fourth quarter.
• Structural cost savings of €80 million achieved in Q1, up 78% versus Q4 2020. • Underlying EBITDA in Q1 2020 was up 10.3% organically yoy, and 7% higher than Q1 2019
on comparable FX & scope basis despite 3% lower sales, reflecting the impacts of significant cost reduction measures taken in the last 2 years. The underlying EBITDA margin increased yoy to a new record at 24.6% driven mainly by strong volume recovery in most markets and cost reductions measures, despite the adverse impacts such as increasing raw material and logistic prices as well as supply chain disruptions due to US storms and the Suez Canal blockage. This is 1.6 and 2.4 percentage points higher than Q1 2020 and Q1 2019, respectively.
• Underlying Net Profit was €240 million in Q1 2021, up 1.8% compared to Q1 2020. • Free Cash Flow in Q1 2021 amounted to €282 million, up 40% of Q1 2020, reflecting
continued working capital discipline even as activity levels increased, as well as the benefit of deleveraging debt and pensions. Total voluntary pension contributions of €0.8 billion since Q4 2019 generate an improvement of more than €100 million per annum.
• Progress on portfolio simplification, with the closure of 5 business line divestments in the first quarter and the last one occurring in Q2 2021.
• Reinvesting in Solvay One Planet, including a decision to invest further in energy transition at our Rheinberg Soda Ash plant with a complete phase out of coal. This action not only enables the site to be the lowest soda ash CO2 emitter globally (irrespective of production process being natural or synthetic), but also creates significant economic value.
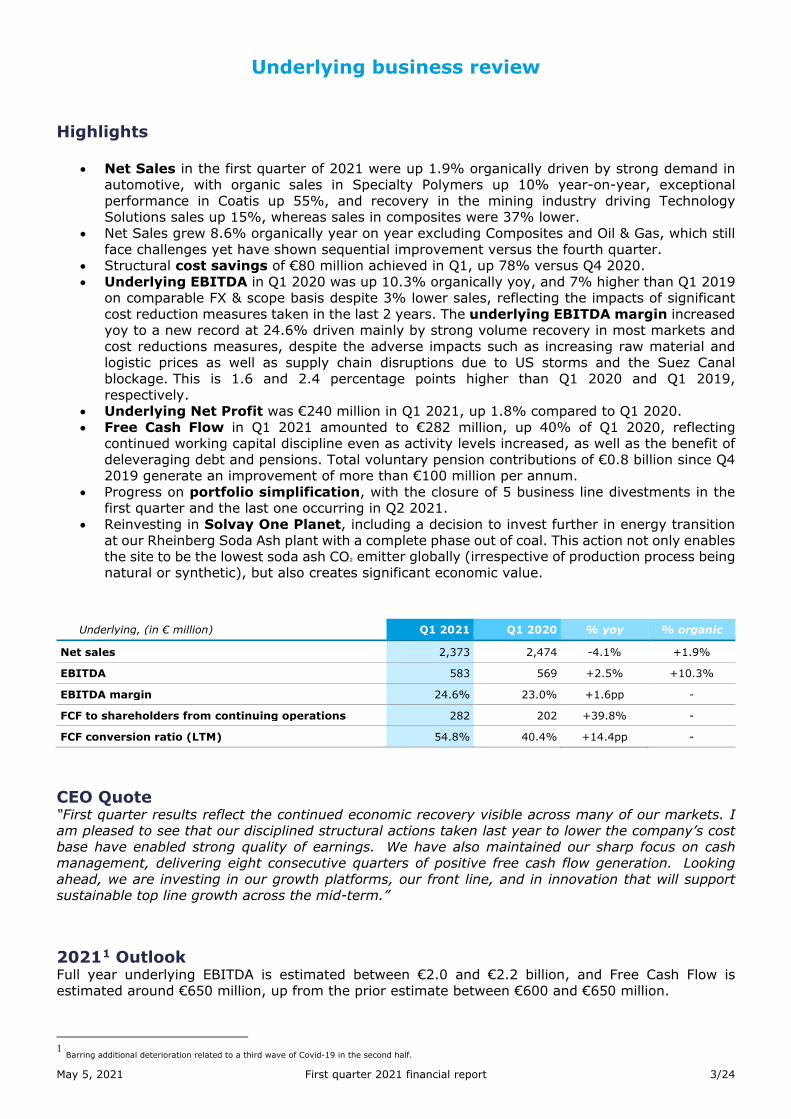
Underlying, (in € million) Q1 2021 Q1 2020 % yoy % organic Net sales 2,373 2,474 -4.1% +1.9%
EBITDA 583 569 +2.5% +10.3%
EBITDA margin 24.6% 23.0% +1.6pp -
FCF to shareholders from continuing operations 282 202 +39.8% -
FCF conversion ratio (LTM) 54.8% 40.4% +14.4pp -
CEO Quote “First quarter results reflect the continued economic recovery visible across many of our markets. I am pleased to see that our disciplined structural actions taken last year to lower the company’s cost base have enabled strong quality of earnings. We have also maintained our sharp focus on cash management, delivering eight consecutive quarters of positive free cash flow generation. Looking ahead, we are investing in our growth platforms, our front line, and in innovation that will support sustainable top line growth across the mid-term.” 20211 Outlook Full year underlying EBITDA is estimated between €2.0 and €2.2 billion, and Free Cash Flow is estimated around €650 million, up from the prior estimate between €600 and €650 million. 1 Barring additional deterioration related to a third wave of Covid-19 in the second half.

May 5, 2021 First quarter 2021 financial report 4/24
Key figures
Underlying key figures
(in € million) Q1 2021 Q1 2020 % yoy Net sales 2,373 2,474 -4.1% EBITDA 583 569 +2.5% EBITDA margin 24.6% 23.0% +1.6pp EBIT 382 371 +2.9% Net financial charges -63 -68 +8.4% Income tax expenses -70 -76 +7.7% Tax rate 24% 26% -2.7pp Profit from discontinued operations 1 21 n.m.
(Profit) / loss attributable to non-controlling interests -9 -11 -14.8%
Profit / (loss) attributable to Solvay shareholders 240 236 +1.8%
Basic earnings per share (in €) 2.33 2.28 +1.9% of which from continuing operations 2.31 2.08 +11.2%
Capex in continuing operations 100 163 -38.6%
FCF to Solvay shareholders from continuing operations 282 202 +39.8%
FCF to Solvay shareholders 282 197 +43.0%
FCF conversion ratio (LTM) 54.8% 40.4% +14.4pp
Net financial debt 4,157 Underlying leverage ratio 2.1
Group performance
Net sales Net sales of €2,373 million in Q1 2021 were down 4.1% due mainly to the 5.9% negative impact from currency and scope, but up 1.9% organically. First quarter sales (+7% sequentially), marks the third consecutive sequential increase, reflecting improving market conditions across most businesses, especially in automotive, electronics, mining and construction industries. Volume growth in each of these markets combined with a supportive pricing environment drove the organic sales increase, which was partially offset by lower volumes in civil aerospace. Geographically, all regions progressed sequentially, with sales in China up by 30% versus the first quarter 2020. Underlying EBITDA Underlying EBITDA of €583 million was up 2.5% (+10.3% organically) in Q1 2021 as a result of higher sales and €80 million of additional structural cost savings. As a result, the EBITDA margin reached a record 24.6% in the quarter.
Q1 2020
Scope Forexconversion
Volume& mix
Price
Q1 2021
2,474 -16 -130 +40 +4 2,373
+1.9%
-4.1%
Q1 2020
ScopeForex
conversionMaterialsChemicalsSolutions
CBS
Q1 2021
569 -12 -31 -10 +19 +32 +15 583
+10.7%
+2.5%

May 5, 2021 First quarter 2021 financial report 5/24
Free cash flow Free cash flow to shareholders from continuing operations reached €282 million, a 40% increase versus Q1 2020, reflecting continued discipline in working capital management, with working capital to sales ratio reaching 12% in Q1 2021. FCF was further supported by lower cash costs related to improvements in pension management. Underlying net debt Underlying net financial debt was roughly stable at €4.2 billion compared to December 2020, with strong free cash flow generation, the proceeds from divestments, the €52 million purchase of the EBRD shares in the Solvay holding of the Rusvinyl Joint Venture, and the €102 million additional voluntary pension contributions made in Belgium in January 2021. Credit ratings remain strong at BBB (S&P) and Baa2 (Moody’s), and the outlook is now stable for both agencies following a recent improvement in outlook by Moody’s. Provisions Provisions are down by €208 million to €2.9 billion compared to December 2020, primarily related to €102 million voluntary pension contributions in Belgium and the impact of higher discount rates, and despite a €174 million non-cash restructuring provision related to the cost savings plan announced in February. Solvay continues to make progress on its pension funding roadmap, with cumulative funding of €768 million since Q4 2019, which has significantly reduced annual pension cash costs by more than €100 million.
UnderlyingEBITDA
CapexWorkingcapital Provisions:
Employeebenefits -23
Environment -9Other -31
Taxes -40Other FCF -5 Financing:
Net interests -7Hybrid coupons -19
Dividends tonon-ctrl
interests -
FCF toSolvay
share fromcont. ops.
583 -100-66
-63-45
-26 282
December 31, 2020
FCF toSolvayshare-holders
Dividendsto Solvay
share-holders
Voluntary pension
contributions
In/outflowfrom M&A
Remeasu-rements
(forex) -56Changesin scope
& other -14
March 31, 2021
-4,198 282 -155-102 86 -70 -4,157
IFRSdebt
-2,357
Hybridbonds-1,800
Hybridbonds-1,800
IFRSdebt
-2,398
December 31, 2020
Payments Net newprovisions
Unwinding of provisions
Voluntary pension
contributions
Asset returnRemeasu-rements
Changesin scope& other
March 31, 2021
-3,087 63 -185 -22 102 -81 334-3 -2,879
Employeebenefits-1,854
Environ-ment-617
Environ-ment-614
Employeebenefits-2,209
Other Other

May 5, 2021 First quarter 2021 financial report 6/24
Performance by segments Net sales bridges
Net sales Q1 Underlying
(in € million) Q1 2020 Scope Forex
conversion Volume & mix Price Q1 2021
Solvay 2,474 -16 -130 40 4 2,373 Materials 789 -8 -36 -51 -5 689 Chemicals 800 -3 -52 29 16 791 Solutions 883 -4 -42 62 -8 891 CBS 1 - - 1 - 3
Materials Sales in Q1 2021 were down 12.7% (7.5% organically) as headwinds in civil aero continue to weigh on the segment; a significant part of the decline was supported by continued recovery in specialty polymers. Sales in Specialty Polymers increased by +6.3% (+10% organically) compared to the first quarter of 2020, and by +12% sequentially versus the fourth quarter 2020. This was driven by the continued strong demand in the automotive industry, partly related to the restocking effect. Automotive sales were up +19% versus Q1 2020, led by 80% growth in batteries for hybrid and electric vehicles. Other markets, including electronics and building were also solid, while healthcare was a bit softer than last year. Strong volume growth in Specialty Polymers was able to offset part of the headwinds related to civil aerospace. Composite Materials sales were down 42.3% (36.6% organically) year on year, but improved by +8.6% sequentially versus the fourth quarter 2020. As expected, civil aerospace remains challenged yet improved sequentially compared to Q4 2020, while the defense and space sectors remain resilient. Segment EBITDA decreased by 9.7% (4.7% organically) year on year, but was up +35% sequentially versus Q4, demonstrating the cost savings initiatives implemented in 2020, mainly attributed to the Composite Materials business following two plant closures. Pricing was sustained despite the various headwinds (raw material, supply chain and logistics issues). These initiatives supported a strong EBITDA margin of 29.9%. Chemicals First quarter 2021 sales in the segment were down 1.2% including forex and scope, but up +6.1% organically. Soda Ash sales continued to improve sequentially, though were still 5.9% lower (-3.0% organically) than Q1 2020. The continuing recovery in building sustained good demand in flat glass, while demand for container glass used in the HORECA (hospitality, restaurant and catering) industry remained weak. Peroxide sales were down by 11.1% (-4.7% organically), compared to Q1 2020, due to lower volumes in the pulp and paper markets in North America and Europe. Silica sales were again strong +2.6% yoy (+7.9% organically), thanks to rising demand in the automotive segment, market share gain, and interest in our recently launched innovations. Coatis had exceptional sales in this quarter, up +23.5% (+55% organically) with higher volumes and higher prices as a result of favorable market conditions. Segment EBITDA was up +0.6% compared to Q1 2020 (+8.7% organically), and increased sequentially by 14.6% versus the fourth quarter 2020, as a result of favorable market conditions in Coatis combined with lower fixed costs in the business, as well as significant contributions from Rusvinyl, driven by strong PVC demand and higher prices. This resulted in a record underlying EBITDA margin of 30.4% in Q1 2021.

May 5, 2021 First quarter 2021 financial report 7/24
Solutions Sales in the first quarter of 2021 were up +0.9% (+6.4% organically) due mainly to higher volumes across most major markets. First quarter sales in Novecare increased organically by 4.9% year on year, and increased organically by 13% excluding oil & gas; growth was driven by higher volumes in coatings, home & personal care, and agro markets. Oil & gas improved sequentially by +11% versus Q4, yet declined 31% year on year. Special Chem sales increased +2.7% (organically by +8.6%) year on year thanks to the continued recovery in the automotive industry and sustained strong demand in the electronics market. Technology Solutions sales increased by +9.4% (+14.5% organically) compared to Q1 2020 thanks to Copper mine site re-openings driving higher production levels and greater demand for our extractant solutions. Sequential sales versus Q4 improved by a similar magnitude. Aroma Performance sales increased sequentially by +11.6% in Q1 versus Q4, due to strong volumes across product lines, but were down organically by 1.6% compared to a very strong Q1 2020. The business is investing to increase capacity in natural vanilla to capture the opportunity in this fast growing market. First quarter EBITDA in the segment was up +12.4% (+21.1% organically) year and year, and up 26% sequentially, reflecting the continued recovery across most markets. EBITDA margin in the segment was up +2pp to 19.4% in Q1 2021, further reflecting our cost reduction improvements across all businesses. Key segment figures
Segment review Underlying
(in € million) Q1 2021 Q1 2020 % yoy % organic Net sales 2,373 2,474 -4.1% +1.9%
Materials 689 789 -12.7% -7.5% Specialty Polymers 511 481 +6.3% +10.0% Composite Materials 178 308 -42.3% -36.6%
Chemicals 791 800 -1.2% +6.1% Soda Ash & Derivatives 367 390 -5.9% -3.0% Peroxides 152 172 -11.1% -4.7% Coatis 157 127 +23.5% +55.1% Silica 114 111 +2.6% +7.9%
Solutions 891 883 +0.9% +6.4% Novecare 416 421 -1.3% +4.9% Special Chem 211 206 +2.7% +8.6% Technology Solutions 154 140 +9.4% +14.5% Aroma Performance 110 116 -5.0% -1.6%
Corporate & Business Services 3 1 +81.4% +94.1%
EBITDA 583 569 +2.5% +10.3% Materials 206 228 -9.7% -4.7% Chemicals 240 239 +0.6% +8.7% Solutions 173 154 +12.4% +21.1% Corporate & Business Services -36 -52 +30.3% -
EBITDA margin 24.6% 23.0% +1.6pp - Materials 29.9% 28.9% +1.0pp - Chemicals 30.4% 29.8% +0.5pp - Solutions 19.4% 17.4% +2.0pp -

May 5, 2021 First quarter 2021 financial report 8/24
Key IFRS figures
Q1 key figures IFRS Underlying
(in € million) Q1 2021 Q1 2020 % yoy Q1 2021 Q1 2020 % yoy Net sales 2,373 2,474 -4.1% 2,373 2,474 -4.1% EBITDA 414 485 -14.7% 583 569 +2.5% EBITDA margin 24.6% 23.0% +1.6pp EBIT 169 233 -27.5% 382 371 +2.9% Net financial charges -30 -27 -11.8% -63 -68 +8.4% Income tax expenses -25 -47 +46.2% -70 -76 +7.7% Tax rate 24% 26% -2.7pp Profit from discontinued operations - 102 n.m. 1 21 n.m. (Profit) / loss attributable to non-controlling interests -9 -11 -16.3% -9 -11 -14.8% Profit / (loss) attributable to Solvay shareholders 104 249 -58.3% 240 236 +1.8%
Basic earnings per share (in €) 1.01 2.41 -58.3% 2.33 2.28 +1.9% of which from continuing operations 1.01 1.43 -29.5% 2.31 2.08 +11.2%
Capex in continuing operations 100 163 -38.6% FCF to Solvay shareholders from continuing operations 282 202 +39.8%
FCF to Solvay shareholders 282 197 +43.0%
Net financial debt 4,157
Underlying leverage ratio 2.1

May 5, 2021 First quarter 2021 financial report 9/24
Supplementary information Reconciliation of alternative performance metrics Solvay measures its financial performance using alternative performance metrics, which can be found below. Solvay believes that these measurements are useful for analyzing and explaining changes and trends in its historical results of operations, as they allow performance to be compared on a consistent basis. Definitions of the different metrics presented here are included in the glossary at the end of this financial report.
Tax rate Underlying (in € million) Q1 2021 Q1 2020
Profit / (loss) for the period before taxes a 319 302 Earnings from associates & joint ventures b 29 21 Interests and realized foreign exchange gains (losses) on the RusVinyl joint venture c -7 -8 Income taxes d -70 -76
Tax rate e = -d/(a-b-c) 24% 26%
Free cash flow (FCF) (in € million) Q1 2021 Q1 2020
Cash flow from operating activities a 303 -58 of which voluntary pension contributions b -102 -460
Cash flow from investing activities c 7 1,095 of which capital expenditures required by share sale agreement d - -14
Acquisition (-) of subsidiaries e -2 -9 Acquisition (-) of investments - Other f -1 -24 Loans to associates and non-consolidated companies g 7 7 Sale (+) of subsidiaries and investments h 77 1,292 Increase/decrease of borrowings related to environmental remediation i - 5 Payment of lease liabilities j -22 -28
FCF k = a-b+c-d-e-f-g-h+i+j 308 220 FCF from discontinued operations l - -4
FCF from continuing operations m = k-l 308 225 Net interests paid n -7 -8 Coupons paid on perpetual hybrid bonds o -19 -13 Dividends paid to non-controlling interests p - -2
FCF to Solvay shareholders q = k+n+o+p 282 197 FCF to Solvay shareholders from discontinued operations r - -4
FCF to Solvay shareholders from continuing operations s = q-r 282 202 FCF to Solvay shareholders from continuing operations (LTM) t 1,043 898
Dividends paid to non-controlling interests from continuing operations (LTM) u -31 -39 Underlying EBITDA (LTM) v 1,959 2,319
FCF conversion ratio (LTM) w = (t-u)/v 54.8% 40.4%
Net working capital 2021 2020
(in € million) March
31 December
31 Inventories a 1,400 1,241 Trade receivables b 1,513 1,264 Other current receivables c 701 519 Trade payables d -1,426 -1,197 Other current liabilities e -907 -720
Net working capital f = a+b+c+d+e 1,281 1,107 Sales g 2,604 2,418 Annualized quarterly total sales h = 4*g 10,416 9,673 Net working capital / sales i = f / h 12.3% 11.4%

May 5, 2021 First quarter 2021 financial report 10/24
Capital expenditure (capex)
(in € million) Q1 2021 Q1 2020 Acquisition (-) of tangible assets a -64 -146 Acquisition (-) of intangible assets b -14 -22 Payment of lease liabilities c -22 -28
Capex d = a+b+c -100 -196 Capex in discontinued operations e - -33
Capex in continuing operations f = d-e -100 -163 Underlying EBITDA g 583 569 Cash conversion h = (f+g)/g 82.8% 71.3%
Net financial debt 2021 2020
(in € million) March
31 December
31 Non-current financial debt a -3,286 -3,233
Current financial debt b -491 -287 IFRS gross debt c = a+b -3,777 -3,519 Underlying gross debt d = c+h -5,577 -5,319
Other financial instruments e 133 119 Cash & cash equivalents f 1,287 1,002
Total cash and cash equivalents g = e+f 1,420 1,121 IFRS net debt i = c+g -2,357 -2,398
Perpetual hybrid bonds h -1,800 -1,800 Underlying net debt j = i+h -4,157 -4,198 Underlying EBITDA (LTM) k 1,959 1,945
Adjustment for discontinued operations l - - Adjusted underlying EBITDA for leverage calculation m = k+l 1,959 1,945
Underlying leverage ratio 2.1 2.2

May 5, 2021 First quarter 2021 financial report 11/24
Reconciliation of underlying income statement indicators Besides IFRS accounts, Solvay also presents underlying Income Statement performance indicators to provide a more consistent and comparable indication of Solvay’s economic performance. These figures adjust IFRS figures for the non-cash Purchase Price Allocation (PPA) accounting impacts related to acquisitions, for the coupons of perpetual hybrid bonds classified as equity under IFRS but treated as debt in the underlying statements, and for other elements to generate a measure that avoids distortion and facilitates the appreciation of performance and comparability of results over time. Q1 consolidated income statement Q1 2021 Q1 2020
(in € million) IFRS Adjust-ments
Under-lying IFRS
Adjust-ments
Under-lying
Sales 2,604 - 2,604 2,687 - 2,687 of which revenues from non-core activities 231 - 231 213 - 213 of which net sales 2,373 - 2,373 2,474 - 2,474
Cost of goods sold -1,869 - -1,869 -1,944 - -1,943 Gross margin 735 - 735 743 - 744
Commercial costs -71 - -71 -87 - -87 Administrative costs -220 - -220 -244 6 -238 Research & development costs -94 1 -93 -78 1 -78 Other operating gains & losses -36 38 2 -36 44 8 Earnings from associates & joint ventures 29 -1 29 4 17 21 Result from portfolio management & major restructuring -161 161 - -58 58 - Result from legacy remediation & major litigations -14 14 - -12 12 -
EBITDA 414 169 583 485 83 569 Depreciation, amortization & impairments -245 43 -201 -252 54 -198
EBIT 169 213 382 233 138 371 Net cost of borrowings -26 - -26 -26 - -26 Coupons on perpetual hybrid bonds - -20 -20 - -24 -24 Interests and realized foreign exchange gains (losses)
on the RusVinyl joint venture - -7 -7 - -8 -8
Cost of discounting provisions -4 -5 -9 -1 -10 -11 Profit / (loss) for the period before taxes 139 180 319 206 96 302
Income taxes -25 -45 -70 -47 -29 -76 Profit / (loss) for the period from continuing operations 113 135 248 159 67 226
Profit / (loss) for the period from discontinued operations - 1 1 102 -81 21
Profit / (loss) for the period 113 136 250 261 -13 247 attributable to Solvay shareholders 104 136 240 249 -13 236 attributable to non-controlling interests 9 - 9 11 - 11
Basic earnings per share (in €) 1.01 1.32 2.33 2.41 -0.13 2.28 of which from continuing operations 1.01 1.31 2.31 1.43 0.65 2.08
Diluted earnings per share (in €) 1.01 1.32 2.32 2.41 -0.13 2.28 of which from continuing operations 1.00 1.31 2.31 1.43 0.65 2.08

May 5, 2021 First quarter 2021 financial report 12/24
EBITDA on an IFRS basis totaled €414 million, versus €583 million on an underlying basis. The difference of €169 million is explained by the following adjustments to IFRS results, which are done to improve the comparability of underlying results:
• €-1 million in “Earnings from associates & joint ventures” for Solvay’s share in the financial charges of the Rusvinyl joint venture and the foreign exchange losses on the €-denominated debt of the joint venture, the Russian ruble being stable vs EUR over the period. These elements are reclassified in “Net financial charges”.
• €156 million to adjust for the “Result from portfolio management and major restructuring”, excluding depreciation, amortization and impairment elements, mainly related to the new restructuring plan launched in Q1 2021 (€150 million).
• €14 million to adjust for the “Result from legacy remediation and major litigations”, primarily indemnities for environmental remediation.
EBIT on an IFRS basis totaled €169 million, versus €382 million on an underlying basis. The difference of €213 million is explained by the above-mentioned €169 million adjustments at the EBITDA level and €43 million of “Depreciation, amortization & impairments”. The latter consist of:
• €38 million to adjust for the non-cash impact of purchase price allocation (PPA), consisting of amortization charges on intangible assets, which are adjusted in "Research & development costs" for €1 million, and in "Other operating gains & losses" for €38 million.
• €5 million to adjust for the impact of impairments reported in “Result from portfolio management and major restructuring” resulting primarily from the impairment of non performing assets
Net financial charges on an IFRS basis were €-30 million versus €-62 million on an underlying basis. The €-32 million adjustment made to IFRS net financial charges consists of:
• €-20 million reclassification of coupons on perpetual hybrid bonds, which are treated as dividends under IFRS, and as financial charges in underlying results.
• €-7 million reclassification of financial charges and realized foreign exchange result on the €-denominated debt of RusVinyl as net financial charges.
• €-5 million for the net impact of decreasing discount rates on the valuation of environmental liabilities in the period.
Income taxes on an IFRS basis were €-25 million, versus €-70 million on an underlying basis. The €-45 million adjustment mainly relates to the adjustments of the earnings before taxes described above. Profit / (loss) attributable to Solvay shareholders was €104 million on an IFRS basis and €240 million on an underlying basis. The delta of €136 million reflects the above-mentioned adjustments to EBIT, net financial charges, income taxes and minor adjustments for discontinued operations. There was no impact from non-controlling interests.

May 5, 2021 First quarter 2021 financial report 13/24
Condensed consolidated financial statements[1] Consolidated income statement IFRS (in € million) Q1 2021 Q1 2020 Sales 2,604 2,687
of which revenues from non-core activities 231 213 of which net sales 2,373 2,474
Cost of goods sold -1,869 -1,944 Gross margin 735 743
Commercial costs -71 -87 Administrative costs -220 -244 Research & development costs -94 -78 Other operating gains & losses -36 -36 Earnings from associates & joint ventures 29 4 Result from portfolio management & major restructuring [2] -161 -58 Result from legacy remediation & major litigations -14 -12
EBIT 169 233 Cost of borrowings -28 -29 Interest on loans & short term deposits 2 3 Cost of discounting provisions -4 -1
Profit / (loss) for the period before taxes 139 206 Income taxes -25 -47
Profit / (loss) for the period from continuing operations 113 159 attributable to Solvay shareholders 104 148 attributable to non-controlling interests 9 11
Profit / (loss) for the period from discontinued operations - 102 Profit / (loss) for the period 113 261
attributable to Solvay shareholders 104 249 attributable to non-controlling interests 9 11
Weighted average of number of outstanding shares, basic 103,276,287 103,313,847 Weighted average of number of outstanding shares, diluted 103,454,065 103,418,888 Basic earnings per share (in €) 1.01 2.41
of which from continuing operations 1.01 1.43 Diluted earnings per share (in €) 1.01 2.41
of which from continuing operations 1.00 1.43
Consolidated statement of comprehensive income IFRS (in € million) Q1 2021 Q1 2020
Profit / (loss) for the period 113 261 Gains and losses on hedging instruments in a cash flow hedge -11 -48 Currency translation differences from subsidiaries & joint operations 244 -2 Share of other comprehensive income of associates and joint ventures accounted for using equity method
that will be reclassified to profit or loss 11 -72
Recyclable components 244 -122 Gains and losses on equity instruments measured at fair value through other comprehensive income 3 1 Remeasurement of the net defined benefit liability [3] 273 35 Share of other comprehensive income of associates and joint ventures accounted for using equity method
that will not be reclassified to profit or loss - 1
Non-recyclable components 276 37 Income tax relating to components of other comprehensive income -46 -6
Other comprehensive income, net of related tax effects 474 -90 Total comprehensive income 588 170
attributed to Solvay share 574 157 attributed to non-controlling interests 13 13
[1] Unaudited. [2] Q1 2021 Result from portfolio management & major restructuring mainly relates to the €150 million provision in relation with the new strategic transformation announced in February, resulting in a net reduction of approximately 500 roles. [3] The remeasurement of the net defined benefit liability of €273 million in Q1 2021 was mainly due to increase of discount rates applicable to post-employment provisions in the Euro-zone, the UK and US, partly offset by the return of plan assets.

May 5, 2021 First quarter 2021 financial report 14/24
Consolidated statement of cash flows IFRS (in € million) Q1 2021 Q1 2020
Profit / (loss) for the period 113 261 Adjustments to profit / (loss) for the period 444 324
Depreciation, amortization & impairments (-) 245 252 Earnings from associates & joint ventures (-) -29 -4 Additions & reversals on provisions (-) 185 114 Other non-operating and non-cash items [1] -11 -312 Net financial charges (-) 29 27 Income tax expenses (-) 25 246
Changes in working capital -67 -137 Uses of provisions -63 -75 Voluntary pension contributions -102 -460 Dividends received from associates & joint ventures 18 3 Income taxes paid (excluding income taxes paid on sale of investments) -40 26
Cash flow from operating activities 303 -58 Acquisition (-) of subsidiaries -2 -9 Acquisition (-) of investments - Other -1 -24 Loans to associates and non-consolidated companies 7 7 Sale (+) of subsidiaries and investments 77 1,292 Acquisition (-) of tangible and intangible assets (capex) -78 -168
of which tangible assets -64 -146 of which capital expenditures required by share sale agreement - -14
of which intangible assets -14 -22 Sale (+) of tangible & intangible assets 10 5 Changes in non-current financial assets -7 -8
Cash flow from investing activities 7 1,095 Sale (acquisition) of treasury shares 37 -26 Increase in borrowings 161 249 Repayment of borrowings [2] -3 -845 Changes in other current financial assets -10 -22 Payment of lease liabilities -22 -28 Net interests paid -7 -8 Coupons paid on perpetual hybrid bonds -19 -13 Dividends paid -155 -157
of which to Solvay shareholders -155 -155 of which to non-controlling interests - -2
Other [3] -11 -62 Cash flow from financing activities -30 -913
of which increase/decrease of borrowings related to environmental remediation - 5 Net change in cash and cash equivalents 280 124
Currency translation differences -2 -44 Opening cash balance [4] 1,009 809
Closing cash balance 1,287 889
[1] Other non-operating and non-cash items of €-312 million in Q1 2020 mainly relates to Polyamide capital gain before taxes and provisions [2] Repayment of borrowings of €-845 million in Q1 2020 mainly relates to the reimbursement of commercial paper after the cash proceeds on Polyamide disposal. [3] Other cash flow from financing activities of €-11 million mainly includes the payment for the purchase of the EBRD shares in the Solvay holding of the Rusvinyl
Joint Venture, following the exercise of the Solvay call option (€-52m) and cash inflows related to margin calls (€+36m). [4] of which €7 million cash in assets held for sale at the end of 2020. Statement of cash flow from discontinued operations IFRS (in € million) Q1 2021 Q1 2020
Cash flow from operating activities 15 Cash flow from investing activities -33 Cash flow from financing activities - 5
Net change in cash and cash equivalents -13
The cash flow from investing activities of discontinued operations excludes the proceeds received on the divestment of Polyamide. The sale of Polyamide was completed on January 31, 2020.

May 5, 2021 First quarter 2021 financial report 15/24
Consolidated statement of financial position 2021 2020
(in € million) March
31 December
31 Intangible assets 2,154 2,141
Goodwill 3,328 3,265
Tangible assets 4,752 4,717
Right-of-use assets 408 405
Equity instruments measured at fair value through other comprehensive income 70 66
Investments in associates & joint ventures 520 495 Other investments 42 42 Deferred tax assets 735 788 Loans & other assets 402 390
Non-current assets 12,411 12,308 Inventories 1,400 1,241 Trade receivables 1,513 1,264 Income tax receivables 108 109 Dividends receivable 3 - Other financial instruments 133 119 Other receivables 701 519 Cash & cash equivalents 1,287 1,002 Assets held for sale 67 229
Current assets 5,212 4,484 Total assets 17,624 16,792
Share capital 1,588 1,588 Issue premiums 1,170 1,170 Other reserves 5,033 4,439 Non-controlling interests 118 106
Total equity 7,909 7,304 Provisions for employee benefits 1,854 2,209 Other provisions 700 689 Deferred tax liabilities 493 487 Financial debt 3,286 3,233 Other liabilities 100 95
Non-current liabilities 6,433 6,713 Other provisions 324 190 Financial debt [1] 491 287 Trade payables 1,426 1,197 Income tax payables 110 113 Dividends payable 5 159 Other liabilities 907 720 Liabilities associated with assets held for sale 17 110
Current liabilities 3,281 2,775 Total equity & liabilities 17,624 16,792
[1] The current financial debt (€491 million at the end of March 2021) is composed of short term financing (which include €96
million of short term portion of leases).

May 5, 2021 First quarter 2021 financial report 16/24
Consolidated statement of changes in equity Revaluation reserve
(fair value)
(in € million) Share capital
Share premiums
Treasury shares
Perpetual hybrid bonds
Retained earnings
Currency translation differences
Equity instruments measured at
fair value through other
comprehensive income
Cash flow
hedges
Defined benefit
pension plans
Total other
reserves
Non-controlling interests
Total equity
Balance on December 31, 2019 1,588 1,170 -274 1,789 6,462 -454 10 -20 -756 6,757 110 9,625 Profit / (loss) for the period - - - - 249 - - - - 249 11 261 Items of other comprehensive
income - - - - - -76 1 -33 15 -93 2 -90
Comprehensive income - - - - 249 -76 1 -33 15 157 13 170 Cost of stock options - - - - 1 - - - - 1 - 1 Dividends - - - - - - - - - - -2 -2 Coupons of perpetual hybrid bonds - - - - -13 - - - - -13 - -13 Sale (acquisition) of treasury shares - - -26 - - - - - - -26 - -26 Other - - - - -6 - - - 5 -1 - -1
Balance on March 31, 2020 1,588 1,170 -300 1,789 6,694 -530 11 -53 -736 6,875 122 9,754 Balance on December 31, 2020 1,588 1,170 -286 1,786 4,985 -1,153 12 14 -919 4,439 106 7,304
Profit / (loss) for the period - - - - 104 - - - - 104 9 113 Items of other comprehensive
income - - - - - 251 2 -9 226 470 4 474
Comprehensive income - - - - 104 251 2 -9 226 574 13 588 Cost of stock options - - - - 2 - - - - 2 - 2 Dividends - - - - - - - - - - -1 -2 Coupons of perpetual hybrid bonds - - - - -19 - - - - -19 - -19 Sale (acquisition) of treasury shares - - 37 - - - - - - 37 - 37 Other - - - - -10 - - - 10 - - -
Balance on March 31, 2021 1,588 1,170 -249 1,786 5,062 -902 14 5 -683 5,033 118 7,909
Q1 2021 Equity increased by € 251 million after currency translation differences mainly due to the USD revaluation against EUR in the quarter.

May 5, 2021 First quarter 2021 financial report 17/24
Notes to the condensed consolidated financial statements 1. General information and significant events Solvay is a public limited liability company governed by Belgian law and quoted on Euronext Brussels and Euronext Paris. These condensed consolidated financial statements were authorized for issue by the Board of Directors on May 4, 2021. On January 18, 2021 Solvay sent a Call option Notice to the European Bank for Reconstruction and Development (EBRD) to purchase the EBRD shares in the Solvay holding of the Rusvinyl Joint Venture. The option price of €52 million was booked as an Other current liability at the end of 2020 and has been paid in Q1 2021. An additional voluntary contribution of €102 million was made in January 2021 to the Belgian pension plans. In January, Solvay launched a new chapter of its strategic transformation aimed to further align its structure to its G.R.O.W. strategy. This builds on previous plans announced in 2020, and represents a profound simplification of all support functions to serve the business more effectively. The plan will lead to an additional net reduction of approximately 500 roles by the end of 2022 and incremental cost savings of €75 million. As a consequence of the new restructuring plan, a non-cash restructuring provision of around €150 million was recognized in Q1 2021. In February, Solvay reached an agreement to purchase a seed coating technology to bolt-on to its existing agro products within the Novecare business. This is a natural extension to Solvay’s own AgRHO® family of sustainable seed boosting solutions and supports the drive toward more bio-based, sustainable technologies. The transaction is expected to close in Q2 2021. Assets held for sale During Q1, 2021, the assets and liabilities related to the following businesses previously classified as “held for sale” were divested: - the Peroxides sodium chlorate business line and related assets in Povoa (Portugal), - the various fluorine chemicals assets in Onsan, South Korea, part of Special Chem, - the Peroxides sodium percarbonate business line and related assets in Bad Hönningen (Germany), - the Barium Strontium business and the joint venture with Chemical Products Corporation (CPC) and – the Process Materials business (part of Composites) At the end of March 2021, the commodity amphoterics surfactants activities in Novecare, are the only business still classified as held for sale. COVID-19 impact The total net impact of COVID-19 on Q1 2021 EBITDA was not considered to be material to the Group as the short-term mitigation actions related to labor costs (including furloughs) and indirect spend were substantially completed at December 31, 2020. The Group will continue to monitor any future evolution of the sanitary crisis. 2. Accounting policies Solvay prepares its condensed consolidated interim financial statements on a quarterly basis, in accordance with IAS 34 “Interim Financial Reporting” using the same accounting policies as those adopted for the preparation of the consolidated financial statements for the year ended December 31, 2020. They do not include all the information required for the preparation of the annual consolidated financial statements and should be read in conjunction with the consolidated financial statements for the year ended December 31, 2020. The consolidated financial statements for 2020 were published in April 2021. The critical accounting judgments and key sources of estimation uncertainty included in the 2020 annual report remain applicable. Relevant updates on specific topics are included in these notes and should be read together with the 2020 annual report. During Q1, 2021, IBOR Reform Phase 2 became effective for the Group and its adoption did not have an impact on the consolidated financial statements during the period. Going forward the Group’s management will continue to monitor the market evolution resulting from the decisions taken by each of the relevant authorities of such benchmarks, however, based on the current understanding IBOR Reform Phase 2 is not expected to have more than an insignificant impact on the Group’s consolidated financial statements.

May 5, 2021 First quarter 2021 financial report 18/24
3. Segment information Solvay is organized in the following operating segments:
● Materials offer a unique portfolio of high-performance polymers and composite technologies used primarily in sustainable mobility applications. Its solutions enable weight reduction and enhance performance while improving CO2 and energy efficiency. Major markets served include next-generation mobility in automotive and aerospace, healthcare and electronics.
● Chemicals host chemical intermediate businesses focused on mature and resilient markets. Solvay is a world leader in soda ash and peroxides and major markets served include building and construction, consumer goods and food. Its Silica, Coatis and RusVinyl businesses are also high quality assets with strong positions in their markets. This segment provides resilient cash flows and the company selectively invests in these businesses to become the #1 cash conversion chemical player.
● Solutions offer a unique formulation & application expertise through customized specialty formulations for surface chemistry & liquid behavior, maximizing yield and efficiency of the processes they are used in while minimizing the eco-impact. Novecare, Technology Solutions, Aroma and Special Chem focus on specific areas such as resources (improving the extraction yield of metals, minerals and oil), industrial applications (such as coatings) or consumer goods and healthcare (including vanillin and guar for home and personal care).
● Corporate & Business Services includes corporate and other business services, such as Group research & innovation or energy services, whose mission is to optimize energy consumption and reduce CO2 emissions.
Reconciliation of segment, underlying and IFRS data
(in € million) Q1 2021 Q1 2020 Net sales 2,373 2,474
Materials 689 789 Chemicals 791 800 Solutions 891 883 Corporate & Business Services 3 1
Underlying EBITDA 583 569 Materials 206 228 Chemicals 240 239 Solutions 173 154 Corporate & Business Services -36 -52
Underlying depreciation, amortization & impairments -201 -198
Underlying EBIT 382 371 Non-cash accounting impact from amortization & depreciation of purchase price allocation (PPA) from
acquisitions -38 -51
Net financial charges and remeasurements of equity book value of the RusVinyl joint venture 1 -17 Result from portfolio management & major restructuring -161 -58 Result from legacy remediation & major litigations -14 -12
EBIT 169 233 Net financial charges -30 -27
Profit / (loss) for the period before taxes 139 206 Income taxes -25 -47
Profit / (loss) for the period from continuing operations 113 159 Profit / (loss) for the period from discontinued operations - 102
Profit / (loss) for the period 113 261 attributable to non-controlling interests 9 11
attributable to Solvay shareholders 104 249
The non-cash PPA impacts can be found in the reconciliation table on page 11.

May 5, 2021 First quarter 2021 financial report 19/24
4. Financial Instruments Valuation techniques Compared to December 31, 2020, there are no changes in valuation techniques. Fair value of financial instruments measured at amortized cost For all financial instruments not measured at fair value in Solvay’s consolidated statement of financial position, the fair value of those financial instruments as of March 31, 2021, is not significantly different from the ones published in Note F35 of the consolidated financial statements for the year ended December 31, 2020. Financial instruments measured at fair value For financial instruments measured at fair value in Solvay’s consolidated statement of financial position, the fair value of those instruments as of March 31, 2021, is not significantly different from the ones as published in the Note F35 of the consolidated financial statements for the year ended December 31, 2020. 5. Events after the reporting period There were no material events after the reporting period. 6. Declaration by responsible persons Ilham Kadri, Chief Executive Officer, and Karim Hajjar, Chief Financial Officer, of the Solvay Group, declare that to the best of their knowledge:
● The condensed consolidated financial information, prepared in accordance with IAS 34 “Interim Financial Reporting” as adopted by the European Union, reflects a faithful image of the assets and liabilities, financial situation and results of the Solvay Group;
● The management report contains a faithful presentation of significant events occurring during the first three months of 2021, and their impact on the condensed consolidated financial information;
● The main risks and uncertainties are in accordance with the assessment disclosed in the Risk Management section of the Solvay 2020 Annual Integrated Report, taking into account the current economic and financial environment.

May 5, 2021 First quarter 2021 financial report 20/24
Glossary Adjustments: Each of these adjustments made to the IFRS results is considered to be significant in nature and/or value. Excluding these items from the profit metrics provides readers with relevant additional information on the Group’s underlying performance over time because it is consistent with how the business’ performance is reported to the Board of Directors and the Executive Committee. These adjustments consist of:
• Results from portfolio management and major restructurings, • Results from legacy remediation and major litigations, • Amortization of intangible assets resulting from Purchase Price Allocation (PPA) and inventory step-up in
gross margin, • Net financial results related to changes in discount rates, coupons of hybrid bonds deducted from equity
under IFRS and debt management impacts (mainly including gains/(losses) related to the early repayment of debt,
• Adjustments of equity earnings for impairment gains or losses and unrealized foreign exchange gains or losses on debt,
• Results from equity instruments measured at fair value through other comprehensive income, • Tax effects related to the items listed above and tax expense or income of prior years • All adjustments listed above apply to both continuing and discontinuing operations, and include the
impacts on non-controlling interests Basic earnings per share: Net income (Solvay’s share) divided by the weighted average number of shares, after deducting own shares purchased to cover stock option programs. Capital expenditure (capex): Cash paid for the acquisition of tangible and intangible assets presented in cash flows from investing activities, and cash paid on the lease liabilities (excluding interests paid), presented in cash flows from financing activities. This indicator is used to manage capital employed in the Group. Cash conversion: Is a ratio used to measure the conversion of EBITDA into cash. It is defined as (Underlying EBITDA + Capex from continuing operations) / Underlying EBITDA. CFROI: Cash Flow Return On Investment measures the cash returns of Solvay’s business activities. Movements in CFROI levels are relevant indicators for showing whether economic value is being added, though it is accepted that this measure cannot be benchmarked or compared with industry peers. The definition uses a reasonable estimate (management estimate) of the replacement cost of assets and avoids accounting distortions, e.g. for impairments. It is calculated as the ratio between recurring cash flow and invested capital, where:
• Recurring cash flow = Underlying EBITDA + (Dividends from associates and joint ventures – Underlying Earnings from associates and joint ventures) + Recurring capex + Recurring income taxes;
• Invested capital = Replacement value of goodwill & fixed assets + Net working capital + Carrying amount of associates and joint ventures;
• Recurring capex is normalized at 2,3% of the Replacement value of fixed assets net of Goodwill; • Recurring income taxes are normalized at 28% of (Underlying EBIT – Underlying Earnings from associates
and joint ventures); CTA: Currency Translation Adjustment Diluted earnings per share: Net income (Solvay’s share) divided by the weighted average number of shares adjusted for the effects of dilution. Discontinued operations: Component of the Group which the Group has disposed of or which is classified as held for sale, and:
• Represents a separate major line of business or geographical area of operations; • Is part of a single coordinated plan to dispose of a separate major line of business or geographical area
of operations; or • Is a subsidiary acquired exclusively with a view to resale
EBIT: Earnings before interest and taxes. Performance indicator that is a measure of the Group’s operating profitability irrespective of the funding’s structure. EBITDA: Earnings before interest and taxes, depreciation and amortization. The Group has included EBITDA as an alternative performance indicator because management believes that the measure provides useful information to assess the Group’s operating profitability as well as the Group’s ability to generate operating cash flows.

May 5, 2021 First quarter 2021 financial report 21/24
Extra-financial indicators: Indicators used that measure the sustainability performance of the company in complement to financial indicators. Solvay has selected 10 indicators that are included in the ONE Planet initiative. For more information, we refer to the last available annual report available on www.solvay.com Free cash flow: Cash flows from operating activities (excluding cash flows linked to acquisitions or disposals of subsidiaries and cash outflows of Voluntary Pension Contributions, as they are deleveraging in nature as a reimbursement of debt), cash flows from investing activities (excluding cash flows from or related to acquisitions and disposals of subsidiaries, cash flows related to internal management of portfolio (one-off external costs of internal carve-out, related taxes...) and other investments, and excluding loans to associates and non-consolidated investments, and recognition of factored receivables), payment of lease liabilities, and increase/decrease of borrowings related to environmental remediation. Prior to the adoption of IFRS 16, operating lease payments were included within free cash flow. Following the application of IFRS 16, because leases are generally considered to be operating in nature, free cash flow incorporates the payment of the lease liability (excluding the interest expense). Excluding this item in the free cash flow would result in a significant improvement of free cash flow compared to prior periods, whereas the operations themselves have not been affected by the implementation of IFRS 16. It is a measure of cash generation, working capital efficiency and capital discipline of the Group. Free cash flow to Solvay shareholders: Free cash flow after payment of net interests, coupons of perpetual hybrid bonds and dividends to non-controlling interests. This represents the cash flow available to Solvay shareholders, to pay their dividend and/or to reduce the net financial debt. Free cash flow conversion: Calculated as the ratio between the free cash flow to Solvay shareholders of the last rolling 12 months (before netting of dividends paid to non-controlling interest) and underlying EBITDA of the last rolling 12 months. GBU: Global business unit. HPPO: Hydrogen peroxide propylene oxide, new technology to produce propylene oxide using hydrogen peroxide. IFRS: International Financial Reporting Standards. LTM: Last twelve months Leverage ratio: Net debt / underlying EBITDA of last 12 months. Underlying leverage ratio = underlying net debt / underlying EBITDA of last 12 months. Mandatory contributions to employee benefits plans: For funded plans, contributions to plan assets corresponding to amounts required to be paid during the respective period, in accordance with agreements with trustees or regulation, as well as, for unfunded plans, benefits paid to beneficiaries. Net cost of borrowings: cost of borrowings netted with interest on loans and short-term deposits, as well as other gains (losses) on net indebtedness. Net financial debt: Non-current financial debt + current financial debt – cash & cash equivalents – other financial instruments. Underlying net debt reclassifies as debt 100% of the hybrid perpetual bonds, considered as equity under IFRS. It is a key measure of the strength of the Group’s financial position and is widely used by credit rating agencies. Net financial charges: Net cost of borrowings, and costs of discounting provisions (namely, related to post-employment benefits and Health Safety and Environmental liabilities). Net pricing: The difference between the change in sales prices versus the change in variable costs. Net sales: Sales of goods and value added services corresponding to Solvay’s know-how and core business. Net sales exclude Revenue from non-core activities. Net working capital: Includes inventories, trade receivables and other current receivables, netted with trade payables and other current liabilities.

May 5, 2021 First quarter 2021 financial report 22/24
OCI: Other Comprehensive Income. Operational deleveraging: Reduction of liabilities (net debt or provisions) through operational performance only, i.e. excluding impacts from acquisitions and divestitures, as well as remeasurement impacts (changes of foreign exchange, inflation, mortality and discount rates). Organic growth: Growth of Net sales or underlying EBITDA excluding scope changes and forex conversion effects. The calculation is made by rebasing the prior period at the business scope and forex conversion rate of the current period. PA: Polyamide, polymer type. pp: Unit of percentage points, used to express the evolution of ratios. PPA: Purchase Price Allocation (PPA) accounting impacts related to acquisitions, primarily for Rhodia and Cytec. Pricing power: The ability to create positive net pricing. PSU: Performance Share Unit. PVC: Polyvinyl chloride, polymer type. Research & innovation: Research & development costs recognized in the income statement and as capital expenditure before deduction of related subsidies, royalties and depreciation and amortization expense. It measures the total cash effort in research & innovation, regardless of whether the costs were expensed or capitalized. Research & innovation intensity: Ratio of Research & innovation / net sales Result from legacy remediation and major litigations: It includes:
• The remediation costs not generated by on-going production facilities (shut-down of sites, discontinued productions, previous years’ pollution), and
• The impact of significant litigations Results from portfolio management and major restructuring: It includes:
• Gains and losses on the sale of subsidiaries, joint operations, joint ventures, and associates that do not qualify as discontinued operations;
• Acquisition costs of new businesses; • One-off operating external costs related to internal management of portfolio (carve-out of major lines of
businesses); • Gains and losses on the sale of real estate not directly linked to an operating activity; • Restructuring charges driven by portfolio management and by major reorganization of business activities,
including impairment losses resulting from the shutdown of an activity or a plant; • Impairment losses resulting from testing of Cash Generating Units (CGUs); • It excludes non-cash accounting impact from amortization and depreciation resulting from the purchase
price allocation (PPA) from acquisitions Revenue from non-core activities: Revenues primarily comprising commodity and utility trading transactions and other revenue, considered to not correspond to Solvay’s know-how and core business. ROCE: Return on Capital Employed, calculated as the ratio between underlying EBIT (before adjustment for the amortization of PPA) and capital employed. Capital employed consists of net working capital, tangible and intangible assets, goodwill, rights-of-use assets, investments in associates & joint ventures and other investments, and is taken as the average of the situation at the end of the last 4 quarters. SBTi: Science-based target initiative SOP: Stock Option Plan. SPM: The Sustainable Portfolio Management tool is integrated into the Solvay Way framework (linked to five practices). It serves as a strategic tool for developing information on our portfolio and analyzing the impacts of sustainability megatrends on our businesses.

May 5, 2021 First quarter 2021 financial report 23/24
Underlying: Underlying results are deemed to provide a more comparable indication of Solvay’s fundamental performance over the reference periods. They are defined as the IFRS figures adjusted for the “Adjustments” as defined above. They provide readers with additional information on the Group’s underlying performance over time as well as the financial position and they are consistent with how the business’ performance and financial position are reported to the Board of Directors and the Executive Committee. Underlying Tax rate: Income taxes / (Result before taxes – Earnings from associates & joint ventures – interests & realized foreign exchange results on RusVinyl joint venture) – all determined on an Underlying basis. The adjustment of the denominator regarding associates and joint ventures is made as these contributions are already net of income taxes. This provides an indication of the tax rate across the Group. Voluntary pension contributions: Contributions to plan assets in excess of Mandatory Contributions to employee benefits plans. These payments are discretionary and are driven by the objective of value creation. These voluntary contributions are excluded from free cash flow as they are deleveraging in nature as a reimbursement of debt. WACC: Weighted Average Cost of Capital yoy: Year on year comparison.

May 5, 2021 First quarter 2021 financial report 24/24
Contacts Investor relations Media relations Jodi Allen Nathalie Van Ypersele +1 609 860 4608 +32 478 20 10 62 [email protected] Geoffroy d’Oultremont +32 2 264 29 97 Brian Carroll +32 2 264 15 30 Bisser Alexandrov [email protected] +32 2 264 36 87 [email protected] Peter Boelaert +32 479 30 91 59 [email protected] Safe harbor This press release may contain forward-looking information. Forward-looking statements describe expectations, plans, strategies, goals, future events or intentions. The achievement of forward-looking statements contained in this press release is subject to risks and uncertainties relating to a number of factors, including general economic factors, interest rate and foreign currency exchange rate fluctuations, changing market conditions, product competition, the nature of product development, impact of acquisitions and divestitures, restructurings, products withdrawals, regulatory approval processes, all-in scenario of R&I projects and other unusual items. Consequently, actual results or future events may differ materially from those expressed or implied by such forward-looking statements. Should known or unknown risks or uncertainties materialize, or should our assumptions prove inaccurate, actual results could vary materially from those anticipated. Solvay undertakes no obligation to publicly update or revise any forward-looking statements. About Solvay Solvay is a science company whose technologies bring benefits to many aspects of daily life. With more than 23,000 employees in 64 countries, Solvay bonds people, ideas and elements to reinvent progress. The Group seeks to create sustainable shared value for all, notably through its Solvay One Planet plan crafted around three pillars: protecting the climate, preserving resources and fostering better life. The Group’s innovative solutions contribute to safer, cleaner, and more sustainable products found in homes, food and consumer goods, planes, cars, batteries, smart devices, health care applications, water and air purification systems. Founded in 1863, Solvay today ranks among the world’s top three companies for the vast majority of its activities and delivered net sales of €9.0 billion in 2020. Solvay is listed on Euronext Brussels (SOLB) and Paris and in the United States, where its shares (SOLVY) are traded through a Level I ADR program. Learn more at www.solvay.com. About Solvay Investor Relations Results’ documentation G.R.O.W. Strategy Share information Credit information ESG information Annual report Webcasts, podcasts and presentations

www.solvay.com/en/investors
Our SolvaLite™ composites are up to40% lighter than metal, allowingmanufacturers to create lighter andmore energy-efficient vehicles thatcontribute to reducing CO2 emissions.