first quarter, june 2020 - canadian solar inc
TRANSCRIPT

Investor PresentationFirst Quarter, June 2020

2
Safe Harbor Statement
This presentation has been prepared by the Company solely to facilitate the understanding of the Company’s businessmodel and growth strategy. The information contained in this presentation has not been independently verified. Norepresentation, warranty or undertaking, express or implied, is made as to, and no reliance should be placed on, thefairness, accuracy, completeness or correctness of the information or the opinions contained herein. None of theCompany or any of its affiliates, advisers or representatives will be liable (in negligence or otherwise) for any losshowsoever arising from any use of this presentation or its contents or otherwise arising in connection with thepresentation.
This presentation contains forward-looking statements and management may make additional forward-lookingstatements in response to your questions. Such written and oral disclosures are made pursuant to the Safe Harborprovisions of the U.S. Private Securities Litigation Reform Act of 1995. These forward looking statements includedescriptions regarding the intent, belief or current expectations of the Company or its officers with respect to its futureperformance, consolidated results of operations and financial condition. These statements can be identified by the use ofwords such as “expects,” “plans,” “will,” “estimates,” “projects,” or words of similar meaning. Such forward-lookingstatements are not guarantees of future performance and involve risks and uncertainties. Actual results may differmaterially from expectations implied by these forward-looking statements as a result of various factors and assumptions.Although we believe our expectations expressed in such forward looking statements are reasonable, we cannot assureyou that they will be realized, and therefore we refer you to a more detailed discussion of the risks and uncertaintiescontained in the Company’s annual report on Form 20-F as well as other documents filed with the Securities & ExchangeCommission. In addition, these forward looking statements are made as of the current date, and the Company does notundertake to update forward-looking statements to reflect future events or circumstances, unless otherwise required bylaw.

3
Table of Contents
1 Company Overview2 Market Opportunity3 Energy Business4 Module and System Solutions5 Financial Highlights

4
Leading solar energy company: global project developer and module manufacturer Founded in 2001 in Ontario, CanadaListed on the NASDAQ as CSIQ in 2006Presence in 23 countries/regions Over 13,000 employees
Company introduction
Energy Business
We develop, build, operate, sell and own solar power plants across 19 countries/territories 17.5 GW of total project pipeline and in operation: 1 GWp in operation, 0.8 GWp in construction, 3.7 GWp in backlog and 12 GWp in pipeline
Module and System Solutions (MSS)
We manufacture solar modules and deliver solar system solutions such as system kits, inverters and EPC services Top tier bankable brand (1) and innovator in solar cell and module technologies with 13 GW of total capacity and cumulatively shipped 43 GW+ to over 150 countries
(1) For definition of solar bankability, see slide 27.
Key 2019 numbersShipments 8.6 GW, revenue $3.2 bn Gross profit margin 22.4%, net income $172 mnTotal assets: $5.5 bn, total equity (book): $1.4 bn

5
Global footprint in project development & module manufacturing and sales
North AmericaCanadaGuelph: Global HQCalgary
U.S. Walnut Creek: North America HQSan FranciscoAustinNew York CityPrinceton
Middle East and Africa U.A.E.Abu DhabiDubai
South AfricaCape Town
Asia Pacific P.R. China Suzhou: China HQ BeijingShanghaiChangshu FuningYanchengDafengLuoyangBaotouTaiyuanHong Kong, SAR
Taiwan, ChinaTaipei Hsinchu
Japan Tokyo OsakaFukuokaSendaiNagoyaKawaguchi
South KoreaSeoul
EuropeGermany Spain PolandMunich: EMEA MSS HQ Madrid: EMEA Energy HQ Warsaw
U.K. ItalyLondon Milan India
New Delhi
ThailandChonburi
VietnamHai Phong
MalaysiaKuala Lumpur
SingaporeSingapore
AustraliaMelborne Sydney BrisbaneToowoomba
Manufacturing operations
Latin America Brazil São PauloSorocaba
MexicoMexico City
ArgentinaBuenos Aires
Our success is driven by our global-local teams and our culture of diversity
41 offices, of which:• Energy: 26 offices across
17 countries/regions• MSS: 32 offices across
18 countries/regions15 factories in 6 countries/regions
Note: Certain offices are shared between the Energy and MSS businesses.

6
1,330 1,7482,492 2,747 2,713
2,169 2,481324
1,213
976106
677 1,576 719
1,654
2,9613,468
2,8533,390
3,7453,201
1,894 MW3,105 MW
4,706 MW 5,232 MW
6,828 MW 6,615 MW
8,579 MW
10,000-12,000 MW
-6,000
-4,000
-2,000
0
2,000
4,000
6,000
8,000
10,000
12,000
0
1,000
2,000
3,000
4,000
5,000
6,000
7,000
8,000
2013 2014 2015 2016 2017 2018 2019 2020 Guidance
16.7% 19.6% 16.6% 14.6% 18.8% 20.7% 22.4%2013-19CAGR:
+30%
+12%
Total Revenue (USD millions) and Module Shipments (MW)
$32 mn $240 mn $172 mn $65 mn $100 mn $237 mn $172 mn
8.1% 33.4% 21.0% 7.4% 9.6% 19.3% 12.3%
Net Income (2)
ROE (2)
Solid operational and financial performance over the past 7 years
Module and System
Solutions (1)
Energy Business
(1) Includes intercompany transaction elimination effect from internal sales from MSS to Energy business. (2) Net income and equity of Canadian Solar Inc. shareholders, excluding minority interests.
$1 billion
16.0%>>
>>
Cumulative net income
Avg. ROE
Industry leading
gross margins

7
Strong balance sheet and liquidity supporting
growth opportunities
• Significantly deleveraged balance sheet, with net debt to EBITDA at 2.8x, despite the high capital intensity of the industry
• Conservative liquidity management with best-in-class working capital management
Differentiated business model focusing on profitable growth
• Industry-leading gross marginsover the past 3 years.
• Consistently profitable over the past 7 years
• Strong sales channels with leading market share in premium markets and segments
• Focus on investments with high risk-adjusted returns
Industry leader strongly positioned to benefit from
global secular growth in demand for solar energy
• One of the most globally-exposed and diversified solar companies
• Strategically positioned across the solar energy value chain
• Growth opportunities in solar plus energy storage and optimized solutions, leveraging R&D capabilities and captive markets
Led by a strategically-minded and prudent management team with excellent track record (1)
2 31
Why invest in Canadian Solar?
(1) Management biographies on slide 48.

8
Near term uncertainty from COVID-19 but long term fundamental drivers intact
❖ Project financing: potentially lower availability of tax equity in the U.S. due to macroeconomic weakness
❖ Project sales: higher cost of capital for project buyers due to volatility in the capital markets
❖ Project construction/permitting: delays but limited impact
❖ Module sales: weakness in global residential markets and certain project delays, but seeing a recovery under way
❖ FX impact: Sharp depreciation in certain currencies impacting demand
❖ Module input costs: rapid cost declines across the supply chain
Risks and Impacts Mitigation Strategies
❖ Improved attractiveness of stable yielding solar assets in a lower-for-longer interest rate environment
❖ Lower solar module and BOS (1) prices improving the economics of contractedsolar pipeline, growing the number of solar markets at/reaching grid parity
❖ Financial stress at lower-tier solar manufacturers to accelerate industry consolidation
❖ Unprecedented global fiscal and monetary stimulus to accelerate investments in clean energy markets
❖ Potential extension of the Investment Tax Credit (ITC) in the U.S.
Opportunities
❖ Support customers, suppliers and partners through the tough times
❖ Renegotiate PPA execution dates
❖ Assess and balance valuation vs. cash flow impacts, self-funding construction on certain projects to sell at a later date to achieve higher project valuation
❖ Adjust production plans focusing more on “build-to-order” and less on “build-to-stock”
❖ Strengthen credit control measures
❖ Accelerate R&D and product development to boost competitiveness
❖ Adopt extra-prudent approach at capital and liquidity management
(1) Balance of systems.

9
Table of Contents
1 Company Overview2 Market Opportunity3 Energy Business4 Module and System Solutions5 Financial Highlights

10Source: BNEF New Energy Outlook 2019, Lazard 2018 LCOE Report.
0
50
100
150
200
250
300
350
400
2009 2010 2011 2012 2013 2014 2015 2016 2017 2018
Gas Peaker
Coal
Gas CC
Solar= Wind
18% 23%32% 35% 40%
33% 27%25% 26%
28%
50% 50% 43% 39% 33%
0%
20%
40%
60%
80%
100%
2015 2016 2017 2018 2019Solar PV Other renewables Carbon-Based and Nuclear
Mean Levelized Cost of Electricity ($/MWh)Global Generation Capacity Addition Mix (GW)
Solar energy adoption accelerating due to competitive economics & policy support
Solar energy already delivers the lowest levelized cost of electricity in most geographies
From 2016 onwards, solar capacity additions outpaced other sources, and in 2019, it exceed all carbon-based sources
Rising carbon prices and structural growth in demand for electricity to support solar energy adoption
>800 GW of fossil fuel capacity is expected to retire over the next decade and >2,700 GW over the next 3 decades

11
3.02.0
8.0 6.07.0
5.0
2019 2022Solar Storage Overall
Gas Baseload (combined cycle) – New Build
(USD c/kWh)
7.4
4.1
Solar and Gas LCOE: US Market Data
Fuel + O&M: 3 c/kWh
Solar plus 4 hours of storage is competitive with gas generation and trending to be more cost effective in years ahead
Recently issued PPAs in the US are $4-5 c/kWh for PV + 4h storage (to be connected in 2021-2024)
Majority of new solar PPAs in California are requesting storage to be paired, setting a trend for other markets

12
1933
50 45 35
109
140163
3
5
8 1111
8
16
11 1015
9
8
10 12 24
8
16
14
12 19
32
2015 2016 2017 2018 2019 2020 2021 2022
China India United States Europe Latin America ROW
Solar energy expected to grow from 3% of global electricity generation in 2019 to around 10% by 2030
Independent analysts expect relatively weak demand in 2020 and growth to return by the following year
40 70 102 141 184 241 319 414 518 643 2,440
7,580
2010 2011 2012 2013 2014 2015 2016 2017 2018 2019 2030 2050
%
GW
% of Total Electricity Generation
Global Cumulative Solar PV Installations
Source: IHS, BNEF.
10%3%
22%
5778
11095 104
140125
163
Key energy markets remain underpenetrated providing long-term visibility into the global demand environment
Source: IHS (April 2020). Disclaimer: Industry forecasts in the charts above and elsewhere in this presentation are provided by third-party industry analysts. Although we have not independently verified the accuracy of these forecasts, we believe them to be reliable and reasonable.

13
24% 28% 36%49%
46%
55%58%
64%
22
4048
5778
95104
125
2010 2013 2014 2015 2016 2017 2018 2019Top 10 Module Manufacturers Others
Industry consolidation is shifting the basis of competition to non-price attributes
Industry consolidating: market share of top 10 module manufacturers vs. annual global shipments
Growing customer loyalty driven by: Brand and bankability (1)
Technology differentiation and value proposition, driven by LCOE (2) and energy yield Quality and performance of integrated energy system solutions Reliability and predictability of delivery and other services Long-term partnerships
GW
(1) For definition of solar bankability, see slide 27. (2) Levelized cost of electricity.Source: IHS, company filings.

14
Table of Contents
1 Company Overview2 Market Opportunity3 Energy Business4 Module and System Solutions5 Financial Highlights

15
Differentiated business model combining asset sales and stable income
• Technological & cost synergies as an integrated solutions provider
• Sell projects at NTP and COD(2), depending on optimal exit point (max. gross profit/W)
• Expect approx. 25% CAGR in project sales to 2024
• Retain approx. 1 GW in minority ownerships by 2024 (3) in certain markets to capture new sources of recurring income and improve predictability of future cash flows
Solid global track record as a solar
project developer
• Since 2009, built and connected >5.6 GWp solar projects globally
• Strong relationships with key players in the solar energy ecosystem
• In 2015, acquired Recurrent Energy in the U.S.
• In 2017, launched the first and largest IPO of a Japanese solar infrastructure fund, with approx. USD 470 million assets under management(1)
Energy business highlights
2 3
(1) As at December 31, 2019. (2) NTP: notice to proceed, COD: commercial operation date.(3) For details, see slide 23.
Large global pipeline and backlog of solar
power projects
• Develop, build, operate, sell and own solar power plants
• Large and growing pipeline
• Visibility into profitable growth
• 956 MWp in operation
• 807 MWp in construction
• 3.7 GWp in backlog
• 12 GWp in pipeline
• 2,820 MWh in storage pipeline
1

16
Process map
Development Execution Operation
Integrated model with expertise across the solar development value chain
Origination, site selection and environmental studies
System design
Energy storage integration
Financial modelling
Secure land and interconnection
PPA negotiation / auction participation
(greenfield and brownfield opportunities)
➔ Notice to Proceed (NTP)
Financing and structuring of debt and equity
EPC:
➢ Engineering
➢ Procurement: Canadian Solar PV modules, centralized BOS
➢ Construction
➢ Management
Testing and commissioning
➔ Commercial Operation Date (COD)
Operations and maintenance (O&M):
➢ Maximize performance
➢ Technical inspections and repairs
➢ Real time remote monitoring
➢ Performance reporting
Asset management
Monetization strategy: Exit at NTP, COD or through equity partnerships (retaining minority ownership), depending on the optimal exit point for each project based on market- and project-specific risk and return profile

17
Strong competitive position with a large and globally diversified project pipeline
Opportunity to unlock value in 5.4 GWp(1) of executed or contracted projects
Plants in Operation
956 MWpPlants in Construction
807 MWpBacklog
3.7 GWpPipeline
12 GWp
Latin AmericaMW 3,891 PipelineMW 1,036 BacklogMW 732 In ConstructionMW 100 In Operation
EMEAMW 2,159 PipelineMW 206 BacklogMW 0 In ConstructionMW 0 In Operation
APAC (ex. Japan)MW 676 PipelineMW 584 BacklogMW 5 In ConstructionMW 96 In Operation
ChinaMW 430 PipelineMW 0 BacklogMW 0 In ConstructionMW 459 In Operation
North AmericaMW 4,847 PipelineMW 1,609 BacklogMW 0 In ConstructionMW 216 In Operation
JapanMW 0 PipelineMW 223 BacklogMW 70 In ConstructionMW 85 In Operation
As of March 31, 2020.(1) Gross GWp of projects in backlog, construction and operation, including combined project stakes of c.800 MWp already sold to third parties.Note: Definitions of backlog and pipeline are consistent with industry practice. For more details, see form 6-K for Q1 2020 results on May 28, 2020.
Calgary
Guelph
New York CityWalnut Creek
San Francisco
Austin
Mexico City
Buenos Aires
São Paulo
London
MadridMilan
Warsaw
Seoul
Hong KongTaipei
Tokyo
Melbourne
Energy business office locations
Storage Backlog
320 MWhStorage Pipeline
2,520 MWh
Brisbane
Earlymover
Suzhou, Shanghai
Beijing
Kuala Lumpur Singapore

18
0.1 0.2
0.6
1.4
2.0
3.3
3.9
5.35.6
2011 2012 2013 2014 2015 2016 2017 2018 2019
(GWp)
Track record developing and connecting over 5.6 GWp in solar projects
5.6 GWp
North America Latin AmericaAsia Pacific ex. Japan JapanChina EMEA
Cumulative Power Plants Built and Connected Regional Mix
Note: Includes projects built and connected by Recurrent prior to Canadian Solar’s acquisition in 2015.

19
Supported by strong partnerships in the solar energy ecosystem
Debt Finance Equity Finance Offtakers

20
Successfully monetized solar projects through NTP, COD sales and equity partnerships
A leading global solar development platform since 2009
2015-20172009-2012
Proj
ects
Dev
elop
edor
Acq
uire
dN
TP o
r CO
D S
ales
2010◼ 9 projects◼ 86 MW
Dec 2011◼ 9 projects◼ 86 MW
2012◼ 20 projects◼ ~200 MW
2012◼ 11 projects◼ 122 MW
Mar 2012◼ 1 projects◼ 8.5 MW
Jun 2013◼ 4 projects◼ 39 MW
Aug 2013◼ 5 projects◼ 49 MW
Sep 2013◼ 2 projects◼ 20 MW
Nov 2013◼ 4 projects◼ 40MW
Jan-Feb 2014◼ 2 projects◼ 20MW
2011◼ 1 project◼ 8.5 MW
Dec 2014◼ 3 projects◼ 30 MW
RET
Mar 2015 Acquisition◼ Leading US
development team
◼ 7 projects, ◼ 1,054 MW
2013-2014
Equi
ty P
artn
ersh
ips
2018-2020
2012-13◼ 29 projects◼ 329 MW
2013◼ 7 projects◼ 290 MW
Nov 2015 ◼ 51-49%
partnership on 3 projects in the US (Garland, Tranquillity, Roserock)
Oct 2016 ◼ 80-20%
partnership on 399 MW Pirapora projects in Brazil
Apr 2019 ◼ 80-20%
partnership on 483 MW project portfolio in Brazil
CSIFSep 2017◼ Successful
listing of Infrastructure Fund on Tokyo Stock Exchange
2014◼ Various
projects◼ ~155 MW
Jan 2019 ◼ Exit
partnership on 399 MW Pirapora projects in Brazil
Oct 2019 ◼ 49-51%
partnership on 370 MW project portfolio in Mexico
Oct 2018 ◼ Sold 49%
equity stake on 260 MW Garland and Tranquillity projects
2015◼ 8 projects◼ 295 MW
2016◼ 1 project◼ 68 MW
Dec 2017◼ 92 MW IS-42
project in North Carolina
Aug 2017◼ 281 MW
Great Valley solar project (previously Tranquility 8)
Apr 2017◼ 2 projects ◼ 70 MWDec 2017◼ 3 projects◼ 44 MW
2018◼ 188 MW ◼ 5-project
1.14 GW co-development
2020◼ 48 MW ◼ Portfolio of
PMGDs
Note: Select transactions only.

21
Launched Japan’s first and largest publicly listed solar infrastructure fund
Canadian Solar Inc. owns 15% of CSIF
Map of CSIF and sponsor assetsCanadian Solar Infrastructure FundTSE: 9282.T
Valuation (1)
Market capitalization (2)
¥51 bn (~$470 mn)
¥27 bn (~$250 mn)
No. of power plants 21
Total power output 120 MWp
Total sponsor portfolio27 projects, 358 MWp
Operational and under construction
13 projects, 155 MWp
Under development14 projects, 203 MWp
(1) Median project valuation amounts estimated by Pricewaterhouse Coopers Sustainability LLC and Ernst & Young Transaction Advisory Services Co., Ltd. in their project valuation reports as at each financial period end (half year) or acquisition. Valuation as at December 31, 2019.
(2) As at June 8, 2020.
¥40
¥36
¥32¥24
¥21
¥18
<¥18
Sponsor portfolio FIT distribution (by MW)
60% of Japan portfolio contracted at FIT prices of USD >0.30/kWh!

22
Synergies from integrated business model and growth opportunities in energy storage
Energy businessTechnological advantage: visibility on technological and cost roadmap from upstream R&D driving early adoption of cutting-edge technologies in own projects
Integrator of solar PV + storage: deep understanding of the power grid, solar PV technology and development ecosystem
Captive market: to incubate, commercialize and scale energy storage solutions for solar projects
Bankable full-wrap solutions: financial modelling and risk management delivering end-to-end performance guarantees
Unique business model to develop cost effective, end-to-end, integrated solar energy solutions
Module and System
Solutions
➢ High risk / high return➢ Captive market ➢ Lumpy business
➢ Strong sales channels➢ Solid balance sheet ➢ Stable business
(relative)
SYNERGIES AND ENERGY STORAGE OPPORTUNITIES
Natural cyclical hedges

23
Expect 25% CAGR in project sales and accumulate 1 GW in minority stakes by 2024
Projectdevelopment
Solar modules and BOS supply
EPC
O&M and asset
management
Power sales
Storage integration/
retrofit
Repowering/ lifespan
extension
Energy Business Targets (1) 2020 2021 2022 2023 2024
Annual project sales, GWp 1.1-1.3 1.8-2.3 2.4-2.9 3.2-3.7 3.6-4.1
Cumulative projects retained, MWp (including inventory to be sold) 30 130 410 760 960
Retain minority ownership in certain markets to:
Capture higher margin income and additional operational value throughout partial ownership holding period, while recycling a large portion of the capital deployed
Over time, improve predictability and reduce volatility of future cash flows, smoothing the typical lumpiness associated with the development and sale of solar projects
Funded via capital partnerships with long-term investors through public or private vehicles. Focus on markets with:
Strong energy demandHigh solar irradianceStable capital marketsBenign policy environment Attractive project returns
Canadian Solar Ecosystem
(1) Approximate and moving targets to be updated periodically based on market and business conditions. These targets are subject to risks; investors are encouraged to review the Risks section of the Company’s annual report on Form 20-F.

24
Table of Contents
1 Company Overview2 Market Opportunity3 Energy Business4 Module and System Solutions5 Financial Highlights

25
Growth opportunities in system solutions and energy storage
• Products and services beyond modules: system kits, inverters and power electronics, microgrids, turnkey services etc.
• Growth opportunities leveraging downstream captive markets to offer integrated technology solutions for solar systems and energy storage
• Deep understanding of solar power plant operations and power markets through knowledge share with Energy business
Market share leader in premium markets
and segments
• Industry-leading margins
• Strong market positioning in high-priced premium markets
• Large and growing downstream captive market from Energy business and turnkey solutions
• Best-in-class sales operation and working capital management
Module and System Solutions (MSS) business highlights
2 3
(1) Levelized cost of electricity.
Global leader in solar cell and module
technologies
• Global footprint – 15 factories in 6 countries/regions, cumulatively delivered 42+ GW of solar modules to customers in over 150 countries
• Top tier bankable solar photovoltaic module brand
• Innovator and first mover in commercializing critical solar cell and module technologies at scale
• Deliver lowest LCOE(1) products
1

26
Cumulatively delivered over 43 GW in shipments across 150 countries
0.4 15 168803
1,5431,894
3,105
4,7065,232
6,828 6,615
8,579
10,000-12,000
2002 2006 2008 2010 2012 2013 2014 2015 2016 2017 2018 2019 2020 E
Annual shipments Regional Mix
North America Latin AmericaAsia Pacific ex. Japan JapanChina EMEA
(MW)
43 GW

27
No. 1 Bankable Module Supplier in the Bloomberg New Energy Finance Bankability Survey, 2019 –top bankable module supplier with 100% bankability for 3 consecutive yearsAA-Rated (top 5) in the PV Module Tech Bankability Ratings, 2020 No. 1 Module Supplier, for Quality & Performance-Price Ratio, IHS Markit, 2016
World-leading bankable brand
Solar brand bankability ratings are used by financial institutions across the world
for credit analysis, and indicate the likelihood that
projects using the solar products will be offered non-recourse financing by banks
(Bloomberg New Energy Finance). It takes into account
various factors, including quality and reliability of products and services,
product warranties, financial strength and track record of the company, among others.
Source: Bloomberg New Energy Finance Module Bankability Survey, 2019. Survey respondents include banks, funds, EPC contractors, independent power providers (IPPs) and technical advisors.
50% 60% 70% 80% 90% 100%
Solar FrontierRisen Energy
Hyundai Green EnergyYingli
PanasonicREC Group
KyoceraGCL Systems
Chint / AstronergyTalesun
SharpBYD
LG ElectronicsSunPowerFirst Solar
Suntech / ShunfengHanwha Q Cells
LongiJA Solar
Jinko SolarTrina Solar
Canadian Solar
Bankable Not bankable Never heard of
28
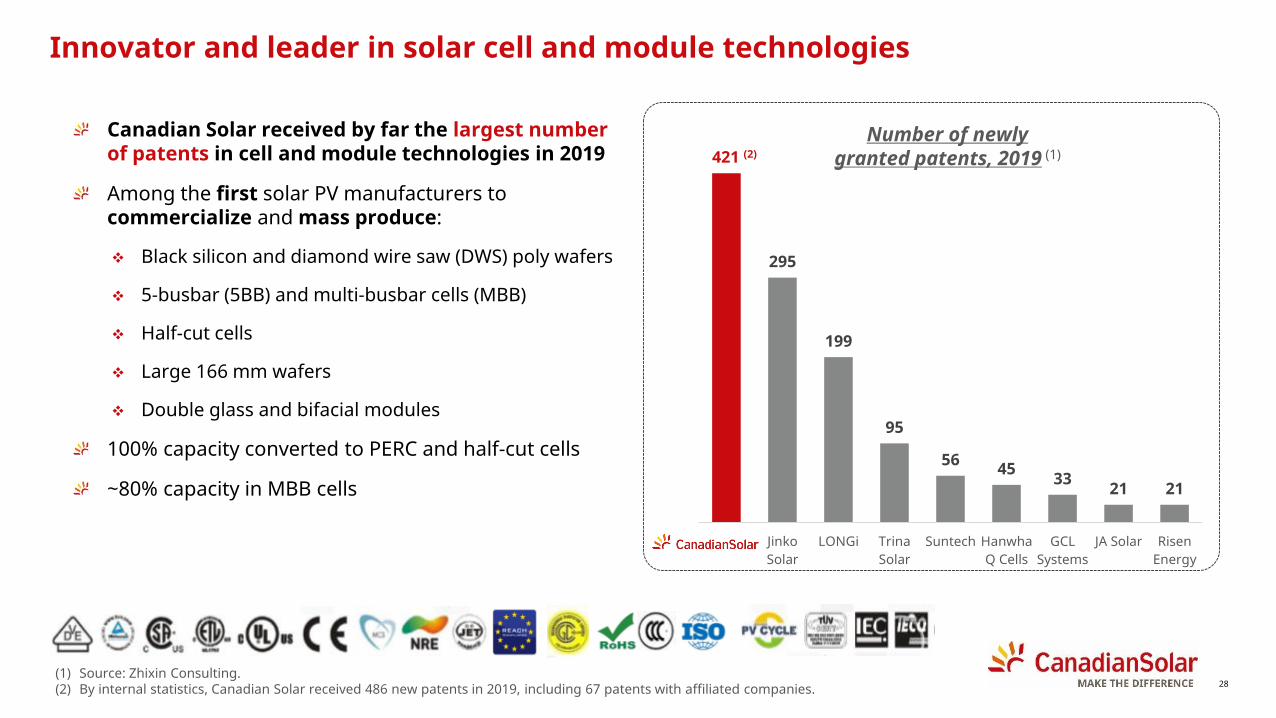
Innovator and leader in solar cell and module technologies
Canadian Solar received by far the largest number of patents in cell and module technologies in 2019
Among the first solar PV manufacturers to commercialize and mass produce:
❖ Black silicon and diamond wire saw (DWS) poly wafers
❖ 5-busbar (5BB) and multi-busbar cells (MBB)
❖ Half-cut cells
❖ Large 166 mm wafers
❖ Double glass and bifacial modules
100% capacity converted to PERC and half-cut cells
~80% capacity in MBB cells
(1) Source: Zhixin Consulting. (2) By internal statistics, Canadian Solar received 486 new patents in 2019, including 67 patents with affiliated companies.
421 (2)
295
199
95
56 45 33 21 21
CSI JinkoSolar
LONGi TrinaSolar
Suntech HanwhaQ Cells
GCLSystems
JA Solar RisenEnergy
Number of newly granted patents, 2019 (1)

29
Production strategy optimizing product LCOE, profitability and capital intensity
Canadian Solar’s manufacturing presence includes the ingot, wafer, cell and module processes
Cell and manufacturing capacity convertible between poly and mono(1) modules with minimal additional capex –production of poly or mono products dependent on relative profitability and LCOE(2) of poly vs. mono products
Inverted pyramid structure to optimize capital intensity focusing resources on higher-return, downstream businesses
Ingot
Wafer
Cell
Module
Internal Mannufacturing Capacity Externally Sourced Capacity
9.6 GW
13.0 GW
5.0 GW
1.9 GW
Manufacturing Capacity – 2019 Year End
2020 planned capacity additions: 2 GW module, 400 MW cell
74%
19%
7%
68%
32%
Module
Capacity by Geography
Cell
Other include Vietnam, Taiwan, Brazil and Canada
(1) The manufacturing process for poly- and mono-crystalline modules differ mainly at the ingot level. (2) Levelized cost of electricity.
(1)
Poly-silicon
Ingot Wafer Cell Module Solar System(Energy business)

30
Strong market positioning and pricing power in premium and captive markets High ASP, container-size direct sales to premium rooftop installers ❖ ~20% market share in target residential and small commercial markets, inc. Japan, U.S., Brazil, Australia, South Africa, E.U. ❖ Dedicated channel management and policies – co-marketing, financial, insurance, warehousing, training and technical support ❖ Customer loyalty and barriers to entry driving stable and predictable demandLarge and growing captive markets from own Energy business and turnkey solutions/EPC services❖ 16.5 GW of pipeline, backlog and projects under construction❖ Disintermediation and higher margin capture from optimized module plus components solutions (tracker, inverter, storage etc.)❖ Better risk management due to Canadian Solar end-to-end solution and guarantee Strategic priority and strong positioning in other high-priced utility scale markets, including the U.S. and Japan
Open and Competitive Markets
~3.2 GW
Turnkey (EPC)
~0.8 GW
Energy Business~0.7 GW
Premium Rooftop Direct
Sales~2.2 GW
U.S. Open Market~0.7 GW
Other Premium~1.0 GW
Captive Markets~3.7 GW
Premium Markets~3.9 GWCaptive and
Premium Markets ~5.4 GW
Total shipments in 2019: 8.6 GW
Captive markets = markets with relatively stable and low risk volumes. Premium markets = markets with relatively higher average selling prices (due to market or Canadian Solar-specific reasons).

31
Country HeadquartersRegional OfficesWarehouses
Japan: Premium market with 2-3x profitability
Strong brand name and presence across the solar value chain:
No. 1 module supplier with ~10% market share in one of the most highly-priced solar module markets globally
No. 2 residential solution supplier behind Panasonic but ahead of Toshiba, Sharp and Kyocera. Among the few foreign household brands in Japan
Top utility project developer, ~500 MWp grid-connected and projects in backlog, supported by financing facilities such as the largest solar infrastructure fund listed in the Tokyo Stock Exchange – Canadian Solar Infrastructure Fund or CSIF (9284.T) – see slide 21
Local presence: 9 offices, ~230 employees, nationwide warehouses, service, logistics centers

32
16.6%
14.6%
18.8%
20.7%
22.4%
19.8%
18.9%
15.1%
14.2%
17.4%
16.2%
17.1%
19.4%
20.8%
2015 2016 2017 2018 2019
Canadian Solar has consistently delivered industry-leading profitability
Strategically focused on delivering profitable growth (as opposed to growth at any cost)
Canadian Solar’s gross margins have expanded over 700 bps since 2016
Gross margins exceeded peer average by approx. 300 bps in 2019
The Company’s gross margins are inherently less volatile than stand-alone manufacturers or project developers due to synergies across the two businesses
Gross margin
(1) Excluding the distortionary effects of anti-dumping and countervailing duty reversals with the U.S. government. (2) Simple average of annual gross margins of Jinko Solar, LONGi, First Solar and SunPower.
(2)Peer average
(Ex. AD/CVD reversal effect)
(1)

33
CSIQ(1) Jinko Solar LONGi First Solar SunPower
Inventory Days 49 83 90 56 70
Receivable Days 51 82 136 74 38
Payable Days 121 148 200 32 81
Cash Conversion Cycle (21) 17 26 98 27
2017-2019Average
Best-in-class sales operation and working capital management
Industry-leading operations management and efficiency:
❖ Fast payment cycle❖ Low inventory ❖ Negative cash conversion cycle❖ Close to zero bad debt in 2017-2019
Highest module ASP among all China-based manufacturers in 2019
Source: Company filings, Factset data. CSIQ inventory and receivables are gross amounts i.e. adding back provisions and bad debt allowances, respectively. Using net amounts would reduce average inventory and receivable days.

34
Solar energy generation & consumption
❖ More merchant PV assets will require storage and market trading capabilities
❖ Systems integration and digitalization to optimize grid’s load management, improve economic returns and increase solar penetration
Power grid❖ Grid resilience and safety❖ Integration and balancing of intermittent
renewable energy
Economics and safety-driven interactions
System Solutions and Energy Storage (SSES)
Enabling technologies: ❖ Power electronics❖ Energy storage❖ Internet of Things, big data,
artificial intelligence, cloud computing
Partnerships with leaders in battery technology
Tech DNA
Technology migration
Solar module supplier
❖ Capital intensive❖ Technology intensive
Growth opportunities in System Solutions and Energy Storage (SSES) System Solutions and Energy Storage (SSES): In-house team established in 2019 to develop solar plus storage and integrated system solutions, leveraging Canadian Solar’s captive markets and expanding Canadian Solar’s technology DNA
35
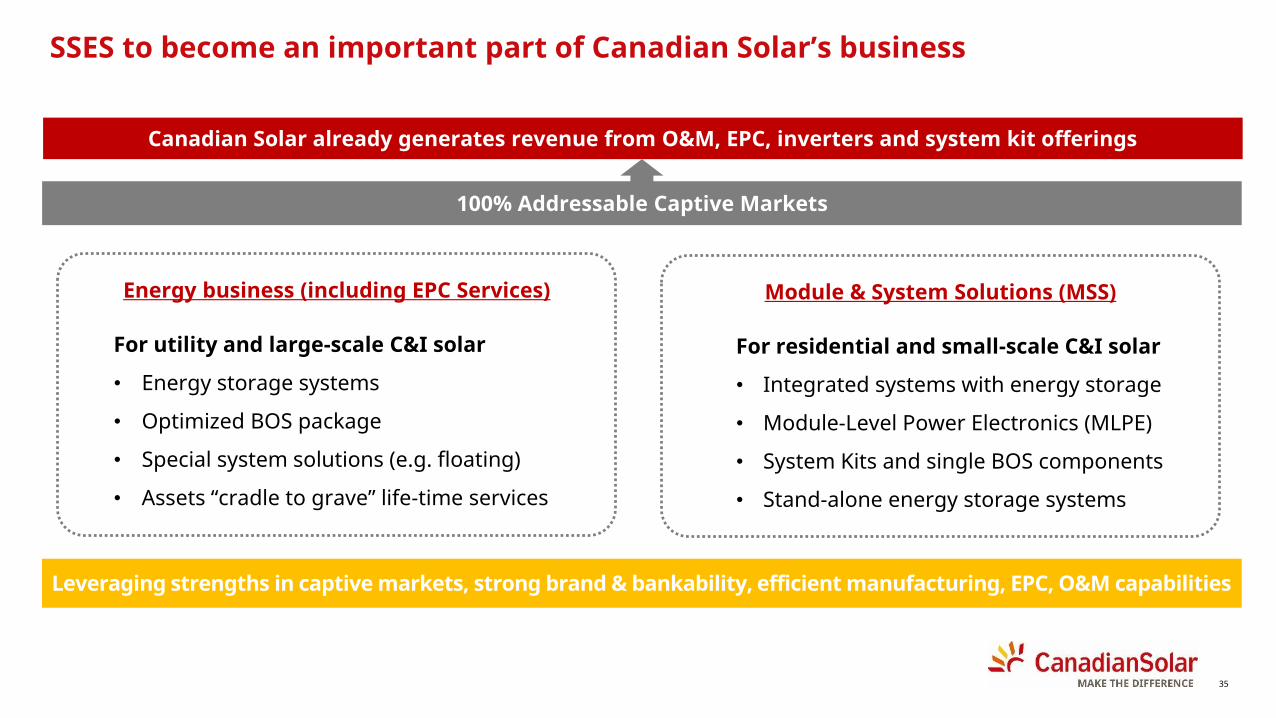
Canadian Solar already generates revenue from O&M, EPC, inverters and system kit offerings
100% Addressable Captive Markets
Energy business (including EPC Services)
For utility and large-scale C&I solar
• Energy storage systems
• Optimized BOS package
• Special system solutions (e.g. floating)
• Assets “cradle to grave” life-time services
Module & System Solutions (MSS)
For residential and small-scale C&I solar
• Integrated systems with energy storage
• Module-Level Power Electronics (MLPE)
• System Kits and single BOS components
• Stand-alone energy storage systems
Leveraging strengths in captive markets, strong brand & bankability, efficient manufacturing, EPC, O&M capabilities
SSES to become an important part of Canadian Solar’s business

36
Table of Contents
1 Company Overview2 Market Opportunity3 Module and System Solutions4 Energy Business5 Financial Highlights

37
Module and System
Solutions, $2,481 mn
Energy Group, $719 mn
FY19 Revenue SplitUSD millions except per share data 1Q20 vs.
4Q19vs.
1Q19 FY19 vs. FY18
Net revenues 826 -10% 70% 3,201 -15%
Cost of revenues 602 -13% 60% 2,482 -16%
Gross profit 223 -3% 108% 719 -7%
Operating expenses 110 -7% 9% 460 12%
Operating income 113 2% 1617% 258.9 -29%
Other (expenses)/income -15 NM NM 19 NM
Depreciation and amortization 45 0% 20% 159 23%
EBITDA (non-GAAP)(1) 143 -7% 336% 437 -17%Net income attributable to Canadian Solar Inc. 111 63% -745% 172 -28%
Diluted EPS 1.84 64% -735% 2.83 -27%
Gross margin 27.0% 21 bp 49 bp 22.4% 17 bp
EBITDA* margin 17.4% 5 bp 106 bp 13.7% -5 bp
Net margin 13.4% 60 bp 169 bp 5.4% -10 bp
Return on equity (TTM) 20.6% 83 bp 63 bp 12.3% -70 bp
Asia32%
Americas44%
Europe and
Others24%
(1) EBITDA calculated as operating income after loss/gain on change in fair value of derivatives, FX gain/loss, investment income/loss, and income from minority shareholdings; then adding back depreciation and amortization. For a reconciliation of GAAP to non-GAAP results, see accompanying table “GAAP to Non-GAAP Reconciliation” on slide 51.
Consolidated Income Statement Summary

38
Highlights
Total module shipments grew 41% yoy but declined 11% qoq. Q1 is typically a soft quarter due to seasonal effects.
Q1 2020 shipments were also partially affected by certain COVID-related manufacturing closures.
Average selling prices (ASPs) declined around 5% qoq due to market expectations of softer demand for solar equipment in 2020. Likewise, costs increased marginally qoq due to higher logistical costs and lower capacity utilization. Both impacts on ASP and costs were mainly driven by disruptions from COVID-19.
2,414 2,583
469673 675 766 690
FY18 FY19 1Q19 2Q19 3Q19 4Q19 1Q20
Gross margin
20.3% 25.1% 21.2% 22.8% 28.0%26.9% 21.6%
%
USD millions except shipment data 1Q20 vs.
4Q19vs.
1Q19 FY19 vs. FY18
Total shipments (MW) 2,214 -11% 41% 8,579 30%
Revenues(1) 690 -10% 47% 2,583 7%
Gross profit(1) 149 -30% 50% 649 32%
Income from operations(1) 61 -46% 197% 280 97%
(1) Includes effects of both sales to third party customers and to the Company’s Energy Business to reflect the real underlying performance. Please refer to the financial tables in the quarterly press release for the intercompany transaction elimination information. Income from operation amounts reflect management's allocation and estimate as some services are shared by the two segments of the Company.
Module and System Solutions Revenues (USD million) (1)
Modules and System Solutions Summary Financials

39
USD millions 1Q20 vs. 4Q19
vs. 1Q19 FY19 vs.
FY18
Revenues 238 11% 654% 719 -54%
Gross profit 90 172% 853% 84 -69%
Income from operations 67 343% NM -7 NA
Highlights
Q1 revenues and profits were up significantly both qoq and yoy.
Projects sold during the quarter include the 56 MWp project in Yamaguchi Japan and the 18 MWp portfolio of projects in Italy.
The high gross margin in Q1 was mainly driven by the project sale in japan, where the revenue and profitability per watt is several times that of projects from other regions.
Energy Business Revenues (USD million)
1,576
719
32
375
98215 238
FY18 FY19 1Q19 2Q19 3Q19 4Q19 1Q20
17.3% 11.6% 29.8% 5.7% 15.3%20.5% 37.7%
% Gross margin
Energy Business Summary Financials

40
Operating Expenses as % of Revenue
5.1% 4.6% 4.4%5.6% 5.5%
2016 2017 2018 2019 1Q20 TTM
Selling expenses
7.1% 6.8% 6.6%
7.6%6.9%
2016 2017 2018 2019 1Q20 TTM
0.6%0.8%
1.2%1.5%
1.2%
2016 2017 2018 2019 1Q20 TTM
General & administrative
expenses
Research & development
expenses
Total operating expenses
11.4% 10.9% 11.0% 14.4% 13.3%
Commentary
Selling expenses in Q1 increased to $53 mn from $50 mn in Q4 and $38 mn in Q1 2019. The sequential and yoy increase was mainly due to an increase in shipping and handling costs and project transaction expenses.
G&A expenses in Q1 declined to $53 mn from $64 mn in Q4, but increased slightly yoy from $51 mn in Q1 2019. The sequential decline was due to tighter control over G&A expenses in Q1, as well as the impact from non-recurring costs from the previous quarter (inc. safe harbor module expenses and fixed asset impairments incurred in Q4 2019 which were no longer in Q1 2020.
R&D expenses in Q1 were $10 mn, flat qoq and slightly lower than $13 mn in Q1 2019. R&D expenses have grown at 39% CAGR over 2016-19, from $17 mn in full year 2016 to $47 mn in 2019.
In addition to the expenses below, in 2016-18, CSI had an annual average of $45 mn in other operating income, consisting primarily of gains/losses from the disposal of solar power systems and property, plant and equipment; government grants received; and compensation from business interruption insurance.
Operating expenses

41
Working Capital Days
287 277316
291270
10.0% 8.2% 8.4% 9.1%
-70.0%
-60.0%
-50.0%
-40.0%
-30.0%
-20.0%
-10.0%
0.0%
10.0%
20.0%
0
50
100
150
200
250
300
350
400
450
500
2016 2017 2018 2019 2020E
Capex Capex as % of revenue
Capital Expenditures (USD million)(4)
46 days 39 days63 days
92 days
2017 2018 2019 1Q20
Inventory Turnover(1)
47 days 47 days58 days 52 days
2017 2018 2019 1Q20
Accounts Receivable Turnover(2)
115 days 107 days140 days 164 days
2017 2018 2019 1Q20
Accounts Payable Turnover(3)
1) Inventory turnover days calculated as average gross inventory (adding back provisions) divided by cost of revenues x3652) Account receivables days calculated as average gross accounts receivable (adding back bad debt allowance) divided by total revenues x365.3) Accounts payable days calculated as average accounts payable divided by cost of revenues x365. 4) Capex for PP&E only, excluding capex related to project development.
Disciplined working capital management, disciplined and balanced capex

42
Total and Net Debt to EBITDA Total Debt, USD mn
11.2x
7.9x
3.7x4.5x
3.4x
8.5x
5.6x
2.6x 2.8x 2.2x
2016 2017 2018 2019 1Q20 TTM
Total debt to EBITDA Net debt to EBITDA*
1,480 1,389 1,229 1,185 1,104
1,191 1,381
735 769 763
2,671 2,770
1,964 1,954 1,867
2016 2017 2018 2019 1Q20
Borrowings for solar projects Borrowings for corporate/manufacturing
*Note: Net debt calculation nets out unrestricted cash and restricted cash securing debt only.
Canadian Solar has significantly deleveraged its balance sheet
Total and net debt to EBITDA are now at 3.4x and 2.2x respectively
The ratios would be approximately 0.5x lower excluding project level non-recourse debt
Deleverage mainly driven by growth in EBITDA and reduction in project debt associated with project sales

43
941
+600
-294-35 -7
1,205
Cash end of 2018 Cash provided by operations
Cash used ininvestingactivities
Cash used infinancingactivities
FX changes Cash end of 2019
USD millions
Cash flow changes in FY19
Note: Values based on Canadian Solar’s unaudited statement of cash flows.
We continue to generate operating cash, invest in the long-term success of our business and strengthen our overall cash position

44
Canadian Solar has delivered an average ROIC of 10.3% (after tax) over the past 6 years
In USD millions, except % data
Return on Invested Capital (ROIC) 2014 2015 2016 2017 2018 2019 6 yr avg
Total equity (book value) 730 833 899 1,060 1,273 1,425
+ Long-term borrowings 134 607 493 404 394 619
+ Short-term borrowings 726 1,157 1,600 1,958 1,028 933
+ Other interest-bearing debt 150 176 577 408 543 402
- Cash and equivalents 550 553 511 562 444 669
- Cash to secure short-term debt 113 107 133 245 134 69
Invested Capital 1,077 2,112 2,926 3,023 2,659 2,642 2,407
EBIT (non-GAAP) 356 260 143 251 399 278
- 26.5% tax (Canadian statutory rate) -94 -69 -38 -67 -106 -74
Net Operating Profit After Tax (NOPAT) 262 191 105 185 293 204 1,240*
ROIC = NOPAT/Invested Capital 24.3% 9.1% 3.6% 6.1% 11.0% 7.7% 10.3%
*6-year cumulative.
45
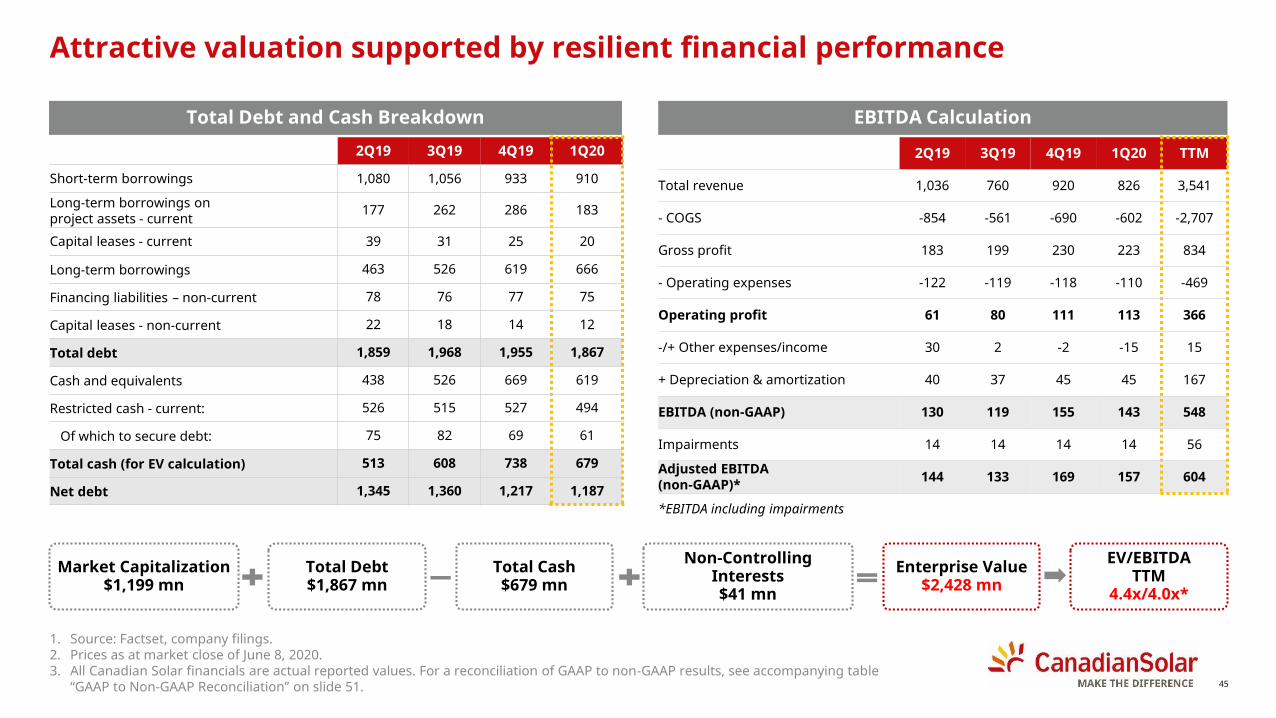
2Q19 3Q19 4Q19 1Q20
Short-term borrowings 1,080 1,056 933 910
Long-term borrowings on project assets - current 177 262 286 183
Capital leases - current 39 31 25 20
Long-term borrowings 463 526 619 666
Financing liabilities – non-current 78 76 77 75
Capital leases - non-current 22 18 14 12
Total debt 1,859 1,968 1,955 1,867
Cash and equivalents 438 526 669 619
Restricted cash - current: 526 515 527 494
Of which to secure debt: 75 82 69 61
Total cash (for EV calculation) 513 608 738 679
Net debt 1,345 1,360 1,217 1,187
1. Source: Factset, company filings. 2. Prices as at market close of June 8, 2020. 3. All Canadian Solar financials are actual reported values. For a reconciliation of GAAP to non-GAAP results, see accompanying table
“GAAP to Non-GAAP Reconciliation” on slide 51.
2Q19 3Q19 4Q19 1Q20 TTM
Total revenue 1,036 760 920 826 3,541
- COGS -854 -561 -690 -602 -2,707
Gross profit 183 199 230 223 834
- Operating expenses -122 -119 -118 -110 -469
Operating profit 61 80 111 113 366
-/+ Other expenses/income 30 2 -2 -15 15
+ Depreciation & amortization 40 37 45 45 167
EBITDA (non-GAAP) 130 119 155 143 548
Impairments 14 14 14 14 56
Adjusted EBITDA (non-GAAP)* 144 133 169 157 604
*EBITDA including impairments
Total Debt and Cash Breakdown EBITDA Calculation
Enterprise Value$2,428 mn
Market Capitalization$1,199 mn
Total Debt$1,867 mn
Total Cash$679 mn
Non-Controlling Interests$41 mn
EV/EBITDATTM
4.4x/4.0x*
Attractive valuation supported by resilient financial performance

46
Attractive valuation relative to peers
1. NA: Not applicable due to negative earnings. 2. Prices as at June 8, 2020 market close. 3. Company A and F has not been updated for calendar Q1 2020 results due to lack of availability. Company B’s earnings were adjusted to remove
the costs of a litigation loss.
2,428 2,778 4,8012,294
15,411
3,406 1,686
4.1x 7.4x 9.8x 9.4x 13.3x 20.7x 13.6x
Canadian Solar A B C D E F
EV/EBITDA TTM
EV (USD mn)
1,199 8495,749 1,506
17,007
2,196 633
4.0x 6.6x 14.1x 13.6x 18.2x 95.9x NA
Canadian Solar A B C D E F
P/ETTM
Market Capitalization(USD mn)
❖ The above relative valuation analysis is intended for illustration purposes only, investors are encouraged to do their own due diligence based on their own analysis of publicly available financial information.
❖ The rationale for Canadian Solar EV/EBITDA calculation can be reviewed on slide 45. EV/EBITDA and P/E for close peers is based on Factset database. We have not independently verified the accuracy of Factset’s data, but believe it to be reasonable.

47
(1) Includes MSS and Energy businesses, including the elimination effect from intercompany sales.(2) The Company withdrew its 2020 annual financial guidance due to uncertainty in business conditions in the second half of 2020 caused by COVID-19.
Q1 2020 Q2 2020E FY2019 FY2020E YoY ∆%
Module Shipments 2,214 MW 2.5 GW to 2.7 GW 8,579 MW 10 GW to 12 GW 17% to 40%
Revenue(1) $826 mn$630 mn to
$680 mn$3.2 bn NA(2) NA
Gross Margin(1) 27.0% 18.5% to 20.5% 22.4% NA NA
Guidance as of May 28, 2020

48
Strategically-minded and prudent management team with excellent track record
Dr. Shawn Qu ChairmanChief Executive Officer
❖ Founded Canadian Solar in 2001, firmly establishing the company as a global leader of the solar industry❖ Director & VP at Photowatt International S.A.❖ Research scientist at Ontario Hydro (Ontario Power Generation)
Yan ZhuangPresidentChief Operating Officer
❖ Head of Asia of Hands-on Mobile, Inc.❖ Asia Pacific regional director of marketing planning and consumer insight at Motorola Inc.
Dr. Huifeng Chang Senior VPChief Financial Officer
❖ Co-Head of Sales & Trading at CICC US in New York❖ CEO of CSOP Asset Management in Hong Kong❖ Vice President of Citigroup Equity Proprietary Investment in New York
Guangchun ZhangSenior VPChief Manufacturing Officer
❖ Vice President for R&D and Industrialization of Manufacturing Technology at Suntech Power Holdings❖ Centre for Photovoltaic Engineering at the University of New South Wales and Pacific Solar Pty. Limited
Ismael GuerreroCorporate VPPresident of Energy Group
❖ President, Head of Origination and COO at TerraForm Global❖ Vice President of Global Projects at Canadian Solar❖ Director of Operations for Asia at the Global Sustainable Fund
Jianyi ZhangSenior VP Chief Compliance Officer
❖ Senior advisor to several Chinese law firms❖ Senior assistant general counsel at Walmart Stores, Inc.❖ Managing Partner at Troutman Sanders LLP

49
USD millions except per share data 2017 2018 2019 ’19 yoy 1Q19 2Q19 3Q19 4Q19 1Q20 1Q qoq 1Q yoy
Net Revenue 3,390 3,745 3,201 -15% 485 1,036 760 920 826 -10% 70%
Cost of revenues -2,753 -2,970 -2,482 -16% -377 -854 -561 -690 -602 -13% 60%
Gross profit 637 775 719 -7% 107 183 199 230 223 -3% 108%
Selling expenses -156 -165 -180 9% -38 -45 -47 -50 -53 5% 39%
General and administrative expenses -231 -247 -244 -1% -51 -66 -61 -64 -53 -17% 3%
Research and development expenses -29 -44 -47 6% -13 -12 -12 -10 -10 -1% -24%
Other operating income, net 48 45 11 2 1 1 6 6
Total operating expenses, net -368 -411 -460 12% -101 -122 -119 -118 -110 -7% 9%
Income from operations 269 364 259 -29% 7 61 80 111 113 2% 1617%
Net interest expense -107 -95 -69 -20 -16 -17 -17 -16
Gain (loss) on change in fair value of derivatives 0 -19 -22 -1 -12 -2 -6 33
Foreign exchange gain (loss) -23 7 10 -13 16 3 4 -34
Investment income (loss) -4 41 2 1 2 -1 0 -14
Income tax benefit (expense) -41 -62 -42 8 -14 -10 -25 29
Equity in earnings (loss) of unconsolidated investees 9 6 29 2 24 2 1 0
Net income 103 242 167 -17 60 55 68 111Less: net income attributable to non-controlling interests 3 5 -5 0 -3 -3 0 1
Net income attributable to Canadian Solar Inc. 100 237 172 -28% -17 63 58 68 111 63% NM
Earnings per share - basis 1.71 4.02 2.88 -0.29 1.05 0.97 1.13 1.86
Earnings per share – diluted 1.69 3.88 2.83 -27% -0.29 1.04 0.96 1.12 1.84 64% NM
Consolidated Income Statement

50
Summary Balance SheetUSD millions 4Q17 1Q18 2Q18 3Q18 4Q18 1Q19 2Q19 3Q19 4Q19 1Q20Cash and cash equivalents 562 567 452 520 444 370 438 526 669 619Restricted cash - current 618 613 536 460 481 516 526 515 527 494Accounts receivable 358 354 370 323 498 389 455 449 437 385Inventories 346 414 336 322 262 385 338 413 554 632Project assets - current 1,523 959 1,191 1,187 934 920 690 910 604 583Other current assets 678 506 511 525 455 510 448 532 462 600Total current assets 4,085 3,413 3,396 3,337 3,074 3,090 2,895 3,345 3,253 3,313Restricted cash - non-current 11 11 3 16 16 26 17 7 10 10Property, plant and equipment 747 791 797 863 885 933 958 996 1,046 977Net intangible assets and goodwill 17 15 16 16 16 20 19 24 23 22Project assets - non-current 148 166 92 117 352 393 404 238 483 442Solar power systems 64 63 59 56 55 60 57 53 53 51Investments in affiliates 414 415 411 403 126 128 153 150 153 68Other non-current assets 403 426 419 396 369 423 536 495 446 433Total non-current assets 1,804 1,887 1,797 1,867 1,819 1,983 2,144 1,963 2,214 2,003TOTAL ASSETS 5,890 5,300 5,193 5,204 4,893 5,073 5,039 5,308 5,467 5,316Short-term borrowings 1,958 1,858 2,000 1,878 1,028 1,071 1,080 1,056 933 910Long-term borrowings on project assets-current 0 0 0 0 266 280 177 262 286 183Accounts and notes payable 976 914 815 857 749 934 926 1,006 1,131 1,048Other payables 315 295 303 322 408 380 440 453 446 410Tax equity liabilities 408 155 154 164 158 158 50 53 0 0Other current liabilities 451 398 391 424 339 241 258 250 296 282Total current liabilities 4,108 3,620 3,663 3,645 2,948 3,064 2,931 3,080 3,092 2,833Long-term borrowings 404 328 221 120 394 434 463 526 619 666Convertible notes 126 0 0 0 0 0 0 0 0 0Other non-current liabilities 192 208 206 237 278 302 323 336 331 324Total non-current liabilities 722 536 427 357 672 736 786 862 950 989TOTAL LIABILITIES 4,830 4,156 4,090 4,002 3,620 3,800 3,717 3,942 4,042 3,823Common shares 702 702 703 703 703 704 703 704 704 686Retained earnings 384 428 444 510 622 605 668 726 794 904Other equity -54 -26 -82 -52 -100 -79 -91 -103 -105 -138Total Canadian Solar Inc. shareholders' equity 1,032 1,104 1,065 1,161 1,226 1,230 1,280 1,327 1,393 1,452Non-controlling interests 28 39 38 41 47 43 42 38 32 41TOTAL EQUITY 1,060 1,144 1,103 1,202 1,273 1,273 1,322 1,366 1,425 1,493

51
GAAP to Non-GAAP Reconciliation
In USD millions FY18 FY19 4Q19 1Q20
GAAP net income 242 167 68 111
Add back:
Income tax benefit (expense) 62 42 25 -29
Net interest expense 95 69 17 16
Non-GAAP EBIT 399 278 110 98
Add back:
Depreciation & amortization 129 159 45 45
Non-GAAP EBITDA 528 437 155 143
Add back:
Impairments 46 42 14 14
Non-GAAP adjusted EBITDA 574 479 169 157
To supplement financial disclosures presented in accordance with GAAP, the Company uses non-GAAP measures which are adjusted from the most comparable GAAP measures for certain items as described herein.
The Company presents non-GAAP values for EBITDA so that readers can better understand the underlying operating performance of the business, excluding the effect of non-cash costs such as depreciation, amortization and impairments.
The non-GAAP numbers are not measures of financial performance under U.S. GAAP, and should not be considered in isolation or as an alternative to other measures determined in accordance with GAAP. These non-GAAP measures may differ from non-GAAP measures used by other companies, and therefore their comparability may be limited.

Thank You