firstenergy - pa.gov › pcdocs › 1372060.pdffirstenergy 76 south main street akron ohio 44308...
TRANSCRIPT

FirstEnergy 76 South Main Street Akron Ohio 44308
Carrie M. Dunn Attorney
July 14, 2015
330-761-2352 Fax: 330-384-3875
JUL 1-4 2015
PA PUBLIC UTILITY COMMISSION SECRETARY'S iiUrtifAU
VIA OVERNIGHT FEDERAL EXPRESS
Rosemary Chiavetta, Secretary Pennsylvania Public Ulilily Commission Commonwealth Keystone Building 400 North Street, 2 , l d Floor Harrisburg, PA 17120
Re: West Penn Power Company Quarterly Report to the Pennsylvania Public Utility Commission and Act 129 Statewide Evaluator M-2012-2334398
Dear Secretary Chiavetta:
Enclosed please find an original, a copy and a disk of West Penn Power Company's Quarterly Reporl lo the Pennsylvania Public Utility Commission and Act 129 Statewide Evaluator.
Please date stamp lhe copy and return to me in the enclosed, postage-prepaid envelope. Should you have any questions regarding this matter, please do not hesitate to contact mc.
Sincerely,
Carrie M. Dunn
enclosures
Ft tO
vaeia "Public Utility Commission
For the Period
March 1, 2015 through May 31, 2015
Program Year 6, Quarter 4
For Pennsylvania Act 129 of 2008
Energy Efficiency and Conservation'"Plan
JUL 14 2015
PA PUBLIC UTILITY COMMISSION SECRETARY'S BUREAU
Prepaid by Wesl: Penn Power Company and ADM Associates, hie.
•••Por
West Penn PowerCompany
Docket No. M-20:i.2-2334398
July 15, 2015-
July 15, 2015 | Quarter ly Repoi t to the PA PUC - Program Year t i 'Quarter-4
Table of Contents TABLE OF CONTENTS I
ACRONYMS .' .•
1 OVERVIEW OF PORTFOLIO :-4
1.1 SUMMARY OF ACHIEVEMENTS ._. 5
1.2 PROGRAM UPDATES AND FINDINGS : 7
•• 1.3 • EVALUATION UPDATES AND FiNDiNtss -...r.-.» 10
2 " SUMMARY OF ENERGY IMPACTS BY PROGRAM 11
3 SUMMARY OF DEMAND IMPACTS BY PROGRAM -. :
4 SUMMARY OF FINANCES '. 15
4.1 PORTFOLIO LEVEL EXPENDITURES -.15
4.2 PROGRAM I.EVEL'EXPHNDITUR'ES 15
West Penn Power Cornpany | Pagci
July 3 5, 2015,]'QuarterIy Report to the PA PUC - Program Year 6 Quarter 4
Acronyms C&l Commercial and Industrial
-GATl Computer-Aided Telephone Interview
CFi Compact Fluorescent Lamp
Pha^e ll Cumulative Program/Portfolio Phase II Inception to Date (Phase II Savings}
Phase ll-CO Cumulative Program/Portfolio Phase li Inception to Date including Carry
Over Savings from Phase I
Phase ll-Q Phase II verified gross savings from the beginning of Phase II + PYTD
reported gross savings.
Phase ll-Q-CO Phase II verified gross savings from the beginning of Phase II + verified
Carry Over Savings from Phase I + PYTD reported gross savings
CSP
CVR
CVRf
DLC
DR
EDC
EE&C
EM&V
GNI
HVAC
ICSP
IQ
kW
kWh
LED
.LEEP
LiURP
'M&V
MW
MWh
NTG
PA PUC
PYS
PY6
PY7
PY8
Curtailment Service Provider
Conservation Voltage Reduction
Conservation Voltage Reduction factor
Direct Load Control
Demand Response
Electric Distribution Company
Energy Efficiency and Conservation
Evaluation, Measurement, and Verification
Government, Non-Profit, Institutional
Heating, Ventilating, and Air Conditioning
Implementation Conservation Service Provider
Incremental Quarter
Kilowatt
Kilowatt-hour
Light Emitting Diode
Low-Income Energy Efficiency Program
Low-Income Usage Reduction Program
Measurement and Verifica'tion
Megawatt
Megawatt-hour
Net-to-Gross
Pennsylvania Public Utility Commission
Program Year 2013, from June 1, 2013 to May 31 , 2014
Program Year 2014, from June 1, 2010 to May 31, 2015
Program Year 2015, from June 1, 2011 to May 31, 2016
Program Year 201G, from June 1", 2012 to May 31, 2017
West Penn Power Cornpany ] Payeii-
July 15, 2015 | Quarterly Repoit Lo the I'A PUC - Program Year 6 Quarter 4
PYX QX
PYTD
SEER
SWE
TRC
TRM
Program Year X^Quarter X
Program Year to Date
Seasonal Energy Efficiency Rating
Statewide Evaluator
Total Resource Cost
Technical Reference Manual
West Perm Power Company | Page ui
July 15, 2015 1 Quarterly Report to the PA PUC - Program Year 6 Quarter 4
1 Overview of Portfolio Pennsylvania Act 129 of 2008 signed on October 15, 2008, mandated energy savings and demand
reduction goals for the largest electric distribution companies (EDCs) in Pennsylvania for Phase I (2008
through 2013). In 2009, each EDC submitted energy efficiency and conservation (EE&C) plans—which
were approved by the Pennsylvania Public Utility Commission (PUC)—pursuant to these goals. The PUC
established energy savings and demand reduction goals for Phase II (June 2013 through May 2016) o f the
Act 129 programs. Each EDC filed new EE&C plans with the PA PUC in late 2012 for Phase II. These plans
were subsequently approved by the PUC in early 2013.
Implementation of Phase II of the Act 129 programs began on June 1, 2013. This report documents the
progress and effectiveness of the Phase II EE&C accomplishments for West Penn Power Company (West
Penn Power or Company) in the 4th quarter of Program Year 6 (PY6), defined as March 1, 2015 through
May 31 , 2015, as well as the cumulative accomplishments o f the programs since inception of Phase II. This
report also includes the energy savings carried over from Phase I that will be applied towards the
Company's savings compliance targets for Phase II. The Phase I carryover values as listed in this quarterly
report are based on the Company's Final Phase I report to the Commission.
The Company's EM&V contractor, ADM Associates, is evaluating the programs, which includes
measurement and verification of program savings.
West Perm Power Company | Page 4
July 15, 2015 | Quarterly Report to the PA PUC - Program Year 6 Quarter n
1.1 Summary of Achievements
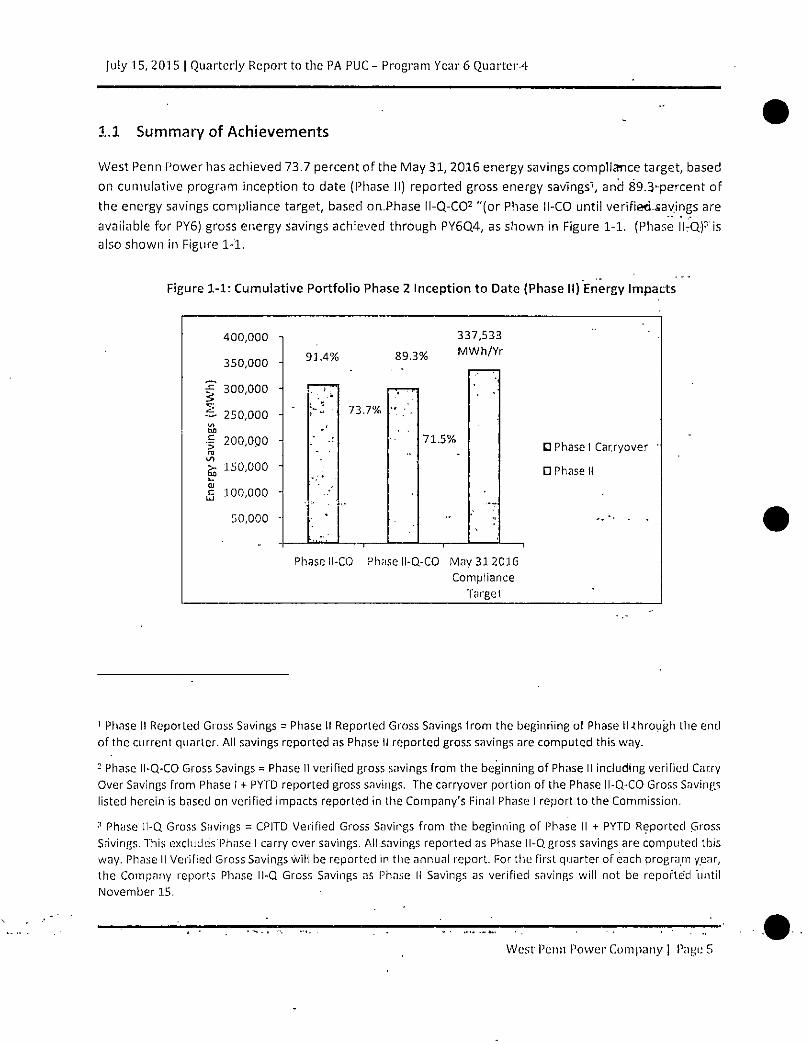
West Penn Power has achieved 73.7 percent of the May 31 , 2016 energy savings compliance target, based
on cumulative program inception to date (Phase II) reported gross energy savings1, and 89.3'percent of
the energy savings compliance target, based on.Phase ll-Q-CO2 "(or Phase ll-CO until verifiedsavings are
available for PY6) gross energy savings achieved through PY6Q4, as shown in Figure 1-1. (Phase I ITQ^ is
also shown in Figure 1-1.
Figure 1-1: Cumulative Portfolio Phase 2 Inception to Date {Phase II) Energy Impacts
400,000
350,000
| 300,000
— 250,000 -ba
| 200,0Q0 ro
^ 150,000
| 100,000
50,000
91.4%
337,533
89.3% M W h / Y r
73.7%
71.5% • Phase I Carryover
• Phase 11
Phase ll-CO Phase ll-Q-CO May 312016 Compliance
Tcirgel
1 Phase II Reported Gross Savings = Phase ll Reported Gross Savings from the beginning of Phase lUhrough the end of the current quarter. All savings reported as Phase II reported gross savings are computed this way.
2 Phase ll-Q-CO Gross Savings = Phase 11 verified gross savings from the beginning of Phase II including verified Carry Over Savings from Phase I + PYTD reported gross savings. The carryover portion of the Phase ll-Q-CO Gross Savings listed herein is based on verified impacts reported in the Company's Final Phase I report to the Commission.
^ Phase ll-Q Gross Savings = CPITD Verified Gross Savings from the beginning of Phase II + PYTD Reported Gross Savings. This excludes'Phase I carry over savings. AlLsnvings reported as Phase ll-Q gross savings are computed this way. Phase II Verified Gross Savings wiH be reported in the annual report. For the first quarter of each program year, the Company reports Phase ll-Q Gross Savings as Phase H Savings as verified savings will not be reported until November 15.
West Penn Power Company ] Page 5
July 15, 2015 | Quarterly Report to the PA PUC - Program Year 6 Quarter 4
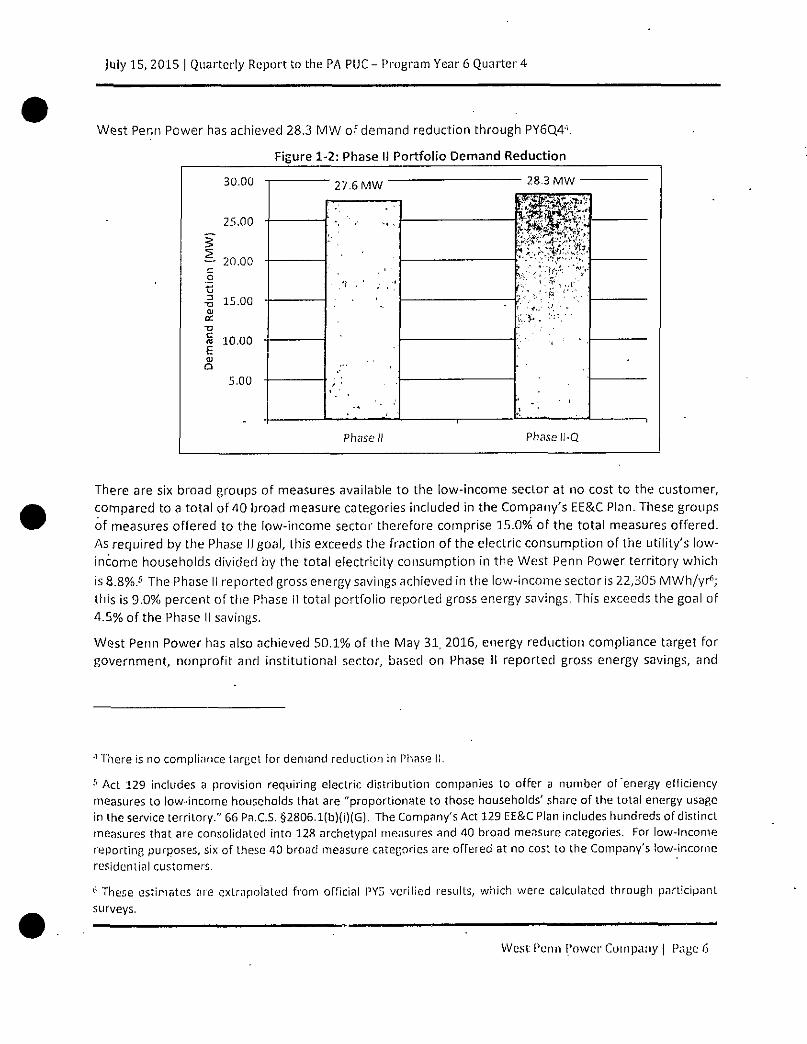
West Penn Power has achieved 28.3 MW of demand reduction through PY6Q4'1.
Figure 1-2: Phase 11 Portfolio Demand Reduction
30.00
25.00
~- 20.00 5 t! -a OJ
cc « 10.00 e a
15.00
5.00
27.6 MW
Phase II
28.3 MW
V". '
'y:\ mm
v'.. > .
Phase ll-Q
There are six broad groups of measures available to the low-income sector at no cost to the customer,
compared to a total of 40 broad measure categories included in the Company's EE&C Plan. These groups
of measures offered to the low-income sector therefore comprise 15.0% o f t h e total measures offered.
As required by the Phase II goal, this exceeds the fraction of the electric consumption of the utility's low-
income households divided by the total electricity consumption in the West Penn Power territory which
is a.8%.5 The Phase II reported gross energy savings achieved in the low-income sector is 22,305 MWh/yr*"1;
this is 9.0% percent of the Phase 11 total portfolio reported gross energy savings. This exceeds the goal of
4.5% of the Phase 11 savings.
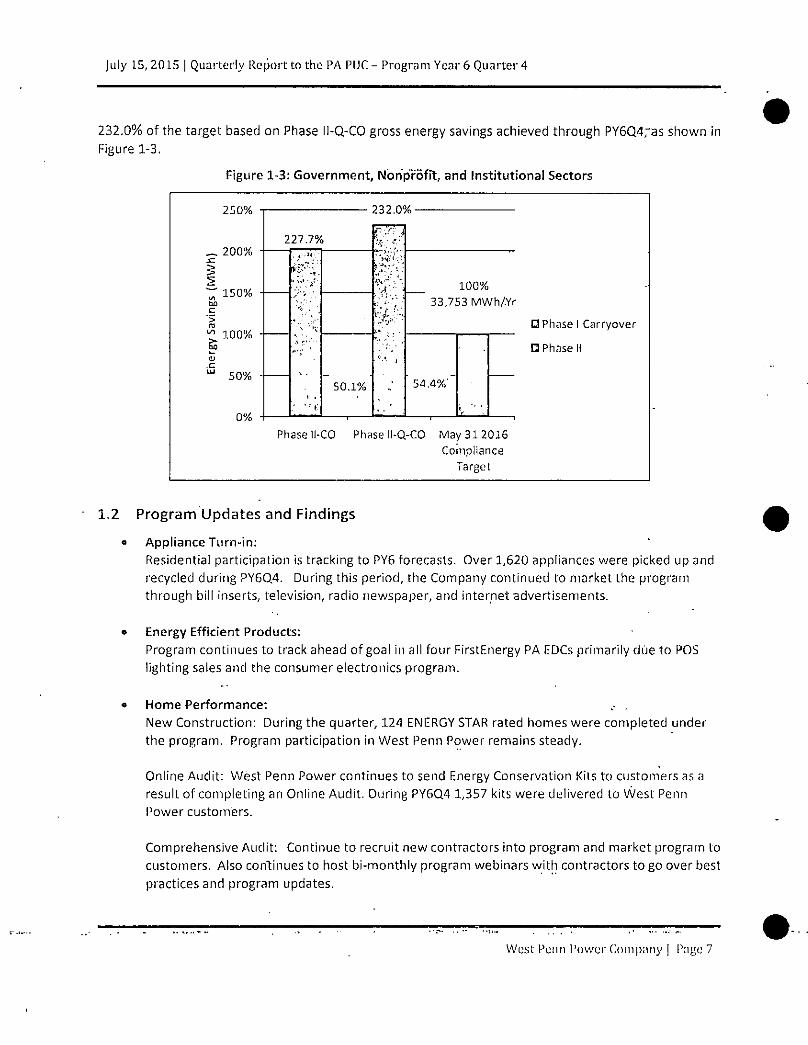
West Penn Power has also achieved 50.1% of the May 31, 2016, energy reduction compliance target for
government, nonprofit and institutional sector, based on Phase II reported gross energy savings, and
4 There is no compliance target for demand reduction in Phase II.
5 Act 129 includes a provision requiring electric distribution companies to offer a number ofenergy efficiency measures to low-income households that are "proportionate to those households' share of the total energy usage in lhe service territory." 66 Pa.C.S. §2806.1(b)(i)(G). The Company's Act 129 EE&C Plan includes hundreds of distinct measures that are consolidated into 128 archetypal measures and 40 broad measure categories. For low-Income reporting purposes, six of these 40 broad measure categories are offered at no cost to the Company's low-income residential customers.
6 These estimates are extrapolated from official PYS verilied results, which were calculated through participant
surveys.
West Penn Power Company ] Page 6
July 15, 2015 | Quarterly Report to the PA PUC - Program Year 6 Quarter 4
232.0% of the target based on Phase ll-Q-CO gross energy savings achieved through PY6Q4ras shown in
Figure 1-3.
Figure 1-3: Government, Nonprofit, and Institutional Sectors
250%
m 200%
150% ba c '5
£ 100% So
50%
0%
232.0%
227.7% r • j
50.1%
100% 33,753 MWh/.Yr
54.4%'
• Phase I Carryover
• Phase H
Phase ll-CO Phase ll-Q-CO May 31 2016 Compliance
Target
1.2 Program Updates and Findings
• Appliance Turn-in:
Residential participation is tracking to PYS forecasts. Over 1,620 appliances were picked up and
recycled during PY60.4. During this period, the Company continued to market the program
through bill inserts, television, radio newspaper, and internet advertisements.
• Energy Efficient Products:
Program continues to track ahead of goal in all four FirstEnergy PA EDCs primarily due to POS
lighting sales and the consumer electronics program.
« Home Performance: .
New Construction: During the quarter, 124 ENERGY STAR rated homes were completed under
the program. Program participation in West Penn Power remains steady.
Online Audit: West Penn Power continues to send Energy Conservation Kits to customers as a
result of completing an Online Audit. During PY6Q4 1,357 kits were delivered to West Penn
Power customers.
Comprehensive Audit: Continue to recruit new contractors into program and market program to
customers. Also continues to host bi-monthly program webinars with contractors to go over best
practices and program updates.
West Penn Power' Company | Page 7
July 15, 2015 | Quarterly Report to Lhe PA PUC - Program Year 6 Quarter 4
Behavior Modification: The Home Energy Reports highlighted the benefits of the Appliance
Recycling program in all reports delivered in May.
Opt-in Kits: During PY6Q.4, over 320 Opt-!n Kits were delivered to customers in West Penn Power
upon enrollment into the program.
Schools Education and Kits: Final performances of the "Energized Guyz" for Phase II were
completed in November 2014 and requested kits were shipped through January. Over 15,000
students participated in the School Education program from inception to date.
Low Income / WARM: The Program continued its marketing efforts to identify and reach income-qualified customers
throughout the West Penn Power service territory during PY6Q4.
WARM Extra Measures/WARM Plus: Procedures for coordination with Peoples, Equitable and
TW Phillips Gas Companies'and WARM Program continued to be finalized and preliminary
coordination efforts have begun.
Mult i Family: West Penn Power continues to identify and serve Multi-Family units/customers for
WARM Plus.
The West Penn Power WARM Program's electronic application process went live March 2015.
Customers now have the opportunity and ability to sign up for the WARM program and submit an
application on-line simply by accessing the energysavePA.com website.
Low income Low Use: West Penn Power distributed energy saving CFLs at one low income event
which was held within the West Penn Power service area.
C/l Small Energy Efficient Equipment: West Penn Power continues to receive and process applications under Phase II for this program.
In this quarter, the ICSP concluded outreach events that were initiated in the 4th Quarter. Main
focus was tO'Conlinue to build on the momentum generated through these outreach events by
conducting call-out campaign and following up on potential leads. The ICSP has revised its 60-Day
outlook marketing plan and, based on the year-to-date results in this sector, the ICSP is planning
to do targeting mailing and outreach to program allies and customer in this sector.
C/l Small Energy Efficient Buildings:
This quarter, West Penn Power has shipped out 1,160 kits to customers in this program The ICSP
focused on following up on potential leads generated at the Outreach events initiated in the 4th
Quarter and completed in 4 l h Quarter. The ICSP continues with its outreach and marketing
efforts that are focused on direct marketing to building owners/operators, design/build
contractors, and engineering and architectural firms by promoting the Building Program
Guidelines document plus number of marketing pieces that are targeted at professionals and
West Penn Power Company [ Page 8

July 15, 2015 | Quarterly Report to the PA PUC - Program Year 6 Quarter 4
decision makers in this market segment. Based on the year-to-date results, the ICSP has revised
its 60-Day outlook marketing plan to build a momentum in this prograiTi
C/l Large Energy Efficient Equipment:
West Penn Power continues to receive and process applications under Phase II for this program.
In this quarter, the ICSP concluded outreach events that were initiated in the 4th Quarter. Main
focus was to continue to build on the momentum generated through these outreach events by
conducting call-out campaign and following up on potential leads. The ICSP has revised its 60-
Day outlook marketing plan and, based on the year-to-date results in this sector, the ICSP is
planning to do targeting mailing and outreach to program allies and customer in this sector.
C/1 Large Energy Efficient Buildings: The ICSP focused on following up on potential leads generated at the Outreach events initiated
in the 4th Quarter and completed in 4" 1 Quarter. The-lCSP continues with its outreach and
marketing efforts that are focused on direct marketing to building owners/operators,
design/build contractors, and engineering and architectural firms by promoting the Building
Program Guidelines document plus number of marketing pieces that are targeted at
professionals and decision makers in this market segment.' Based on the year-to-date results,
the ICSP has revised its 60-Day outlook marketing plan to build a momentum in this program.
An uptick in new project applications coming through this program are also a result of outreach
to upstream program allies. No kits were shipped to customers this quarter.
Government & Institutional:
West Penn Power continues to receive and process applications under Phase II. The bonus
program that was launched on November 1, 2014, in which the Company offered an additional
$0.02/kWh saved for lighting and non-lighting projects, ended April 30, 2015. Based on the
year-to-clate results, the ICSP has revised its 60-Day outlook marketing plan to build on the
momentum achieved during the bonus period.
West Penn Power Company | Page 9
July 15, 2015 | Quarterly Report to the PA PUC - Program Year 6 Quarter 4
1.3 Evaluation Updates and Findings
© Appliance Turn-in
o Energy Efficient Products
* Home Performance
« Low Income / WARM
« C/l Small Energy Efficient Equipment
o C/l Small Energy Efficient Buildings
• C/l Large Energy Efficient Equipment
* C/l Large Energy Efficient Buildings
• Government & Institutional
ADM has communicated to the Company's implementation staff the data collection
requirements and calculation procedures outline_d in the 2014 PA TRM for measures offered
under each program. Nonresidential lighting projects with ex ante savings above 800 MWh and
other nonresidential projects with ex ante savings above 400 MWh are sampled with certainty
and evaluated on an ongoing basis by ADM. Nonresidential lighting projects with ex ante
savings above 500 MWh and other nonresidential projects with ex ante savings above 250 MWh
are reviewed for evaluability on an ongoing basis by ADM, and data acquisition requirements for
these projects are communicated to the ICSP. ADM has launched PY6 verification surveys for
residential programs and has started on-site verification work on smaller non-residential
projects in April 2015. Initial survey and calculation review results indicate that the gross
realization rates for residential programs will be similar to those observed in PYS.
West Penn Power Company J Page 10
July 15, 2015 | Quarterly Report to the PA PUC - Program Year 6 Quarter 4
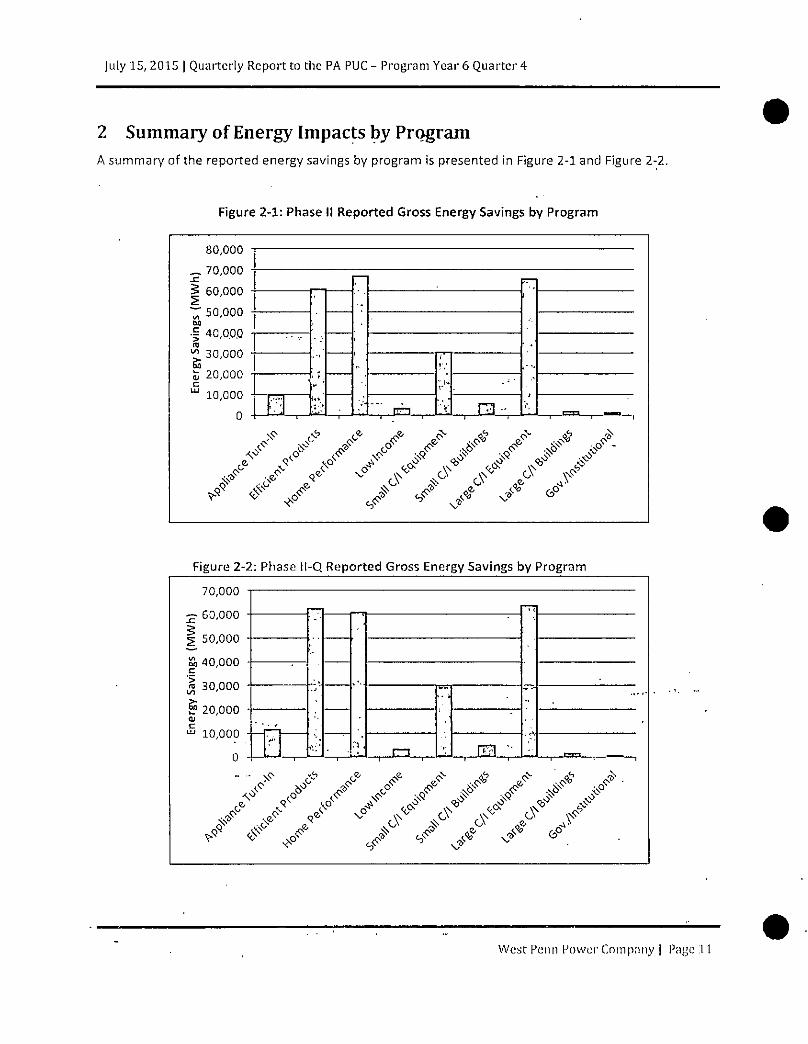
2 Summary of Energy Impacts by Program
A summary of the reported energy savings by program is presented in Figure 2-1 and Figure 2-2.
Figure 2 -1 : Phase II Reported Gross Energy Savings by Program
80,000
70,000
60,000
50,000
40,0.00
30,000
20,000
JS3
V
ra-
_<sr .<* ^ ^ ^ .J* ^
V
Figure 2-2: Phase ll-Q Reported Gross Energy Savings by Program
70,000
60,000
50,000
40,000
30,000
20,000
10,000
0
X s
V
West Penn Power Company j Page 11

July 15, 2015 | Quarterly Report' to the PA PUC - Program Year 6 Quarter 4
A summary of energy impacts by program through PY6Q4 is presented in Table 2-1 .
Table 2-1: EDC Reported Participation and Gross Energy Savings by Program (MWh/Year)
Program
Participants
Reported Gross Impact
(MWh/Year)
Program IQ PYTD Phase 11 IQ PYTD Phase ll
Phase II-
Q7
Appliance Turn-In 1,629 6,440 13,246 1,291 5,051 10,398 11,915
Energy Efficient Products 56,107 234,158 479,490 5,894 24,949 61,198 62,749
Home Performance 2,434 -5,563 230,522 17,126 48,297 67,332 60,953
Low Income / WARM 417 5,228 10,843 268 1,849 3,636 3,571
C/l Small Energy Efficient Equipment 136 543 924 3,915 16,906 30,937 30,071
C/l Small.Energy Efficient Buildings 1,1.61 3,572 6,210 941 3,348 6,070 5,046
C/l Large Energy Efficient Equipment .19 107 16.1 10,196 47,843 65,912 64,161
C/l Laige Energy Efficient Buildings 0 29 29 0 1,911 1,911 1,911
GovtMnrnent, & rnstiLutional 3 13 30 30 489 1,322 1,098
TOTAL PORTFOLIO 61,906 244,527 741,455 39,660 150,643 248,716 241,476
Carry Over Savings from
Phase I" 59,929
Total Phase ll-Q-CO 301,405
7 Phase II cumulative savings reflect PY5 verified savings as reported in the PYS annual report in November 2014.
s The Phase I carryover values as listed in this quarterly report are based on^ verified impacts reported in the
Company's Final Phase I report to the Commission all remaining values for all periods are shown ex-ante.
West Penn Power Company | Page 12
July 15, 2015 1 Quarterly Report to the PA PUC - Program Year 6 Quarter 4
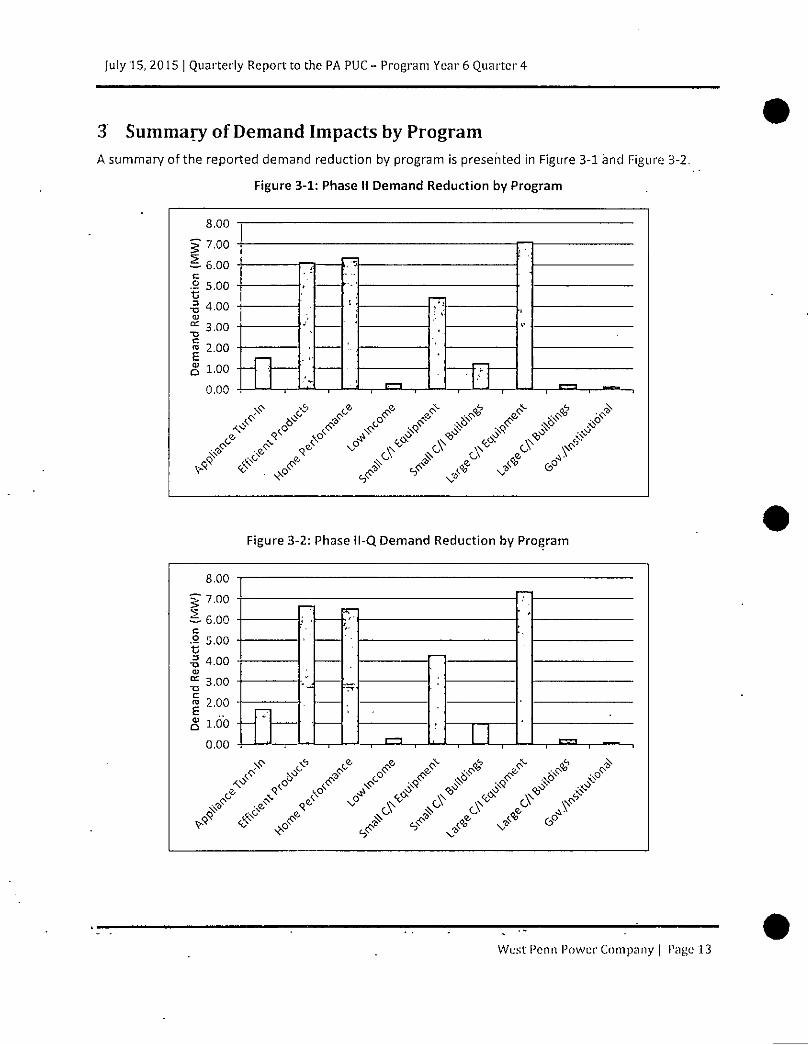
3 Summary of Demand Impacts by Program A summary of the reported demand reduction by program is presented in Figure 3-1 and Figure 3-2.
Figure 3-1: Phase II Demand Reduction by Program
8.00
5 7.00
1- 6.00
.9 5.00
= 4.00 CJ
^ 3.00 T3
| 2.00
O i-oo
0.00
o
• ̂ X ^ / f
/ /
« / ^ ^ ^ fo0 V
Figure 3-2: Phase ll-Q Demand Reduction by Program
8.00
^ 7.00
^ 6.00
.3 5.00 t ^ 4.00 CJ
^ 3.00
| 2.00
0.00 4
^ ^
^ & J " . / <f g <r <*
West Penn Power Company | Page 13

July 15, 2015 | Quarterly Report to the PA PUC - Program Year 6 Quarter 4
A summary of total demand reduction impacts by program through PY6Q4 is presented in Table 3-1.
Table 3-1: Participation and Reported Gross Demand Reduction by Program
Program
Participants
Reported Gross Impact
(MW)
Program IQ PYTD Phase II IQ PYTD Phase 11
Phase l l- |
Q1' !
Appliance Turn-In 1,629 6,440 13,246 0.20 0.76 1.54 1.70
Energy EFficient'Products 56,107 234,158 479,490 0.76 3.40 6.11 6.69
Home Performance 2,434 -5,563 230,522 5.34 5.70 6.38 6.54
Low Income / WARM 417 5,228 10,843 0.03 0.19 0.31 0.30
C/l Small Energy Efficient Equipment 136 543 924 0.57 2.63 4.45 4.30
C/l Small Eneigy Efficient Buildings 1,161 3,572 6,210 0.17 0.69 i:25 0.98
C/l Large Energy Efficient Equipment 19 107 161 1.05 5.11 7.14 7.38
C/l Large Energy Efficient Buildings 0 29 29 0.00 0.27 0.27 0.27
Government, & institutional 3 13 30 0.01 0.05 0.17 0.13
TOTAL PORTFOLIO 61,906 244,527 741,455 8.12 18.81 27.62 28.29
'•> Phase II cumulative demand impacts reflect PYS verified savings as reported in the PYS annual report in November
2014.
West Penn Power Company | Page 14

July 15, 2015 ] Quarterly Report to the PA PUC - Program Year 6 Quarter 4
4 Summary of Finances
4.1 Portfolio Level Expenditures
A breakdown of the portfolio finances is presented in Table 4-1.
Table 4-1: Summary of Portfolio Finances
Quarter 4
($000}
PYTD
($000}
Phase II
($000)
EDC Incentives to Participants $1,373 $5,923 $11,045
EDC Incentives to Trade Allies $0 $0 $0
Subtotal EDC Incentive Costs $1,373 $5,923 $11,045
Design & Development $37 $53 $161
Administration, Management and
Technical Assistance' 1 1 $3,075 $8,905 $20,539
Marketing $261 $1,021 $2,072
Subtotal EDC Implementat ion Costs $3,373 $9,979 • $22,771
EDC Evaluation Costs $148 $503 $774
SWE Audit Costs $81 $317 $1,067
Total EDC Costs 1 2 1 $4,074 $16,812 $35,058
Participant Costs' 3 1
Total TRC Costs''11
NOTES
Per PUC direction, TRC inputs and calculations are required in the Annual Roport only and should comply with the 2013 Total Rusoiirce Cosl Test Order approved August 30, 2012. Costs shown above include startup expenses prior to June 1, 2013. Negative values are the result of prior period adjustments in the current quarter and are reflected throughout the program level tables. 1 Includes the administrative ICSP (rebate processing), tracking system, general administration and clerical costs, EDC program management, ICSP program management, general management oversight major accounts and technical assistance 2 Per the 2013 Total Resource Cost Test Order - Total EDC Costs, here, refer to EDC incurred expenses only. Total EDC Costs = Subtotal EDC Incentive Costs + Subtotal EDC Implementation Costs + EDC Evaluation Costs + SWE Audit Costs. 3 Per the 2013 Total Resource Cost Test Order-Net participant costs; in PA, the costs of the end-use customer. " Total TRC Costs = Total EDC Costs + Participant Costs .
West Penn Power Company | Page 15
|uly 15, 2015 | Quarterly Report to the PA PUC - Program Year 6 Quarter 4
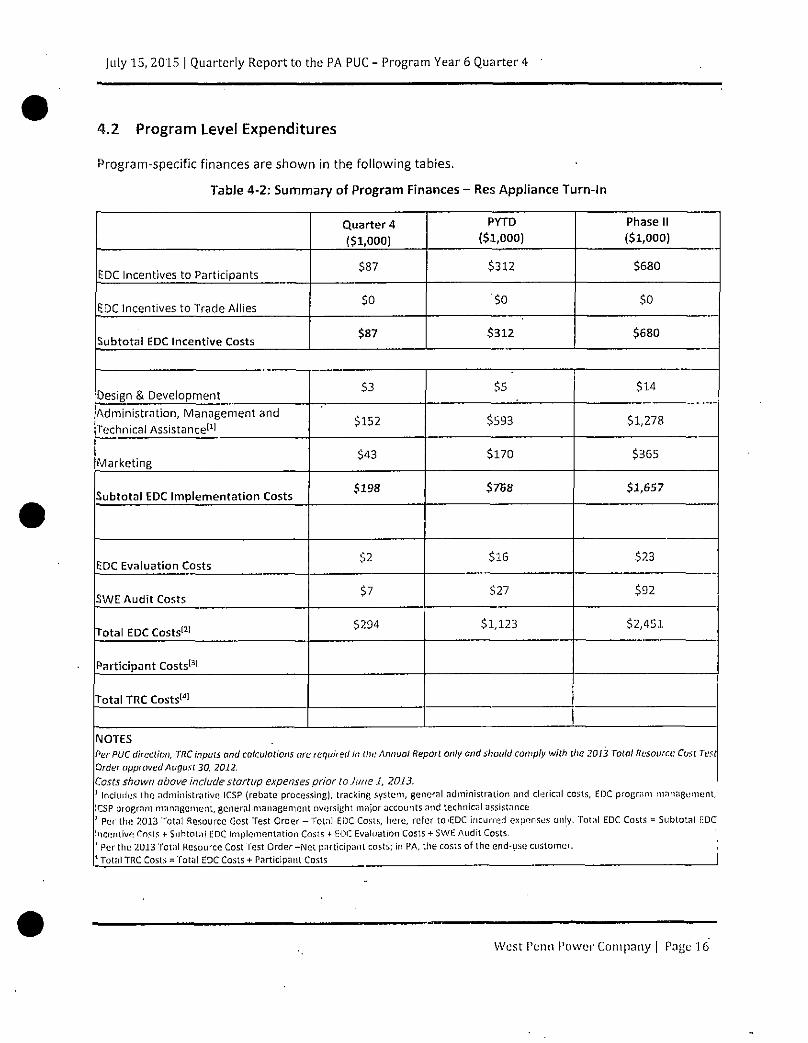
4.2 Program Level Expenditures
Program-specific finances are shown in the following tables.
Table 4-2: Summary of Program Finances - Res Appliance Turn-In
Quarter 4
($1,000)
PYTD
($1,000)
Phase II
($1,000)
EDC Incentives to Participants $87 $312 $680
EDC Incentives to Trade Allies $0 "$o $0
Subtotal EDC Incentive Costs $87 $312 $680
Design & Development $3 $5 $14
Administration, Management and
Technical Assistance' 1 1 $152 $593 $1,278
Marketing $43 $170 $365
Subtotal EDC Implementat ion Costs $198 $768 $1,657
EDC Evaluation Costs $2 $16 $23
SWE Audit Costs $7 $27 $92
Total EDC Costs' 2 1 $294 $1,123 $2,451
Participant Costs' 3 1
Total TRC Costs'"1
NOTES
Per PUC direction, TRC inputs and calculations arc required in the Annual Report only ond should comply with the P.013 Total Resource Cost Test
Order approved August 30, 2012.
Costs shown above include startup expenses prior to June i , 2013. 1 Indudiis iho administrative ICSP (rebate processing), tracking system, general administration and clerical costs, EDC program management, ICSP program management, general management oversight major accounts and technical assistance , Per the 2013 Total Resource Cost Test Order - Total EDC Costs, hero, refer to IEDC incurred expenses only. Total EDC Costs = Subtotal [:DC Incentive Costs +• Subtotal EDC Implementation Costs + HOC Evaluation Costs + SWE Audit Costs. ' Perthe 2013 Total Resource Cost Test Order-Net participant costs; in PA, the costs of the end-use customer. * Total TRC Costs = Total EDC Costs + Participant Costs
West Penn Power Company | Page 16
July 15, 2015 | Quarterly Report to the PA PUC - Program Year 6 Quarter 4
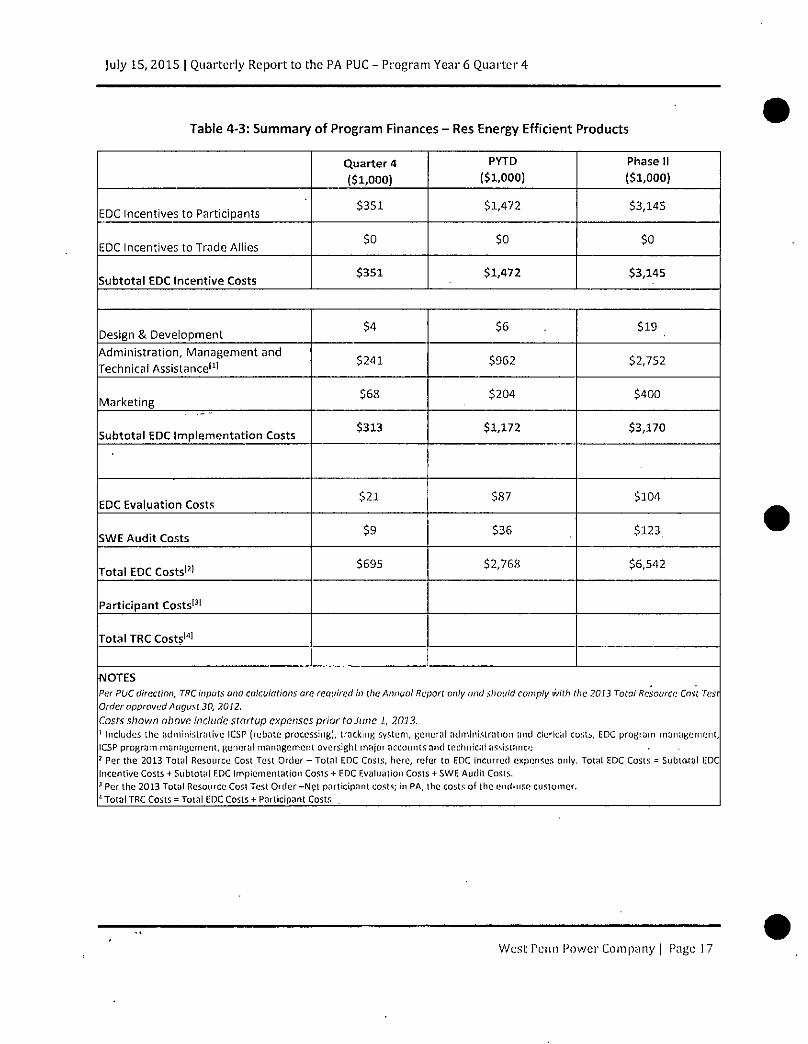
Table 4-3: Summary of Program Finances - Res Energy Efficient Products
Q u a r t e r 4
($1,000)
PYTD
($1,000)
Phase II
($1,000)
EDC Incentives to Participants $351 $1,472 $3,145
EDC Incentives to Trade Allies $0 $0 $0
Subtotal EDC Incentive Costs $351 $1,472 $3,145
Design & Development $4 $6 $19
Administrat ion, Management and
Technical Assistance' 1 ' $241 $962 $2,752
Marketing $68 $204 $400
Subtotal EDC Implementat ion Costs $313 $1,172 $3,170
EDC Evaluation Costs $21 $87 $104
SWE Audit Costs $9 $36 $123.
Total EDC Costs' 7 1 $695 $2,768 $6,542
Participant Costs' 3 1
Total TRC Costs'111
NOTES
Per PUC direction, TRC inputs and calculations are required in the Annual Report only and should comply with the 2013 Totai Resource Cost Test Order approved August 30, 2012.
Costs shown above include startup expenses prior to June 1, 2013. ' Includes the administrative ICSP (rebate processing], tracking system, general administration and clerical costs, EDC program management, ICSP program management, general management oversight major accounts and technical assistance I Per the 2013 Total Resource Cost Test Order - Total EDC Costs, hero, refer to EDC incurred expenses only. Total EDC Costs = Subtctfal EDC Incentive Costs + Subtotal EDC Implementation Costs + EDC Evaluation Costs + SWE Audit Cosis, J Per the 2013 Total Resource Cost Test Order-Npt participant costs; in PA, the costs of the eml-use customer. I I Total TRC Costs = Total EDC Costs + Participant Costs
West Penn Power Company | Page 17
July 15, 2015 ] Quarterly Report to the PA PUC - Program Year 6 Quarter 4
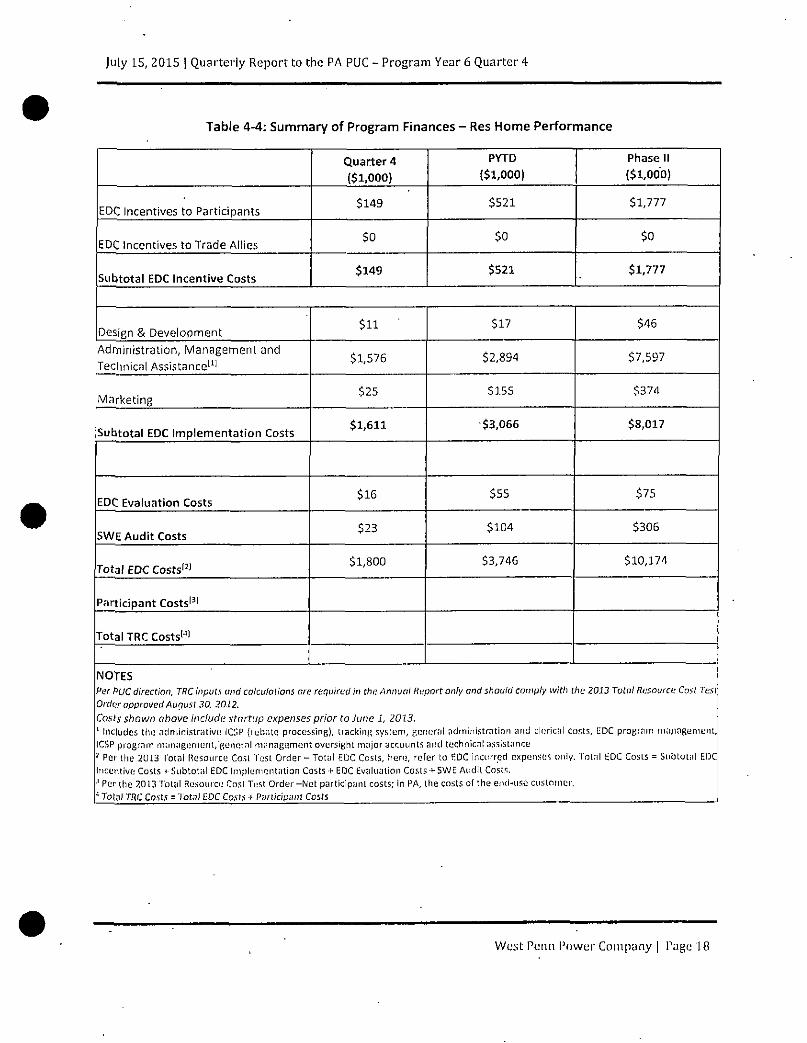
Table 4-4: Summary of Program Finances - Res Home Performance
Quarter 4
($1,000}
PYTD
($1,000)
Phase 11
($1,000)
EDC Incentives to Participants $149 $521 $1,777
EDC Incentives to Trade Allies $0 $0 $0
Subtotal EDC Incentive Costs $149 $521 $1,777
Design & Development $11 ' $17 $46
Administration, Management and
Technical Assistance 1 1 1 $1,576 $2,894 $7,597
Marketing $25 $155 $374
Subtotal EDC Implementation Costs $1,611 $3,066 $8,017
EDC Evaluation Costs $16 $55 $75
SWE Audit Costs $23 $104 $306
Total EDC Costs' 2 1 $1,800 $3,746 $10,174
Participant Costs' 3 '
Total TRC Costs' 1 '
NOTES Per PUC direction, TRC inputs and calculations are required in the Annual Report only and should comply with the 2013 Total Resource Cost Test Oni(>r approved August 30, 2012.
Costs shown above include startup expenses prior to June 1, 201.3. 1 Includes the administrative; ICSP (tubate processing), tracking system, general administratinn and cluneal costs, EDC program nia;iagement, ICSP program management, general management oversight major accounts and technical assistance ' Per the 2013 Total Resource Cosl Test Order - Total EDC Costs, here, refer lo EDC incurred expenses only. Total EDC Costs = Subtotal EDC Incentive Costs t- Subtotal EDC Implementation Costs •(• EDC Evaluation Costs + SWE Audit Costs. 1 Per the 2013 Total Resource Cosl Test Order-Net participant costs; in PA, the costs of the end-use cuslnmer. 1 Total TRC Costs = 'lotal EDC Cosis + Piniidpain Costs
West Penn PowerCompany | Page 18
July 15, 2015 | Quarterly Report to the PA PUC - Program Year 6 Quarter 4
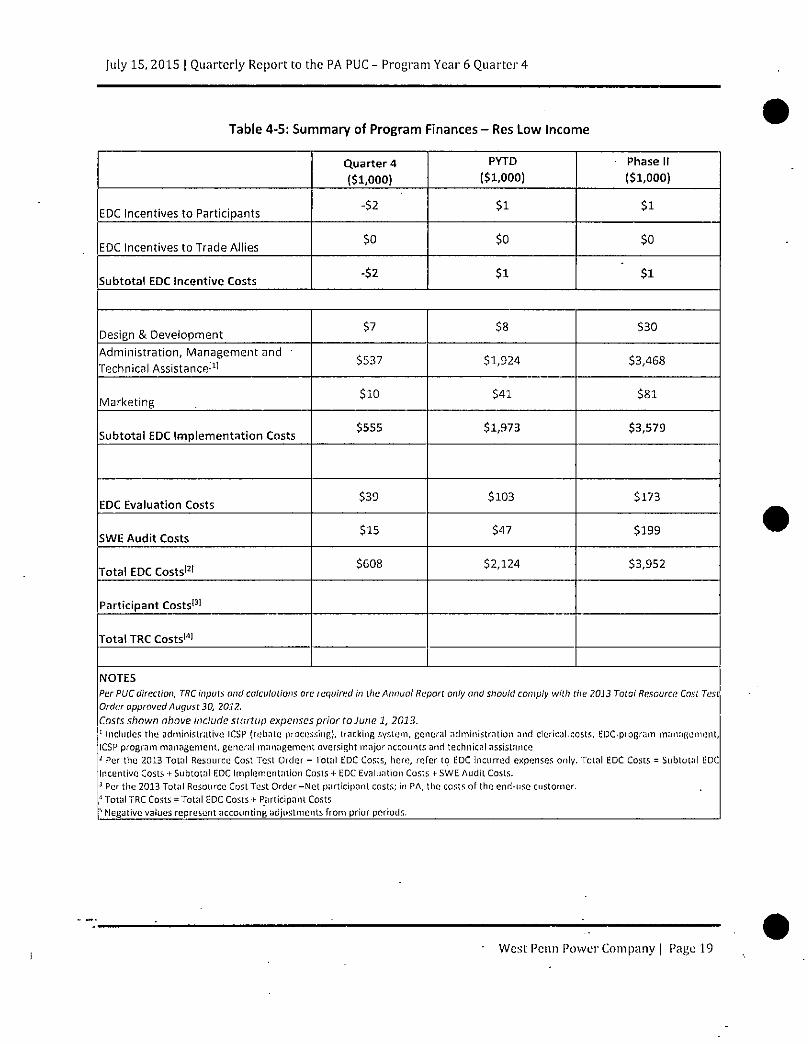
Table 4-5: Summary of Program Finances - Res Low Income
Q u a r t e r 4
($1,000)
PYTD ($1,000)
Phase II
($1,000)
EDC Incentives to Participants -$2 $1 $ 1
EDC Incentives to Trade Allies $0 $0 $0
Subtotal EDC incentive Costs -$2 $ 1 $1
Design & Development $7 $8 $30
Administration, Management and ' Technical Assistance11'
$537 $ 1 , 9 2 4 $3,468
Marketing $10 $ 4 1 $81
Subtotal EDC Implementation Costs $555 $ 1 , 9 7 3 $3,579
EDC Evaluation Costs $39 $103 $173
SWE Audit Costs $15 $47 $199
Total EDC Costs'2' $608 $2 ,124 $3,952
Participant Costs'3'
T o t a l TRC Cos ts ' 4 1
NOTES
Per PUC direction, TRC inputs and calculations are required in the Annual Report only and should comply with the 2013 Total Resource Cost Test Order approved August 30, 2012.
Costs shown above include startup expenses prior to June 1, 2013. 1 Includes the administrative ICSP (rebate piocessinp,}, tracking system, general administration and clerical.costs, EDdprogram management, ICSP program management, general management oversight major accounts and technical assistance 1 Per the 2013 Total Resource Cost Test Order - Total EDC Costs, here, refer to EDC incurred expenses only. Total EDC Costs = Subtotal EDC Incentive Costs + Subtotal EDC Implementation Costs + EDC Evaluation Costs r SWE Audit Costs. 3 Per the 2013 Total Resource Cost Test Order -Net participant costs; in PA, the costs of the end-use customer. 1 Total TRC Costs = Total EDC Costs H Participant Costs ^ Negative values represent accounting adjustments from prior periods.
West Penn Power Company | Page 19

July 15, 2015 | Quarterly Report to the PA PUC - Program Year 6 Quarter 4
Table 4-6: Summary of Program Finances - Small Cl Efficient Equipment
Quarter 4
($1,000)
PYTD
($1,000) .
Phase II
($1,000)
EDC incentives to Participants $233 $1,087 $1,845
EDC Incentives to Trade Allies $0 $0 $0
Subtotal EDC Incentive Costs $233 $1,087 $1,845
Design & Development $6 $9 $26
Administrat ion, Management and
Technical Assistance' 1 1 $270 $1,162 $2,653
Marketing $54 $210 $408
Subtotal EDC Implementation Costs $330 $1,381 $3,087
EDC Evaluation Costs $25 $108 $135
SWE Audit Costs $13 $52 $175
Total EDC Costs' 2 1 $601 $2,628 $5,242
Participant Costs 1 3'
Total TRC Costs'"1
NOTES
Per PUC dircctinn, TRC inputs and calculations are required in the Annual Report only and should comply with the 2013 Total Resource Cost Test Order approved August 30, 201?..
Costs shown above include startup expenses prior to June 1, 2013. 1 Includes tlie administrative ICSP (rebate processing), tracking system, general administration and clerical costs, CDC program management, ICSP program management, general management oversight major accounts and technical assistance ' Per tlie 2013 Totnl Resource Cost Test Order - Total EDC Costs, here, refer to EDC incurred expenses only. Total EDC Costs = Subtotal EDC Incentive Costs + Subtotal EDC Implementation Costs + EDC Evaluation Costs ** SWE Audit Costs. 3 Per the 2013 Total Resource Cost Test Order-Net participant costs; in PA, the costs of the end-use customer. ' ToUil TRC Costs = Total EDC Costs + Participant Costs
West Penn Power Company | Page 20
July 1.5, 2015 | Quarterly Report to the PA PUC - Program Year 6 Quarter 4
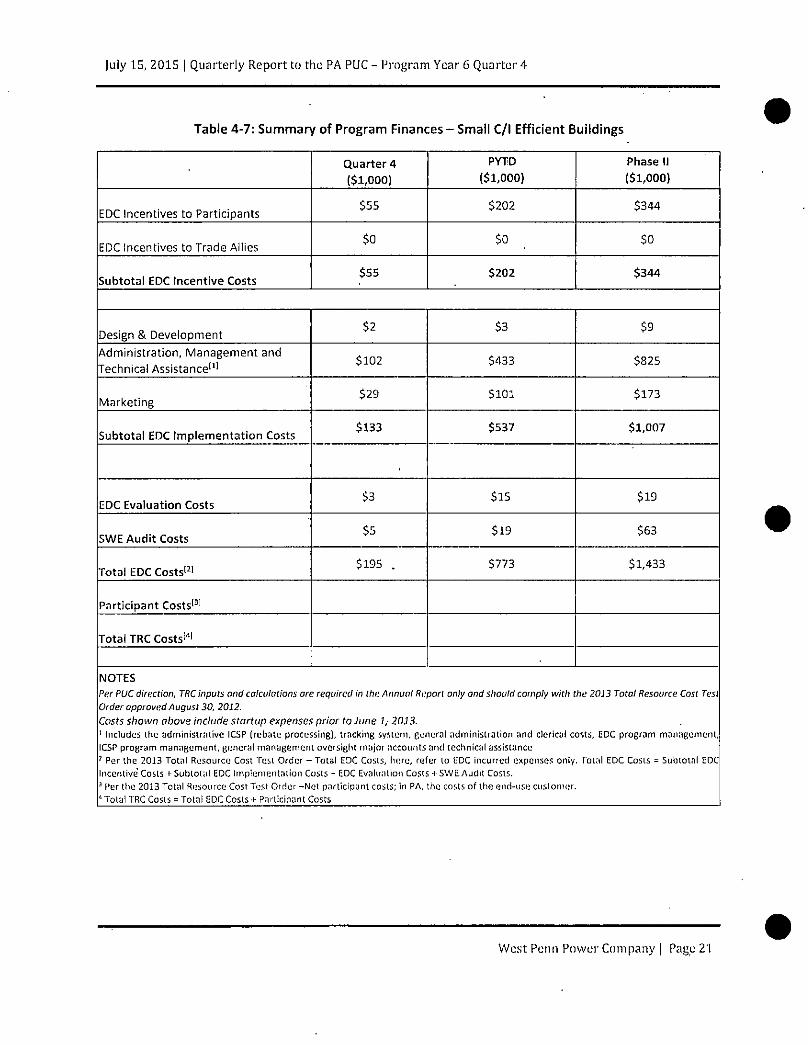
Table 4-7: Summary of Program Finances - Small C/l Efficient Buildings
Quarter 4
($1,000)
PYTD
($1,000)
Phase II
($1,000)
EDC Incentives to Participants $55 $202 $344
EDC Incentives to Trade Allies $0 5° $0
Subtotal EDC Incentive Costs $55 $202 $344
Design & Development $2 $3 $9
Administration, Management and
Technical Assistance 1 ' 1 $102 $433 $825
Marketing $29 $101 $173
Subtotal EDC Implementat ion Costs $133 $537 $1,007
EDC Evaluation Costs $3 $15 $19
SWE Audit Costs $5 $19 $63
Total EDC Costs 1 2 1 $195 . $773 $1,433
Participant Costs' 3 1
Total TRC Costs!'11
NOTES
Per PUC direction, TRC inputs ond calculations ore required in the Annual Report only and should comply with the 2013 Total Resource Cost Test Order approved August 30, 2012.
Costs shown above include startup expenses prior to June 1,- 2013. 1 Includes the administrative ICSP (rebate processing), tracking system, general administration and clerical costs, EDC program management, ICSP program management, general management oversight major accounts and technical assistance 1 Per the 2013 Tolal Resource Cost Test Order - Total EDC Costs, here, refer to EDC incurred expenses only. Total EDC Costs - Subtotal EDC Incentive Costs r Subtotal EDC Implementation Costs + EDC Evaluation Costs + SWE.Audit Costs. 3 Per the 2013 Total Resource Cost Test Order -Net participant costs; in PA, the costs of the end-use customer. * Tolal TRC Cosls = Total EDC Costs + Participant Costs
West Penn Power Company | Page 2*1
July 15, 2015 | Quarterly Report to the PA PUC - Program Year 6 Quarter 4
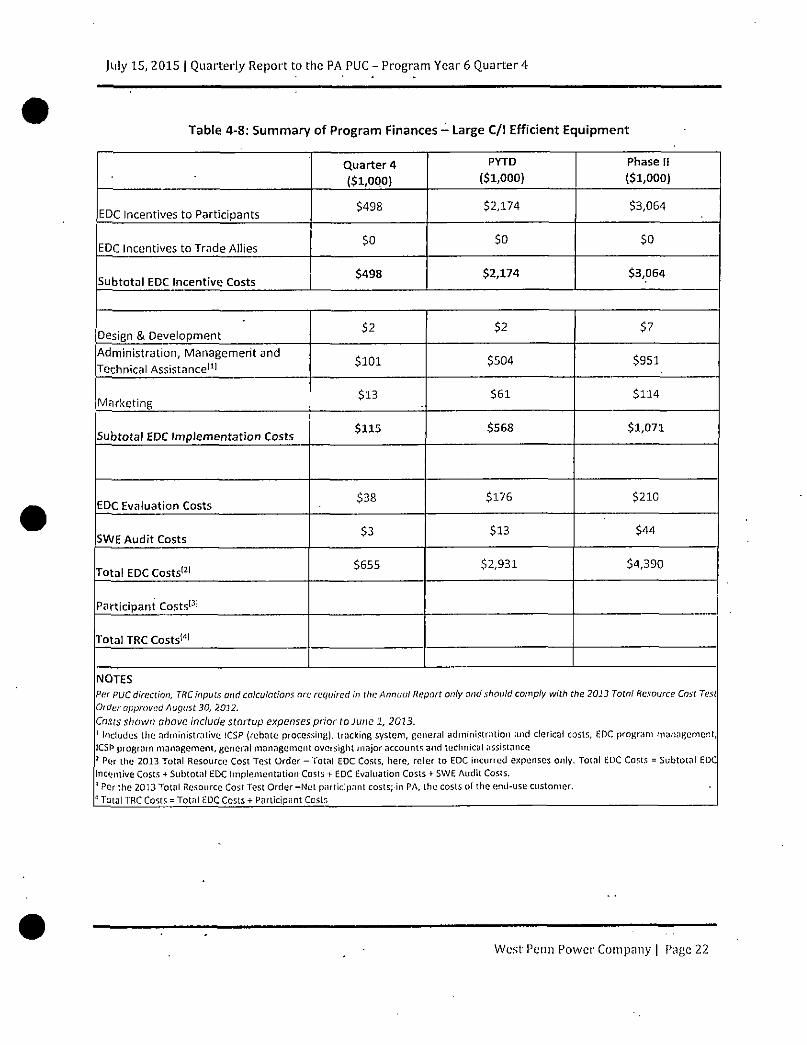
Table 4-8: Summary of Program Finances - Large C/l Efficient Equipment
Quarter 4
($1,000)
PYTD
($1,000)
Phase li
($1,000)
EDC Incentives to Participants $498 $2,174 $3,064
EDC Incentives to Trade Allies $0 $0 $0
Subtotal EDC Incentive Costs $498 $2,174 $3,064
Design & Development $2 $2 $7
Administration, Management and
Technical Assistance 1 ' 1 $101 $504 $951
Marketing $13 $61 $114
Subtotal EDC Implementat ion Costs $115 $568 $1,071
EDC Evaluation Costs $38 $176 $210
SWE Audit Costs $3 $13 $44
Total EDC Costs 1 2 1 $655 $2,931 $4,390
Participant Costs' 3 1
Total TRC Costs1"'
NOTES
Par PUC direction, TRC inputs ond calculations ore required in the Annual Report only and should comply with the 2013 Totnl Resource Cost Test Order approved August 30, 2012.
Costs shown above indude startup expenses prior to June 1, 2013. 1 Includes the administrative ICSP (rebate processiiifj), tracking system, general administration and clerical cosls, EDC program management, ICSP program management, general management oversight major accounts and technical assistance 1 Pftr the 2013 Total Resource Cost Test Order - Total EDC Costs, here, refer to EDC incurred expenses only. Total EDC Costs = Subtotal EDC Incimiive Costs + Subtotal EDC Implementation Costs + EDC Evaluation Costs *- SWE Audit Costs. 1 Per the 2013 Total Resource Cost Test Order -Not participant costs; in PA, the costs of the end-use customer. 4 Total TRC Costs = Total EDC Costs + Participant Costs
West Penn Power Company | Page 22
July 15, 2015 | Quarterly Report to the PA PUC - Program Year 6 Quarter 4
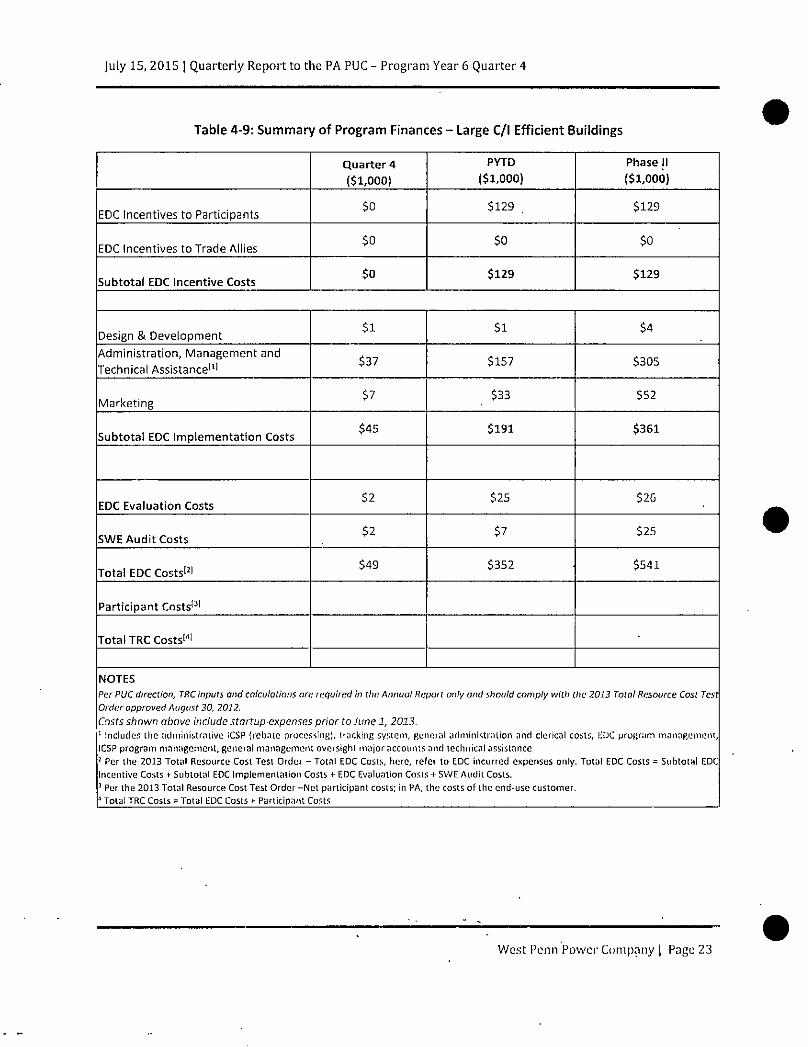
Table 4-9: Summary of Program Finances - Large C/l Efficient Buildings
Q u a r t e r 4
($1,000)
PYTD
($1,000)
Phase II
($1,000)
EDC Incentives to Participants $0 $129 . $129
EDC Incentives to Trade Allies $0 $0 $0
Subtotal EDC Incentive Costs $o $129 $129
Design & Development $1 $1 $4
Administrat ion, Management and
Technical Assistance' 1 1 $37 $157 $305
Marketing $7 . $ 3 3 $52
Subtotal EDC Implementat ion Costs $45 $191 $361
EDC Evaluation Costs $2 $25 $26
SWE Audi t Costs $2 $7 $25
Total EDC Costs' 2 1 $49 $352 $541
Participant Costs 1 3 1
Total TRC Costs'"1
NOTES
Par PUC direction, TRC inputs and calculations are required in tha Annual Report only and should comply with [lie 2013 Total Resource Cost Test Order approved August 30, 2012.
Costs shown above indude startup expenses prior to June 1, 2013. 1 Includes the administrative ICSP (rebate processing), tracking system, general administration and clerical costs, EDC program management, ICSP program management, general management oversight major accounts and technical assistance 1 Per the 2013 Total Resource Cost Test Order - Total EDC Costs, here, refer to EDC incurred expenses only. Total EDC Costs = Subtotal EDC Incentive Costs + Subtotal EDC Implementation Costs *• EDC Evaluation Costs + SWE Audit Costs. 3 Per the 2013 Total Resource Cost Test Order -Net participant costs; in PA, the costs of the end-use customer. 4 Total TRC Costs = Total EDC Costs + Participant Costs
West Penn Power Company [ Page 23
July 15, 2015 | Quarterly Report to the PA PUC - Program Year 6 Quarter 4
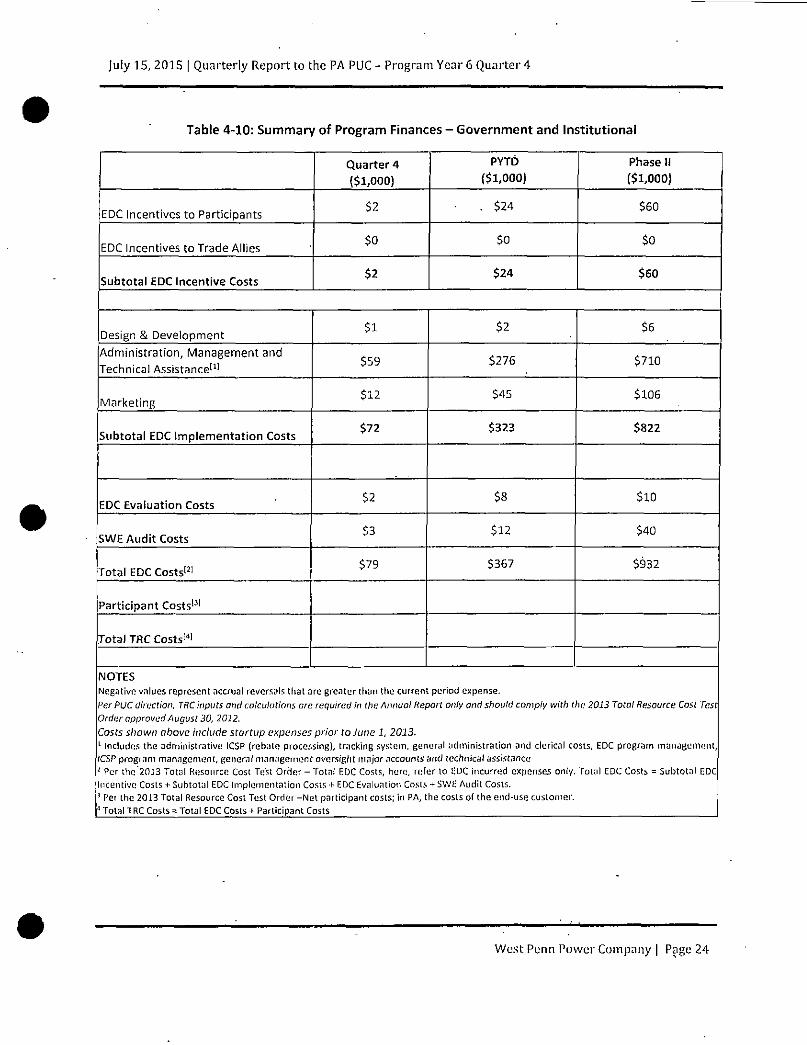
Table 4-10: Summary of Program Finances - Government and Institutional
Quarter 4
($1,000)
PYTD
($1,000)
Phase II
($1,000)
EDC Incentives to Participants $2 • . $24 $60
EDC Incentives to Trade Allies $0 $0 $0
Subtotal EDC Incentive Costs $2 $24 $60
Design & Development $1 $2 $6
Administration, Management and
Technical Assistance' 1 ' $59 $276 $710
Marketing $12 $45 $106
Subtotal EDC Implementat ion Costs $72 $323 $822
EDC Evaluation Costs $2 $8 $10
SWH Audit Costs $3 $12 $40
Total EDC Costs' 2 1 $79 $367 $932
Participant Costs' 3 '
Total TRC Costs 1 4 '
NOTES
Negative values represent accrual reversals tliat are greater than the current period expense.
Per PUC direction, TRC inputs ond cokulations are required in the Annual Report only and should comply with the 2013 Total Resource Cost Test Order approved August 30, 2012.
Costs shown above include startup expenses prior to June 1, 2013. 1 Includes the administrative ICSP (rebate processing}, tracking system, general administration and clerical costs, EDC program management, (CSP program management, general management oversigfit major accounts and technical assistance i Per the"20J3 Total Resource Cost Test Order - Total EDC Costs, here, refer to EDC incurred expenses only. Total EDC Costs = Subtotal EDC Incentive Costs + Subtotal EDC Implementation Costs + EDC Evaluation Costs + SWE Audit Cosls. J Per the 2013 Total Resource Cost Test Order -Net participant costs; in PA, the cosls of the end-use cuslomer. 1 Total T RC Costs = Total EDC Cosls + Participant Costs
West Penn Power Company | Page 24