fis 2013 resistance surveillance: the uk landscape fis pdf/monday/hall 1/alasdair... · problems...
TRANSCRIPT

FIS 2013
Resistance Surveillance:
The UK Landscape
Alasdair MacGowan Chair BSAC Working Party on Antimicrobial Resistance Surveillance

A statement of the obvious
“Good quality surveillance data on resistant
micro-organisms are essential to underpin
effective interventions to counter the
problems of resistance and developing
guidelines on prescribing antimicrobial drugs.
Such data should be epidemiologically and
clinically relevant.”
Copenhagen Recommendations
European Union, 1998

Problems with antimicrobial surveillance in the last 20 years
routine passive surveillance was biased by disease state,
age, uneven methodologies in and outside labs. However,
large data sets are captured.
sentinel focused surveillance using central laboratory
overcomes some problems by use of standard within lab
methods but not requesting bias and is costly
poor dissemination of data – public/private providers
and funders
Based on Livermore, MacGowan, Wale, 1998; BMJ 317, 614-5

Epidemiologically relevant data?
Passive Surveillance
Collection of antimicrobial resistance data in the community
i.e. UK/Ireland – depends on healthcare system
Patient presents with infection
Primary
Care Doctor Primary Care Nurse Other NHS Direct
Accident Departments
(OTC Pharmacy) Specimen sent to laboratory
Bacteria isolated, identified and susceptibility tests
performed using routine methods
Confirmed and repeated
by central laboratory
using “gold standard
methods”
Results entered into
Laboratory Information
Management System
(LIMS)
Resistance Data Base

Pitfalls with passive surveillance
Data skewed because patients who fail initial empirial
therapy more likely to be tested
Age bias in LIMS towards the elderly and young
Location of patient (Admission Unit vs Primary Care)
Isolates from different disease states included in
database disproportionately:- i.e. Acute Sinusitis vs
UTI, exacerbation COPD vs CAP
Specimens may be sent for non-infective reasons

Proportion of patients
Age Band
In community
In hospital <48h
16-40 0.28 0.11 40-49 0.16 0.05 50-59 0.15 0.07 60-69 0.19 0.18 70-79 0.17 0.31
80 0.05 0.27
Lovering, unpublished
Specimen referral by location and age for community LRTI:
Sputum

Ampicillin resistance in H.influenzae rate
Laboratory database (passive surveillance)
0.20
Unselected patients with LRTI who received an antibiotic (n=20)
0.11
MacGowan et al, 1998
Assessment of Biases: Sputum Referral
Single Practice
1:35 episodes of GP diagnoses “Chest Infection”
results in sputum referral

Patient Group TMP
n %S P CI
Acute UTI
55
81
0.343
0.394 – 1.38 Laboratory data
5448
76
Lovering & MacGowan, 2003
Assessment of Bias: Laboratory Database vs UTI
Symptoms in UTI Group, i.e. culture >105 pathogen
Pain on urination 0.85
Increased frequency 0.87
Blood in urine 0.25
Increased urgency 0.65
Urination at night 0.56
Abdominal pain 0.56
Back pain 0.38
Smelly urine 0.44

Number of isolates required
90% power
80% power
+10% 208 152 +5% 801 592 -5% 714 542 -10% 163 127
But significantly underpowered:-
If true rate of resistance in laboratory database is 24%
Patients recruited over 2-3 years : 55

Problem with sentile surveillance in Primary Care
Acute Infection Group
UTI (n=165) Cough (n=197) Throat (n=249)
Urine sample (n=150) Sputum sample (n=99) Throat swab (n=243)
Potential pathogen
(n=67)
Potential pathogen
(n=23)
Potential pathogen
(n=38)
E.Coli (n=59)
Proteus (n=3)
Klebsiella (n=4)
Other (n=2)
H.influenzae (n=13)
S.pneumoniae (n=8)
M.catarrhalis (n=1)
Group A n=79
Group C n=11
Group G n=6

BSAC antimicrobial resistance surveillance contribution:
Overcomes previous perceived problems:
continuous since 1999
based on uniform within laboratory methodology
target at relevant resistances by use of a core
testing set
allow cross validation with other resistance data
bases
data is widely available
Does not overcome:
bias related to passive surveillance in the
community
partly answers concerns about how
representative sampling is (increase from 25 to 40
collecting labs)
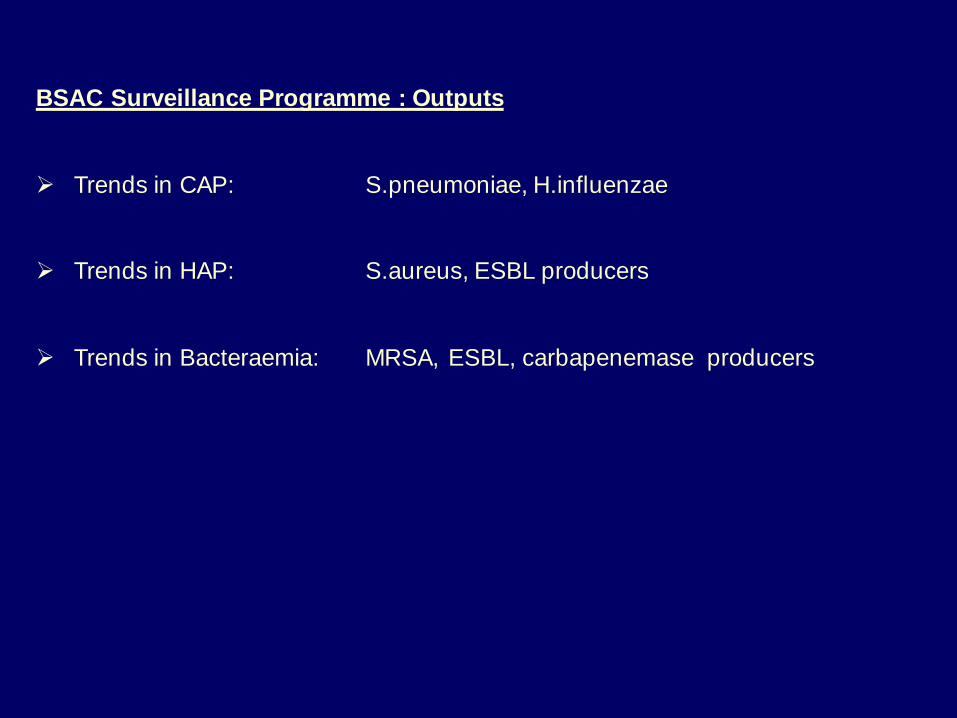
BSAC Surveillance Programme : Outputs
Trends in CAP: S.pneumoniae, H.influenzae
Trends in HAP: S.aureus, ESBL producers
Trends in Bacteraemia: MRSA, ESBL, carbapenemase producers

CAP Programme: S. pneumoniae (420) % non-susceptible

Both Programmes: Penicillin non-susceptible S.pneumoniae
- Great Britain data
Year Respiratory programme
Bacteraemia programme
1999-00 7.2% 2000-01 7.2% 6.8% 2001-02 4.4% 7.1% 2002-03 6.1% 8.0% 2003-04 5.7% 3.0% 2004-05 5.3% 2.0% 2005-06 4.3% 4.2% 2006-07 4.9% 4.3% 2007-08 4.7% 2.2% 2008-09 5.3% 3.7% 2009-10 7.5% 4.3% 2010-11 5.8% 3.6% 2011-12 10.9% 8.3%

% Penicillin non-susceptibility in pneumococci:
BSAC bacteraemia surveillance

CAP Programme: H. influenzae (516) % non-susceptible

HAP Programme: E. coli (274)

2008-09 2009-10 2010-11
non-
ICU ICU
non-
ICU ICU
non-
ICU ICU
Klebsiella spp.
%ESBL 18% 20% 7% 9% 13% 8%
% ctx-M 30% 35% 17% 33% 67% 50%
Escherichia
coli
%ESBL 16% 13% 17% 16% 13% 9%
% ctx-M 81% 71% 85% 53% 85% 73%
Enterobacter
spp.
%ESBL 9% 6% 8% 7% 5% 6%
% ctx-M 57% 60% 60% 50% 0% 0%
HAP Programme: ESBL prevalence

HAP Programme: S. aureus (226) % non-susceptible
P <0.0005

01
02
03
04
05
06
0
Iso
late
s, %
2001 2002 2003 2004 2005 2006 2007 2008
England Wales, Scotland, N. Ireland, Ireland
% MRSA over time (BSAC surveillance)
Bacteramia Programme:

0
2000
4000
6000
8000
10000
12000
N o
f M
RS
A b
acte
rae
mia
s0
10
20
30
40
50
60
MR
SA
, %
of is
ola
tes
2001 2002 2003 2004 2005 2006 2007 2008
% MRSA in S. aureus bacteraemia (BSAC surveillance)
Number of MRSA bacteraemias (mandatory reports)
MRSA bacteraemia in England
0
5
10
15
20
25
30
35
40
45
01 02 03 04 05 06 07 08 09 10
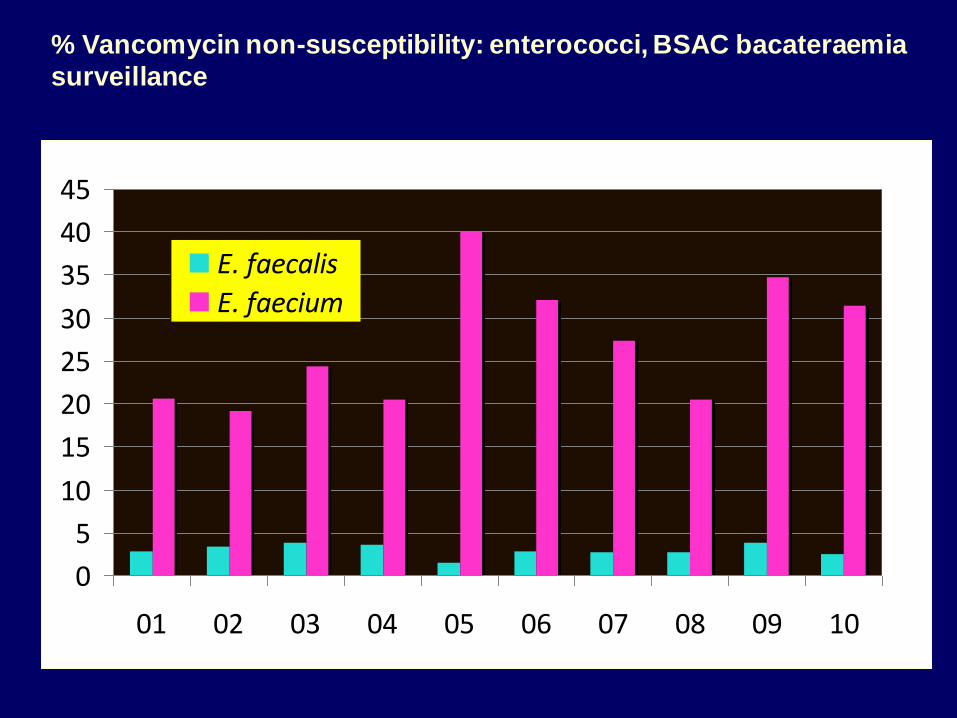
E. faecalis
E. faecium
% Vancomycin non-susceptibility: enterococci, BSAC bacateraemia
surveillance

0
5
10
15
20
25
30
2001 2002 2003 2004 2005 2006 2007 2008 2009 2010
Cipro
C'taxime
Gentamicin
BSAC E. coli from bacteraemia (n = 3149; 242-530 p.a.)

E.coli - ESBL prevalence
segmented logistic regression
BSAC Bacteraemia 2001-2008
05
10
15
ES
BL p
roducers
, %
of is
ola
tes
2001 2002 2003 2004 2005 2006 2007 2008
Observed, mean for year Model
Q3 2005
p <0.0005
OR = 1.76
p = 0.15
OR = 0.86

0
2
4
6
8
10
12
14
16
02 03 04 05 06 07 08 09 10
Other/undefined
AmpC
non-CTX-M ESBL
CTX-M
Livermore et al., JAC 2008; 62 2: ii41-54, updated
Ceph-R mechanisms BSAC % Prevalence E. coli

Carbapenemase-producing Enterobacteria: BSAC bacteraemia
2003-4 2 Enterobacter, KPC-4. ?Same patient
2009 1 Klebsiella, NDM
2009 1 Enterobacter, IMP
2010 1 Enterobacter, VIM
2010 1 Enterobacter, IMI
2010 1 Klebsiella, VIM
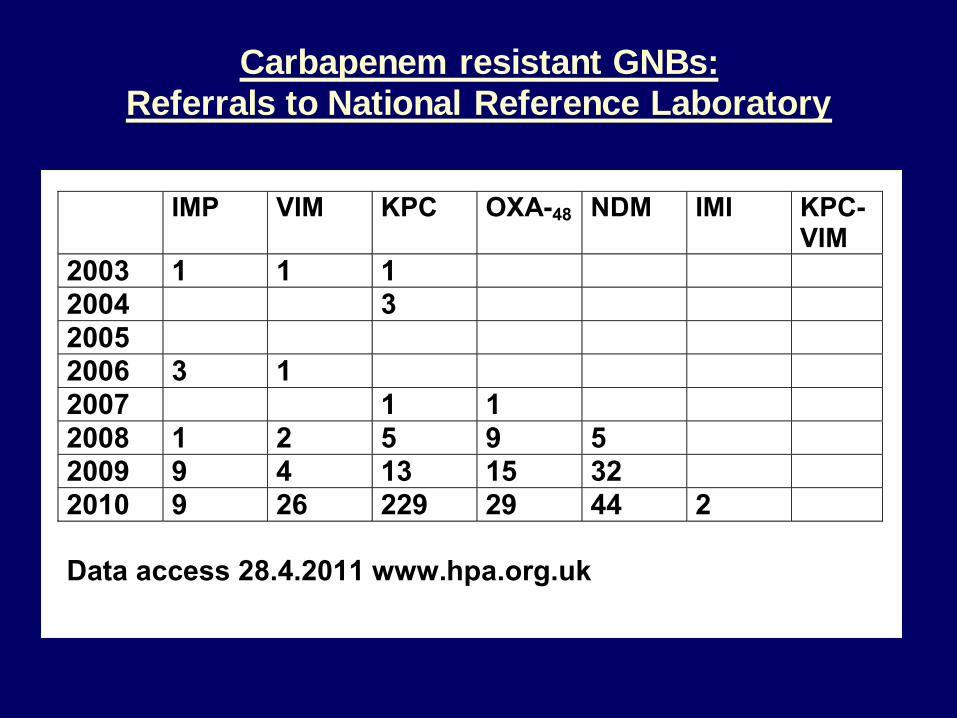
Carbapenem resistant GNBs:
Referrals to National Reference Laboratory
IMP VIM KPC OXA-48 NDM IMI KPC-VIM
2003 1 1 1
2004 3
2005
2006 3 1
2007 1 1
2008 1 2 5 9 5
2009 9 4 13 15 32
2010 9 26 229 29 44 2
Data access 28.4.2011 www.hpa.org.uk

Geometric mean with 95% CI, conventional calculation
Vancomycin fitted line = 0.074 log2 units/year; p = 0.002
Teicoplanin fitted line = -0.069 log2 units/year; p = 0.003
-2-1
01
2
log
2(M
IC)
0.2
50
.51
24
MIC
, m
g/L
2001 2002 2003 2004 2005 2006 2007Year
Original MICs for 271 MRSA
Vancomycin MIC creep – bacteraemia isolates

Geometric mean with 95% CI, from interval regressionGradient of fitted line = -0.027 log2 units/year; p = 0.006
-2-1
01
log
2(M
IC)
0.2
50
.51
2
MIC
, m
g/L
2001 2002 2003 2004 2005 2006 2007Year
Vancomycin MICs for 271 MRSA - re-test

Conclusions:
What the BSAC Resistance Surveillance Programme has shown:
Long term non-public sector surveillance of antimicrobial resistance is possible
In CAP:
- decline in penicillin non-susceptible S.pneumoniae with recent increase, with
shift in serotype – vaccine types down
- significant increase in resistance to aminopenicillin H.influenzae
In HAP
- short term results so far
- most resistance stable, ESBL producers, few carbapenem resistant Klebsiella
- P.aeruginosa resistance higher in ICU especially carbapenem and
piperacillin/tazobactam
- S.aureus resitance not higher in ICU with drop in MRSA (MecA, ciprofloxacin,
erythromycin resistance)
…/cont’d

Conclusions cont’d
Bacteraemia
- decline in MRSA
- rise then plateauing and fall of CTXM
- carbapenemase beginning to register
- Not much happening with P.aeruginosa
- vancomycin MIC shift in MRSA is not a problem.

Thanks to:
Dr Ian Morressy, formerly of Quotient
Professor David Livermore
Dr Rosy Reynolds
Also:
- Collecting laboratories
- Central laboratories
- Website provider (MRS)
- Working Party Members
- Commercial Sponsors
- BSAC