fiscal 4q16 earnings release finals21.q4cdn.com › ... ›...
TRANSCRIPT
News Release
SPRINT RETURNS TO NET OPERATING REVENUE GROWTH, NEAR-RECORD OPERATING INCOME, AND POSITIVE ADJUSTED FREE CASH FLOW* WITH FISCAL
YEAR 2016 RESULTS
• Fiscal year 2016 postpaid phone net additions of 930,000 more than doubled year-over-year
o Highest postpaid phone gross additions in four years o Fiscal fourth quarter postpaid phone net additions of 42,000 were the tenth consecutive
quarter of year-over-year improvement
• Return to prepaid customer growth with 180,000 net additions in the fiscal fourth quarter
• Fiscal year 2016 net operating revenues of $33.3 billion grew for the first time in three years o Fiscal fourth quarter net operating revenues of $8.5 billion grew 6 percent year-over-year
• Fiscal year 2016 net loss of $1.2 billion, operating income of $1.8 billion, and Adjusted EBITDA* of
nearly $10 billion o Highest operating income in 10 years and highest Adjusted EBITDA* in nine years o $2.1 billion of year-over-year reductions in cost of service and selling, general, and
administrative expenses in fiscal year 2016 o Fiscal fourth quarter net loss of $283 million, operating income of $470 million, and
Adjusted EBITDA* of $2.7 billion
• Fiscal year 2016 net cash provided by operating activities of $4.2 billion and adjusted free cash flow* of $607 million
OVERLAND PARK, Kan. – May 3, 2017 – Sprint Corporation (NYSE: S) today reported operating results for the fiscal year 2016 fourth quarter and full year, including annual growth in net operating revenues for the first time in three years and more than twice as many postpaid phone net additions as last year. The company also reported its highest annual operating income in 10 years at $1.8 billion, Adjusted EBITDA* of nearly $10 billion for the year, which grew 22 percent year-over-year, and positive adjusted free cash flow*. For the fiscal fourth quarter, the company reported operating income of $470 million and Adjusted EBITDA* of $2.7 billion, both improvements of more than $450 million year-over-year. “Sprint took a big step forward in the second year of our turnaround plan,” said Sprint CEO Marcelo Claure. “Net operating revenues returned to growth and cost reductions accelerated, leading to the highest operating income in a decade and a return to positive adjusted free cash flow*.” Postpaid Phone Net Additions More Than Double Year-Over-Year and Prepaid Returns to Growth
Sprint’s focus on delivering the most attractive value proposition in wireless resulted in 930,000 postpaid phone net additions in fiscal year 2016, more than twice as many as the prior year. The company also reported its highest postpaid phone gross additions in four years and improved its share of gross additions for the second year in a row. In a competitive quarter where Verizon and AT&T introduced new unlimited data plans, Sprint added 42,000 postpaid phone customers and recorded its tenth consecutive quarter of year-over-year improvement. Sprint continued to take share and has now added more postpaid phone customers than Verizon for five consecutive quarters and more than AT&T for 10 consecutive quarters.

News Release
The company also saw significant improvements in its prepaid business in the quarter, adding 180,000 customers and returning to customer growth for the first time in two years. With the resurgence of prepaid and the continued growth in postpaid phone customers, the company reported positive net additions for both in the same quarter for the first time in four years. The company also reported the following results:
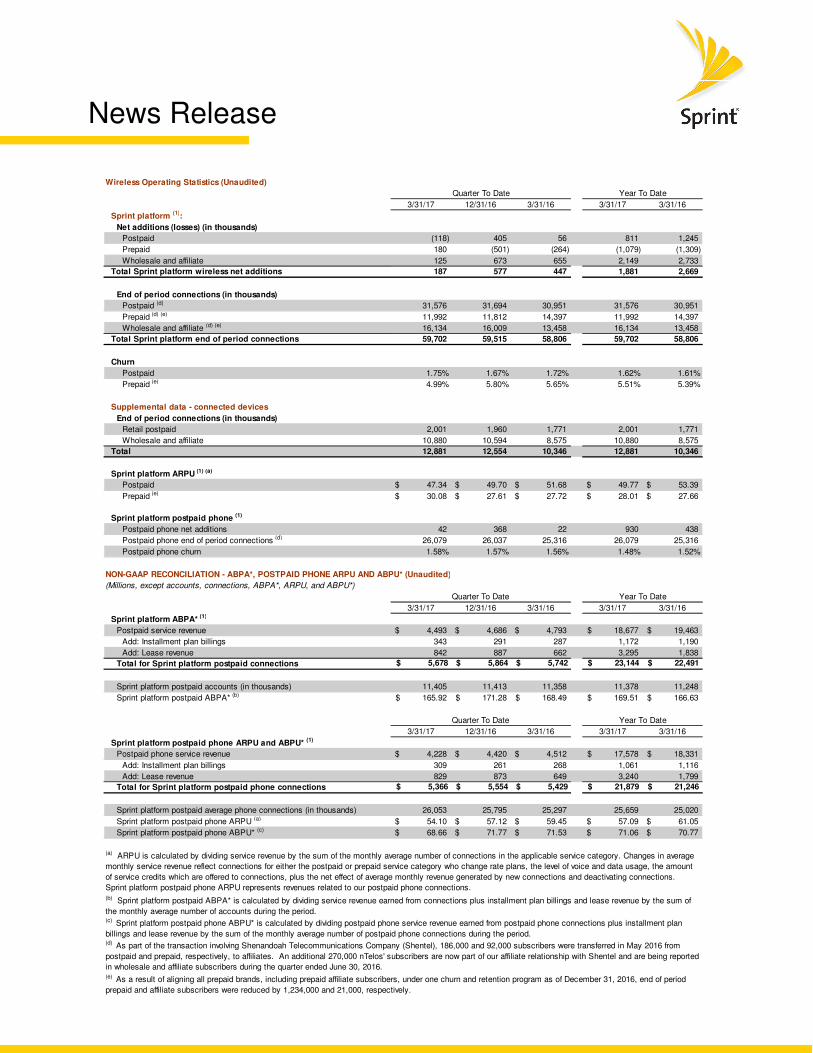
• Total net additions were 187,000 in the quarter, including postpaid net losses of 118,000, prepaid net additions of 180,000, and wholesale and affiliate net additions of 125,000. For the full year, total net additions were 1.9 million, including postpaid net additions of 811,000, prepaid net losses of 1.1 million, and wholesale and affiliate net additions of 2.1 million.
• Postpaid phone churn was 1.58 percent and total postpaid churn was 1.75 percent in the quarter. For the full year, postpaid phone churn of 1.48 percent was the lowest in company history and total postpaid churn was 1.62 percent.
Another Year of Significant Cost Reductions Sprint continued to make progress on its multi-year plan to transform the way it does business and significantly lower its cost structure. The company delivered $2.1 billion of year-over-year reductions in cost of service and selling, general and administrative expenses in fiscal year 2016, bringing the two-year total reduction to $3.4 billion. The company also reported the following financial results:
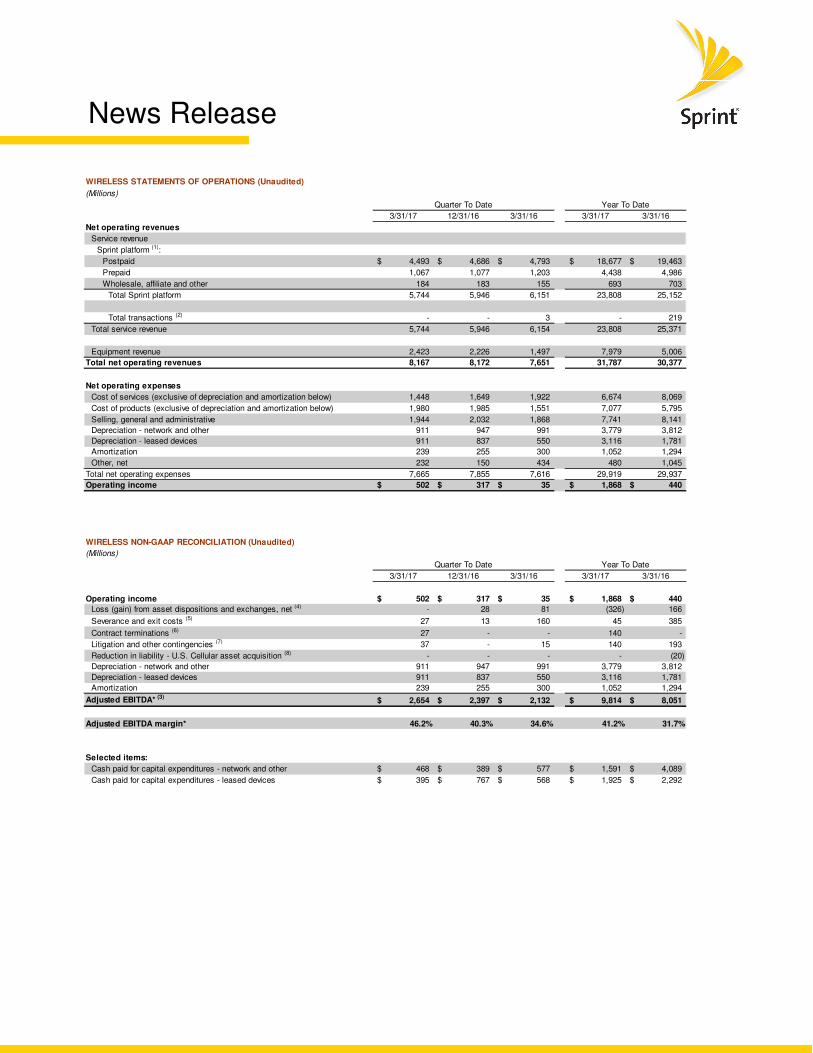
• Net operating revenues of $8.5 billion in the quarter grew 6 percent year-over-year and increased year-over-year for the third consecutive quarter. For the full year, net operating revenues of $33.3 billion grew 4 percent and increased year-over-year for the first time in three years.
• Net loss of $283 million, or $0.07 per share, in the quarter compared to a net loss of $554 million, or $0.14 per share, in the year-ago period, an improvement of $271 million, or $0.07 per share. For the full year, net loss of $1.2 billion, or $0.30 per share, compared to a net loss of $2 billion, or $0.50 per share, in the year-ago period, an improvement of $789 million, or $0.20 per share.
• Operating income of $470 million in the quarter compared to $8 million in the year-ago period, an improvement of $462 million. For the full year, operating income of $1.8 billion improved by $1.5 billion year-over-year and reached its highest level in 10 years.
• Adjusted EBITDA* of $2.7 billion in the quarter grew year-over-year by $522 million or 24 percent. For the full year, Adjusted EBITDA* of nearly $10 billion grew year-over-year by $1.8 billion or 22 percent.
• Net cash provided by operating activities of $1.3 billion in the quarter was in line with the year-ago period. For the full year, net cash provided by operating activities was $4.2 billion compared to $3.9 billion in the year-ago period.
• Adjusted free cash flow* was $80 million in the quarter compared to $603 million in the year-ago period. For the full year, adjusted free cash flow* was positive $607 million compared to negative $1.4 billion in the year-ago period, an improvement of $2 billion.
Obtaining Lower Cost Funding to Retire Higher Cost Debt Sprint continued to execute its financing strategy of diversifying its funding sources, lowering its cost of capital, and reducing its future cash interest expenses. During the quarter Sprint replaced its $3.3 billion unsecured revolving bank credit facility with a new $6 billion secured credit facility, consisting of a $4 billion seven-year term loan and a $2 billion four-year revolving bank credit facility. At closing, the company borrowed $4 billion on the term loan facility at a rate of LIBOR plus 250 basis points, which is about half of Sprint’s current effective interest rate.
News Release
The company also retired approximately $1.6 billion of debt maturities with higher interest payments in the quarter, including $1 billion of 9.125 percent senior notes, $300 million associated with its Network LeaseCo facility, and $250 million related to the early retirement of tranche 4 of its EDC facility. Total liquidity was $10.9 billion at the end of the quarter, including $8.3 billion of cash, cash equivalents and short-term investments. Additionally, the company has $1.2 billion of availability under vendor financing agreements that can be used toward the purchase of 2.5GHz network equipment. New Technology Expected to Continue Network Improvements Sprint is unlocking the value of the largest spectrum holdings in the U.S. in a capital-efficient manner and third party sources continue to validate the company’s network performance improvements.
• Independent mobile analytics firm RootMetrics® awarded Sprint over 30 percent more first-place (outright or shared) Metropolitan area RootScore® Awards (from 103 to 135) for reliability, speed, data, call, text, or overall network performance in the 76 markets measured in the first half of 2017 compared to the year-ago testing period.1 Additionally, Sprint ranked #2 nationally in Call performance for the fourth consecutive time in the second half of 2016 report, including more metro Call RootScore awards (108) than Verizon, AT&T, or T-Mobile for the first time ever.
• Sprint’s overall network reliability continues to beat T-Mobile and performs within 1 percent of Verizon and AT&T, based on an analysis of Nielsen data.2
As previously announced, Sprint helped develop a breakthrough innovation called High Performance User Equipment (HPUE), a new technology that extends the coverage of its 2.5GHz spectrum by up to 30 percent to nearly match its mid-band 1.9GHz spectrum performance on capable devices. In one of the fastest progressions from global standard approval to commercial availability, HPUE-capable devices are already available to Sprint customers, including the recently launched LG G6, Samsung Galaxy S8, and ZTE Max XL. The company will be announcing another exciting technology innovation on today’s conference call. Fiscal Year 2017 Outlook
• The company expects Adjusted EBITDA* of $10.7 billion to $11.2 billion. • The company expects operating income of $2 billion to $2.5 billion. • The company expects cash capital expenditures, excluding devices leased through indirect
channels, of $3.5 billion to $4 billion.
Conference Call and Webcast
• Date/Time: 8:30 a.m. (ET) Wednesday, May 3, 2017 • Call-in Information
o U.S./Canada: 866-360-1063 (ID: 3938447) o International: 443-961-0242 (ID: 3938447)
• Webcast available at www.sprint.com/investors • Additional information about results is available on our Investor Relations website
1 Rankings based on RootMetrics Metro RootScore Reports from 1H 2016, 2H 2016, and 1H 2017 and, National RootScore Report from 2H 2016 for mobile performance as tested on best available plans and devices on four mobile networks across all available network types. Your experiences may vary. The RootMetrics award is not an endorsement of Sprint. Visit www.rootmetrics.com for more details.
2 Average network reliability (voice & data) based on Sprint’s analysis of latest Nielsen drive test data in the top 106 metro markets.

News Release
Contact Information
• Media contact: Dave Tovar, [email protected] • Investor contact: Jud Henry, [email protected]
News Release
Wireless Operating Statistics (Unaudited)
Quarter To Date
3/31/17 12/31/16 3/31/16 3/31/17 3/31/16
Sprint platform (1):
Net additions (losses) (in thousands)
Postpaid (118) 405 56 811 1,245
Prepaid 180 (501) (264) (1,079) (1,309)
Wholesale and affiliate 125 673 655 2,149 2,733
Total Sprint platform wireless net additions 187 577 447 1,881 2,669
End of period connections (in thousands)
Postpaid (d) 31,576 31,694 30,951 31,576 30,951
Prepaid (d) (e) 11,992 11,812 14,397 11,992 14,397
Wholesale and affiliate (d) (e) 16,134 16,009 13,458 16,134 13,458
Total Sprint platform end of period connections 59,702 59,515 58,806 59,702 58,806
Churn
Postpaid 1.75% 1.67% 1.72% 1.62% 1.61%
Prepaid (e) 4.99% 5.80% 5.65% 5.51% 5.39%
Supplemental data - connected devices
End of period connections (in thousands)
Retail postpaid 2,001 1,960 1,771 2,001 1,771
Wholesale and affiliate 10,880 10,594 8,575 10,880 8,575
Total 12,881 12,554 10,346 12,881 10,346
Sprint platform ARPU (1) (a)
Postpaid 47.34$ 49.70$ 51.68$ 49.77$ 53.39$
Prepaid (e) 30.08$ 27.61$ 27.72$ 28.01$ 27.66$
Sprint platform postpaid phone (1)
Postpaid phone net additions 42 368 22 930 438
Postpaid phone end of period connections (d) 26,079 26,037 25,316 26,079 25,316
Postpaid phone churn 1.58% 1.57% 1.56% 1.48% 1.52%
NON-GAAP RECONCILIATION - ABPA*, POSTPAID PHONE ARPU AND ABPU* (Unaudited)
(Millions, except accounts, connections, ABPA*, ARPU, and ABPU*)
3/31/17 12/31/16 3/31/16 3/31/17 3/31/16
Sprint platform ABPA* (1)
Postpaid service revenue 4,493$ 4,686$ 4,793$ 18,677$ 19,463$
Add: Installment plan billings 343 291 287 1,172 1,190
Add: Lease revenue 842 887 662 3,295 1,838
Total for Sprint platform postpaid connections $ 5,678 $ 5,864 $ 5,742 $ 23,144 $ 22,491
Sprint platform postpaid accounts (in thousands) 11,405 11,413 11,358 11,378 11,248
Sprint platform postpaid ABPA* (b) 165.92$ 171.28$ 168.49$ 169.51$ 166.63$
3/31/17 12/31/16 3/31/16 3/31/17 3/31/16
Sprint platform postpaid phone ARPU and ABPU* (1)
Postpaid phone service revenue 4,228$ 4,420$ 4,512$ 17,578$ 18,331$
Add: Installment plan billings 309 261 268 1,061 1,116
Add: Lease revenue 829 873 649 3,240 1,799
Total for Sprint platform postpaid phone connections $ 5,366 $ 5,554 $ 5,429 $ 21,879 $ 21,246
Sprint platform postpaid average phone connections (in thousands) 26,053 25,795 25,297 25,659 25,020
Sprint platform postpaid phone ARPU (a) 54.10$ 57.12$ 59.45$ 57.09$ 61.05$
Sprint platform postpaid phone ABPU* (c) 68.66$ 71.77$ 71.53$ 71.06$ 70.77$
(e) As a result of aligning all prepaid brands, including prepaid affiliate subscribers, under one churn and retention program as of December 31, 2016, end of period
prepaid and affiliate subscribers were reduced by 1,234,000 and 21,000, respectively.
(b) Sprint platform postpaid ABPA* is calculated by dividing service revenue earned from connections plus installment plan billings and lease revenue by the sum of
the monthly average number of accounts during the period.(c) Sprint platform postpaid phone ABPU* is calculated by dividing postpaid phone service revenue earned from postpaid phone connections plus installment plan
billings and lease revenue by the sum of the monthly average number of postpaid phone connections during the period.(d) As part of the transaction involving Shenandoah Telecommunications Company (Shentel), 186,000 and 92,000 subscribers were transferred in May 2016 from
postpaid and prepaid, respectively, to affiliates. An additional 270,000 nTelos' subscribers are now part of our affiliate relationship with Shentel and are being reported
in wholesale and affiliate subscribers during the quarter ended June 30, 2016.
Year To Date
Quarter To Date Year To Date
Quarter To Date Year To Date
(a) ARPU is calculated by dividing service revenue by the sum of the monthly average number of connections in the applicable service category. Changes in average
monthly service revenue reflect connections for either the postpaid or prepaid service category who change rate plans, the level of voice and data usage, the amount
of service credits which are offered to connections, plus the net effect of average monthly revenue generated by new connections and deactivating connections.
Sprint platform postpaid phone ARPU represents revenues related to our postpaid phone connections.

News Release
Wireless Device Financing Summary (Unaudited)
(Millions, except sales, connections, and sales and connections mix)
Quarter To Date
3/31/17 12/31/16 3/31/16 3/31/17 3/31/16
Postpaid sales (in thousands) 3,471 4,812 3,438 15,298 16,394
Postpaid sales mix
Subsidy/other 18% 20% 37% 24% 36%
Installment plans 40% 37% 18% 34% 13%
Leasing 42% 43% 45% 42% 51%
Installment plans
Installment sales financed 696$ 1,036$ 311$ 2,884$ 1,059$
Installment billings 343$ 291$ 287$ 1,172$ 1,190$
Leasing
Lease revenue 842$ 887$ 662$ 3,295$ 1,838$
Lease depreciation 911$ 837$ 550$ 3,116$ 1,781$
Leased device additions
Cash paid for capital expenditures - leased devices 395$ 767$ 568$ 1,925$ 2,292$
Transfers from inventory - leased devices 639$ 1,095$ 621$ 2,920$ 3,244$
Leased devices in property, plant and equipment, net 4,162$ 4,454$ 3,645$ 4,162$ 3,645$
Leased device and receivables financings net proceeds
Proceeds from MLS sale -$ -$ -$ 1,055$ 1,136$
Repayments to MLS (151) (176) - (653) -
Proceeds from lease securitization - - 600 - 600
Repayments of lease securitization (102) (55) - (255) -
Proceeds from receivables securitization 100 - - 100 -
Repayments of receivables securitization (161) - - (161) -
Net (repayments) proceeds of financings related to devices and
receivables (314)$ (231)$ 600$ 86$ 1,736$
Year To Date

News Release
CONDENSED CONSOLIDATED STATEMENTS OF OPERATIONS (Unaudited)
(Millions, except per share data)
3/31/17 12/31/16 3/31/16 3/31/17 3/31/16
Net operating revenues
Service revenue 6,116$ 6,323$ 6,574$ 25,368$ 27,174$
Equipment revenue 2,423 2,226 1,497 7,979 5,006
Total net operating revenues 8,539 8,549 8,071 33,347 32,180
Net operating expenses
Cost of services (exclusive of depreciation and amortization below) 1,736 1,925 2,245 7,861 9,439
Cost of products (exclusive of depreciation and amortization below) 1,980 1,985 1,551 7,077 5,795
Selling, general and administrative 2,002 2,080 1,939 7,994 8,479
Depreciation - network and other 960 1,000 1,042 3,982 4,013
Depreciation - leased devices 911 837 550 3,116 1,781
Amortization 239 255 300 1,052 1,294
Other, net 241 156 436 501 1,069
Total net operating expenses 8,069 8,238 8,063 31,583 31,870
Operating income 470 311 8 1,764 310
Interest expense (631) (619) (552) (2,495) (2,182)
Other income (expense), net 27 (60) 5 (40) 18
Loss before income taxes (134) (368) (539) (771) (1,854)
Income tax expense (149) (111) (15) (435) (141)
Net loss (283)$ (479)$ (554)$ (1,206)$ (1,995)$
Basic and diluted net loss per common share (0.07)$ (0.12)$ (0.14)$ (0.30)$ (0.50)$
Weighted average common shares outstanding 3,988 3,983 3,972 3,981 3,969
Effective tax rate -111.2% -30.2% -2.8% -56.4% -7.6%
NON-GAAP RECONCILIATION - NET LOSS TO ADJUSTED EBITDA* (Unaudited)
(Millions)
3/31/17 12/31/16 3/31/16 3/31/17 3/31/16
Net loss (283)$ (479)$ (554)$ (1,206)$ (1,995)$
Income tax expense 149 111 15 435 141
Loss before income taxes (134) (368) (539) (771) (1,854)
Other (income) expense, net (27) 60 (5) 40 (18)
Interest expense 631 619 552 2,495 2,182
Operating income 470 311 8 1,764 310
Depreciation - network and other 960 1,000 1,042 3,982 4,013
Depreciation - leased devices 911 837 550 3,116 1,781
Amortization 239 255 300 1,052 1,294
EBITDA* (3)2,580 2,403 1,900 9,914 7,398
Loss (gain) from asset dispositions and exchanges, net (4) - 28 81 (326) 166
Severance and exit costs (5) 36 19 162 66 409
Contract terminations (6) 27 - - 140 -
Litigation and other contingencies (7) 37 - 15 140 193
Reduction in liability - U.S. Cellular asset acquisition (8) - - - - (20)
Adjusted EBITDA* (3)2,680$ 2,450$ 2,158$ 9,934$ 8,146$
Adjusted EBITDA margin* 43.8% 38.7% 32.8% 39.2% 30.0%
Selected items:
Cash paid for capital expenditures - network and other 529$ 478$ 722$ 1,950$ 4,680$
Cash paid for capital expenditures - leased devices 395$ 767$ 568$ 1,925$ 2,292$
Quarter To Date Year To Date
Quarter To Date Year To Date
News Release
WIRELESS STATEMENTS OF OPERATIONS (Unaudited)
(Millions)
3/31/17 12/31/16 3/31/16 3/31/17 3/31/16
Net operating revenues
Service revenue
Sprint platform (1):
Postpaid 4,493$ 4,686$ 4,793$ 18,677$ 19,463$
Prepaid 1,067 1,077 1,203 4,438 4,986
Wholesale, affiliate and other 184 183 155 693 703
Total Sprint platform 5,744 5,946 6,151 23,808 25,152
Total transactions (2) - - 3 - 219
Total service revenue 5,744 5,946 6,154 23,808 25,371
Equipment revenue 2,423 2,226 1,497 7,979 5,006
Total net operating revenues 8,167 8,172 7,651 31,787 30,377
Net operating expenses
Cost of services (exclusive of depreciation and amortization below) 1,448 1,649 1,922 6,674 8,069
Cost of products (exclusive of depreciation and amortization below) 1,980 1,985 1,551 7,077 5,795
Selling, general and administrative 1,944 2,032 1,868 7,741 8,141
Depreciation - network and other 911 947 991 3,779 3,812
Depreciation - leased devices 911 837 550 3,116 1,781
Amortization 239 255 300 1,052 1,294
Other, net 232 150 434 480 1,045
Total net operating expenses 7,665 7,855 7,616 29,919 29,937
Operating income 502$ 317$ 35$ 1,868$ 440$
WIRELESS NON-GAAP RECONCILIATION (Unaudited)
(Millions)
3/31/17 12/31/16 3/31/16 3/31/17 3/31/16
Operating income 502$ 317$ 35$ 1,868$ 440$
Loss (gain) from asset dispositions and exchanges, net (4) - 28 81 (326) 166
Severance and exit costs (5) 27 13 160 45 385
Contract terminations (6) 27 - - 140 -
Litigation and other contingencies (7) 37 - 15 140 193
Reduction in liability - U.S. Cellular asset acquisition (8) - - - - (20)
Depreciation - network and other 911 947 991 3,779 3,812
Depreciation - leased devices 911 837 550 3,116 1,781
Amortization 239 255 300 1,052 1,294
Adjusted EBITDA* (3)2,654$ 2,397$ 2,132$ 9,814$ 8,051$
Adjusted EBITDA margin* 46.2% 40.3% 34.6% 41.2% 31.7%
Selected items:
Cash paid for capital expenditures - network and other 468$ 389$ 577$ 1,591$ 4,089$
Cash paid for capital expenditures - leased devices 395$ 767$ 568$ 1,925$ 2,292$
Quarter To Date Year To Date
Quarter To Date Year To Date

News Release
WIRELINE STATEMENTS OF OPERATIONS (Unaudited)
(Millions)
3/31/17 12/31/16 3/31/16 3/31/17 3/31/16
Net operating revenues
Voice 143$ 153$ 194$ 649$ 840$
Data 39 41 37 166 171
Internet 276 281 316 1,147 1,284
Other 22 22 15 81 87
Total net operating revenues 480 497 562 2,043 2,382
Net operating expenses
Costs of services (exclusive of depreciation and amortization below) 402 400 467 1,686 1,962
Selling, general and administrative 49 49 74 238 328
Depreciation and amortization 47 51 50 195 194
Other, net 8 6 3 21 25
Total net operating expenses 506 506 594 2,140 2,509
Operating loss (26)$ (9)$ (32)$ (97)$ (127)$
WIRELINE NON-GAAP RECONCILIATION (Unaudited)
(Millions)
3/31/17 12/31/16 3/31/16 3/31/17 3/31/16
Operating loss (26)$ (9)$ (32)$ (97)$ (127)$
Severance and exit costs (5) 8 6 3 21 25
Depreciation and amortization 47 51 50 195 194
Adjusted EBITDA* 29$ 48$ 21$ 119$ 92$
Adjusted EBITDA margin* 6.0% 9.7% 3.7% 5.8% 3.9%
Selected items:
Cash paid for capital expenditures - network and other 19$ 24$ 74$ 94$ 279$
Quarter To Date Year To Date
Quarter To Date Year To Date
News Release
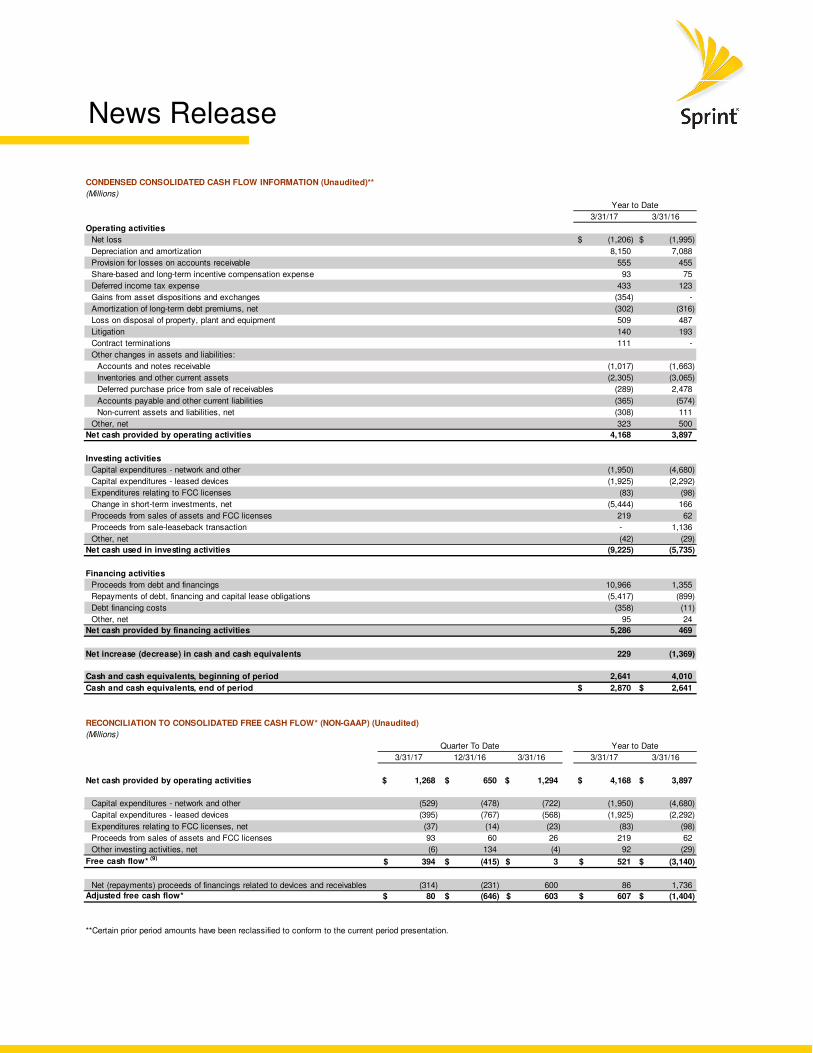
CONDENSED CONSOLIDATED CASH FLOW INFORMATION (Unaudited)**
(Millions)
3/31/17 3/31/16
Operating activities
Net loss (1,206)$ (1,995)$
Depreciation and amortization 8,150 7,088
Provision for losses on accounts receivable 555 455
Share-based and long-term incentive compensation expense 93 75
Deferred income tax expense 433 123
Gains from asset dispositions and exchanges (354) -
Amortization of long-term debt premiums, net (302) (316)
Loss on disposal of property, plant and equipment 509 487
Litigation 140 193
Contract terminations 111 -
Other changes in assets and liabilities:
Accounts and notes receivable (1,017) (1,663)
Inventories and other current assets (2,305) (3,065)
Deferred purchase price from sale of receivables (289) 2,478
Accounts payable and other current liabilities (365) (574)
Non-current assets and liabilities, net (308) 111
Other, net 323 500
Net cash provided by operating activities 4,168 3,897
Investing activities
Capital expenditures - network and other (1,950) (4,680)
Capital expenditures - leased devices (1,925) (2,292)
Expenditures relating to FCC licenses (83) (98)
Change in short-term investments, net (5,444) 166
Proceeds from sales of assets and FCC licenses 219 62
Proceeds from sale-leaseback transaction - 1,136
Other, net (42) (29)
Net cash used in investing activities (9,225) (5,735)
Financing activities
Proceeds from debt and financings 10,966 1,355
Repayments of debt, financing and capital lease obligations (5,417) (899)
Debt financing costs (358) (11)
Other, net 95 24
Net cash provided by financing activities 5,286 469
Net increase (decrease) in cash and cash equivalents 229 (1,369)
Cash and cash equivalents, beginning of period 2,641 4,010
Cash and cash equivalents, end of period 2,870$ 2,641$
RECONCILIATION TO CONSOLIDATED FREE CASH FLOW* (NON-GAAP) (Unaudited)
(Millions)
3/31/17 12/31/16 3/31/16 3/31/17 3/31/16
Net cash provided by operating activities 1,268$ 650$ 1,294$ 4,168$ 3,897$
Capital expenditures - network and other (529) (478) (722) (1,950) (4,680)
Capital expenditures - leased devices (395) (767) (568) (1,925) (2,292)
Expenditures relating to FCC licenses, net (37) (14) (23) (83) (98)
Proceeds from sales of assets and FCC licenses 93 60 26 219 62
Other investing activities, net (6) 134 (4) 92 (29)
Free cash flow* (9)394$ (415)$ 3$ 521$ (3,140)$
Net (repayments) proceeds of financings related to devices and receivables (314) (231) 600 86 1,736
Adjusted free cash flow* 80$ (646)$ 603$ 607$ (1,404)$
**Certain prior period amounts have been reclassified to conform to the current period presentation.
Year to Date
Quarter To Date Year to Date
News Release
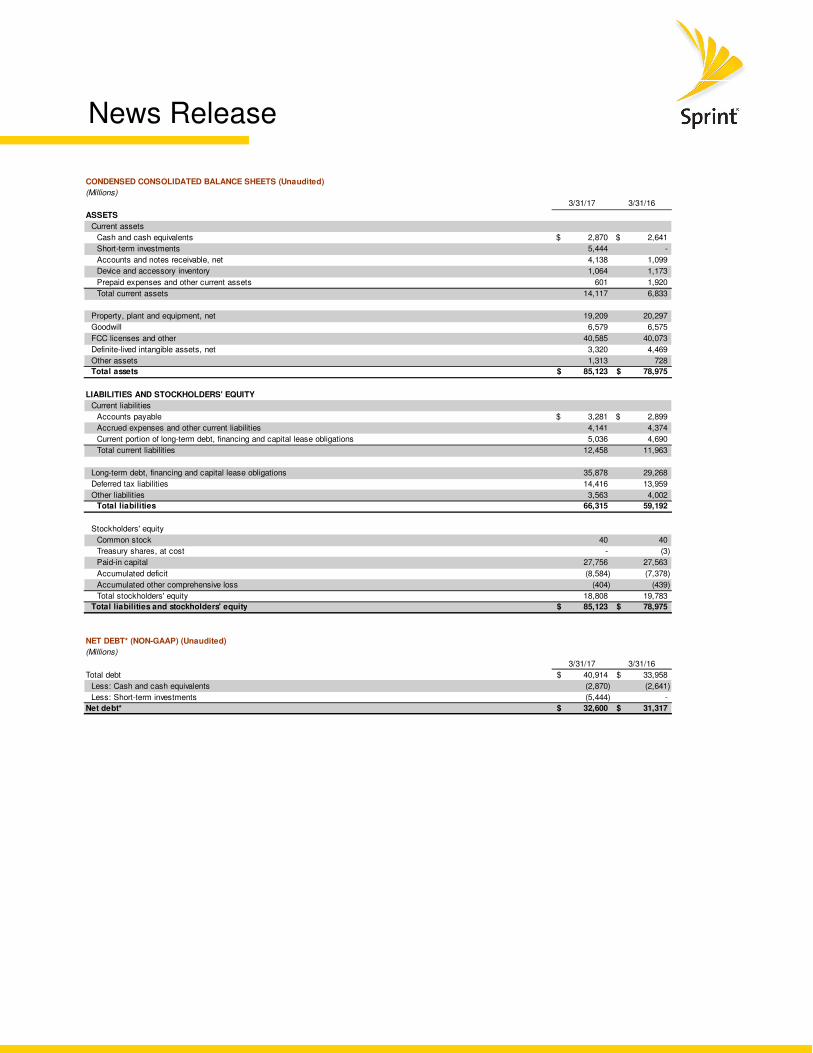
CONDENSED CONSOLIDATED BALANCE SHEETS (Unaudited)
(Millions)
3/31/17 3/31/16
ASSETS
Current assets
Cash and cash equivalents 2,870$ 2,641$
Short-term investments 5,444 -
Accounts and notes receivable, net 4,138 1,099
Device and accessory inventory 1,064 1,173
Prepaid expenses and other current assets 601 1,920
Total current assets 14,117 6,833
Property, plant and equipment, net 19,209 20,297
Goodwill 6,579 6,575
FCC licenses and other 40,585 40,073
Definite-lived intangible assets, net 3,320 4,469
Other assets 1,313 728
Total assets 85,123$ 78,975$
LIABILITIES AND STOCKHOLDERS' EQUITY
Current liabilities
Accounts payable 3,281$ 2,899$
Accrued expenses and other current liabilities 4,141 4,374
Current portion of long-term debt, financing and capital lease obligations 5,036 4,690
Total current liabilities 12,458 11,963
Long-term debt, financing and capital lease obligations 35,878 29,268
Deferred tax liabilities 14,416 13,959
Other liabilities 3,563 4,002
Total liabilities 66,315 59,192
Stockholders' equity
Common stock 40 40
Treasury shares, at cost - (3)
Paid-in capital 27,756 27,563
Accumulated deficit (8,584) (7,378)
Accumulated other comprehensive loss (404) (439)
Total stockholders' equity 18,808 19,783
Total liabilities and stockholders' equity 85,123$ 78,975$
NET DEBT* (NON-GAAP) (Unaudited)
(Millions)
3/31/17 3/31/16
Total debt 40,914$ 33,958$
Less: Cash and cash equivalents (2,870) (2,641)
Less: Short-term investments (5,444) -
Net debt* 32,600$ 31,317$

News Release
News Release
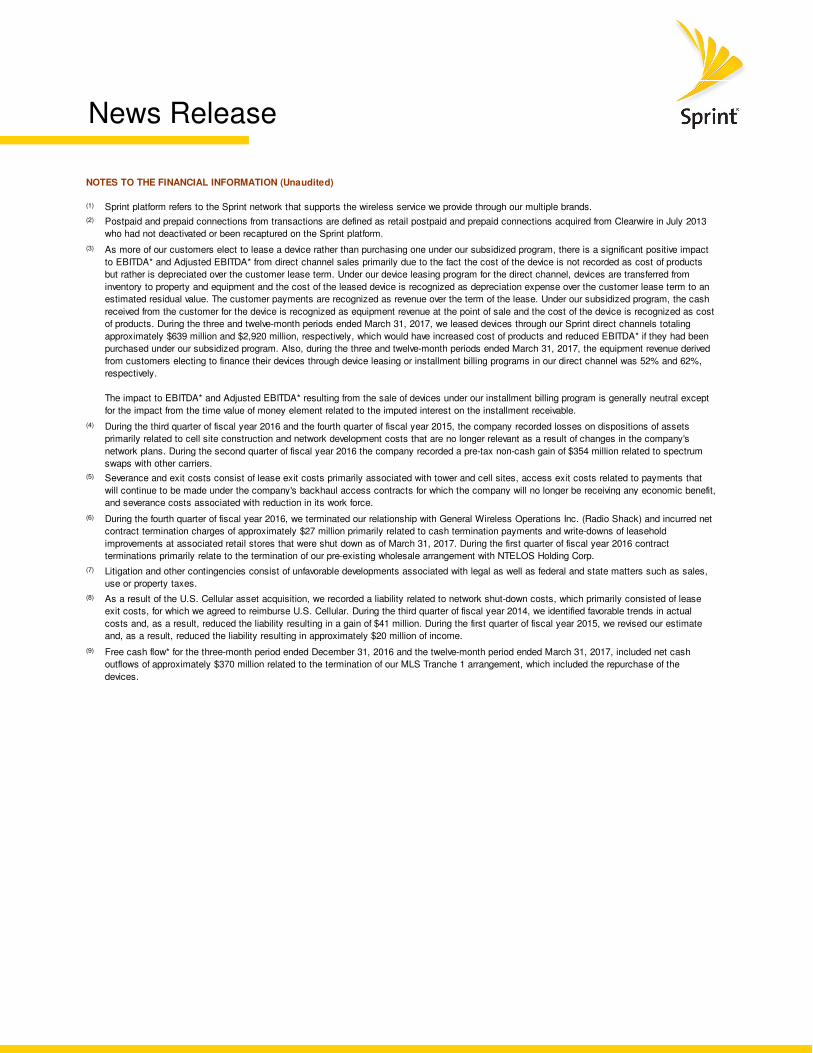
NOTES TO THE FINANCIAL INFORMATION (Unaudited)
(1) Sprint platform refers to the Sprint network that supports the wireless service we provide through our multiple brands.
(2) Postpaid and prepaid connections from transactions are defined as retail postpaid and prepaid connections acquired from Clearwire in July 2013
who had not deactivated or been recaptured on the Sprint platform.
(3) As more of our customers elect to lease a device rather than purchasing one under our subsidized program, there is a significant positive impact
to EBITDA* and Adjusted EBITDA* from direct channel sales primarily due to the fact the cost of the device is not recorded as cost of products
but rather is depreciated over the customer lease term. Under our device leasing program for the direct channel, devices are transferred from
inventory to property and equipment and the cost of the leased device is recognized as depreciation expense over the customer lease term to an
estimated residual value. The customer payments are recognized as revenue over the term of the lease. Under our subsidized program, the cash
received from the customer for the device is recognized as equipment revenue at the point of sale and the cost of the device is recognized as cost
of products. During the three and twelve-month periods ended March 31, 2017, we leased devices through our Sprint direct channels totaling
approximately $639 million and $2,920 million, respectively, which would have increased cost of products and reduced EBITDA* if they had been
purchased under our subsidized program. Also, during the three and twelve-month periods ended March 31, 2017, the equipment revenue derived
from customers electing to finance their devices through device leasing or installment billing programs in our direct channel was 52% and 62%,
respectively.
The impact to EBITDA* and Adjusted EBITDA* resulting from the sale of devices under our installment billing program is generally neutral except
for the impact from the time value of money element related to the imputed interest on the installment receivable.
(4) During the third quarter of fiscal year 2016 and the fourth quarter of fiscal year 2015, the company recorded losses on dispositions of assets
primarily related to cell site construction and network development costs that are no longer relevant as a result of changes in the company's
network plans. During the second quarter of fiscal year 2016 the company recorded a pre-tax non-cash gain of $354 million related to spectrum
swaps with other carriers.
(5) Severance and exit costs consist of lease exit costs primarily associated with tower and cell sites, access exit costs related to payments that
will continue to be made under the company's backhaul access contracts for which the company will no longer be receiving any economic benefit,
and severance costs associated with reduction in its work force.
(6) During the fourth quarter of fiscal year 2016, we terminated our relationship with General Wireless Operations Inc. (Radio Shack) and incurred net
contract termination charges of approximately $27 million primarily related to cash termination payments and write-downs of leasehold
improvements at associated retail stores that were shut down as of March 31, 2017. During the first quarter of fiscal year 2016 contract
terminations primarily relate to the termination of our pre-existing wholesale arrangement with NTELOS Holding Corp.
(7) Litigation and other contingencies consist of unfavorable developments associated with legal as well as federal and state matters such as sales,
use or property taxes.
(8) As a result of the U.S. Cellular asset acquisition, we recorded a liability related to network shut-down costs, which primarily consisted of lease
exit costs, for which we agreed to reimburse U.S. Cellular. During the third quarter of fiscal year 2014, we identified favorable trends in actual
costs and, as a result, reduced the liability resulting in a gain of $41 million. During the first quarter of fiscal year 2015, we revised our estimate
and, as a result, reduced the liability resulting in approximately $20 million of income.
(9) Free cash flow* for the three-month period ended December 31, 2016 and the twelve-month period ended March 31, 2017, included net cash
outflows of approximately $370 million related to the termination of our MLS Tranche 1 arrangement, which included the repurchase of the
devices.
News Release
*FINANCIAL MEASURES Sprint provides financial measures determined in accordance with GAAP and adjusted GAAP (non-GAAP). The non-GAAP financial measures reflect industry conventions, or standard measures of liquidity, profitability or performance commonly used by the investment community for comparability purposes. These measurements should be considered in addition to, but not as a substitute for, financial information prepared in accordance with GAAP. We have defined below each of the non-GAAP measures we use, but these measures may not be synonymous to similar measurement terms used by other companies. Sprint provides reconciliations of these non-GAAP measures in its financial reporting. Because Sprint does not predict special items that might occur in the future, and our forecasts are developed at a level of detail different than that used to prepare GAAP-based financial measures, Sprint does not provide reconciliations to GAAP of its forward-looking financial measures. The measures used in this release include the following:
EBITDA is operating income/(loss) before depreciation and amortization. Adjusted EBITDA is EBITDA excluding severance, exit costs, and other special items. Adjusted EBITDA Margin represents Adjusted EBITDA divided by non-equipment net operating revenues for Wireless and Adjusted EBITDA divided by net operating revenues for Wireline. We believe that Adjusted EBITDA and Adjusted EBITDA Margin provide useful information to investors because they are an indicator of the strength and performance of our ongoing business operations. While depreciation and amortization are considered operating costs under GAAP, these expenses primarily represent non-cash current period costs associated with the use of long-lived tangible and definite-lived intangible assets. Adjusted EBITDA and Adjusted EBITDA Margin are calculations commonly used as a basis for investors, analysts and credit rating agencies to evaluate and compare the periodic and future operating performance and value of companies within the telecommunications industry. Sprint Platform Postpaid ABPA is average billings per account and calculated by dividing postpaid service revenue earned from postpaid customers plus installment plan billings and lease revenue by the sum of the monthly average number of postpaid accounts during the period. We believe that ABPA provides useful information to investors, analysts and our management to evaluate average Sprint platform postpaid customer billings per account as it approximates the expected cash collections, including installment plan billings and lease revenue, per postpaid account each month. Sprint Platform Postpaid Phone ABPU is average billings per postpaid phone user and calculated by dividing service revenue earned from postpaid phone customers plus installment plan billings and lease revenue by the sum of the monthly average number of postpaid phone connections during the period. We believe that ABPU provides useful information to investors, analysts and our management to evaluate average Sprint platform postpaid phone customer billings as it approximates the expected cash collections, including installment plan billings and lease revenue, per postpaid phone user each month. Free Cash Flow is the cash provided by operating activities less the cash used in investing activities other than short-term investments, including changes in restricted cash, if any, and excluding the sale-leaseback of devices and equity method investments. Adjusted Free Cash Flow is Free Cash Flow plus the proceeds from device financings and sales of receivables, net of repayments. We believe that Free Cash Flow and Adjusted Free Cash Flow provide useful information to investors, analysts and our management about the cash generated by our core operations and net proceeds obtained to fund certain leased devices, respectively, after interest and dividends, if any, and our ability to fund scheduled debt maturities and other financing activities, including discretionary refinancing and retirement of debt and purchase or sale of investments.

News Release
Net Debt is consolidated debt, including current maturities, less cash and cash equivalents, short-term investments and, if any, restricted cash. We believe that Net Debt provides useful information to investors, analysts and credit rating agencies about the capacity of the company to reduce the debt load and improve its capital structure. SAFE HARBOR This release includes “forward-looking statements” within the meaning of the securities laws. The words “may,” “could,” “should,” “estimate,” “project,” “forecast,” “intend,” “expect,” “anticipate,” “believe,” “target,” “plan”, “outlook,” “providing guidance,” and similar expressions are intended to identify information that is not historical in nature. All statements that address operating performance, events or developments that we expect or anticipate will occur in the future — including statements relating to our network, cost reductions, connections growth, and liquidity; and statements expressing general views about future operating results — are forward-looking statements. Forward-looking statements are estimates and projections reflecting management’s judgment based on currently available information and involve a number of risks and uncertainties that could cause actual results to differ materially from those suggested by the forward-looking statements. With respect to these forward-looking statements, management has made assumptions regarding, among other things, the development and deployment of new technologies and services; efficiencies and cost savings of new technologies and services; customer and network usage; connection growth and retention; service, speed, coverage and quality; availability of devices; availability of various financings, including any leasing transactions; the timing of various events and the economic environment. Sprint believes these forward-looking statements are reasonable; however, you should not place undue reliance on forward-looking statements, which are based on current expectations and speak only as of the date when made. Sprint undertakes no obligation to publicly update or revise any forward-looking statements, whether as a result of new information, future events or otherwise, except as required by law. In addition, forward-looking statements are subject to certain risks and uncertainties that could cause actual results to differ materially from our company's historical experience and our present expectations or projections. Factors that might cause such differences include, but are not limited to, those discussed in Sprint Corporation’s Annual Report on Form 10-K for the fiscal year ended March 31, 2016, and, when filed, its Annual Report on Form 10-K for the fiscal year ended March 31, 2017. You should understand that it is not possible to predict or identify all such factors. Consequently, you should not consider any such list to be a complete set of all potential risks or uncertainties. About Sprint: Sprint (NYSE: S) is a communications services company that creates more and better ways to connect its customers to the things they care about most. Sprint served 59.7 million connections as of March 31, 2017 and is widely recognized for developing, engineering and deploying innovative technologies, including the first wireless 4G service from a national carrier in the United States; leading no-contract brands including Virgin Mobile USA, Boost Mobile, and Assurance Wireless; instant national and international push-to-talk capabilities; and a global Tier 1 Internet backbone. Sprint has been named to the Dow Jones Sustainability Index (DJSI) North America for the past five years. You can learn more and visit Sprint at www.sprint.com or www.facebook.com/sprint and www.twitter.com/sprint.