fiscal decentralisation, local institutions and public ...ftp.iza.org/dp7076.pdf · fiscal...
TRANSCRIPT

DI
SC
US
SI
ON
P
AP
ER
S
ER
IE
S
Forschungsinstitut zur Zukunft der ArbeitInstitute for the Study of Labor
Fiscal Decentralisation, Local Institutions andPublic Goods Provision: Evidence from Indonesia
IZA DP No. 7076
December 2012
Sarmistha PalZaki Wahhaj
Fiscal Decentralisation, Local Institutions
and Public Goods Provision: Evidence from Indonesia
Sarmistha Pal University of Surrey
and IZA
Zaki Wahhaj University of Kent
Discussion Paper No. 7076 December 2012
IZA
P.O. Box 7240 53072 Bonn
Germany
Phone: +49-228-3894-0 Fax: +49-228-3894-180
E-mail: [email protected]
Any opinions expressed here are those of the author(s) and not those of IZA. Research published in this series may include views on policy, but the institute itself takes no institutional policy positions. The IZA research network is committed to the IZA Guiding Principles of Research Integrity. The Institute for the Study of Labor (IZA) in Bonn is a local and virtual international research center and a place of communication between science, politics and business. IZA is an independent nonprofit organization supported by Deutsche Post Foundation. The center is associated with the University of Bonn and offers a stimulating research environment through its international network, workshops and conferences, data service, project support, research visits and doctoral program. IZA engages in (i) original and internationally competitive research in all fields of labor economics, (ii) development of policy concepts, and (iii) dissemination of research results and concepts to the interested public. IZA Discussion Papers often represent preliminary work and are circulated to encourage discussion. Citation of such a paper should account for its provisional character. A revised version may be available directly from the author.

IZA Discussion Paper No. 7076 December 2012
ABSTRACT
Fiscal Decentralisation, Local Institutions and Public Goods Provision: Evidence from Indonesia*
Using data from the Indonesian Family Life Surveys, this paper studies the impact of fiscal decentralisation in Indonesia on local public spending across communities with different types of local institutions. Our results provide evidence of heterogeneity in access to public goods across communities in the period prior to fiscal decentralisation; with significantly greater spending on schools and health centres in communities which observe traditional adat laws (which promote an ethic of mutual cooperation), and less spending on roads, public transport, communications etc. in communities which have a democratic electoral system. Fiscal decentralisation led to an increase in the share of spending on physical infrastructure, as well as a convergence in spending across communities with different types of local institutions. We develop a theoretical model to argue that communities which enjoy a higher level of mutual cooperation would benefit less from investment in public goods which facilitate communication and exchange with outsiders – as these improve the outside options of community members and therefore makes it more difficult to sustain intra-community cooperation. Surprisingly, investment in communications and transport infrastructure in these communities were more restrained during the period of centralised fiscal control. JEL Classification: D02, H41, O43 Keywords: decentralisation, democratisation, mutual co-operation, social and physical
infrastructure, local public spending, Indonesia Corresponding author: Sarmistha Pal Faculty of Business, Economics and Law University of Surrey Guildford, GU2 7XH United Kingdom E-mail: [email protected]
* The paper has benefitted from discussion with Marcel Fafchamps, Sugata Ghosh, Rozanna Himaz, James Maws, Jean-Philippe Platteau, Matthew Rablen, Joydeep Roy as well as seminar participants at Brunel, CSAE (Oxford) and Minneapolis for their comments and suggestions. Any errors are ours.

1 Introduction
The delivery of public goods and services to poor people remains a significant challenge in many developing
countries today (World Bank 2004a). Decentralisation has been identified by many as an important policy
reform that has the potential of improving public service delivery. It is a political decision of national
leadership that devolves political, fiscal and/or administrative powers to local government. It has been argued
that fiscal decentralisation makes government more responsive and effi cient, and that it also strengthens the
voice of the poor and the marginalised. However, its success has not been uniform; Bardhan and Mukherjee
(2000) highlight the problem of elite capture in a decentralised set up.
Since fiscal decentralisation provides greater decision-making power to local governments, its impact on
public goods provision should, arguably, depend on the quality and nature of local institutions. The relevant
local institutions should not only include the formal processes through which communities make collective
decisions regarding public spending, but also the informal institutions which facilitate economic exchange
and maintain law and order within the community. These local institutions can vary enormously across
and within developing countries, and therefore it is important to understand how they mediate the effects
of fiscal decentralisation. In this context, we raise the following questions. In a setting where communities
enjoy some degree of politcal autonomy, (i) do informal norms and formal institutions influence the choice
of local public goods? And, (ii) how does the introduction of fiscal decentralisation impact upon the choice
of local public goods?
This paper attempts to bring both theoretical insights and empirical evidence to this under-researched
topic. We develop a theoretical model to derive the optimal choice of public goods in communities which rely,
in varying degrees, on informal sanctions to maintain cooperation in economic exchange among community
members. We argue that public goods which facililate communication and exchange with outsiders (such as
roads, public transport, telephone facilities, etc.) will improve the outside options of community members and
therefore make it more diffi cult to sustain intra-community cooperation. Therefore, the greater the existing
level of mutual cooperation, ceteris paribus, the less the community should invest in such infrastructure
compared to other public goods which do not directly improve communication and trade links with the
outside world (such as schools and health centres).
We use data on local public spending in Indonesia from two rounds of the Indonesian Family Life Survey
(1997 and 2007) to compare the nature of public investments across communities which vary in terms of
the importance of traditional, informal institutions (specifically, adat laws) promoting an ethic of mutual
cooperation. Fiscal decentralisation laws were introduced in Indonesia in 2001 and, therefore, the two
rounds of data also provides an opportunity to study how decentralisation impacted upon public spending in
communities with different types of local institutions. The socially optimal level of spending, derived from
our theoretical model, provides a benchmark for comparison.
We take the share of the central government’s direct contribution in a community’s public spending
budget as a measure of centralised fiscal control for that community. This share declined, broadly, across
Indonesian communities following decentralisation. However, the decentralisation laws introduced a ’fiscal
2
needs formula’for the transfer of funds from the central government based on geographic and demographic
characteristics; such that the central government’s share fell by less in coastal, rural, more populous, and
geographically larger communities. We exploit this variation to estimate the impact of fiscal decentralisation
on local public spending across communities with different types of formal and informal institutions. To
ensure that our findings are robust, we also estimate the impact of decentralisation on access to public
goods, and repeat the analysis with communities which did not experience any institutional change at the
local level between 1997 and 2007.
Our results provide evidence of heterogeneity in access to public goods — as well as heterogeneity in
investment in different types of public goods —across communities in the period prior to fiscal decentralisation.
There was significantly greater spending on schools and health centres (which we collectively call ‘social
goods’) in communities which observe traditional adat laws (relative to those that do not), and less spending
on roads, public transport, communications etc. (which we collectively call ‘physical infrastructure’) in
communities which have a democratic electoral system (relative to those that do not). Moreover, fiscal
decentralisation led to an increase in the share of spending on physical infrastructure, as well as a convergence
in spending across communities with different types of local institutions.
We find that (the share of) spending on physical infrastructure is lower in traditional adat communities,
compared to non-adat communities during the period of centralised fiscal control, and that this difference
disappears in the period following decentralisation. This is contrary to expectations as it suggests that the
potential adverse effects of improving links with the outside world for close-knit communities were taken
into consideration in local public spending decisions before —but not after —fiscal control was devolved to
local authorities. We suggest the possibility that community leaders were able to bargain more effectively
with the central government and push for policies that would maximise community welfare during the period
of centralised fiscal control; and that this became more diffi cult following decentralisation when community
members were, at least in some instances, able to vote, secretly and individually, for policies of their choice.
Our results are closely related to, and contribute to, various strands of the literature, including: (i) the
literature on democracy and growth which argues that democracy is associated with higher rates of economic
growth (e.g. Barro 1996); (ii) the political economy literature on public goods provision under different forms
of democracy, including different methods for apportioning votes, parliamentary versus presidential regimes
(Persson and Tabellini, 2004), and variations in term limits and voter registration rules (Besley and Case,
2003); (iii) the political economy of public goods provision in developing countries, which identifies the
role of community leader characteristics on public goods provision, e.g. caste (Pande, 2003), gender (Duflo
and Chattopadhyay, 2004), and the wealth of elected legislators (Besley et al., 2005); (iv) a literature on
fiscal decentralisation and development, which highlights the lack of capacity of local governments (Akin,
Hutchinson, and Strump, 2001), misaligned responsibilities arising from incomplete decentralisation (e.g.,
Devarajan, 2005) and elite capture (Bardhan and Mukherjee, 2000) and (v) an emerging literature on
cultures, institution and development (Platteau 2000; Guiso et al. 2006), which highlights the role of social
norms and cultural factors in economic development.
We are not aware of any research that explicitly examines the role of institutions, both formal and
3
informal, on public goods provision at the community-level, or the impact of fiscal decentralisation across
communities with different types of local institutions. This is an important exercise as access to public goods
and infrastructure is understood to be central to economic growth and an important source of heterogeneity
in the levels of development across nations and regions. History reveals that informal governance based
on personal relations is the precursor to the more formal modes of governance made necessary by ever-
increasing specialisation and division of labour. Therefore, an understanding of how informal and formal
institutions interplay is essential for an understanding of the process of economic development. Our results
identify the differential effects of informal and formal institutions on the choice of social goods and physical
infrastructure.
The paper is developed as follows. In 2, we provide an overview of central government policy in Indonesia
in its dealings with local communities; to provide the context for our theoretical and empirical analysis. In
Section 3.1, we discuss the theoretical literature which provides a starting point for our model on local
public goods expenditures. The model is presented in sections 3.2 to 3.6, and its implications for fiscal
decentralisation are discussed in Section 3.7. Section 4 provides a description of the data and the econometric
specifications used in our analysis. The econometric results are discussed in section 5, and we consider possible
explanations to account for the results in Section 5.3. Our conclusions are presented in section 6.
2 Background on the Soeharto Regime and Fiscal Decentralisa-tion in Indonesia
At the start of the process of fiscal decentralisation in 2001, Indonesia was characterised by substantial
heterogeneity in its local institutions. We provide a brief description of Soeharto’s New Order regime, which
lasted from 1966 to 1998, to explain the nature and source of this heterogeneity. This background will
motivate the theoretical model in Section 3 as well as help interpret our empirical findings in Section 4.
During the New Order Period, Soeharto established a strongly unitary state and acted to enforce territor-
ial claims over much of Indonesia. Rejecting Sukarno’s socialist legacy, Soeharto made a U-turn on economic
policy, embracing an unfettered capitalism. He supported national entrepreneurship to build big businesses,
which in turn led to rapid development of urban centres. A clear distinction was made between rural and
urban communities through the Village Law of 1979. While leaders of rural communities were elected or
nominated by local people, urban community leaders were to be appointed by the central government.
The New Order regime was dedicated to maintaining political order, promoting economic development,
and excluding mass participation from the political process. The military had a strong role in politics and the
regime opted for a selective but effective and sometimes brutal repression against its opponents, most notably
the communists. A number of seats in the Parliament were set aside for the military under the dwifungsi
(dual function) doctrine. Thus, Soeharto made way to a dictatorial government, backed by the army and
a co-opted elite. The armed services took over much of the economy, with senior offi cers often getting the
government contracts, property deals and nationalised industries. Very often this involved ownership or a
cut of profits rather than direct management.
4
The regime placed clear emphasis on Indonesian identity over regional/ethnic identity, which threatened
many ethnic groups including the adat communities (which observed and practised their own local customary
laws and traditions). In order to bring the adat communities under central government, there have been
significant changes in property rights in land and other natural resources. Even though the state did not
formally own all of the free land, the notion of state-controlled land was emphasized during this period.
The state resumed exclusive authority over all territories classified as forest area including all aspects of
human activities within them. Local customary institutions were marginalised, replaced or co-opted through
centrally-driven and capital-intensive development policies. These policies served the political and economic
interests of the national elite, the regional and local agents they patronised, and the international agencies
and investors who supported them. These changes came as a threat to the traditional adat communities who
had lived off the land and its natural resources for generations and had preserved their autonomous cultures,
including aspects of language, belief, production patterns, law and social institutions till this period.
It is possible that the Soeharto government also pursued a more subtle strategy for promoting national
integration by investing heavily in education. Greater access to education would be welcome in all communi-
ties; but a nationally integrated education system could also be designed to reinforce the Indonesian identity
rather than the varied ethnic and religious identities of its people. In 1974, the Indonesian government initi-
ated a large primary school construction program, the Sekolah Dasar INPRES program. Between 1974 and
1978, 61,807 new buildings were constructed, with special emphasis in regions where initial enrollment rates
were low, doubling the number of available schools per capita. As much as 12% of the regional development
budget was devoted to school construction (as opposed to only 3.4% on regional health); this increased
spending was largely funded by an unprecedented increase in oil revenue during this period.
By the 1990s, cracks were appearing on the façade of the New Order regime as it underwent significant
transformation itself. This involved a shift from a military regime to a personalistic/autocratic regime as
Soeharto, having outlived all other competitors of his generation, emerged as the unrivalled strongman
(Hill and Shiraisi, 2007). Army offi cers who had served as his personal confidants dominated the military
(Shiraishi, 1999a). His family members, now grown up and each intent on building his or her own business
empire, relied on presidential powers to obtain business opportunities and privileges.
While adat laws were formally banned during Soeharto’s regime, the formal ban did not result in their
abandonment everywhere. The geography of the country makes it particularly diffi cult for the central ad-
ministration to reach the remote islands. Many communities protested against central intervention especially
in the 1990s. Secret wars went on in East Timor, Aceh, and Irian Jaya (Schwarz, 1999; McGibbon, 2004).
Jakarta’s control of powers and resources as well as Javanese domination of the state (i.e. the domination of
mainly Javanese army offi cers over the military and civilian state agencies) led to the rising demand for local
autonomy and the appointment of putra daerah (literally, “local sons”) in strategic positions of provincial
governors, district chiefs, and mayors. Transmigration, forest exploitation, and the consequent disappear-
ance of living space for local Dayaks in Kalimantan led to widespread ethnic violence against Madurese in
East Kalimantan in 1996 (Morishita, 2005). Islamic and Islamist forces found more space for political action
with the establishment of the Indonesian Muslim Intellectuals Association (Ikatan Cendekiawan Muslim In-
5

donesia) in 1990 (Hefner, 2000; International Crisis Group, 2005). Finally the economic crisis of the 1990s
was a major blow to infrastructural investment; transport and communication output contracted by 36.44%
and 15.13% respectively; road conditions deteriorated significantly due to the lack of funds for maintenance
and this reduction was more dramatic in rural areas.
The first free and fair parliamentary elections were held in 1999 and again in 2004. Democratization has
also gone hand in hand with decentralization. The new laws on local autonomy and local finance in 1999
have created local governments that are no longer accountable to the central government but answer to the
local parliament. Article 6 of Act 39 provides an explicit formulation of the recognition and protection of
adat communities and their cultural identity, and considers this recognition and protection as part of the
implementation of human rights.
In summary, a number of factors in Indonesia’s social, political and economic transformation during, and
immediately following, Soeharto’s new order regime, are salient for our analysis.
1. The regime had aggressively pursued a policy of centralised fiscal control up until its end. It also
maintained control over local urban politics, but rural communities were allowed to choose their own
leaders.
2. The central government aimed to undermine traditional adat communities — which had their own
autonomous local institutions for mediating social and economic matters —through changes in property
rights for land and natural resources. There is evidence that, at least since the 1990’s, this process was
resisted in the more remote provinces.
3. The central government had invested heavily in education, especially in areas with low levels of school
enrollment , starting in the 1970’s.
4. The financial crisis in the late 1990’s led to a substantial decline in infrastructural investment, especially
in rural areas.
5. Fiscal decentralisation was accompanied by political decentralisation and democratisation at the local
level.
3 Theoretical Model
3.1 Related Literature
One of the ways in which a group can ensure that its members adhere to a set of prescribed rules in social
and economic interactions is by excluding those who violate them, at least temporarily, from the benefits of
group membership. This reasoning plays an important role in theoretical explanations of the functioning of
informal insurance groups (Kimball 1988, Fafchamps 1992, Coate and Ravallion 1994); in which members
of the group comply with the rules of mutual insurance because they value the benefits of being part of the
group, and the extent of mutual insurance in turn depends on the extent to which this insurance is valued
by its members.
6
Similar mechanisms have been proposed to explain the effectiveness of joint liability credit contracts in
eliciting high repayment rates (Besley and Coate 1995), and contract enforcement in the context of medieval
trade (Greif 1993). According to this kind of reasoning, the extent to which a group can enforce its rules
of behaviour is affected by the benefits of group membership, which in turn depends on the outside options
that its members have. Consequently, as the outside options of the members improve, the ability of the
group to enforce its rules declines. Kranton (1996) develops a theoretical model of ’reciprocal exchange’(i.e.
goods or services are given in exchange for future compensation in kind) where this mechanism is in effect:
as markets develop, individuals have more opportunity to engage in trade outside of informal, personalised
exchange; the cost of social exclusion thus declines, which in turn makes it more diffi cult to sustain honest
behaviour in reciprocal exchange.
Similary, Platteau (2006) has argued that social norms of informal insurance and communal land rights in
traditional village communities become less effective as market integration provides outside opportunities to
a rural population. Hoff and Sen (2005) explore the consequences of this type of tension between informal,
personalised exchange and market-based exchange in the context of a kin system. They argue that the
tension provides a kin group the incentives to take collective action to restrict its members from migrating
to the modern sector even if doing so might raise aggregate welfare. Thus, the kin group can lead to a kind
of poverty trap. In the context of informal insurance, Wahhaj (2010) argues that the insuring group will
find it in its interest to prescribe behaviour that restrict the ability of its members to self-insure (such as
a prescription of excessive consumption) as this increases the value of the service provided by the insuring
group and makes it easier to enforce the rules of mutual insurance using a threat of social exclusion from
the group.
Platteau (2000: Chapter 5) provides a survey of an ethnographic literature on a variety of social norms
and beliefs in traditional societies which make it costly for individuals to engage in behaviour — such as
wealth accumulation —which would make them less dependant on solidary networks. Arguably, these norms
and beliefs play the type of function suggested by Hoff and Sen (2005) and Wahhaj (2010).
The theoretical contribution of the present paper is to extend the reasoning highlighted above to the
context of local public expenditures. Just as a kin group may wish to engage in collective action which
limits the outside options of its members, a community may choose, collectively, to restrict the type of
public investments that would enable its members to engage better with the outside economy. Moreover,
these incentives should be stronger in communities that have more intra-community exchange to protect.
If such incentives are present, they should have implications for —and be apparent in —a process of fiscal
decentralisation. We explore these ideas formally in sections 3.2 to 3.7.
It should be noted that there is an existing theoretical literature on collective action and and the provision
of public services, reviewed, for example, by Banerjee, Iyer and Somanathan (2007). This literature relates
different characteristics of a group —including group size, the distribution of benefits and cohesion within
the group to the level of public goods provision, compared to the first-best level. Our approach is closest to
that of Miguel and Gugerty (2004), who argue that a group with stronger social networks has greater ability
to impose sanctions on group members who free-ride; and therefore should be able to generate a higher
7

level of public goods. However, unlike this literature, we distinguish between public goods which support
interactions within communities and across communities, and relate group solidarity to the type of public
good provided.
3.2 Setup
Imagine a community consisting of N members labelled 1, 2, .., N . In each period, members of the community
face a choice of engaging in trade with a fellow community member or with an outsider. In the present
context, ‘trade’should be interpreted broadly to include any bilateral exchange which can provide utility to
both sides. Trade with an outsider generates a payoff of Vo. Intra-community trade can potentially generate
a payoff of Vc for each party. Given the presence of formal institutions which can enforce contracts in the
modern economy, the specified gains from inter-community trade are guaranteed.
Intra-community trade, however, must be supported by the threat of community sanctions, and therefore
we model the strategic interaction between trading parties in more detail. Specifically, if two community
members opt to trade with each other, then they must simultaneously choose between the actions ‘Trade’
(honestly) and ‘Cheat’. The fraction 1− ε represents the loss in surplus when either or both parties opt to‘Cheat’. When only one party opts to ‘Cheat’and the other party opts to ‘Trade’honestly, there is also a
transfer of resources from the latter to the former equal to a payoff of µVc. The payoffs are summarised in
Table 1 below:
Agent 1\Agent 2 Trade CheatTrade Vc, Vc (ε− µ)Vc, (ε+ µ)VcCheat (ε+ µ)Vc, (ε− µ)Vc εVc, εVc
where ε, µ ∈ (0, 1). If ε+µ > 1, then the simultaneous-move game has a unique Nash equilibrium (Cheat,
Cheat) for any Vc > 0. We assume henceforth that this inequality holds.
We distinguish between two kinds of infrastructure which may strengthen the scope of either inter-
community or intra-community trade. Investment in roads and communications technology will facilitate
exchange between the community and the outside world. The development of public spaces within the com-
munity will facilitate social interactions within the community. Schools and health centres will, over time,
improve the level of education and health within the community, and, arguably, provide more scope for
mutually beneficial exchange within the community. In summary, ‘physical’infrastructure (roads, communi-
cations network) is relatively more important for inter-community trade and ‘social’infrastructure (schools,
health centres, community centres) are relatively more important for intra-community trade.
To capture these ideas within the model, we represent the intra-community and inter-community gains
from trade as follows:
Vc = θcWc (Ks) (1)
Vo = θoWo (Kp) (2)
where Ks denotes social infrastructure within the community and Kp denotes physical infrastructure. We
assume that the functions Wc (.) and Wo (.) are increasing and strictly concave; furthermore, θc and θo
8
are stochastic variables distributed according to the cummulative distribution functions Fc (.) and Fo (.)
respectively with some positive support[θ, θ]. The gains from trade in each period are stochastic as,
arguably, opportunities for mutually beneficial exchange are impossible to foresee completely in advance.
To sustain cooperation in intra-community trade, anyone who cheats must be subject to some kind of
punishment by the community. We assume that this punishment takes the form of exclusion from intra-
community trade for a certain number of periods. During the period of social exclusion, the individual would
still be able to engage in trade with outsiders. Therefore, the severity of the punishment depends on the
value of intra-community trade over inter-community trade, which is itself a function of the punishment
imposed by the community. Therefore, we represent the punishment as a function P (Ks,Kp) which will be
derived endogenously from the model in subsequent sections. We assume that the community also has the
means to impose additional social sanctions proportional to the value of intra-community trade, δWc (Ks)
[the factor δ will be used primarily for comparative statics exercises later on]. Then, cooperation can be
sustained in intra-community trade if and only if the following condition holds:
(ε+ µ− 1)Vc ≤ β [P (Ks,Kp) + δWc (Ks)] (3)
where β is the discount factor for future utility.
3.3 Choice of Trading Partner
In sections 3.3 to 3.6, we determine the optimal choice of investment in social and physical infrastructure
across different types of communities. Combining (3) and (1), we obtain
θc ≤β
(ε− µ− 1)
[P (Ks,Kp)
Wc (Ks)+ δ
](4)
Let us denote by θc the value of θc at each (4) is satisfied with equality. Then, for θc < θc, cooperation
can be sustained in intra-community trade. Then, a community member will opt for intra-community trade
over inter-community trade if and only if Vc ≥ Vo. For θc > θc, cooperation cannot be sustained in intra-
community trade. Therefore, a community member will opt for intra-community trade over inter-community
trade if and only if εVc ≥ Vo.Figure 1 shows the possible values that θc and θo can take in a particular period and the type of trade
— inter-community or intra-community — that will occur for each combination of values. Although the
visual representation is simple and intuitive, the mathematical representation of expected utility for general
distribution functions is unwieldy. Therefore, we make further assumptions about the distributions as follows:
Assumption 1 Fc (θ) = θ−θθ−θ for θ ∈
[θ, θ]; Fc (θ) = 0 for θ < θ and Fc (θ) = 1 for θ > θ and θ+θ
2 = 1
Assumption 2 Fo (θ) = 0 for θ < 1 and Fo (θ) = 1 for θ ≥ 1.
Assumption 1 says that θc is uniformly distributed in the interval[θ, θ]and has an average value of 1.
Assumption 2 says that θo always takes a value of 1. These assumptions are made for analytical convenience
and the main insights from the model, as will be seen, do not hinge on them.
9

Let λ = Wo
Wc. Under Assumptions 1 and 2, there are four possible outcomes, depending on the realised
value of θc, as described below:
1. For θc ∈ (θ, λ), we obtain inter-community trade;
2. For θc ∈(λ, θc
), we obtain intra-community cooperative trade;
3. For θc ∈(θc,
λε
), we obtain, once again, inter-community trade;
4. For θc ∈(λε , θ), we obtain intra-community non-cooperative trade.
The first outcome describes the situation where the value of θc is suffi ciently low for cooperation to be
sustained in intra-community trade; but since trade with outsiders is relatively more attractive, community
members opt for the latter. As θc increases, community members will begin to find intra-community trade
more attractive and therefore may switch to this option. This is the second outcome described above.
However, when θc crosses the threshold θc, the temptation to cheat in intra-community trade is too strong:
therefore, cooperation cannot be sustained and members of the community will again prefer trading with
outsiders (third outcome). But for a suffi ciently high value of θc, community members will prefer intra-
community trade to inter-community trade even if cooperation cannot be sustained (fourth outcome).
It should be noted that if λ < θ, then the first type of outcome cannot occur. Similarly, if λ > θc, orλε < θc or λε > θ, then, correspondingly, the second, third or fourth type of outcome is not feasible.
For the subsequent analysis, we assume that θ < λ < θc <λε < θ, which means that each of the four
outcomes described above occurs for some range of values of θc. Then, for each community member, we can
write the expected utility from trade as follows:
Pr (θc < λ)Wo +
∫ θc
λ
θc
θ − θWcdθc + Pr
(θc < θc < λ/ε
)Wo +
∫ θ
λ/ε
θc
θ − θεWcdθc
10

=
(λε − θc + λ− θ
θ − θ
)Wo +
1
2
(θc
)2
− λ2 + ε(θ)2 − ε (λε )2
θ − θ
Wc (5)
3.4 The Cost of Social Exclusion in Equilibrium
If an individual is prevented from trading with other community members, she would receive a utility of Wo
in each period from trade with outsiders. Therefore, the loss in utility per period from such an embargo is
obtained by subtracting Wo from the expression in (5), as shown below:
B (Kp,Ks) =1
2
ε{(θ)2 − (λε )2}+
(θc
)2
− λ2
θ − θ
Wc −(θ − λ
ε + θc − λθ − θ
)Wo (6)
If the punishment imposed on individuals who cheat in intra-community trade is an embargo of T periods,
then we have
P (Kp,Ks) =∑T
t=1βt−1B (Kp,Ks) (7)
Note that it is possible to adjust T , weighing the advantages of increasing severity of punishment against
the social cost of exclusion, so as to maximise the expected utility of community members. However, for the
present analysis, we regard it as an exogenous parameter determined by custom. This may be justified if
long-term social exclusion is not regarded as practical for (economic) reasons not explicitly introduced into
the model.
3.5 How Cooperation is Affected by the Relative Gains from Inter-Communityversus Intra-Community Trade
Recall that θc = β(ε−µ−1)
[P (Ks,Kp)Wc(Ks) + δ
]. Using (6) and (7) and the definition of θc, and letting κ (T ) =∑T
t=1
βt
2(θ−θ),
(ε− µ− 1) θc = κ (T )
[(ε
{(θ)2 − (λ
ε
)2}
+(θc
)2
− λ2
)− 2λ
(θ − λ
ε+ θc − λ
)]+ βδ
Rearranging and simplifying terms, we obtain
(ε− µ− 1) θc = κ (T )
[ε
(θ − λ
ε
)2
+(θc − λ
)2]
+ βδ (8)
Equation (8) may have zero, one or two solutions. By construction, θc ∈[λ, θ]. Therefore, we need only
consider solutions in this interval. If there are two solutions in this interval, we consider the one corresponding
to a higher value of θc as it is pareto-superior to the other.
If[ε− µ− 1− 2κ (T )
(θc − λ
)]< 0 at the (unique or higher-vaIue) solution, this means that values of θc
above the solution are also sustainable. More precisely, there is an equilibrium where community members
cooperate in intra-community trade for all values of θc.
If the equation has no solution in the interval θc ∈[λ, θ]then, if the quadratic expression on the right-
hand side of (8) lies below the linear expression on the left-hand side, then this means that cooperation
11

cannot be sustained in intra-community trade for any value of θc; and if the opposite is true, cooperation
can be sustained for all values of θc.
The comparative statics are, of course, interesting only if cooperation can be sustained for a subset of θc
values. Therefore, the following lemma, on the impact of changing λ and δ on θc, focuses on this case. The
proof of the lemma is provided in the Appendix.
Lemma 1 If equation (8) has a solution in the interval[λ, θ], and
[ε− µ− 1− 2κ (T )
(θc − λ
)]> 0 at
this solution, then ∂θc∂λ < 0 and ∂θc
∂δ > 0 .
Lemma 1 implies that the level of intra-community cooperation declines in the relative value of inter-
community trade, as represented by λ.
3.6 How Investment in Infrastructure Affects the Utility from Trade
Investment in physical infrastructure leads to an increase in Kp and consequently in the gains from trade
with outsiders, Wo. This leads to a direct increase in the expected utility in trade, as seen in (5), but
also a decrease in the relative value of intra-community trade which, using Lemma 1, makes cooperation in
intra-community trade more diffi cult to sustain; i.e. it leads to a decrease in θc. This negatively affects the
expected utility from trade.
Investment in social infrastructure leads to an increase in Ks and consequently in the gains from intra-
community trade, Wc. This leads to a direct increase in the expected utility in trade, as seen in (5), but
also an increase in the relative value of intra-community trade which, using Lemma 1, makes cooperation in
intra-community trade easier to sustain; i.e. it leads to an increase in θc. This positively affects the expected
utility from trade.
Formally, differentiating throughout (5) with respect to Kp and simplifying terms, we obtain(λε − θc + λ− θ
θ − θ
)∂Wo
∂Kp+
∂λ
∂Kp
∂θc∂λ
(θcWc −Wo
θ − θ
)(9)
Differentiating throughout (5) with respect to Ks, we obtain
1
2
(θc
)2
− λ2 +(θ)2 − (λε )2
θ − θ
∂Wc
∂Ks+
∂λ
∂Ks
∂θc∂λ
(θcWc −Wo
θ − θ
)(10)
The first term in (9) and (10) represent the direct effects of investment on the expected gains from trade;
while the second term represent the indirect effects. When θc > λ, the expression θcWc−Wo is positive and
increasing in the level of cooperation in intra-community trade, and therefore the magnitude of the indirect
effect in both (9) and (10) is higher in communities with higher levels of cooperation.
For fixed levels of Ks and Kp, higher δ translates into greater cooperation in intra-community trade,
i.e. higher θc (Lemma 1). From (9) and (10), it is evident that both the direct and indirect effects of an
investment in social infrastructure are increasing in θc while the direct and indirect effects of an investment
in physical infrastructure are decreasing (in the case of the indirect effect, becoming more negative) in θc.
Thus, we obtain the following result.
12
Proposition 1 For a fixed level of physical and social infrastructure, if the conditions of Lemma 1 are
satisfied, communities which exhibit higher levels of intra-community cooperation (greater δ and θc) also
have a stronger preference for investments in social infrastructure compared to physical infrastructure.
3.7 The Impact of Fiscal Decentralisation
Let us denote by U (Kp,Ks; δ) the expected utility from trade for an individual in a community where the
level of physical and social infrastructure are given by Kp and Ks respectively and δ, as discussed in Section
3.3, represents the scope of community sanctions.
It is important to realise that the objective of the relevant authorities — the central government, the
local elite or democratically elected leaders — in allocating public spending, may have included goals not
captured by the term U (Kp,Ks; δ). As discussed in Section 2, the Soeharto administration pursued a policy
of national unity and industrialisation and therefore the central government may have preferred investment
choices that would accelerate economic and social integration of isolated communities. The local elite may
have preferred certain types of investment for which the profits were easier to capture.
To capture other objectives that may be pursued by the relevant authorities in determining the allocation
of public spending, we introduce a distinct function Θ (Kp,Ks) which is continuous and differentiable in
both arguments; and assume that investment decisions were obtained from maximising a weighted average
of U (Kp,Ks; δ) and Θ (Kp,Ks) as below:
maxKp,Ks
(1− γ)U (Kp,Ks; δ) + γΘ (Kp,Ks) (11)
subject to Kp +Ks ≤ Y and Kp,Ks ≥ 0
The effects of fiscal decentralisation on decisions regarding local public spending can, then, be treated as
a shift in γ. We denote by K∗p (δ, γ, Y ) ,K∗s (δ, γ, Y ) the solution to the maximisation problem in (11) and
by Ψ the expression(∂U∂Ks− ∂U
∂Kp
)−(∂Θ∂Ks− ∂Θ
∂Kp
). Using Topkis’theorem (Topkis 1998), we can establish
the following results (the proof is shown in the Appendix)
Proposition 2 (i) If the conditions of Lemma 1 are satisfied then ∂K∗p/∂δ < 0 and K∗s /∂δ > 0; (ii) If
Ψ > 0 for Kp,Ks > 0, then ∂K∗p/∂γ > 0 and K∗s /∂γ < 0, and if Ψ < 0, then ∂K∗p/∂γ < 0 and K∗s /∂γ > 0.
The first part of Proposition 2 implies that, holding fixed the role of different agents — the central
government, the local elite, and the village electorate —in the allocation of public funds within the community,
the optimal level of investment (as defined in (11)) in social instructure should be higher —and in physical
infrastructure lower —in communities characterised by higher levels of cooperation.
The expression Ψ, in the second part of Proposition 2, measures the change in U (.) when a small quantity
of funds are transferred from physical infrastructural investments to social infrastructural investments, minus
the corresponding changes in Θ (.). If the expression is positive for all values of Kp and Ks, it means, roughly,
that the relative importance of social infrastructure over physical infrastructure is greater for the benefits of
trade compared to whatever policy objective is represented by the function Θ (.).
13

The second part of Proposition 2 states that if this condition holds true, then at a higher value of γ, the
level of physical infrastructure would be higher, and the level of social infrastructure lower, in the ‘optimal’
allocation of public funds.
As we have not specified the function Θ (.), we cannot say whether and when the conditions in Proposition
2(ii) will hold true. However, using the reasoning in the proof of Proposition 1, we can show that, for fixed
values of Ks and Kp, we have Us − Up increasing in δ.Therefore, the function Ψ (.) is more likely to be positive in communities characterised by higher levels
of cooperation. It follows that in communities with higher levels of cooperation, increasing γ would decrease
the allocation of public funds to social infrastructure in the solution to (11); while in communities with lower
levels of cooperation, increasing γ would have the opposite effect. We can state this result formally as a
corollory to Propositon 2:
Corollary 1 of Proposition 2: If δ′ > δ and∂K∗p∂γ |δ > 0 and K∗s
∂γ |δ < 0, then∂K∗p∂γ |δ′ > 0 and K∗s
∂γ |δ′ < 0. If
δ′ < δ and∂K∗p∂γ |δ < 0 and K∗s
∂γ |δ > 0, then∂K∗p∂γ |δ′ < 0 and K∗s
∂γ |δ′ > 0.
We can use the corollary to determine whether fiscal decentralisation resulted in an increase or decrease
in γ. Suppose that, in communities characterised by high levels of cooperation, fiscal decentralisation is
more frequently associated with a shift in local public spending towards social infrastructure and away from
physical infrastructure. If so, then, according to the corollary to Proposition 2, the process of decentralisation
would be consistent with a decrease in γ; i.e. with more emphasis being placed on the expected utility from
trade. By contrast, if fiscal decentralisation is more frequently associated with a shift towards physical
infrastructural spending in communities characterised by high levels of cooperation, then the process would
be consistent with an increase in γ.
4 Data and Methodology
The analysis is based on community-level data obtained from the Indonesian Family Life Survey (IFLS).
In addition to household level data akin to that in the Living Standards Measurement Surveys, the IFLS
provides detailed information on communities. Each round of the IFLS contains information on 314 rural
and urban communities drawn from 13 provinces including Jakarta, Bali, Java (central, east and south),
Sumatra (north, west and south), Lampung, Wntenara and south Kalimantan (for further details on the
data see Frankenberg and Thomas, 2000; Strauss et al. 2009). Although the IFLS was conducted in 1993,
1997, 2000, 2007, only the rounds from 1997 and 2007 contain information on a community’s adherence to
adat laws and nature of governance. Therefore, our analysis makes use of the 1997 and 2007 rounds of the
IFLS only.
4.1 Description of the Data
Formal Institutions: We consider the role of both formal and informal institutions on the provision of
public goods. To analyse the role of formal institutions, we classify communities according to the level
of democratisation in local governance. Local government in Indonesia consists of a headman assisted by
14

an appointed village assembly (LMD) throughout the country. Development projects and assistance were
managed by community resilience boards (LKMD) who allocated development grants (mainly from the
central government) across households and projects. Law 22/99, enacted in January 2001, gave villages
more autonomy in raising local revenues, replacing direct grants from the central government. This change
paved the way for fiscal decentralisation. Elections of both the headman and the council now take place
every five years and the headman is directly accountable to the council.
The 1997 and 2007 rounds of the IFLS included questions on how the community leader was selected.
Answers to this question are coded as: (i) voting, (ii) all residents, (iii) local elites, (iv) local institutions
and (v) others. Under ‘voting’ (code (i)) and ‘all residents’ (code (ii)), the standard notion of plurality
was employed where the voting population consisted of local community residents. Otherwise, community
leaders were chosen by ‘local elites’(code (iii)) or by existing offi cials of local government bureaucracies (code
(iv)). It is not clear how ‘others’(code (v)) selected the local leader, and so we exclude these communities
from our analysis. Accordingly, we classify the local polity as ‘democratic’if a leader is selected by free and
fair elections with all community members having the right to vote, and ‘oligarchic’if a leader is selected
by community elites (codes (iii) and (iv)), who then remain uncontested. We assume that the incidence of
oligarchies reflects the scope for elite capture. Using this data, we define a binary variable ELITE which
takes a value of 1 for ‘oligarchic’communities and 0 for ‘democratic’communities.
Using this classification, Table 1 summarises information on the selection of community leaders across
communities in 1997 and 2007. The data shows substantial changes in the selection process between the two
years. While there is a trend towards increasing democracy —which may, in part, be due to the introduction of
the fiscal decentralisation laws —the process of selection of community leaders remained ‘oligarchic’in about
one-third of the communities. Although rural communities opted for ‘democracy’after the introduction of
fiscal decentralisation, there was a greater incidence of ‘oligarchy’among urban communities in our sample.
This pattern may have been a direct result of the Village Law of 1979, discussed in Section 2.
Informal Institutions: To analyse the role of informal institutions on the provision of public goods,
we classify communities according to their degree of adherence to adat laws. The IFLS data place each
community into one of four possible categories: (i) traditional laws are almost never broken; (ii) traditional
laws are sometimes broken; (iii) traditional laws are frequently broken and (iv) only a few people understand
traditional laws. We classify a community as an adat community if adat laws are ‘almost never broken’and
a non-adat community otherwise. Table 2a summarises the distribution of adat communities in 1997 and
2007. Overall, a smaller proportion of sample communities adhered strictly to adat law in 2007 than in 1997.
The IFLS data also provides information on the extent to which community members participate in
mutual cooperation groups. In 1997, a significantly higher proportion of individuals participated in such
groups in adat communities than in non-adat communities (see Table 2b). But there is a sharp rise in
mutual cooperation activities in both types of communities in 2007, and the differences in the rates of
participation are no longer statistically significant. As the classification based on adat laws are more stable
across the two years than the classification based on mutual cooperation activities, we regard it as a more
reliable measure of underlying informal institutions at the community-level. The 1997 data indicates that
15

the adat communities tend to practise a significantly higher level of mutual cooperation, and we adopt this
interpretation to interpret our empirical findings. We define a binary variable ADAT which takes a value of
1 for communities where adat laws ‘are almost never broken’and 0 otherwise.
Physical Infrastructural Goods: The aim of the paper is to examine how local institutions shape the
provision of different types of public goods. Therefore, we focus on a number of basic infrastructural goods
that could directly impact on sustainable livelihoods and provide opportunities for all, especially for the
poor. The list of ‘physical’infrastructural goods we consider includes the community’s access to cemented
local roads , access to motorised public transport including buses and boats, access to a public telephone
offi ce, and access to a post offi ce. Local roads and motorised public transport can subtantially reduce the
disadvantages associated with geographical isolation and remoteness and are, therefore, potentially important
tools for economic development and poverty alleviation. Similarly, the availability of public telephone services
and post offi ces could substantially reduce the disadvantages associated with location and distance. Using
principal components methods, we generate a composite infrastructural goods index consisting of the afore-
mentioned physical infrastructural goods (labelled PCINFRA).
Social Goods: We compare these physical infrastructural goods with a community’s access to two
important ‘social’goods: namely, the number of government schools and health centres per capita. Table 3
compares adat and non-adat communities in terms of their access to these public goods. It is evident that
the adat communities have worse access to ‘physical’infrastructural goods but better access to government
schools and health centres.
In general, the fiscal decentralisation in Indonesia did not, in fact, decentralise the system of revenues.
Rather, the key change was a shift in the centre of power from the central government in Jakarta to the
district governments located in the district headquarters. Fiscal decentralisation, as contained in Law 25/99,
gave communities absolute freedom on how to spend public funds received from the district headquarters,
which they did not have before.The district governments received grants from the central government for a
‘General Allocation Fund’according to the following ‘fiscal needs formula’(Brodjonegoro 2001):
average local expenditure × 14 [population index + area index + construction price index + poverty index]
The IFLS data provides details of the community budget and we use this information to calculate the
allocation of public spending between new social and physical infrastructural goods. Accordingly, we classify
community level spending as follows: (i) spending on social development, which includes spending on edu-
cation, health, community services and women’s development and (ii) spending on village enterprises and
physical infrastructural goods. The remainder of community public budget goes to the maintenance of local
infrastructure, the payment of salaries and other administrative expenses. We construct variables SHSOC
and SHINFRA defined, respectively, as the proportion of total development spending on social infrastructure,
and the proportion of total development spending on physical infrastructure.
Table 4 provides summary statistics on the source of revenues and share of spending on different types
of public goods in 1997 and 2007. It is evident that the share of the funds received directly from the central
government fell sharply following decentralisation; however, this decline was accompanied by an increase in
16
the share of the funds received from the district-level governments. Furthermore, there was a significant
increase in the share of community spending on ‘physical’infrastructural goods in the post-decentralisation
period when local governments were given full freedom to spend according to their needs.
4.2 Methodology
We exploit changes in the share of the grant from the central government in the community budget before
and after the introduction of fiscal decentralisation to identify the causal effects of fiscal autonomy, and
informal and formal institutions, on the provision of public goods. Our identification strategy is described
below.
Let yit be the share of the public good y in the total expenditures budget of community i in period t;
and let Xit be a vector of characteristics of community i in period t. Let Rit be a measure of the extent to
which spending is determined by local authorities versus central government authorities in community i in
period t (with larger numbers indicating a greater say for local authorities) .
We propose the following relationship:
yit = Xitβx + (Rit ×Xit)βrx + uit (12)
where E(uit|Xit, Rit) = 0, V ar(uit|Xit, Rit) = σ2. In general, fiscal decentralisation shifted Rit in
favour of local authorities. However, the extent of the shift may be correlated to the initial conditions in
the community. Morever, certain community characteristics, particularly local institutions, may themselves
have been affected by the process of fiscal decentralisation (besides other exogenous factors). Therefore, we
proceed by estimating the following equation with Rit as the dependent variable:
Rit = Ziδz + (Dt × Zi)δtz + vit (13)
where Dt is a binary variable which takes a value of 1 in year 2007 and 0 otherwise; and Zi is a set of
time-invariant community-level characteristics. Equation (13) allows for the effect of these time-invariant
community characteristics on Rit to change over time. This assumption seems plausible as the fiscal de-
centralisation laws, introduced in 2001, changed the balance between the local government and the central
government in local public spending decisions. Using our estimates for (13), we can compute, Rit, predicted
values for Rit. We can replace Rit with its predicted values in (12) and estimate the resulting equation with
community fixed-effects.
Variables in Zi can, of course, directly influence yit. But there is no a priori reason to assume that the
direct influence of Zi on yit changes from one period to the next. Equation (12) implicitly assumes that
the direct influence of any time-invariant community characteristics on yit is constant over time. Under
this assumption, the direct influence of Zi on Rit will be absorbed in community fixed-effects and any
time-variation in Rit can be attributed to the fiscal decentralisation process. Therefore, it constitutes our
identifying assumption for determining the effect of Rit on yit.
In practice, we measure Rit using the share of the grant from the central government in the community’s
public spending budget. We take a larger share to indicate that the central government had greater influence
17

in local spending decisions. We select variables for Zi using the ‘fiscal rule formula’discussed in the preceding
section as a guide: Z includes the population and geographic size of the community, its distance from the
district headquarters, the proportion of households in the community that are poor, and binary variables to
indicate whether the community is rural and has access to sea, and whether Islam is the main religion. (The
population and the poverty rate, of course, do change over time but these changes account for only a small
part of the total variation in Rit). We use district fixed-effects to estimate (13), as the ‘fiscal rule formula’
was applied at the level of the district.
We estimate equation (12) with SHSOC (the share of ‘social’spending in the community’s public goods
expenditures) and SHINFRA (the share of ‘physical’ infrastructural spending in the community’s public
goods expenditures) as the dependent variable. Furthermore, to see how the stock of physical infrastructure
and social goods are influenced by decentralisation and local institutions, we also use the index of physical
infrastructural goods (PCINFRA) and the number of government schools and health centres per capita as the
dependent variable. We include the binary variables ELITE and ADAT among community characteristics in
the second-stage equation as we are interested in the impact of local institutions on local public spending and
the differential impact of fiscal decentralisation across different types of local institutions. Our second-stage
specification can be written as follows:
yit = AdatitβA + EliteitβE + RitβCG + (Rit ×Adatit)βCGA + (Rit × Eliteit)βCGE + ci + uit (14)
We also compare the IV estimates of (14) with the un-instrumented estimates (15) below
yit = Adatitβa + Eliteitβe +Ritβcg + (Rit ×Adatit)βcga + (Rit × Eliteit)βcge + ci + vit (15)
We estimate equations (14) and (15) with community fixed-effects ci to absorb the direct effect of time-
invariant community characteristics.
According to the theoretical results discussed in Section 3.7, the sign of the coeffi cient βCGA should
indicate whether fiscal decentralisation led to a change in the weight assigned to expected gains from within-
and between-community trade for community members in determining the allocation of local public expen-
ditures. If the coeffi cient is negative when y is the share of social investments in the community budget, this
means that an increase in Rit corresponds to a decrease in γ as defined in Section 3.7. In other words, fiscal
decentralisation led to increased emphasis on gains from trade for community members in public spending
decisions. If the coeffi cient is positive, then fiscal decentralisation shifted emphasis from the gains from trade
for community members to other social, economic or political objectives.
5 Empirical Results and Analysis
In this section, we present and analyse our results. We start with the un-instrumented estimates of equation
(15) as shown in Appendix Table A1. However, given the potential endogeneity of the share of the central
grant as a measure of R, we focus our analysis on the instrumented estimates of equation (14). These
18
estimates are shown in Tables 5, 6 and 7: while Table 5 shows the first stage estimates of share of central
grant, Tables 6 and 7 respectively show the instrumented estimates of the share of public spending on
physical infrastructure and social goods (see section 5.1) and access to public infrastructural goods (see
section 5.2). For each dependent variable, we also conduct the Davidson-McKinnon exogeneity test to
examine the consistency of the OLS with the corresponding IV estimates in a panel framework. This
computes an F-statistic where the null hypothesis is that an uninstrumented OLS of the same equation
would yield consistent estimates. A rejection of the null hypothesis would in turn mean that the endogenous
regressor’s effects on the particular dependent variable are meaningful. Finally, we check the robustness
of our central estimates shown in Tables 6 and 7, by considering sub-samples of communities that did not
experience any change in formal and informal institutions over the decade 1997-2007 (see section 5.4).1
In order to obtain the instrumented estimates of public goods provision, we start with the district-level
FE-OLS estimates of equation (13). We include not only the set of variables Z (see section 4.2), but also
a set of interaction terms between a year-dummy variable (which takes a value of 1 for the year 2007 and
0 otherwise) and variables in Z. As indicated above, the choice of explanatory variables has been dictated
by the ‘fiscal rule formula’ introduced at the time of fiscal decentralisation in 2001. These estimates are
clustered at the district-level to minimise the problem of correlation over time for a given district (see Table
5). We particularly focus our attention on the interaction terms which represent the differential effects
of fiscal decentralisation. In general, there is evidence of a significant differential effect of the population,
geographical size, and location of the community (i.e. whether or not it is rural and has access to sea and its
distance from the district headquarters). The estimates indicate that, while the share of the grant from the
central government in the community public spending budget fell across communities on average in 2007,
the decline was more muted in coastal, rural, more populous, and geographically larger communities. We
use these estimates to calculate fitted values for the share of the central government grant. These values are
then used as the relevant community-level instrument for the estimation of public goods provision, as laid
out in equation (12).
5.1 Estimates of Shares of Public Spending
Table 6 reports the estimated coeffi cients from the second-stage regressions involving the share of physical
and social investments in the community budget. In each case, the Davidson-McKinnon test rejects the
null hypothesis suggesting that the panel IV estimates are meaningful. In the case of physical investments
(column 1), the coeffi cient of the share of the central government grant in the community budget is negative
and significant. Thus, as the central government’s share in the community budget increases, spending on
physical infrastructure goes down. Given the signs of the coeffi cients on the interaction terms, this negative
effect is even stronger for adat communities but more muted for ‘elite’communities (both are statistically
significant). For the share of social spending (column 2), the central government’s share in the community
budget does not significantly affect spending on social goods. However, there is potentially a positive effect
on adat communities (though statistically insignificant) and a negative effect on ‘elite’communities.
1The corresponding first stage estimates are shown in Appendix Table A4.
19

These results indicate that the process of decentralisation —which led to a decline in central govern-
ment’s contributions to local budgets —led to a sharp rise in the share of community spending on physical
infrastructural investments. Furthermore, this effect was stronger for adat communities and weaker for ‘elite’
communities. This implies that the central government constrained infrastructural spending across all com-
munities; but to a greater extent in adat communities than in non-adat communities; and to a lesser extent
in ‘elite’communities than in ‘non-elite’communities.
By contrast, fiscal decentralisation did not lead to a significant change in the share of community budgets
devoted to social spending.
5.2 Estimates of Public Infrastructural Goods
Table 7 reports the estimates from the second-stage regressions involving the existing level of public goods
provision. As with public spending shares, in these cases too, the Davidson-McKinnon test rejects the null
hypothesis suggesting that the panel IV estimates are meaningful.
Recall that the dependent variable PCINFRA (column 1) is a composite index comprising of binary
variables indicating the presence of concrete roads, access to bus services, post offi ce facilities, and a public
telephone offi ce in the community. As such, it is a measure of physical infrastructure which facilitate
communication and exchange with individuals outside of the community; and it can be regarded as the
‘stock’ variable corresponding to the measure of investment in physical infrastructure considered in the
previous section.
The coeffi cient for the variable ELITE is negative and statistically significant while that of ADAT is
close to zero; therefore, the level of physical infrastructure is lower in communities where the process of
selecting leaders is non-democratic; but there is little difference between adat and non-adat communities.
The coeffi cient of the share of the central government’s grant in the community budget is negative and
statistically significant; therefore, an increased role of the central government in budget decisions is associated
with lower levels of physical infrastructure.
However, the corresponding interaction term with the variable ELITE is positive, statistically significant,
and of the same order of magnitude as the uninteracted term. Thus, where local institutions favour the
elite, changing the share of the central government in the budget has no impact on the stock of physical
infrastructure; the objectives of the central government are in line with those of the elite. The coeffi cient for
the interaction term with the variable ADAT is not significantly different from zero; this suggest that the
central government did not pursue differential policies in adat versus non-adat communities.
We also consider how the share of the central government’s grant in the local budget influences the number
of government schools and health centres per capita (columns 2 and 3 of Table 7). These can be regarded
as the ‘stock’variable corresponding to the measure of investment in social infrastructure considered in the
previous section. The central government appears to have a strongly positive effect on the stock of schools
but a negative effect on health centres.
In adat communities, a greater role of the central government is associated with more schools and more
health centres (both effects are statistically significant). But in the ‘elite’ communities, a greater role of
20

the central government is associated with fewer schools and health centres (albeit the second effect is not
statistically significant).
By contrast, we do not observe any significant differences between adat and non-adat communities and
‘elite’and ‘non-elite’communities in terms of the stock of social infrastructure, when the central government
is absent.
In summary, the estimates with the stock variables are very similar to those with the investment share
variables. The difference between communities with different local institutions is not that they exhibit
different preferences in public goods spending —with the exception that ‘elite’communities appear to care
less about investment in physical infrastructure and have lower levels of infrastructure —but rather that the
central government, when and where it had a role in these decisions, pursued different policies in communities
with varying local institutions. The central government is investing less in the physical infrastructure of adat
communities, and there are indications that they are investing more in the social infrastructure of these
communities. Moreover, the central goverment is offseting the tendency of ‘elite’communities to spend less
on physical infrastructure, and supressing spending on social infrastructure in these communities. In the
next section, we consider possible explanations for these results.
5.3 Possible Explanations
5.3.1 East Asian Financial Crisis
The first explanation we need to consider is that public spending between the two rounds of the survey, 1997
and 2007, was affected by the East Asian financial crisis. The crisis inflicted a major blow to infrastructural
investment; transport and communication output contracted by 36.44% and 15.13% respectively; road con-
ditions deteriorated significantly due to the lack of maintenance funds and this reduction was more dramatic
in rural areas (World Bank 2004b).
The crisis would have suppressed spending on both physical infrastructure and social infrastrcuture at
the start of the crisis in 1997. And the recovery in spending would have occurred during the same period that
fiscal spending was being decentralised. Therefore, we would expect the data to show a negative correlation
between the share of central government funds in the community budget and spending on infrastructure.
Indeed, in the estimation results we observe a negative effect of centralisation on spending in physical
infrastructure. However two other factors in the results indicate that this cannot be explained entirely by the
East Asian financial crisis. The first is that we observe similar effects not only for annual spending but also
for the corresponding stock variables across communities. While spending in 1997 would have been adversely
affected by the financial crisis —which began in the same year —it seems implausible that the stock of physical
infrastructure in those communities would have suffered and declined to the same extent at the very start
of the crisis. Second, while we observe a negative effect of fiscal centralisation on physical infrastructure
spending, we do not observe a similar effect for spending on schools and health centres. This suggests that
the positive effect of fiscal decentralisation on physical infrastructure spending in communities we observe in
the data goes beyond the simple correlation between the process of decentralisation and recovery from the
East Asian financial crisis.
21
5.3.2 Urban Bias
The second possibility that needs to be considered is urban bias in development policies pursued by the Soe-
harto regime in Indonesia (1966-1998)..The 1979 village laws laid down by Soeharto made a.clear distinction
between rural and urban areas with, for example, differential rules for the selection of leaders in rural and
urban communities. Soeharto supported national entrepreneurship to build big businesses, which in turn led
to the rapid development of urban centres (Hill and Shiraishi 2007). It can also be argued that Soeharto’s
power base was concentrated in urban areas and, therefore, the central government had clear incentives to
invest more heavily in these areas.
It is evident from Table 1 and Table 2 that the ‘elite’communities identified in our data are more likely
to be urban; while the adat communities are more likely to be rural. Urban bias would translate into higher
spending in ‘elite’ communities and lower spending in the adat communities; and if the process of fiscal
decentralisation reduced urban bias, decentralisation would be associated with increased spending in adat
communities and decreased spending in ‘elite’communities.
We noted earlier that the central government constrained infrastructural spending to a greater extent
in adat communities than in non-adat communities; and to a lesser extent in ‘elite’communities than in
‘non-elite’communities. This would be consistent with a policy of urban bias in the development of physical
infrastructure. However, in the case of social infrastructure (schools and hospitals), the regressions involving
stock levels indicate that the central government invested more heavily in adat communities and less in the
‘elite’communities; a phenomenon that cannot be explained by the notion of urban bias alone.
5.3.3 Decentralisation and Community Norms
One of the aims of this paper is to study how fiscal decentralisation affected communities which practised
traditional norms of solidarity, compared to those where such norms are weak or absent. For this purpose
we distinguished, as described earlier, between adat and non-adat communities in the data; and analysed,
within a theoretical model, the socially optimal investment choice as a function of the existing level of mutual
cooperation in the community.
The estimated coeffi cients of the interaction term involving the binary variable ADAT and the share of the
central government’s grant in the community budget, in Table 7, indicate that the central government made
differential choices across adat and non-adat communities. Specifically, the coeffi cients imply that, in adat
communities, fiscal centralisation was associated with greater investment in social infrastructure (i.e. schools
and health centres) and less investment in physical infrastructure, compared to non-adat communities. (The
estimated coeffi cients for the interaction term ‘adat x shcg_iv_distfe’for the investment shares regressions
in Table 6, although statistically insignificant, are consistent with this interpretation). According to the
theoretical discussion in Section 3.7, these estimates imply that fiscal decentralisation led to an increase in
γ; i.e. greater weight being placed on factors other than the effects of investments on intra-community trade,
as represented by the function U (Kp,Ks; δ).
The small and statistically insignificant coeffi cients for the ADAT variable in the corresponding regressions
imply that, by 2007 —when the contribution of the central government in the community budget had, on
22

average, declined to 6% —there was little difference in the investment choices and levels of infrastructure
across adat and non-adat communities; thus, fiscal decentralisation eroded the initial differences in public
spending.
The differential levels of investment across adat and non-adat communities in the pre-decentralisation
period appears, at first glance, contrary to the Soeharto regime’s policy of national integration (Hill and
Shiraishi 2007). However, the literature also documents organised resistence to the central government’s
efforts to control resources and political power in remote communities (Warren 2005a). Direct investment in
physical infrastructure of these communities, to improve communication with the outside world, may have
been viewed as encroachment and interference with their traditional way of life. Indeed, on a number of
islands, such efforts triggered immediate protests (Warren 2005b).
It is possible that the government pursued a more subtle strategy for promoting national integration
by investing heavily in education. Greater access to education would be welcome in all communities but
it could also be designed to reinforce the Indonesian identity —rather than the varied ethnic and religious
identities —of school students. Duflo (2001) highlights the importance of the very large school construction
projects initiated in 1973 with a view to boost school enrolment and thus redress regional inequality across
the country. This was particularly evident in the second five-year plan that saw as much as 12% of the
regional development budget being spent on school construction (as opposed to only 3.4% of the regional
development budget on public health). Indeed, in Table 7, we see that centralised fiscal control is associated
with more schools per capita at the expense of medical centres.
We argue that the investment choices during the period of centralised fiscal control were closer to the
‘optimal’levels (defined in terms of an objective of maximising the gains of trade, as represented by the func-
tion U (Kp,Ks; δ) in Section 3.7) in adat communities because deviations would have been met with strong
resistance from the communities themselves. The non-adat communities, would have less reason to worry
about investments in communications and transport (as the extent of mutual cooperation is lower to start
with) and therefore, the central government would have been more successful in making such investments.
In the post-decentralisation period, community members have more say about how public funds are in-
vested within the community. But it is important to note that while any opposition to the central government
during the period of centralised fiscal control would have been a collective community effort, in a democratic
setting community members vote individually and secretly. Individual community members may not take
into account the possibility that certain investment choices will unravel cooperation in the future; or they
may ignore the consequences of these investments because the process is too gradual to affect their personal
welfare. Thus, investment in communications and transport infrastructure may receive greater support in the
post-decentralisation period, both in adat and non-adat communities. This may explain why, as previously
noted, the effect of decentralisation on public spending appears to be consistent with an increase in γ, as
defined in (11).
Indeed, consistent with this narrative, we observe (i) higher levels of physical infrastructure investment in
the post-decentralisation period; (ii) lack of variation in physical infrastructure investment across adat and
non-adat communities in the post-decentralisation period; (iii) greater investment in physical infrastructure,
23

as well as higher levels of physical infrastructure in ‘non-elite’communities —in which community members
vote individually for leaders and policies —than in ‘elite’communities in the post-decentralisation period.
5.4 Robustness Checks
It is possible to argue that fiscal decentralisation induced changes in both formal and informal institutions in
our sample and, as such, these variables are potentially endogenous. To address this issue, we examine the
robustness of our results by considering communities with stable institutions: (i) communities where there
was no change in local polity (i.e. those with stable polity) and (ii) communities which saw no change in
terms of their adherence to adat laws over the decade (i.e., those with stable adat). These two sets of results
are shown in Appendix Tables A2 and A3 respectively.
The results are essentially similar to what we found earlier. As before, when the share of investments
in physical infrastructure is the dependent variable, the coeffi cient of the central government grant share is
negative and significant. Therefore, as the central government’s share in the community budget increases,
spending on physical infrastructure goes down. Given the signs of the coeffi cients on the interaction terms,
this negative effect is stronger for adat communities but more muted for ’elite’ communities (both are
statistically significant). This result holds for both types of communities —those with stable polity and those
with stable adherence to adat over the decade.
The effect is slightly different for these two types of communities when we consider the share of social
infrastructural spending: the coeffi cient of the central government’s share in the community budget is positive
and statistically significant (at the 10% level) for communities with stable adat and the effect is statistically
insignificant for communities with stable polity. The interaction terms are insignificant in all cases except
one: there is an additional negative effect of an increase in the share of central grant on ‘elite’communities,
significant at the 10% level. Broadly, these estimates are in line with those obtained for the full sample, as
shown in Table 6.
6 Concluding Comments
Improving the quality of public services available to the poor is, potentially, an important tool for poverty
alleviation in developing countries; and the potential role of fiscal decentralisation in this process has been
discussed extensively in the literature (World Bank 2004a). Since decentralisation provides greater decision-
making power to local governments, its impact on public goods provision should, arguably, depend on the
quality and nature of local institutions.
With this motivation, this paper investigated the impact of fiscal decentralisation on local public spending
in Indonesia using two rounds of the Indonesian Family Life Survey. Specifically, we explored how the share
of public spending on goods which facilitate communication and exchange with outsiders (collectively called
‘physical infrastructure’) and health and education (collectively called ’social infrastructure’) vary across
communities which differ in terms of their adherence to customary law and practice of local democracy.
We found that the period of centralised fiscal control was characterised by significant heterogeneity across
communities and that this heterogeneity disappeared following decentralisation.
24
Broadly, these findings indicate that the central government pursued different policies on public spending
across communities depending on the nature of local institutions. But when decision-making power regarding
public spending was transferred to the communities, they opted for similar policies, at least as measured by
the share of spending on ‘physical infrastructure’and ‘social infrastructure’.
Decisions regarding local public spending, when in the hands of the central government, can, potentially,
be shaped by political factors and strategies at the national level and the political science literature indicates
that this was true in the case of the Soeharto regime in Indonesia, as discussed in Section 2. Our findings
on heterogeneity of spending across communities prior to decentralisation provide support to this view.
However, the question as to whether or not the allocation of public spending following decentralisation
was more effi cient requires a more nuanced answer. We suggest the possibility that, during the period of
centralised fiscal control, community leaders were able to bargain more effectively with the central government
and push for policies that would maximise community welfare, and that this became more diffi cult following
decentralisation when community members were, at least in some instances, able to vote, secretly and
individually, for policies of their choice while ignoring negative externalities on other community members.
Such a narrative may explain why traditional adat communities spent a smaller share of development
funds on physical infrastructure compared to non-adat communities —in line with the social optimum derived
in our theoretical model —during the period of centralised fiscal control but not after fiscal decentralisation
had been implemented.
7 Appendix
Proof. of Lemma 1: Differentiating throughout (8) with respect to λ, we obtain
∂θc∂λ
[ε− µ− 1− 2κ (T )
(θc − λ
)]= −κ (T )
[2
ε
(θ − λ
ε
)+ 2
(θc − λ
)](16)
By assumption, ε− µ− 1− 2κ (T )(θc − λ
)> 0. Therefore, using (16), we have ∂θc
∂λ < 0.
Differentiating throughout (8) with respect to δ, we obtain
∂θc∂δ
[ε− µ− 1− 2κ (T )
(θc − λ
)]= β
Once again, if ε− µ− 1− 2κ (T )(θc − λ
)> 0, then ∂θc
∂δ > 0.
Proof. of Proposition 2: Let U (K, δ) = U (Y −K,K, δ) and Θ (K) = Θx (Y −K,K). Then the maximisa-
tion problem in (11) is equivalent to
max0≤K≤Y
(1− γ) U (K, δ) + γΘ (K) (17)
Let us denote by K∗ (δ) the solution to (17). Then, K∗s (Y, δ) ≡ K∗ (δ) and K∗p (Y, δ) ≡ Y −K∗ (δ).
(i) By definition, ∂U∂K = ∂U∂Ks− ∂U∂Kp
. Therefore, using Proposition 1, ∂2U∂K∂δ > 0. By construction, ∂2Θ
∂K∂δ = 0.
Therefore, we can apply Topkis’ theorem to (17) to show that ∂K∗
∂δ > 0. Therefore, ∂K∗p/∂δ < 0 and
K∗s /∂δ > 0.
25

(ii) By construction, taking the derivative w.r.t. K and γ throughout the maximand in (17), we obtain
−(∂U∂K −
∂Θ∂K
). If Ψ < 0 for all Ks,Kp ≥ 0, then we can apply Topkis’theorem to obtain K∗s /∂γ > 0 and
∂K∗p/∂γ < 0. Similarly, if Ψ > 0 for all Ks,Kp ≥ 0, then we can apply Topkis’theorem to obtain K∗s /∂γ < 0
and ∂K∗p/∂γ > 0.
References
[1] Alberto Alesina & Reza Baqir & William Easterly, 1999. "Public Goods And Ethnic Divisions," The
Quarterly Journal of Economics, MIT Press, vol. 114(4), pages 1243-1284.
[2] Alesina, A. and E. La Ferrara. 2005. Ethnic Diversity and Economic Performance’, Journal of Economic
Literature 63 pp. 762-800.
[3] Acemoglu, Daron, Simon Johnson, and James A. Robinson (2001) ‘The colonial origins of comparative
development: An empirical investigation.’American Economic Review 91(5), 1369—1401.
[4] Bandeira, O. and G. Levy. 2007. ‘The Diminishing Effect of Democracy in Diverse Societies’, mimeo,
London School of Economics, September.
[5] Banerjee, A., L. Iyer, and R. Somanathan. 2007. "Public Action for Public Goods", in Handbook of
Development Economics, edited by T. Schultz and J. Strauss, Vol. 4, pages 3117-3154.
[6] Bardhan, P. and D. Mukherjee. 2002. ‘Decentralisation of Governance and Development’, Journal of
Economic Perspectives, 185-205.
[7] Barro, R. 1996. ’Determinants of Economic Growth’
[8] Beard, V. 2007. ‘Household Contribution to Community Development in Indonesia’, World Development
35(4), 607-25.
[9] Besley, Timothy & Coate, Stephen, 1995. "Group lending, repayment incentives and social collateral,"
Journal of Development Economics, Elsevier, Vol. 46(1), pp. 1-18, February 1995.
[10] Besley, T. and A. Case, 2003. “Political Institutions and Policy Choices:Evidence from the United
States,”Journal of Economic Literature, XLI (March 2003) 7-73.
[11] Besley, T., R. Pande. and V. Rao. 2005. ‘Participatory Democracy in Action: Survey Evidence from
India’, Journal of European Economic Association Papers and Proceedings, Vol. 3 (2-3), pp. 648-657,
April - May 2005.
[12] Brodjonegoro, B. 2001. ‘Indonesian Intergovernmental Transfer in Decentralization Era: The Case of
General Allocation Fund’, Paper Presented at the International Symposium on Intergovernmental Trans-
fers in Asian Countries, Asian Tax and Public Policy Program, Hitotsubashi University, Tokyo, February
2001. (Accessed at http://www.econ.hit-u.ac.jp/~kokyo/symposium/PDF/Indonesia.PDF)
26

[13] Burroughs, J. and A. Rindfleisch. 2002. ‘Materialism and Well-Being: A Conflicting Values Perspective’
The Journal of Consumer Research, Vol. 29 (3), pp. 348-370
[14] Bowles and Gintis. 2004. ‘Persistent Parochialism: Trust and Exclusion in Ethnic Networks’, Journal
of Economic Behaviour and Organisation 55 pp. 1-23.
[15] Chaudhuri, A. 2005. ‘Conditional Cooperation and Social Norms in Public Goods Experiments’, mimeo,
University of Auckland, New Zealand.
[16] Coate, S. and M. Ravallion, 1993. "Reciprocity without commitment: characterisation and performance
of informal risk-sharing arrangements", Journal of Development Economics, Vol. 40, pp. 1—24
[17] Chattopadhyay, R., and E. Duflo. 2004. ‘Women as Policy Makers: Evidence from a India-Wide Ran-
domized Policy Experiment’, Econometrica, Vol. 72, pp. 1409-1443.
[18] Duflo, Esther. 2001. "Schooling and Labor Market Consequences of School Construction in Indonesia:
Evidence from an Unusual Policy Experiment." American Economic Review, 91(4): 795—813.
[19] Easterlin, R. 1995. "Will Raising the Incomes of All Increase the Happiness of All?" Journal of Economic
Behavior and Organization, 27:1 (June), 1995, 35-48.
[20] Easterly, W. 2001. ‘The Elusive Quest for Growth : Economists’Adventure and Misadventure in the
Tropics’, MIT Press, Cambridge.
[21] Fafchamps, M., 1992. "Solidarity Networks in Preindustrial Societies: Rational Peasants with a Moral
Economy", Economic Development and Cultural Change, Vol. 41(1), October 1992
[22] Faguet, J. 2001. Does Decentralisation Increase Responsiveness to Local Needs? Evidence from Bolivia’,
Policy Research Working Paper No. 2516, World Bank, Washington DC.
[23] Frankenberg, E. and D. Thomas. (2000). “Study Design and Results fromWaves 1 and 2,”Santa Monica,
CA, Rand, DRU - 2238, Volumes 1-7, NIA/NICH.
[24] Grief, A. 1994. Cultural Beliefs and the Organization of Society: A Historical and Theoretical Reflection
on Collectivist and Individualist Societies’, Journal of Political Economy 102(5), pp. 912-50.
[25] Greif, Avner., 1993. "Contract Enforceability and Economic Institutions in Early Trade: The Maghribi
Traders’Coalition", The American Economic Review, Volume 83
[26] Guiso, Sapienza and Zingales. 2006. ‘Does Culture Affect Economic Outcomes?’ Journal of Economic
Perspectives.
[27] Heine, S.J. 2007. ‘Cultural Psychology’, W.W. Norton & Compnay.
[28] Hal HILL & Takashi SHIRAISHI, 2007. "Indonesia After the Asian Crisis," Asian Economic Policy
Review, vol. 2(1), pages 123-141.
27

[29] Hoff, K. and A. Sen, 2005. "The Kin System as a Poverty Trap?", World Bank Policy Research Working
Paper No. 3575, April 2005.
[30] Khawaja, A. 2008. ‘Can Good Projects Succeed in Bad Communities ?’ Journal of Public Economics
(forthcoming).
[31] Kimball, M., 1988. "Farmers’cooperatives as behaviour toward risk", American Economic Review, 78
(1988), pp. 224—232
[32] Kranton, R., 1996. "Reciprocal Exchange: A Self-Sustaining System", The American Economic Review,
Vol. 86(4), September 1996, pp. 830-851
[33] Kuran, T. 1997. ‘Islam and Underdevelopment: An Old Puzzle Revisited’, Journal of Institutional and
Theoretical Economics.
[34] Ledyard, J. (1995) ‘Public goods: A survey of experimental research.’In The Handbook of Experimental
Economics, ed. J.H. Kagel and A. Roth (Princeton University Press) pp. 205—356
[35] Mansuri, G. and Rao. 2004. ‘Community Based and Driven Development: A Critical Review’, World
Bank Research Observer 19(1) 1-39.
[36] Miguel, E. and M. Gugerty. 2005. ‘Ethnic diversity, social sanctions, and public goods in Kenya’, Journal
of Public Economics, 89: 11, 2325.
[37] Musgrave, R.A. 1983. ‘Who Should Tax, Where and What?’ in Tax Assignment in Federal Countries,
by Charles McClure (ed), Canberra: Centre for Research on Federal Financial Relations, Australian
National University
[38] Narayanan and Pritchett. 1999. ‘Cents and Sociability —Household Income and Social Capital in Rural
Tanzania’, Economic Development and Cultural Change 47(4) 871-98.
[39] Oates, W. 1972. Fiscal Federalism, New York: Harcourt Brace Jovanovich.
[40] Oates, W. 1999. ‘An Essay on Fiscal Federalism’, Journal of Economic Literature, 37 p. 1120-49.
[41] Olken, B. 2007. Political Institutions and Local Public Goods, mimeo, Harvard University, February.
[42] Persson, Torsten, and Guido Tabellini, 2004. “Constitutions and Economic Policy”, Journal of Economic
Perspectives, 18(1) (Winter 2004) 75-98.
[43] Pal, S. and J. Roy. 2010. ‘Fiscal Decentralisation and Development: How Crucial is Politics?, IZA
discussion paper.
[44] Pande, R. 2003. ‘Can Mandated Political Representation Increase Policy Influence for Disadvantaged
Minorities? Theory and Evidence from India’, American Economic Review, Vol. 93, pp. 1132-1151.
28

[45] Platteau, J-P. 2000. Institutions, Social Norms and Economic Development, Harwood Academic Pub-
lishers.
[46] Platteau, J.P., 2006. "Solidarity Norms and Institutions in Agrarian Societies: Static and Dynamic
Considerations" in Handbook of the Economics of Giving, Altruism and Reciprocity, edited by S. Kolm
and J. Mercier Ythier. North Holland.
[47] Putnam, R. 1993. Making Democracy Work, Princeton University Press, Princeton, NJ.
[48] Reinikka, R. and J. Svensson. 2002. ‘Coping with Poor Public Capital’, Journal of Development Eco-
nomics 69(1), pages 51-69.
[49] Strauss, J., F. Witoelar, B. Sikoki and A. M. Wattie (2009). “The 4th Wave of the Indonesian Family
Life Survey (IFLS4): Overview and Field Report,”WR - 675/1 - NIA/NICHD.
[50] Topkis, D.M. (1998). Supermodularity and Complementarity, Princeton University Press.
[51] Wahhaj, Z., 2010. "Social Norms and Individual Savings in the Context of Informal Insurance", Journal
of Economic Behavior and Organization, Vol. 76(3), December 2010, pp. 511-530
[52] Warren, C., 2005a. Mapping Common Futures: Customary Communities, NGOs and the State in
Indonesia’s Reform Era. Development and Change 36: 49-73.
[53] Warren, C., 2005b. ‘Community mapping, local planning and alternative land use strategies in Bali’
Danish Journal of Geography 105(1):29-41.
[54] Weber, M. 1905. The protestant Ethic and the Spirit of Capitalism, Routledge Classic, London, 2001.
[55] World Bank. 2004a. World Development Report. Making Services Work for the Poor. World Bank and
Oxford University Press.
[56] World Bank. 2004b. ’Indonesia averting an infrastructure crisis: a framework for policy and action’,
Washington DC
29

Tables
Table 1. Method of Selection of Community Leaders 1997-2007
1997 2007
Rural urban rural urban
Consensus 38 53 15 18
Voting 64 50 100 78
Oligarchy 18 89 5 96
Total 120 192 120 192

2
Table 2A. Adherence to Adat laws across Communities 1997-2007
1997 (% of total communities) 2007 (% of total communities)
Rural Urban Rural Urban
Adat laws are never broken 38.41 24.81 28.69 21.63
Adat laws are sometimes broken 40.58 51.13 35.25 23.56
Adat laws are frequently broken 1.45 3.76 9.84 20.67
Only a few understand Adat laws 19.57 19.55 26.23 34.13

3
Table 2B. Practice of Mutual Cooperation across Adat and Non-adat
Communities 1997-2007
1997
% of communities with mutual
cooperation groups
2007
% of communities with mutual
cooperation groups
ADAT=1 ADAT=0 T-stat ADAT=1 ADAT=0 T-stat
Rural 94.23 76.47 2.5350** 100 100 -
Urban 93.93 88.66 0.8691 100 0.9421 1.6339
1997
% of communities with coop groups
for community infrastructure
2007
% of communities with coop groups
for community infrastructure
ADAT=1 ADAT=0 T-stat ADAT=1 ADAT=0 T-stat
Rural 41.51 27.06 1.7684* 95.40 91.43 0.8492
Urban 18.18 13.53 0.6764 95.56 89.02 1.3235
*** p<0.01, ** p<0.05, * p<0.1
Note: Mutual cooperation groups may exist for the purpose of worship, weddings, funerals,
maintaining community cleanliness or development of infrastructure.

4
Table 3. Inter-community Variation in Public Goods Provision
Variables adat
communities
non-adat
communities t-stat
Access to bus services 0.23 0.32 -2.2520**
Access to paved roads 0.84 0.92 -2.5689***
Public telephone office 0.50 0.67 -3.9604***
Access to a post office 0.16 0.29 -3.4384***
Government schools
per 100 people 1.85 1.41 1.9428**
Government health facilities
per 100 people 1.66 1.46 1.44
Share of public spending on
physical infrastructure 0.24 0.28 -1.0097
Share of public spending on
social infrastructure 0.12 0.11 1.5061

5
Table 4. Changes in Community Revenues and Public Spending 1997-2007
Variables 1997 2007
Mean (sd) Mean (sd)
Share of spending on
Social Infrastructure 0.1078 (0.1153) 0.1284 (0.1955)
Physical infrastructure 0.0658 (0.0839) 0.4992 (0.3691)
Share of revenues from
Central Government
District Headquarters
0.3291 (0.3119)
0.0911 (0.1877)
0.0663 (0.1745)
0.4066 (0.3479)
Local Funds 0.3786 (0.3781) 0.3925 (0.3256)
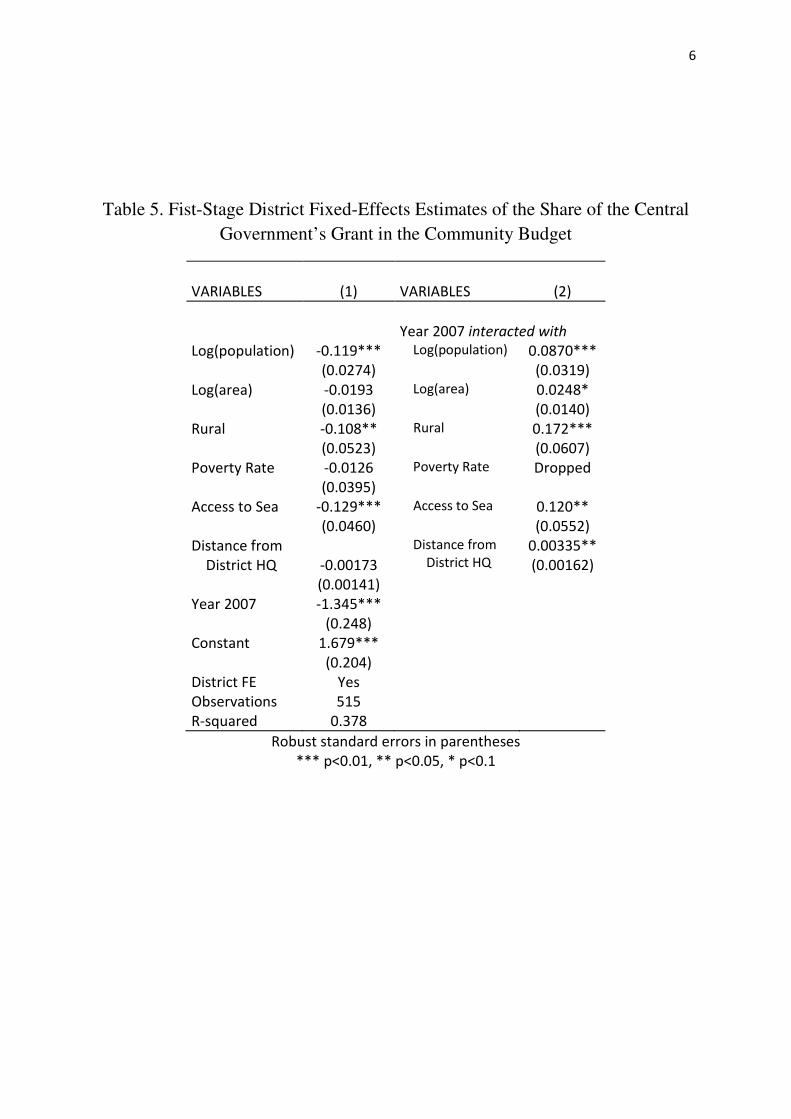
6
Table 5. Fist-Stage District Fixed-Effects Estimates of the Share of the Central
Government’s Grant in the Community Budget
VARIABLES (1) VARIABLES (2)
Year 2007 interacted with
Log(population) -0.119*** Log(population) 0.0870***
(0.0274) (0.0319)
Log(area) -0.0193 Log(area) 0.0248*
(0.0136) (0.0140)
Rural -0.108** Rural 0.172***
(0.0523) (0.0607)
Poverty Rate -0.0126 Poverty Rate Dropped
(0.0395)
Access to Sea -0.129*** Access to Sea 0.120**
(0.0460) (0.0552)
Distance from
District HQ
-0.00173
Distance from
District HQ
0.00335**
(0.00162)
(0.00141)
Year 2007 -1.345***
(0.248)
Constant 1.679***
(0.204)
District FE Yes
Observations 515
R-squared 0.378
Robust standard errors in parentheses
*** p<0.01, ** p<0.05, * p<0.1
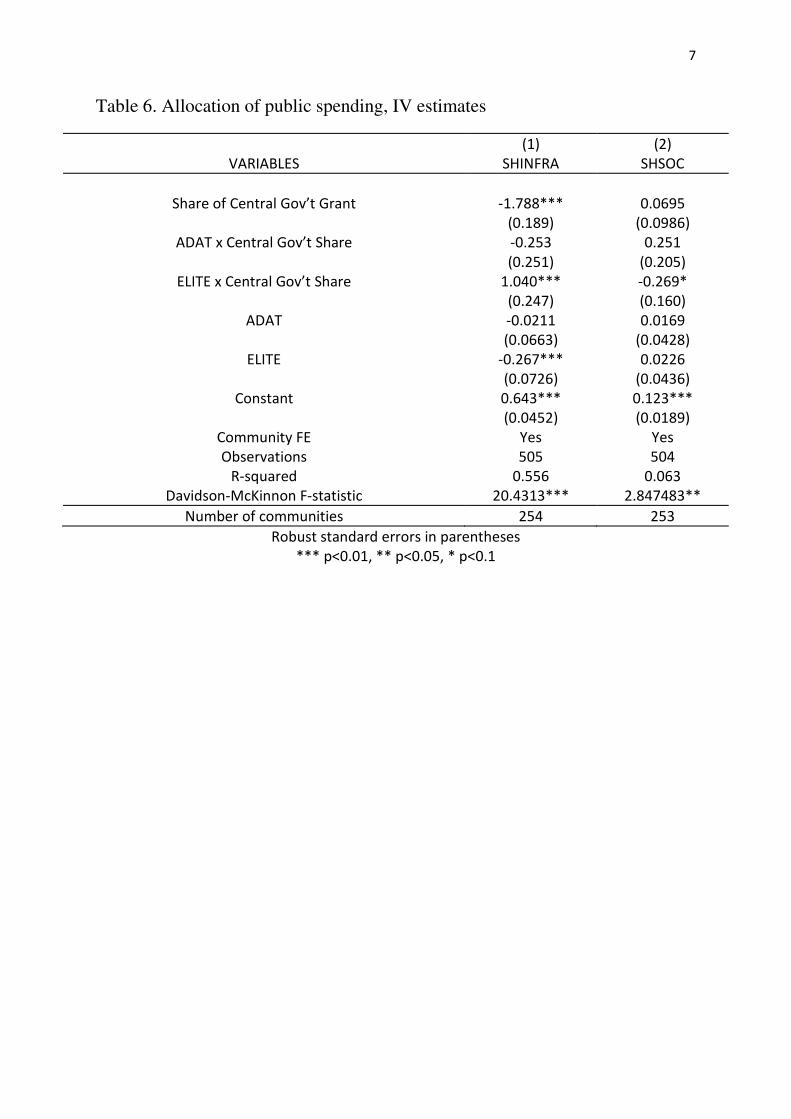
7
Table 6. Allocation of public spending, IV estimates
(1) (2)
VARIABLES SHINFRA SHSOC
Share of Central Gov’t Grant -1.788*** 0.0695
(0.189) (0.0986)
ADAT x Central Gov’t Share -0.253 0.251
(0.251) (0.205)
ELITE x Central Gov’t Share 1.040*** -0.269*
(0.247) (0.160)
ADAT -0.0211 0.0169
(0.0663) (0.0428)
ELITE -0.267*** 0.0226
(0.0726) (0.0436)
Constant 0.643*** 0.123***
(0.0452) (0.0189)
Community FE Yes Yes
Observations 505 504
R-squared 0.556 0.063
Davidson-McKinnon F-statistic 20.4313*** 2.847483**
Number of communities 254 253
Robust standard errors in parentheses
*** p<0.01, ** p<0.05, * p<0.1

8
Table 7. Access to public goods, IV Estimates
(1) (2) (3)
VARIABLES PCINFRA Gov’t Schools
per 100
Gov’t Health
Centres per 100
Share of Central Gov’t Grant -1.827*** 1.299** -1.630***
(0.298) (0.553) (0.508)
ADAT x Central Gov’t Share -0.172 0.837*** 0.796*
(0.479) (0.247) (0.405)
ELITE x Central Gov’t Share 1.798*** -1.400** -0.450
(0.402) (0.670) (0.662)
ADAT 0.000132 -0.0748 -0.159
(0.133) (0.155) (0.163)
ELITE -0.508*** 0.250 -0.0934
(0.107) (0.167) (0.261)
Community FE Yes Yes Yes
Observations 616 616 610
R-squared 0.185 0.048 0.090
Davidson-McKinnon F-stat 23.2028*** 3.265839*** 31.20235***
Number of communities 311 311 311
Robust standard errors in parentheses
*** p<0.01, ** p<0.05, * p<0.1

9
Appendix
Table A1. Uninstrumented estimates of public goods provision all communities
(1) (2) (3) (4) (5)
VARIABLES SHINFRA SHSOC PCINFRA Schools per 100 Health Centres per 100
ADAT -0.0177 0.0264 -0.0374 0.0781 0.0923
(0.0731) (0.0323) (0.142) (0.127) (0.157)
ELITE -0.308*** 0.00498 -0.267** 0.349** -0.0497
(0.0983) (0.0420) (0.120) (0.161) (0.194)
Share of Central Gov’t Grant -1.506*** 0.141** -0.515** 0.679 -0.718*
(0.165) (0.0546) (0.241) (0.498) (0.380)
ADAT x Central Gov’t Share 0.192 -0.276** -0.306 -0.281 -0.142
(0.420) (0.130) (0.378) (0.598) (0.536)
ELITE x Central Gov’t Share 1.325*** -0.151 0.473 -0.526 0.0707
(0.228) (0.0951) (0.337) (0.561) (0.459)
Constant 0.561*** 0.109*** 0.200*** 1.266*** 1.658***
(0.0392) (0.0136) (0.0615) (0.0974) (0.0831)
Community FE Yes Yes Yes Yes Yes
Observations 500 498 610 610 608
R-squared 0.399 0.29 0.050 0.035 0.066
Number of communities 250 249 305 305 304
Robust standard errors in parentheses
*** p<0.01, ** p<0.05, * p<0.1

10
Table A2. FE-IV estimates of public goods provision in communities with
stable local polity
(1) (2) (3) (4) (5)
VARIABLES SHINFRA SHSOC PCINFRA1 Schools per 100 Health Centres per 100
Share of Central Gov’t Grant -1.549*** -0.0593 -1.384*** 1.314*** -1.226***
(0.178) (0.0853) (0.290) (0.481) (0.395)
ADAT x Central Gov’t Share 0.187 -0.193 -0.739 0.00408 -0.236
(0.298) (0.227) (0.565) (1.136) (1.073)
ELITE x Central Gov’t Share 1.143*** -0.239* 1.188*** -1.167* -0.986
(0.288) (0.141) (0.445) (0.620) (0.746)
ADAT -0.000990 0.0283 0.0156 0.0196 -0.0906
(0.0718) (0.0455) (0.148) (0.159) (0.177)
ELITE Dropped Dropped Dropped Dropped Dropped
Constant 0.537*** 0.138*** 0.161*** 1.323*** 1.813***
(0.0366) (0.0171) (0.0567) (0.0805) (0.0663)
Community FE Yes Yes Yes Yes Yes
Observations 299 299 442 442 437
R-squared 0.508 0.046 0.172 0.072 0.127
Number of communities 187 187 222 222 222
Robust standard errors in parentheses
*** p<0.01, ** p<0.05, * p<0.1
Note that the ELITE variable is dropped in the panel FE model, as there is no change in local
polity in this case.
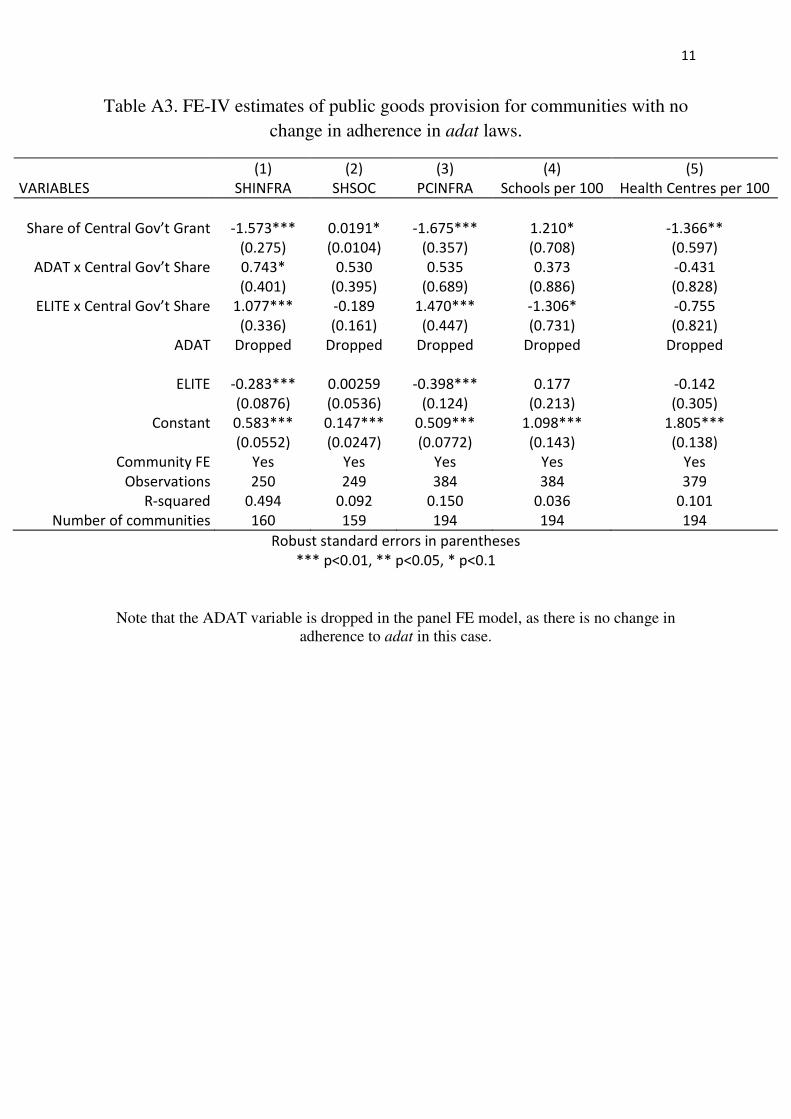
11
Table A3. FE-IV estimates of public goods provision for communities with no
change in adherence in adat laws.
(1) (2) (3) (4) (5)
VARIABLES SHINFRA SHSOC PCINFRA Schools per 100 Health Centres per 100
Share of Central Gov’t Grant -1.573*** 0.0191* -1.675*** 1.210* -1.366**
(0.275) (0.0104) (0.357) (0.708) (0.597)
ADAT x Central Gov’t Share 0.743* 0.530 0.535 0.373 -0.431
(0.401) (0.395) (0.689) (0.886) (0.828)
ELITE x Central Gov’t Share 1.077*** -0.189 1.470*** -1.306* -0.755
(0.336) (0.161) (0.447) (0.731) (0.821)
ADAT Dropped Dropped Dropped Dropped Dropped
ELITE -0.283*** 0.00259 -0.398*** 0.177 -0.142
(0.0876) (0.0536) (0.124) (0.213) (0.305)
Constant 0.583*** 0.147*** 0.509*** 1.098*** 1.805***
(0.0552) (0.0247) (0.0772) (0.143) (0.138)
Community FE Yes Yes Yes Yes Yes
Observations 250 249 384 384 379
R-squared 0.494 0.092 0.150 0.036 0.101
Number of communities 160 159 194 194 194
Robust standard errors in parentheses
*** p<0.01, ** p<0.05, * p<0.1
Note that the ADAT variable is dropped in the panel FE model, as there is no change in
adherence to adat in this case.

12
Table A4. First stage District Fixed-Effects estimates of
the Share of the Central Government’s Grant in Communities with Stable Polity
and no change in adherence to adat Laws
(1) (2)
VARIABLES stable polity stable adat
Ln(Population) -0.147*** -0.121***
(0.0286) (0.0318)
Ln(Size) 0.00427 -0.0451***
(0.0185) (0.0156)
Rural -0.144* -0.104*
(0.0796) (0.0592)
Islam -0.00876 0.0332
(0.0767) (0.0833)
Poverty Rate -0.0236 0.0143
(0.0518) (0.0509)
Access to Sea -0.0682 -0.118*
(0.0447) (0.0695)
Distance to District HQ -0.00174 0.000469
(0.00117) (0.00315)
Year 2007 -1.398*** -1.543***
(0.315) (0.315)
Year 2007 interacted with
Ln(Population) 0.104*** 0.0764**
(0.0373) (0.0365)
Ln(Size) 0.00495 0.0622***
(0.0189) (0.0214)
Rural 0.223** 0.144**
(0.103) (0.0692)
Distance to District HQ 0.00299** 0.00189
(0.00141) (0.00491)
Sea 0.0820 0.107
(0.0575) (0.0673)
Islam 0.0517 0.112
(0.0878) (0.0743)
Constant 1.803*** 1.729***
(0.272) (0.298)
District FE Yes Yes
Observations 376 370
R-squared 0.387 0.431
Robust standard errors in parentheses
*** p<0.01, ** p<0.05, * p<0.1