fiscal development - financefinance.gov.pk/survey/chapters_15/04_fiscal development.pdf ·...
TRANSCRIPT

Chapter 4
Significance of sound fiscal policies and prudent
expenditure management has become an
important part of the policy debate in the fallout
of the global financial crisis. The prudent
expenditure management not only accommodates
shortfall in revenues, creates buffers but also
help in easing pressures on public finances.
Managing fiscal deficit in Pakistan has always
remained a daunting task together with
unexpected high government expenditures. Due
to unfavorable climatic behavior, along with
security situation posed serious threats to fiscal
sustainability efforts. Consequently, the economy
marked growth at 3.9 percent on average over the
past five years.
When the present government came into power
in mid-June 2013, it particularly focused to
balance the external account, contract the fiscal
imbalance, contain the inflationary pressure,
revive the economy through short term policy
measures by resolving all structural issues.
Government’s efforts started to reap the benefits
as evidenced from initial gains in
macroeconomic recovery. During fiscal year
2013-14, all major indicators showed significant
improvement, real GDP grew at 4.03 percent,
average CPI inflation remained in single digit,
fiscal deficit contained at 5.5 percent and foreign
exchange reserves improved significantly. More
importantly, fiscal year 2013-14 witnessed
considerable decline in government borrowing
for budgetary purpose from the banking system
which was the evidence of improved fiscal
accounts. Better economic performance in the
midst of difficult domestic environment on
account of security and energy related issues can
be credited to commendable efforts of
government through better monetary and fiscal
policies coordination.
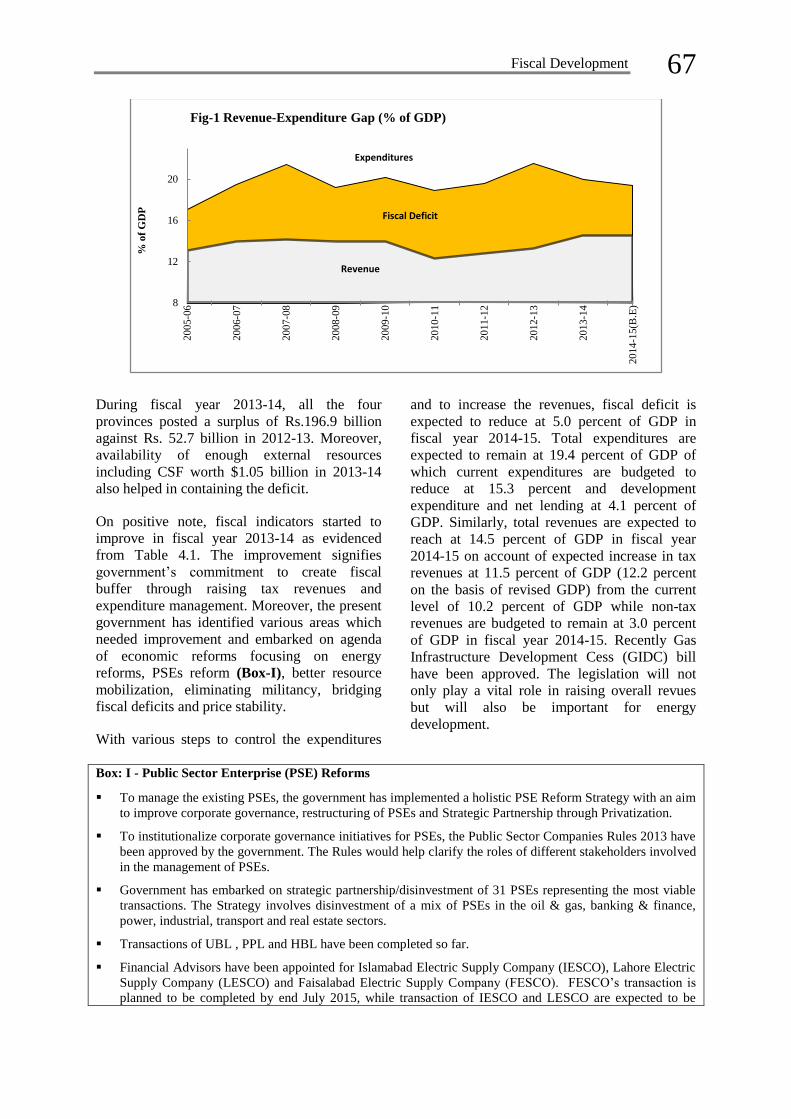
High fiscal deficit since 2009-10, was reduced to
5.5 percent of GDP in 2013-14 if to compare
with 8.2 percent of GDP in 2012-13. The deficit
was effectively brought down through prudent
expenditure management strategy as total
expenditures reduced from 21.5 percent of GDP
in fiscal year 2012-13 to 20.0 percent of GDP in
2013-14. While total revenues increased to 14.5
percent of GDP in fiscal year 2013-14 from 13.3
percent during 2012-13.Similarly, FBR tax
collection posted a growth of 15.8 percent during
fiscal year 2013-14 and stood at 9.0 percent of
GDP against 8.7 percent of GDP in preceding
year.
With the onset of the current fiscal year, the
economy faced some headwinds due to political
unrest followed by security related operations,
legal challenges to privatization, taxation and
energy sector reforms. In spite of all these
challenges economy showed resilience on
account of government’s efforts to contain
expenditures through expenditure management
strategy and revenue building measures.
Furthermore, decline in international oil prices
also helped in reducing the pressures on external
and fiscal sector.
During July-March 2014-15, fiscal deficit was
contained at 3.8* percent against 3.9* percent in
the same period of fiscal year 2013-14. Similarly,
total expenditures reduced to 13.6 percent of
GDP against 13.7 percent of GDP during the
period under review. Following the fiscal
discipline in the last three quarters, overall fiscal
deficit is expected to remain at 5.0 percent of
GDP for the entire fiscal year 2014-15.This
shows that consolidation efforts of present
government are focused on containing
expenditure along with broadening the tax base,
improving tax collection and strengthening tax
administration.
*On the basis of revised GDP
Fiscal Development
66 Pakistan Economic Survey 2014-15
Fiscal Policy Development
Fiscal policy as an important part of economic
framework can play an important role in
influencing the economic direction of the country
as it can bolster economic growth and human
development through efficient utilization of
resources and prudent expenditure management.
Over the years, Pakistan has faced formidable
challenges on fiscal front due to inefficient
utilization of resources and ineffective
expenditure management strategy in the wake of
less efficient tax system and unplanned
expenditures.
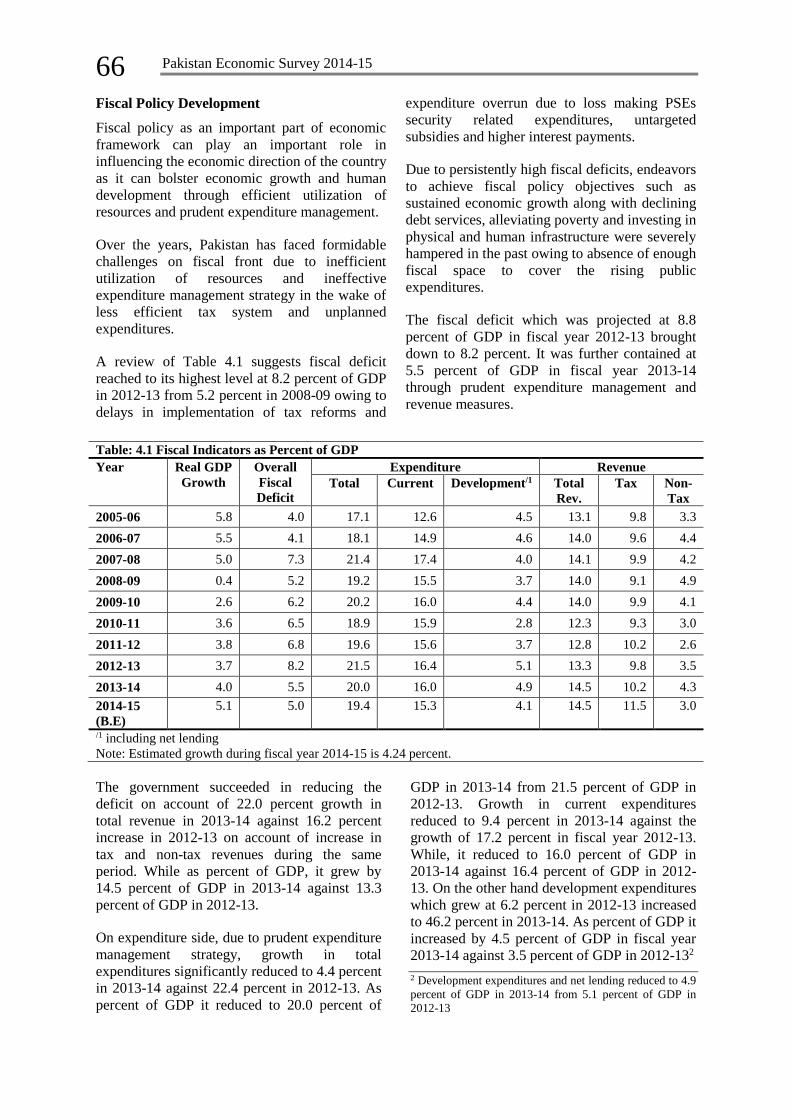
A review of Table 4.1 suggests fiscal deficit
reached to its highest level at 8.2 percent of GDP
in 2012-13 from 5.2 percent in 2008-09 owing to
delays in implementation of tax reforms and
expenditure overrun due to loss making PSEs
security related expenditures, untargeted
subsidies and higher interest payments.
Due to persistently high fiscal deficits, endeavors
to achieve fiscal policy objectives such as
sustained economic growth along with declining
debt services, alleviating poverty and investing in
physical and human infrastructure were severely
hampered in the past owing to absence of enough
fiscal space to cover the rising public
expenditures.
The fiscal deficit which was projected at 8.8
percent of GDP in fiscal year 2012-13 brought
down to 8.2 percent. It was further contained at
5.5 percent of GDP in fiscal year 2013-14
through prudent expenditure management and
revenue measures.
Table: 4.1 Fiscal Indicators as Percent of GDP
Year Real GDP
Growth
Overall
Fiscal
Deficit
Expenditure Revenue
Total Current Development/1 Total
Rev.
Tax Non-
Tax
2005-06 5.8 4.0 17.1 12.6 4.5 13.1 9.8 3.3
2006-07 5.5 4.1 18.1 14.9 4.6 14.0 9.6 4.4
2007-08 5.0 7.3 21.4 17.4 4.0 14.1 9.9 4.2
2008-09 0.4 5.2 19.2 15.5 3.7 14.0 9.1 4.9
2009-10 2.6 6.2 20.2 16.0 4.4 14.0 9.9 4.1
2010-11 3.6 6.5 18.9 15.9 2.8 12.3 9.3 3.0
2011-12 3.8 6.8 19.6 15.6 3.7 12.8 10.2 2.6
2012-13 3.7 8.2 21.5 16.4 5.1 13.3 9.8 3.5
2013-14 4.0 5.5 20.0 16.0 4.9 14.5 10.2 4.3
2014-15
(B.E)
5.1 5.0 19.4 15.3 4.1 14.5 11.5 3.0
/1 including net lending
Note: Estimated growth during fiscal year 2014-15 is 4.24 percent.
The government succeeded in reducing the
deficit on account of 22.0 percent growth in
total revenue in 2013-14 against 16.2 percent
increase in 2012-13 on account of increase in
tax and non-tax revenues during the same
period. While as percent of GDP, it grew by
14.5 percent of GDP in 2013-14 against 13.3
percent of GDP in 2012-13.
On expenditure side, due to prudent expenditure
management strategy, growth in total
expenditures significantly reduced to 4.4 percent
in 2013-14 against 22.4 percent in 2012-13. As
percent of GDP it reduced to 20.0 percent of
GDP in 2013-14 from 21.5 percent of GDP in
2012-13. Growth in current expenditures
reduced to 9.4 percent in 2013-14 against the
growth of 17.2 percent in fiscal year 2012-13.
While, it reduced to 16.0 percent of GDP in
2013-14 against 16.4 percent of GDP in 2012-
13. On the other hand development expenditures
which grew at 6.2 percent in 2012-13 increased
to 46.2 percent in 2013-14. As percent of GDP it
increased by 4.5 percent of GDP in fiscal year
2013-14 against 3.5 percent of GDP in 2012-132
2 Development expenditures and net lending reduced to 4.9
percent of GDP in 2013-14 from 5.1 percent of GDP in
2012-13
Fiscal Development
67
During fiscal year 2013-14, all the four
provinces posted a surplus of Rs.196.9 billion
against Rs. 52.7 billion in 2012-13. Moreover,
availability of enough external resources
including CSF worth $1.05 billion in 2013-14
also helped in containing the deficit.
On positive note, fiscal indicators started to
improve in fiscal year 2013-14 as evidenced
from Table 4.1. The improvement signifies
government’s commitment to create fiscal
buffer through raising tax revenues and
expenditure management. Moreover, the present
government has identified various areas which
needed improvement and embarked on agenda
of economic reforms focusing on energy
reforms, PSEs reform (Box-I), better resource
mobilization, eliminating militancy, bridging
fiscal deficits and price stability.
With various steps to control the expenditures
and to increase the revenues, fiscal deficit is
expected to reduce at 5.0 percent of GDP in
fiscal year 2014-15. Total expenditures are
expected to remain at 19.4 percent of GDP of
which current expenditures are budgeted to
reduce at 15.3 percent and development
expenditure and net lending at 4.1 percent of
GDP. Similarly, total revenues are expected to
reach at 14.5 percent of GDP in fiscal year
2014-15 on account of expected increase in tax
revenues at 11.5 percent of GDP (12.2 percent
on the basis of revised GDP) from the current
level of 10.2 percent of GDP while non-tax
revenues are budgeted to remain at 3.0 percent
of GDP in fiscal year 2014-15. Recently Gas
Infrastructure Development Cess (GIDC) bill
have been approved. The legislation will not
only play a vital role in raising overall revues
but will also be important for energy
development.
Box: I - Public Sector Enterprise (PSE) Reforms
To manage the existing PSEs, the government has implemented a holistic PSE Reform Strategy with an aim
to improve corporate governance, restructuring of PSEs and Strategic Partnership through Privatization.
To institutionalize corporate governance initiatives for PSEs, the Public Sector Companies Rules 2013 have
been approved by the government. The Rules would help clarify the roles of different stakeholders involved
in the management of PSEs.
Government has embarked on strategic partnership/disinvestment of 31 PSEs representing the most viable
transactions. The Strategy involves disinvestment of a mix of PSEs in the oil & gas, banking & finance,
power, industrial, transport and real estate sectors.
Transactions of UBL , PPL and HBL have been completed so far.
Financial Advisors have been appointed for Islamabad Electric Supply Company (IESCO), Lahore Electric
Supply Company (LESCO) and Faisalabad Electric Supply Company (FESCO). FESCO’s transaction is
planned to be completed by end July 2015, while transaction of IESCO and LESCO are expected to be
8
12
16
2020
05-0
6
20
06-0
7
20
07-0
8
20
08-0
9
20
09-1
0
20
10-1
1
20
11-1
2
20
12-1
3
20
13-1
4
20
14-1
5(B
.E)
% o
f G
DP
Fig-1 Revenue-Expenditure Gap (% of GDP)
Fiscal Deficit
Expenditures
Revenue
68 Pakistan Economic Survey 2014-15
completed by end December, 2015.
Financial advisors have been appointed for Pakistan International Airlines (PIA) to seek potential options
for restructuring and strategic private sector participation in the core airline business by end December,
2015.
The Board of Pakistan Steel Mills (PSM) has approved a comprehensive restructuring plan to prepare for
potential strategic private sector participation in the company.
In this regard appointment of financial advisors, which was advertised in January 2015, was disqualified
during the evaluation process. It has been re-advertised on February 15, 2015 and the appointment of
financial advisors is expected to be completed soon so that the due diligence process can be initiated.
A comprehensive Railway restructuring plan has been finalized, which envisages improvements in
governance and internal business processes, service delivery, financial management and investment
planning.
The roadmap revolves around short, medium and long term reform measures in the above five areas to
facilitate achievement of optimum results.
Power Sector Reforms
National Power Policy 2013-18 focuses on improved governance structure, supportive legal framework,
financial stability, supply demand side management and promoting private sector participation in the sector.
In an effort to move to full cost recovery, the current government has rationalized tariffs.
The differential, between the NEPRA determined tariff (NDT) and proposed tariff for fiscal year 2013-14
has decreased substantially and subsidies are being targeted to vulnerable consumers in the residential and
agriculture categories.
Mechanisms are under consideration to cap the overdue payments to a minimum sustainable level.
Mechanism of at source deduction of public sector overdue payables is being implemented and a feeder to
feeder monitoring to curtail losses is being pursued. New Electricity Act will help improve litigation
mechanism for power sector receivables.
Revenue based load management is being carried out in order to ensure smooth recovery of payables. An
effort is underway to incorporate all costs to reflect in the tariff structure to arrest buildup circular debt.
Operationalization of Central Power Purchase Authority (CPPA) as an effective financial manager of the
system is a significant step in this regard.
To increase transparency in the system, monthly amount due and payment by the DISCOs to CPPA and by
CPPA to the generators will be made available on the website of CPPA.
Efforts are underway to improve power sector fuel mix in the country to reduce the price of power basket
and improve financial viability. Under the reforms, large capacity addition is planned from wind, solar,
nuclear, hydel and coal power projects in the medium term.
Three hydel plants Tarbela 4th extension, Chashma, Neelum Jehlum and few other small dams are expected
to provide additional generation within next three years.
IPPs and GENCOs are also being encouraged to convert from oil to coal based power generation.
Development of supportive infrastructure to import 1000MW under CASA is also included in the plan.
Power sector has been given priority in terms of allocation of gas for power generation.
All these efforts will improve the energy mix whereby reducing dependence on oil for power generation
and ensure reasonable tariffs for consumers ultimately leading for financial sustainability.
Structure of Tax Revenues
Taxes are the most important source of public
revenues and fundamental to strengthen the
successful functioning of the government. In
this regard strengthening resource
mobilization is imperative for designing an
Fiscal Development
69
efficient tax system which can promote
inclusive growth, encourages good
governance, ensures the delivery of public
services and promotes social justice.
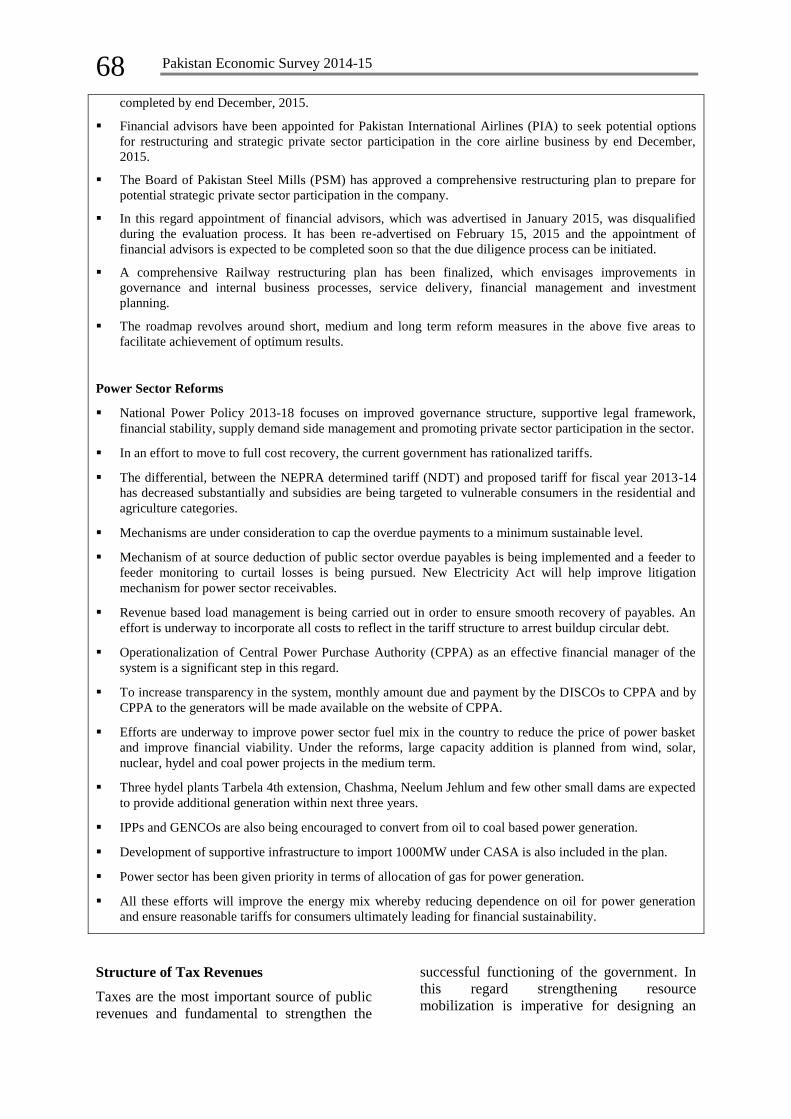
Inefficient tax system in developing countries
has long been a major concern. Pakistan has also
witnessed numerous tax policy challenges to
establish efficient tax system. Resultantly
narrow tax base lead not only lower tax to GDP
ratio but also posed serious threats to fiscal
sustainability. Despite the increase in tax
revenues in absolute term, FBR tax to GDP ratio
varied between 8.5 to 9.7 percent during the past
10 years.
However to achieve the fiscal sustainability
present Government is stringently focusing on
wide-ranging resource mobilization strategy
with an aim to increase the tax to GDP ratio to
15 percent in next few years (Box-II).
Table 4.2: Structure of Federal Tax Revenue (Rs. Billion)
Year Total
(FBR)
Tax Rev as % of
GDP
Direct
Taxes
Indirect Taxes
Customs Sales Excise Total
2005-06 713.5 9.4 225.0 138.4 294.8 55.3 488.5
[31.5] {28.3} {60.3} {11.3} [68.5]
2006-07 847.2 9.2 333.7 132.3 309.4 71.8 513.5
[39.4] {25.8} {60.3} {14.0} [60.6]
2007-08 1,008.1 9.5 387.9 150.7 377.4 92.1 620.2
[38.5] {24.3} {60.9} {14.9} [61.5]
2008-09 1,161.1 8.8 443.5 148.4 451.7 117.5 717.6
[38.2] {20.7} {62.9} {16.4} [61.8]
2009-10 1,327.4 8.9 526.0 160.3 516.3 124.8 801.4
[39.6] {20.0} {64.4} {15.6} [60.4]
2010-11 1,558.2 8.5 602.5 184.9 633.4 137.4 955.7
[38.7] {19.3} {66.3} {14.4} [61.3]
2011-12 1,882.7 9.4 738.4 216.9 804.9 122.5 1,144.3
[39.2] {19.0} {70.3} {10.7} [60.8]
2012-13 1,946.4 8.7 743.4 239.5 842.5 121.0 1,203.0
[38.2] {19.9} {70.0} {10.1} [61.8]
7.0
8.0
9.0
10.0
0.0
1,000.0
2,000.0
3,000.0
20
05-0
6
20
06-0
7
20
07-0
8
20
08-0
9
20
09-1
0
20
10-1
1
20
11-1
2
20
12-1
3
20
13-1
4
20
14-1
5B
.E
Rs.
bil
lio
n
Fig-2: FBR Tax Revenue Tax Rev as % of GDP Total (FBR)
70 Pakistan Economic Survey 2014-15
Table 4.2: Structure of Federal Tax Revenue (Rs. Billion)
Year Total
(FBR)
Tax Rev as % of
GDP
Direct
Taxes
Indirect Taxes
Customs Sales Excise Total
2013-14 2,254.5 9.0 877.3 242.8 996.4 138.1 1,377.3
[39.0] {17.6} {72.3} {10.0} [61.1]
2014-15
B.E
2,810.0* 9.7 1,180.0 281.0 1,171.0 178.0 1,630.0
[42.0] {17.2} {71.8} {10.9} [58.0]
Source: Source: Federal Board of Revenue
{} as % of indirect taxes. [ ]as % of total taxes
*: Target revised downward at Rs.2605 on account of losses incurred due to decline in International Oil and
Commodity Prices.
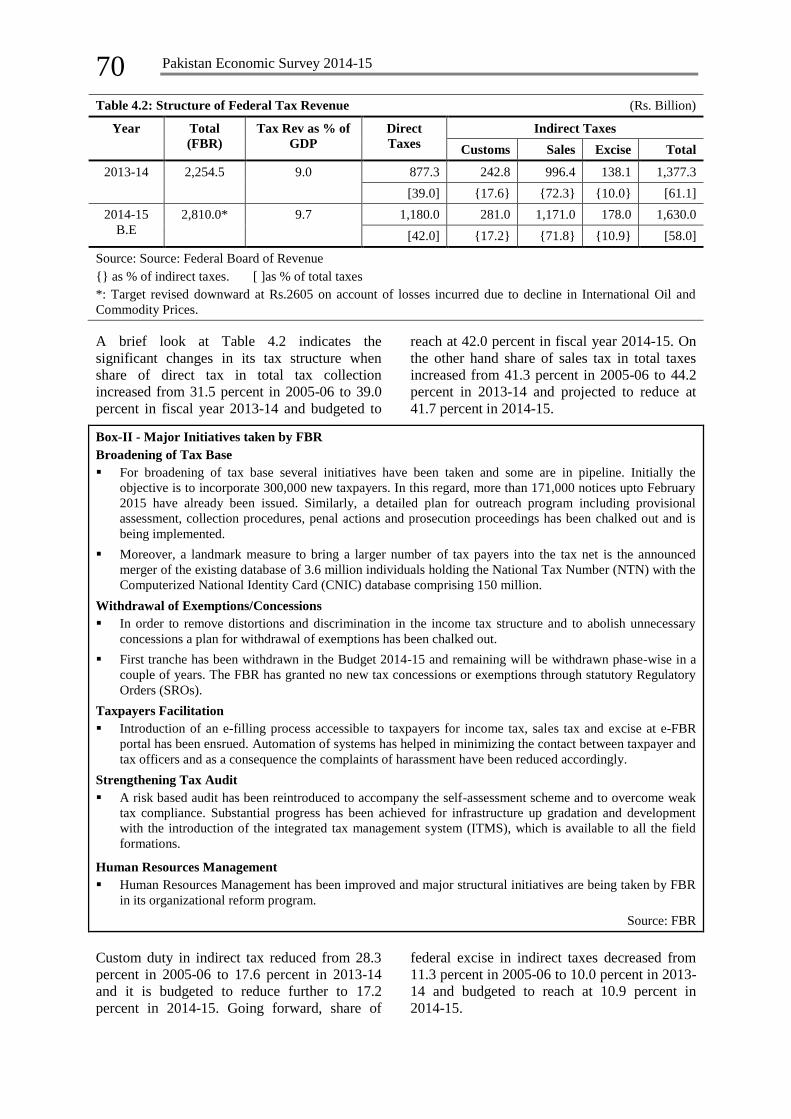
A brief look at Table 4.2 indicates the
significant changes in its tax structure when
share of direct tax in total tax collection
increased from 31.5 percent in 2005-06 to 39.0
percent in fiscal year 2013-14 and budgeted to
reach at 42.0 percent in fiscal year 2014-15. On
the other hand share of sales tax in total taxes
increased from 41.3 percent in 2005-06 to 44.2
percent in 2013-14 and projected to reduce at
41.7 percent in 2014-15.
Box-II - Major Initiatives taken by FBR
Broadening of Tax Base
For broadening of tax base several initiatives have been taken and some are in pipeline. Initially the
objective is to incorporate 300,000 new taxpayers. In this regard, more than 171,000 notices upto February
2015 have already been issued. Similarly, a detailed plan for outreach program including provisional
assessment, collection procedures, penal actions and prosecution proceedings has been chalked out and is
being implemented.
Moreover, a landmark measure to bring a larger number of tax payers into the tax net is the announced
merger of the existing database of 3.6 million individuals holding the National Tax Number (NTN) with the
Computerized National Identity Card (CNIC) database comprising 150 million.
Withdrawal of Exemptions/Concessions
In order to remove distortions and discrimination in the income tax structure and to abolish unnecessary
concessions a plan for withdrawal of exemptions has been chalked out.
First tranche has been withdrawn in the Budget 2014-15 and remaining will be withdrawn phase-wise in a
couple of years. The FBR has granted no new tax concessions or exemptions through statutory Regulatory
Orders (SROs).
Taxpayers Facilitation
Introduction of an e-filling process accessible to taxpayers for income tax, sales tax and excise at e-FBR
portal has been ensrued. Automation of systems has helped in minimizing the contact between taxpayer and
tax officers and as a consequence the complaints of harassment have been reduced accordingly.
Strengthening Tax Audit
A risk based audit has been reintroduced to accompany the self-assessment scheme and to overcome weak
tax compliance. Substantial progress has been achieved for infrastructure up gradation and development
with the introduction of the integrated tax management system (ITMS), which is available to all the field
formations.
Human Resources Management
Human Resources Management has been improved and major structural initiatives are being taken by FBR
in its organizational reform program.
Source: FBR
Custom duty in indirect tax reduced from 28.3
percent in 2005-06 to 17.6 percent in 2013-14
and it is budgeted to reduce further to 17.2
percent in 2014-15. Going forward, share of
federal excise in indirect taxes decreased from
11.3 percent in 2005-06 to 10.0 percent in 2013-
14 and budgeted to reach at 10.9 percent in
2014-15.
Fiscal Development
71
Review of Public Expenditures
Public expenditure management is important for
any government to have control over its
expenditures particularly when revenue receipts
are not enough to cover its development
projects. It is therefore imperative to create
harmony between revenue receipts and
expenditures to help the governments to evade
high deficits.
In Pakistan considerably high expenditures on
account of unplanned expenditures incurred due
to floods, security related issues, high interest
payment, untargeted subsidies particularly to
loss making PSEs, energy subsidies, non-
development projects and less than expected tax
collection has dominated the scene of fiscal
management. Consequently, fiscal deficit rose
by 6.6 percent on average during the past five
years.
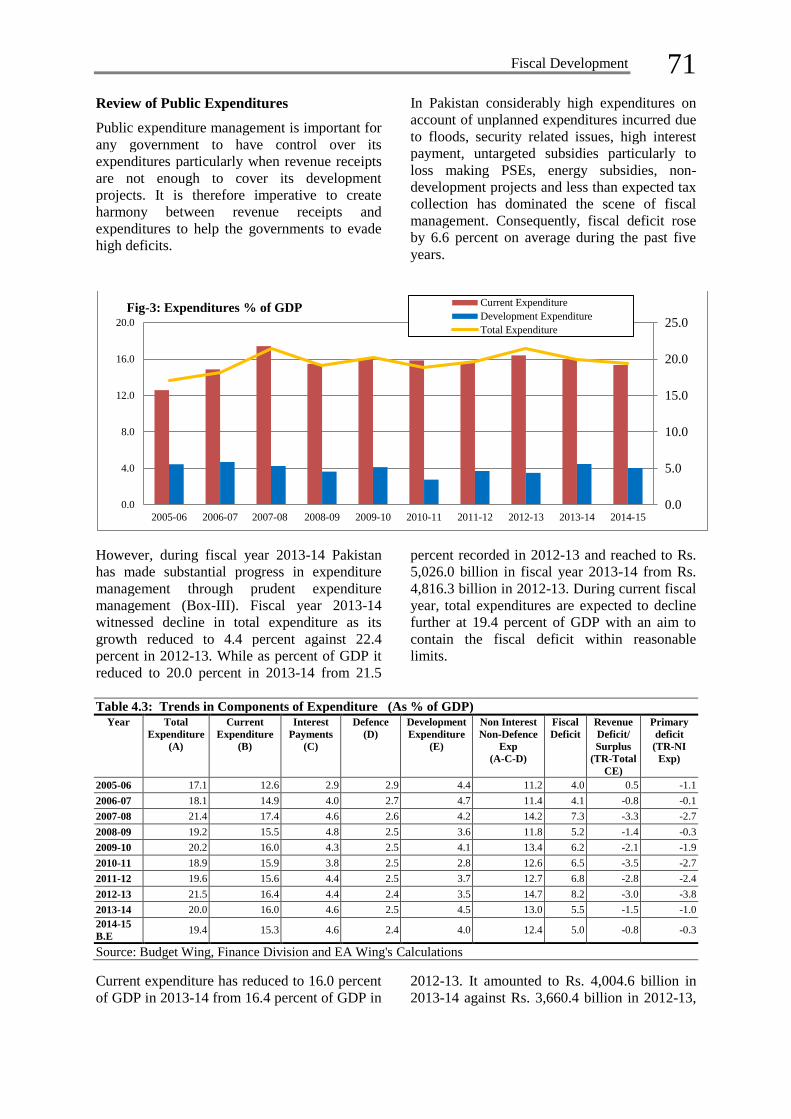
However, during fiscal year 2013-14 Pakistan
has made substantial progress in expenditure
management through prudent expenditure
management (Box-III). Fiscal year 2013-14
witnessed decline in total expenditure as its
growth reduced to 4.4 percent against 22.4
percent in 2012-13. While as percent of GDP it
reduced to 20.0 percent in 2013-14 from 21.5
percent recorded in 2012-13 and reached to Rs.
5,026.0 billion in fiscal year 2013-14 from Rs.
4,816.3 billion in 2012-13. During current fiscal
year, total expenditures are expected to decline
further at 19.4 percent of GDP with an aim to
contain the fiscal deficit within reasonable
limits.
Table 4.3: Trends in Components of Expenditure (As % of GDP)
Year Total
Expenditure
(A)
Current
Expenditure
(B)
Interest
Payments
(C)
Defence
(D)
Development
Expenditure
(E)
Non Interest
Non-Defence
Exp
(A-C-D)
Fiscal
Deficit
Revenue
Deficit/
Surplus
(TR-Total
CE)
Primary
deficit
(TR-NI
Exp)
2005-06 17.1 12.6 2.9 2.9 4.4 11.2 4.0 0.5 -1.1
2006-07 18.1 14.9 4.0 2.7 4.7 11.4 4.1 -0.8 -0.1
2007-08 21.4 17.4 4.6 2.6 4.2 14.2 7.3 -3.3 -2.7
2008-09 19.2 15.5 4.8 2.5 3.6 11.8 5.2 -1.4 -0.3
2009-10 20.2 16.0 4.3 2.5 4.1 13.4 6.2 -2.1 -1.9
2010-11 18.9 15.9 3.8 2.5 2.8 12.6 6.5 -3.5 -2.7
2011-12 19.6 15.6 4.4 2.5 3.7 12.7 6.8 -2.8 -2.4
2012-13 21.5 16.4 4.4 2.4 3.5 14.7 8.2 -3.0 -3.8
2013-14 20.0 16.0 4.6 2.5 4.5 13.0 5.5 -1.5 -1.0
2014-15
B.E 19.4 15.3 4.6 2.4 4.0 12.4 5.0 -0.8 -0.3
Source: Budget Wing, Finance Division and EA Wing's Calculations
Current expenditure has reduced to 16.0 percent
of GDP in 2013-14 from 16.4 percent of GDP in
2012-13. It amounted to Rs. 4,004.6 billion in
2013-14 against Rs. 3,660.4 billion in 2012-13,
0.0
5.0
10.0
15.0
20.0
25.0
0.0
4.0
8.0
12.0
16.0
20.0
2005-06 2006-07 2007-08 2008-09 2009-10 2010-11 2011-12 2012-13 2013-14 2014-15
Fig-3: Expenditures % of GDPCurrent Expenditure
Development Expenditure
Total Expenditure
72 Pakistan Economic Survey 2014-15
thus posted a growth of 9.4 percent against the
growth of 17.2 percent in preceding year. In
fiscal year 2014-15, it is expected to reduce
further at 15.3 percent of GDP.
Notwithstanding high growth in interest
payments and defense expenditure, reduced
growth in current expenditure during fiscal year
2013-14 was achievable due to decline in
subsidies. In fiscal year 2013-14, subsidies
registered a significant decline and stood at Rs.
305.7 billion against Rs. 358.0 billion in the
same period of fiscal year 2012-13 on account
of increased power tariffs for all categories of
consumers, however subsidies are being
targeted to vulnerable consumers in the
residential and agriculture categories.
Interest payments increased from Rs.991.0
billion in 2012-13 to Rs.1,147.8 billion in 2013-
14. While as percent of GDP it increased to 4.6
percent in fiscal year 2013-14 against 4.4
percent in the comparable period of fiscal year
2012-13. By the end of current fiscal year it is
expected to reach at 4.6 percent of GDP.
Defense expenditures witnessed a slight increase
of 2.5 percent of GDP in fiscal year 2013-14
against 2.4 percent of GDP in 2012-13 and
reached to Rs.623.1billion against Rs. 540.6
billion in fiscal year 2012-13. During current
fiscal year, defense expenditures are expected to
remain at 2.4 percent of GDP slightly lower than
the level witnessed in fiscal year 2013-14.
Despite the fact that government is taking all
possible efforts to restrict the non development
expenditures to create a fiscal buffer for
development spendings, there are some
mandatory non development expenditures like
interest payments, defence and law and order
which cannot be avoided in any circumstances.
Therefore government is making its best efforts
to manage these expenditures within the
available fiscal space.
During fiscal year 2013-14, development
expenditures witnessed marked improvement as
it grew by 46.2 percent against the growth of 6.2
percent and reached to Rs. 1,135.9 billion in
2013-14 against Rs. 777.1 billion in 2012-13.
As percent of GDP it increased to 4.5 percent in
2013-14 from 3.5 percent of GDP in 2012-13.
Together with net lending it posted a growth of
8.5 percent to reach at Rs. 1,236.5 billion in
fiscal year 2013-14. Development expenditures
are expected to reach at Rs.1,172.8 billion in
fiscal year 2014-15.
Within development expenditure, Public Sector
Development Program (PSDP) increased
significantly both at federal as well as provincial
level. In absolute term, Federal PSDP increased
to Rs. 434.9 billion in 2013-14 against Rs.323.5
billion in 2012-13, thus posted a growth of 34.4
percent. On the other hand Provincial ADP
amounted to Rs. 430.5 billion in 2013-14
against Rs. 371.5 in 2012-13 thus witnessed a
growth of 15.9 percent. During fiscal year 2014-
15, Rs. 1,175 billion have been allocated in the
PSDP as compared to Rs.1,155billion in 2013-
14.
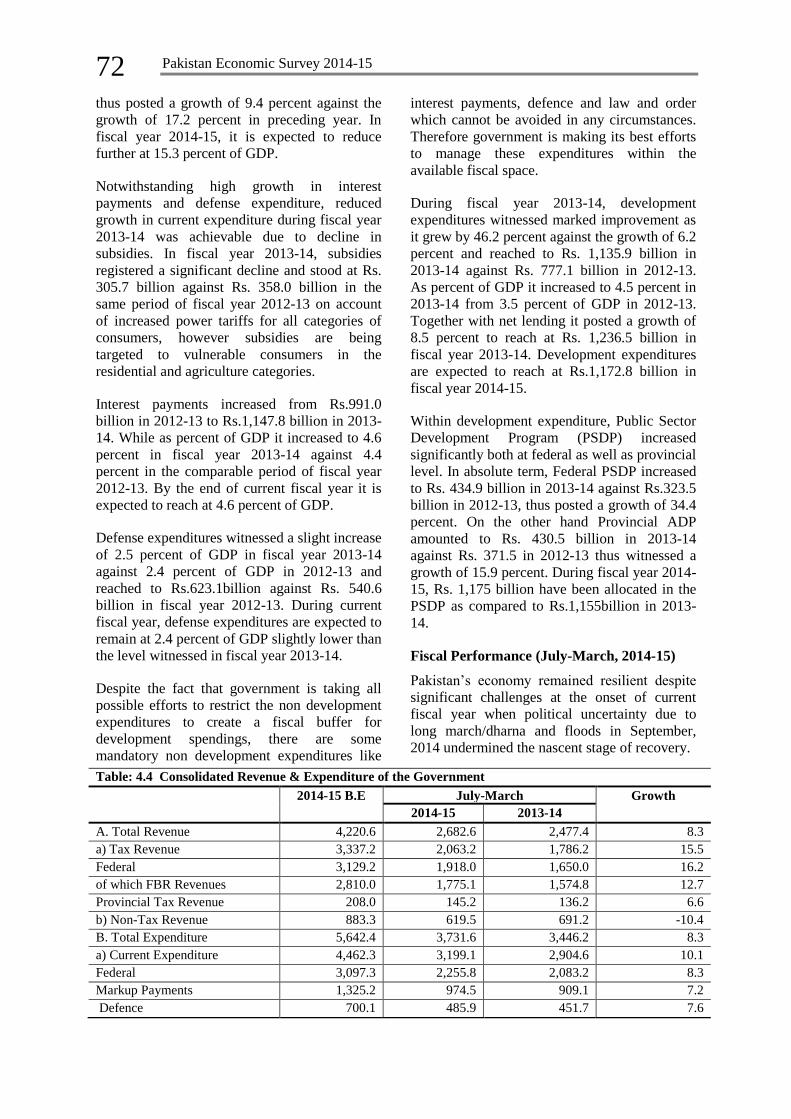
Fiscal Performance (July-March, 2014-15)
Pakistan’s economy remained resilient despite
significant challenges at the onset of current
fiscal year when political uncertainty due to
long march/dharna and floods in September,
2014 undermined the nascent stage of recovery.
Table: 4.4 Consolidated Revenue & Expenditure of the Government
2014-15 B.E July-March Growth
2014-15 2013-14
A. Total Revenue 4,220.6 2,682.6 2,477.4 8.3
a) Tax Revenue 3,337.2 2,063.2 1,786.2 15.5
Federal 3,129.2 1,918.0 1,650.0 16.2
of which FBR Revenues 2,810.0 1,775.1 1,574.8 12.7
Provincial Tax Revenue 208.0 145.2 136.2 6.6
b) Non-Tax Revenue 883.3 619.5 691.2 -10.4
B. Total Expenditure 5,642.4 3,731.6 3,446.2 8.3
a) Current Expenditure 4,462.3 3,199.1 2,904.6 10.1
Federal 3,097.3 2,255.8 2,083.2 8.3
Markup Payments 1,325.2 974.5 909.1 7.2
Defence 700.1 485.9 451.7 7.6
Fiscal Development
73
Table: 4.4 Consolidated Revenue & Expenditure of the Government
2014-15 B.E July-March Growth
2014-15 2013-14
Provincial 1,365.0 943.2 821.4 14.8
b) Development Expenditure &
net lending
1,180.1 594.0 555.8 6.9
c) Statistical discrepancy - -61.4 -14.1 -
C. Overall Fiscal Deficit 1,421.8 1,048.9 968.9 -
As % of GDP 5.0 3.8 3.9 -
Financing of Fiscal Deficit 1,421.8 1,048.9 968.9 8.3
i) External Sources 508.0 137.8 107.1 28.7
ii) Domestic 913.9 911.1 861.7 5.7
- Bank 227.9 469.4 436.9 7.4
- Non-Bank 686.0 426.5 424.8 0.4
GDP at Market Prices 29,078 27,384 25,068 9.2
Source: Budget Wing, Finance Division
Government’s concerted endeavors helped the
economy in coming back on track as key
macroeconomic indicators have improved
during ongoing fiscal year 2014-15.
Additionally, favorable decline in international
oil prices, private and financial sector
developments, improved social protection and
revenue mobilization further supported the
economic recovery.
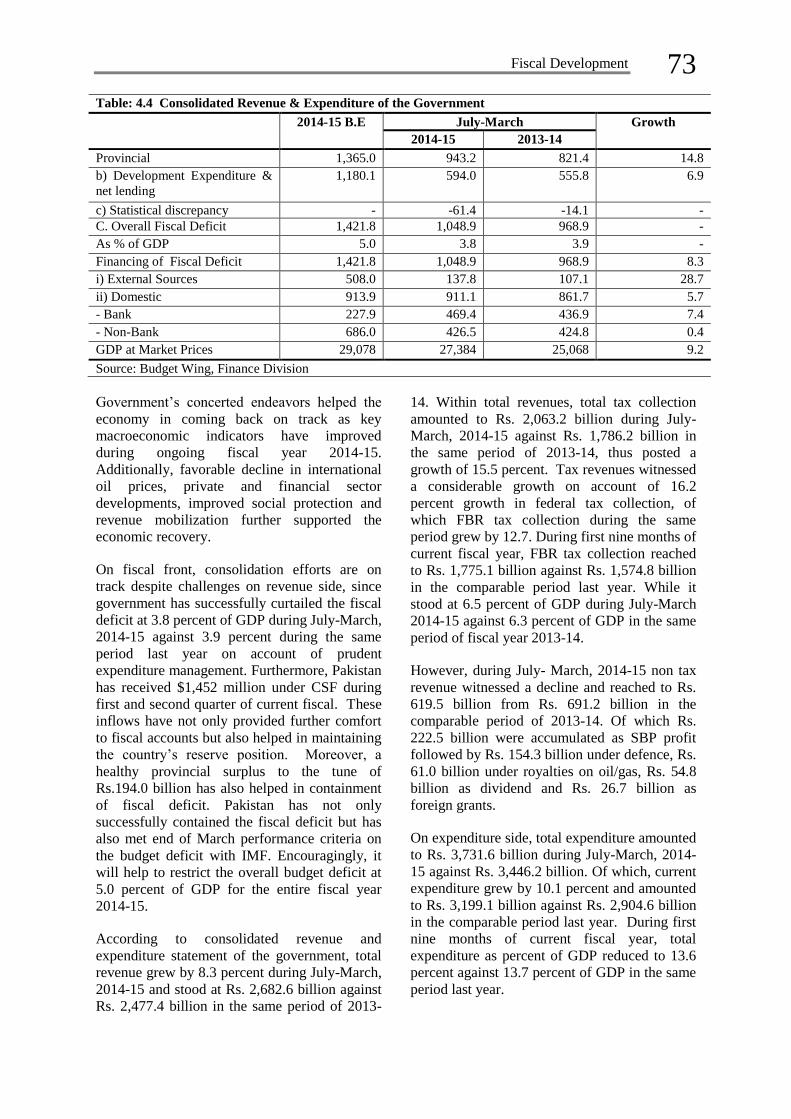
On fiscal front, consolidation efforts are on
track despite challenges on revenue side, since
government has successfully curtailed the fiscal
deficit at 3.8 percent of GDP during July-March,
2014-15 against 3.9 percent during the same
period last year on account of prudent
expenditure management. Furthermore, Pakistan
has received $1,452 million under CSF during
first and second quarter of current fiscal. These
inflows have not only provided further comfort
to fiscal accounts but also helped in maintaining
the country’s reserve position. Moreover, a
healthy provincial surplus to the tune of
Rs.194.0 billion has also helped in containment
of fiscal deficit. Pakistan has not only
successfully contained the fiscal deficit but has
also met end of March performance criteria on
the budget deficit with IMF. Encouragingly, it
will help to restrict the overall budget deficit at
5.0 percent of GDP for the entire fiscal year
2014-15.
According to consolidated revenue and
expenditure statement of the government, total
revenue grew by 8.3 percent during July-March,
2014-15 and stood at Rs. 2,682.6 billion against
Rs. 2,477.4 billion in the same period of 2013-
14. Within total revenues, total tax collection
amounted to Rs. 2,063.2 billion during July-
March, 2014-15 against Rs. 1,786.2 billion in
the same period of 2013-14, thus posted a
growth of 15.5 percent. Tax revenues witnessed
a considerable growth on account of 16.2
percent growth in federal tax collection, of
which FBR tax collection during the same
period grew by 12.7. During first nine months of
current fiscal year, FBR tax collection reached
to Rs. 1,775.1 billion against Rs. 1,574.8 billion
in the comparable period last year. While it
stood at 6.5 percent of GDP during July-March
2014-15 against 6.3 percent of GDP in the same
period of fiscal year 2013-14.
However, during July- March, 2014-15 non tax
revenue witnessed a decline and reached to Rs.
619.5 billion from Rs. 691.2 billion in the
comparable period of 2013-14. Of which Rs.
222.5 billion were accumulated as SBP profit
followed by Rs. 154.3 billion under defence, Rs.
61.0 billion under royalties on oil/gas, Rs. 54.8
billion as dividend and Rs. 26.7 billion as
foreign grants.
On expenditure side, total expenditure amounted
to Rs. 3,731.6 billion during July-March, 2014-
15 against Rs. 3,446.2 billion. Of which, current
expenditure grew by 10.1 percent and amounted
to Rs. 3,199.1 billion against Rs. 2,904.6 billion
in the comparable period last year. During first
nine months of current fiscal year, total
expenditure as percent of GDP reduced to 13.6
percent against 13.7 percent of GDP in the same
period last year.
74 Pakistan Economic Survey 2014-15
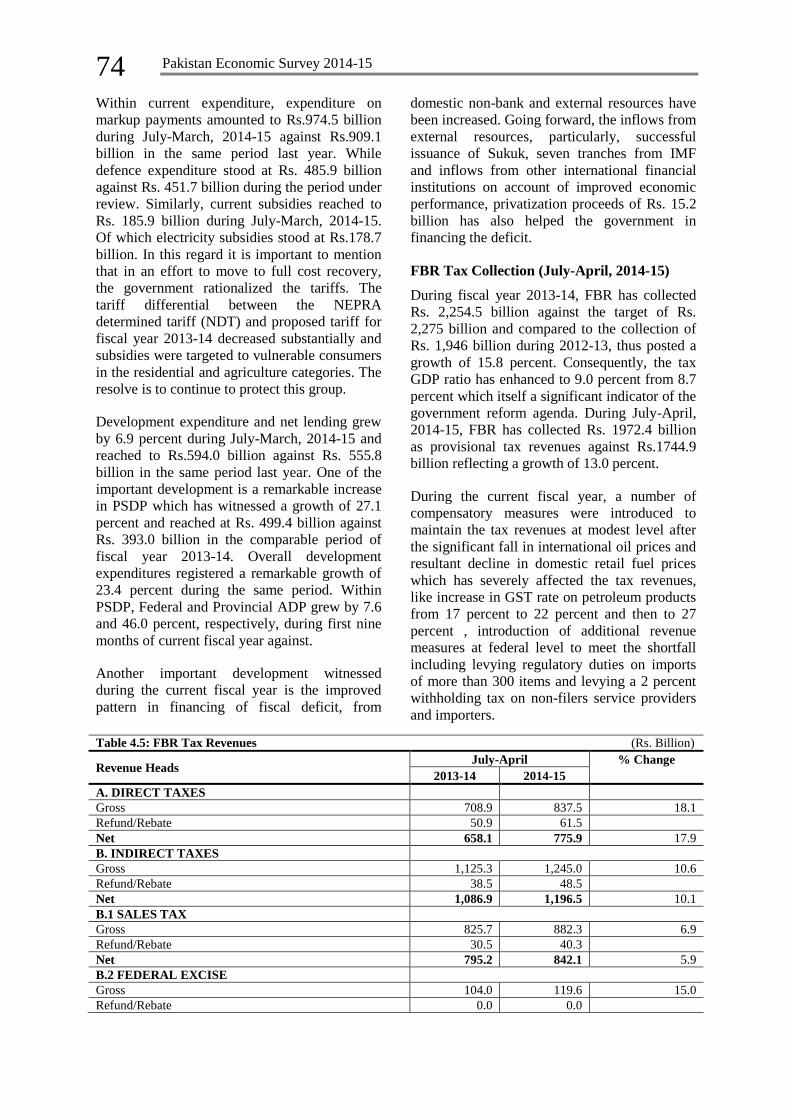
Within current expenditure, expenditure on
markup payments amounted to Rs.974.5 billion
during July-March, 2014-15 against Rs.909.1
billion in the same period last year. While
defence expenditure stood at Rs. 485.9 billion
against Rs. 451.7 billion during the period under
review. Similarly, current subsidies reached to
Rs. 185.9 billion during July-March, 2014-15.
Of which electricity subsidies stood at Rs.178.7
billion. In this regard it is important to mention
that in an effort to move to full cost recovery,
the government rationalized the tariffs. The
tariff differential between the NEPRA
determined tariff (NDT) and proposed tariff for
fiscal year 2013-14 decreased substantially and
subsidies were targeted to vulnerable consumers
in the residential and agriculture categories. The
resolve is to continue to protect this group.
Development expenditure and net lending grew
by 6.9 percent during July-March, 2014-15 and
reached to Rs.594.0 billion against Rs. 555.8
billion in the same period last year. One of the
important development is a remarkable increase
in PSDP which has witnessed a growth of 27.1
percent and reached at Rs. 499.4 billion against
Rs. 393.0 billion in the comparable period of
fiscal year 2013-14. Overall development
expenditures registered a remarkable growth of
23.4 percent during the same period. Within
PSDP, Federal and Provincial ADP grew by 7.6
and 46.0 percent, respectively, during first nine
months of current fiscal year against.
Another important development witnessed
during the current fiscal year is the improved
pattern in financing of fiscal deficit, from
domestic non-bank and external resources have
been increased. Going forward, the inflows from
external resources, particularly, successful
issuance of Sukuk, seven tranches from IMF
and inflows from other international financial
institutions on account of improved economic
performance, privatization proceeds of Rs. 15.2
billion has also helped the government in
financing the deficit.
FBR Tax Collection (July-April, 2014-15)
During fiscal year 2013-14, FBR has collected
Rs. 2,254.5 billion against the target of Rs.
2,275 billion and compared to the collection of
Rs. 1,946 billion during 2012-13, thus posted a
growth of 15.8 percent. Consequently, the tax
GDP ratio has enhanced to 9.0 percent from 8.7
percent which itself a significant indicator of the
government reform agenda. During July-April,
2014-15, FBR has collected Rs. 1972.4 billion
as provisional tax revenues against Rs.1744.9
billion reflecting a growth of 13.0 percent.
During the current fiscal year, a number of
compensatory measures were introduced to
maintain the tax revenues at modest level after
the significant fall in international oil prices and
resultant decline in domestic retail fuel prices
which has severely affected the tax revenues,
like increase in GST rate on petroleum products
from 17 percent to 22 percent and then to 27
percent , introduction of additional revenue
measures at federal level to meet the shortfall
including levying regulatory duties on imports
of more than 300 items and levying a 2 percent
withholding tax on non-filers service providers
and importers.
Table 4.5: FBR Tax Revenues (Rs. Billion)
Revenue Heads July-April % Change
2013-14 2014-15
A. DIRECT TAXES
Gross 708.9 837.5 18.1
Refund/Rebate 50.9 61.5
Net 658.1 775.9 17.9
B. INDIRECT TAXES
Gross 1,125.3 1,245.0 10.6
Refund/Rebate 38.5 48.5
Net 1,086.9 1,196.5 10.1
B.1 SALES TAX
Gross 825.7 882.3 6.9
Refund/Rebate 30.5 40.3
Net 795.2 842.1 5.9
B.2 FEDERAL EXCISE
Gross 104.0 119.6 15.0
Refund/Rebate 0.0 0.0

Fiscal Development
75
Table 4.5: FBR Tax Revenues (Rs. Billion)
Revenue Heads July-April % Change
2013-14 2014-15
Net 104.0 119.6 15.0
B.3 CUSTOM
Gross 195.6 243.0 24.2
Refund/Rebate 8.0 8.2
Net 187.7 234.8 25.1
TOTAL TAX COLLECTION
Gross 1,834.3 2,082.4 13.5
Refund/Rebate 89.4 110.0
Net 1,744.9 1,972.4 13.0
Source: Federal Board of Revenue
Direct Taxes
The net collection of direct taxes has registered
a growth of 17.9 percent during the first ten
months of fiscal year 2014-15. The net
collection has increased from Rs. 658.1 billion
during July-April, 2013-14 to Rs. 775.9 billion
in the same period of current fiscal year. Bulk of
the tax revenues of direct taxes is realized from
income tax. The components of income tax are
withholding tax, voluntary payments and
collection on demand.
Indirect Taxes
Sales Tax
Gross and net collection of sales tax has
increased from Rs. 825.7 billion and Rs. 795.2
billion to Rs.882.3 billion and Rs. 842.1 billion
respectively, thus registered a growth of 6.9 and
5.9 percent, respectively. In fact, 53.1 percent of
total sales tax has been contributed by sales tax
on import while the rest has been contributed by
domestic sector. Within net domestic sales tax
collection, the major contribution emanated
from POL products, fertilizers, natural gas,
cement, electrical energy, beverages, cigarettes,
sugar etc. On the other hand, POL products,
plastic, edible oil, vehicles, machinery,
chemicals, oilseeds etc contributed significantly
to the collection of sales tax from imports.
Customs Duty
Customs duty collection has registered growth
of 24.2 percent and 25.1 percent in both gross
and net terms, respectively. The gross and net
collection have increased from Rs.195.6 billion
and Rs.187.7 billion during July-April 2013-14
to Rs. 243.0 billion and Rs. 234.8 billion,
respectively. The major revenue spinners of
custom duty have been vehicles, automobiles,
edible oil, petroleum products, machinery,
plastic, iron and steel, paper and paperboard etc.
Federal Excise Duty
The collection of Federal Excise Duties (FED)
during July-April, 2014-15 has recorded 15.0
percent growth. The net collection stood at Rs.
119.6 billion during July-April, 2014-15 as
against Rs. 104.0 billion during the same period
last year. The major revenue spinners of FED
are cigarettes, cement, beverages, natural gas
and international travel.
Provincial Budget
The total outlay of the four provincial budgets
for 2014-15 stood at Rs. 2,257.1 billion, 29.9
percent higher than the outlay of Rs. 1,737.7
billion last year.
Table 4.6: Overview of Provincial Budgets (Rs Billion)
Items Punjab Sindh KPK Baluchistan Total
2013-14
RE
2014-15
BE
2013-14
RE
2014-15
BE
2013-14
RE
2014-15
BE
2013-14
RE
2014-15
BE
2013-14
RE
2014-15
BE
A. Tax Revenue 746.3 968.5 387.5 488.4 217.4 273.9 127.6 146.6 1,478.8 1,877.4
Provincial Taxes 96.4 164.7 79.1 107.0 11.7 19.5 2.8 3.5 190.0 294.7
GST on Services (transferred by
federal govt)
0.0 0.0 0.0 0.0 0.0 0.0 1.5 1.9 1.5 1.9
Share in Federal Taxes 649.9 803.8 308.4 381.4 205.7 254.4 123.3 141.2 1,287.3 1,580.8
B. Non-Tax Revenue 34.1 32.6 77.3 101.7 46.9 82.8 17.8 22.1 176.1 239.2
C. All Others 42.4 35.3 19.1 36.0 36.4 17.8 36.7 31.3 134.6 120.3
Total Revenues (A+B+C) 822.8 1,036.4 483.9 626.1 300.7 374.5 182.1 200.0 1,789.5 2,236.9
a) Current Expenditure 569.3 699.9 328.2 436.0 187.1 249.9 120.3 120.9 1,204.9 1,506.7
b) Development Expenditure 224.0 345.0 152.0 215.0 104.8 139.7 52.0 50.7 532.8 750.4
Total Exp (a+b) 793.3 1,044.9 480.2 651.0 291.9 389.6 172.3 171.6 1,737.7 2,257.1
Source: Provincial Finance, Finance Division
76 Pakistan Economic Survey 2014-15
The total budget outlay of Rs. 2,257.1 billion is
shared in the ratio of 66.8 percent and 33.2
percent between current and development
expenditures, respectively. The allocation for
development expenditure is 40.8 percent higher
than last year and current expenditure is higher
by 25.0 percent.
Allocation of Revenues between the Federal
Government and Provinces
Currently, 7th National Finance Commission
(NFC) Award (2009) is operative. Through this
Award, the financial autonomy of the provinces
has been strengthened by increasing their share
in the Divisible Pool (taxes) from 50 percent to
56 percent in fiscal year 2010-11 and to 57.5
percent from fiscal year 2011-12 onwards.
Under 7th NFC award, multiple indicators were
adopted for distribution of provincial shares in
the divisible pool whereas in all the previous
awards, population remained as sole criterion
for distribution of provincial share in the
divisible pool with special grants (subventions)
to smaller provinces.
Table 4.7: Transfers to Provinces (NET) (Rs. Billion)
2009-10 2010-11 2011-12 2012-13 2013-14 2014-15
B.E
Divisible Pool 574.1 834.7 1,063.1 1,117.5 1,287.4 1,580.8
Straight Transfer 81.2 163.0 145.6 103.5 124.4 137.5
Special Grants/ Subventions 82.0 54.1 53.9 61.2 53.8 32.7
Project Aid 16.0 21.9 47.8 71.3 85.2 103.6
Program Loans 0.0 0.0 4.6 4.2 59.1 48.1
Japanese Grant 0.0 0.1 0.1 0.0 0.0 0.1
Total Transfer to Province 753.3 1,073.7 1,315.0 1,441.5 1,611.5 1,904.7
Interest Payment 18.7 18.5 12.9 14.8 14.1 13.0
Loan Repayment 24.0 32.4 36.1 32.1 38.7 39.4
Transfer to Province(Net) 710.6 1,022.8 1,266.0 1,394.5 1,558.8 1,852.3
Source: Various issue of Budget in Brief.
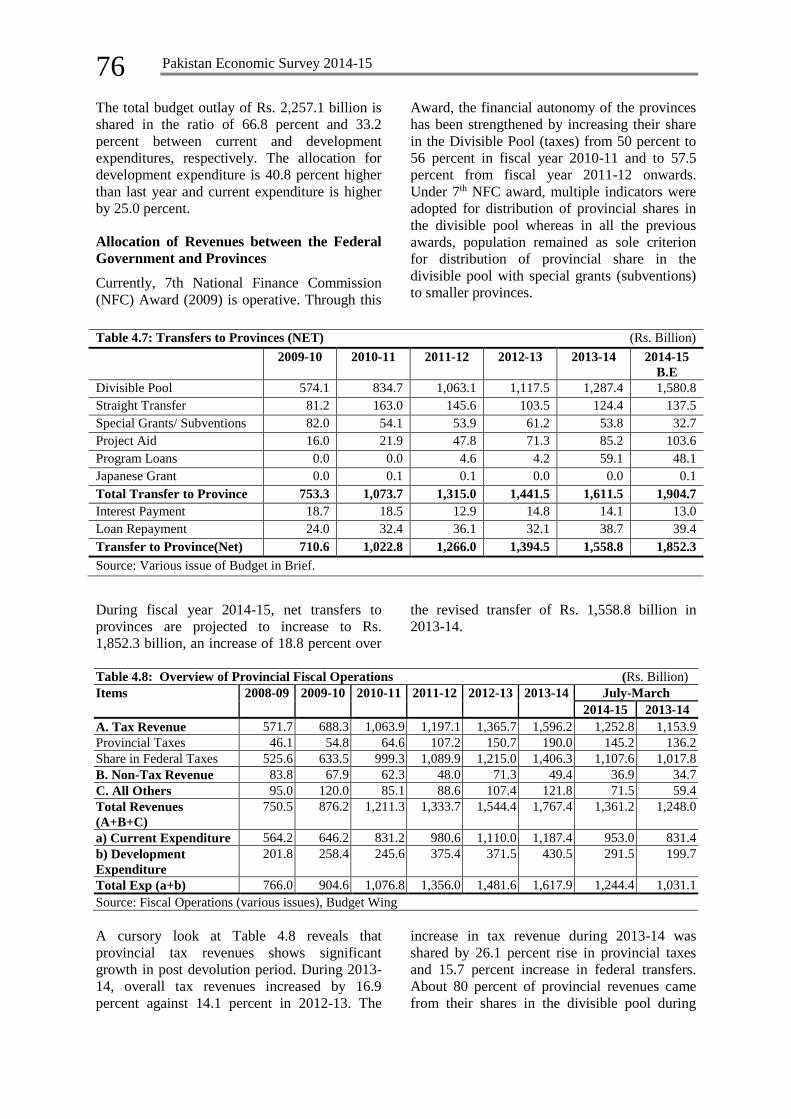
During fiscal year 2014-15, net transfers to
provinces are projected to increase to Rs.
1,852.3 billion, an increase of 18.8 percent over
the revised transfer of Rs. 1,558.8 billion in
2013-14.
Table 4.8: Overview of Provincial Fiscal Operations (Rs. Billion)
Items 2008-09 2009-10 2010-11 2011-12 2012-13 2013-14 July-March
2014-15 2013-14
A. Tax Revenue 571.7 688.3 1,063.9 1,197.1 1,365.7 1,596.2 1,252.8 1,153.9
Provincial Taxes 46.1 54.8 64.6 107.2 150.7 190.0 145.2 136.2
Share in Federal Taxes 525.6 633.5 999.3 1,089.9 1,215.0 1,406.3 1,107.6 1,017.8
B. Non-Tax Revenue 83.8 67.9 62.3 48.0 71.3 49.4 36.9 34.7
C. All Others 95.0 120.0 85.1 88.6 107.4 121.8 71.5 59.4
Total Revenues
(A+B+C)
750.5 876.2 1,211.3 1,333.7 1,544.4 1,767.4 1,361.2 1,248.0
a) Current Expenditure 564.2 646.2 831.2 980.6 1,110.0 1,187.4 953.0 831.4
b) Development
Expenditure
201.8 258.4 245.6 375.4 371.5 430.5 291.5 199.7
Total Exp (a+b) 766.0 904.6 1,076.8 1,356.0 1,481.6 1,617.9 1,244.4 1,031.1
Source: Fiscal Operations (various issues), Budget Wing
A cursory look at Table 4.8 reveals that
provincial tax revenues shows significant
growth in post devolution period. During 2013-
14, overall tax revenues increased by 16.9
percent against 14.1 percent in 2012-13. The
increase in tax revenue during 2013-14 was
shared by 26.1 percent rise in provincial taxes
and 15.7 percent increase in federal transfers.
About 80 percent of provincial revenues came
from their shares in the divisible pool during
Fiscal Development
77
fiscal year 2013-14. However, provinces’ own
revenue receipts are also on continuous rise
mainly due to GST collection on services. The
share of provincial tax collection in total
revenues has increased from 5.3 percent in fiscal
year 2010-11 (before the 18th Amendment), to
10.8 percent during fiscal year 2013-14.
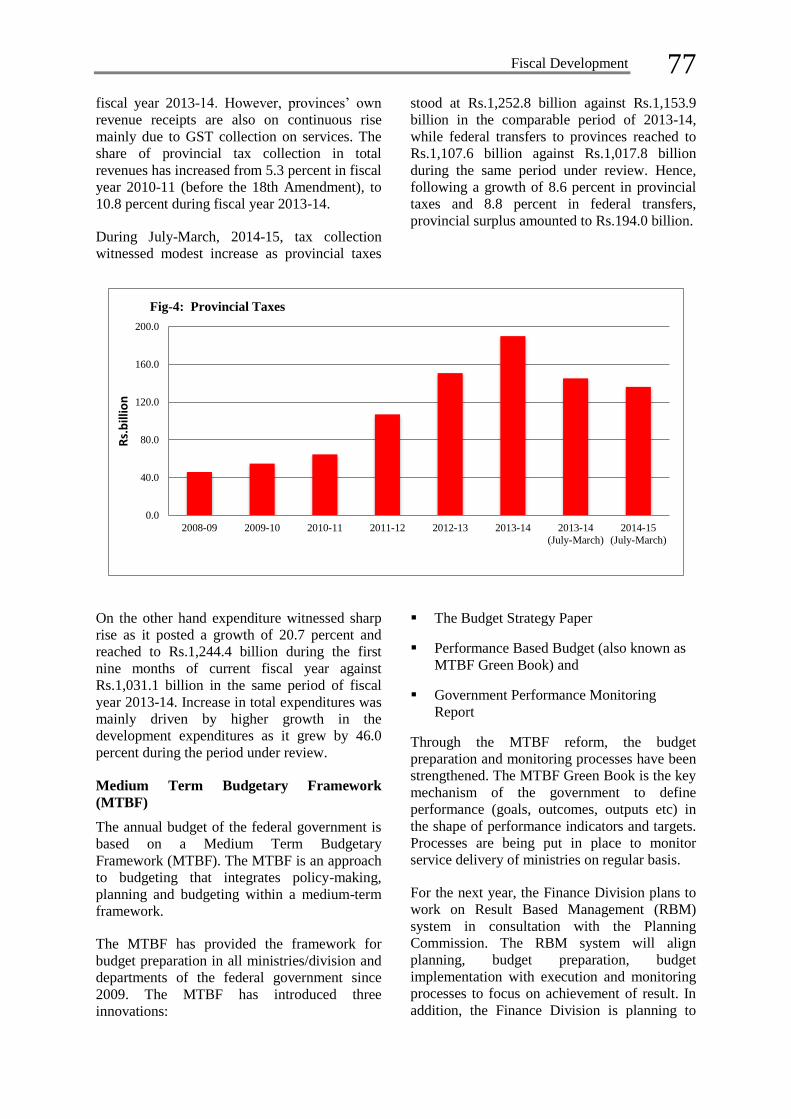
During July-March, 2014-15, tax collection
witnessed modest increase as provincial taxes
stood at Rs.1,252.8 billion against Rs.1,153.9
billion in the comparable period of 2013-14,
while federal transfers to provinces reached to
Rs.1,107.6 billion against Rs.1,017.8 billion
during the same period under review. Hence,
following a growth of 8.6 percent in provincial
taxes and 8.8 percent in federal transfers,
provincial surplus amounted to Rs.194.0 billion.
On the other hand expenditure witnessed sharp
rise as it posted a growth of 20.7 percent and
reached to Rs.1,244.4 billion during the first
nine months of current fiscal year against
Rs.1,031.1 billion in the same period of fiscal
year 2013-14. Increase in total expenditures was
mainly driven by higher growth in the
development expenditures as it grew by 46.0
percent during the period under review.
Medium Term Budgetary Framework
(MTBF)
The annual budget of the federal government is
based on a Medium Term Budgetary
Framework (MTBF). The MTBF is an approach
to budgeting that integrates policy-making,
planning and budgeting within a medium-term
framework.
The MTBF has provided the framework for
budget preparation in all ministries/division and
departments of the federal government since
2009. The MTBF has introduced three
innovations:
The Budget Strategy Paper
Performance Based Budget (also known as
MTBF Green Book) and
Government Performance Monitoring
Report
Through the MTBF reform, the budget
preparation and monitoring processes have been
strengthened. The MTBF Green Book is the key
mechanism of the government to define
performance (goals, outcomes, outputs etc) in
the shape of performance indicators and targets.
Processes are being put in place to monitor
service delivery of ministries on regular basis.
For the next year, the Finance Division plans to
work on Result Based Management (RBM)
system in consultation with the Planning
Commission. The RBM system will align
planning, budget preparation, budget
implementation with execution and monitoring
processes to focus on achievement of result. In
addition, the Finance Division is planning to
0.0
40.0
80.0
120.0
160.0
200.0
2008-09 2009-10 2010-11 2011-12 2012-13 2013-14 2013-14
(July-March)
2014-15
(July-March)
Rs.
bill
ion
Fig-4: Provincial Taxes
78 Pakistan Economic Survey 2014-15
start work on development of a comprehensive
Public Financial Management reforms strategy
to strengthen further fiscal reforms.
Way Forward:
Despite the headwinds at the onset of new fiscal
year due to political unrest, security related
operations, legal challenges to privatization;
taxation and energy sector reform Pakistan’s
economy remained resilient. Particularly,
economy has successfully followed the path of
fiscal discipline due to strenuous efforts by the
government in order to contain expenditures
through expenditure management strategy and
revenue building measures. Furthermore decline
in international oil prices also helped in
reducing the pressures on external and fiscal
sector.
Fiscal development during the first nine months
of current fiscal year has laid down the
foundation of long term economic growth.
Fiscal deficit has been successfully curtailed to
3.8 percent of GDP during July-March, 2014-15
from 3.9 percent of GDP in the comparable
period last year. Pakistan has not only
successfully contained the fiscal deficit but has
also met end March performance criteria on the
budget deficit with IMF. Encouragingly, it will
help to restrict the overall budget deficit at 5.0
percent of GDP for the entire fiscal year
2014-15.