fiscal focus: state appropriations, tuition, and public
TRANSCRIPT

State Appropriations, Tuition, and Public
University Operating Costs
Prepared by Kyle I. Jen, Deputy Director
December 2013
Ma r y Ann C l ea r y , D i r ec t o r
FISCAL FOCUS
HOUSE FISCAL AGENCY GOVERNING COMMITTEE
Joe Haveman Rashida Tlaib Jase Bolger Tim Greimel Jim Stamas David Rutledge
MICHIGAN HOUSE OF REPRESENTATIVES APPROPRIATIONS COMMITTEE
Joe Haveman, Chair Rob VerHeulen
Al Pscholka, Vice Chair Jim Stamas
Jon Bumstead John Walsh
Anthony Forlini Rashida Tlaib, Minority Vice Chair
Martin Howrylak Terry Brown
Nancy Jenkins Brandon Dillon
Eileen Kowall Fred Durhal
Matt Lori Pam Faris
Peter MacGregor Andrew Kandrevas
Greg MacMaster Sean McCann
Michael McCready Sarah Roberts
Paul Muxlow Sam Singh
Earl Poleski Adam Zemke
Phil Potvin John Olumba (I)
Bill Rogers

STATE OF MICHIGAN
HOUSE OF REPRESENTATIVES
HOUSE FISCAL AGENCY
MARY ANN CLEARY, DIRECTOR
P.O. BOX 30014 LANSING, MICHIGAN 48909-7514 PHONE: (517) 373-8080 FAX: (517) 373-5874
www.house.mi.gov/hfa
GOVERNING COMMITTEE
JOE HAVEMAN, CHAIR JASE BOLGER JIM STAMAS
RASHIDA TLAIB, VC TIM GREIMEL
DAVID RUTLEDGE
December 2013 TO: Members of the House of Representatives Over 250,000 Michigan students attend one of the state’s 15 public universities each year. The Michigan Legislature does not directly set the tuition rates those students pay, but the level of funding appropriated to the universities does play a major role in the university tuition setting process. This report examines the combined effect of state funding reductions and tuition increases on overall university operating resources over the last decade and a half and discusses major factors related to university operating costs. This information is intended to provide context for future legislative decision making regarding state funding levels for universities and associated tuition restraint policy. Kyle I. Jen, Deputy Director, is the author of this report. Kathryn Bateson, Administrative Assistant, prepared the material for publication. Please do not hesitate to call if you have questions about the information in this report. Mary Ann Cleary, Director

Executive Summary ................................................................................................... 1 State Appropriations and Tuition Rates ..................................................................... 3 University Operating Cost Growth ............................................................................. 7 University Operating Cost Factors ........................................................................... 11 Conclusion ............................................................................................................... 15 Appendix: University-Specific Charts ....................................................................... 17 FIGURES 1 Appropriations and Tuition as a Percentage of Total University Operating Revenues .................................................................. 3 2 Total State Appropriations for University Operations ......................................... 4 3 Average Full-Time In-State Undergraduate Tuition and Fee Rate ....................... 5 4 Public University Operating Resources per FTE Student ..................................... 7 TABLE 1 Financial Information: Public University Totals ................................................... 8
TABLE OF CONTENTS

APPENDIX Operating Resources per FTE Student A Central Michigan University .............................................................................. 18 B Eastern Michigan University ............................................................................. 19 C Ferris State University ....................................................................................... 20 D Grand Valley State University ........................................................................... 21 E Lake Superior State University .......................................................................... 22 F Michigan State University ................................................................................. 23 G Michigan Tech University .................................................................................. 24 H Northern Michigan University .......................................................................... 25 I Oakland University ........................................................................................... 26 J Saginaw Valley State University ........................................................................ 27 K University of Michigan-Ann Arbor .................................................................... 28 L University of Michigan-Dearborn ...................................................................... 29 M University of Michigan-Flint .............................................................................. 30 N Wayne State University .................................................................................... 31 O Western Michigan University .............................................................................. 32
TABLE OF CONTENTS cont.
From FY 2000-01 to FY 2013-14, state appropriations to public universities for operating costs have been reduced by about 30% on a per-student basis, while the average tuition and fee rate charged to an in-state undergraduate student has increased by about 150%. Combining the two revenue sources, total operating resources per student at Michigan public universities have increased by about 57% over the 13-year period. On an annualized basis, this growth has run about a percentage point per year above consumer inflation and about half a percentage point above national higher education cost inflation. A number of factors contribute to university expenditure growth, including compensation costs, enrollment changes, program offerings, and the distribution of institutional financial aid. Removing increases associated with growth in institutional financial aid, total university per-student operating revenues have grown at roughly the same rate as national higher education cost inflation. While state budget policies can influence university operational decisions, tuition increases will be a much larger factor for university revenue and expenditure growth in future years than changes in state appropriations will. State appropriations now account for less than a quarter of university general fund revenue. Declining enrollment levels will be a challenge for many universities over the next decade as the number of high school graduates in Michigan has begun to fall.
EXECUTIVE SUMMARY
FISCAL FOCUS: STATE APPROPRIATIONS, TUITION, AND PUBLIC UNIVERSITY OPERATING COSTS HOUSE FISCAL AGENCY: DECEMBER 2013 PAGE 1

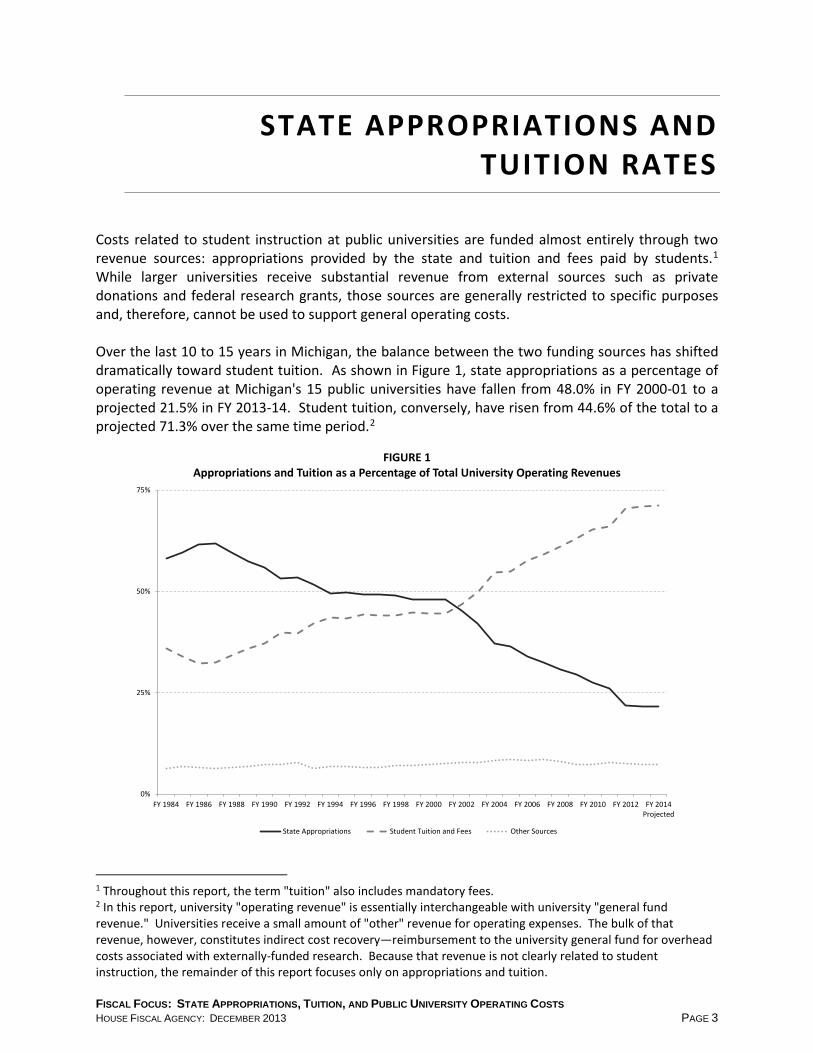
Costs related to student instruction at public universities are funded almost entirely through two revenue sources: appropriations provided by the state and tuition and fees paid by students.1 While larger universities receive substantial revenue from external sources such as private donations and federal research grants, those sources are generally restricted to specific purposes and, therefore, cannot be used to support general operating costs. Over the last 10 to 15 years in Michigan, the balance between the two funding sources has shifted dramatically toward student tuition. As shown in Figure 1, state appropriations as a percentage of operating revenue at Michigan's 15 public universities have fallen from 48.0% in FY 2000-01 to a projected 21.5% in FY 2013-14. Student tuition, conversely, have risen from 44.6% of the total to a projected 71.3% over the same time period.2
1 Throughout this report, the term "tuition" also includes mandatory fees. 2 In this report, university "operating revenue" is essentially interchangeable with university "general fund revenue." Universities receive a small amount of "other" revenue for operating expenses. The bulk of that revenue, however, constitutes indirect cost recovery―reimbursement to the university general fund for overhead costs associated with externally-funded research. Because that revenue is not clearly related to student instruction, the remainder of this report focuses only on appropriations and tuition.
STATE APPROPRIATIONS AND TUITION RATES
0%
25%
50%
75%
FY 1984 FY 1986 FY 1988 FY 1990 FY 1992 FY 1994 FY 1996 FY 1998 FY 2000 FY 2002 FY 2004 FY 2006 FY 2008 FY 2010 FY 2012 FY 2014Projected
FIGURE 1Appropriations and Tuition as a Percentage of Total University Operating Revenues
State Appropriations Student Tuition and Fees Other Sources
FISCAL FOCUS: STATE APPROPRIATIONS, TUITION, AND PUBLIC UNIVERSITY OPERATING COSTS HOUSE FISCAL AGENCY: DECEMBER 2013 PAGE 3
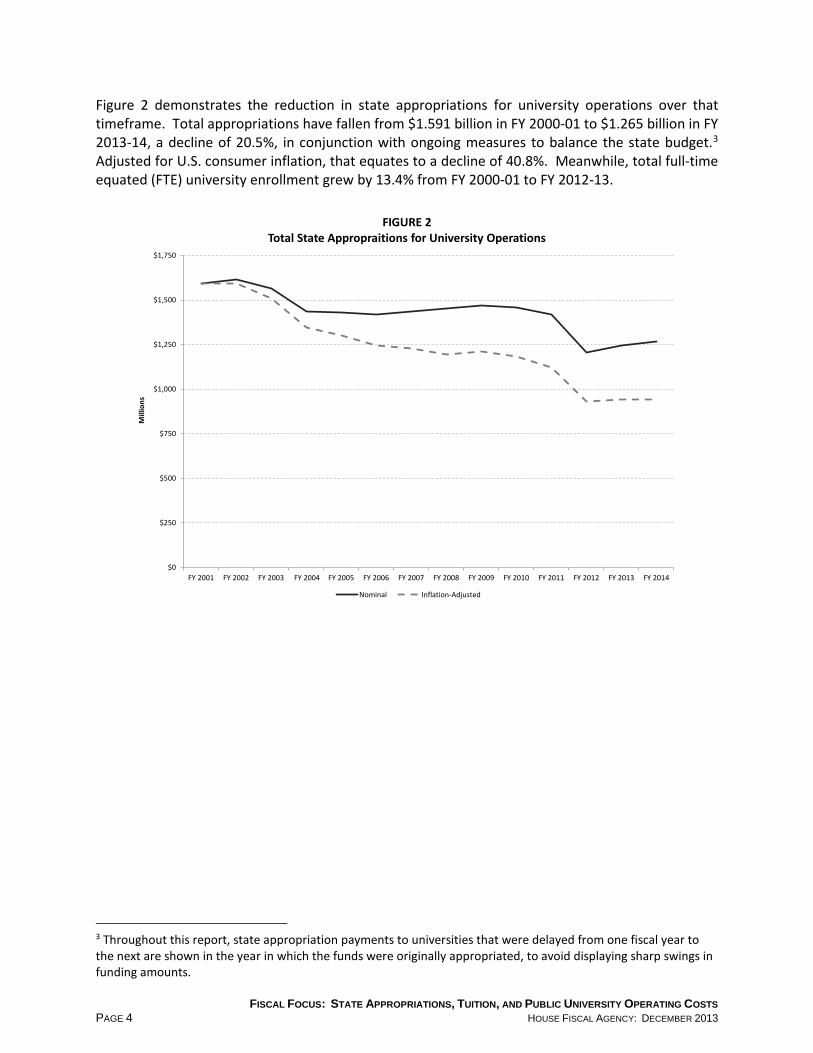
Figure 2 demonstrates the reduction in state appropriations for university operations over that timeframe. Total appropriations have fallen from $1.591 billion in FY 2000-01 to $1.265 billion in FY 2013-14, a decline of 20.5%, in conjunction with ongoing measures to balance the state budget.3 Adjusted for U.S. consumer inflation, that equates to a decline of 40.8%. Meanwhile, total full-time equated (FTE) university enrollment grew by 13.4% from FY 2000-01 to FY 2012-13.
[Figure 2 goes here]
3 Throughout this report, state appropriation payments to universities that were delayed from one fiscal year to the next are shown in the year in which the funds were originally appropriated, to avoid displaying sharp swings in funding amounts.
$0
$250
$500
$750
$1,000
$1,250
$1,500
$1,750
FY 2001 FY 2002 FY 2003 FY 2004 FY 2005 FY 2006 FY 2007 FY 2008 FY 2009 FY 2010 FY 2011 FY 2012 FY 2013 FY 2014
Mill
ions
FIGURE 2Total State Appropraitions for University Operations
Nominal Inflation-Adjusted
FISCAL FOCUS: STATE APPROPRIATIONS, TUITION, AND PUBLIC UNIVERSITY OPERATING COSTS
PAGE 4 HOUSE FISCAL AGENCY: DECEMBER 2013
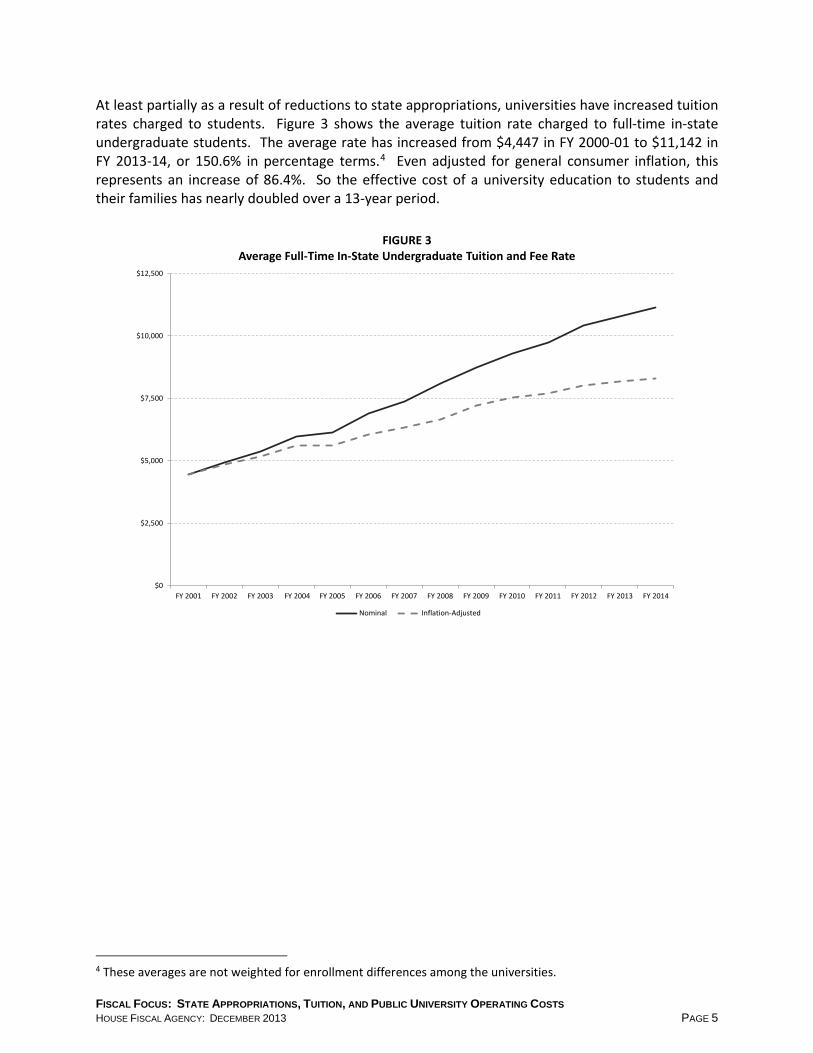
At least partially as a result of reductions to state appropriations, universities have increased tuition rates charged to students. Figure 3 shows the average tuition rate charged to full-time in-state undergraduate students. The average rate has increased from $4,447 in FY 2000-01 to $11,142 in FY 2013-14, or 150.6% in percentage terms.4 Even adjusted for general consumer inflation, this represents an increase of 86.4%. So the effective cost of a university education to students and their families has nearly doubled over a 13-year period.
[Figure 3 goes here]
4 These averages are not weighted for enrollment differences among the universities.
$0
$2,500
$5,000
$7,500
$10,000
$12,500
FY 2001 FY 2002 FY 2003 FY 2004 FY 2005 FY 2006 FY 2007 FY 2008 FY 2009 FY 2010 FY 2011 FY 2012 FY 2013 FY 2014
FIGURE 3Average Full-Time In-State Undergraduate Tuition and Fee Rate
Nominal Inflation-Adjusted
FISCAL FOCUS: STATE APPROPRIATIONS, TUITION, AND PUBLIC UNIVERSITY OPERATING COSTS HOUSE FISCAL AGENCY: DECEMBER 2013 PAGE 5

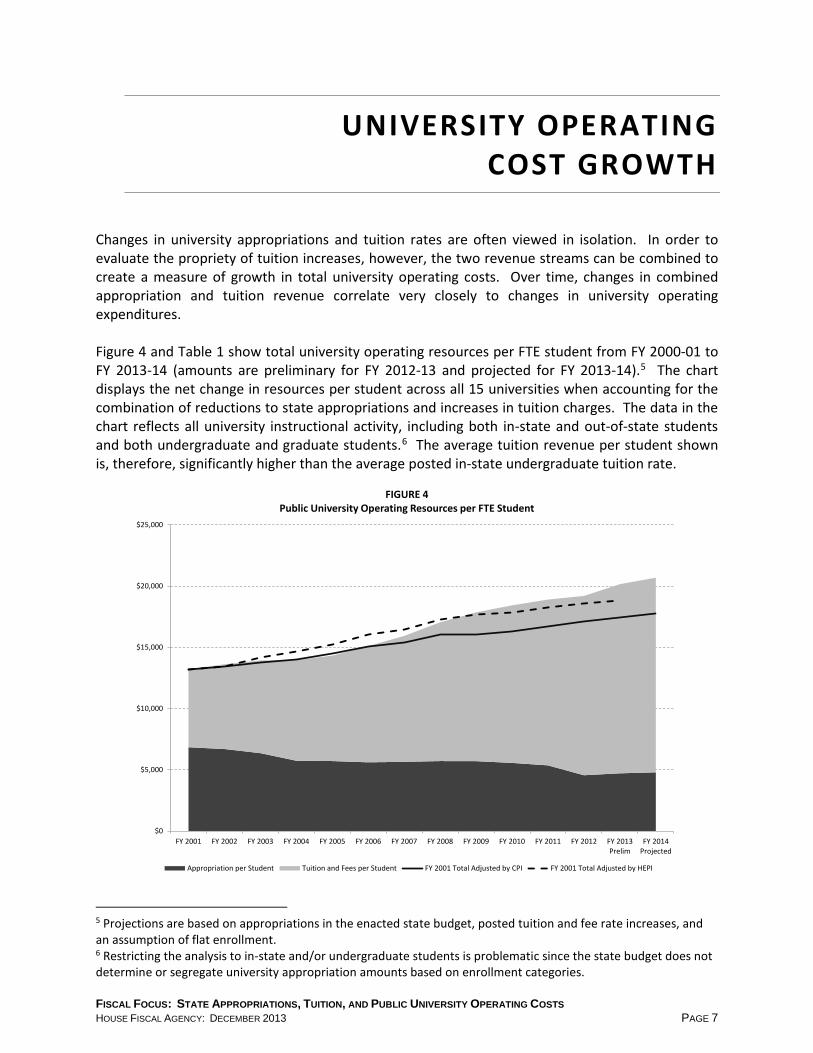
Changes in university appropriations and tuition rates are often viewed in isolation. In order to evaluate the propriety of tuition increases, however, the two revenue streams can be combined to create a measure of growth in total university operating costs. Over time, changes in combined appropriation and tuition revenue correlate very closely to changes in university operating expenditures. Figure 4 and Table 1 show total university operating resources per FTE student from FY 2000-01 to FY 2013-14 (amounts are preliminary for FY 2012-13 and projected for FY 2013-14).5 The chart displays the net change in resources per student across all 15 universities when accounting for the combination of reductions to state appropriations and increases in tuition charges. The data in the chart reflects all university instructional activity, including both in-state and out-of-state students and both undergraduate and graduate students.6 The average tuition revenue per student shown is, therefore, significantly higher than the average posted in-state undergraduate tuition rate.
[Figure 4 goes here]
5 Projections are based on appropriations in the enacted state budget, posted tuition and fee rate increases, and an assumption of flat enrollment. 6 Restricting the analysis to in-state and/or undergraduate students is problematic since the state budget does not determine or segregate university appropriation amounts based on enrollment categories.
UNIVERSITY OPERATING COST GROWTH
$0
$5,000
$10,000
$15,000
$20,000
$25,000
FY 2001 FY 2002 FY 2003 FY 2004 FY 2005 FY 2006 FY 2007 FY 2008 FY 2009 FY 2010 FY 2011 FY 2012 FY 2013Prelim
FY 2014Projected
FIGURE 4Public University Operating Resources per FTE Student
Appropriation per Student Tuition and Fees per Student FY 2001 Total Adjusted by CPI FY 2001 Total Adjusted by HEPI
FISCAL FOCUS: STATE APPROPRIATIONS, TUITION, AND PUBLIC UNIVERSITY OPERATING COSTS HOUSE FISCAL AGENCY: DECEMBER 2013 PAGE 7
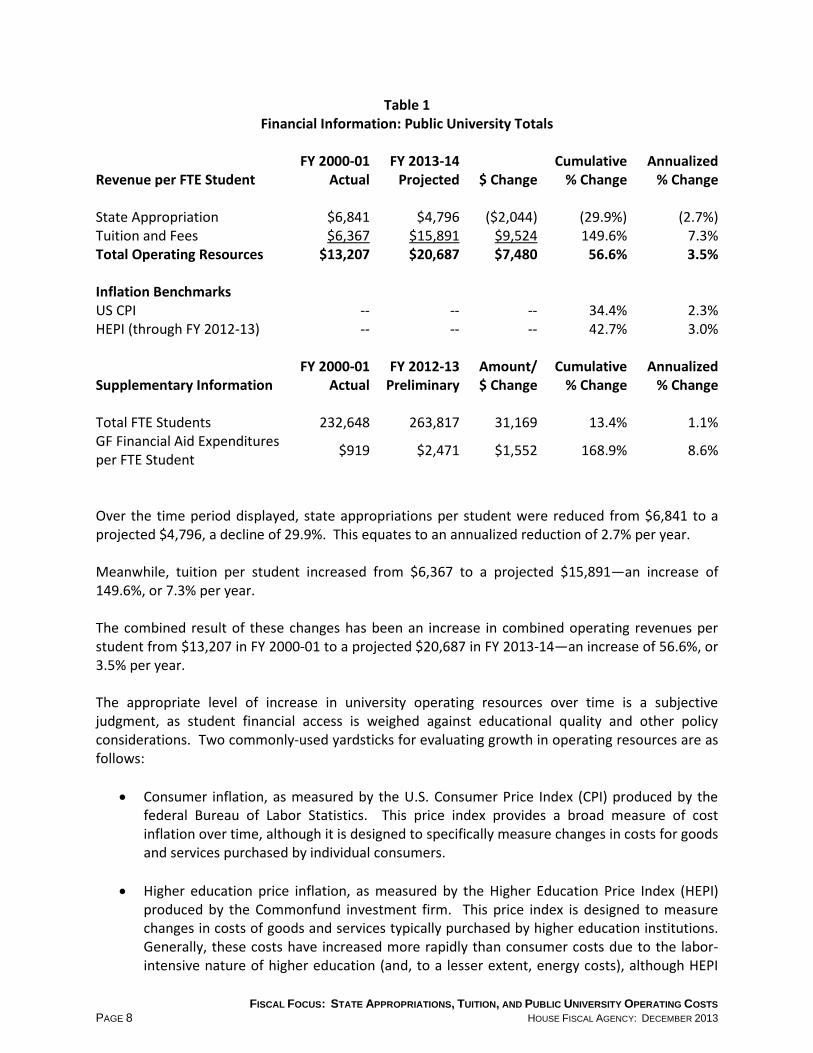
Table 1 Financial Information: Public University Totals
Revenue per FTE Student FY 2000-01
Actual FY 2013-14
Projected $ Change Cumulative
% Change Annualized
% Change State Appropriation $6,841 $4,796 ($2,044) (29.9%) (2.7%) Tuition and Fees $6,367 $15,891 $9,524 149.6% 7.3% Total Operating Resources $13,207 $20,687 $7,480 56.6% 3.5% Inflation Benchmarks US CPI -- -- -- 34.4% 2.3% HEPI (through FY 2012-13) -- -- -- 42.7% 3.0%
Supplementary Information FY 2000-01
Actual FY 2012-13
Preliminary Amount/$ Change
Cumulative % Change
Annualized % Change
Total FTE Students 232,648 263,817 31,169 13.4% 1.1% GF Financial Aid Expenditures per FTE Student $919 $2,471 $1,552 168.9% 8.6%
Over the time period displayed, state appropriations per student were reduced from $6,841 to a projected $4,796, a decline of 29.9%. This equates to an annualized reduction of 2.7% per year. Meanwhile, tuition per student increased from $6,367 to a projected $15,891―an increase of 149.6%, or 7.3% per year. The combined result of these changes has been an increase in combined operating revenues per student from $13,207 in FY 2000-01 to a projected $20,687 in FY 2013-14―an increase of 56.6%, or 3.5% per year. The appropriate level of increase in university operating resources over time is a subjective judgment, as student financial access is weighed against educational quality and other policy considerations. Two commonly-used yardsticks for evaluating growth in operating resources are as follows:
• Consumer inflation, as measured by the U.S. Consumer Price Index (CPI) produced by the federal Bureau of Labor Statistics. This price index provides a broad measure of cost inflation over time, although it is designed to specifically measure changes in costs for goods and services purchased by individual consumers.
• Higher education price inflation, as measured by the Higher Education Price Index (HEPI)
produced by the Commonfund investment firm. This price index is designed to measure changes in costs of goods and services typically purchased by higher education institutions. Generally, these costs have increased more rapidly than consumer costs due to the labor-intensive nature of higher education (and, to a lesser extent, energy costs), although HEPI
FISCAL FOCUS: STATE APPROPRIATIONS, TUITION, AND PUBLIC UNIVERSITY OPERATING COSTS
PAGE 8 HOUSE FISCAL AGENCY: DECEMBER 2013
increases have been more in line with CPI increases for the last few years due to lower wage growth.7
From FY 2000-01 to FY 2013-14, consumer inflation has been approximately 34.4%, or 2.3% per year (utilizing Consensus Revenue Estimating Conference estimates for the most recent two years). Meanwhile, higher education inflation has been approximately 3.0% per year (calculating through FY 2012-13, the most recent year for which HEPI data is available). In Figure 4, university per-student operating revenue increases can be measured against inflation by comparing the total shaded area of the chart with two charted lines, which show FY 2000-01 total operating resources per student adjusted to account for the two measures of inflation. The lines depict what total operating resources per student would have been each year if they'd simply increased at each of the two rates of inflation since FY 2000-01 From FY 2000-01 to FY 2005-06, per-student operating revenue increases were consistent with CPI increases and lower than HEPI increases. Since FY 2005-06, per-student operating revenue increases have accelerated somewhat, while both measures of inflation (particularly the HEPI) have generally increased at more modest rates. Over the full time period of FY 2000-01 to FY 2013-14, the change in total operating resources per student at Michigan public universities has run about a percentage point per year above consumer inflation (3.5% vs. 2.3%) and about half a percentage point per year above higher education inflation (3.5% vs. 3.0%).
7 More information on HEPI, see this website: https://www.commonfund.org/CommonfundInstitute/HEPI/Pages/default.aspx FISCAL FOCUS: STATE APPROPRIATIONS, TUITION, AND PUBLIC UNIVERSITY OPERATING COSTS HOUSE FISCAL AGENCY: DECEMBER 2013 PAGE 9


A number of factors can influence changes in university operating costs over time. Major factors are described below.
Compensation costs: As with other service-intensive industries, staffing and compensation levels are the largest driver of overall operating costs. In FY 2001-12, faculty and staff compensation made up 63.4% of total university general fund expenditures. From FY 2000-01 to FY 2011-12, total full-time equated faculty positions funded by general fund revenue at the 15 universities increased by 15.6% (from 16,371 to 18,931), while full-time equated non-faculty staff positions increased by 7.4% (from 20,940 to 22,490). This compares to enrollment growth of 13.9% over that period. Over the same time period, average compensation per general fund faculty position (including both base salary and fringe benefit costs) increased by 45.1%, from $67,718 to $98,275. This equates to growth of 3.4% per year. Average compensation per nonfaculty staff position increased by 37.8%, from $53,388 to $73,567. This equates to growth of 3.0% per year. Compensation amounts and growth rates vary by university, and are affected in part by the mix of faculty positions at a university (tenure-track vs. non-tenure-track vs. teaching assistants). Contract negotiations with employee unions also play a major role in determining compensation levels. Retirement costs: A particular area of compensation-related cost growth has been contributions to the Michigan Public School Employees' Retirement System (MPSERS), a state-administered pension system. Until 1996, state statute required that new employees at seven of the 15 universities become members of the system: Central, Eastern, Ferris, Lake Superior State, Michigan Tech, Northern, and Western. Statute was amended so that, beginning in 1996, new employees at those universities no longer became members of the system and have instead received retirement benefits under individual university retirement systems, which are generally defined contribution, 401k/457b-style, systems. Unfunded liability costs tied to MPSERS employees' retirement benefits have increased rapidly in recent years, mainly due to investment losses. In FY 2013-14, the seven MPSERS universities will pay a rate of 13.41% across the payroll of all MPSERS employees, as well as the payroll of non-MPSERS support staff and part-time employees, for unfunded pension liability costs. Additionally, those universities pay retiree health benefits for MPSERS employees on a pay-as-
UNIVERSITY OPERATING COST FACTORS
FISCAL FOCUS: STATE APPROPRIATIONS, TUITION, AND PUBLIC UNIVERSITY OPERATING COSTS HOUSE FISCAL AGENCY: DECEMBER 2013 PAGE 11

you-go basis. Non-MPSERS employees at those universities and employees at other universities generally do not receive retirement health benefits.8 Enrollment changes: Generally, a university with growing enrollment can more easily restrain growth in operating costs on a per-student basis, as fixed overhead costs are spread across a larger base. Conversely, a university with declining enrollment will have more difficulty restraining per-student cost growth, as fixed costs are spread across a smaller base―at least until permanent reductions in overhead costs can be made. (On a related note, a university with growing enrollment naturally sees its state appropriations per student decline and its reliance on student tuition increase. The inverse is true for a university with declining enrollment. Michigan does not have a permanent formula for allocating base state funding to public universities, so appropriations are not automatically tied to enrollment levels.) While public universities have experienced enrollment growth as a whole over the last 15 to 20 years, that growth has varied across the universities. Several universities have experienced declines in student enrollment in recent years, often due in part to population loss in the surrounding area. Declining enrollment is likely to become a challenge for a larger number of universities over the next decade, given that the number of high school graduates in the state has begun declining due to demographic trends. The U.S. Department of Education has projected the number of public high school graduates in Michigan to decline from a peak of 115,183 in FY 2007-08 to 93,710 in FY 2020-21, a decline of about 19%.9 FY 2012-13 was the first year since FY 1994-95 that total FTE enrollment at the 15 public universities declined from the prior year. Total enrollment fell by 0.4%, as enrollment declined at 10 of the 15 universities.10 While a number of universities have increased out-of-state and international enrollments in recent years to help replace declining in-state enrollment, there is presumably a natural limit on that growth. The mix of full-time and part-time students at a university can also affect operating costs per FTE student, as some categories of costs (for example, student services) may correspond more closely to individual student headcount than to a full-time equated enrollment measure. Changes in program offerings: The cost of providing instruction varies widely across academic levels and program areas. A university that increases its graduate-level instruction or program offerings in higher-cost (and generally higher-demand) areas such as engineering or health professions will experience higher cost growth due to higher faculty compensation costs, smaller class sizes, and/or associated supplies and equipment. While the ratio of undergraduate-to-graduate enrollment across all public universities has been fairly steady over the last 10 to 15 years, a number of universities have increased offerings in higher-cost program areas.
8 For more information on university participation in MPSERS, see the HFA memorandum "Public Universities in the Michigan Public School Employees Retirement System": http://www.house.mi.gov/hfa/PDF/HigherEducation/mpsers_university_memo_apr2012.pdf. 9 Source - “Projections of Education Statistics to 2021”: http://nces.ed.gov/pubs2013/2013008.pdf. 10 The five exceptions were Michigan State, Oakland, and the three University of Michigan campuses. FISCAL FOCUS: STATE APPROPRIATIONS, TUITION, AND PUBLIC UNIVERSITY OPERATING COSTS PAGE 12 HOUSE FISCAL AGENCY: DECEMBER 2013

For example, from FY 2003-04 to FY 2011-12, the number of bachelor's degrees earned in health professions and related fields at the 15 universities doubled―increasing from 2,123 to 4,294―whereas the number of bachelor's degrees earned in education (a lower-cost program area) declined by about a third―from 4,661 to 3,001. Institutional financial aid: The universities all provide financial aid to students out of their own operating resources, supplementing aid provided by the federal and state governments. While this aid is accounted for as a university general fund expenditure, it effectively represents a discount to the posted tuition rate, rather than a true operating expenditure. From FY 2000-01 to FY 2012-13, general fund expenditures for financial aid per FTE student at the 15 universities more than doubled, increasing from $919 to $2,471. For a number of years (from FY 2005-06 to FY 2008-09, and in FY 2010-11), the annual Higher Education budget act included language specifically stating intent that universities increase general fund financial aid expenditures by at least the same percentage rate as they increased tuition rates. The degree to which universities target this aid based on financial need versus academic or other merit-based considerations varies considerably. In FY 2011-12, a majority of general fund expenditures for undergraduate financial aid were need-based at Michigan State, the University of Michigan-Ann Arbor, and the University of Michigan-Flint. The majority of such expenditures at the other 12 universities were merit-based. Growth in institutional financial aid expenditures accounts for roughly 22% of total growth in university operating revenues since FY 2000-01. Excluding the impact of institutional financial aid growth from the data displayed in Figure 4 would leave total growth in university operating revenues per student at roughly the level of HEPI growth (3.1% vs. 3.0% on an annualized basis).
An appendix to this report replicates Figure 4 and the associated table for each individual public university in Michigan. These charts are intended as a starting point for examination of university financial trends, with the cost factors listed above―and other geographic, institutional, and policy considerations―having varying impacts on both the starting level of expenditures per student and cost growth over time for each university.
FISCAL FOCUS: STATE APPROPRIATIONS, TUITION, AND PUBLIC UNIVERSITY OPERATING COSTS HOUSE FISCAL AGENCY: DECEMBER 2013 PAGE 13

The degree to which reductions in state appropriations have driven public university tuition increases since FY 2000-01 can only be assessed by setting a baseline for the appropriate level of overall university operating cost growth:
• With a baseline of operating cost increases matching consumer inflation, roughly 60% of cumulative tuition increases (after adjusting tuition rates for inflation) would be attributable to appropriation reductions.
• With a baseline of operating cost increases matching the Higher Education Price Index, roughly 80% of the cumulative tuition increases (after adjusting tuition rates for inflation) would be attributable to appropriation reductions.
• If increases in institutional financial aid are subtracted from university operating revenue increases, nearly all of the cumulative tuition increases would be attributable to appropriation reductions with the HEPI baseline.
Looking forward, increases in student tuition will continue to be directly tied to changes in state appropriations and changes in overall university operating costs. Given the high level of operational autonomy granted to Michigan's universities under the state constitution, the Legislature cannot directly dictate shifts in university operating policies and strategies. Instead, changes in operating costs will continue to be affected by broader policies included in the state Higher Education budget. Currently, there are two such major policies in place. First, the state has utilized a performance funding methodology to allocate appropriation increases to universities in the last two budget cycles (for the FY 2012-13 and FY 2013-14 budgets), with funding allocated based on metric data reported by the universities in prior years.
• Of the five performance funding metrics that have been utilized, one is clearly intended to reduce or restrain university costs: institutional support expenditures (that is, administrative costs) as a percentage of total expenditures.
• Conversely, two of the metrics arguably put upward pressure on university costs: undergraduate degree completions in generally higher-cost "critical skills" areas and research expenditures. (Universities that conduct more externally-funded research generally have higher faculty salaries.)
• The remaining two metrics are six-year graduate rate and total degree completions. Some strategies to improve student retention and degree completion, such as increased counseling services, could involve new expenditures by universities.11
Additionally, the Higher Education budget has included a tuition restraint policy for each of the last three years. (Prior to this, the last firm tuition restraint policy included in the budget was for FY
11 For more information on the performance funding calculations, see the HFA/SFA "Fiscal Year 2013-14 Higher Education Appropriations Report": http://www.house.mi.gov/hfa/PDF/HigherEducation/hiedrept_fy14.pdf.
CONCLUSION
FISCAL FOCUS: STATE APPROPRIATIONS, TUITION, AND PUBLIC UNIVERSITY OPERATING COSTS HOUSE FISCAL AGENCY: DECEMBER 2013 PAGE 15

2004-05.) In each case, varying amounts of state funding have been appropriated to universities contingent on holding tuition and fee increases for in-state undergraduate students below a certain threshold:
• For FY 2011-12, the limit was 7.1%, as university appropriations were reduced by 15.0% across the board.
• For FY 2012-13, the limit was 4.0%, as university appropriations were increased by 3.0%, with varying percentage increases for each university based on performance funding calculations and tuition increase levels.
• For FY 2013-14, the limit was 3.75%, as university appropriations were increased by 1.8%, with varying percentage increases for each university based on performance funding calculations.
With a single exception, all 15 universities have complied with the tuition restraint requirements in all three years.12 As compared to the situation 15 years ago, increases in tuition drive overall university operating revenue much more than the changes in state appropriations do. A 5% increase in tuition charges now yields nearly a 4% increase in total operating revenue, whereas a 5% increase in state appropriations would yield not much more than a 1% increase in total operating revenues. Stated differently, as tuition and fees have become a larger percentage of total operating revenues, the percentage increase in tuition charges needed to generate the same amount of revenue has naturally declined. Conversely, as state appropriations have declined, the percentage increase in those appropriations needed to generate the same amount of revenue has increased. If the state economy continues to grow steadily and the state provides at least inflationary increases in appropriation levels, that will have some positive effect on restraining tuition increases. To a large degree, however, student tuition levels will be driven mainly by university operating decisions and associated cost increases or savings, with declining enrollment levels putting upward pressure on per-student expenditure growth.
12 The single exception was Wayne State for FY 2013-14. For more information on the FY 2013-14 tuition restraint policy, see the HFA memorandum on "FY 2013-14 University Tuition Restraint Compliance": http://www.house.mi.gov/hfa/PDF/HigherEducation/TuitionRestraintMemo_%20fy14.pdf. FISCAL FOCUS: STATE APPROPRIATIONS, TUITION, AND PUBLIC UNIVERSITY OPERATING COSTS PAGE 16 HOUSE FISCAL AGENCY: DECEMBER 2013

Notes: (1) Data reflects appropriation and tuition revenue per FTE student accounting for all university
students, including both in-state and out-of-state students and both undergraduate and graduate students. Average tuition revenue per student for each university is, therefore, higher than the posted in-state undergraduate tuition rate.
(2) Numbers in report tables may not add due to rounding.
APPENDIX: UNIVERSITY-SPECIFIC CHARTS
FISCAL FOCUS: STATE APPROPRIATIONS, TUITION, AND PUBLIC UNIVERSITY OPERATING COSTS HOUSE FISCAL AGENCY: DECEMBER 2013 PAGE 17

Financial Information: Central Michigan University
FY 2000-01
Actual FY 2013-14
Projected $ Change Cumulative
% Change Annualized
% Change Revenue per FTE Student State Appropriation $4,351 $3,390 ($961) (22.1%) (1.9%) Tuition and Fees $4,237 $11,639 $7,402 174.7% 8.1% Total Operating Resources $8,588 $15,029 $6,440 75.0% 4.4% Inflation Benchmarks US CPI -- -- -- 34.4% 2.3% HEPI (through FY 2012-13) -- -- -- 42.7% 3.0%
Supplementary Information FY 2000-01
Actual FY 2012-13
Preliminary Amount/$ Change
Cumulative % Change
Annualized % Change
Total FTE Students 20,349 21,694 1,345 6.6% 0.5% GF Financial Aid Expenditures per FTE Student $401 $1,206 $805 200.7% 9.6%
$0
$5,000
$10,000
$15,000
$20,000
FY 2001 FY 2002 FY 2003 FY 2004 FY 2005 FY 2006 FY 2007 FY 2008 FY 2009 FY 2010 FY 2011 FY 2012 FY 2013Prelim
FY 2014Projected
Central Michigan University: Operating Resources per FTE Student
Appropriation per Student Tuition and Fees per Student FY 2001 Total Adjusted by CPI FY 2001 Total Adjusted by HEPI
FISCAL FOCUS: STATE APPROPRIATIONS, TUITION, AND PUBLIC UNIVERSITY OPERATING COSTS PAGE 18 HOUSE FISCAL AGENCY: DECEMBER 2013
[EMU chart goes here]
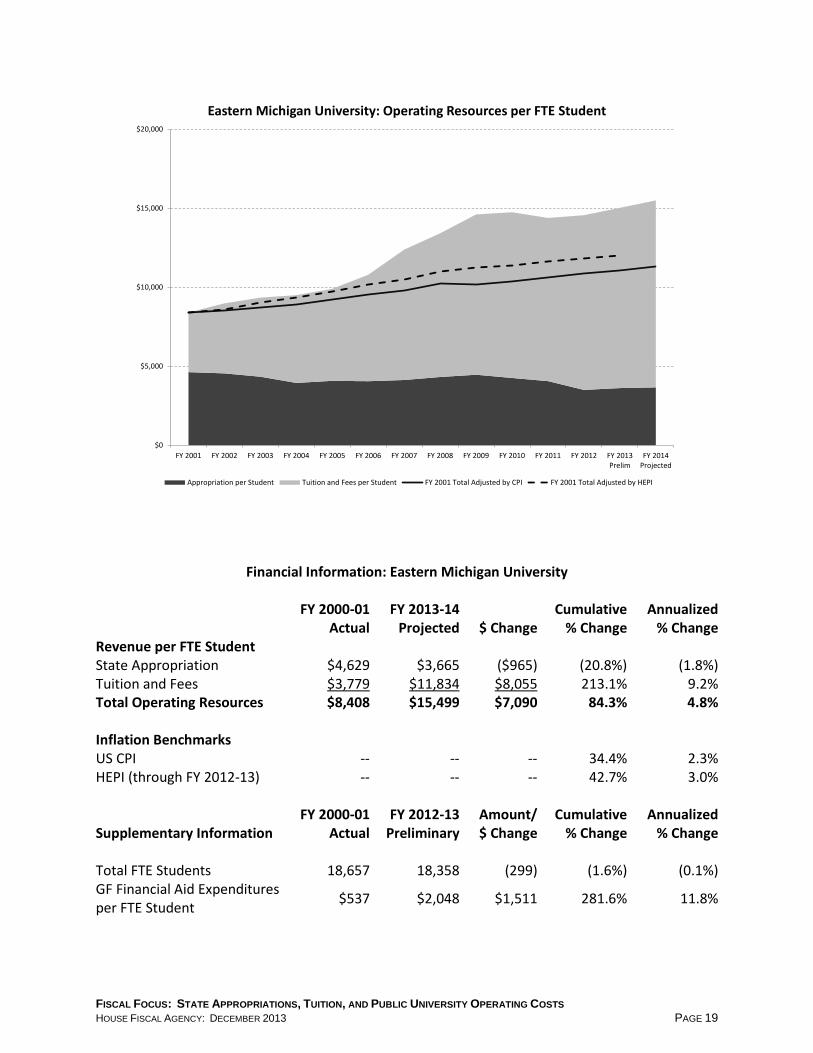
Financial Information: Eastern Michigan University
FY 2000-01
Actual FY 2013-14
Projected $ Change Cumulative
% Change Annualized
% Change Revenue per FTE Student State Appropriation $4,629 $3,665 ($965) (20.8%) (1.8%) Tuition and Fees $3,779 $11,834 $8,055 213.1% 9.2% Total Operating Resources $8,408 $15,499 $7,090 84.3% 4.8% Inflation Benchmarks US CPI -- -- -- 34.4% 2.3% HEPI (through FY 2012-13) -- -- -- 42.7% 3.0%
Supplementary Information FY 2000-01
Actual FY 2012-13
Preliminary Amount/$ Change
Cumulative % Change
Annualized % Change
Total FTE Students 18,657 18,358 (299) (1.6%) (0.1%) GF Financial Aid Expenditures per FTE Student $537 $2,048 $1,511 281.6% 11.8%
$0
$5,000
$10,000
$15,000
$20,000
FY 2001 FY 2002 FY 2003 FY 2004 FY 2005 FY 2006 FY 2007 FY 2008 FY 2009 FY 2010 FY 2011 FY 2012 FY 2013Prelim
FY 2014Projected
Eastern Michigan University: Operating Resources per FTE Student
Appropriation per Student Tuition and Fees per Student FY 2001 Total Adjusted by CPI FY 2001 Total Adjusted by HEPI
FISCAL FOCUS: STATE APPROPRIATIONS, TUITION, AND PUBLIC UNIVERSITY OPERATING COSTS HOUSE FISCAL AGENCY: DECEMBER 2013 PAGE 19

[FSU chart goes here]
Financial Information: Ferris State University
FY 2000-01
Actual FY 2013-14
Projected $ Change Cumulative
% Change Annualized
% Change Revenue per FTE Student State Appropriation $6,094 $3,739 ($2,355) (38.6%) (3.7%) Tuition and Fees $5,580 $12,133 $6,553 117.4% 6.2% Total Operating Resources $11,673 $15,872 $4,198 36.0% 2.4% Inflation Benchmarks US CPI -- -- -- 34.4% 2.3% HEPI (through FY 2012-13) -- -- -- 42.7% 3.0%
Supplementary Information FY 2000-01
Actual FY 2012-13
Preliminary Amount/$ Change
Cumulative % Change
Annualized % Change
Total FTE Students 8,979 12,206 3,227 35.9% 2.6% GF Financial Aid Expenditures per FTE Student $504 $1,512 $1,008 199.9% 9.6%
$0
$5,000
$10,000
$15,000
$20,000
FY 2001 FY 2002 FY 2003 FY 2004 FY 2005 FY 2006 FY 2007 FY 2008 FY 2009 FY 2010 FY 2011 FY 2012 FY 2013Prelim
FY 2014Projected
Ferris State University: Operating Resources per FTE Student
Appropriation per Student Tuition and Fees per Student FY 2001 Total Adjusted by CPI FY 2001 Total Adjusted by HEPI
FISCAL FOCUS: STATE APPROPRIATIONS, TUITION, AND PUBLIC UNIVERSITY OPERATING COSTS PAGE 20 HOUSE FISCAL AGENCY: DECEMBER 2013
[GVSU chart goes here]
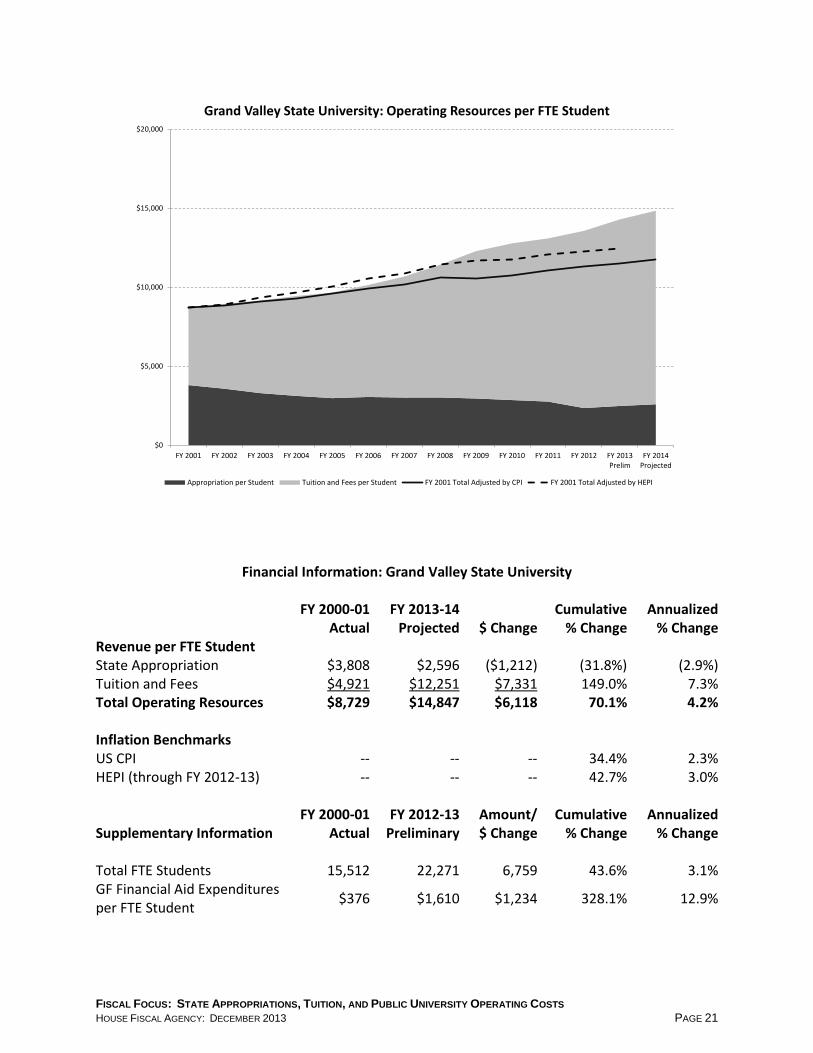
Financial Information: Grand Valley State University
FY 2000-01
Actual FY 2013-14
Projected $ Change Cumulative
% Change Annualized
% Change Revenue per FTE Student State Appropriation $3,808 $2,596 ($1,212) (31.8%) (2.9%) Tuition and Fees $4,921 $12,251 $7,331 149.0% 7.3% Total Operating Resources $8,729 $14,847 $6,118 70.1% 4.2% Inflation Benchmarks US CPI -- -- -- 34.4% 2.3% HEPI (through FY 2012-13) -- -- -- 42.7% 3.0%
Supplementary Information FY 2000-01
Actual FY 2012-13
Preliminary Amount/$ Change
Cumulative % Change
Annualized % Change
Total FTE Students 15,512 22,271 6,759 43.6% 3.1% GF Financial Aid Expenditures per FTE Student $376 $1,610 $1,234 328.1% 12.9%
$0
$5,000
$10,000
$15,000
$20,000
FY 2001 FY 2002 FY 2003 FY 2004 FY 2005 FY 2006 FY 2007 FY 2008 FY 2009 FY 2010 FY 2011 FY 2012 FY 2013Prelim
FY 2014Projected
Grand Valley State University: Operating Resources per FTE Student
Appropriation per Student Tuition and Fees per Student FY 2001 Total Adjusted by CPI FY 2001 Total Adjusted by HEPI
FISCAL FOCUS: STATE APPROPRIATIONS, TUITION, AND PUBLIC UNIVERSITY OPERATING COSTS HOUSE FISCAL AGENCY: DECEMBER 2013 PAGE 21
[LSSU chart goes here]
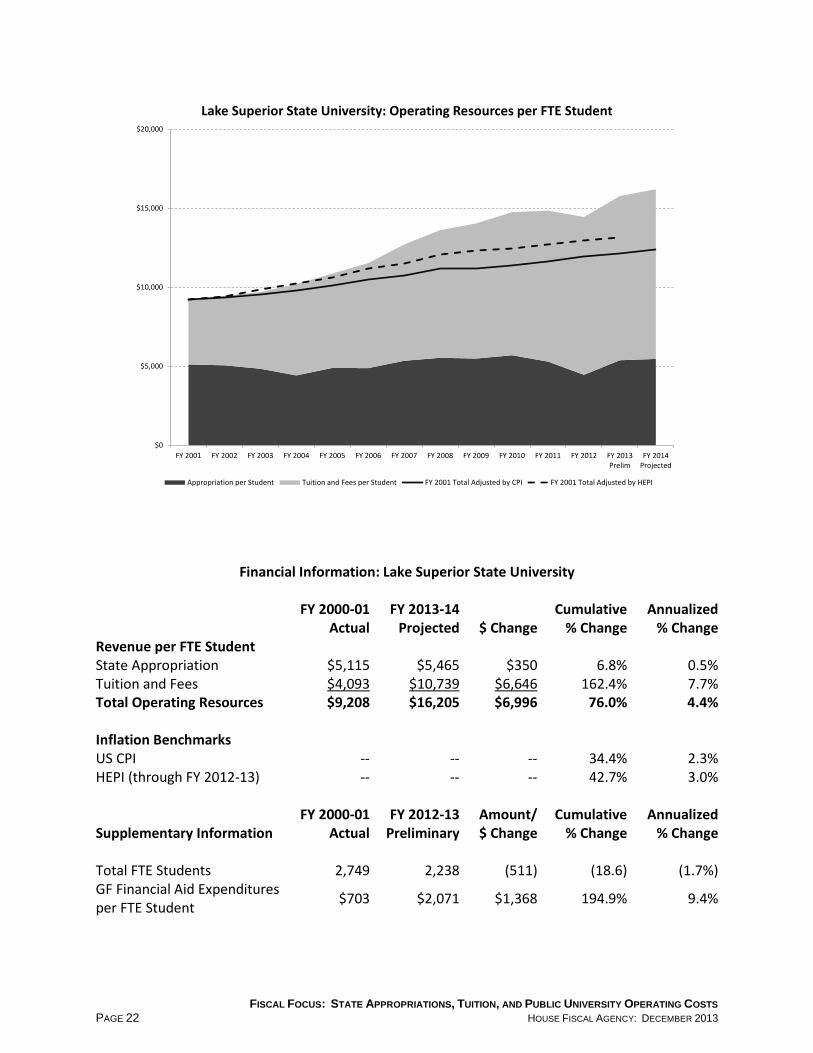
Financial Information: Lake Superior State University
FY 2000-01
Actual FY 2013-14
Projected $ Change Cumulative
% Change Annualized
% Change Revenue per FTE Student State Appropriation $5,115 $5,465 $350 6.8% 0.5% Tuition and Fees $4,093 $10,739 $6,646 162.4% 7.7% Total Operating Resources $9,208 $16,205 $6,996 76.0% 4.4% Inflation Benchmarks US CPI -- -- -- 34.4% 2.3% HEPI (through FY 2012-13) -- -- -- 42.7% 3.0%
Supplementary Information FY 2000-01
Actual FY 2012-13
Preliminary Amount/$ Change
Cumulative % Change
Annualized % Change
Total FTE Students 2,749 2,238 (511) (18.6) (1.7%) GF Financial Aid Expenditures per FTE Student $703 $2,071 $1,368 194.9% 9.4%
$0
$5,000
$10,000
$15,000
$20,000
FY 2001 FY 2002 FY 2003 FY 2004 FY 2005 FY 2006 FY 2007 FY 2008 FY 2009 FY 2010 FY 2011 FY 2012 FY 2013Prelim
FY 2014Projected
Lake Superior State University: Operating Resources per FTE Student
Appropriation per Student Tuition and Fees per Student FY 2001 Total Adjusted by CPI FY 2001 Total Adjusted by HEPI
FISCAL FOCUS: STATE APPROPRIATIONS, TUITION, AND PUBLIC UNIVERSITY OPERATING COSTS PAGE 22 HOUSE FISCAL AGENCY: DECEMBER 2013

[MSU chart goes here]
Financial Information: Michigan State University
FY 2000-01
Actual FY 2013-14
Projected $ Change Cumulative
% Change Annualized
% Change Revenue per FTE Student State Appropriation $8,017 $5,492 ($2,525) (31.5%) (2.9%) Tuition and Fees $6,392 $17,846 $11,453 179.2% 8.2% Total Operating Resources $14,409 $23,338 $8,929 62.0% 3.8% Inflation Benchmarks US CPI -- -- -- 34.4% 2.3% HEPI (through FY 2012-13) -- -- -- 42.7% 3.0%
Supplementary Information FY 2000-01
Actual FY 2012-13
Preliminary Amount/$ Change
Cumulative % Change
Annualized % Change
Total FTE Students 40,060 45,446 5,386 13.4% 1.1% GF Financial Aid Expenditures per FTE Student $734 $2,374 $1,640 223.4% 10.3%
$0
$5,000
$10,000
$15,000
$20,000
$25,000
FY 2001 FY 2002 FY 2003 FY 2004 FY 2005 FY 2006 FY 2007 FY 2008 FY 2009 FY 2010 FY 2011 FY 2012 FY 2013Prelim
FY 2014Projected
Michigan State University: Operating Resources per FTE Student
Appropriation per Student Tuition and Fees per Student FY 2001 Total Adjusted by CPI FY 2001 Total Adjusted by HEPI
FISCAL FOCUS: STATE APPROPRIATIONS, TUITION, AND PUBLIC UNIVERSITY OPERATING COSTS HOUSE FISCAL AGENCY: DECEMBER 2013 PAGE 23

[MTU chart goes here]
Financial Information: Michigan Tech University
FY 2000-01
Actual FY 2013-14
Projected $ Change Cumulative
% Change Annualized
% Change Revenue per FTE Student State Appropriation $9,248 $7,086 ($2,162) (23.4%) (2.0%) Tuition and Fees $6,760 $18,017 $11,257 166.5% 7.8% Total Operating Resources $16,008 $25,103 $9,095 56.8% 3.5% Inflation Benchmarks US CPI -- -- -- 34.4% 2.3% HEPI (through FY 2012-13) -- -- -- 42.7% 3.0%
Supplementary Information FY 2000-01
Actual FY 2012-13
Preliminary Amount/$ Change
Cumulative % Change
Annualized % Change
Total FTE Students 5,887 6,135 248 4.2% 0.3% GF Financial Aid Expenditures per FTE Student $1,801 $4,596 $2,795 155.2% 8.1%
$0
$5,000
$10,000
$15,000
$20,000
$25,000
$30,000
FY 2001 FY 2002 FY 2003 FY 2004 FY 2005 FY 2006 FY 2007 FY 2008 FY 2009 FY 2010 FY 2011 FY 2012 FY 2013Prelim
FY 2014Projected
Michigan Tech University: Operating Resources per FTE Student
Appropriation per Student Tuition and Fees per Student FY 2001 Total Adjusted by CPI FY 2001 Total Adjusted by HEPI
FISCAL FOCUS: STATE APPROPRIATIONS, TUITION, AND PUBLIC UNIVERSITY OPERATING COSTS PAGE 24 HOUSE FISCAL AGENCY: DECEMBER 2013
[NMU chart goes here]
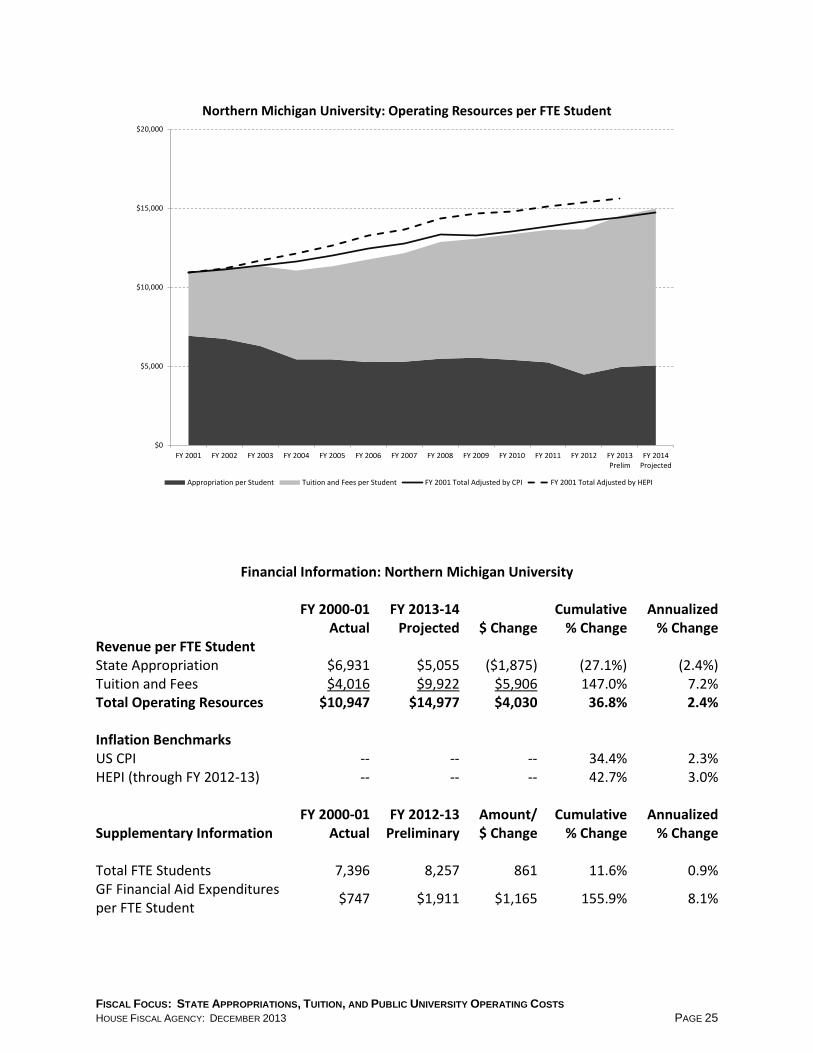
Financial Information: Northern Michigan University
FY 2000-01
Actual FY 2013-14
Projected $ Change Cumulative
% Change Annualized
% Change Revenue per FTE Student State Appropriation $6,931 $5,055 ($1,875) (27.1%) (2.4%) Tuition and Fees $4,016 $9,922 $5,906 147.0% 7.2% Total Operating Resources $10,947 $14,977 $4,030 36.8% 2.4% Inflation Benchmarks US CPI -- -- -- 34.4% 2.3% HEPI (through FY 2012-13) -- -- -- 42.7% 3.0%
Supplementary Information FY 2000-01
Actual FY 2012-13
Preliminary Amount/$ Change
Cumulative % Change
Annualized % Change
Total FTE Students 7,396 8,257 861 11.6% 0.9% GF Financial Aid Expenditures per FTE Student $747 $1,911 $1,165 155.9% 8.1%
$0
$5,000
$10,000
$15,000
$20,000
FY 2001 FY 2002 FY 2003 FY 2004 FY 2005 FY 2006 FY 2007 FY 2008 FY 2009 FY 2010 FY 2011 FY 2012 FY 2013Prelim
FY 2014Projected
Northern Michigan University: Operating Resources per FTE Student
Appropriation per Student Tuition and Fees per Student FY 2001 Total Adjusted by CPI FY 2001 Total Adjusted by HEPI
FISCAL FOCUS: STATE APPROPRIATIONS, TUITION, AND PUBLIC UNIVERSITY OPERATING COSTS HOUSE FISCAL AGENCY: DECEMBER 2013 PAGE 25

[OU chart goes here]
Financial Information: Oakland University
FY 2000-01
Actual FY 2013-14
Projected $ Change Cumulative
% Change Annualized
% Change Revenue per FTE Student State Appropriation $4,305 $2,734 ($1,571) (36.5%) (3.4%) Tuition and Fees $4,744 $12,309 $7,565 159.5% 7.6% Total Operating Resources $9,049 $15,043 $5,993 66.2% 4.0% Inflation Benchmarks US CPI -- -- -- 34.4% 2.3% HEPI (through FY 2012-13) -- -- -- 42.7% 3.0%
Supplementary Information FY 2000-01
Actual FY 2012-13
Preliminary Amount/$ Change
Cumulative % Change
Annualized % Change
Total FTE Students 11,970 16,699 4,729 39.5% 2.8% GF Financial Aid Expenditures per FTE Student $457 $1,803 $1,346 294.6% 12.1%
$0
$5,000
$10,000
$15,000
$20,000
FY 2001 FY 2002 FY 2003 FY 2004 FY 2005 FY 2006 FY 2007 FY 2008 FY 2009 FY 2010 FY 2011 FY 2012 FY 2013Prelim
FY 2014Projected
Oakland University: Operating Resources per FTE Student
Appropriation per Student Tuition and Fees per Student FY 2001 Total Adjusted by CPI FY 2001 Total Adjusted by HEPI
FISCAL FOCUS: STATE APPROPRIATIONS, TUITION, AND PUBLIC UNIVERSITY OPERATING COSTS PAGE 26 HOUSE FISCAL AGENCY: DECEMBER 2013

[SVSU chart goes here]
Financial Information: Saginaw Valley State University
FY 2000-01
Actual FY 2013-14
Projected $ Change Cumulative
% Change Annualized
% Change Revenue per FTE Student State Appropriation $4,063 $2,880 ($1,183) (29.1%) (2.6%) Tuition and Fees $3,923 $9,956 $6,033 153.8% 7.4% Total Operating Resources $7,986 $12,836 $4,850 60.7% 3.7% Inflation Benchmarks US CPI -- -- -- 34.4% 2.3% HEPI (through FY 2012-13) -- -- -- 42.7% 3.0%
Supplementary Information FY 2000-01
Actual FY 2012-13
Preliminary Amount/$ Change
Cumulative % Change
Annualized % Change
Total FTE Students 6,632 9,025 2,393 36.1% 2.6% GF Financial Aid Expenditures per FTE Student $460 $1,318 $858 186.3% 9.2%
$0
$5,000
$10,000
$15,000
$20,000
FY 2001 FY 2002 FY 2003 FY 2004 FY 2005 FY 2006 FY 2007 FY 2008 FY 2009 FY 2010 FY 2011 FY 2012 FY 2013Prelim
FY 2014Projected
Saginaw Valley State University: Operating Resources per FTE Student
Appropriation per Student Tuition and Fees per Student FY 2001 Total Adjusted by CPI FY 2001 Total Adjusted by HEPI
FISCAL FOCUS: STATE APPROPRIATIONS, TUITION, AND PUBLIC UNIVERSITY OPERATING COSTS HOUSE FISCAL AGENCY: DECEMBER 2013 PAGE 27
[UM-AA chart goes here]
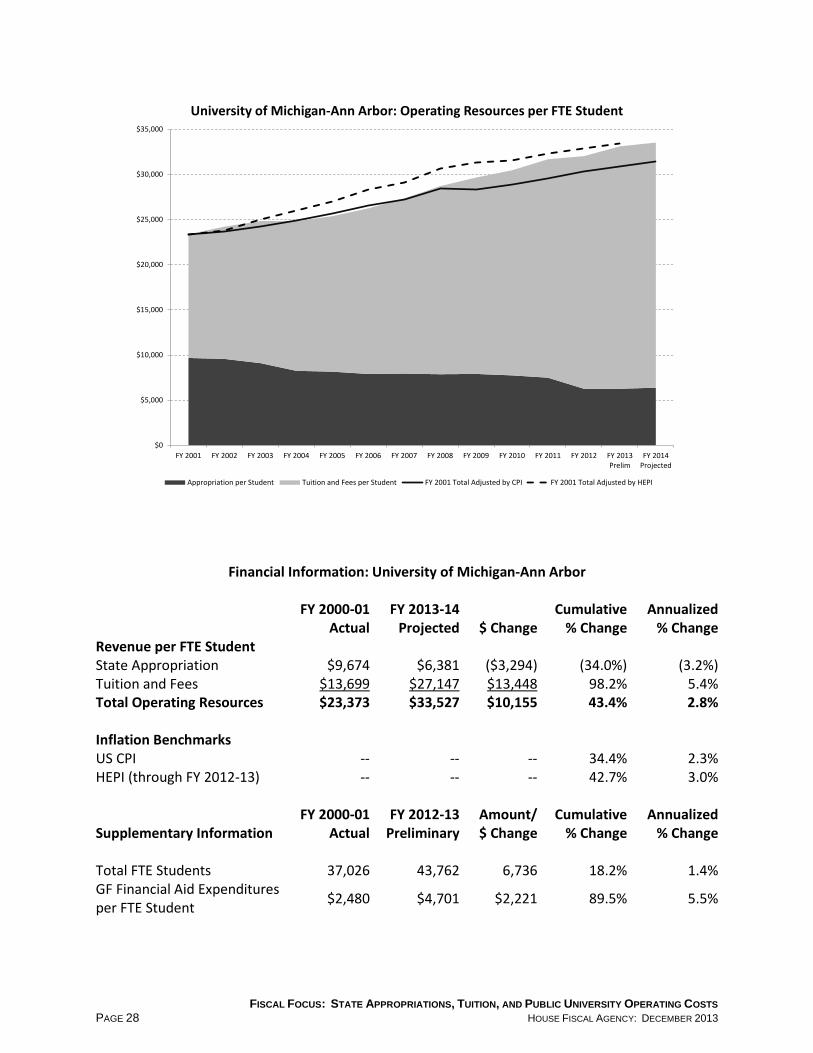
Financial Information: University of Michigan-Ann Arbor
FY 2000-01
Actual FY 2013-14
Projected $ Change Cumulative
% Change Annualized
% Change Revenue per FTE Student State Appropriation $9,674 $6,381 ($3,294) (34.0%) (3.2%) Tuition and Fees $13,699 $27,147 $13,448 98.2% 5.4% Total Operating Resources $23,373 $33,527 $10,155 43.4% 2.8% Inflation Benchmarks US CPI -- -- -- 34.4% 2.3% HEPI (through FY 2012-13) -- -- -- 42.7% 3.0%
Supplementary Information FY 2000-01
Actual FY 2012-13
Preliminary Amount/$ Change
Cumulative % Change
Annualized % Change
Total FTE Students 37,026 43,762 6,736 18.2% 1.4% GF Financial Aid Expenditures per FTE Student $2,480 $4,701 $2,221 89.5% 5.5%
$0
$5,000
$10,000
$15,000
$20,000
$25,000
$30,000
$35,000
FY 2001 FY 2002 FY 2003 FY 2004 FY 2005 FY 2006 FY 2007 FY 2008 FY 2009 FY 2010 FY 2011 FY 2012 FY 2013Prelim
FY 2014Projected
University of Michigan-Ann Arbor: Operating Resources per FTE Student
Appropriation per Student Tuition and Fees per Student FY 2001 Total Adjusted by CPI FY 2001 Total Adjusted by HEPI
FISCAL FOCUS: STATE APPROPRIATIONS, TUITION, AND PUBLIC UNIVERSITY OPERATING COSTS PAGE 28 HOUSE FISCAL AGENCY: DECEMBER 2013

[UM-D chart goes here]
Financial Information: University of Michigan-Dearborn
FY 2000-01
Actual FY 2013-14
Projected $ Change Cumulative
% Change Annualized
% Change Revenue per FTE Student State Appropriation $4,617 $3,366 ($1,251) (27.1%) (2.4%) Tuition and Fees $5,952 $14,498 $8,546 143.6% 7.1% Total Operating Resources $10,569 $17,865 $7,295 69.0% 4.1% Inflation Benchmarks US CPI -- -- -- 34.4% 2.3% HEPI (through FY 2012-13) -- -- -- 42.7% 3.0%
Supplementary Information FY 2000-01
Actual FY 2012-13
Preliminary Amount/$ Change
Cumulative % Change
Annualized % Change
Total FTE Students 5,973 6,687 714 12.0% 0.9% GF Financial Aid Expenditures per FTE Student $372 $1,729 $1,356 364.2% 13.6%
$0
$5,000
$10,000
$15,000
$20,000
FY 2001 FY 2002 FY 2003 FY 2004 FY 2005 FY 2006 FY 2007 FY 2008 FY 2009 FY 2010 FY 2011 FY 2012 FY 2013Prelim
FY 2014Projected
University of Michigan-Dearborn: Operating Resources per FTE Student
Appropriation per Student Tuition and Fees per Student FY 2001 Total Adjusted by CPI FY 2001 Total Adjusted by HEPI
FISCAL FOCUS: STATE APPROPRIATIONS, TUITION, AND PUBLIC UNIVERSITY OPERATING COSTS HOUSE FISCAL AGENCY: DECEMBER 2013 PAGE 29

[UM-F chart goes here]
Financial Information: University of Michigan-Flint
FY 2000-01
Actual FY 2013-14
Projected $ Change Cumulative
% Change Annualized
% Change Revenue per FTE Student State Appropriation $4,788 $2,949 ($1,838) (38.4%) (3.7%) Tuition and Fees $4,849 $12,372 $7,523 155.1% 7.5% Total Operating Resources $9,637 $15,322 $5,684 59.0% 3.6% Inflation Benchmarks US CPI -- -- -- 34.4% 2.3% HEPI (through FY 2012-13) -- -- -- 42.7% 3.0%
Supplementary Information FY 2000-01
Actual FY 2012-13
Preliminary Amount/$ Change
Cumulative % Change
Annualized % Change
Total FTE Students 4,954 6,760 1,806 36.5% 2.6% GF Financial Aid Expenditures per FTE Student $454 $934 $479 105.4% 6.2%
$0
$5,000
$10,000
$15,000
$20,000
FY 2001 FY 2002 FY 2003 FY 2004 FY 2005 FY 2006 FY 2007 FY 2008 FY 2009 FY 2010 FY 2011 FY 2012 FY 2013Prelim
FY 2014Projected
University of Michigan-Flint: Operating Resources per FTE Student
Appropriation per Student Tuition and Fees per Student FY 2001 Total Adjusted by CPI FY 2001 Total Adjusted by HEPI
FISCAL FOCUS: STATE APPROPRIATIONS, TUITION, AND PUBLIC UNIVERSITY OPERATING COSTS PAGE 30 HOUSE FISCAL AGENCY: DECEMBER 2013

[WSU chart goes here]
Financial Information: Wayne State University
FY 2000-01
Actual FY 2013-14
Projected $ Change Cumulative
% Change Annualized
% Change Revenue per FTE Student State Appropriation $10,958 $7,871 ($3,087) (28.2%) (2.5%) Tuition and Fees $4,827 $14,914 $10,088 209.0% 9.1% Total Operating Resources $15,785 $22,785 $7,000 44.3% 2.9% Inflation Benchmarks US CPI -- -- -- 34.4% 2.3% HEPI (through FY 2012-13) -- -- -- 42.7% 3.0%
Supplementary Information FY 2000-01
Actual FY 2012-13
Preliminary Amount/$ Change
Cumulative % Change
Annualized % Change
Total FTE Students 22,811 23,301 490 2.1% 0.2% GF Financial Aid Expenditures per FTE Student $678 $2,638 $1,960 289.1% 12.0%
$0
$5,000
$10,000
$15,000
$20,000
$25,000
FY 2001 FY 2002 FY 2003 FY 2004 FY 2005 FY 2006 FY 2007 FY 2008 FY 2009 FY 2010 FY 2011 FY 2012 FY 2013Prelim
FY 2014Projected
Wayne State University: Operating Resources per FTE Student
Appropriation per Student Tuition and Fees per Student FY 2001 Total Adjusted by CPI FY 2001 Total Adjusted by HEPI
FISCAL FOCUS: STATE APPROPRIATIONS, TUITION, AND PUBLIC UNIVERSITY OPERATING COSTS HOUSE FISCAL AGENCY: DECEMBER 2013 PAGE 31
[WMU chart goes here]
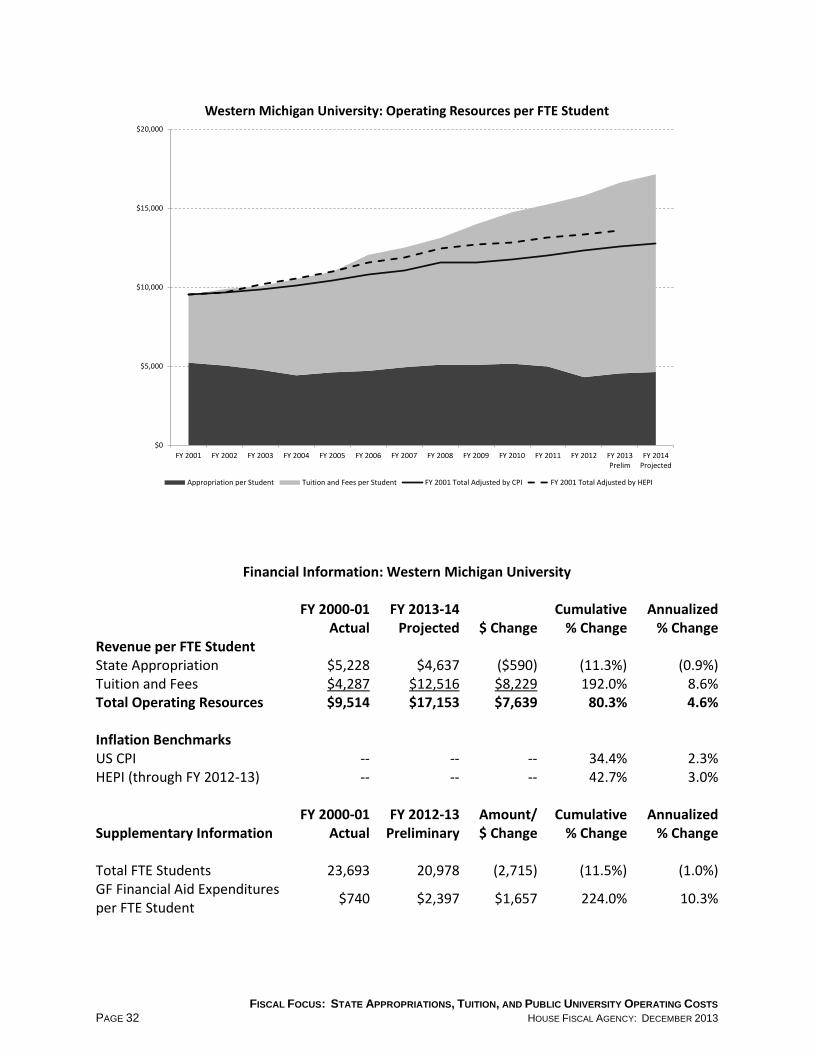
Financial Information: Western Michigan University
FY 2000-01
Actual FY 2013-14
Projected $ Change Cumulative
% Change Annualized
% Change Revenue per FTE Student State Appropriation $5,228 $4,637 ($590) (11.3%) (0.9%) Tuition and Fees $4,287 $12,516 $8,229 192.0% 8.6% Total Operating Resources $9,514 $17,153 $7,639 80.3% 4.6% Inflation Benchmarks US CPI -- -- -- 34.4% 2.3% HEPI (through FY 2012-13) -- -- -- 42.7% 3.0%
Supplementary Information FY 2000-01
Actual FY 2012-13
Preliminary Amount/$ Change
Cumulative % Change
Annualized % Change
Total FTE Students 23,693 20,978 (2,715) (11.5%) (1.0%) GF Financial Aid Expenditures per FTE Student $740 $2,397 $1,657 224.0% 10.3%
$0
$5,000
$10,000
$15,000
$20,000
FY 2001 FY 2002 FY 2003 FY 2004 FY 2005 FY 2006 FY 2007 FY 2008 FY 2009 FY 2010 FY 2011 FY 2012 FY 2013Prelim
FY 2014Projected
Western Michigan University: Operating Resources per FTE Student
Appropriation per Student Tuition and Fees per Student FY 2001 Total Adjusted by CPI FY 2001 Total Adjusted by HEPI
FISCAL FOCUS: STATE APPROPRIATIONS, TUITION, AND PUBLIC UNIVERSITY OPERATING COSTS PAGE 32 HOUSE FISCAL AGENCY: DECEMBER 2013
Mary Ann Cleary, Director
Kyle I. Jen, Deputy Director
517.373.8080 Agriculture and Rural Development .................................................................................................... Paul Holland Capital Outlay ................................................................................................................................ Benjamin Gielczyk Community Colleges .......................................................................................................................Marilyn Peterson Community Health: Mental Health/Substance Abuse ................................................................................................ Margaret Alston Public Health/Aging/Medicaid-Backup ............................................................................................. Susan Frey Medicaid/Children's Special Health Care Services ............................................... Steve Stauff; Matt Ellsworth Corrections ..........................................................................................................................................Robin R. Risko Education (Department) ......................................................................................................................Karen Shapiro Environmental Quality ....................................................................................................................... Viola Bay Wild General Government: Attorney General/Civil Rights/State/ Technology, Management, and Budget ..................................................................................Marilyn Peterson Executive Office/Legislature/Legislative Auditor General/ Lottery/Michigan Strategic Fund/Treasury ........................................................................... Benjamin Gielczyk Higher Education ....................................................................................................................................... Kyle I. Jen Human Services (Department) .......................................................................................................... Kevin Koorstra Insurance and Financial Services ........................................................................................................ Paul Holland Judiciary ..............................................................................................................................................Robin R. Risko Licensing and Regulatory Affairs ........................................................................................................ Paul Holland Military and Veterans Affairs .................................................................................................................... Mark Wolf Natural Resources .............................................................................................................................. Viola Bay Wild School Aid .............................................................................................................. Bethany Wicksall; Karen Shapiro State Police ................................................................................................................................................ Mark Wolf Transportation ............................................................................................................................ William E. Hamilton Economic and Revenue Forecast/State and Local Finance/ Tax Analysis .............................................................................................................. Jim Stansell; Adam Desrosiers Legislative Analysis ............................................................................................................................... Chris Couch Edith Best, Joan Hunault, Jeff Stoutenburg, Sue Stutzky Fiscal Oversight, Audit, and Litigation .......................................................................................... Mary Ann Cleary Legislative Transfers ........................................................................................................................ Margaret Alston Retirement .................................................................................................................... Bethany Wicksall; Kyle I. Jen Revenue Sharing/EVIP ........................................................................................... Jim Stansell; Benjamin Gielczyk Supplementals ........................................................................................................................................... Kyle I. Jen Administrative Assistant ................................................................................................................ Kathryn Bateson Budget Assistant /HFA Internet ........................................................................................................... Tumai Burris Front Desk Coordinator ....................................................................................................................... Katie Eitniear December 2013

P.O. Box 30014 Lansing, MI 48909-7514 (517) 373-8080 FAX (517) 373-5874
www.house.mi.gov/hfa