fiscal policies to address air pollution from road
TRANSCRIPT

Fiscal policies to address air pollution from road transport in cities and improve health:
Insights from country experiences and lessons for Indonesia
Working Paper
December 2019
r 2019

2
Cover photo credits: Arran Smith as published on Unsplash
________________________________________ Copyright © United Nations Environment Programme, 2019 This publication may be reproduced in whole or in part and in any form for educational or non-profit purposes without special permission from the copyright holder, provided acknowledgement of the source is made. The United Nations Environment Programme would appreciate receiving a copy of any publication that uses this publication as a source. No use of this publication may be made for resale or for any other commercial purpose whatsoever without prior permission in writing from the United Nations Environment Programme. Disclaimer The designations employed and the presentation of the material in this publication do not imply the expression of any opinion whatsoever on the part of the United Nations Environment Programme concerning the legal status of any country, territory, city or area or of its authorities, or concerning delimitation of its frontiers or boundaries. Moreover, the views expressed do not necessarily represent the decision or the stated policy of the United Nations Environment Programme, nor does citing of trade names or commercial processes constitute endorsement.
3
Acknowledgements This study was undertaken in the context of a United Nations Environment Programme (UNEP) project on Environment, Health and Pollution as well as a project on Enhancing Knowledge and Capacity for Inclusive Green Economies. This study was prepared by a team of researchers. Kai Schlegelmilch of Green Budget Germany was the overall lead for the study. Jacqueline Cottrell of Green Budget Germany led the development of policy recommendations and coordinated inputs of all authors. Anja Rosenberg of the Energy Community Secretariat was responsible for estimating the impacts of measures. Verena Streitferdt and Maya Virdayanti Anggraini of Pertiwi-Consulting, Aditya Mahalana an independent consultant in Indonesia, Budi Haryanto of the University of Indonesia, and Ahmad Safrudin of KPBB were responsible for analyzing data, delivering policy analysis, conducting interviews and stakeholder consultations. The study was led and carried out by Joy Kim, Senior Economic Affairs Officer at the Economy Division of UNEP, under the overall supervision of Steven Stone, Chief of the Resources and Markets Branch of the Economy Division of UNEP. Administrative support was provided by Rahila Somra, Fatma Pandey and Desiree Leon. The authors gratefully acknowledge the insightful comments and contribution of experts and participants at a stakeholder workshop including: Dr Adi Budiarso, Eka Hendra Permana and Angustin Samosir from the Fiscal Policy Office, Ministry of Finance of Indonesia (BKF); Ms Fitri, Mr Agung, Ms Ambar and Sri Mulyati from the Environmental Protection Agency of DKI Jakarta Province; Barlev Nico Marhehe from UNEP; Ririn Kusuma from the Vital Strategies Programme; Mega Kunue from the International Council on Clean transportation (ICCT); Stkvura Azurar and Dr Ir. Sylvira Ananda Azwar from the Indonesian Environmental Scientists Association; and Mr Yuniar from the Transport Agency of Jakarta Special Region. In addition, the authors would like to thank KPBB for providing their facilities for meetings and the stakeholder workshop. The authors gratefully acknowledge the contribution of UNEP reviewers for their invaluable comments and support to the development of the study including Sirini Withana, Bert Fabian, Barlev Nico Marhehe, Maria Katherina Patdu, Teodora Cakarmis and Himanshu Sharma. The layout and design of the report and the bibliography was prepared by Rouven Stubbe of Green Budget Germany. The study was undertaken in the context of a UNEP-led project on Environment, Health and Pollution which seeks to provide the needed understanding, capacities and tools to help countries and stakeholders take effective action to address pollution. As part of this project, a series of studies have been carried out which explore the effective use of fiscal policies for pollution reduction. These fiscal studies contribute to the Implementation Plan ‘Towards a pollution-free planet’ adopted at the Third UN Environment Assembly (UNEA-3) which identifies stimulating good practices through fiscal policy as an accelerator for implementation.

4
Table of Contents
List of figures ................................................................................................................................... 8
List of tables..................................................................................................................................... 9
List of Abbreviations ...................................................................................................................... 10
Executive Summary ....................................................................................................................... 13
1. Introduction ........................................................................................................................... 20
1.1. Background ......................................................................................................................... 20
1.2. The role of green fiscal policy in achieving emissions reductions from the transport sector ................................................................................................................................................... 23
1.3. Indonesia and DKI Jakarta as a case study to investigate opportunities for fiscal policy measures to curb air pollution .................................................................................................. 24
1.3.1. Regulatory framework for air pollution ................................................................... 24
1.3.2. Fiscal situation ......................................................................................................... 25
1.3.3. Growing public awareness ....................................................................................... 25
1.4. Objectives of the study .................................................................................................. 26
1.5. Methodology ................................................................................................................. 27
1.6. Structure ........................................................................................................................ 27
2. Key Trends, Costs and Challenges of Air Pollution ................................................................ 29
2.1 Introduction ......................................................................................................................... 29
2.1.1. Air pollution ................................................................................................................. 29
2.1.2. Air pollutant monitoring in Indonesia ......................................................................... 30
Air pollutant monitoring stations in Indonesia .............................................................. 30
2.1.3. Publicly available data ................................................................................................. 30
2.1.4. Overview of data used for the review ......................................................................... 32
The GAINS Model ................................................................................................................... 32
Monitoring Stations in DKI Jakarta ........................................................................................ 33
2.2. Air pollutants in Indonesia .................................................................................................. 35
2.3. Overview of air pollution in DKI Jakarta ............................................................................. 37
2.4. Costs of air pollution .......................................................................................................... 41
2.4.1. Explanation of health impacts attributable to the pollutants ..................................... 41
2.4.2. Bottom up health cost assessment in Jakarta ............................................................. 43
2.4.3 Sources of air pollution and hotspots .......................................................................... 47
2.5. Conclusions ......................................................................................................................... 50

5
3. Analysis of policy framework for air pollution ...................................................................... 52
3.1. Existing and planned policies to address air pollution from transport in Indonesia and Jakarta ....................................................................................................................................... 52
3.1.1. Regulations in Indonesia ............................................................................................. 52
3.1.2. Regulations in DKI Jakarta ....................................................................................... 60
3.1.3. Summary of the regulatory overview .......................................................................... 63
3.2. Recommendations and reflections on the existing policy framework ............................... 64
3.2.1. Updating standards across different government agencies ....................................... 64
3.2.2. Limited enforcement of emission standards from transport ...................................... 64
3.3. Jakarta’s budget: revenues and expenditure related to transport and air pollution......... 65
3.4. Analysis of existing policy measures for road transport and their impact on air pollution 68
3.4.1. Traffic restriction measures ......................................................................................... 68
3.4.2. Odd-Even policy ........................................................................................................... 69
3.4.3. Fiscal policies to encourage greater use of public transport ...................................... 71
3.4.4. Fuel Tax ........................................................................................................................ 71
3.4.5. Fuel pricing policies and fossil fuel subsidy reform from 2015 ................................... 72
3.4.6. Support for Electric vehicles ........................................................................................ 73
3.4.7. Green car rebate scheme (Low Cost Green Car/ LCGC Programme) .......................... 75
3.5. Challenges and recommendations for specific measures to reduce air pollution in Jakarta ................................................................................................................................................... 76
3.6. Conclusions ......................................................................................................................... 78
4. International best practice: Potential fiscal policy reform options ........................................... 79
4.1. Introduction: fiscal policy design and complementary measures ...................................... 79
4.2. Fuel taxes ............................................................................................................................ 79
4.2.1. Excise duties on transport fuels .................................................................................. 79
4.2.2. Carbon taxes on transport fuels .................................................................................. 81
4.2.3. Differentiated taxes to encourage take-up of cleaner fuels ....................................... 83
4.3. Differentiated vehicle registration charges and feebates in Europe and South East Asia, including measures targeting motorcycles ............................................................................... 84
4.3.1. Two European models: French feebate and Norwegian vehicle registration charges 84
4.3.2. Vehicle registration taxes in South East Asia, including measures targeting motorcycles ........................................................................................................................... 86
4.4. Different forms of congestion charging, including electronic road pricing ........................ 88
4.4.1. Congestion charging in Stockholm and London .......................................................... 88
4.4.2. Low-emissions zones in Germany: an honour system with enforcement penalties ... 89

6
4.5. Subsidising cleaner transport ............................................................................................. 90
4.5.1. Subsidies for public transport: examples from India and the UK ................................ 90
4.5.2. Demand-side policies subsidizing a transit-oriented city in Seoul .............................. 91
4.5.3. Grants and subsidies to promote cleaner motorcycles and three-wheelers .............. 92
4.5.4. Subsidies to promote alternative fuels ....................................................................... 92
4.5.5. Scrappage schemes: China and Beijing ....................................................................... 93
4.5.6. Scrappage schemes for trucks in Mexico .................................................................... 94
4.6. Road tolls to incentivise modal shift from road to rail and shipping ................................. 94
4.7. Lessons for Jakarta ............................................................................................................. 95
5. Policy reform options to reduce emissions harmful to human health in Jakarta ................. 97
5.1. Proposals at the national level ...................................................................................... 98
5.1.1. Differentiated excise duties on oil imports and domestically produced fuels on the basis of sulphur content ........................................................................................................ 98
5.1.2. Removal of price regulations and other fossil fuel subsidy mechanisms .............. 101
5.1.3. Carbon taxation of transport fuels ........................................................................ 102
5.1.4 HDV tolls to raise revenue to fund measures to incentivize shift from road freight . 105
5.2. Proposals at the national and/or municipal level ....................................................... 107
5.2.1. Vehicle ownership tax differentiated by vehicle emissions .................................. 107
5.2.2. Scrappage schemes for heavy duty freight vehicles .............................................. 111
5.3. Proposals at the municipal level .................................................................................. 112
5.3.1. Electronic road pricing ........................................................................................... 113
5.3.2. Low-tech congestion charging scheme for road vehicles in DKI Jakarta ............... 113
5.3.3. Increase Motorized Vehicle Fuel Tax differentiated by fuel type under Act 28/2009 116
5.3.4. Allocation of free public transport tickets for poor households ........................... 120
5.3.5. Reform annual motorized vehicle tax in Jakarta (PKB) to differentiate on the basis of harmful emissions ........................................................................................................... 121
5.3.6. Subsidies for the installation of CNG conversion kits and particulate filters for diesel freight vehicles and diesel ......................................................................................... 122
5.3.7. Subsidies for electrification of public transport .................................................... 122
6. Conclusions: Policy options and the way forward ............................................................... 124
6.1. Summary of key findings and proposed policy reform package ................................. 124
6.2. Challenges to the reform package and how they can be overcome ........................... 130
6.2.1. Lack of robust data on air pollution in Jakarta ...................................................... 130
6.2.3. Addressing the trade-off between air quality and fiscal policy goals.................... 131
7
6.2.4. Revenue allocation between national and provincial government ...................... 132
6.2.5. Earmarking of revenue .......................................................................................... 133
6.2.6. Overlapping and outdated regulations result in poor enforcement ..................... 133
6.2.7. Politicization of fuel prices ..................................................................................... 134
6.3. Policy synergies from a national and international perspective ................................. 135
6.4. Further work and follow-up activities ......................................................................... 136
Annexes ....................................................................................................................................... 138
Annex I. Methodology for calculation of policy impacts ..................................................... 138
Annex II. Tables ..................................................................................................................... 145
Annex III. Strategic Regional Activity (KSD) Jakarta (as of July 2019) .................................... 152
Annex IV. Legal instruments hierarchy .................................................................................. 153
ANNEX V. List of roundtable participants 06.09.2019 ........................................................... 154
7. Bibliography ......................................................................................................................... 155

8
List of figures Figure 1: Ambient Level of PM2.5 in Asia in 2015 .......................................................................................... 20 Figure 2: The SDGs and their relevance to air pollution ............................................................................... 22 Figure 3: Environmental gains from removing fossil fuel subsidies ............................................................. 22 Figure 4: MoEF website display on the Air Pollutant Standard Index (ISPU) Information ........................... 30 Figure 5: AQM stations in DKI Jakarta maintained by the BPLHD and MoEF ............................................... 33 Figure 6: PM2.5 concentration in Indonesia compared to the WHO Standards ............................................ 35 Figure 7: National Trend development of PM10 emissions from road transport ......................................... 36 Figure 8: National Trend analysis form CO2 emissions from Road Transport .............................................. 36 Figure 9: Regional Haze Situation on 23 September 2019 ........................................................................... 37 Figure 10: Real-time status of Indonesia air quality index (AQI) and PM2.5 air pollution ............................. 37 Figure 11: Comparison of Pollutant Concentrations in Jakarta recording in 2013 Data with WHO guidelines
and NAAQS Standards (annual emissions) .......................................................................................... 38 Figure 12: Air pollutant trends in DKI Jakarta (Breathe Easy Jakarta, p. 131) .............................................. 39 Figure 13: Trend analysis of PM 2.5 pollutant in DKI Jakarta 2015-2017 ..................................................... 40 Figure 14: Trend analysis of SO2 pollutant in DKI Jakarta 2015-2017 .......................................................... 41 Figure 15: Air quality index Jakarta trend 2012-2017 .................................................................................. 41 Figure 16: Mortality, morbidity and welfare cost from exposure to ambient particulate matter in Indonesia
............................................................................................................................................................. 43 Figure 17: Estimated costs of illness on diseases related to air pollution in Jakarta 2010 (in IDR) .............. 45 Figure 18: Growth of PM2.5 emissions in Jakarta over the same time period using GAINS model ............. 47 Figure 19: PM10 total emissions Jakarta, likely trend of PM10 until 2030 based on estimation .................... 47 Figure 20: Trends in the motor vehicle fleet in Indonesia (KPBB 2019) ....................................................... 48 Figure 21: SO2 total emissions and percentage shares for the Greater Jakarta region ................................ 48 Figure 22: PM10 emissions form road transport in DKI Jakarta .................................................................... 49 Figure 23: CO2 emissions from road transport ............................................................................................. 49 Figure 24: Total Gridded PM10 emissions over the Greater Jakarta Region ................................................. 50 Figure 25: The odd-even road segments (ASEAN games recommendation)................................................ 70 Figure 26: Total car sales and total sales of Low-Cost Green Cars in Indonesia 2013-2019......................... 76 Figure 27: Sales of petroleum fuels subject to the carbon tax ..................................................................... 82 Figure 28: PM 2.5 emissions in most polluted Norwegian cities .................................................................. 85 Figure 29: Air pollution levels in Seoul 1989-2012 ....................................................................................... 92 Figure 30: Potential retail price increase and consumption decrease under Sulphur Excise Duty .............. 99 Figure 31: Impact of proposed Carbon Tax scheme on fuel prices and energy consumption ................... 104 Figure 32: Vehicle taxation in Indonesia up to the point of purchase........................................................ 107 Figure 33: Development of total gasoline and diesel consumption and retail prices under BAU and
proposed Motorized Vehicle Fuel Tax Scheme 2008-2022 ............................................................... 117 Figure 34: Impact of proposed Motorized Fuel Duty on fuel prices and energy consumption .................. 118 Figure 35: Realised and targeted government revenues from the existing Motorized Vehicle Fuel Duty
scheme/ PBB-KB in relation to gasoline and diesel retail prices between 2013-2019 ...................... 119 Figure 36: Realised and estimated local tax revenues from the fuel duty between 2019-2022 (in billion
IDR) .................................................................................................................................................... 119 Figure 37: Share of transport related local tax revenues of total local tax revenues between 2013-2019
(billion IDR) ........................................................................................................................................ 120 Figure 38: Crude oil price, gasoline retail price and energy subsidy in Indonesia 2008-2018 ................... 138

9
List of tables Table 1: Summary of fiscal policy measures proposed including timeline for implementation .................. 15 Table 2: Overview of sources of air pollutants ............................................................................................. 29 Table 3: Air Quality Monitoring Stations in Indonesia .................................................................................. 30 Table 4: Overview of available data on air pollutants in Indonesia and DKI Jakarta .................................... 31 Table 5: Programs related to Air Pollution in Jakarta ................................................................................... 32 Table 6: Air Quality Monitoring Sites in DKI Jakarta ..................................................................................... 34 Table 7: Impacts on human health from major air pollutants ..................................................................... 42 Table 8: Incidence of diseases related to air pollution ................................................................................. 44 Table 9: Overview of studies that estimate the costs of diseases related to air pollution in Jakarta (in
million IDR) for the years 1990, 2001, 2010 and 2015 ........................................................................ 46 Table 10: List of Existing National Laws, Regulations, and Plans .................................................................. 53 Table 11: List of municipal regulations relevant to air pollution .................................................................. 60 Table 12: DKI Jakarta’s revenue and expenditure related to air pollution ................................................... 66 Table 13: Actual (2010) and projected (2010) travel demand in Jabodetabek ............................................ 69 Table 14: Projected Share of Conventional ICE, LCGC and Low Carbon Emission Vehicles (LCEV) Cars,
Motorcycle and Electric Motorcycles .................................................................................................. 75 Table 155: Registration taxes on vehicles in Norway ................................................................................... 85 Table 166: Incentives by vehicle type ........................................................................................................... 94 Table 17: Most used road transport fuels used in Indonesia and their sulphur content 2018 .................... 99 Table 18: Proposed carbon tax rates 2020-2030 ........................................................................................ 103 Table 190: Vehicle ownership tax differentiated by emissions: possible structure and rates ................... 109 Table 20: Proposed fee structure for the congestion charging scheme ..................................................... 114 Table 21: Proposed fuel tax escalator 2020-2022 ...................................................................................... 116 Table 22: Minimum and maximum estimated local tax revenues from the fuel duty in DKI Jakarta between
2020-2022 .......................................................................................................................................... 119 Table 23: Number of MRT or LRT tickets that could be subsidized from the increase in government
revenues from the proposed Motorized Vehicle Fuel Duty scheme 2020-2022 ............................... 121 Table 24: Fiscal policy recommendations ................................................................................................... 126 Table 25: Detailed Transport Sector Fuel Retail Prices per Fuel Type in 2018 ........................................... 139 Table 26: Emission and conversion factors ................................................................................................ 140 Table 27: Development of transport sector fuel consumption (thousands of litres) in Indonesia 2019-2031
(BAU scenario) ................................................................................................................................... 141 Table 28: Comparison of WHO and National Air Quality Standards .......................................................... 145 Table 29: Types of legislation in Indonesia referred to in this study .......................................................... 146 Table 30: KSD for Environment and Transport ........................................................................................... 147 Table 31: Potential retail price increase and consumption decrease under Sulphur Excise Duty ............. 149 Table 32: Impact of proposed Carbon Tax scheme on fuel prices and energy consumption..................... 150 Table 33: Impact of proposed Motorized Fuel Duty on fuel prices and energy consumption ................... 151 Table 34: The fleet in Jakarta 2012-2016 ................................................................................................... 151

10
List of Abbreviations
ADB Asian Development Bank
APBD Anggaran Pendapatan, dan Belanja Daerah (Regional Government Budget- Revenues and Expenditures)
APBN Anggaran Pendapatan dan Belanja Negara (National Government Budget- Revenues and Expenditures)
APEC Asia-Pacific Economic Cooperation
ASEAN Association of South East Asian Nations
AQMS Air Quality Monitoring Stations
BAU Business As Usual
BPTJ Badan Pengelola Transportasi Jabodetabek (Greater Jakarta Board)
BKF Badan Kebijakan Fiscal (Fiscal Policy Office)
BLHD Badan Lingkungan Hidup Daerah (Local Environment Agency)
BMKG Badan Meteorologi, Klimatologi, dan Geofisika (Meteorology, Climate and Geophysics Agency)
BPLH Environmental Management Board of Jakarta
BPPT Indonesian Agency for the Assessment and Application of Technology
BRT Bus Rapid Transit
CLS Citizen’s Lawsuit
CO Carbon Monoxide
CO2 Carbon Dioxide
COI Cost of Illness
Dishub Dinas Hubungan (Transport agency)
DKI Daerah Khusus Ibu Kota (Special capital city – Jakarta)

11
DLH Dinas LIngkungan Hidup (Environment Agency)
EPA Environmental Protection and Management
ERP Electronic Road Pricing
ESCO Energy Service Company
EU European Union
EV Electric Vehicle
GAIKINDO Gabungan Industri Kendaraan Bermotor Indonesia / The Association of Indonesia Automotive Industries
GFP Green Fiscal Policy
GHG Greenhouse Gas
GIZ German International Development Cooperation
IIASA International Institute for Applied Systems Analysis (IIASA)
ICE Internal Combustion Engine
IDR Indonesian Rupiah
ITB Institute Technology Bandung
JORR Jakarta Outer Ring Road
JUTPI Jabodetabek Urban Transport Policy Integration
KPBB Komite Panghapusan Bensin Bertimbel – Clean Air Indonesia (NGO campaigning to tackle air pollution)
KSD Kegiatan Strategis Daerah - Regional Strategic Activity
LCGC Low Cost Green Car
LCEV Low Carbon Emission Vehicles
LRT Light Rail Transport System
MEMR Ministry of Energy and Mineral Resources
MoEF Ministry of Environment and Forestry

12
MoT Ministry of Transport
MRT Mass Rapid Transport System
NAAQS National Ambient Air Quality Standard of Indonesia
NDC Nationally Determined Contribution
NMHC Non-Methane Hydrocarbons
NOx Nitrogen Oxides
Pergub Peraturan Gubernur (Governeur Regulation)
PMDA Pemerintah Daerah – Local Government
PM Particulate Matter
PP Peraturan Pemerintah (Government Regulation)
RCCCC -UI Research Center for Climate Change at the University of Indonesia
RUEN Rencana Umum Energi Nasional (National Energy Plan)
SO2 Sulphur Dioxide
SPM Suspended Particulate Matter
SDGs Sustainable Development Goals
THC Total Hydrocarbons
TSP Total Suspended Particulate
UNICEF United Nations International Children's Emergency Fund
UNIDO United Nations Industrial Development Organisation
USA United States of America
USAID United States Agency for Development
USD United States Dollars
UU Undang-Undang (Act, Law)
WHO World Health Organisation

13
Executive Summary Context There is growing awareness of the negative health impacts of air pollution caused by road transport in many emerging economies such as Indonesia. Governments face increasing pressure to limit harmful pollution and improve air quality in line with their commitments including under the Sustainable Development Goals (SDGs). For example, in Jakarta, a 2018 citizen’s lawsuit against the provincial and national government contended that policymakers were denying citizens the right to breathe healthy air in line with air quality standards. These developments create a window of opportunity for policy action to reduce harmful emissions. In response, many countries and cities have taken steps to mitigate the negative impacts of transport emissions on human health using various complementary measures including fiscal policy instruments. Policymakers are also exploring ways to exploit synergies between measures to mitigate greenhouse gas emissions and reduce emissions harmful to human health. In Jakarta, some steps have been taken to reduce harmful emissions from transport, but success has been limited to date. The potential for a comprehensive and far-reaching package of measures—including fiscal policies—to bring about tangible health benefits remains untapped. Against this background, this study aims to support recent efforts of the Indonesian and DKI Jakarta government to reduce air pollution. It analyses the impact of harmful pollution from the transport sector on human health in Jakarta. Reflecting on the current policy framework and challenges faced by policymakers in DKI Jakarta and drawing on international best practice, it proposes a package of green fiscal policy measures with the potential to reduce harmful emissions in the city and deliver human health benefits. Most of the proposed measures also have the potential to bring about commensurate reductions in greenhouse gas emissions as they set out to reduce private vehicle use, encourage modal shift to public transport, enhance fuel efficiency and the uptake of low-emissions vehicles. Given the similarity of the air pollution challenges faced by many cities, especially in emerging economies, the findings of the study have a wider application and many of the proposed fiscal policy measures have the potential to deliver health benefits in similar cities in South East Asia and beyond. Current framework conditions and policy landscape in Indonesia and Jakarta Since the 1990s, emissions harmful to human health in Jakarta have been rising rapidly (RCCC UI 2019). This trend is predicted to continue in the future. In 2017, Jakarta’s citizens were exposed to polluted air, expected to have severe health impacts for 69 days in total. They were also exposed to polluted air expected to have moderate health impacts for 194 days (KPBB 2018). The primary source of these pollutants is the transport sector, followed by dust from roads and industrial emissions. The rising pollution from the transport sector is a major cause of escalating health costs in the city, which increased by 250 percent between 1990 and 2010. In 2010, 58 percent of Jakarta’s citizens were suffering from air pollution-related diseases, with health costs amounting to IDR 38.5 trillion/US$ 54 billion in that year (World Bank and Institute for Health Metrics and Evaluation 2016). Although data measuring continuous pollutant emissions is difficult to access, levels of Particulate Matter (PM) damaging to human health are on the rise, especially due to increases in transport emissions. In Indonesia, PM2.5 emissions continuously exceed WHO guidelines and National Air Ambient Quality Standards (OECD 2019d) while PM10 and CO2 emissions from transport have been rapidly increasing since 1990 (RCCC_UI 2019). Measurements from five air pollution stations indicate that on an annual basis, O3
14
exceeds national and WHO guideline standards (Breathe Easy Jakarta 2017). Seasonal pollution spikes from open burning practices are also common. In Indonesia, the framework for the control and management of air pollution is provided by the Environment Management Act 41/1999 which mandates the Ministry of Environment and Forestry (MoEF) to issue air pollution standards and monitor whether these standards are met. However, so far, the enforcement of stringent standards and effective monitoring remain challenging due to overlaps of authority and a lack of resources. Several regulations overlap, are inconsistent, or require updating to reflect international standards and guidelines, while others are poorly enforced. A range of green fiscal policies could also be introduced under Law 32/2009, including motor vehicle taxes (including the luxury tax on vehicle purchase, fees for transfer of ownership, and the progressive vehicle tax) and taxes on transport fuels. Some fiscal policies have already been implemented such as the Low-Cost Green Car programme. However, to date, these have not achieved the magnitude of emission reductions required to bring about improvements to human health. Insights from international best practices Several countries, provinces and cities are already using fiscal policy instruments as part of their approach to tackling air pollution from the transport sector. These experiences provide some useful insights and lessons for Jakarta and Indonesia. This study discusses the following international examples:
▪ Fuel taxes including fuel excises (UK and Germany), carbon tax (British Columbia) and differentiated excise on cleaner fuels (Thailand) (section 4.2)
▪ Vehicle registration charges in France, Norway and Thailand, including motorcycles (section 4.3) ▪ Congestion charging (Stockholm and London) and low-emission zones based on honour systems
(Germany) (section 4.4) ▪ Subsidies for cleaner transport (Seoul) and electric buses (India and London), grants for cleaner
motorcycles and three-wheelers (Philippines), subsidies to promote alternative fuels (Thailand) and scrappage subsidy schemes (Beijing, China and Mexico) (section 4.5), and
▪ Road tolls to incentivise modal shift in the freight sector (Germany) (section 4.6). Insights from these international best practices suggest that a complementary package of measures containing both revenue-raising instruments and spending / subsidy policies, alongside soft instruments such as labelling and information, and regulations including vehicle standards, is the most effective approach to address harmful emissions from the transport sector. Main findings and recommendations on fiscal policy measures to address pollution in Indonesia and Jakarta Based on international best practice experiences and lessons learned, the study sets out several policy measures with the potential to reduce harmful emissions in the short-, medium- and long-term, some at the national level, and some at the provincial level. First, this study proposes various ways in which Law 32/2009 can be better used to improve existing fiscal incentives for the reduction of harmful emissions. Reviewing Law 32/2009 alongside Government Regulation 46/2017 could also enable the development of specific new green fiscal policy measures to reduce air pollution at national and provincial level. Greening the system of budget transfers from national to provincial government is yet another way to
15
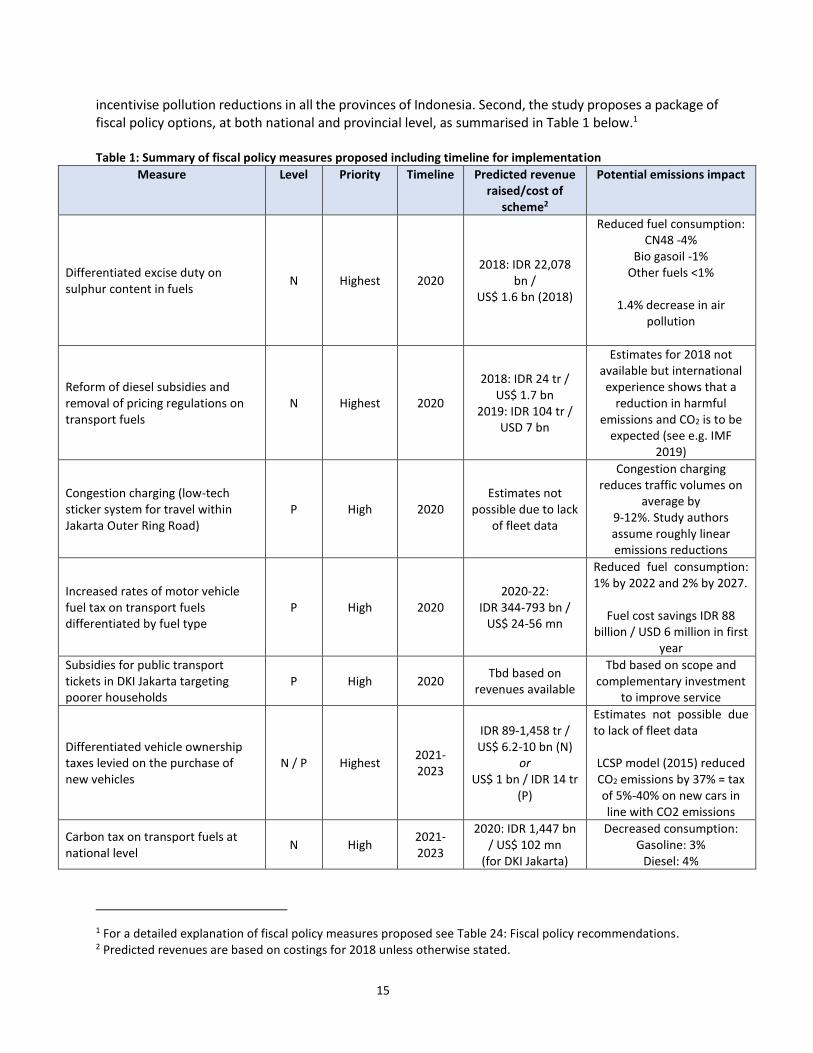
incentivise pollution reductions in all the provinces of Indonesia. Second, the study proposes a package of fiscal policy options, at both national and provincial level, as summarised in Table 1 below.1 Table 1: Summary of fiscal policy measures proposed including timeline for implementation
Measure Level Priority Timeline Predicted revenue raised/cost of
scheme2
Potential emissions impact
Differentiated excise duty on sulphur content in fuels
N Highest 2020 2018: IDR 22,078
bn / US$ 1.6 bn (2018)
Reduced fuel consumption: CN48 -4%
Bio gasoil -1% Other fuels <1%
1.4% decrease in air
pollution
Reform of diesel subsidies and removal of pricing regulations on transport fuels
N Highest 2020
2018: IDR 24 tr / US$ 1.7 bn
2019: IDR 104 tr / USD 7 bn
Estimates for 2018 not available but international experience shows that a
reduction in harmful emissions and CO2 is to be
expected (see e.g. IMF 2019)
Congestion charging (low-tech sticker system for travel within Jakarta Outer Ring Road)
P High 2020 Estimates not
possible due to lack of fleet data
Congestion charging reduces traffic volumes on
average by 9-12%. Study authors assume roughly linear emissions reductions
Increased rates of motor vehicle fuel tax on transport fuels differentiated by fuel type
P High 2020 2020-22:
IDR 344-793 bn / US$ 24-56 mn
Reduced fuel consumption: 1% by 2022 and 2% by 2027.
Fuel cost savings IDR 88 billion / USD 6 million in first
year
Subsidies for public transport tickets in DKI Jakarta targeting poorer households
P High 2020 Tbd based on
revenues available
Tbd based on scope and complementary investment
to improve service
Differentiated vehicle ownership taxes levied on the purchase of new vehicles
N / P Highest 2021-2023
IDR 89-1,458 tr / US$ 6.2-10 bn (N)
or US$ 1 bn / IDR 14 tr
(P)
Estimates not possible due to lack of fleet data LCSP model (2015) reduced CO2 emissions by 37% = tax of 5%-40% on new cars in line with CO2 emissions
Carbon tax on transport fuels at national level
N High 2021-2023
2020: IDR 1,447 bn / US$ 102 mn
(for DKI Jakarta)
Decreased consumption: Gasoline: 3%
Diesel: 4%
1 For a detailed explanation of fiscal policy measures proposed see Table 24: Fiscal policy recommendations. 2 Predicted revenues are based on costings for 2018 unless otherwise stated.

16
2020: IDR 23,550 bn /
US$ 1,663 mn (N)
CNG: 4% (compared to BAU by 2031). Longer term
impacts up to 7% less than BAU.
Subsidies for CNG conversion kits and particulate filters in HDVs
P High 2021-2023
1% take up would cost IDR 268 bn /
US$ 19 mn
Estimate not possible given lack of data on freight
vehicles
Subsidies for electric buses and charging infrastructure
P Medium 2021-2025
Dependent on revenue available (medium priority)
30% increase in electric buses would reduce harmful
pollution by 30%
Scrappage scheme for heavy duty vehicles
P Medium 2021-2025
Annual uptake 1%: IDR 149 bn / US$
10.5 mn
Emissions reductions per HDV scrapped:
NOx 78% CO 88% PM 95%
The immediate implementation of differentiated sulphur excise duty at national level is proposed as a measure of the highest priority. Differentiated fuel duty tends to be extremely effective in bringing about changes in behaviour and supporting the phase-out of harmful fuels. The lack of availability of diesel fuel of a sufficiently high quality for Euro IV vehicles is undermining potential human health improvements resulting from the introduction of the Euro IV standard – an issue that can easily be addressed by speeding up the transition to low-sulphur fuel. The impact of emissions from high-sulphur diesel on human health are very significant. In its first year, the measure is predicted to bring about health cost savings of at least IDR 258 million / US$ 19 million. In the first year of the measure being implemented, it would raise IDR 22,078 billion / US$ 1.6 billion – more than enough revenue to fund the upgrading of all domestic refineries, estimated in 2016 to amount to roughly US$ 0.6 billion (CCAC 2016). This would enable low-sulphur diesel to be produced domestically and high-sulphur diesel to be phased out, with sufficient revenue remaining for compensating poorer households. To maximise the impact of this measure and free up additional revenue, the diesel price subsidy should also be discontinued in 2020. The potentially negative social impacts of both measures can be addressed by drawing on positive experiences since 2015 with the redistribution of subsidy revenue, which can be reallocated for sustainable public investment in health, education and public transport infrastructure among others. In Jakarta, as an intermediate step on the way to electronic road pricing, it is proposed that a low-tech congestion charging scheme be implemented as soon as possible. This would entail differentiated charges for all vehicles entering the centre of Jakarta based on harmful emissions volumes – with electric vehicles exempt – based on an honour system, requiring that all vehicles display an appropriate and non-transferable sticker. The scheme proposed is low-tech and could be implemented in a relatively short timeframe. It would encourage modal shift to public transport and has the potential to reduce traffic volumes and congestion in the city centre, and thus harmful emissions. Once electronic road pricing, which is more targeted and responsive to actual traffic flows, is running effectively, the congestion charging scheme should be phased out. It is proposed that revenue from the scheme should be used to subsidise public transport tickets to compensate poorer households and support public transport improvements in the city. The study proposes that the provincial government takes steps to gradually increase fuel prices over upcoming years. Act 28/2009 permits provinces to tax transport fuels by up to 10 percent of the sales price. This would be easy to implement administratively and would tie in with an existing revenue collection mechanism. The only necessary change, to enable the tax increase, is to lift the current 5

17
percent cap on the tax rate set by the 2014 Presidential Decree. The study also proposes that this measure be complemented by a national carbon tax on transport fuels introduced at a rate of US$ 10/tCO2e and increased to a rate of USD 20/tCO2e within 10 years. Potential negative social and distributional impacts, resulting from fuel price increases, are expected to be limited as the transport fuel tax has a progressive character—taxing more those that use greater amounts of transport fuel, which tend to be populations in higher income brackets. Household income of vulnerable groups can be insulated from direct and indirect price effects of the fuel tax increase by drawing on the Indonesian experience of fossil fuel subsidy reform in 2015, where saved revenues were used for pro-poor investment in health, education and infrastructure. The study proposes differentiated vehicle ownership taxes levied on the purchase of new vehicles. One component of the tax could be based on emissions harmful to human health, and a further component on CO2 emissions, with high-emitting vehicles subject to a higher rate. This approach could be implemented at either national or provincial level, although at national level, the potential to raise revenue would be considerably higher. A differentiated tax has the potential to transform the vehicle fleet within a few years. This measure should be implemented as soon as possible, although due to its complex nature and the need to better understand the current vehicle fleet in Indonesia and Jakarta, this measure is probably only feasible in the medium term. Given the differentiated tax rates proposed between motorcycles and cars, whether implemented at national or provincial level, these measures are expected to be broadly progressive. Proposals to step up the distribution of free public transport tickets and to increase investment in public transport networks using revenues raised by additional green fiscal policies in the transport sector will ensure that negative social impacts are kept to a minimum. Electric vehicles (EVs) would also be incentivised through the differentiated vehicle ownership tax, as they would be immune to both tax components. It should be noted that subsidies or tax exemptions for EV ownership cater to wealthier income deciles with the resources to purchase expensive EVs. In addition, for the widespread deployment of electric vehicles to bring about substantial reductions in harmful emissions nationally, it is essential that renewable energy deployment be accelerated. To avoid exporting pollution outside the city boundaries of Jakarta, it is essential that the country shifts away from its current high dependence on coal in the energy mix, which results in harmful pollutant emissions and proven negative health impacts (Greenpeace 2015). The subsidies proposed alongside these revenue-raising measures have been designed to mitigate equity concerns arising from the proposed green fiscal measures and to continue to drive reductions in harmful emissions. In the first instance, additional revenues raised should be used to subsidise the transition to cleaner fuels, and invested in education, health and infrastructure – like the approach adopted when fossil fuel subsidies were reformed in Indonesia in 2015. Equity concerns should also be addressed by distributing free or subsidised public transport tickets. Subsidy measures proposed in the medium terms set out to prevent job losses or bankruptcies of SMEs in the freight sector in the face of tighter emissions requirements and to subsidise the conversion of heavy-duty freight vehicles to CNG or retrofitting to install particulate filters. Subsidies for e-buses and scrappage fees for freight vehicles to reduce harmful emissions from heavy duty vehicles are also proposed. Implementation challenges and possible solutions Implementing these proposals would face several challenges. In particular, the lack of continuous and transparent monitoring and reporting of air pollution data remains a major challenge. In addition, data and research available in the public domain on transport policies tends to refer to GHG emissions reductions, rather than emissions harmful to human health. As a result, understanding and estimating the

18
human health impacts of fiscal policies in the transport sector can be challenging for policymakers. A detailed, publicly available, consolidated regular reporting system for pollution concentrations would help to inform evidence-based policymaking. This study aims to take steps towards addressing these shortcomings by collating the positive health impacts of fiscal policy measures in the transport sector. A robust pollution reporting system would facilitate a review of fiscal policies’ effectiveness in protecting Jakarta’s citizens from negative health impacts. It could also incorporate warning mechanisms if concentrations exceeded guideline values. A further challenge is posed by the potential conflict between fiscal and human-health related policy goals. The primary sources of revenue for the Jakarta government are taxes, fees and charges on motorised transport. If fiscal policies foster a preference for fuel-efficient vehicles liable for lower rates of registration and ownership tax, this will result – in the medium term at least – in reduced revenues. There are several ways in which this conflict can be addressed. For example, fiscal policy design can incorporate gradual tax rate increases to stabilise revenues, including regular reviews to keep policymakers in the loop on policy impacts and revenue streams and inform subsequent revisions as necessary. Revenue allocation between national and provincial government can also act as an obstacle to green taxation at a provincial level. Whether or not provincial governments will receive additional revenue from the central government, even if they increase green taxation, remains unclear. This could discourage policymakers at the provincial level from risking political criticism for the implementation of fiscal measures, particularly if they are unable to use revenues to mitigate social impacts or compensate private stakeholders. Efforts should be made to ensure that this problem is addressed when the intergovernmental system of fiscal transfers under Act No. 32/ 2009 and Government Regulation No. 46/ 2017 is amended to reflect ecological considerations in 2020. Political will is likely to prove the single most significant obstacle to implementation of the green fiscal policies set out in this study. Many of the measures will result in higher prices for transport fuels and for individual mobility. Tackling the root cause of this politicisation is the only way to address this challenge. Fossil fuel subsidy reform and increases in fuel prices should be planned carefully and accompanied by structural changes to ensure that higher spending on welfare continues but is more accurately targeted to those in need. Prices should be adjusted gradually or timed to coincide with falling global oil prices to alleviate the impact of price increases. In the medium term, the goal of policymakers should be to abolish price regulation mechanisms, so that fuel prices fluctuate in line with the global oil price and are no longer a function of political decision-making. As in 2015, consensus building within ministries and amongst the general public will be vital to lock in sustainable fiscal reform. As proposed in this study, revenues from fiscal policy instruments can be used to invest in public transport and transport infrastructure to facilitate modal shift to public transport and freight rail and shipping. Earmarking revenues for such uses can mitigate potential negative social impacts, reduce opposition and build public support for the reform. A concerted effort to communicate the rationale underlying fiscal policy measures is also vital in this context to build support among the wider public. The co-benefits are numerous—reductions in health-related costs; better health outcomes; better air quality in Jakarta; reduced congestion; shorter journey times; and availability of additional revenues for continuous improvement to the transport system. Communication strategies should emphasise these benefits and educate the public on the costs associated with poor ambient air quality and its impacts on human health. Such a strategy would feed into the current wave of increasing awareness of the negative impacts of air pollution on health amongst Jakarta’s population and help build the case for using fiscal policy instruments to address air pollution.

19
The way forward Given current awareness and pressure from civil society to address the negative health impacts of air pollution, there is a window of opportunity for decisive policy action to reduce harmful emissions from the transport sector. Fiscal policy instruments provide a cost-effective and efficient tool to reduce harmful emissions and deliver human health benefits. Priority fiscal policy options which could be considered by policymakers in DKI Jakarta and Indonesia include the introduction of differentiated sulphur duties, vehicle registration taxes and the introduction of a congestion charging scheme in Jakarta. Capacity building could support the implementation of these proposed measures. At the same time, to create momentum for implementing such fiscal policies, stakeholder engagement processes could be supported by the creation of two inter-ministerial working groups: one at a high level, to bring together decision-makers to foster the exchange of policy perspectives and the exploration of possible approaches to air pollution from the transport sector (and beyond), as well as a working level group to support the high-level group by conducting background research and developing concrete proposals upon request. This could be complemented by an establishment of a green fiscal and public health commission, at the national or provincial level in DKI Jakarta, working across ministries and stakeholders to create the necessary momentum to implement the policy measures recommended in this study and consequently bring about economic and health benefits for the citizens of DKI Jakarta and Indonesia.

20
1. Introduction
1.1. Background Urban power generation and rapid growth in private motor vehicle ownership are driving air pollution levels in low- and middle-income cities to critical levels. According to the WHO air quality database, 97% of cities in low- and middle- income countries do not meet WHO air quality guidelines (WHO 2018a). As a result, air pollution is having a serious and growing impact on human health. Exposure to fine particles in air, polluted by vehicle emissions and other sources, is causing a range of respiratory and cardiovascular diseases including stroke, heart disease, lung cancer, chronic obstructive pulmonary disease and respiratory infections, including pneumonia (WHO 2018b; UNEP and WHO 2009). In 2016, indoor and outdoor air pollution combined were responsible for an estimated 7 million deaths worldwide – a very significant increase from the estimated 800,000 deaths caused by exposure to air pollution in the year 2000, nearly two-thirds of which were in Asian developing countries (WHO 2018c; WHO 2002). Today, it is estimated that global health costs related to air pollution amount to US$ 98 billion or 3.5 percent of global GDP (OECD 2019). Air pollution also has additional economic impacts, such as labour productivity losses, crop yield losses, and ecosystem damages; already in 2013, global welfare costs associated with air pollution were estimated at US$5.11 trillion (World Bank 2016). As can be seen in Figure 1, air pollution in Asia is reaching critical levels. The figure shows average concentrations of fine particulate matter PM2.5 as the index of measurement. PM2.5 has been recognized as one of the most health damaging air pollutants to which populations are exposed, and accounts for large health burdens (CCAC and UNEP 2019). Figure 1: Ambient Level of PM2.5 in Asia in 2015
Source: CCAC and UNEP 2019
Indonesia has one of the highest pollution concentrations in Southeast Asia, with varying levels in rural and urban areas due to seasonal burning of biomass, power generation emissions and transportation (IQAIR 2018; OECD 2019). Transport emissions in Indonesia are rising due to the rapid growth of the

21
vehicle fleet. Between 2005 and 2016 vehicle emissions increased by an average of 10 percent each year, while the motorcycle fleet grew by an average of 12 percent. Together with inadequate road infrastructure in the city, this rapid growth has resulted in severe congestion in Jakarta, which is detrimental to both human health and the economy (OECD 2019a). Indonesian cities are amongst those with the worst air quality in South East Asia, which has had a corresponding impact on the health of people living in and around them. Jakarta has been ranked the tenth most polluted capital city in the world and the most polluted city in the South East Asia region. It has the annual average PM2.5 concentrations of 45,3 µg/m³ that far exceeds the WHO guideline value of 10 µg/m³ (IQAir 2018). The monetary impact of such high levels of air pollution have been estimated to be USD 16 billion / IDR 227 trillion in Jakarta in 2015, triple the national health budget in the same year (World Bank 2015). At the same time, air pollution monitoring is a politically sensitive issue and it is difficult to access robust and reliable real-time data. Municipal governments of polluted cities tend to be criticised by their citizens. In DKI Jakarta at the end of 2018, a group of individuals and organisations filed a Citizen’s Lawsuit against the governor of Jakarta and the Indonesian President, Joko Widodo, accusing them of failing to protect Jakarta’s citizens from the negative impacts of air pollution—for more details see section 1.3.3. (Tomonews 2019). The nexus between urban air pollution, health, environment and climate is becoming more and more apparent, as are their detrimental impacts of pollution on urban economies (Haines 2009). Air pollution is addressed in several Sustainable Development Goals (SDGs). One of the targets of SDG 3 (ensure healthy lives and promote well-being for all at all ages) aims to substantially reduce the number of deaths and illnesses due to air pollution by 2030, using the mortality rate attributed to household and ambient air pollution as the indicator. This is in line with the targets and indicators of SDG 11 (make cities and human settlements inclusive, safe, resilient and sustainable) that aims to reduce the adverse environmental impact of cities, including by paying special attention to air quality by measuring annual mean levels of fine particulate matter (e.g. PM2.5 and PM10) in cities. Air pollution attributable to the combustion of fossil fuels as an energy source will be reduced by shifting to clean energy (SDG 7), significantly reducing contaminant release to the atmosphere through sustainable production (SDG 12) and improving transportation infrastructures and systems (SDG 9 and SDG 11). Fossil-fuel subsidies that encourage wasteful consumption are also targeted and should be rationalized (SDG 12). Reducing air pollution will also have a positive impact on the climate agenda (SDG 13) and support implementation of Indonesia’s Nationally Determined Contribution (NDC) to the Paris Agreement by integrating greenhouse gas (GHG) mitigation measures into development policies, such as in transportation, energy, industry, and the forestry sector. Relevant SDGs and indicators are shown in Figure 2.

22
Figure 2: The SDGs and their relevance to air pollution
deaths & illnesses from air pollution (T 3.9; I 3.9.1)
affordable clean fuels (T 7.1; I 7.1.2)
sustainable transportation infrastructure (T 9,1; I 9.1.2)
accessible public transport (T 11.2; I 11.2.1)
clean production (T 12.4)
low GHG development (T 13.2; I 13.2.1)
early warning health risks (T.3.d)
air quality, fine particulate matter level (T 11.6; I 11.6.2)
inefficient fossil-fuel subsidies rationalization (T 12.c; I 12.c.1)
Source: United Nations Sustainable Development Knowledge Platform
Figure 3 shows the global impact of a total phase out of post-tax fossil fuel subsidies3 on CO2 emissions (left) and on human health (right). In the figure, different bars show reductions in CO2 emissions and air pollution deaths attributable to removing subsidies for different fossil fuel types: the black section refers to coal, the orange to petroleum (gasoline and diesel) and the yellow to natural gas. The figure clearly illustrates the strong links between fossil fuel subsidies, CO2 emissions and air-pollution related deaths. Although, discrepancies also demonstrate that the relationship between CO2 emissions and air pollutant emissions is not necessarily linear. Figure 3: Environmental gains from removing fossil fuel subsidies
Percentage reduction of CO2 emissions Percentage reduction of air pollution deaths
Source: Coady et al. 2019
In emerging and developing countries in Asia (marked E.D. Asia on Figure 3), coal combustion is the most important source of CO2 emissions and harmful air pollution, and that subsidy reform has the potential to reduce these emissions substantially. ASEAN member states have discussed and announced further support for member countries to address the issues of air pollution and GHG emissions. Recent research illustrates the linkages between air
3 The IMF calculation of post-tax subsidies includes the measurement for both explicit and implicit subsidies for fossil fuels (including untaxed externalities).

23
pollution and health impacts, as well as their climate implications. About 4 billion people in the Asia Pacific region (92 percent of the region’s population) are exposed to levels of air pollution which go beyond the World Health Organization (WHO) guidelines. If current levels of economic growth are maintained and policies are not implemented to curb air pollution, harmful PM2.5 concentrations are predicted to increase by more than 50 percent by 2030. Moreover, fossil fuel combustion emits GHGs such as carbon dioxide CO2 and nitrous oxides (NOx), as well as supporting the atmospheric formation of ozone (O3) and secondary aerosol particles. Such particles can have negative impacts on the climate; deposits of particulate matter on glaciers, for example, lead to more absorption of heat and faster melting rates (Climate and Clean Air Coalition (CCAP) and UNEP 2019). The CCAP and UNEP (2019) Air Pollution in Asia Pacific: Science-Based Solutions report was presented to ASEAN member states in July 2019 in Manila, at which time twenty-five possible policy and technology actions for six sectors to curb air pollution were discussed. The report included the following options for the transport sector: strengthen emissions standards for road vehicles; strengthen enforcement; mainstream electric vehicles; provide alternative transport modes; control dust; and reduce emissions from shipping (CCAC n.d.). For all policy options, this study identifies fiscal policies which may contribute to their achievement.
1.2. The role of green fiscal policy in achieving emissions reductions from the transport sector Reducing air pollutant emissions from road transport can be done by reducing vehicles on the road, modal shift to cleaner transport modes for both passengers and freight, increasing the efficiency and emissions performance of vehicles, and systematically shifting towards cleaner energy sources for the transportation sector. Green fiscal policies (GFP) can play an important role in driving the behavioural changes necessary to achieve a cleaner transport sector, particularly when implemented as a suite of policies to reduce emissions. A combination of GFPs, including revenue-raising instruments and spending and subsidy policies, soft instruments such as labelling and information, and regulations including vehicle standards, is the most effective and efficient way of ensuring that all the changes that are necessary to reduce emissions from the sector take place (Sims et al. 2014). For the purposes of this study and the fiscal policy recommendations developed therein, a relatively wide definition of fiscal policy is used, which includes measures which raise revenue – taxes, fees and charges at national and provincial level – and measures associated with expenditure, whether at national or provincial level. Hybrid instruments, such as regulations combined with subsidies, taxes, fees or charges, e.g. vehicle standards implemented alongside scrappage subsidies, are thus included under the umbrella of GFPs for the purposes of this report. There are several arguments in favour of implementing GFP in the transport sector. First, GFPs are particularly well-suited to policy objectives which target diffuse and diverse populations, such as individual drivers and commuters (Sims et al. 2014). A second powerful argument in favour of GFP is its potential to raise revenue. Indonesia has relatively limited fiscal space, with a tax-to-GDP ratio of around 12 percent (OECD 2018a). Thus, there is an ongoing need for the national government, and the government of DKI Jakarta, to mobilise domestic revenue and make the investments necessary to reduce pollution harmful to human health from road transport.

24
Internationally, it is recognised that vehicle taxes can have a big impact to limit air pollution from the transport sector (van Dender 2019). The effectiveness of fiscal policies in reducing transport emissions harmful to health is dependent on several factors, such as:
1) The monetary value of incentives and/or green taxes, fees and charges. 2) Their placement in the vehicle lifecycle – i.e. on vehicle acquisition/registration, vehicle ownership
(e.g. annual circulation taxes), or vehicle use (e.g. fuel taxes or congestion charges). 3) The types of vehicles they favour, e.g. efficient conventional engines, hybrids or electric vehicles
(EEA 2018). These factors are taken into account in the recommendations proposed in this study.
1.3. Indonesia and DKI Jakarta as a case study to investigate opportunities for fiscal policy measures to curb air pollution Indonesia has one of the highest pollution rankings in the world, as does the city of Jakarta. OECD statistics indicate that since 1990 Indonesia has continuously exceeded the WHO guidelines for PM2.5
concentrations of 10 μg/m3, as well as the Indonesian government’s National Ambient Air Quality Standard (NAAQS) of 15 μg/m3 (OECD 2019d). Further data from the University of Indonesia shows that there have been rapid increases from PM10 pollution and CO2 emissions as a result of road transport. From 1990 to 2030, PM10 is predicted to increase from just under 2.5 kt PM to 15kt PM (RCCC UI 2019). These air-pollution increases are in line with a trend of a burgeoning transport sector that can be observed since the 1980s: between 1989 and 2015, the number of road vehicles in Indonesia increased from 16.6 million to 242.8 million (Statistics Indonesia 2017). Although individual annual air pollutant measurements do not exceed national standards, except for O3, the data analysis demonstrates that Jakarta’s population is exposed to levels of air pollution potentially damaging to human health several times a year. The Air Pollution Index shows that on 194 days each year, moderate health impacts can be expected, and on 69 days a year, severe health impacts can be expected (KPBB 2018). In 2010, a study in Jakarta found that 57.8 percent of Jakarta’s citizens suffer from various air pollution-related diseases, with health costs amounting to IDR 38.5 trillion/US$ 54 billion: a 250 percent cost increase over just 20 years (World Bank and Institute for Health Metrics and Evaluation 2016). A recent lawsuit has increased awareness amongst civil society of the scale of the problem. Thus, reducing emissions harmful to human health is a high priority and a matter of urgency in the country. Furthermore, in Jakarta, awareness of the impact of high air pollutant concentrations on human health is high and political pressure to address it is increasing. Current national measures, however, have not proven sufficient to control air pollution and congestion in the city. Therefore, there is a need to move beyond national efforts to address the problem of air pollution effectively (ICCT 2014). Policymakers at provincial level have clearly expressed their intention to address the issue. Therefore, in the current political climate there is a window of opportunity to consider the potential that fiscal policy instruments have in reducing harmful air pollution. For this reason, fiscal policy proposals specifically tailored to the city of Jakarta were developed for this study.
1.3.1. Regulatory framework for air pollution In Indonesia, the environmental and transport ministries are responsible for the management of air pollution. The Ministry of Environment and Forestry (MoEF) draws up regulations on air pollution control and emissions limits, as well as fuel standards. The Ministry of Transport (MoT) provides guidance on traffic management and new technologies such as electric vehicles (EVs). National Ambient Air Quality
25
Standards do exist and are monitored by the respective agencies. However, public data on air quality is hardly available. This seems to be a response to political pressure from national and civil society (see further elaboration in section 2.1.2). In parallel to this, DKI Jakarta has developed environmental management standards and identified specific air pollution emissions standards. Five stationary Air Quality Monitoring Stations (AQMS) regularly measure air quality in Jakarta. The Traffic and Transport division (Dishub) has been mandated to implement periodic vehicle tests and manage the traffic flow (BEJ 2013). The DKI Jakarta government has a range of responsibilities, including for the implementation and administration of fiscal policies (see chapter 3 for details).
1.3.2. Fiscal situation Tax revenue volumes and administrative efficiency have recently improved in Indonesia. However, the government ratios of revenue-GDP and tax-GDP, at 14 and 12 percent respectively as measure in 2016, remain low in comparison to countries at a similar income level. Even though between 2012 and 2016 the number of registered taxpayers rose by almost 12 million and E-filing registration rates increased by 82 percent in 2017, the overall tax registration in 2016 was still low ranging between 17.8 and 35.7 percent (OECD 2018a)4. Provinces and municipalities raise only about 10 percent of total tax revenue directly, relying substantially on central government transfers to fund public services (OECD 2018a). Tax revenues derived from environmental taxation remain low (0.8 percent of GDP), with vehicle taxation providing a large proportion of the total (OECD 2019a). Challenges faced by the government when attempting to increase revenues include the country’s large informal sector, low tax compliance levels, a narrow tax base, and wide tax exemptions. Both national and provincial governments have some experience with GFPs. At the national level, tax incentives for Low Cost Green Cars (LCGC) and the reduction of fossil fuel subsidies since 2015 demonstrate the willingness of the Indonesian government to enact pricing and subsidy policies. DKI Jakarta has been aiming for some time to implement Electronic Road Pricing (ERP) to reduce air pollution, although the process has been hindered for several reasons (see section 3.5). Several non-fiscal measures aimed at reducing air pollution have also been implemented, including fuel quality and vehicle standards and expansion of the public transport sector.
1.3.3. Growing public awareness In November 2018, a group of individuals and organizations who call themselves the Coalition to Improve Air Quality officially placed a Citizen’s Lawsuit against the Governor of Jakarta Anies Baswedan and the Indonesian President Joko Widodo (Tomonews 2019). The group argued that the government had failed to fulfil the right of Jakarta’s citizens to breathe healthy air, in line with air quality standards. The group also contended that they had data to prove that the citizens of Jakarta would have paid at least 51.2 trillion IDR / US$ 3.9 billion (Jakarta case 2016) to cover the health costs associated with disease related to air pollution in 2019 alone (KPBB 2019).
4 Calculated from data provided by the Directorate General of Taxes. Registered taxpayers are at end 2016. Note that married individuals typically pay tax at the household level; the lower bound is calculated by adjusting the number of taxpayers for the share that file tax jointly and the upper bound assumes that every taxpayer represents a two-taxpayer household.

26
The lawsuit was submitted as a response to the deteriorating air quality in Jakarta in July 2019 and the City Governor has since issued some guidance for strategic activities on addressing pollution, which includes the expansion of public transport and electronic road pricing (OECD 2019a). Nonetheless, several challenges remain:
1) Expansion of air pollution monitoring stations 2) Transparency in reporting of air pollution levels 3) Setting of Ambient Air Quality Standards and indicators at city level 4) Monitoring and implementation of vehicle emission standards and fuel quality standards 5) Price regulations for transport fuels which distort fuel markets 6) Regulatory overlap of institutional responsibilities on air quality monitoring 7) The need to focus on reducing poverty and economic development
Fiscal instruments such as congestion charging systems, differentiated vehicle registration charges and other measures to encourage low-emissions vehicles, road taxes and taxes on transport fuels, and subsidies to support emissions reductions in the freight sector and drive modal shift from road to rail freight all have potential to reduce harmful air pollution. This study will look at successful international examples of these and other measures and consider how best they can be designed and implemented in the context of DKI Jakarta.
1.4. Objectives of the study The objective of this study is to support the Indonesian and Jakarta governments in their efforts to address air pollution and GHG emissions by proposing a possible package of green fiscal policies in the transport sector. The negative health impacts of air pollution in Indonesia are concentrated in the very densely populated Special Capital City Region (DKI) Jakarta. Successful policy interventions in the city could potentially have a significant impact on human health and well-being of many Indonesian citizens. Thus, DKI Jakarta has been chosen as the focus of this study to maximise the impact of the measures proposed. This study analyses existing regulatory and fiscal instruments to reduce the health impacts from pollution related to road transport in DKI Jakarta and proposes ways in which these instruments could be improved. It also draws on international best practice to propose a package of GFPs with the potential to reduce harmful emissions in DKI Jakarta. Many of the lessons learned and recommendations made are broadly applicable. Thus, the instruments here-proposed have the potential to reduce harmful emissions in other large and rapidly urbanising cities facing similar problems in Southeast Asia and further afield. More specifically, the study will:
1) Contribute to an improved understanding of the use and effectiveness of fiscal policy instruments in reducing air pollution and negative health impacts from road transport in Jakarta
2) Raise awareness of the economic, environmental and health costs of air pollution from the road transport sector in Jakarta and other cities in South East Asia
3) Contribute to bridging knowledge gaps in country experiences of optimizing the use of green fiscal policies to mitigate negative health impacts and address air pollution from road transport alongside other policy instruments, and
4) Identify synergies with climate mitigation policies. The primary target audience for the study are policymakers in DKI Jakarta and Indonesia. However, the study is also intended to serve policymakers in cities in developing and emerging countries facing similar challenges—associated with designing effective policies to curb rapidly rising transport emissions harmful to human health.

27
To ensure that this study adds value to the policy debate and given the existing extensive research on fossil fuel subsidies and their reform, the proposals in chapters 5 and 6 focus on: green taxes, charges and fees, green subsidies, and hybrid fiscal policy instruments in the transport sector. This does not imply that fossil fuel subsidy reform is not an important fiscal policy measure with substantial potential to reduce harmful emissions (as shown in Figure 3), but is rather a reflection of the fact that this issue has already been given significant attention by international organisations such as the G20, IEA, OECD, ADB, and IMF. The study is part of a wider UNEP project on Environment, Pollution and Health, which aims to help countries step up action on pollution by building understanding, capacity and tools on the nexus between environment and health issues. The study is coordinated in line with UNEP activities to support a registration tax on the basis of CO2 vehicle emissions as well as cleaner and more efficient fuels and vehicles in Indonesia (in particular, the implementation of Euro 4 vehicle emission standards and equivalent fuel quality, and the upscaling of the electric mobility in Jakarta and the whole country).
1.5. Methodology The analysis, conducted over a six-month period, focused on existing literature on air pollution globally, in Southeast Asia, in Indonesia, and in DKI Jakarta. Due to the limited availability of government data, much of the data used was taken from the reports of international agencies. Identification of international best practices took the form of a literature review, focusing on those measures where significant impacts on emissions harmful to human health have been identified. On the back of these preliminary findings, several interviews with key stakeholders were conducted.5 Following the interviews, several proposals for fiscal policies to reduce harmful emissions from the transport sector in Jakarta were developed. To discuss these proposals and verify the findings of the study relating to existing policies and human health impacts, a roundtable with key stakeholders was held in DKI Jakarta at the beginning of September.6 Estimations of the policy implementation status and challenges were developed in close collaboration with the key experts involved in the writing of this study from KPBB and the University of Indonesia (UI).
1.6. Structure The first chapter of the study introduces the thematic focus of the report and the report methodology. Chapter 2 outlines air pollution trends in Indonesia and more specifically, DKI Jakarta, and provides the latest research on health costs associated with the air pollution in the city. The chapter also outlines sources of air pollution and discusses the interlinkages between population growth, increased commuter numbers, congestion, transportation and energy consumption. Chapter 3 assesses past, current and planned policies to address air pollution from the transport sector in DKI Jakarta. After examining existing regulations, specific fiscal and non-fiscal measures are analysed, with reference to their potential impact on air pollution. Data on revenue and expenditure of the DKI Jakarta
5 Interviews were held with MoEF, BKF at MoF; DLH DKI Jakarta and CLS group (see Annex V) 6 The roundtable was attended by 13 representatives from DKI Jakarta, BKF and research organizations (see Annex 5).

28
government highlights current tax revenues available and their sources. The main challenges to fiscal and non-fiscal policies for reducing air pollution are discussed from a political economy perspective. Chapter 4 looks at several successful examples of GFPs which have achieved reductions in air pollution, stemming from road transport in cities, and consequent benefits to human health. The chapter also evaluates their applicability to DKI Jakarta. Chapter 5 proposes a range of possible fiscal policies which could be implemented in the short- and medium term at the national and provincial level to mitigate emissions harmful to human health. Their applicability and feasibility are considered, as well as their potential impacts on revenue, social equity, human health and the economy. Chapter 6 synthesizes the key messages of the study. It is forward-looking and focuses on proposed policy reform packages and complementary measures. The final chapter also discusses the challenges that the implementation of these measures might face and how they can be addressed. The chapter ends by identifying knowledge gaps and lays out possible questions for further research.

29
2. Key Trends, Costs and Challenges of Air Pollution
2.1 Introduction Monitoring air quality is challenging. Data on air pollution is a highly politicized topic in many countries, and the data necessary to estimate costs related to pollution accurately tend to be difficult to access. For evidence-based policymaking, however, it is essential that this data is robust, accurate, transparent, and available in the public domain. Such data is needed to raise awareness about the extent of the negative impacts of the status quo and create momentum for change, both within and outside government. Awareness of the costs of inaction on air pollution can provide leverage in favour of change and embolden governments to act. At the same time, air pollution data is essential for the accurate evaluation of policy impacts. Therefore, this chapter will outline the availability of data on air pollutants in Indonesia and specifically DKI Jakarta and provide an overview of the current status of air pollutant levels and their economic and associated health impacts on the population of DKI Jakarta. Finally, sources of air pollution and the contribution of the transport sector are analysed.
2.1.1. Air pollution Air pollution is commonly measured in relation to the following pollutants: particulate matter (PM) (PM2.5 and PM10), sulphur dioxide (SO2), nitrogen dioxide (NO2), carbon monoxide (CO), ozone (O3). All are emitted as a result of fossil-fuel combustion processes, as summarized in Table 2 below. PM2.5 is widely used as a representative measure of air pollution, as the small size of the particulates of PM2.5 poses the greatest risks to human health. Particulate matter (PM) is commonly emitted from combustion engines (both diesel and petrol), solid-fuel (coal, lignite, heavy oil and biomass) combustion for energy production in households and industry, and other industrial activities (building, mining, manufacture of cement, ceramic and bricks, and smelting) (WHO, n.d. a). Table 2: Overview of sources of air pollutants
Pollutant Sources of the pollutant in the city
PM2.5 Combustion engines (both diesel and petrol) Solid fuel (coal, lignite, heavy oil and biomass) Combustion for energy production in households and industry, as well as other industrial activities (building, mining, manufacture of cement, ceramic and bricks, and smelting) Secondary particulates are derived from sulphates and nitrates formed in reactions involving SO2 and NOx
PM10
SO2 Burning of fossil fuels (coal and oil) Smelting of mineral ores that contain sulphur
NO2 Mainly emitted by power generation, industrial process and transport (esp. diesel engines)
CO Motor vehicle exhausts and machinery that burns fossil fuels
O3 Produced when carbon monoxide (CO), methane, or other volatile organic compounds (VOCs) are oxidized in the presence of NOx and sunlight.
NOx and VOCs Emissions from motor vehicle exhaust, industrial facilities, and chemical solvents
Methane Waste and the fossil fuel and agricultural industry Source: Summarized from WHO (n.d. a)

30
2.1.2. Air pollutant monitoring in Indonesia Air pollutant monitoring stations in Indonesia The Ministry of Environment and Forestry (MoEF) shows 129 continuous monitoring stations spread across the country on its website (as shown in Table 3). Given their respective mandates and responsibilities as specified in law, these stations are managed by the MoEF (for national monitoring of air quality), the Meteorology, Climatology and Geophysical Agency (BMKG) (for weather forecasting), local environmental agencies (DLH) (for local monitoring), or other institutions, such as the US Embassy (for verification of official data), etc. Table 3: Air Quality Monitoring Stations in Indonesia
Location Labelled as Active Stations
Labelled as Non-Active Stations
Total Stations
Indonesia (all) 74 55 129
Java 34 28 62
Sumatera & surrounds 23 16 39
Borneo 11 5 16
Eastern Indonesia 6 6 12
Source: Summarized from KLHK 2019c (accessed 19 November 2019)
2.1.3. Publicly available data The monitoring of air pollutants in Indonesia is currently relatively inconsistent and given the recent lawsuit, highly politicized. Official data from government agencies such as MoEF, BMKG and the local environmental agency all provide a certain amount of information on their websites (see Figure 4). However, accurate overviews of air pollutant emissions over time are not available on their databases (see Table 4 for an overview). Figure 4: MoEF website display on the Air Pollutant Standard Index (ISPU) Information
Source: KHLK 2019c (Accessed on 26 November 2019).

31
Table 4: Overview of available data on air pollutants in Indonesia and DKI Jakarta National Government DKI Jakarta
Agency MoEF BMKG BPLH Jakarta Jakarta Open Data (Diskominfotik DKI Jakarta)
Period Real time data Latest month (but inconsistent)
-Real time data -Daily database
2011, 2012, 2014
Data/ publication
Online: -Map of Air Quality Monitoring stations and air pollutant index on that day; displays one indicator for air pollution -Graph of air pollutant index of PM10, CO, SO2, NO2, O3 on that day -Map of PM2.5 station location & hourly pollutant concentration on that day
Online: Graph of SO2, NO2, O3 PM10, PM2.5, SPM, & TSP concentrations.
Online: -Air pollutant index on the day -Pollutant measurements of the day (in ug/m3).
Online: NO2, SO2, TSP, Pb; data in csv format.
Description The map shows data from 41 stations run by MoEF, BMKG, and local environmental agencies. On its website, it lists 129 stations but only 74 as active. 12 stations measure PM2.5
Provides information on SO2, NO2, O3 PM10, PM2.5, SPM, & TSP.
Five continuous monitoring stations, nine manual sampling stations, and two mobile monitoring vans.
Pollutant measurement most likely originates from the manual station, not the fixed DK1-DK5 stations.
Publicly Available
Air Quality Index http://iku.menlhk.go.id/aqms/ PM2.5 Monitoring http://iku.menlhk.go.id/aqms/pm25 Online database (but data is incomplete) http://iku.menlhk.go.id/aqms/arsip
https://www.bmkg.go.id/?lang=ID Only provides one overview for each pollutant. Not consistent regarding dates. No historic data is available online.
Online Database https://llhd.jakarta.go.id/#; https://llhd.jakarta.go.id/pages/sensor/konsentrasi.php?id=DKI1 (Only available on hourly rate and data seems incomplete)
http://data.jakarta.go.id/dataset/data-kualitas-dan-baku-mutu-udara-menurut-lokasi-pengukuran-dki-jakarta
Source. Authors
Other programs, which have collaborated with the MoEF and the DLH, and have filled some of the gaps in publicly available data from national or provincial government agencies responsible for monitoring are shown in Table 5. In this study, due to the lack of available government data, national data on air pollution was taken from the World Health Organization (WHO) and the emissions evaluations of the Toyota Clean Air Project. For DKI Jakarta, data from five DKI Jakarta monitoring stations and analysis conducted in the Toyota Clean Air Project were used.
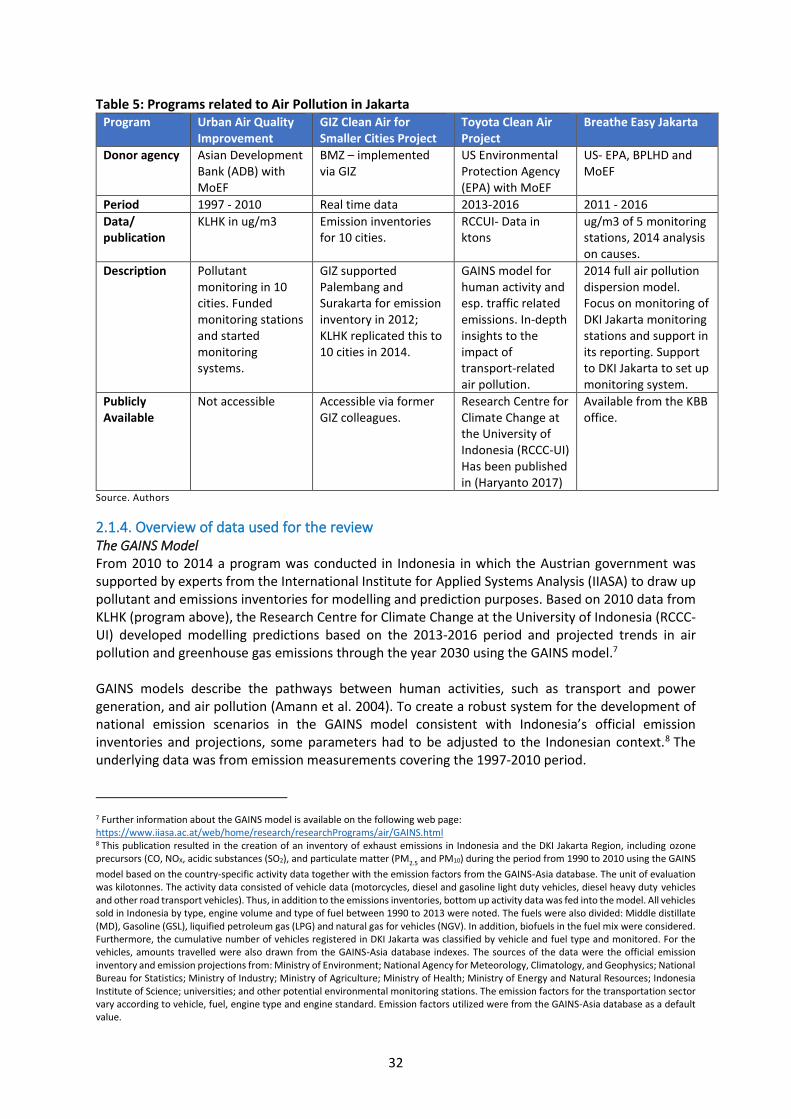
32
Table 5: Programs related to Air Pollution in Jakarta Program Urban Air Quality
Improvement GIZ Clean Air for Smaller Cities Project
Toyota Clean Air Project
Breathe Easy Jakarta
Donor agency Asian Development Bank (ADB) with MoEF
BMZ – implemented via GIZ
US Environmental Protection Agency (EPA) with MoEF
US- EPA, BPLHD and MoEF
Period 1997 - 2010 Real time data 2013-2016 2011 - 2016
Data/ publication
KLHK in ug/m3 Emission inventories for 10 cities.
RCCUI- Data in ktons
ug/m3 of 5 monitoring stations, 2014 analysis on causes.
Description Pollutant monitoring in 10 cities. Funded monitoring stations and started monitoring systems.
GIZ supported Palembang and Surakarta for emission inventory in 2012; KLHK replicated this to 10 cities in 2014.
GAINS model for human activity and esp. traffic related emissions. In-depth insights to the impact of transport-related air pollution.
2014 full air pollution dispersion model. Focus on monitoring of DKI Jakarta monitoring stations and support in its reporting. Support to DKI Jakarta to set up monitoring system.
Publicly Available
Not accessible Accessible via former GIZ colleagues.
Research Centre for Climate Change at the University of Indonesia (RCCC-UI) Has been published in (Haryanto 2017)
Available from the KBB office.
Source. Authors
2.1.4. Overview of data used for the review The GAINS Model From 2010 to 2014 a program was conducted in Indonesia in which the Austrian government was supported by experts from the International Institute for Applied Systems Analysis (IIASA) to draw up pollutant and emissions inventories for modelling and prediction purposes. Based on 2010 data from KLHK (program above), the Research Centre for Climate Change at the University of Indonesia (RCCC-UI) developed modelling predictions based on the 2013-2016 period and projected trends in air pollution and greenhouse gas emissions through the year 2030 using the GAINS model.7 GAINS models describe the pathways between human activities, such as transport and power generation, and air pollution (Amann et al. 2004). To create a robust system for the development of national emission scenarios in the GAINS model consistent with Indonesia’s official emission inventories and projections, some parameters had to be adjusted to the Indonesian context.8 The underlying data was from emission measurements covering the 1997-2010 period.
7 Further information about the GAINS model is available on the following web page: https://www.iiasa.ac.at/web/home/research/researchPrograms/air/GAINS.html 8 This publication resulted in the creation of an inventory of exhaust emissions in Indonesia and the DKI Jakarta Region, including ozone precursors (CO, NOX, acidic substances (SO2), and particulate matter (PM2.5 and PM10) during the period from 1990 to 2010 using the GAINS
model based on the country-specific activity data together with the emission factors from the GAINS-Asia database. The unit of evaluation was kilotonnes. The activity data consisted of vehicle data (motorcycles, diesel and gasoline light duty vehicles, diesel heavy duty vehicles and other road transport vehicles). Thus, in addition to the emissions inventories, bottom up activity data was fed into the model. All vehicles sold in Indonesia by type, engine volume and type of fuel between 1990 to 2013 were noted. The fuels were also divided: Middle distillate (MD), Gasoline (GSL), liquified petroleum gas (LPG) and natural gas for vehicles (NGV). In addition, biofuels in the fuel mix were considered. Furthermore, the cumulative number of vehicles registered in DKI Jakarta was classified by vehicle and fuel type and monitored. For the vehicles, amounts travelled were also drawn from the GAINS-Asia database indexes. The sources of the data were the official emission inventory and emission projections from: Ministry of Environment; National Agency for Meteorology, Climatology, and Geophysics; National Bureau for Statistics; Ministry of Industry; Ministry of Agriculture; Ministry of Health; Ministry of Energy and Natural Resources; Indonesia Institute of Science; universities; and other potential environmental monitoring stations. The emission factors for the transportation sector vary according to vehicle, fuel, engine type and engine standard. Emission factors utilized were from the GAINS-Asia database as a default value.

33
Monitoring Stations in DKI Jakarta The five stationary monitoring stations are spread across DKI Jakarta, namely Central, North, South, East, and West Jakarta (see Figure 5). The air quality index, pollutant monitoring results and information about the effects of pollution on human health and the environment are available online.9 The five stations monitor the critical pollutants PM10, SO2, NO2, CO, O3, as well as NOx, NMHC, and CH4. However, PM2.5 has only been measured since 2019 at the MoEF’s station (KLHK-GBK-Jakarta). The measurement unit is concentration (u/m3). BPLHD also operates a laboratory and data centre. International technical guidelines on ambient air quality monitoring stations recommend that DKI Jakarta install 11 monitoring stations in view of Jakarta’s total population and land area. Even though that number is achieved with mobile stations in the city, experts have recommended that the number of stationary monitoring stations be increased (Breathe Easy Jakarta 2017). Furthermore, in stakeholder discussions it was mentioned that the reliability of the continuous monitoring at the stations is sometimes compromised, as monitoring stations that break down can be out of service for 2-3 before they are repaired (Breathe Easy Jakarta 2017). Figure 5: AQM stations in DKI Jakarta maintained by the BPLHD and MoEF
Source: Breath Easy Jakarta, 2017, p.113; and KHLK 2019b
9 Index and pollution effects https://llhd.jakarta.go.id/pages/sensor/sensor.php; Pollutant concentration monitoring data https://llhd.jakarta.go.id/pages/sensor/konsentrasi.php?id=DKI1
KLHK-GBK-Jakarta

34
Table 6: Air Quality Monitoring Sites in DKI Jakarta
Source: Breath Easy Jakarta, 2017, p.112

35
2.2. Air pollutants in Indonesia Indonesia ranks 11 in the world for air pollution, with an annual mean concentration of PM2.5 of 42 μg/m3 in 2018 – more than four times the WHO guideline value of 10 μg/m3 (IQAir Air Visual 2018; OECD 2019d). Even though Indonesia has 129 monitoring stations, PM2.5 has only been monitored since 2019. According to the OECD Environment Statistics Database, the level of exposure to PM2.5 in Indonesia in the last decades has always been above the 10 μg/m3 WHO guideline value (OECD 2019d), as well as above the 15 μg/m3 National Ambient Air Quality Standards (NAAQS) (see Figure 6). Figure 6: PM2.5 concentration in Indonesia compared to the WHO Standards
Source: OECD 2019d, authors
Projections for the increase in transport emissions in Indonesia are alarming, with rapid increases in harmful air pollutants such as PM10 (see Figure 7) and greenhouse gas emissions such as CO2 (see Figure 8) expected (RCCC UI 2019). Such a rapid increase in emissions is in part related to the low quality of transport fuels currently used in Indonesia (Safrudin 2018). Thus, the increase could be mitigated to some extent by raising and enforcing fuel standards. Also, it is interesting to note that in a BAU scenario, motorcycles are and will remain the main contributors to emissions. The sharp increase in motorcycles has been already noted by the WHO as a common phenomenon in middle-income cities, where cars are still unaffordable for most citizens (UNEP and WHO 2009). However, both CO2 and PM10 emissions from light duty vehicles (LDVs) are also predicted to increase substantially between 2015 and 2030, with emissions from motorcycles rising less rapidly, reflecting the trend towards higher levels of car ownership in Indonesia. In common with many other middle-income economies, improving living standards in the country are an important driver of rising car ownership (Sims et al. 2014). The figures from the GAINS model also highlight the relationship between GHG emissions and harmful emissions, such as PM10. There are often synergies between GHG mitigation and reduction of ambient air pollution harmful to human health, although this is not always true – particularly in the case of diesel vehicles (these synergies are explored further in the study e.g. in section 6.3).

36
Figure 7: National Trend development of PM10 emissions from road transport10
Source: RCCC_UI 2019
Figure 8: National Trend analysis form CO2 emissions from Road Transport11
Source: RCCC_UI 2019
High pollution spikes in Indonesia are often related to the seasonal agricultural practice of open burning for clearing land for future crops (IQAir Air Visual 2018). Thick smoke from the fires blanketed several areas in Sumatra and Borneo island from July 2019 for a considerable length of time, as shown in the Regional Haze Situation map by the ASEAN Specialised Meteorological Centre (Figure 9). This figure also shows pollution hotspots, which represent locations with possible fires derived from the NOAA satellite imagery. These fires resulted in very poor air quality expected to have negative health
10 GAINS database accessed by B. Haryanto – University of Indonesia: Inventory data for the estimation of vehicles was derived from the
number every single type of vehicles sold in Indonesia, its volume of engine, & type of fuel used from 1990 to 2013 accessed by
10.9.2019. 11 GAINS database accessed by B. Haryanto – University of Indonesian accessed by 10.9.2019.

37
impacts, as demonstrated via a real-time status aerial view shown below in Figure 10 (view taken on 23 September 2019) (IQ Air Visual 2018).
Figure 9: Regional Haze Situation on 23 September 2019
Source: ASEAN Specialised Meteorological Centre (ASMC) 2019
Figure 10: Real-time status of Indonesia air quality index (AQI) and PM2.5 air pollution
Source: Air Visual 2019
2.3. Overview of air pollution in DKI Jakarta DKI Jakarta has a significant air pollution problem with key pollutants continuously exceeding international and national guidelines several times a year (Breathe Easy Jakarta 2017). However, only O3 annual measurements continuously exceed WHO and the NAAQS guideline, highlighting both the discrepancies between WHO guideline and NAAAQS, and the limitations of annual measurements. Data shown in Figure 11 and recorded by the five monitoring stations in Jakarta shows that the measured annual average concentration of PM10 exceeds WHO guidelines but not the NAAQS, while the secondary pollutant O3 exceeds the national standard as well. Comparing WHO guidelines and NAAQS is difficult as the time taken to calculate average emissions varies between some of the

38
pollutants, e.g. ozone (see Annex I). On the other hand, according to MoEF, air quality in DKI Jakarta is good and healthy (CNN 2019). This statement is based on NAAQS, which are generally lower than the WHO guidelines (see Annex I). Many cities, particularly in emerging economies, continuously fail to meet WHO Air Quality guidelines. The 2018 World Air Quality Report indicates that 64 percent of over 3,000 cities monitored exceeded WHO guidelines, while in Southeast Asia, 95 percent of cities monitored exceeded the guidelines (IQAir Air Visual 2018). Indeed, the WHO states that 91 percent of the world population is living in places where WHO air quality guidelines levels are not met (WHO 2019). Figure 11: Comparison of Pollutant Concentrations in Jakarta recording in 2013 Data with WHO guidelines and NAAQS Standards (annual emissions)
Source: Breathe Easy Jakarta 2017
PM10 NO2 O3
Breath easy Jakarta 63.0 16.6 79.2
WHO 20 40
NAAQS 100 50
0.0
20.0
40.0
60.0
80.0
100.0
120.0
ug/
m3
pollutant concentration data & standards
Breath easy Jakarta WHO NAAQS
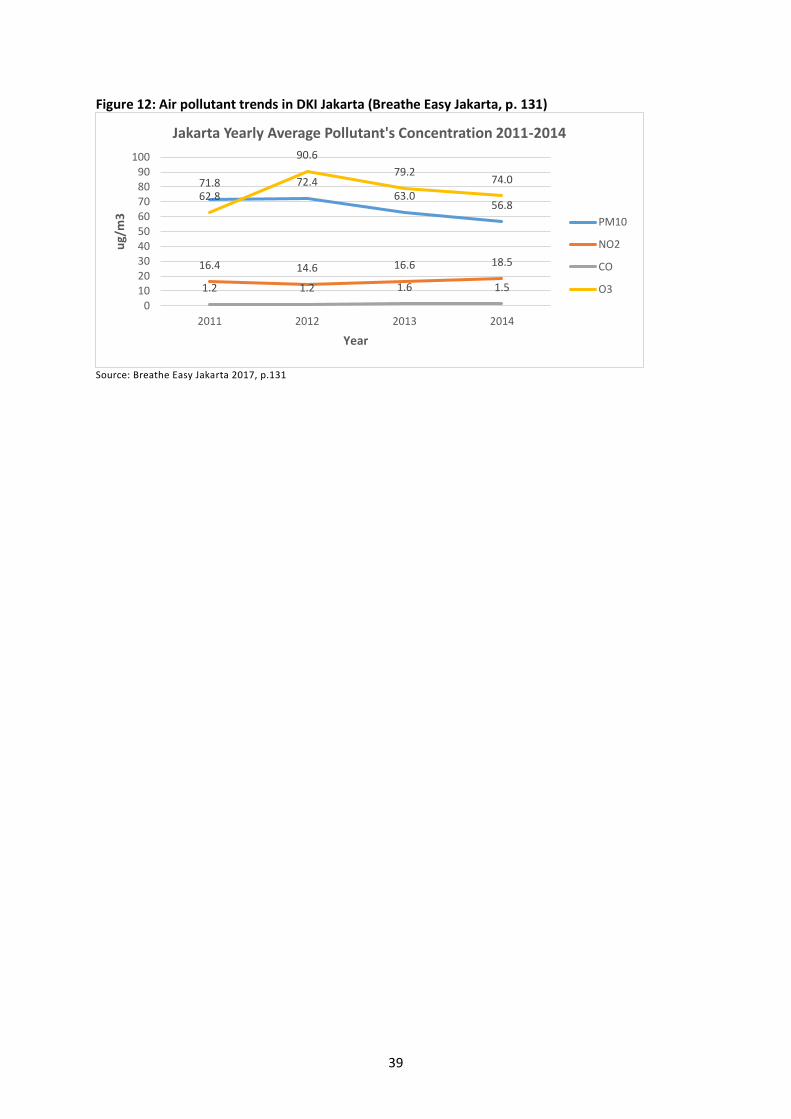
39
Figure 12: Air pollutant trends in DKI Jakarta (Breathe Easy Jakarta, p. 131)
Source: Breathe Easy Jakarta 2017, p.131
71.8 72.463.0
56.8
16.4 14.6 16.6 18.5
1.2 1.2 1.6 1.5
62.8
90.6
79.274.0
0102030405060708090
100
2011 2012 2013 2014
ug/
m3
Year
Jakarta Yearly Average Pollutant's Concentration 2011-2014
PM10
NO2
CO
O3

40
Figure 12 above shows that when an annual average is used to measure air pollution, average concentrations of PM10 and O3 decreased overall between 2011 and 2014, while NO2 and CO increased slightly in Jakarta. However, the degree to which annual average concentrations are relevant in relation to human health impacts is unclear, as health experts report that what is most detrimental to human health is not the annual average, but spikes in the concentration of air pollutants. Current ongoing research in the UK has reported that in total across nine major cities, higher air pollution days trigger an average additional 124 out-of-hospital cardiac arrests, 231 hospitalizations for stroke and 193 children and adults hospitalized as a result of severe asthma attacks (King’s College London 2019). When it comes to PM2.5, for which only US Embassy measurement data is available, it Is evident that concentrations at the monitoring station continuously exceed the NAAQS. For SO2 measurements from the five continuous monitoring stations of the DKI Jakarta government, it is also observable that, with very few exceptions, the NAAQS is continuously exceeded, as shown in figures 13 and 14. Figure 13: Trend analysis of PM 2.5 pollutant in DKI Jakarta 2015-2017
Source: KPBB 2018
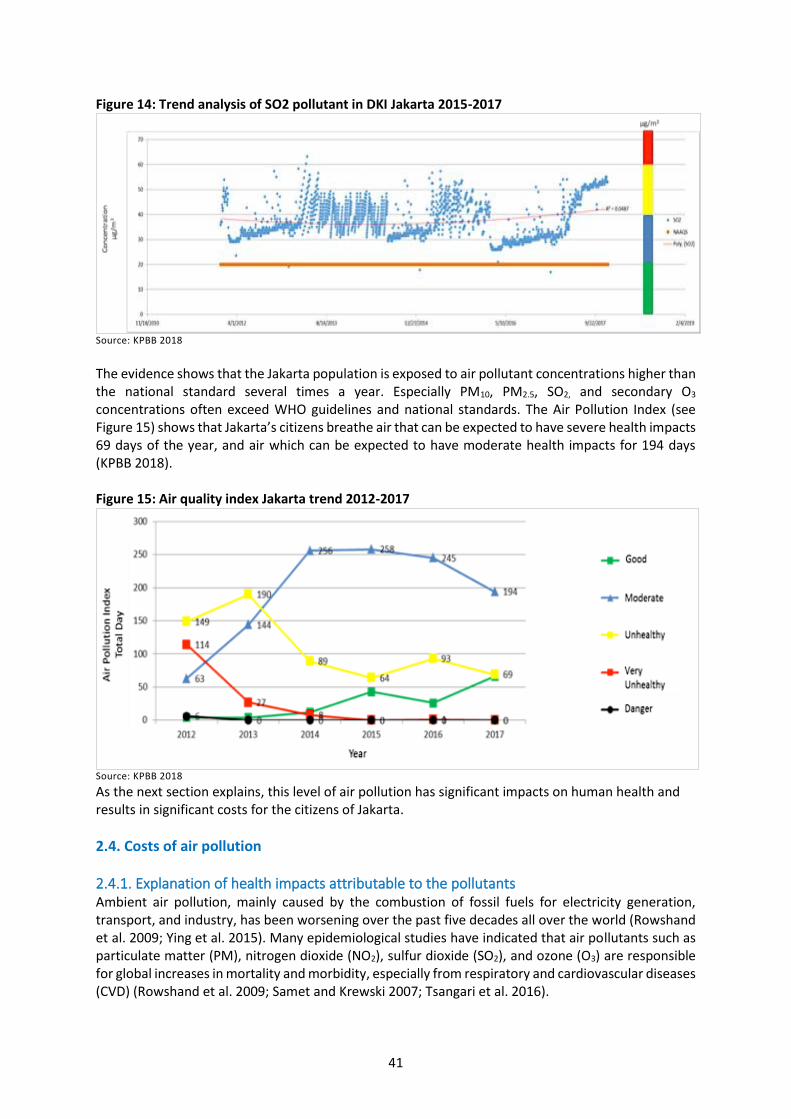
41
Figure 14: Trend analysis of SO2 pollutant in DKI Jakarta 2015-2017
Source: KPBB 2018
The evidence shows that the Jakarta population is exposed to air pollutant concentrations higher than the national standard several times a year. Especially PM10, PM2.5, SO2, and secondary O3 concentrations often exceed WHO guidelines and national standards. The Air Pollution Index (see Figure 15) shows that Jakarta’s citizens breathe air that can be expected to have severe health impacts 69 days of the year, and air which can be expected to have moderate health impacts for 194 days (KPBB 2018). Figure 15: Air quality index Jakarta trend 2012-2017
Source: KPBB 2018
As the next section explains, this level of air pollution has significant impacts on human health and results in significant costs for the citizens of Jakarta.
2.4. Costs of air pollution
2.4.1. Explanation of health impacts attributable to the pollutants Ambient air pollution, mainly caused by the combustion of fossil fuels for electricity generation, transport, and industry, has been worsening over the past five decades all over the world (Rowshand et al. 2009; Ying et al. 2015). Many epidemiological studies have indicated that air pollutants such as particulate matter (PM), nitrogen dioxide (NO2), sulfur dioxide (SO2), and ozone (O3) are responsible for global increases in mortality and morbidity, especially from respiratory and cardiovascular diseases (CVD) (Rowshand et al. 2009; Samet and Krewski 2007; Tsangari et al. 2016).

42
Table 7: Impacts on human health from major air pollutants Pollutant Short-term effects Long-term effects
PM Increase in mortality Increase in hospital admissions Exacerbation of symptoms and increased use of therapy in asthma Cardiovascular effects Long inflammatory reactions
Increase in lower respiratory symptoms Reduction in long function in children and adults Increase in chronic obstructive pulmonary disease Increase in cardiopulmonary mortality and lung cancer Diabetes effects Increased risk for myocardial infarction Endothelial and vascular dysfunction Development of atherosclerosis
O3 Increase in mortality Increase in hospital admission Effects on pulmonary function Lung inflammatory reaction Respiratory symptoms Cardiovascular system effects
Reduce lung function Development of atherosclerosis Development of asthma Reduction in life expectancy
NO2 Effects on pulmonary structure and function (asthmatics) Increase in allergic inflammatory reactions Increase in hospital admissions Increase in mortality
Reduction in lung function Increased probability of respiratory symptoms Reproductive effects
CO* High levels can be harmful to humans by impairing the amount of oxygen transported in the bloodstream to critical organs; Long-term exposure to low concentrations is also associated with a wide range of health effects
SO2* affects the respiratory system and the function of the lungs, and causes irritation of the eyes; aggravate asthma and chronic bronchitis, as well as increases the risk of infection
Source: Adapted from WHO (2004b, 2006) and summarized from WHO (n.d. a)
Air pollution has been ranked as number six on risk factors that influence death and disability in Indonesia (IHME 2019). Haryanto and Franklin (2011) have estimated that 50% of morbidity in the country is caused by air pollution (Haryanto and Franklin 2011). The cost of mortality, morbidity, and loss of welfare from exposure to ambient particulate matter in Indonesia has been estimated to have doubled from 1% GDP equivalent in 1990 to 2,1% GDP equivalent in 2017, or around 8.6 billion USD PPP in 1990 to 62.2 billion USD PPP in 2017. The trend of the cost burden has been rising since the 1990s, as seen in Figure 16.12
12 Own analysis based on data from the OECD Environment Statistics Database (OECD 2019d), Air quality and health, Mortality, morbidity, and welfare cost from exposure to environment-related risks, Risk: Ambient Particulate Matter https://stats.oecd.org/viewhtml.aspx?datasetcode=EXP_MORSC&lang=en (Accessed September 2019).

43
Figure 16: Mortality, morbidity and welfare cost from exposure to ambient particulate matter in Indonesia
Source: Authors, based on OECD 2019d (OECD Environment Statistics Database)
Another study of Indonesia estimated that the total costs attributable to air pollution – including direct damage to crops, forests, and infrastructure and the indirect costs of responding to wildfires and losses in other economic sectors – exceed USD 16 billion annually (IDR 221 trillion). This is more than double the cost of the 2004 tsunami and three times the national health budget in 2015 (World Bank 2015). This figure is greater than the estimates of economic losses from the 1997 forest fires, amongst the largest forest fires recorded in the last two centuries. Air pollution is an important cause of respiratory disease and death in Indonesia. Pneumonia, which has severe effects on pulmonary functions and can be caused by air pollution, is the primary cause of death for infants (22.3 percent) and children under 5 years of age (23.6 percent) in Indonesia and is among the ten most common disease-related causes of death amongst adults. The WHO has estimated that deaths caused by acute lower respiratory infection (ALRI) and deaths attributable to solid fuel use in Indonesia in 2002 amounted to 3,130 (for children under 5 years) (WHO 2002). Deaths caused by chronic obstructive pulmonary disease (COPD), also attributable to solid fuel use, amounted to 12,160 in adults of 30 years old and upwards (Haryanto 2017).
2.4.2. Bottom up health cost assessment in Jakarta The Ministry of Environment conducted a study in 2012 which included a bottom up assessment of the health costs caused by air pollution in DKI Jakarta (Kementrian Lingkungan Hidup 2012). In the study, health costs resulting from ambient air pollution were estimated by using the Cost of Illness (COI) approach. This approach is also used here. In this case, COI are assessed using the following three criteria:
1. There is epidemiological evidence that the disease is linked to air pollution; 2. The disease has been defined as one of the ICD13 codes; 3. The health impacts can be expressed in monetary terms.
Hospital medical records of in-patient and out-patient departments in two hospitals14 were used to measure the value of morbidity. The two hospitals are located within the Jakarta metropolitan area and focus on infectious and respiratory tract diseases. Treatment costs for the treatment of asthma, bronchopneumonia, cancer nasopharyngeal, acute respiratory infection (ARI), chronic lung obstructive disease, pneumonia, and coronary artery diseases were recorded. The medical records
13International Classification of Diseases. 14 Sulianti Saroso Hospital and Persahabatan Hospital
0
10000
20000
30000
40000
50000
60000
70000
1990 1995 2000 2005 2006 2007 2008 2009 2010 2011 2012 2013 2014 2015 2016 2017
Co
st (
mio
USD
PP
P)
Year

44
were then analysed by incidence per 100,000 of the population, and the results extrapolated to the Jakarta population (in 2010: 9,607,787 people). Several studies have used this approach and by illustrating the costs, have resulted in policy changes (Small and Kazimi, 1995; Meduri et al. 1994). Two similar studies were carried out in Indonesia in 1994 (Ostro et al., 1994) and 1998 (Resosudarmo et al. 1998). In Jakarta in 2010, the data show that there were: 1,210,581 people who suffered from bronchial asthma (compared with 500,000 of the population identified by Ostro et al. in 1994); 153,724 people with bronchopneumonia; 2,449,986 with ARI; 336,273 people with pneumonia; 153,724 people with Chronic Obstructive Pulmonary Disease (COPD); and 1,246,129 people with coronary artery diseases. Thus, in 2010, 57,8 percent of the population in Jakarta was reported to have suffered from different air pollution-related illnesses—see Table 8 (Kementerial Lingkungan Hidup [KLH] 2012). In 2016, KPBB updated this data and found that incidences increased by 17.6 percent on average, indicating that health costs for Jakarta citizens are increasing steadily (KPBB 2018). Table 8: Incidence of diseases related to air pollution
Health impacts Incidence Per 100.000
2010 for Jakarta population 15
2016 for Jakarta Population
Increase
Asthmatic bronchiole 12,600 1,210,581 1,489,014 19%
Bronchopneumonia 1,600 153,724 214,265 28%
ARI 25,500 2,449,985 2,731,734 10%
Pneumonia 3,500 336,272 373,935 10%
COPD 1,600 153,724 172,632 11%
Coronary artery diseases 12,970 1,246,129 1,386,319 10%
TOTAL 57,770 5,550,415 6,367,899 17.6% (av.) Source: KLH 2012; KPBB 2018
Associated costs were estimated to range between a minimum of IDR 697,935 million/US$ 76 million and a maximum cost of IDR 38.5 trillion/US$ 4.2 billion, with average costs amounting to 5,675,366 million / USD 618 million (see Figure 17 below). Lower costs are based on estimates using the lower payments for disease treatment extrapolated across the Jakarta population, while the higher costs use the highest payments for disease treatment as the extrapolation factor. This implies that citizens of Jakarta suffering from diseases related to air pollution in 2010 may have paid up to IDR 38.5 trillion/US$ 4.2 billion for their treatment. This upper value is almost twice as much as the national budget of the Ministry of Health in the same year, which amounted to about IDR 21 trillion/US$ 2.3 billion (KLH 2012).
15. Extrapolated to Jakarta population (x 96.07787).

45
Figure 17: Estimated costs of illness on diseases related to air pollution in Jakarta 2010 (in IDR)
Source: Author, based on KLH 2012

46
Table 9: Overview of studies that estimate the costs of diseases related to air pollution in Jakarta (in million IDR) for the years 1990, 2001, 2010 and 2015
Year of cost estimate
1990 1998 2015 2010 average
2010 maximum
References (WB 1990)
(URBAIR 1990)
(Resosudarmo and Napitupulu 2004)
(KLH 2012)
Health Impacts
Asthmatic bronchiole
5,263 11,165 5,000 3,158,993 1,749,380 5,349,096
Bronchopneumonia 33,680 22,330 17,500 71,883 50,812 561,221
ARI 842 4,466 850 26,809,908 597,150 11,698,297
Pneumonia - - - 676,420 1,834,490
COPD - - - 335,271 811,176
Coronary artery diseases
- - - 2,266,334 18,253,187
Hospital Admissions
547,085 346,096 1,515,000 290,588 - -
TOTAL (in million IDR)
587,085 384,096 1,538,350 30,331,372 5,675,366 38,507,467
TOTAL (in million USD)
- - 147 2,278 618,5 4,196
Sources: Authors; World Bank 1990; Resosudarmo and Napitupulu 2004; KLH 201216.
Comparing earlier COI analysis with the 2010 study indicates that the cost of air pollution in DKI Jakarta is on the rise (see Table 8). The COI estimation from 1990 to 1998 shows that COI doubled and that the increase is even more pronounced from 1998 to 2010 and 2015. Resosudarmo and Napitupulu’s (2004) estimates for 2015 were lower than the maximum possible estimates for 2010, according to the KLH (2012) study (see Table 8). Their estimates for COI amount to just IDR 30,331,372/US$ 2.3 billion in 2015, whereas the maximum costs estimated by KLH (2012) for as far back as 2010 were IDR 38,507,467/US$ 4.2 billion. However, KLH’s estimate of average costs for 2010 of IDR 5,675,366 million or USD 618.5 million lie more in line with Resosudarmo and Napitupulu’s (2004) estimates. Differences in these assessments may be attributable to different approaches to generating the data, sampling sizes and the objectives of the institution conducting the study. Figures 18 and 19 suggest a correlation between growth in emissions, rising pollution levels, and rapidly increasing health costs related to air pollution. Irrespective of the question on the use of high or low estimates, the analysis above shows that health care costs linked to air pollution are significant and that spending could be avoided if appropriate policies were put in place.
16 World Bank report no.12083-IND (World Bank, 1994); URBAIR (Indonesia) numbers are estimated by Indonesian consultants during the URBAIR project; Resosudarmo used data from three hospitals: UKI Hospital, Universitas Kristen Indonesia Hospital and Cipto Hospital. The data was adapted to make it comparable. For example, the diseases were summarized given their different names. USD exchange rate for 2010= 9176.6 and 2015= 13314.4.

47
Figure 18: Growth of PM2.5 emissions in Jakarta over the same time period using GAINS model17
Source: GAINS database
2.4.3 Sources of air pollution and hotspots Breathe Easy Jakarta 2017 predicted an increase in air pollutants PM10, PM2.5, SO2, and CO between 2012 and 2030, with the transport sector the largest source of emissions. Figure 19 shows that transport is the single most important source of PM10 emissions and that these are predicted to increase substantially between 2019 and 2030. Figure 19: PM10 total emissions Jakarta, likely trend of PM10 until 2030 based on estimation
Source: (Breathe Easy Jakarta 2017, p. 235). Legend: TR; Transport; IND; Industry; RD: Road Dust; DOM: Domestic; OWB: Open Waste Burning; CON: Construction
17 GAINS database accessed by B. Haryanto – University of Indonesia accessed by 10.9.2019

48
Figure 20: Trends in the motor vehicle fleet in Indonesia (KPBB 2019)
Source: KPBB 2019
It is also of note that sulphur emissions are very high compared to those observed in other Asian cities such as Delhi and Beijing, due to the higher sulphur content in diesel in Indonesia ranging between 1000 ppm and 2000ppm (see figure 21). It is predicted that improvements will be seen once high fuel standards are introduced and more importantly, enforced (Breathe Easy Jakarta 2017). Figure 21: SO2 total emissions and percentage shares for the Greater Jakarta region
Source: Breathe Easy Jakarta 2017, p. 236. Legend: TR; Transport; IND; Industry; RD: Road Dust; DOM: Domestic; OWB: Open Waste Burning; CON: Construction
The GAINS model also projected the development of PM10 emissions and sources to 2030 and predicts that light-duty vehicles will grow in their dominance as the main emitters. Interesting to note is that CO2 emissions are mainly caused by motorbikes (see figure 23). Finally, the GAINS model also predicted that with no policy changes, CO2 emissions from the transport sector could double by 2030.

49
Figure 22: PM10 emissions form road transport in DKI Jakarta18
Source: RCCC_UI 2019 Figure 23: CO2 emissions from road transport19 Source: RCCC_UI 2019
For 2015, hotspots for PM10 emissions were mapped as shown in Figure 24, with the main concentrations in the city centre around congested ring roads (shown as black lines) (Breathe Easy Jakarta 2017). 20 The main sources of PM10 concentrations are vehicle exhausts and industrial emissions. During stakeholder consultations for the study, it was mentioned that the DKI Jakarta government has identified two hotspots in the city centre—Jenderal Sudirman Street and Thamrin Street—as priorities for pollution reduction. When these locations are compared to the map, these
18 GAINS database accessed by B. Haryanto – University of Indonesia: Inventory data for the number and type of vehicles was derived from
an inventory of every single type of vehicle sold in Indonesia from 1990 to 2013, its volume of engine, & type of fuel used accessed by
10.9.2019. 19 GAINS database accessed by B. Haryanto – University of Indonesia accessed by 10.9.2019 20 Atmospheric Transport Modeling System (ATMoS) dispersion model was used, using local specific meteorological data. Application reports for other Asian cities are available at http://www.urbanemissions.info The model allows for multi-pollutant analysis. The data is cross-checked with the 5 DKI Jakarta measuring stations.

50
hotspots seem to have been chosen for political reasons, as they are the main streets with principal Jakarta landmarks, rather than because they are genuine hotspots for ambient air pollution. Figure 24: Total Gridded PM10 emissions over the Greater Jakarta Region
Source: (Breathe Easy Jakarta 2017)
2.5. Conclusions Despite the limited availability of official data, this chapter demonstrated using secondary literature that air pollutant concentrations in Indonesia and DKI Jakarta continuously exceed both national standards and international WHO guidelines. The growth in transport sector emissions (driven by rapid urbanization and an increase in living standards), along with the emissions attributable to seasonal forest fires, waste burning, and coal fired power stations, is exposing Indonesian citizens to ever rising concentrations of harmful pollutants (OECD 2019a). Based on available data, although air pollutant emissions from official data are not necessarily increasing in terms of the annual average, specific pollutants such as PM10 and O3 still spike several times a year—exceeding acceptable national standards and WHO guidelines. In the past, Indonesia and Jakarta have been dependent on international cooperation for reliable and robust air pollution data. In this analysis, it became clear that although MoEF reports on 129 monitoring stations, only 74 are active. Further, these stations are owned by MoEF, BMKG and local environmental agencies, which makes data sharing difficult. No evidence of joint publicly available air pollutant monitoring was found during the research. Therefore, the study had to rely on the publications of past projects. A need that surfaced during meetings with key stakeholders and KPBB experts was the one for more detailed, transparent and regular reporting of pollution concentrations. Instead of annual average pollutant concentrations, data collected daily over long periods of time should be made available to enable the analysis of trends and to inform an understanding of pollution spikes, high emissions concentrations, and hotspots. Such information can feed into the development of targeted proposals to prevent these spikes and thus protect Jakarta’s citizens from the negative health impacts.

51
Transparent and regular reporting could incorporate warning mechanisms if concentrations exceed NAAQS or are consistently higher than WHO guideline values. The governor of Jakarta has launched a new air monitoring app and has announced several strategic actions to address air pollution, described in chapter 3 below. Hence, interviewed experts were hopeful that government might provide further resources to improve the data monitoring situation. Air pollution has a significant economic impact on the citizens of DKI Jakarta. The research has shown that in 2016, 57.8 percent of the population in Jakarta was suffering from different air pollution-related diseases (Safrudin 2018). In 2010, estimated health costs associated with air/pollution reached on average USD 618 million but may have been as high as USD 4.2 billion. The mean value estimated was IDR 5.7 trillion/USD 618 million (KLH 2012; Safrudin 2018). The transport sector contributes between 30 and 40 percent of total PM emissions in DKI Jakarta. Thus, reducing emissions from the transport sector will go a long way towards improving air quality in the city. The next chapter reviews existing initiatives and policies that set out to address air pollution in Indonesia and DKI Jakarta and their impacts, both positive and negative, planned and unplanned.

52
3. Analysis of policy framework for air pollution
3.1. Existing and planned policies to address air pollution from transport in Indonesia and Jakarta
3.1.1. Regulations in Indonesia In principle, a country’s commitment to the reduction of air pollution through implementation of various policies can be gauged by a combination of the following: (i) The extent to which a policy and its implementation details are reflected in the country’s
laws, regulations, strategies and plans; (ii) Whether or not sufficient financial and human resources are allocated to implementation and
enforcement; (iii) Enforcement/capacity for enforcement of these laws and regulations, and (iv) Efforts to monitor the extent to which these commitments are successfully realised and if not,
to review and amend them as appropriate. In view of this, Table 10 below discusses the main laws, regulations, policies, and plans relating to air quality management in Indonesia and their implementation status as of October 2019. Where possible, an evaluation of the extent to which these laws are effective and enforced has also been included.21
21 Qualitative data relating to the implementation status of various policies and regulations and information on challenges associated with implementation and enforcement were derived from the team’s discussions and roundtable meeting with key stakeholders (for more information please see section 1.5, the methodology section in Chapter 1).

53
Table 10: List of Existing National Laws, Regulations, and Plans22
Regulation Fiscal/ non fiscal
Responsible agency
Objective or Targets Implementation Status and Challenges23
Fiscal
Law 28/2009 Fiscal Ministry of Finance
The law on provincial and local taxes (28/2009) was adopted and the tax bases determined in 2009. For provinces possible relevant taxes include: 1) Motor Vehicle Taxes; 2) Excise/Taxes for Transfer of Ownership of Motor vehicles; 3) Taxes on Fuel for Motor Vehicle. City governments are entitled to collect relevant taxes on: 1) Parking Taxes; 2) Rural and Urban Land and Building Taxes.
The law has already been implemented and so far no major issues have been raised by the public. There are already several initiatives that supported BAPPENAS and MoF in developing carbon tax/emission trading scheme. However, there is no political commitment from the national government yet to really implement ETS nationwide. Under Law 28/2009, in 2017, Indonesia passed the ‘Government Regulation on Environmental Economic Instruments’ that provides a basis for ETS implementation; this regulation sets a mandate for an emissions and/or waste permit trading system to be implemented by 2024 (within seven years from its passage). If implemented, the ETS would apply to the power and industry sectors, not transport (ICAP 2020).
Environment
Act No. 21/ 1997
Non fiscal
Ministry of Environment and Forestry
Environmental Management Act Relevance to air pollution: The right for each individual to have a healthy living environment and access information related to environment; obligation of every individual to contribute to environmental protection and restrictions of activities that exceed environmental quality standards; environmental management has to be carried out in an integral way by government agencies in accordance with their duties & responsibilities.
In general, still relevant, as it outlines the principal condition for environmental management – including air pollution. However, this act has been superseded by Act No. 32/2009.
22 For an overview of regulation types in Indonesia please see the annex. 23 Qualitative analysis in this column on implementation status and challenges was derived from one-to-one meetings and the roundtable with key stakeholders, as well as from an analysis by the authors of the policy environment in Jakarta (for more information please see section 1.5, the methodology section in Chapter 1).
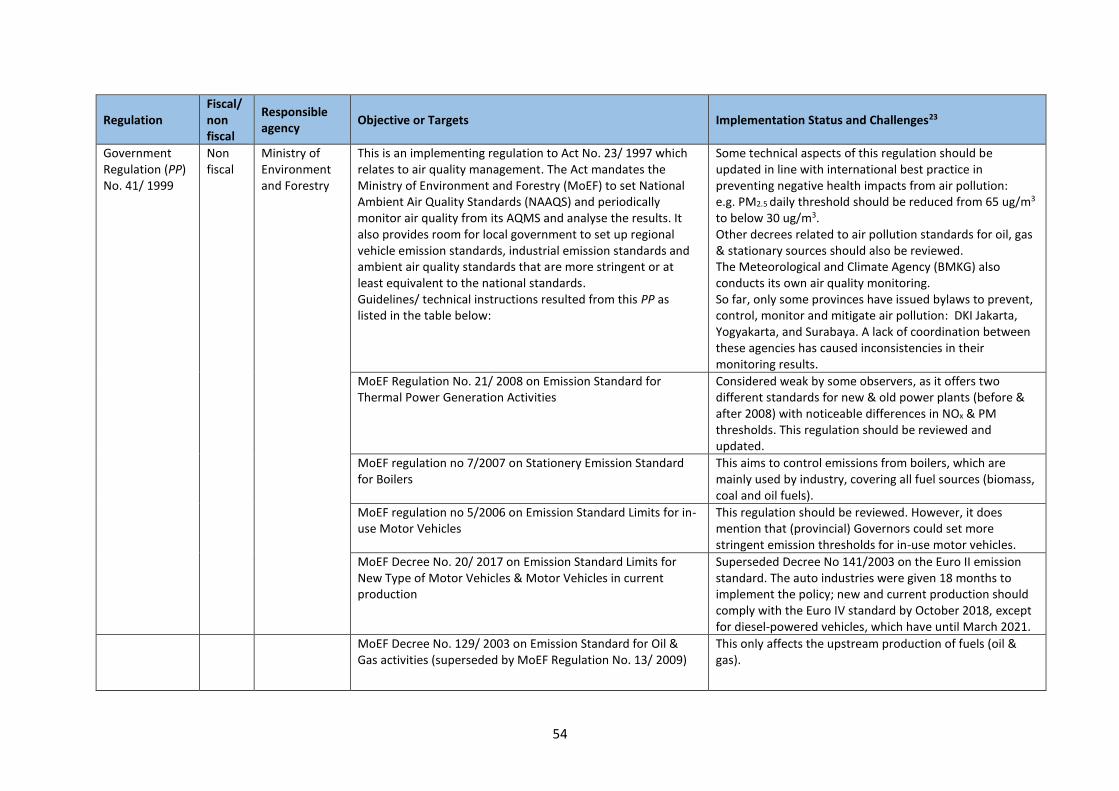
54
Regulation Fiscal/ non fiscal
Responsible agency
Objective or Targets Implementation Status and Challenges23
Government Regulation (PP) No. 41/ 1999
Non fiscal
Ministry of Environment and Forestry
This is an implementing regulation to Act No. 23/ 1997 which relates to air quality management. The Act mandates the Ministry of Environment and Forestry (MoEF) to set National Ambient Air Quality Standards (NAAQS) and periodically monitor air quality from its AQMS and analyse the results. It also provides room for local government to set up regional vehicle emission standards, industrial emission standards and ambient air quality standards that are more stringent or at least equivalent to the national standards. Guidelines/ technical instructions resulted from this PP as listed in the table below:
Some technical aspects of this regulation should be updated in line with international best practice in preventing negative health impacts from air pollution: e.g. PM2.5 daily threshold should be reduced from 65 ug/m3 to below 30 ug/m3. Other decrees related to air pollution standards for oil, gas & stationary sources should also be reviewed. The Meteorological and Climate Agency (BMKG) also conducts its own air quality monitoring. So far, only some provinces have issued bylaws to prevent, control, monitor and mitigate air pollution: DKI Jakarta, Yogyakarta, and Surabaya. A lack of coordination between these agencies has caused inconsistencies in their monitoring results.
MoEF Regulation No. 21/ 2008 on Emission Standard for Thermal Power Generation Activities
Considered weak by some observers, as it offers two different standards for new & old power plants (before & after 2008) with noticeable differences in NOx & PM thresholds. This regulation should be reviewed and updated.
MoEF regulation no 7/2007 on Stationery Emission Standard for Boilers
This aims to control emissions from boilers, which are mainly used by industry, covering all fuel sources (biomass, coal and oil fuels).
MoEF regulation no 5/2006 on Emission Standard Limits for in-use Motor Vehicles
This regulation should be reviewed. However, it does mention that (provincial) Governors could set more stringent emission thresholds for in-use motor vehicles.
MoEF Decree No. 20/ 2017 on Emission Standard Limits for New Type of Motor Vehicles & Motor Vehicles in current production
Superseded Decree No 141/2003 on the Euro II emission standard. The auto industries were given 18 months to implement the policy; new and current production should comply with the Euro IV standard by October 2018, except for diesel-powered vehicles, which have until March 2021.
MoEF Decree No. 129/ 2003 on Emission Standard for Oil & Gas activities (superseded by MoEF Regulation No. 13/ 2009)
This only affects the upstream production of fuels (oil & gas).

55
Regulation Fiscal/ non fiscal
Responsible agency
Objective or Targets Implementation Status and Challenges23
MoEF Decree No. 45/ 1997 on Air Pollutant Standard Index The Pollution Standard Index (PSI) of PM10, CO, SO2, NO2, & O3; needs to be updated & include PM2.5.
MoEF Decree No. 13/ 1995 on Emission Standards for Stationary Sources
Covers emission standards for steel, pulp & paper, coal-fired power plants, cement, & other industries. For Jakarta’s case, DLH is using the threshold to monitor emissions from the stationary sources.
Act No. 32/ 2009
Non-fiscal
Ministry of Environment and Forestry
Act constitutes the basic law for managing & protecting the environment; it mentions sanctions for individuals/ organizations that contribute to the deterioration of air quality; defines the role of the MoEF in setting up air quality thresholds and their responsibility to measure ambient air quality in Indonesia.
Quite effective legal basis to process cases related to haze pollution (of land open burning); some individuals/ companies were convicted & had to go to prison. However, not very effective against emissions from road transport as they cannot be pinpointed. In general, implementation & enforcement remain weak, with efforts focused on high profile cases.
Ministry of Environment and Forestry Decree No. 20/ 2017
Non-Fiscal
Ministry of Environment and Forestry
Issued in response to air pollution problems related to vehicle emissions. Calls on the oil industry to produce fuel of a quality that is compliant with the Euro IV emission standard. Constitutes the basis for the MoEF to carry out its function to manage and protect the environment and ecosystems. Specifically, for air pollution, this law mentions sanctions individuals/organizations that contribute to the deterioration of air quality. It also defines the role of the MoEF in setting up the air quality thresholds &and its responsibility to measure and monitor ambient air quality throughout Indonesia.
Relatively new policy. Implementation of the Euro IV standard started at the end of 2018. The standard is being imposed in order to lower emissions from internal combustion engines. Euro IV requires fuels (both diesel and gasoline) to have a sulphur content of less than 50 ppm to realize air pollutant emissions reductions effectively. The policy of bringing fuel quality into line with the Euro IV standard will only be effective if policymakers are fully aware of the relationship between engine technology and fuel quality. The monitoring task for this regulation has been moved from the Ministry of Environment and Forestry (MoEF) to Ministry of Energy and Mineral Resources (MEMR), which is the responsible authority overseeing fuel production and distribution. However, results of their quality monitoring activities are not widely published.
Government Regulation No. 46/ 2017
Fiscal and non-fiscal
Ministry of Environment and Forestry
An implementing regulation to Act No. 32/ 2009, this legislation refers to environmental economic instruments: a. To integrate environment into the development and economic activities planning;
This policy worked on certain issues, for example sustainable procurement. Currently MoEF selects pilot agencies who would like to implement environmental economic instruments. But BAPPENAS and KLHK do not

56
Regulation Fiscal/ non fiscal
Responsible agency
Objective or Targets Implementation Status and Challenges23
b. Environmental funds available/under development; Guarantee fund, Rehabilitation Fund and conservation fund; c. Incentives and/or disincentives (including ecolabel, sustainable procurement, tax, etc.) The instruments used for guaranteeing accountability and legal compliance in the implementation of environmental protection and management, changing stakeholders’ mind-sets, managing Environment Funds, and public trust building on the fund management.
provide financial support. It is expected that local government will adopt these measures into their local regulation (Perda) system. This regulation provides a basis for the implementation of emissions trading, and several initiatives have already supported BAPPENAS and MoF in the development of carbon pricing (carbon tax or emissions trading). However, there is not yet political commitment from the national government to implement ETS nationwide.
Transport
Government Regulation No. 41/ 2013
Fiscal Ministry of Industry
The policy levies a zero rate of tax on the purchase environmentally friendly and efficient vehicles, the so-called Low Cost Green Cars (LCGC). The zero rate applies to cars with an engine capacity up to 1,200 cc for gasoline and 1,500 cc for diesel vehicles that achieve a fuel economy of at least 20 km per litre.
The latest study conducted by Institute of Transport and Logistic Trisakti and supported by MoT pointed out that that LCGC policy is likely to lead to increased GHG emissions (see forthcoming publication by Sinaga et al.) and that it can be assumed that air pollution has increased as well, since the relationship between GHG & local air pollutants from road transport is roughly linear (as demonstrated in chapter 2). The team found that LCGCs are mainly used in cities, rather than between cities, thus limiting the overall benefits of an increased proportion of LCGCs in the fleet (for a detailed analysis of the LCGC policy see section 3.4.7 below).24
Act No. 22/ 2009
Non-fiscal
Ministry of Transport
The act manages road transport and traffic activities to make them more transparent, accountable and sustainable. The act stipulates that a vehicle emissions test is an integral part of the roadworthiness test, which should be measured every year for public transport.
The act could contribute to air pollution reductions, as it requires road vehicles to operate within certain limits and emphasizes their efficient and safe operation. However, only public vehicles must undergo periodic emission checks in order to extend their license, there is currently no equivalent requirement for private vehicles. The Transport Agency is mandated to measure vehicle emissions. Some
24 Summarized from the Association of Indonesian Automotive Industry (GAIKINDO) Wholesale data.

57
Regulation Fiscal/ non fiscal
Responsible agency
Objective or Targets Implementation Status and Challenges23
cities have discussed implementing mandatory emission standards for private vehicles as well.
Presidential Decree No. 55/ 2019
Non fiscal
Ministry of Industry
This aims to accelerate the electric vehicle (EV) program in Indonesia. According to the Ministry of Finance, this Decree will be accompanied by a Government Regulation that will include fiscal incentives for EVs.
Relatively new policy introduced towards the end of 2019. Alongside roll-out of EVs, the government needs to improve the share of clean or renewable energy in the energy mix, to reduce well-to-tank emissions.
Presidential Decree No. 2/ 2015
Fiscal and non-fiscal
Ministry of Planning (BAPPENAS)
To develop national connectivity, the National Mid Term Plan or RPJMN 2015-2019 aims to improve transport infrastructure and the integration of multimodal-intermodal transport, including increasing the rail freight volumes.
An umbrella plan for mid-term development. The infrastructure development targets were mostly achieved (construction of more road, rail, port, airport infrastructure) but significant improvements in the environmental conditions are still missing.
Ministry of Transport Decree No. 189/ 2015
Fiscal and non-fiscal
Ministry of Transport
Strategic planning document endorsed in September 2015. Maps out how to establish better national connectivity and improved access to transport, including distribution of goods. RENSTRA (Strategic Planning) identifies a need to accelerate multimodal transport and enhance transport services to foster development of Indonesia’s industry & logistics sector.
Same as above.
Energy
Act No. 28/ 2009 Energy Ministry of Transport Decree No. 189/ 2015
Fiscal and non-fiscal
Ministry of Finance Local Government
Legal basis for the implementation of cleaner fuel specification set by the Directorate General of Oil and Gas. Covers operational requirements for opening of downstream markets. Known as Pajak Bahan Bakar Kendaraan Bermotor (PBBKB), this tax is levied on all types of liquid & gas fuels used by motorized vehicles. The mechanism for this fuel tax is regulated under Act No. 34/ 2000, which was then revised into Act No. 28/ 2009 regarding Local Tax & Local Retribution (also known as Pajak Daerah dan Retribusi Daerah or PDRD).
There is currently no earmarking system within the Indonesian budgetary process. Therefore, it is difficult at this moment to assess whether the tax income from fuel is effectively used to address the issue of air pollution. In relation to behavioural change resulting from the tax, increases to tax rates on diesel and gasoline are proposed and potential revenues and impacts on air pollution estimated in chapter 4.
Act No. 22/ 2001
Non-fiscal
MEMR This is the legal basis for the implementation of cleaner fuel specifications set by the Directorate General of Oil and Gas. It covers the operational requirement for the opening of the downstream market.
Following its enactment, several private companies (mainly international) opened their businesses in the downstream markets.
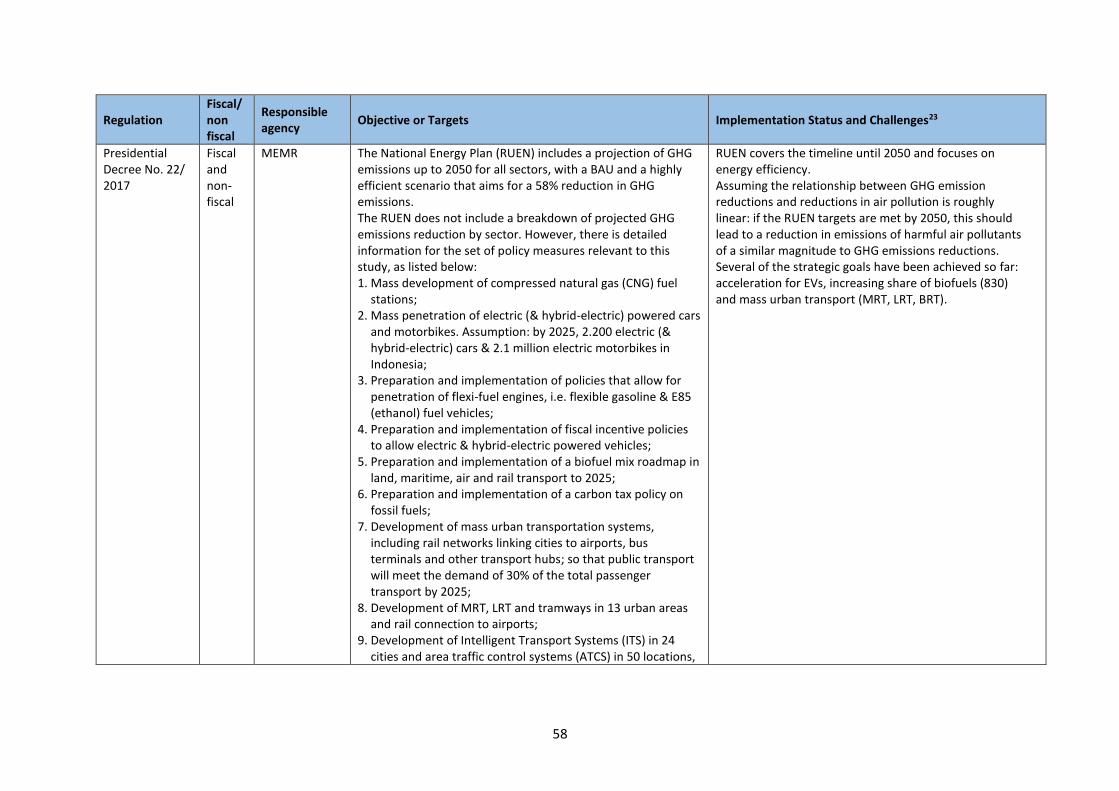
58
Regulation Fiscal/ non fiscal
Responsible agency
Objective or Targets Implementation Status and Challenges23
Presidential Decree No. 22/ 2017
Fiscal and non-fiscal
MEMR The National Energy Plan (RUEN) includes a projection of GHG emissions up to 2050 for all sectors, with a BAU and a highly efficient scenario that aims for a 58% reduction in GHG emissions. The RUEN does not include a breakdown of projected GHG emissions reduction by sector. However, there is detailed information for the set of policy measures relevant to this study, as listed below: 1. Mass development of compressed natural gas (CNG) fuel
stations; 2. Mass penetration of electric (& hybrid-electric) powered cars
and motorbikes. Assumption: by 2025, 2.200 electric (& hybrid-electric) cars & 2.1 million electric motorbikes in Indonesia;
3. Preparation and implementation of policies that allow for penetration of flexi-fuel engines, i.e. flexible gasoline & E85 (ethanol) fuel vehicles;
4. Preparation and implementation of fiscal incentive policies to allow electric & hybrid-electric powered vehicles;
5. Preparation and implementation of a biofuel mix roadmap in land, maritime, air and rail transport to 2025;
6. Preparation and implementation of a carbon tax policy on fossil fuels;
7. Development of mass urban transportation systems, including rail networks linking cities to airports, bus terminals and other transport hubs; so that public transport will meet the demand of 30% of the total passenger transport by 2025;
8. Development of MRT, LRT and tramways in 13 urban areas and rail connection to airports;
9. Development of Intelligent Transport Systems (ITS) in 24 cities and area traffic control systems (ATCS) in 50 locations,
RUEN covers the timeline until 2050 and focuses on energy efficiency. Assuming the relationship between GHG emission reductions and reductions in air pollution is roughly linear: if the RUEN targets are met by 2050, this should lead to a reduction in emissions of harmful air pollutants of a similar magnitude to GHG emissions reductions. Several of the strategic goals have been achieved so far: acceleration for EVs, increasing share of biofuels (830) and mass urban transport (MRT, LRT, BRT).

59
Regulation Fiscal/ non fiscal
Responsible agency
Objective or Targets Implementation Status and Challenges23
together with urban access limitations on freight transport vehicles;
10.Preparation and implementation of road rehabilitation funding through a government revenue mechanism; 11.Establishment of fuel economy standards for motorized vehicles, especially private vehicles, before 2020; 12.Development of a sea toll road system (regular maritime freight service) by providing 150 ships.
Climate Change
First Nationally Determined Contribution (NDC)
Fiscal and non-fiscal
All relevant ministries, coordinated by MOEF
In September 2015, Indonesia officially submitted its INDC to UNFCCC. This included a GHG emission reduction target of 29% below BAU by 2030. The INDC was converted into an NDC and registered with the UNFCCC in November 2016. It includes no specific transport goal or action.
A comprehensive MRV system is still under development. Support from various development agencies are ongoing, e.g. GIZ is supporting the Ministry of Planning and other line ministries to develop MRV methodologies, including supporting MoT to develop MRV for the transport sector with the Centre for Sustainable Transport (PPTB).
Presidential Decree No. 61/ 2011
Fiscal and non-fiscal
All relevant Ministries
The RAN-GRK (national action plan to reduce GHG emissions) is implemented by various line ministries. In relation to air pollution from road transport, the plan has a strong passenger transport and proposes two freight-specific activities—creating a modern logistic system in 12 cities and a replacement program for heavy trucks— that have not been implemented yet. Measures relevant to road transport are being coordinated by MoT.
Progress of the RAN-GRK can be tracked to MER online, which is run by the Secretariat of RAN-GRK. This process is coordinated by the Ministry of Planning.

60
3.1.2. Regulations in DKI Jakarta Table 11: List of municipal regulations relevant to air pollution
Regulation Fiscal/ non-fiscal
Responsible agency
Objective or Targets Implementation Status and Challenges25
Local Government Regulation (Perda) No. 2/ 2005
Non fiscal
Environment Agency
Prevent, control, monitor and mitigate air pollution in DKI Jakarta. This Perda provides the legal basis for Jakarta to set up its local thresholds for air pollution, with reference to the Government Regulation No. 41/ 1999; it also regulates emissions from motorized vehicles, but not industrial emissions.
Implementation is difficult due to limited resources & a lack of coordination.
Local Government Regulation (Perda) No. 5/ 2014
Non fiscal
Transport Agency
Sets out to improve the transportation system and covers both safety and environmental protection and regulates better transportation management for road, rail, waterway and air transport in Jakarta.
This regulation enables the extension of BRT corridors and increased passenger numbers and contributes to the successful construction of the MRT and LRT systems for Jakarta. However, it has not yet been able to contribute significantly to the reduction of private vehicle trips, which are currently dominated by motorcycles.
Governor Instruction No. 66/ 2019
Non fiscal
Multi agencies
Aims to better accelerate air pollution control through a multi sectoral approach among related agencies. It is addressed to the heads of relevant agencies, who are required to come up with more focused efforts to reduce the air pollution problem in Jakarta.
Requires the local transportation agency (DISHUB) to ensure that all public transport fleets are no older than 10 years, and that all vehicles have passed the emissions check. It also aims to put more effort into increasing modal shift from private vehicles to public transport and calls on the local environment agency (DHL) to improve the control of private vehicle emissions through various emission testing campaigns and to better monitor stationary sources of air pollution within Jakarta, e.g., industrial activities, power plants.
Governor Regulation No. 155/ 2018
Non fiscal
Transport Agency
Traffic restrictions implemented by means of the “odd-even” policy aim to improve traffic flows in Jakarta’s main arteries and encourage modal shift from private vehicles to public transport.
This measure does contribute to better traffic flows in six of Jakarta’s main arteries and has resulted in lower air pollution levels. Policy can be regarded as an intermediate measure to address both traffic congestion and air pollution problems. However, as
25 As above, qualitative analysis in this column on implementation status and challenges was derived from one-to-one meetings and the roundtable with key stakeholders, as well as from an analysis by the authors of the policy environment in Jakarta (for more information please see section 1.5, the methodology section in Chapter 1).

61
Regulation Fiscal/ non-fiscal
Responsible agency
Objective or Targets Implementation Status and Challenges25
motorcycles are still excluded it might not be as effective as an alternative, more inclusive policy would be (see Chapter 4). In the long-term, Jakarta needs to accelerate the implementation of Electronic Road Pricing for a more effective traffic volumes & balanced restriction of vehicles.
Various decrees on public transportation
Fiscal MoF This policy sets out to encourage modal shift from private motor vehicles to public transport. The new Mass Rapid Transit (MRT) corridor 1 that connects South and Central Jakarta could potentially contribute to a high modal shift, as could the extension of Bus Rapid Transit (BRT) which now covers 13 corridors across north, south, central, west and east Jakarta, and lastly the Light Rapid Transit (LRT) that is scheduled to be operational by end of 2019 to connect the suburban area of Bekasi and Cibubur with the central business district in Jakarta. For examples of BRT integration see: (https://jdih.jakarta.go.id/uploads/default/produkhukum/No_96_Tahun_2018.pdf), public transport subsidy (https://jdih.jakarta.go.id/uploads/default/produkhukum/PERGUB_62_TAHUN_2016.pdf)
There are already indications that the effort to encourage modal shift is having a positive impact. Average daily passenger for Transjakarta BRT is currently between 800,000-900,000 (Republika 2019) and MRT Jakarta recorded 125,000 passengers on 30. September 2019 (Detik 2019). Combined with the upcoming LRT that will become operational by the end of 2019, and improvement to commuter lines, the government expects to increase modal shift towards public transport still further.
Governor Decree No. 1107/ 2019
Non fiscal
Multi Agencies
The legal basis for setting up the strategic activities (Kegiatan Strategis Daerah or KSD) for each agency & technical unit. E.g. DLH has prioritized a more coordinated air pollution control system, which includes setting up the locations for air quality monitoring stations as well as the plan to procure two new PM2.5 monitoring instruments. Includes measures relevant to transport such as parking management (park and ride), inspection, and maintenance, as well as traffic engineering. In Annex I the activities under KSD No 71 are listed.
The new KSD was updated in July 2019, so there is not enough time to see effectiveness at this moment. However, KSD is also a basis for the review of key performance indicators (KPIs) of the various head of agencies.

62
Regulation Fiscal/ non-fiscal
Responsible agency
Objective or Targets Implementation Status and Challenges25
Note that the table only lists the most relevant activities with the most significant impact.
KSD no.32 on ERP Non-fiscal
Multi agency
Preparatory steps to establish the ERP, such as re-tendering of the necessary infrastructure for ERP, as well as to set up the legal basis for ERP implementation.
At this moment the KSD does not have clarity on when ERP will be implemented. The targets mentioned mainly focused on re-tendering the ERP infrastructure.
KSD no. 35 on Park and Ride
Non-fiscal
Transport Agency
Provides targets to set up parking hubs in several main bus terminals in Jakarta and to design a progressive parking fee system in the city centre. Also, conduct studies on the business model between ride schemes with public transport integration.
At this moment, Dishub is still piloting a park and ride scheme at 2 stations/terminals in Jakarta, in Kalideres (West Jakarta) and Kampung Rambutan (South Jakarta), although Jakarta already provided 5 park and ride locations (the two locations mentioned above plus Ragunan, Pulogebang and M.H. Thamrin street).

63
3.1.3. Summary of the regulatory overview As shown above, the Indonesian and DKI Jakarta governments have put in place several regulations to limit air pollution. Implementation tends to be weak, however, and regulations need to be better aligned and regularly updated to be effective in reducing negative health impacts. The Environmental Management Act 41/1999 provides a framework for the MoEF to issue air pollution standards for industry and other sectors. Yet existing air pollution standards fall below WHO guidelines, and experts on the ground argue that these standards need to be regularly revised and should also include PM2.5. As shown, vehicle emissions standards and fuel quality standards do exist (Act No. 22/ 2009; MoEF Decree No. 20/ 2017), but their implementation, enforcement and monitoring are limited. Emission standards are mandatory for the public transport fleet and are monitored by the Transport Agency in several cities. Mandatory emission standards for private vehicles have also been considered. Improving fuel quality is a complex issue in Indonesia. In 2001, Act No. 22/2001 shifted the fuel quality monitoring mandate from the Ministry of Environment and Forestry (MoEF) to Ministry of Energy and Mineral Resources (MEMR) and opened the market to private companies. Thus far, however, monitoring results have not been widely published and fuel quality was noted as an issue by the experts consulted for this report. The Low-Cost Green Car (LCGC) policy levies a zero rate of tax on the purchase of LCGCs, which would otherwise be subject to the luxury tax. In many cases, LCGCs were purchased by motorcycle owners able to shift to private car ownership for the first time as a result of the subsidy and LCGC car sales increased significantly as a proportion of total car sales. Some research seems to indicate that instead of reducing overall GHG emissions and emissions harmful to human health, the LCGC policy has resulted in increased emissions due to higher volumes of inner-city traffic (Sinaga et al., forthcoming).
Since the Reformasi reform in 1998, which led to the resignation of President Suharto and the introduction of decentralisation by his successor, local governments in Indonesia have been given greater authority to manage their own internal issues, including air pollution. In the context of DKI Jakarta, the government of Jakarta is in control of land use planning, urban transport planning and other city development plans. Given law 28/2009, DKI Jakarta also has the authority to grant licenses to public transport operators and raise several taxes related to car registrations. Jakarta has issued numerous bylaws that cover various policy interventions to improve air quality, mainly through Governor’s Decrees and Instructions. DLH is mandated to conduct air quality monitoring, but so far has only provided limited public information. The government of Jakarta has reacted to the citizen’s lawsuit with two Governor Instructions (GIs) relating to air pollution control: first through DLH and the implementation of vehicle emissions, and second by enforcing an upper age limit for all public vehicles – in effect, a ban on public buses and other public vehicles that are 10 years old or more through the Transport Agency. Some existing traffic-reducing measures, such as the odd-even policy, will be retained, and new measures introduced, e.g. the Electronic Road Pricing system (ERP). Regarding e-mobility, at the time of writing, Jakarta was testing the operation of e-buses along TransJakarta Busway corridors. The large-scale deployment of e-buses and their integration in public transport networks had not yet taken place. Other options for e-mobility include
64
“Grabwheels”, a small electric scooter that can be rented by using the Grab app. However, Grabwheels is controversial and similar systems have been banned in several countries due to safety and reliability issues. At the time of writing, a Grand Design on Air Pollution for DKI Jakarta was being developed with support from external partners. This is expected to be able to lay the foundations for a more coordinated approach against worsening air pollution.
3.2. Recommendations and reflections on the existing policy framework 3.2.1. Updating standards across different government agencies Given that standards have fallen behind international best practice in the measurement and monitoring of air pollution, national legislation on emission standards should be updated, especially government regulation (PP) No. 41/1999. Besides cross-referencing current WHO guidelines, the update should also adjust the current threshold for daily values of PM2.5. MoEF Decree no. 45/1997 also needs to be updated to include PM2.5 in the Air Pollution Index (API). To enforce these standards and maximise the benefits of air pollution policies, improved inter-ministerial coordination is desirable. For instance, realising the benefits from the Euro IV vehicle emissions standard issued under MoEF-issued Decree No. P.20/2017 – which has required automotive industries in Indonesia to produce vehicles compliant with Euro IV emission standards since October 2018 – requires inter-ministerial coordination with the MEMR to ensure that the production of fuels in Indonesia is sufficiently clean to enable vehicles to meet Euro IV emissions standards on the road. Unfortunately, neither Euro IV nor fuel standards have been met, and even Euro IV vehicles continue to emit high levels of pollutants harmful to human health.
3.2.2. Limited enforcement of emission standards from transport The implementation of spot testing of vehicle emissions in accordance with the Air Pollution Act No. 32/ 2009 and Act No. 22/ 2009 on road transport and traffic activity is poor. DKI Jakarta has issued Perda No. 2/2005 on air pollution control and Decree No. 1041 to develop inspection and maintenance systems of private passenger vehicles, but these are not enforced. Perda No. 2/2005 requires public and official vehicles to use Compressed Natural Gas (CNG), LPG, or LNG. In practice, this has a limited impact because only 14,000 vehicles are obliged to use gas out of 100,000 vehicles which could potentially be affected. 26 The Perda applies mainly to rickshaws or three-wheelers, taxis, and buses, but not to operational vehicles of the government or private vehicles. The different agencies involved and difficulties in cross-departmental coordination pose many challenges and prevent effective policy implementation of emissions standards. For example, DLH has the power to monitor and sanction standards violations, but must collaborate with the Police and Traffic Department to ensure that regular monitoring of vehicles is carried out. The traffic police are responsible by law for the enforcement of emission checks (razias) and the sanctioning of vehicle owners if a vehicle does not pass certain emission levels. Thus far, only public vehicles
26 Information from an input to a stakeholder forum hosted by KPBB on 9 September 2019.

65
are undergoing periodic emission checks in order to extend their license as part of the roadworthiness test. As demonstrated above, the national government and DKI Jakarta have enacted very few green fiscal policies and those implemented have had limited success, such as the fiscal incentive scheme for LCGCs. A range of green fiscal policies are possible under Law 32/2009, such as parking fees, motor vehicle taxes (including the luxury tax on vehicle purchase, fees for transfer of ownership and the progressive vehicle tax), as well as taxes on transport fuels, which are currently frozen at provincial level at a rate of just 5 percent. Going forward, in terms of green fiscal policies, it might be advisable to:
1) Review Law 28/2009 regarding possible environmentally related taxes and explore how it can be better used to incentivise environmental improvement;
2) Review Law 32/2009 alongside Law 47/2017 to develop specific environmental taxes that could further reduce air pollution at national and provincial level, and
3) Consider the extent to which budget transfers from national government to local government should be made dependent on environmental performance, including air pollution.
Chapters 5 and 6 make some preliminary proposals based on the approaches listed above and develop a range of fiscal policies to reduce harmful emissions from the transport sector, including where possible, calculations of the revenues raised and health and environmental benefits.
3.3. Jakarta’s budget: revenues and expenditure related to transport and air pollution The section below analyses revenue and expenditure in Jakarta in relation to transport and air pollution using both national data and data relating to Jakarta’s provincial budget. Revenue in Jakarta is largely generated by (i) direct revenue (tax and retribution, wealth management and other income), (ii) revenue sharing (balanced fund generated from revenue sharing between national and local/regional governments), and (iii) other revenues. A detailed breakdown of the processes underlying revenue sharing and general allocation funds are not available in the public domain and revenues are not earmarked. Therefore, for this study it has not been possible to ascertain whether revenues derived from the transport sector (for example, fuel tax, parking fees, etc.) are allocated for activities that improve air quality. Revenue and expenditure in DKI Jakarta related to transport and air pollution are shown in Table 12. Revenues include related taxes and other service or license levies, incomes from facility operations (BRT, forest parks, cemeteries) and grants. Expenditures are allocated for financing transportation improvement programs or subsidies, air quality management and development of green spaces. An analysis of the local budget in 201927 shows that expenditure related to air pollution control is around 39 percent of the revenue earned from the related sectors.
27 Analysis using the online database of (APBD Jakarta 2019). http://apbd.jakarta.go.id/ main/pub/2019/8/1 (accessed September 2019). Note: only related activities are counted, the supporting activities such as building maintenance, administrational purchases, safety equipment etc. are not included in the calculation analysis.

66
Table 12: DKI Jakarta’s revenue and expenditure related to air pollution28
In relation to air pollution in Jakarta, revenues are mostly raised through transportation taxes, i.e. motorized vehicle tax, owner name transfer fees, fuel tax, and parking tax. 29 For motorized vehicles, there is a progressive tax in place, meaning that an individual with more than one car, pays a higher tax for the registration of each additional car. The biggest expenditure items aim to improve public transport development in Jakarta by subsidising BRT, MRT and LRT operators. The public transportation system is also being improved through land procurement for MRT phase 2, school bus services, ‘Mudik Gratis’ – an annual mass pilgrimage journey (the annual movement of
28 Source: Authors’ own calculations based on the online database of Amendment APBD 2019 DKI Jakarta (APBD Jakarta 2019). Revenue: http://apbd.jakarta.go.id/main/pub/2019/8/1/pendapatan; Expenditure: http://apbd.jakarta.go.id/main/pub/2019/8/1/giat/list; http://apbd.jakarta.go.id/main/pub/2019/8/1/btl/subsidi (accessed September 2019). Exchange rate used: USD 1 = IDR 14.165, exchange rate October 2019 taken from InforEUro https://ec.europa.eu/budget/graphs/inforeuro.html. Note: A dot has been used as a thousand separator. To simplify the table, numbers have been rounded ((rounded up for > 0,5; rounded down for < 0,4; some figures appear zero due to very small numbers). 29 DKI Jakarta Government Regulation No. 2 Year 2015; http://peraturan.go.id/common/dokumen/perda/2015/PERDA_NO_2_TAHUN_2015.pdf (Accessed September 2019).
67
urban dwellers to go to their hometown by end of Ramadan to celebrate the Islamic Eid al-Fitr celebration) – operation and maintenance of bus stations, public transportation surveys, and the transportation forum. The provincial government also runs special units for testing motorized vehicle emissions. Additional expenditures aim to improve traffic control. Using the provincial budget, the DKI Jakarta government enhances traffic management by installing traffic control infrastructure, controlling traffic, building parking areas in terminals, and procuring manpower, vehicles and related equipment. Therefore, reducing transport emissions through modal shift and improved traffic management are the main strategies currently employed by DKI Jakarta to reduce air pollution from the transport sector. At the same time, transport in Jakarta also benefits from national expenditure. In March 2019, the President of Indonesia inaugurated the country’s first Mass Rapid Transit (MRT) to address the acute problem of transportation in Jakarta. Improvements to transport infrastructure aim to encourage and accelerate economic growth in Jakarta by creating a more efficient transportation system and so improving the urban environment by reducing the negative impacts of motor vehicle pollution.30 The national government gave a loan of IDR 1.8 trillion/US$ 129.1 million31 for the DKI Jakarta government to finance the MRT construction, and a further grant for IDR 100 million/US$ 7 thousand as preparation for the continuation of an MRT grant programme from JICA. 3233 From 2012 to 2017, the national government invested IDR 3.6 trillion/US$ 604.3 million through the foreign lending scheme loan agreement in DKI Jakarta for MRT development. Other transportation infrastructure projects supported by the national government are the construction of Light Rail Transit (LRT) and highway development. The national government guarantees payment obligations related to bank loans and / or bonds for the LRT project, Jakarta-Cikampek II highway, and Jakarta-Cikampek II Selatan highway. This provision of support and guarantees carries fiscal consequences for the national government in the form of increased demands for the government’s contingency obligations, which have the potential to be an additional burden on the APBN in the event of default. This is a concern, as the overall debt-to-GDP ratio in Indonesia (not only for transportation sector) is predicted to remain at around 30 percent from 2019 to 2022. DKI Jakarta also has a program to control pollution and environmental damage, which aims to improve the environmental quality index by 2022. Revenues for pollution control are allocated for procurement of laboratory equipment; monitoring station parts and maintenance; monitoring
30 See: http://www.anggaran.kemenkue.go.id/content/publikasi/NK%20APBN/2018%20Buku%2011%2020Nota%20Keuangan%20Beserta%20APBN%20TA%202019.pdf 31 The exchange rate used throughout the text is USD 1 = IDR 14.165, the exchange rate October 2019 taken from InforEuro, see: https://ec.europa.eu/budget/graphs/inforeuro.html. 32 Nota Keuangan APBN 2019 (source idem footnote 34) 33 Rate used: JPY 1 = IDR 134.021.

68
air quality and noise levels; monitoring air quality during ‘car-free days’; management of air pollution from immovable sources of emissions; and evaluation of urban air quality. The national government has also allocated a budget for overall environmental function improvement (including pollution handling, research and development on environmental protection) in DKI Jakarta of IDR 3.7 trillion/US$ 260.4 million34 in 2019. DKI Jakarta is also trying to improve the micro-climate of the city by creating green spaces. Most of the budget goes to park development: land and plant procurement; maintenance of park and green belt areas; and development of plant nursery areas. Besides parks, DKI Jakarta also manages city forests and cemeteries. Total green space in DKI Jakarta amounted to 27,488,095 m2 in 2014, including city parks, interactive gardens, public gardens, recreational parks, street green belt, riverbanks, and cemeteries35 (or around 4 percent of DKI Jakarta total land area)36. Existing health programs aim to improve health services in general, rather than focusing on respiratory diseases or other illnesses caused by air pollution.
3.4. Analysis of existing policy measures for road transport and their impact on air pollution37
The section below provides a more in-depth analysis of existing policies based on a series of interviews with policymakers and key stakeholders. These sections capture the most relevant points for the development of recommendations in subsequent chapters.
3.4.1. Traffic restriction measures Over time, a variety of traffic restriction measures in Jakarta have been implemented. The first was the three-in-one policy introduced in the late 1990s until 2016, which aimed to reduce vehicle volumes on Jakarta’s main arteries by allowing only vehicles carrying three or more passengers (DPPL and IWA 2018). This policy was replaced by the “odd-even” policy (details below). The transport agency (Dishub) adjusted the three-in-one policy several times, mainly due to the introduction of the BRT in 2004, indicating that the responsible authority was aware of the relationship between traffic restrictions and modal shift. Interviews with key stakeholders conducted during research indicated that traffic restrictions have only recently been closely evaluated and deliberately related to the objective of improving environmental quality and reducing air pollution. The odd-even policy reduced the number of cars passing certain arteries by half. However, because motorcycles are excluded, the overall impact of the policy on congestion has been limited. Although the main responsibility for regulating traffic activities in Jakarta lies with Dishub, the national government tasked the MoT in 2014 with the establishment of the Greater Jakarta Transport Management Board, the BPTJ (Badan Pengelola Transportasi Jabodetabek) to further improve transport management in Greater Jakarta (Jakarta, Bogor, Tangerang, Depok and Bekasi).
34 Data obtained from: https://www.peta.data-apbn.kemenkeu.go.id/?i=337&v=3&t=2010,2019&s=8&r=ci (accessed August 2019). 35 DKI Jakarta Dalam Angka 2019, page 477-479, https://jakarta.bps.go.id/publication/2019/08/16/eea4f4b387c3024bb4a3a7fc/provinsi-dki-jakarta-dalam-angka-2019.html (accessed September 2019). 36 Own calculation based on data of total land area, DKI Jakarta Dalam Angka 2019, page: 3. 37 Estimations regarding policy implementation and challenges were provided by the core study team, namely experts from KPPB and FKM UI.

69
The focus of the BPTJ’s work is macro-level planning. At meetings with representatives of BPTJ, it became clear that data on passenger-km or passenger trips across Indonesia are not available, although annual statistical data on the modal share of passengers are available for certain areas, particularly the Greater Jakarta region. The JICA-supported Jabodetabek Urban Transport Policy Integration (JUTPI) project has estimated journeys made by transport mode (car, motorcycle, public transport) in 2010 and 2020, as shown in Table 13 (JICA and ALMEC 2012). Table 13: Actual (2010) and projected (2010) travel demand in Jabodetabek Type Travel demand (million trips*) Modal share (%)
2010 2020** 2010 2020**
Car 10.5 14.2 19.8 24.1
Motorcycle 28.1 24.6 53.0 41.5
Public Transport 14.4 20.4 27.2 34.4
Total 53.0 59.2 100.0 100.0 Source: JICA and ALMEC 2012; *) demand excludes non-motorized trips, **) modal share is estimated under scenario two (highway moderate and public transport intensive development)
3.4.2. Odd-Even policy Initially this policy was a temporary measure to control air pollution during the Asian Games in 2018. It works by restricting road vehicles with 4 or more wheels (i.e. excluding motorcycles) passing through the main arteries in Jakarta (Figure 25). Access is restricted to odd or even number license plates on different days of the week, thus reducing the overall number of cars on main roads. Due to its positive effect on reducing speed, travel times and air pollution and in response to civil society lobbying, Governor Regulation No.155/2018 was subsequently adopted and the policy formalised. It is now in place on workdays from 06:00-10:00 and 16:00-20:00 and concerns the five main arteries in Jakarta.

70
Figure 25: The odd-even road segments (ASEAN games recommendation) Source: BPTJ 2019
The BPTJ evaluated the impact of the policy during the 2018 ASEAN games. Average speeds were based on google maps data (every week and every day from 05:00-21:00), while traffic counts were conducted by BPTJ. Average traffic speeds in observed road segments during the Asian Games (in August 2018) increased from 25.12 km/hour in June to 36.83 km/hour in August. On roads in the control group, where the odd-even policy was not implemented, average speeds fell to 24.12 km/hour in August (Asian Games) and 23.14 km/hour in October (Asian Para Games). The BPTJ estimated that potential time saved could generate about IDR 136,742 trillion/US$ 9,653 billion in increased productivity.38 A survey conducted by Dishub in 2019 noted that the odd-even policy has had a positive impact on average speeds, which increased by 9 percent from 25.65 km/hour to 28.03 km/hour on the observed arteries, while trip duration decreased by almost 12 percent from an average of 17 to 15 minutes.39 BPJT also conducted a survey to investigate travel during odd-even hours. Most respondents (37 percent) claimed that they had shifted to motorcycles, 25 percent used public transport, and 17 percent shifted to online taxis or motorcycle taxis. 40
Transjakarta recorded a 5 percent increase in total passengers throughout 12-22 August 2019 after the extension of the odd-even policy in comparison to similar dates in the previous month. In line with the increase of passengers for Transjakarta, there was a 4 percent reduction in the morning and a 6 percent reduction in the afternoon of toll road traffic volumes, particularly the toll road segments located nearby or with toll exits going to/from the odd-even road segments. These developments had a corresponding positive impact on air pollution: During the games, BPTJ estimated that CO2 emissions were reduced by 20 percent as a result of the odd-even policy in August and October 2018 (using June 2018 as a baseline). Dishub has looked specifically at emissions harmful to human health using data from DLH AQMS between 12-22 August 2019.41 These recorded some reductions of PM2.5 emissions: Bundaran HI station recorded a 9.3 percent decrease compared to the previous average, and Kelapa Gading
38 Presentation from BPTJ on the 2nd of August 2019; provided by KPBB. 39 Statistics from a presentation from Dishub, 29th August 2019; provided by KPBB. 40 Presentation form BPJT on the 2nd of August 2019; provided by KPBB. 41 Using data from: Hayam Wuruk-mobile station, Jl Suryopranoto-mobile station, Bundaran HI-stationary station and Kelapa Gading-stationary station.

71
station a 9.4 percent decrease. However, until continuous data become available, the actual impact cannot be precisely understood (Dishub 2019). Due to its positive impact, Dishub has announced that the odd/even policy is being extended (from the current 32 km) to cover approx. 54 km of roadways. However, the odd-even policy is unpopular, with only 44 percent of the Jakarta population expressing their support for the measure (Dishub 2019). More importantly, motorcycles are exempt from the odd-even rule, although they make up around 80 percent of the total vehicle fleet in Jakarta. The BPTJ has indicated that the odd-even policy should be considered a temporary strategy to reduce congestion, to be replaced by more effective and targeted ERP in the longer term.
3.4.3. Fiscal policies to encourage greater use of public transport In line with the national Pro-Poor Growth Policy stipulated by BAPPENAS, the Jakarta Government implements a pro-poor program to provide affordable transportation by subsidizing BRT tickets and train fares for the KRL commuter line (BAPPENAS 2011). The policy is implemented under Jakarta Government Ordinance No. 5/2014, and through the National Act No. 22/2009. The fare discount is applied to encourage people to shift from private vehicles to public transport and so reduce congestion and emissions harmful to human health from the transport sector. The Transjakarta system applies a flat fare for any trips in the inner Jakarta system network, while the commuter line uses distance-based tickets. Both are subsidized to keep ticket prices cheap. The Jakarta Government is also working to establish ticket integration between Transjakarta and the train (KRL Commuter Line) using an electronic transport card. Thus far, subsidies for public transport tickets alone have been insufficient to boost modal shift, because investment is lacking and the level of service in Greater Jakarta requires improvement to address reliability, coverage and public transport speeds. The BPTJ has stated that even though the BRT system has an exclusive bus lane, average speed reaches just 13 km/hour due to obstacle flow in intersections with mixed traffic.42 According to SITRAMP, average commuting times for road vehicles are around 30 minutes, while commuting times on public transport are above 60 minutes (SITRAMP 2011). At the time of writing, national and provincial governments were working together to tackle the problem and incentivise modal shift away from private vehicles to public transport by implementing a number of strategic infrastructure projects, including the construction of 16km of the North-South corridor of the MRT in Jakarta; 42 km of elevated LRT tracks; extensions of commuter rail lines to the east part of Bekasi; and an elevated TransJakarta bus lane.
3.4.4. Fuel Tax The central government has implemented a fuel tax, known as Pajak Bahan Bakar Kendaraan Bermotor (PBBKB) in Bahasa Indonesia, on all types of liquid and gas fuels used by motorized road vehicles (see Table 10). The tax is levied at 5 percent of the pre-tax price per litre of fuel.43 Act no.28/2009 establishes that the national government has the right to collect the fuel tax, while article 2A states that at least 70 percent of revenue belongs to the local government.
42 Presentation from BPJT on 2 August 2019; provided by KPBB. 43 http://www.djpk.kemenkeu.go.id/?p=355 (Accessed August 2019).

72
Several interviews with the BKF and the Deputy Governor for Environment and Land Use Planning of Jakarta revealed that it is challenging to gather precise information about the tax and to ascertain whether 70 percent of the revenue is allocated to Jakarta. This problem is attributable to the lack of earmarking of revenue during budget formulation. Thus, even though such information might be available, it is likely to be scattered across several agencies. Despite all these limitations in terms of the exact value of revenues from the fuel tax, some local media have indicated that DKI Jakarta is amongst those provinces that receive the largest amount of revenue from the fuel tax. The politicisation of fuel prices in Indonesia is apparent in relation to the PBBKB tax: the Ministry of Internal Affairs has instructed provincial governments to reduce the tax in order to stabilise fuel prices in the face of the rising global oil price.44
3.4.5. Fuel pricing policies and fossil fuel subsidy reform from 2015 In Indonesia, the prices of fossil fuels are in theory set by the Ministry of Energy and Mineral Resources (MEMR) and in practice by Presidential Decree. This process takes place within a complex political landscape, with the Energy Law promoting consultation in the setting of fuel prices, most notably the right for parliament to be consulted on each price increase (IEA 2016). In the past, attempts to reform fossil fuel pricing policies in Indonesia have tended to lead to policy reversals in the face of strong opposition. In 1998, for example, weeks of unrest following subsidy reform contributed to President Suharto’s resignation.45 In contrast, the latest round of fuel pricing reforms in 2015 have been relatively successful. Better and more careful planning of reform, good timing, awareness raising and use of revenues to increase spending on health, education and infrastructure have ensured that more recent efforts have been sustained, at least in relation to gasoline. A major driver of subsidy reform in 2015 was budgetary pressure. In 2012, subsidy spending was worth the equivalent of 4.1% of GDP, while expenditure on education amounted to 3.6% and spending on health to just 1% of GDP (ADB 2015). In the same year, the country received USD 2.3 billion in overseas development aid but spent USD 36.2 billion on fossil fuel subsidies (ADB 2016). In 2014, combined fuel and electricity subsidies accounted for 24% of total government spending (IEA 2016). 46 In response, the decision was taken in 2015 to phase out gasoline subsidies and reduce diesel subsidies. In 2016, diesel subsidies were fixed at IDR 1,000 / 7 US cents per litre and allowed to fluctuate in line with the global oil price (Detik 2016; OECD 2019b). This resulted in a fall in total transport fuel subsidies from US$ 19 billion in 2014 to USD 5 billion in 2015 (IEA 2016). As a result, the budget deficit was reduced by 13 percent points, accounting for 1.9 percent of GDP in 2015—as compared to 2.2 percent in 2014 (IISD 2016). In the longer term, however, the continued diesel subsidies have nonetheless proven costly. In late 2019, subsidy spending increased, because the upper limit for subsidised diesel available to
44 https://www.tribunsnews.com/nasional/2018/03/30/harga-bbm-naik-pemda-diminta-turunkan-pajak-bahan-bakar (Accessed August 2019). 45 For a chronology of fossil fuel subsidy reform in Indonesia see IEA 2016, p.68. 46 Alongside subsidies for fossil fuels in the transport sector, electricity subsidies were also reformed gradually in 2015 and 2016. The reform process is not discussed here, as it is beyond the scope of this report.

73
the end of the year increased from 14.5 to 16 million kilolitres, as the initial allocation of subsidised fuel was insufficient. On top of planned diesel subsidy spending of IDR 101 trillion/USD 7 billion, the increase is expected result in approximately IDR 3 trillion/US$ 70 million of additional spending (Jakarta Post 2019a). Several theoretical scenarios have looked at the impact of reform and have predicted positive impacts on GDP, the energy sector, and poverty rates (e.g. ADB 2015). A 2015 input-output analysis to investigate the impact of subsidy reform and revenue reallocation predicted a substantial increase in total economic output in comparison to a business as usual scenario, as well as positive impacts on employment as a result of greater investment in productive capacity (IISD 2016). Modelling predicted a 5-7 percent drop in CO2 emissions in 2015, and a further 9 percent reduction by 2030 due to the cumulative impact of subsidy reform in the transport and electricity sectors (ADB 2015). In 2015 when reform took place, the government acknowledged that fossil fuel subsidies were not sufficiently targeted to address poverty or protect the poorest from energy price increases or fluctuations, even though subsidies were originally implemented for poverty reduction purposes (Chelminski 2018). Prior to reform, the top third of households in income terms accounted for 70% of household consumption of gasoline, while the poorest third of households consumed around 5% of the total (IEA 2016). The strongly regressive nature of fossil fuel subsidies in Indonesia was corroborated by the World Bank, which found in 2012 that nearly 40 percent of fuel subsidies went to the richest 10 percent of households, while less than 1 percent of fuel subsidies went to the poorest 10 percent (Diop 2014). While these statistics underline the regressive impact of fuel subsidies, they do not imply that fuel price increases will not affect the vulnerable populations. Even a relatively small fuel price increase may have negative direct and indirect (e.g. as a result of inflation) impacts on the disposable income of poorer households. To compensate for this, the Indonesian government increased spending on infrastructure, education and health substantially in parallel to the 2015 reform. In future, the government intends to develop oil and gas infrastructure to compensate for subsidy cuts and prevent geographical disparities in fuel prices, to ensure that there is one price for gasoline and diesel throughout the country.47
3.4.6. Support for Electric vehicles Electric vehicles have considerable potential to reduce emissions harmful to human health from the transport sector, particularly if they are used to replace heavy duty vehicles – buses and freight – which emit high levels of emissions harmful to human health. In Jakarta, commercial vehicles, including buses, taxies and urban trucks, account for less than 0.5 percent of the 17 million vehicles circulating in the city but 10-20 percent of total emissions (Grütter Consulting 2019). New policies for electric vehicles (EV) have been expected for some time. However, only in August 2019 did the government officially issue Presidential Regulation No. 55/ 2019 calling for the EV
47 Before the regime of President Joko Widodo in 2014, fuel prices in remote areas such as eastern Indonesia could be as much as double prices in Jakarta, due to lack of fuel stations and higher distribution costs.
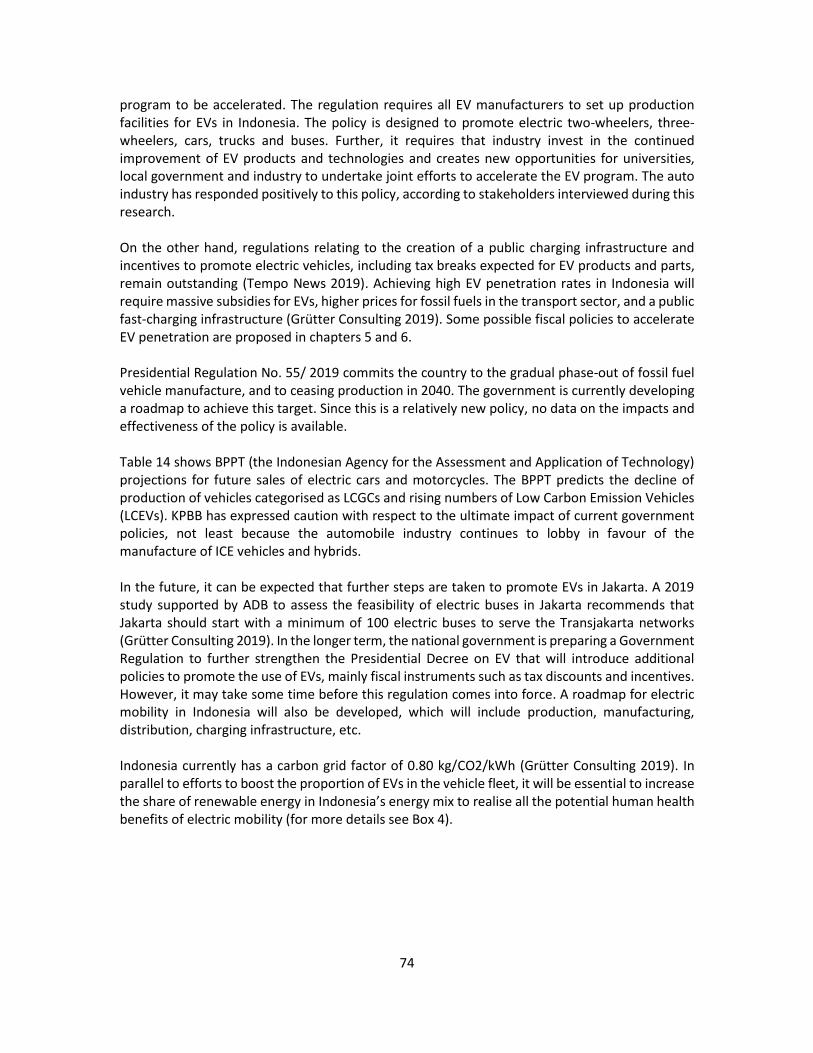
74
program to be accelerated. The regulation requires all EV manufacturers to set up production facilities for EVs in Indonesia. The policy is designed to promote electric two-wheelers, three-wheelers, cars, trucks and buses. Further, it requires that industry invest in the continued improvement of EV products and technologies and creates new opportunities for universities, local government and industry to undertake joint efforts to accelerate the EV program. The auto industry has responded positively to this policy, according to stakeholders interviewed during this research. On the other hand, regulations relating to the creation of a public charging infrastructure and incentives to promote electric vehicles, including tax breaks expected for EV products and parts, remain outstanding (Tempo News 2019). Achieving high EV penetration rates in Indonesia will require massive subsidies for EVs, higher prices for fossil fuels in the transport sector, and a public fast-charging infrastructure (Grütter Consulting 2019). Some possible fiscal policies to accelerate EV penetration are proposed in chapters 5 and 6. Presidential Regulation No. 55/ 2019 commits the country to the gradual phase-out of fossil fuel vehicle manufacture, and to ceasing production in 2040. The government is currently developing a roadmap to achieve this target. Since this is a relatively new policy, no data on the impacts and effectiveness of the policy is available. Table 14 shows BPPT (the Indonesian Agency for the Assessment and Application of Technology) projections for future sales of electric cars and motorcycles. The BPPT predicts the decline of production of vehicles categorised as LCGCs and rising numbers of Low Carbon Emission Vehicles (LCEVs). KPBB has expressed caution with respect to the ultimate impact of current government policies, not least because the automobile industry continues to lobby in favour of the manufacture of ICE vehicles and hybrids. In the future, it can be expected that further steps are taken to promote EVs in Jakarta. A 2019 study supported by ADB to assess the feasibility of electric buses in Jakarta recommends that Jakarta should start with a minimum of 100 electric buses to serve the Transjakarta networks (Grütter Consulting 2019). In the longer term, the national government is preparing a Government Regulation to further strengthen the Presidential Decree on EV that will introduce additional policies to promote the use of EVs, mainly fiscal instruments such as tax discounts and incentives. However, it may take some time before this regulation comes into force. A roadmap for electric mobility in Indonesia will also be developed, which will include production, manufacturing, distribution, charging infrastructure, etc. Indonesia currently has a carbon grid factor of 0.80 kg/CO2/kWh (Grütter Consulting 2019). In parallel to efforts to boost the proportion of EVs in the vehicle fleet, it will be essential to increase the share of renewable energy in Indonesia’s energy mix to realise all the potential human health benefits of electric mobility (for more details see Box 4).
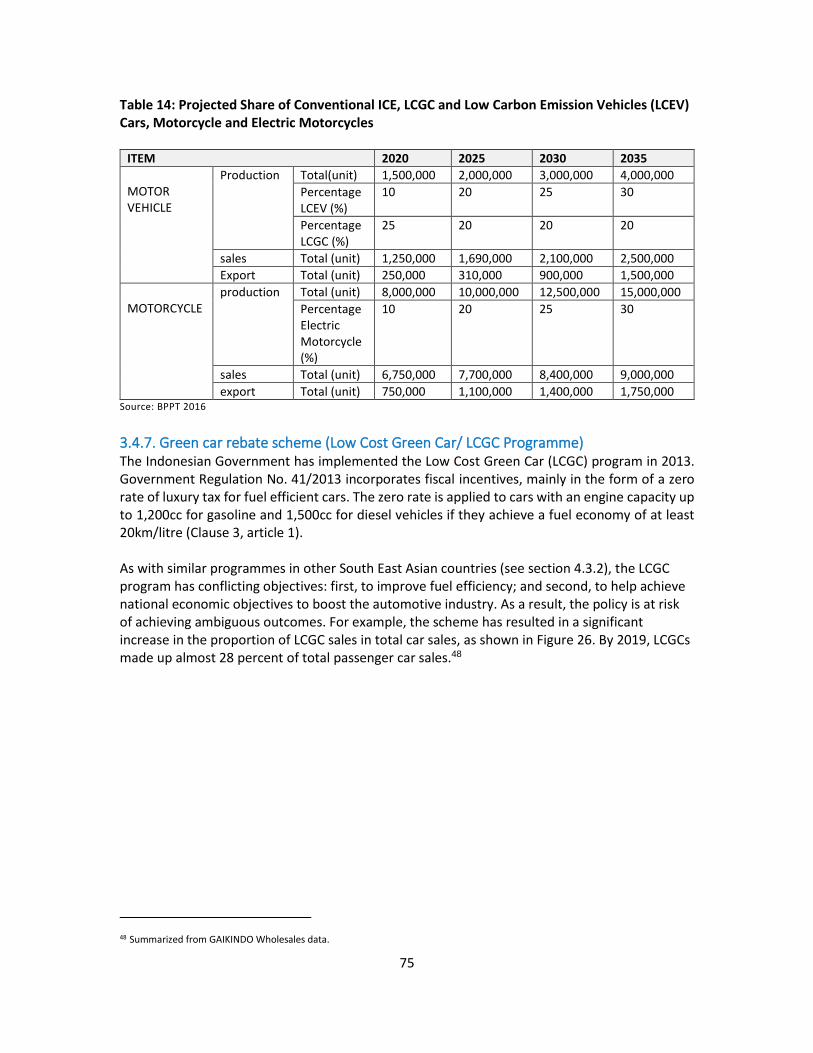
75
Table 14: Projected Share of Conventional ICE, LCGC and Low Carbon Emission Vehicles (LCEV) Cars, Motorcycle and Electric Motorcycles
ITEM 2020 2025 2030 2035
MOTOR VEHICLE
Production Total(unit) 1,500,000 2,000,000 3,000,000 4,000,000
Percentage LCEV (%)
10 20 25 30
Percentage LCGC (%)
25 20 20 20
sales Total (unit) 1,250,000 1,690,000 2,100,000 2,500,000
Export Total (unit) 250,000 310,000 900,000 1,500,000
MOTORCYCLE
production Total (unit) 8,000,000 10,000,000 12,500,000 15,000,000
Percentage Electric Motorcycle (%)
10 20 25 30
sales Total (unit) 6,750,000 7,700,000 8,400,000 9,000,000
export Total (unit) 750,000 1,100,000 1,400,000 1,750,000 Source: BPPT 2016
3.4.7. Green car rebate scheme (Low Cost Green Car/ LCGC Programme) The Indonesian Government has implemented the Low Cost Green Car (LCGC) program in 2013. Government Regulation No. 41/2013 incorporates fiscal incentives, mainly in the form of a zero rate of luxury tax for fuel efficient cars. The zero rate is applied to cars with an engine capacity up to 1,200cc for gasoline and 1,500cc for diesel vehicles if they achieve a fuel economy of at least 20km/litre (Clause 3, article 1). As with similar programmes in other South East Asian countries (see section 4.3.2), the LCGC program has conflicting objectives: first, to improve fuel efficiency; and second, to help achieve national economic objectives to boost the automotive industry. As a result, the policy is at risk of achieving ambiguous outcomes. For example, the scheme has resulted in a significant increase in the proportion of LCGC sales in total car sales, as shown in Figure 26. By 2019, LCGCs made up almost 28 percent of total passenger car sales.48
48 Summarized from GAIKINDO Wholesales data.
76
Figure 26: Total car sales and total sales of Low-Cost Green Cars in Indonesia 2013-2019
Source: GAIKINDO Wholesales data
The LCGC policy has been successful in boosting purchases of more fuel-efficient vehicles as a proportion of total vehicle sales. It is likely to have safeguarded and potentially created new domestic jobs in the automotive industry. Nonetheless, because it does not target emissions harmful to human health, purchases under the LCGC rebate scheme may have resulted in higher overall levels of air pollution. By incentivising passenger car purchases for those previously unable to afford passenger cars, the scheme may have led to higher traffic volumes and increased congestion, reduced modal share for public transportation, and rising concerns relating to air and noise pollution.49 Going forward, the risk of ‘rebound effects’ from promoting so-called ‘green’ vehicles and the impact of such schemes on emissions harmful to human health and GHG emissions should be carefully assessed. Following implementation, such policies should be regularly reviewed to ensure that the policy outcomes are in line with policy objectives. Such considerations will be key when developing a new tax scheme for Low Carbon Emission Vehicles (LCEVs), as it may face similar issues.50
3.5. Challenges and recommendations for specific measures to reduce air pollution in Jakarta
Delays or changes in direction on legislation ERP has been in the pipeline for several years but has not yet been implemented. Discussions with key responsible agencies (Dishub, BPTJ) and KPBB indicate that barriers to implementation relate not only to technical issues, but rather to administrative questions, such as procurement of ERP infrastructure (Berita Satu 2016). For instance, while the Dishub is the responsible agency for
49 Indonesian Stocktaking Report on Sustainable Transport and Climate Change, Ministry of Transport and GIZ, 2018, p.59. 50 In chapters 5 and 6, this report proposes a system to promote vehicles with both low carbon emissions and low emissions of pollutants harmful to human health, see e.g. section 5.2.1. For information on the LCGC and LCEV see: http://www.kemenperin.go.id/artikel/16994/Habis-LCGC,-Terbitlah-LCEV (Accessed August 2019).
77
running the ERP program, it is not responsible for acquiring expensive hardware and software. For this reason, although there have been several pushes from the Governor of Jakarta to accelerate implementation of ERP (mainly through KSD No.32/2019), experts are sceptical that this policy can be implemented in the short or medium term. This suggestion is corroborated by the lack of specific timeline in KSD No.32/2019 for the completion of ERP infrastructure construction, but rather a focus on a new tendering process. A further technical problem is posed by the lack of standardisation of the font used in number plates in Indonesia (plates are generally made by independent vendors), making the development of software for automatic plate recognition impossible (DPPL and IWA 2018). There also appear to be challenges to using the national database of motor vehicles for the purpose of creating software for ERP. These problems may take 2-3 years to address (DPPL and IWA 2018). An example of changes in policy direction are evident in Presidential Decree No. 55/2019 and in legislation relating to EVs that has been amended in response to lobbying from the automotive industry. Experts have warned that the Decree on EVs might not be effective, due to the influence of a strong automotive industry lobby in favour of conventional ICE vehicles (CNN Indonesia 2019). The auto industry is moving towards selling low carbon emission vehicles (LCEVs) but tends to promote Plug-in Hybrid Electric Vehicles (PHEVs) rather than Battery Electric Vehicles (BEVs) (Kompas 2018). The newly introduced fiscal incentive scheme for EVs does not subsidise EVs enough to boost the market share of EV vehicles substantially, as ICE vehicles remain the cheaper option.

78
3.6. Conclusions This chapter described a wide range of regulations put into place as early as 1997 to mitigate air pollution in Indonesia, covering environmental, energy, industry, and transport related issues. It has shown that many regulations are in place for proper air quality management at national and municipal levels, but many challenges exist when it comes to their implementation. Thus, there are strong arguments in favour of updating and adjusting some of these regulations to establish a stronger legislative basis for more stringent air pollution control. At the same time, this chapter also showed that there are gaps existing in current legislation, which new fiscal or other policy measures could potentially fill, such as a lack of credible incentives in favour of low-emissions vehicles. Given the recent momentum behind measures to reduce air pollution due to the citizen’s lawsuit and rising awareness of the scale of the human health impacts of breathing polluted air, the national government and especially DKI Jakarta currently enjoy a window of opportunity to introduce fiscal and other measures to reduce harmful emissions. Chapter 4 looks at international best practice in fiscal policy, while chapters 5 and 6 go on to develop proposals for fiscal policies to reduce harmful emissions from transport tailored to the Jakarta context.

79
4. International best practice: Potential fiscal policy reform options
4.1. Introduction: fiscal policy design and complementary measures Choosing and designing fiscal policies to reduce emissions harmful to human health from the transport sector is a complex process. Ambient air pollution concentrations are not distributed uniformly in urban areas but are concentrated in hotspots such as central business districts, traffic intersections and signalised roadways and thus, fiscal instruments must ideally address these spatial disparities. Emissions also vary over time depending on traffic volumes and may vary in severity depending on meteorological conditions, requiring policymakers to develop instruments to address such temporal considerations as well (Giulia et al. 2015). Furthermore, instruments must take into account that a range of pollutants are damaging to human health – such as SO2, NOx, CO and particulate emissions – and that these are attributable to various sources, such as poor-quality fuels, fuels with high sulphur content, or poorly functioning vehicle engines. As a result, transport policy must achieve multiple objectives and outcomes to successfully reduce harmful emissions. To address these challenges and the multiple market failures associated with them, policy measures in the transport sector tend to be most effective when implemented as a complementary package of measures (see e.g. Public Health England 2019; Wappelhorst et al. 2018). There is a tendency for policy review and impact assessments to focus on GHG emissions reductions rather than reductions of harmful pollutant emissions. In general, however, there is a correlation between the two. Measures that result in reduced demand for a product or service, e.g. by promoting switching to cleaner, more efficient transport modes, tend to bring about a commensurate percentage reduction in both GHG and air pollutant emissions (Air Quality Expert Group 2007). Thus, while the cases below focus on examples where positive and measurable health impacts have been identified, some instruments which have the potential to significantly reduce demand for e.g. private transport, have also been highlighted as potential fiscal policy instruments for Jakarta. The following sections look at successful experiences of applying fiscal policies to reduce emissions harmful to human health from road transport. Many of these instruments have been widely applied, and general lessons learned as well as specific country cases are presented.
4.2. Fuel taxes
4.2.1. Excise duties on transport fuels Transport fuel taxes are the most common fiscal policy instrument relating to transport policy. For many governments, taxes on transport fuels are primarily regarded as a revenue-raising instrument, rather than a measure to reduce transport emissions. Indeed, in some countries, fuel tax revenues account for a substantial proportion of total tax revenues e.g. South Korea (33 percent) and India (15 percent) (Timilsina and Dulal 2015).

80
However, there is a large body of evidence that fuel taxes are also effective in reducing transport fuel consumption and thus emissions of harmful air pollutants and GHGs, particularly over longer timescales. In the short-term, fuel taxes increase the price of transport fuels and thus, encourage consumers to use fuels more efficiently, to change their behaviour e.g. by cutting down on unnecessary journeys, and to shift to cleaner transport modes, such as public transport. In the longer term, such measures may also encourage increased consumption of fuel-efficient vehicles.51 Thomas Sterner (2007) calculated that if all OECD countries had gasoline taxes at the average level of taxation in EU countries over a relatively long period (of about ten years), then gasoline consumption would have been reduced by 57 percent in the USA, 36 percent in Canada, Australia and New Zealand, and 34 percent in Japan. His calculations indicate that CO2 emissions from transport fuels can be cut by more than half by introducing a long-run policy of high transport fuel taxes that raise consumer prices by a factor of 3. Given the relationship between GHG emissions and harmful pollutants delineated in chapter 2, a similar impact on harmful pollutants would also have been achieved. Care should be taken when setting transport fuel tax rates on different fuels, to ensure that distortions do not result in unintended effects on air pollutant emissions. For example, in the last 20 years in the UK, a tax cut on diesel excise in 2001 and vehicle registration and circulation charges for diesel vehicles have resulted in a 406 (2007) increase in diesel vehicles, and corresponding unintended increases in air pollutant emissions harmful to human health (UK Office for National Statistics 2018). When these measures were initially implemented in the early 2000s, they were intended to encourage the uptake of diesel vehicles to reduce GHG emissions in the transport sector. However, emissions harmful to human health from diesel vehicles were not taken sufficiently into account at the time. Given the clear evidence available today of the harmful emissions associated with diesel vehicles, fuel excise must take this into account and the rate of duty on different fuels be set accordingly. Possible negative social impacts resulting from fuel price increases are also a concern and are addressed in Box 1. In relation to the design of fuel excise: Many European countries initially introduced fuel excise duties at a relatively low rate and increased them gradually and predictably over time. The Ecotax in Germany, clearly labelled as an environmental tax, was realised in stepwise increases over 5 years from 1999 and remains in place today. Conversely, if price increases are poorly communicated or perceived to be excessive or prolonged, this can result in protests and policy reversals, as in the UK in 1999, when the fuel duty escalator was withdrawn in response to protests.
51 Although consumption of cleaner vehicles can be more directly incentivised through vehicle registration fees and circulation taxes, see section 4.3.

81
Box 1: Impacts of fiscal policies on the poor in the transport sector
Evaluating the impacts of fuel price increases resulting from fiscal policies on specific income groups is not a simple exercise. Impacts are not uniform, even within individual countries. Regressive impacts may be a minor concern if household spending on the items subject to new taxes, fees or charges are relatively low, but a serious concern in cases where spending is much higher. There is a body of evidence that shows that fuel taxation is generally strongly progressive in African and large Asian countries, because transport fuel taxes are in many low- and lower-middle-income economies luxury taxes on goods consumed disproportionately by wealthier income groups (see e.g. Morris and Sterner 2013; Pizer and Sexton 2017). Such directly progressive impacts may be reduced or even reversed due to indirect effects on commodity prices and inflation, although these tend to level off over time (Beaton et al. 2013). Clearly, for poorer households, even a relatively small change in disposable income can have serious consequences and steps must always be taken to ensure suitable welfare or compensation mechanisms are in place. Research focused on road pricing measures and circulation taxes in the OECD has shown that they tend to be regressive, with poorer income groups spending a greater proportion of their income on the charges than wealthier groups. However, if the additional benefits of improved air quality, price correction and resource allocation are taken into account, lower income groups fare better than average (Leung, Perkins and Wagner 2018). Key to addressing the impact of the higher road prices is to ensure that reasonable alternatives are available and to ensure that these are affordable (for example, by distributing low-cost or free public transport tickets). In general, this has also been found to be the case for registration taxes for vehicles, particularly in those countries where vehicles are a luxury item (Kosonen 2012). Fiscal measures can also have indirect impacts due to rising commodity and product prices as a result of the pass-through effect of price increases. These impacts are hard to predict and vary depending on the consumption baskets of poor households, their ability to substitute for greener alternatives, and their direct and indirect sensitivity to changing transport, energy or commodity costs. The urban poor, generally most dependent for their basic needs on goods transported from elsewhere, can be expected to be most vulnerable to such effects (Fay et al. 2015). Indirect effects should be monitored carefully and compensated for where necessary.
4.2.2. Carbon taxes on transport fuels A concrete example of a carbon tax on transport fuels leading to a rapid decrease in emissions can be seen in Figure 27. Figure 27 The carbon tax in British Columbia was introduced in 2008 at a rate of USD 7.5 /tCO2e and increased by USD 3.8 annually until it reached US$ 22.6/tCO2e in 2012. Following implementation of the carbon tax, fuel sales in British Columbia fell, while fuel sales in the rest of Canada increased. This brought about corresponding reductions in CO2 emissions, estimated to have amounted to about 10 percent between 2008-2011 (Elgie and McClay 2013). There has not been an analysis of the impact of the carbon tax in British Columbia on harmful emissions. However, given the correlation between reduced GHG emissions and harmful air pollutant emissions, it is likely that the reduced consumption of gasoline shown in Figure 27 and the greater uptake of hybrid vehicles – double the national average – resulting from the carbon tax brought about commensurate reductions in emissions harmful to human health from the

82
transport sector (Harrison 2013). Data from similar countries indicate that these emissions reductions are likely to have resulted in improved human health outcomes. Although no figures are available for British Columbia, estimates for the USA indicate that health benefits offset the cost of carbon reduction policies by as much as 1050 percent (Cuevas and Haines 2016). In East Asia, the monetised health benefits of GHG emissions reduction policies have been estimated to exceed abatement costs by 10-70 times (West et al. 2013). At the same time, the tax did not have any discernible negative economic impacts and due to the revenue recycling mechanisms, social impacts were broadly positive. Social compensation measures were implemented through tax cuts: a reduced income tax rate for the two lowest income tax bands, and a lump sum payment referred to as “low-income tax credit” for low income households. Corporate income tax was also reduced from 12 to 10 percent over two years, and the small business rate from 4.5 to 2 percent over three years. Furthermore, a one-off Climate Action Dividend of IDR 1 million/ US$ 75 was paid to all citizens in 2008 (Harrison 2013). The equity impacts of carbon taxes are important in the context of human health, because they affect a wide range of socioeconomic factors which are important drivers of health (Cuevas and Haines 2016). Thus, to maximise positive health impacts, it is important to ensure that fiscal policy interventions act as redistributive, progressive mechanisms—for example, by funding access to public transportation or universal health coverage (Cuevas and Haines 2016). Two important design factors have helped to ensure its success. Firstly, a binding legislative commitment was made to recycle all revenues to individuals and firms via tax cuts – legislation to enact the tax included a clause for the Finance Minister’s salary to be cut by 15 percent if this rule was not applied (Harrison 2013). Secondly, over time, policymakers have become dependent on the tax revenues and are politically vulnerable to their reform: revenues are used to fund tax cuts and support low-income households, particularly households with lone parents. If the provincial government reduces or removes the carbon tax, new sources of revenue will be needed to cover the cost of the tax credits for poorer and more remote households, or these measures too will need to be withdrawn. Figure 27: Sales of petroleum fuels subject to the carbon tax
Source: Elgie and McClay 2013

83
4.2.3. Differentiated taxes to encourage take-up of cleaner fuels Even relatively small tax differentiations between leaded and unleaded petrol, or high-sulphur and low-sulphur diesel, can drive rapid behavioural change in the transport sector. In Thailand, a tax differentiation was introduced in 1991 to reduce air pollution from lead, particularly in Bangkok. The tax was one element in a package of measures that also included awareness raising about the health impacts of leaded petrol, and steps to liberalise fuel markets and support oil companies in the production of unleaded fuels. Consumers responded rapidly to the price differential between unleaded petrol, which amounted to 1 Thai baht – a difference per litre of around IDR 77 (unleaded petrol cost THB 14/litre and leaded petrol THB 15/litre). Within 30 days of introducing unleaded fuels, their share had already risen to 30 percent of total fuel sold. Within 2 years, lead concentrations in key monitoring stations had dropped by up to 93 percent, and on average by about 70 percent in comparison with 1990 levels. By 1995, leaded petrol had been phased out altogether. The Pollution Control Department (PCD) in Thailand has estimated that health benefits of the measure were worth THB 7 billion / US$ 280 million annually52 (Cottrell et al. 2016). Following the introduction of unleaded fuel, concentrations of lead in the blood of schoolchildren were found to have decreased. Considering that elevated lead concentrations in the late 1980s in Bangkok were estimated to have resulted in 30,000-70,000 children suffering loss of 4 or more IQ points, the reduction of lead concentration can be said to have carried an improvement in cognitive development of children (see e.g. Ruangkanchanasetr et al. 1999; Lovei 1998). Globally, the impact of the phase out of lead in transport fuels has been estimated to result in 1.2 million avoided premature deaths annually and the overall global benefit to be worth over US$ 2 trillion annually (Tsai and Hatfield 2011). Many similar examples of differentiated taxes on leaded and unleaded fuels, or high- and low-sulphur diesel, have successfully contributed to reducing emissions harmful to human health. For instance, differentiated sulphur taxes levied on diesel imports in Hong Kong in 1995 supported the transition from 5,000 ppm sulphur diesel to 500 ppm diesel by 1997, and 50 ppm by 2000. Subsequently, taxes were reintroduced in 2007 to promote the transition to ultra-low-sulphur diesel of 10 ppm (ICCT 2014). Differentiated taxes were also introduced on leaded and unleaded petrol. Complementary measures regulated vehicle imports and the sulphur, lead and benzene content of fuels, subsidised retrofitting and LPG conversion of diesel taxis. Prior to these reforms to reduce the content of sulphur and other pollutants in transport fuels, transport sector emissions accounted for 90 percent of all air pollution in the city (Hung 2006). The Environmental Protection Department of Hong Kong estimated that the cost of illness (COI) attributable to SO2 emissions amounted to US$ 18 million in 1996, while COI attributable to all air pollutants amounted to US$ 259 million in the same year (cited in Hung 2006). While no data is publicly available quantifying the health benefits of differentiated sulphur taxes, the Poisson regression model53 has projected average gains in life expectancy. It predicts that, in
52 1995 exchange rate used: https://ec.europa.eu/budget/graphs/inforeuro.html (accessed 23 Jan 2020). 53 The model uses data from 1985 to 1995 to compare life expectancy before and after first measures implemented to reduce SO2
concentrations in Hong Kong in 1990. Subsequent actions had a much more significant impact on SO2 concentrations and presumably, therefore, also a much more significant positive impact on human health.

84
the city, women gain 20 and men 41 days in life expectancy for every year of exposure to lower ambient air SO2 concentrations (Hedley et al. 2002). Prior to the implementation of differentiated fuel taxes on lead and sulphur content, a US$ 34 increase in health expenditure days between 1996 and 1999 was predicted: this escalation in health costs was at the very least alleviated as air quality improved (Hung 2006).
4.3. Differentiated vehicle registration charges and feebates in Europe and South East Asia, including measures targeting motorcycles
4.3.1. Two European models: French feebate and Norwegian vehicle registration charges In the European context, creating significant tax advantages for low-emission vehicles at the point of purchase tends to have a greater impact on consumer choice and thus on the vehicle fleet than annual tax payments, even if circulation taxes are also differentiated in line with vehicle emissions (Wappelhorst et al. 2018). In France, the feebate system introduced in 2008 has been successful in reducing CO2 emissions per vehicle and emissions harmful to human health. France’s feebate system subsidises the purchase of low-emissions vehicles, while penalising vehicles with higher CO2 emissions: This means that consumers purchasing a low-emissions vehicle will be given a rebate for part of the purchase price, while consumers purchasing a high-emissions vehicle will be required to pay an additional fee. In its first year, the OECD has estimated that the feebate policy reduced CO2 emissions by roughly 4.8 million tonnes and delivered welfare benefits of roughly US$1.7 billion due to reduced air pollution and congestion (OECD 2019c).54 However, in its first three years, the feebate weakened public finances by an average of US$419 million annually, far more than the French government had projected, as purchases of low-emissions vehicles rose more rapidly than predicted: indeed, following its implementation, the scheme led to a 3.5 percent increase in car purchases (OECD 2019c; Yang 2018; EEA 2018).55 Subsequent changes to the design reduced the risk of overspend and rebound effects by making annual adjustments to maintain a balance between fees collected and rebates paid and by reducing the size of steps between categories, to reduce the risk of car manufacturers producing cars which achieved emissions at the top of a specific rebate emissions range (Yang 2018). One of the most successful examples of differentiated registration taxes has been implemented in Norway, where there is no feebate but significant differences in one-off taxes at the point of purchase. EVs are exempt from the 25 percent VAT payable on the list price of a new vehicle and the registration tax payable on CO2 and NOx emissions. The tax liable is the sum of the three tax elements shown in Table 15. If the sum of all three taxes for which the purchaser is liable is negative, the tax is not refunded.
54 The magnitude of these figures is uncertain, as they predict the impact of changes to the fleet in 2008 until vehicles are withdrawn from use. If policies banning diesel vehicles from city centres were subsequently implemented, this would result in far more substantial falls in pollution from diesel vehicles. 55 Exchange rate average 2008-2010 taken from the European Central Bank: https://www.ecb.europa.eu/stats/policy_and_exchange_rates/euro_reference_exchange_rates/html/eurofxref-graph-usd.en.html.
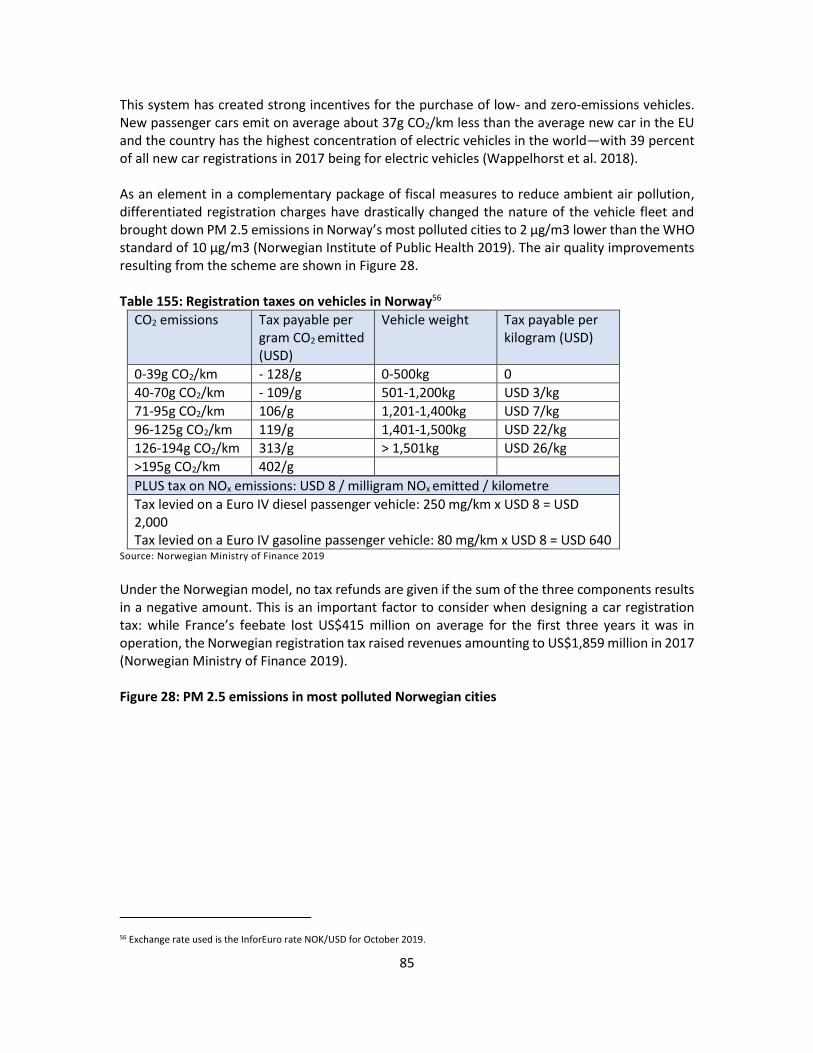
85
This system has created strong incentives for the purchase of low- and zero-emissions vehicles. New passenger cars emit on average about 37g CO2/km less than the average new car in the EU and the country has the highest concentration of electric vehicles in the world—with 39 percent of all new car registrations in 2017 being for electric vehicles (Wappelhorst et al. 2018). As an element in a complementary package of fiscal measures to reduce ambient air pollution, differentiated registration charges have drastically changed the nature of the vehicle fleet and brought down PM 2.5 emissions in Norway’s most polluted cities to 2 μg/m3 lower than the WHO standard of 10 μg/m3 (Norwegian Institute of Public Health 2019). The air quality improvements resulting from the scheme are shown in Figure 28. Table 155: Registration taxes on vehicles in Norway56
CO2 emissions Tax payable per gram CO2 emitted (USD)
Vehicle weight Tax payable per kilogram (USD)
0-39g CO2/km - 128/g 0-500kg 0
40-70g CO2/km - 109/g 501-1,200kg USD 3/kg
71-95g CO2/km 106/g 1,201-1,400kg USD 7/kg
96-125g CO2/km 119/g 1,401-1,500kg USD 22/kg
126-194g CO2/km 313/g > 1,501kg USD 26/kg
>195g CO2/km 402/g
PLUS tax on NOx emissions: USD 8 / milligram NOx emitted / kilometre
Tax levied on a Euro IV diesel passenger vehicle: 250 mg/km x USD 8 = USD 2,000 Tax levied on a Euro IV gasoline passenger vehicle: 80 mg/km x USD 8 = USD 640
Source: Norwegian Ministry of Finance 2019
Under the Norwegian model, no tax refunds are given if the sum of the three components results in a negative amount. This is an important factor to consider when designing a car registration tax: while France’s feebate lost US$415 million on average for the first three years it was in operation, the Norwegian registration tax raised revenues amounting to US$1,859 million in 2017 (Norwegian Ministry of Finance 2019). Figure 28: PM 2.5 emissions in most polluted Norwegian cities
56 Exchange rate used is the InforEuro rate NOK/USD for October 2019.

86
Source: Central database for air monitoring data, Norwegian Environment Agency 57 *Dotted line represents upper limit values for PM2.5 based on pollution regulations, the solid black line air quality criteria defined by the Norwegian Institute of Public Health
4.3.2. Vehicle registration taxes in South East Asia, including measures targeting motorcycles Such measures are also becoming more common in South East Asia. Many countries in South East Asia have introduced incentives for low-emissions vehicles, defined on a country-by-country basis, but in general referring to cars with a relatively small engine. In the past these schemes have been geared towards stimulating the domestic car industry to manufacture ICE vehicles and subsidising manufacturing. There is little evidence that such programmes have positive impacts on fossil fuel vehicle emissions, particularly on emissions harmful to human health. The first-time car buyer incentive scheme in Thailand, for example, drove a sharp increase in vehicle sales of 1.25 million new vehicles while the policy was in force between September 2011 and the end of 2012 (Israngkura 2014). In 2016, Thailand introduced a vehicle registration scheme based on CO2 emissions. The scheme levies an excise duty of 25 percent on the purchase of vehicles with emissions of <100gCO2/km, a 30 percent duty on vehicles emitting 100-150gCO2/km, a 35 percent duty on vehicles emitting 150-200gCO2/km and a 40 percent duty on higher emitting vehicles. There was no data available at the time of publication on the impacts of these changes on the vehicle fleet and as a result it is not possible to estimate impacts on harmful emissions. However, experience elsewhere has shown that schemes targeting CO2 emissions alone may encourage higher proportions of diesel vehicles in the fleet, which may result in higher levels of emissions harmful to human health (see the case of the UK, above, in section 4.2.1). In the past, Thailand has also tried to encourage the purchase of lower emissions motorcycles using differentiated vehicle excise duty. In 2011, a 10 percent excise duty was introduced on two-stroke motorcycles, while four-stroke motorcycles were liable to an excise duty of 3 percent (Israngkura 2014). Two-stroke motorcycle engines emit 10-40 percent more hydrocarbon and particulate emissions, and consume more fuel, than four-stroke engines (ICCT 2009). However,
57 Sourced from Norwegian Institute of Public Health website: https://www.fhi.no/en/op/hin/environment/air-pollution-in-norway---public-he/

87
the scheme was abandoned in 2012 in response to pressure from motorcycle manufacturers in Thailand. Rates were subsequently levied according to engine size, irrespective of whether the engines were two- or four-stroke: 3 percent on vehicles under 150cc, 5 percent on vehicles between 150-500cc and 10 percent on 500-1,000cc motorcycles (PWC customs 2013). The former measure was in place for a duration of approximately 12 months and thus had at best a very small impact on harmful emissions. In 2018, proposals were mooted to introduce excise duties on motorcycles in line with their CO2 emissions, but it has been estimated that these changes will bring about a 0.05 percent increase in the purchase price of new motorcycles. Thus, the excise duty is not likely to impact motorcycle purchases nor harmful emissions from motorcycle engines (Bangkok Post 2018).
88
4.4. Different forms of congestion charging, including electronic road pricing
4.4.1. Congestion charging in Stockholm and London Congestion charges can target hotspots of pollution in cities relatively well by reducing congestion on main roads into the city centre and by reducing traffic volumes in the central business district. Ideally, a charge should differentiate between time of day, location and traffic volumes – although the latter is more challenging to implement (Eskeland 2015). The congestion charge introduced in Stockholm in 2007 is a successful example. The charge of USD 0.9-3.70 is levied on vehicles entering the congestion pricing zone on workdays, the price varying depending on the time of day and crossing location. Vehicles using alternative fuels were initially exempt to stimulate the market but later included in the charge. Charges are imposed automatically using licence plate scanning technology, so there are no delays or congestion at the charge boundaries. The Stockholm charge has been effective in reducing traffic volumes, which fell by 25% three weeks after the introduction of the charge and has remained stable at about 22 percent below pre-charge levels. Over time, congestion has been reduced by 30-50 percent and public transport use increased by 10-15 percent (Eliasson 2014). It has been estimated that NO2 emissions fell by 5-7.5 percent by 2010 and PM10 emissions by 15-20 percent between the 2006 trial of the congestion charge and 2010. This was associated with a significant decrease in acute asthma attacks amongst young children within the congestion charging zone (Simeonova et al. 2018). Benefits attributable to improved human health and reduced health costs have been quantified at US$ 2.3 million annually (Eliasson 2014). In Stockholm, health benefits were realised more gradually than the change in ambient air pollution, which seems to suggest that it may take some time for the full health effects of changes in pollution to be felt. Therefore, short-run estimates of the pollution reduction programs may understate the long-run health benefits (Simeonova et al. 2018). The charge has raised an average of around US$82 million of revenues each year. Increased revenues from public transport amount to a further US$ 14 million, while operational costs – administration, maintenance and reinvestment – amount to around US$22 million annually. Start-up costs for the scheme were recouped within two years (Eliasson 2014). Congestion charging in London, introduced in 2003, has had similar impacts. Congestion was reduced by 30 percent on 2002 levels in 2003 and 2004, and by 26 percent in 2005, although congestion since increased due to road repairs and other factors (TFL 2008). Modal switch to public transport was significant, with a 37 percent increase in bus passengers entering the congestion zone during charging hours in the first year of the scheme (CPI 2016). In terms of air pollutant emissions: from 2002-2003, Transport for London has claimed that greenhouse gas emissions in the congestion zone were reduced by 16 percent, NOx emissions by 8 percent and PM emissions by 6 percent. Subsequently, between 2003 and 2006, annual improvements in central London have been estimated to amount to reductions of 6 percent for NOx, 7 for PM and 1 for CO2 emissions per year (TFL 2008). However, a 2018 study by Green, Heywood and Navarro, found that while CO, PM10 and NO emissions decreased, NO2 emissions increased in the congestion zone, which the authors suggest may have been due to the increased
89
use of diesel-powered vehicles such as taxis and buses, that were exempt from the charge, (Green, Heywood and Navarro 2018).58 This finding highlights uncertainties relating to the correlation between reducing congestion and reducing the harms of air pollution: an undesired shift e.g. to diesel vehicles may lead to increases in emissions of pollutants harmful to human health, even while congestion is reduced. Notwithstanding these findings, a 2008 study conducted to model the impacts of the congestion charge on human health based on reduced NO2 and PM10 concentrations found that benefits in congestion zone wards amounted to 183 years of life per 100,000 of population, a total of 1,888 years of life for London overall (Tonne et al. 2008). The impacts of the congestion charge have been disproportionately progressive. First, because revenues are raised from wealthier income quintiles prepared to pay the charge and travel by car to the city centre and used primarily to fund improvements to public buses (Clayton, N., Jeffrey, S. and Breach, A. 2017). Second, because more deprived areas within the congestion zone have benefitted from greater air pollution reductions and mortality benefits, as they had previously suffered from higher air pollution concentrations (Tonne et al. 2008).
4.4.2. Low-emissions zones in Germany: an honour system with enforcement penalties There are low-emissions zones in a 57 city and town centres in Germany. In the country, the policy used to implement these zones is a hybrid between a regulation and a fiscal instrument – understood in this case in the broadest sense of the word, as an instrument that raises revenue through payment of penalties for non-compliance. Low-emissions zones require all vehicles to display a sticker—a Plakette—stating the emissions of the vehicle. Vehicles which do not comply with the performance standards of the zone, or which do not display a sticker, are not permitted to enter the zone. Non-compliance, if observed, results in a fine, of US$ 88 in Berlin or Munich. Generally, city residents tend to comply with the zones and purchase stickers once they become accustomed to the system. In Munich, for example, non-compliance fell by 54 percent between 2012 and 2017. In Berlin in 2017, 97 percent of city residents complied with the system. In total, 65,000 drivers failed to comply (Morgenpost 2018). In terms of revenue: If enforced at the highest rate, penalty charges in Berlin of US$ 88 per vehicle have the potential to raise revenues of approximately US$5.7 million/IDR 81 billion annually. One of the most important objectives of the low-emissions zones in Germany is to reduce emissions harmful to human health in compliance with EU air quality standards, particularly particulate emissions. Prior to their introduction in many German cities, air quality standards for PM and NO2 for average annual emissions and peak emissions were regularly exceeded. Although this is still often the case, low-emissions zones have made an important contribution to reducing PM10 emissions harmful to human health by up to 10 percent (Umweltbundesamt 2017).
58 This problem highlights the importance of improving vehicle fleet performance by ensuring that newer vehicles conform to higher Euro emissions standards. In London from October 2020, the EURO VI standard will be compulsory for all buses and heavier vehicles in the low-emissions and ultra-low emissions zones. Alongside an age limit on taxis, this can be expected to address the problem of NO2 emissions to some extent. The issue of vehicle standards is returned to in the second half of this chapter, which looks at concrete recommendations for Jakarta.

90
Nonetheless, Germany’s Federal Environment Agency considers further improvements and more strict standards necessary to safeguard human health (Umweltbundesamt 2017). NO2 emissions remain a problem, due to high NO2 emissions even from newer diesel vehicles allowed to enter the zones (Federal Environment Agency 2019). This problem was exacerbated by the 2014-16 diesel emissions scandal in Europe, during which it was discovered that automobile manufacturers had programmed vehicle software to make engines emit less when undergoing vehicle emissions testing (Guardian 2015).
4.5. Subsidising cleaner transport
4.5.1. Subsidies for public transport: examples from India and the UK In Himachal Pradesh, a mountainous state in North West India, electric buses have been promoted using fiscal policies since 2017. In the first phase, a pilot project included 25 electric buses that were subsidised through a US$5.5 million grant under the Faster Adoption and Manufacturing of (hybrid and) Electric vehicles (FAME) programme of the Indian government. Subsequent phases in 2018 and 2019 have rolled out a further 100 electric buses. Aside from the grants for the first pilot phase, the policy also included a package of fiscal incentives in the state budget, including exemptions from the token tax (a tax on vehicle ownership for which a token is issued), registration charges and VAT on all EVs for five years (GGGI 2017). Deployment of electric buses in the region has effectively substituted fossil fuel powered vehicles with electric vehicles powered by clean hydropower, thus substantially reducing emissions of air pollutants harmful to human health, GHGs and noise by 30 percent. No robust data is available on absolute reductions of air pollutants or related human health impacts, however, anecdotal evidence suggest improvements at pollution hotspots with residents claiming they: “can definitely feel the difference in the level of pollution at places where electric buses and cars are running, especially at crowded city areas” (NDTV India 2019). Other benefits include substantial savings since for electric buses lifecycle maintenance cost is 85 percent lower than for diesel buses and operational cost is 65 percent lower. This has allowed for ticket prices to remain unchanged and freed up revenues for other services. Electric buses have also created new employment opportunities in manufacturing and related industries (see GGGI 2017). In urban areas in India, in a business as usual scenario, harmful emissions are predicted to rise by 25 percent in terms of PM2.5 and 200-400 percent in terms of SO2 and NOx by 2030, which will inevitably lead to severe impacts on human health (Public Health Foundation of India and Centre for Environmental Health 2017). With the explicit aim of reducing air pollution harmful to human health, the Delhi municipal government is funding the purchase of 1,000 electric buses and infrastructure construction through revenues from the Environmental Compensation Charge (a green tax), rather than a FAME subsidy (Times of India 2019). Similarly, 80 percent of revenues raised through London’s congestion charge were initially used to finance an improved bus system in central London and today, around 43 percent or revenues go towards funding improvements in the bus transit system. Between 2002 and 2004, this included purchase of 30 percent more buses, development of longer bus lanes, improved ticketing systems and other measures to reduce journey times, which boosted passenger numbers by about 30,000 annually (Givoni 2012).

91
4.5.2. Demand-side policies subsidizing a transit-oriented city in Seoul In Seoul since 2003 a broad package of measures, both fiscal and non-fiscal, has transformed the city (for a detailed description see e.g. Lee et al. 2015). By 2011, over 60 percent of total modal share was in public transport and Seoul was ranked second worldwide for modal share in public transport amongst all large cities (Lee et al. 2015). An important element in the package of measures were steps to reduce the number of road transport journeys – both public and private. This was relatively successful, with passengers shifting to the subway, which increased its modal share from 19 percent in 1990 to 36 percent in 2010, and away from high-emitting buses, in which modal share fell from 43 percent in 1990 to 28 percent (Ko 2015). The package included both non-fiscal and fiscal elements. Several of the non-fiscal elements are worth considering in Jakarta. For example, there is a high level of city government involvement in bus route planning, to ensure that accessibility rather than profitability is maximised (see Lee et al. 2015). In contrast, in Jakarta, many private bus companies operate without being fully integrated in the publicly owned transport system and focus on the most profitable routes, rather than those that would best integrate the public transport system. Some steps have been taken to integrate Transjakarta bus routes within the cooperative Kopaja, to introduce a feeder service, and to coordinate ticketing. Still, substantial potential for improvement remains, particularly in relation to the integration of privately-owned transport companies (see Miharja and Priadi 2018). At the same time in Seoul, public transport subsidies cover the cost of a new ticketing system, which enables easy and free transfers between buses, community buses (for the last mile), and the metro. This is centred on distance-based transport tickets that use a smart card system, with card readers installed in all public transport modes. In Jakarta, currently progress is being made towards introducing fully transferable tickets, but the process has not yet been successfully completed. These subsidies are relatively costly, with the operating losses of the bus system worth around US$200 million per year, an actual loss of US$20 per person (Lee et al. 2015). However, this calculation does not include the benefits of public transport in relation to human health as a result of improved air quality (see Figure 29). Indeed, concentrations of PM10 fell by 27 percent between 2004 and 2013 (Ko 2015). While it remains a challenge to find evidence that quantifies the health benefits of these air quality improvements in Seoul, the Korea Environment Institute estimated in 2006 that 7,400 fewer people would die from air-pollution related causes annually in Seoul if the Special Measures for Metropolitan Air Quality Improvement – which includes the measures described above in the transport sector and additional measures to reduce emissions from stationary sources – were implemented, and that health benefits could amount to as much as US$17.8 billion annually (WHO Western Pacific n.d. b).59
59 Average exchange rate 2006 (ECB).

92
Figure 29: Air pollution levels in Seoul 1989-2012
Source: Lee et al. 2015.
4.5.3. Grants and subsidies to promote cleaner motorcycles and three-wheelers In many countries in South East Asia, low-cost loans and grants have been implemented to drive a shift to cleaner motorcycles and three-wheelers. In the Philippines San Fernando city, for example, interest-free loans were made available in 2001 for the purchase of four-stroke three-wheelers. In combination with regulations to phase out two-stroke vehicles by 2004, this resulted in the replacement of 400 two-stroke tricycles with four-stroke tricycles, one third of the city’s total two-stroke tricycle fleet (ICCT 2009). Given the higher pollution associated with two-stroke engines, it is likely that this resulted in reduced harmful emissions. Similarly, in Taiwan, tighter emissions standards for two-strokes combined with financial incentives for the purchase of four-stroke motorcycles were adopted in 2004. Almost no new two-stroke motorcycles have been sold since that date (ICCT 2009). Although no measured data is available on trends in emissions harmful to human health during this period, emissions of HC and PM would have been reduced by 10-40% for each two-stroke motorcycle replaced by a four-stroke motorcycle, with corresponding reductions in harmful air pollution.
4.5.4. Subsidies to promote alternative fuels Alongside registration taxes, Thailand has implemented additional successful policies to increase take-up of alternative fuels, and alternative fuel vehicles. Subsidies to support the use of LPG and NGV as an alternative to gasoline and diesel under the 2015 Oil Plan have complemented earlier fiscal incentives in favour of gas-fuelled and dual fuel vehicles and subsidies to fund the conversion of buses to NGV. Together, these fiscal measures have been relatively successful in incentivising the purchase of low-emissions vehicles. In 2007, only 0.16 million petrol/LPG dual fuel vehicles were registered, in contrast to 1 million vehicles in 2015, more than half registered in Bangkok. The number of LPG/NGV gas stations has increased from 166 in 2007 to 500 in 2015. In 2015 there were 186,000 dual fuel petrol/NGV vehicles registered in Thailand, 63 percent of which were registered in Bangkok (AEDP 2015; DLT 2016). There is no concrete data available on the health impacts of these measures but given the effectiveness of the policy in promoting alternative fuel vehicles, health benefits are likely to have been the result.

93
4.5.5. Scrappage schemes: China and Beijing The Chinese government has initiated multiple scrappage programmes at national and local levels to modernise the vehicle fleet alongside supporting policies including mandatory vehicle age limits and activity restrictions. Pre-Euro standard gasoline (pre-2000) and diesel (pre-2008) vehicles are targeted because they emit disproportionate volumes of harmful emissions. In 2011, the Ministry of Environmental Protection estimated such vehicles accounted for 16 percent of the fleet but 64 percent of NOx, 87 percent of PM and 56 percent of CO emissions (cited in Posada et al. 2015). The Chinese experience demonstrated that relatively high scrappage subsidies may be required to encourage participation. In 2009-2010, subsidies were increased from US$980 to US$2,940, leading to a twelvefold increase in uptake. The programme cost a little over US$1 billion for 459,000 vehicles: an average of US$2,270 per vehicle: mainly subsidies towards the high end of the possible range were paid out (Posada et al. 2015). Around 46 percent of subsidies were given for passenger vehicles, 21 percent for buses and 17 percent for small or micro trucks. The national scheme made clear that vehicles must be at least one year younger than the mandatory limit to be eligible receive the subsidy, encouraging the renewal of the fleet. The city of Beijing has also implemented several scrappage schemes. The first was from 2006-2010. Subsidies were announced at the start of the programme but fell over time to encourage early take-up and were initially worth between USD$131–4,086, falling to US$82–3,595 in 2009 (Posada et al. 2015). Subsidies varied according to vehicle type and age: the newer the vehicle, the higher the subsidy paid. Subsequent schemes have overreached their targets substantially: by 150 percent in 2012, by 80 percent in 2013 and 22 percent in 2014 – the lower overshoot in 2014 reflecting the higher ambition of the scheme – to retire 391,000 vehicles, rather than a fall in effectiveness (Yang et al. 2015). In terms of impacts on emissions harmful to human health, Beijing’s scrappage schemes have been relatively successful. Yang et al. (2015) have calculated that annual NOx emissions for the Beijing BAU scenario in 2010 were 45 percent lower than emissions in China’s BAU scenario, while PM2.5 emissions were 68 percent lower and black carbon emissions 40 percent lower. The Beijing Environmental Protection Board has calculated that the elimination of the first 50,000 vehicles scrapped between 2006-2010 resulted in daily reductions of 245 tons of CO, 35 tons of HC, 32 tons of NOx and 3 tons of PM in the city (cited in Posada et al. 2015). Between 1.5 million vehicles were retired between 2009 and 2014: if these vehicles all emitted on average the same average amount of pollutants as the first 50,000 scrapped, then total daily reductions by 2014 would have amounted to 7,350 tons of CO, 1,050 tons of HC, 960 tons of NOx and 90 tons of PM. However, criticisms of the scheme include: Higher subsidies for newer vehicles than for older vehicles create incentives to scrap newer vehicles while keeping older more polluting vehicles on the road. Such unwanted substitutions could be avoided by differentiated scrappage subsidies aligned with pollutant emissions, rather than vehicle age. The scheme was also unpredictable in terms of its cost – targets were frequently overshot by a significant margin – and expensive, because it targeted the entire vehicle fleet. Furthermore, while little evidence is available in the public domain, the scheme is likely to have had quite significant regressive impacts, as poorer households are more likely to own older vehicles (which were eligible for lower subsidies) or not

94
to own vehicles at all. The scheme also permitted scrapped vehicles to be sold outside Beijing, exporting high polluting vehicles beyond the city limits rather than taking them off the road. Even though transferred vehicles were eligible for a slightly lower subsidy, if a vehicle was sold outside Beijing, this amount was certainly not sufficient to cover the difference between true scrappage and vehicle transfer.
4.5.6. Scrappage schemes for trucks in Mexico In Mexico, truck owners with vehicles over ten years old can receive a subsidy for the purchase of a vehicle that is new or five years old or less. The incentive amount is the lowest of the following: the value of the old vehicle; 15 percent of the cost of replacement; a bonus defined by law as shown in Table 16. From 2004-2010, it has been estimated that the scheme avoided following amounts of emissions harmful to human health: 31,410 tons of HC, 152,663 tons of CO, 77,547 tons of NOx and 7,543 tons of PM 2.5 (Posada at al. 2015). Despite these reductions in harmful emissions, the programme has had low rates of participation. The HDV sector is dominated by small family businesses with fewer than five vehicles: such firms make up 83 percent of all transport businesses (Posada et al. 2015). These firms, some of which are in the informal sector, find it difficult to access credit, and even with the scrappage incentives, cannot access sufficient funds to replace older vehicles. In addition, unlike in Beijing, there are no emissions performance standards to push older vehicles off the road and no high taxes on older vehicles to incentivise scrappage. Table 166: Incentives by vehicle type
Vehicle category Incentive
Two-axle trucks US$5,350
Conventional buses US$6,200
Three-axle trucks US$8,000
Integral buses US$10,650
5-wheel tractor-trailers US$12,400 Source: Posada at al. 2015
4.6. Road tolls to incentivise modal shift from road to rail and shipping The fiscal policies delineated above to introduce differentiated excise taxes on diesel fuels in line with e.g. sulphur content or CO2 emissions or to charge high-polluting vehicles higher circulation and registration taxes can incentivise modal shift. Tax exemptions or reductions for shipping and rail freight can complement such policies. Distance-based tolls on HDVs, such as those implemented in Germany, have been shown to boost transport volumes by rail and shipping – important in this regard is to ensure the sound alternatives to road freight are available, and intermodal hubs exist to transfer between freight modes. They have also boosted logistics efficiency by just over 2 percent, reducing empty freight journeys on major roads. The German HDV tolls were introduced at a rate per kilometre calculated to cover the costs of extension, maintenance and operation of the road network – USD 0.13/km, although this has since increased (Doll et al. 2016). At first, revenues raised were spread between

95
federal motorways (50 percent), rail (38 percent) and inland waterways (12 percent): a model that seems applicable to the Indonesian context. In 2005, when the system was first introduced, around 20 percent of total revenues were required to operate the system, but this has since fallen to around 11-12% (Doll et al. 2016). A positive impact on GHG emissions and resulting co-benefits in relation to human health can be expected from a shift in the freight sector from road to rail and shipping. Globally, if growth in road freight were halved between 2010 and 2050 and instead shifted to rail freight, the IEA has estimated that this would result in a 20 percent reduction in fuel demand and CO2 emissions and corresponding health benefits, with only a fifth of these energy savings being offset by increased energy use (IEA 2009). Impacts on economic growth, consumer prices and employment have been found to be negligible and thus, impacts on social equity as well (Doll et al. 2016).
4.7. Lessons for Jakarta The international best practice cases above have important implications for the design and application of fiscal policies in Jakarta to reduce emissions harmful to human health from the road transport sector. Taxes on fuels, whether carbon taxes or more general excise duties on fuel, can be effective in incentivising shifts between fuels, even if only a small price differentiation is the result of differentiated tax rates. The experience in Hong Kong indicated that the speed of the transition to cleaner fuels may be directly related to the price difference between high and lower polluting fuels, and that greater price differentials do incentivise more rapid rates of switching (Hung 2006). However, given the politicised nature of transport fuel prices in Indonesia, taxes should probably be implemented gradually to ensure that they meet with political acceptance and to minimise policy reversals. Good and transparent communication of fiscal policy measures is also of fundamental importance in this regard. Various forms of congestion charging, including both simpler schemes in Stockholm and London and the more complex ERP scheme in Singapore have been shown to have reduced emissions harmful to human health by reducing overall emissions attributable to congestion and idling. In the case of Singapore, twenty years of the area licensing scheme paved the way for the ERP in 1998 by fostering widespread acceptance that the system existed to constrain traffic growth and manage congestion, not raise revenue (DPPL and IWA 2018). Laying the foundations for the roll-out of ERP in Jakarta could be achieved in a similar way through the implementation of the current odd-even policy and in future, the implementation of a low-tech congestion charging zone, which is proposed below and which could be implemented using an honour system, in much the same way as low-emissions zones in German cities. In terms of revenue, there are some important differences between the London congestion charge and the Stockholm charge. The former is implemented by Transport for London, a local government body responsible for the transport system, including revenue collection and expenditure. In Stockholm, the charge is a tax levied at national level. A charge levied and administrated at municipal level, with revenues spent transparently on improving public transport and other measures to reduce harmful emissions, is likely to meet with greater political acceptance and be easier to communicate and is thus perhaps the most feasible option available.

96
When designing a scheme to promote low emissions vehicles, care should be taken to ensure that the scheme encourages ambitious emissions reductions and that it does not result in higher overall vehicle sales. Avoiding rebates or subsidies which create disproportionate incentives to purchase new low-emission vehicles is thus essential. Furthermore, as noted at the start of this chapter, fiscal policies should be implemented within a complementary package of measures to encourage modal shift away from private vehicles and towards public transport. When implementing differentiated vehicle registration charges, as shown by the feebate scheme in France, or subsidies for scrappage, low-cost public transport tickets, or the purchase of low-emissions vehicles, it is essential that measures are carefully costed and that revenues are available to cover the cost of the scheme. To fund the roll-out of public buses, the funding models used in Delhi and London, where tax revenues fund public transport improvements, might be of higher relevance to DKI Jakarta than the subsidy model implemented in Himachal Pradesh. All subsidies in the transport sector should be carefully assessed in line with their equity impacts. It is also particularly important in the context of countries with substantial income inequality to evaluate whether subsidies will disproportionately benefit those on higher incomes, as exemplified by the unequal benefits of fossil fuel subsidies in Indonesia (for detailed figures see sections 3.4.5 above and 5.1.2. below). Scrappage schemes for private vehicles have several disadvantages: they are relatively costly and may also be inefficient, subsidising consumers who would have purchased a new vehicle in any event. Unless carefully designed they tend to benefit wealthier households rather than those on low incomes. Finally, scrappage schemes encourage vehicle ownership rather than modal shift to public transport and do not target the highest-emitting vehicles on the road. These problems are less pronounced in the freight sector and as a result, this study does propose a scrappage scheme for freight in the medium-term.

97
5. Policy reform options to reduce emissions harmful to human health in Jakarta
The sections below look at a range of fiscal measures which have potential in Jakarta to reduce harmful emissions in the transport sector. Fiscal and complimentary non-fiscal policies are proposed which have the potential to reduce emissions harmful to human health and so improve air quality and tackle the current health crisis in Jakarta. Within the confines of this study, reductions in CO2 emissions are treated as co-benefits, but are not the primary objective. Nonetheless, given the close correlation between air pollution and CO2 emissions, most of the policies proposed, if effective, will bring about reductions in both. One proposal, drawing on a government Green Paper from 2009, is for a national carbon tax on transport fuel rather than on air pollutant emissions; since there is a nearly linear relationship between CO2 emissions and emissions of pollutants harmful to human health, both are expected to fall as a result of the national carbon tax. Although, as evidenced by the need for an ultra-low-emissions zone in London alongside a congestion charge, the relationship between health benefits and falling CO2 emissions is not always clear cut. It is important to note that per kilometre driven, diesel vehicles emit less CO2 but higher levels of air pollutants than gasoline-powered vehicles, particularly if vehicles are old and/or low quality, high-sulphur fuel is used. Thus, the climate benefits of differentiated fuel excise on the sulphur content of fuels are less obvious.60 An additional consideration when focusing on policies to improve ambient air quality are the potentially severe human health impacts of pollution spikes and hotspots. In the case of CO2
emissions, these considerations are irrelevant – aside from aviation, it is the overall emissions that count. For air pollutants, not only how much pollutant is emitted is important, but also where and when (see section 2.3). Thus, measures like ERP or a low-tech congestion charge (implemented through the compulsory display of stickers within an honour system) might have more potential to reduce harmful air pollution than CO2 emissions, as they may redistribute traffic volumes throughout the day, thus avoiding spikes in pollution concentrations and pollution hotspots, rather than reducing traffic volumes overall. Together the policies proposed here have the potential to achieve multiple policy outcomes and in so-doing reduce harmful emissions from transport: by reducing traffic volumes in Jakarta and transport fuel consumption (e.g. congestion charging, fuel taxation, road tolls); by driving a shift towards cleaner production and consumption in the private vehicle sector (vehicle registration charges, subsidies for CNG retrofits, freight, scrappage); and by fostering modal shift from private vehicles to public transport, and from road to rail and shipping freight (e.g. road tolls, fuel tax exemptions for shipping). Where possible, the impacts of the fiscal policies proposed in this chapter on health costs, GHG emissions and government revenue have been quantified (for details of the approach used see the methodology for calculations of policy impacts in Annex I). Predicting these impacts is a complex process. Unintended substitutions rebound effects and other unpredictable responses
60 Although as shown in section 5.1.1. we calculated that differentiated sulphur taxes would bring about an overall reduction in fuel consumption and thus reductions in CO2 emissions as well as SO2 and secondary emissions.
98
to policy measures do occur, although many can be prevented through careful preparation of policy and in-depth policy impact assessments. In addition, if appropriate and regular monitoring of policy outcomes is in place, in line with international best practice, policymakers can adjust tax rates or amend policy measures within a relatively short timeframe in response to any unwanted effects and to ensure that policy objectives are met. This chapter first proposes fiscal policies to be implemented at the national level, followed by policies applicable to either national or municipal level and finally, fiscal policies for the government of Jakarta. Chapter 6 prioritises these measures and proposes an implementation timeline.
5.1. Proposals at the national level
5.1.1. Differentiated excise duties on oil imports and domestically produced fuels based on sulphur content As noted in chapter 3, fuel standards in Indonesia are poorly enforced. Fiscal measures can complement standards and pave the way for their more effective enforcement, as was the case in Thailand for unleaded fuels (see section 4.2.3.). An excise duty differentiated in line with sulphur content levied on fuel imports, as well as fuels produced by domestic refineries, would create tangible financial incentives in favour of reducing the sulphur content of fuels. Revenues could be used to fund the technological improvement of domestic refineries. Such a measure has the potential to motivate industry to invest in low-sulphur technology and encourage the uptake of cleaner fuels by consumers by making them cheaper at the pump than other high-sulphur fuels. The measure also has the potential to foster increased competitiveness in the downstream domestic market for transport fuels, which was initially opened under Act 22/2001. An excise duty on sulphur would be easy to administer, as it would involve few taxpayers: Indonesia’s domestic refineries and oil importers.61 Policymakers could refer to the emissions index for sulphur content, in order to establish the correct charge for the sulphur tax. Opposition to the measure could be mitigated by using a proportion of revenue to fund refinery improvements and investment in low-sulphur technologies. The proposal is in line with current policy to reduce sulphur content sufficiently to shift to Euro IV vehicles from 2018. The state-owned enterprise Pertamina, responsible for Indonesia’s refineries, has already indicated an interest in implementing a programme of investment in low-sulphur technologies (CCAC 2016). If a differentiated excise duty of just 0.2 IDR per 1 ppm sulphur/litre had been imposed in 2018, IDR 22,078 billion/US$1.57 billion of revenue would have been raised, or just over 0.1 percent of GDP (see table 17). This is substantially more than the amount of investment necessary to install low-sulphur technologies in Indonesia’s refineries, estimated in 2016 to amount to roughly USD 0.6 billion (CCAC 2016).
61 In 2018 Indonesia produced 282 million barrels of oil equivalent (BOE) of crude oil and imported a further 113 million BOE and imported 166 million BOE of petroleum (MoEMR 2019).

99
As in Thailand, this can be expected to be a relatively short-term measure, as revenues will fall rapidly once new technology is installed and refineries and importers move away from high-sulphur diesel. Although earmarking is not permitted in Indonesia, a subsidy could be introduced alongside the sulphur duty, and the relationship between the two communicated clearly to state-owned enterprises, the general public and other stakeholders to help reduce opposition. International experience has shown that even a small price difference has the potential to bring about a strong consumer response. On the basis of the low rate proposed here, our calculations indicate that if the excise duty on sulphur in fuels had been implemented in 2018, it might have reduced CN48 consumption (3,500 ppm sulphur) by 4 percent, bio gasoil consumption (2,500 ppm sulphur) by 2 percent, and consumption of other transport sector fuels (500 ppm sulphur) by less than 1 percent in comparison to fuel consumption under a business as usual scenario in the same year (see Table 17). This indicative fuel consumption decrease translates into fuel cost savings of 5,520 billion IDR (US$393 million) on the national level. Table 17: Most used road transport fuels used in Indonesia and their sulphur content 2018
Fuel % of total transport
fuels Fuels sales
Sulphur content
Predicted revenue in
2018 62 Price increase (IDR and US$)
% ('000 litres) (ppm) (billion IDR) (IDR/litre) (USD/litre)
Gasoline RON 88
15.51 10,737,683 500 1,074 100 0.007
Gasoline RON 95+98+100
0.57 385,977 500 39 100 0.007
Gasoline RON 92
8.40 5,643,055 500 564 100 0.007
Gasoline RON 90
26.36 17,706,790 500 1,771 100 0.007
Gasoil CN 51 1.10 666,191 500 67 100 0.007
Gasoil CN 53 0.33 199,901 500 20 100 0.007
Gasoil CN 48 9.85 11,946,056 3500 8,362 700 0.050
Bio gasoil 29.08 18,182,154 2800 10,182 560 0.040
TOTAL REVENUE IDR 22,078 billion / USD 1.57 billion
Source: MoEMR 2019, revenue estimates and price increases based on authors own calculations based on MoEMR data
Figure 30: Potential retail price increase and consumption decrease under Sulphur Excise Duty
62 Calculated on the basis of the proposed tax rate of 0.2 IDR / 1 ppm sulphur / litre.

100
Source: 2018 Fuel prices are based on Pertamina 2018 and 2019 and MEMR, assumptions on fuel consumption decrease based on pages 22/23 in Victoria Transport Policy Institute: “Understanding Transport Demands and Elasticities”.
It is not possible to draw a direct link between the estimated energy consumption reduction; air pollution decreases and health cost savings because we are lacking the necessary data. The latest related health cost data available refers to DKI Jakarta in 2016 (KPBB, 2018) and while the transport sector’s contribution to this figure is not quantified; as a result, our estimations are based on 2010 figures. Many factors have changed since then, including health treatment costs, congestion, type of vehicles in use including their engine sizes, fuel efficiency, fuel type and vehicle kilometres driven, the influence of other sectors on air pollution, etc. All these factors influence the levels of energy consumption, subsequent air pollution and related health cost. However, it is possible is to outline a hypothetical case for 2016 (see Annex I). If we assume an average 1.4 percent reduction in transport sector energy consumption in 2016 (similar to what is to be expected in the year following the introduction of the Sulphur Content Excise Duty) and a subsequent 1.4 percent decrease in transport sector related63 air pollution, the health cost savings could have been as much as 258 billion IDR ( US$19 million) in DKI Jakarta. This figure does not take into account the above average reductions in consumption of high-sulphur fuels – 4 percent for CN48 and 2 percent for bio gasoil – implying that the actual figure is likely to be considerably higher.64 As shown in Table 17, the impact of the proposal on the price of a litre of fuel can be expected to be very low and thus, social impacts will be minimal.
63 As in 2010 the transport sector had contributed about one third to fuel consumption in Indonesia (ESDM 2018 Handbook of Energy) and about 36% of PM10 emission in Jakarta (Breathe Easy Jakarta (BEJ) (2017)), we assume that its contribution to local air pollution accounted for roughly one third. 64 Given the complex relationship between SO2 emissions and human health impacts, and the lack of available data, it is not possible to make an accurate estimate of reduced health costs by fuel type.

101
Box 2: Additional regulations required to support the transition to low-sulphur fuels
Fuel quality and vehicle standards are essential elements of any policy package to reduce road transport emissions harmful to human health in the city of Jakarta. Many international organisations and expert research institutions have identified Indonesia as a priority for the reduction of sulphur content in fuel, due to the significant negative impacts high sulphur fuels have on human health (CCAC 2016). Currently, standards for sulphur content in transport fuels are lacking ambition and are poorly enforced. Nonetheless, lowering sulphur content and improving fuel quality is an essential first step towards reducing air pollution from vehicles. Euro IV vehicles require fuel with a sulphur content of less than 50 ppm for vehicles to function optimally: otherwise they emit higher volumes of pollutants harmful to human health (ICCT 2014; CCAC 2016). Thus, it is essential that the MEMR revises fuel standards and enforces those standards effectively. When Euro IV implementation began in 2018, total sales of gasoline with Euro IV compliant sulphur content decreased, although such fuel has been produced since 2017 in Indonesia. Interviews and stakeholder consultations suggest that this is due to a number of factors: lack of awareness of the significance of using clean fuels in Euro IV vehicles amongst the general public (this is not publicised or communicated by the automobile industry); lack of promotion of cleaner fuels that comply with Euro IV standards by oil companies; and the tendency for people to consume cheaper lower-quality fuels. According to current legislation, the 50ppm target for sulphur content for diesel is to be achieved by 2025; meanwhile, RON 90 specifications currently set a limit of 500 ppm, which is not Euro IV compliant.65 This process must be accelerated, and ambition ratcheted up if fuels are to be low-sulphur by 2025. This is an urgent priority to reduce harmful emissions from transport. A second important regulatory step would be to require vehicle manufacturers to meet the Euro VI standard by 2023. This would reduce the harmful pollution load emitted by road vehicles significantly: Euro VI diesel passenger vehicles emit 82% less PM and 68% less NOx than Euro IV.
5.1.2. Removal of price regulations and other fossil fuel subsidy mechanisms The deviation from automatic price adjustments to diesel prices described in chapter 3 represents a partial reversal of fossil fuel subsidy reform. This was a political decision: in March 2018 (in the run-up to the 2019 presidential election), it was announced that fuel prices would be kept at current levels until at least the end of 2019 (OECD 2019b). A failure to continue to pursue reform in future will undermine any fiscal policies introduced to reduce pollutant emissions. This ongoing failure to phase out fossil fuel subsidies is fiscally damaging, as noted in chapter 3. Subsidies resulting from the 2018 price freeze are estimated to have been worth IDR 24 trillion/US$1.7 billion (Braithwaite and Gerasimchuk 2019). In 2019, IDR 101 trillion/US$7 billion was allocated for spending on subsidised diesel in the government budget, with overall spending was increased by IDR 3 trillion/US$70 million at the end of November 2019, once it became clear that the budget allocation would not cover the cost of subsidies (Jakarta Post 2019a). This seems to indicate an ongoing acceptance in government of subsidy spending, albeit at lower levels than pre-2015.
65 See https://jdih.esdm.go.id/peraturan/Kepdirjen%20Migas%20No.%2028%20Thn%202016.pdf for diesel and https://jdih.esdm.go.id/peraturan/Kepdirjen%20Migas%20No.%200486%20Thn%202017.pdf for gasoline specifications. Specifications for all fuels are available here: https://jdih.esdm.go.id/?page=peraturan&act=listperaturan&id=90 (in Bahasa Indonesia).

102
At the same time, the International Energy Agency (IEA) has claimed that one of the most obvious consequences of fossil fuel subsidies is chronic congestion in Jakarta as well as “lost output, dissipation of energy, negative health effects and reduced productivity….[and] CO2 emissions”
(IEA 2016, p. 62). The ongoing reform of subsidies in the transport sector is an important pillar of the contribution national government can make to reducing harmful health impacts from transport emissions. Fossil fuel subsidies, if not effectively targeted at vulnerable households, are a very inefficient means of protecting the vulnerable from high energy prices, because they keep transport fuels cheap for everyone, even high-income households who benefit disproportionately. The Indonesian government has already acknowledged this (Chelminski 2018). From an equity perspective, blanket subsidies should be replaced by targeted welfare measures to protect low-income households from potential negative impacts. It is important to ensure that the energy price rises resulting from fossil fuel subsidy reforms do not negatively affect poor populations. As demonstrated in 2015, subsidy reform can be implemented, and public resistance dealt with if the policy is executed carefully. Since 2015, compensation for rising prices has been linked to the well-established smart card system covering financial assistance, education and healthcare (see e.g. Pradiptyo et al. 2016). Given that an effective compensation system is already in place, there is considerable scope for policymakers to use fuel prices as a lever to encourage cleaner mobility while protecting the vulnerable (G20 2019).
Box 3: Subsidies for CNG Although CNG emits lower levels of localised air pollutants, the price cap for CNG should also be reformed, as it limits the profitability of privately owned CNG stations and so discourages its large-scale deployment, thus working against the realisation of Decree 22/2017 (the RUEN) for the mass development of CNG fuel stations (more details see ICCT 2014). Free distribution of conversion kits to highly polluting heavy-duty diesel freight vehicles would be a more effective, targeted and time-limited subsidy policy (this is proposed at municipal level, see below). In addition, differentiated tax rates on transport fuels can be used to encourage increased use of CNG, rather than gasoline and diesel, without undermining incentives for market penetration (details below).
There are strong fiscal, economic, environmental, climate-related, social equity and health-related reasons to complete the process of reforming diesel and CNG price regulations. This should be an integral part of any fiscal policy package to address pollutant emissions harmful to human health in the transport sector in Indonesia. However, given the existing body of work on fossil fuel subsidy reform in Indonesia – see e.g. (G20 2019; ADB 2015; IEA 2015; Bridle et al. 2018) – reform of fossil fuel subsidies will not be discussed in more depth in this study.
5.1.3. Carbon taxation of transport fuels Currently in Indonesia, fuel consumption taxes – VAT and motor fuel tax – generate revenue equivalent to 0.57 percent of GDP. This is low in comparison to the value of fuel and electricity subsidies – 1.7 percent of GDP (Braithwaite and Gerasimchuk 2019). In parallel to the withdrawal

103
of all forms of subsidies for fossil fuels and in line with international best practice, it would be advisable to introduce an ad quantum carbon tax at national level on all transport fuels. Globally, Indonesia has the second-largest carbon-pricing gap amongst emerging economies. The carbon- pricing gap is an OECD indicator that quantifies the difference between a conservative benchmark carbon price of US$35/tCO2 and the carbon price in Indonesia. As much as 84 percent of CO2 emissions from energy use is unpriced in Indonesia and the remainder is priced at around USD 8/tCO2 (OECD 2019a). Therefore, energy and fuel are priced at levels well below their associated environmental and social cost. The introduction of a carbon tax is in line with Presidential Decree No 22/2017. Taxation of transport fuels is very much in line with international best practice (see section 4.2). A carbon tax would complement the emissions trading system for stationary emissions sources66 currently under consideration (see Table 10), by targeting mobile emissions. In 2009, the Ministry of Finance published a Green Paper on climate change, which proposed a carbon price on stationary emissions of US$10/tCO2 targeting power generation and large industrial installations. This was to be implemented in 2014 and the rate increased by 5 percent per until 2020, with revenues used to alleviate the impact of higher prices on poorer households. The Green Paper predicted that the tax would reduce CO2 emissions by 10 percent compared to BAU with no negative impacts on growth or poverty reduction (OECD 2019a). International experience supports the proposal in the Green Paper to implement fuel taxation at a low rate initially and gradually increase the rate over time. This can boost political acceptance and is an approach that has been pursued by the majority of EU and indeed OECD countries (see section 4.2. on fuel taxes). A clear lesson from the UK fuel duty escalator was that annual increases in excise duty, if poorly communicated or perceived to be excessive, can lead to protests and ultimately policy reversals. Thus, in 18, the price proposed in the 2009 Green Paper is taken as a possible starting point of a carbon tax escalator on transport fuels, which gradually increases the carbon price over 10 years.67 In the calculations below, a biannual increase of US$2 until 2031 is proposed. Given the politicised nature of fuel prices increases in the Indonesian context, such an has the potential to prevent policy reversals and foster acceptance for the principle of price increases. This would give business and individual consumers a predictable fuel price upon which to base their investment decisions. Once political acceptance for such a reform is established and fuel prices become less politicised, more rapid adjustments could be implemented to bring the carbon price into line with the conservative benchmark price of US$35/tCO2. Table 18: Proposed carbon tax rates 2020-2030
2020-2021 10 USD/tCO2
2022-2023 12 USD/tCO2
2024-2025 14 USD/tCO2
66 Government Regulation No. 46/ 2017 has laid the foundations for emissions trading in Indonesia. At the time of writing, no political commitments had been made, but under consideration is a scheme that would target the power and industry sectors (ICAP 2020). 67 Carbon content should be calculated on the basis of the carbon index for fuels.

104
2026-2027 16 USD/tCO2
2028-2029 18 USD/tCO2
2030-2031 20 USD/tCO2 Source: Authors
Figure 31 shows the estimated development of nominal retail prices under the proposed carbon tax scheme. We assume constant nominal retail prices for 2019-2031 (based on 2018 prices) under a business as usual scenario (BAU), namely 6,469 IDR/litre/US$0.46/litre) for gasoline, 4,627 IDR/litre / US$0.33/litre for diesel and 3,100 IDR/litre / US$0.22/litre for CNG. By 2031 the carbon tax scheme could increase real retail prices stepwise by up to 11 percent for gasoline, 16 percent for diesel and 15 percent for CNG. Considering the stand-alone price increase of each fuel type leads to an estimated consumption decrease of 3 percent for gasoline, 4 percent for diesel and 4 percent for CNG (compared to the BAU) by 2031. In the longer run, average fuel consumption in the transport sector could decrease by up to 7 percent as compared to BAU. Figure 31: Impact of proposed Carbon Tax scheme on fuel prices and energy consumption
Based on these estimates, fuel cost savings in DKI Jakarta alone might add up to 368 billion IDR/US$26 million in the first year after implementation. Consumption decrease estimates might be different under a more detailed and data-heavy model, which could also allow for the effects of switching between fuel types. A higher initial rate and/or a more rapid escalation of fuel taxation would also result in more rapid reductions in fuel consumption. With respect to transport sector air pollution reductions and health cost savings, a very hypothetical case can be drawn for 2016: If we assumed an average 1.5 percent reduction in transport sector energy consumption in 2016 (similar to what we would expect in the year after implementing the carbon tax) and a subsequent 1.5 percent decrease in transport sector related air pollution and health costs, health cost savings could have been as much as 283 billion IDR/US$21 million in DKI Jakarta compared to a non-reduction-scenario. Government revenues generated from the carbon tax have been derived by relating the predicted future fuel prices to future fuel consumption under a carbon tax scheme. Carbon tax revenues raised in DKI Jakarta could be as high as 1,447 billion IDR/US$102 million in 2020, adding another 3 percent to the overall local tax revenues. In the same year, national carbon tax revenues could be as much as 23,550 billion IDR/US$1,663 million, by applying 2019 currency exchange rates. Revenues could be used for a variety of purposes, including investment in social welfare (health,

105
education, public transport infrastructure), climate mitigation, carbon leakage prevention, debt reduction, development objectives (investment in the SDGs). A carbon tax can be expected to have several additional benefits, including enhanced greater competitiveness deriving from improved energy efficiency, reduced dependence on energy imports, and innovation and job creation in low-carbon sectors. The social impacts of the scheme as proposed are expected to be relatively limited as Predicted price increases would be gradual and relatively insignificant. Real retail prices would increase by 1-2 percent annually over 12 years: a total price increase of 11 percent for gasoline by 2031, 16 percent for diesel and 15 percent for CNG. Furthermore, as discussed in Box 1, transport fuel taxes tend to have a progressive impact in developing countries (Morris and Sterner 2013). Nonetheless, even a small reduction in disposable household income can have a negative impact on the most vulnerable. Increased spending on health and education and improved access to healthcare for poor and vulnerable households, as implemented to compensate for fossil fuel subsidy reform, is a tried and tested policy which could effectively offset the impacts of price rises. A similar approach was taken in the 2009 government Green Paper on carbon taxation, which proposed to use revenues to compensate for price increases and did not predict any negative impacts on poverty reduction (OECD 2019a). Table 19: Potential local government tax revenues (in nominal terms) from the proposed Carbon Tax raised in DKI Jakarta and on national level 2019-2031
(billion IDR) DKI Jakarta Indonesia
2019 - -
2020 1,447 23,550
2021 1,507 24,516
2022 1,876 30,522
2023 1,953 31,773
2024 2,364 38,458
2025 2,461 40,035
2026 2,919 47,468
2027 3,039 49,414
2028 3,547 57,673
2029 3,692 60,037
2030 4,257 69,205
2031 4,431 72,043
Source: Authors
5.1.4 HDV tolls to raise revenue to fund measures to incentivize shift from road freight Nationally, the imposition of relatively high road tolls for heavy diesel freight vehicles, both on existing highways and on new roads due to be built as part of the large-scale highway infrastructure project worth US$70 billion announced by President Joko Widodo in June 2019, could encourage modal shift towards shipping for freight transport (Bloomberg 2019). Such high

106
road tolls on HDVs would create price incentives in favour of modal shift to rail and shipping and more efficient freight operations, including fewer empty journeys for freight vehicles. Steps to enhance efficiency in road freight have considerable potential to reduce emissions from road haulage: at Jakarta’s port, around 40-50 percent of all truck journeys are empty haul trips (GIZ 2017). Similarly, penalty fines for overloading of trucks could be introduced at toll pay stations or weigh stations to raise revenue in the short term: more than half of all trucks in Indonesia are overloaded by an average of 45 percent above the maximum payload weight limit (GIZ 2017). A proportion of toll revenues, savings resulting from reduced spending on fossil fuel subsidies, and a proportion of the investment currently allocated to road construction project should be used to invest in enabling measures to facilitate modal shift within the freight sector, e.g. investment in railways, ports and intermodal connectivity. The construction of a smart freight centre in Jakarta using industry 4.0 automation technologies to integrate freight modes could reduce energy use and emissions from the sector. Such measures are key policy objectives in Indonesia’s National Mid-term Development Plan (RPJMN) 2015-2019, which set out to increase rail freight volumes to 5% of total freight, and in Transport Ministerial Regulation 43/2011, which sets out to increase rail freight volumes to 15-17 percent of the total (GIZ 2017).68 There is not sufficient data on freight transport in Indonesia to make accurate predictions for potential revenues from road tolls, or the impact of increased use of shipping on human health. In terms of social impacts, international experience has shown that HDV tolls can result in job losses in the freight sector, particularly in countries where SMEs are dominant, as they are in Indonesia. Schemes to fund freight vehicle retrofits and scrappage schemes, either at national or Jakarta level, can compensate to some extent for potential negative impacts. A number of fiscal measures to reduce air pollution from freight and encourage modal shift from road to rail, inland waterways and short sea shipping are proposed in this study, e.g. vehicle ownership tax differentiated on the basis of vehicle emissions (section 5.2.1.); the proposed congestion charging scheme for Jakarta, which includes high fees for diesel freight vehicles with high emissions (section 5.3.2.); and differentiated taxation of shipping and road transport fuels in DKI Jakarta (section 5.3.3.).
68 Non-fiscal measures to enhance efficiency and reduce emissions from road freight are described in GIZ 2017.

107
5.2. Proposals at the national and/or municipal level
5.2.1. Vehicle ownership tax differentiated by vehicle emissions The current tax system for vehicle ownership in Indonesia is shown in Error! Reference source not found.. Vehicles are subject to import duty, luxury tax, local ownership progressive taxes, title transfer fees, and VAT. Currently, electric vehicles (EVs) are exempt from luxury taxes, and low-cost green cars are subject to reduced rates. These tax breaks certainly create a substantial fiscal incentive for consumers to purchase EVs and low-emissions vehicles. Figure 32: Vehicle taxation in Indonesia up to the point of purchase
Source: Authors
A more nuanced structure for new vehicle ownership differentiated in line with emissions of CO2 and harmful air pollutants could create strong incentives in favour of cleaner vehicles throughout the fleet and encourage consumers unable or unwilling to purchase an EV to nevertheless choose a low-emissions vehicle. There are two points at which the vehicle ownership tax could be revised. The luxury tax regulated by Government Regulation 22/2014 could be reformed at national level with differentiated tax rates applied in line with vehicle emissions of CO2 and harmful air pollutants. Low cost green cars are currently exempt and EVs will be subject to lower luxury tax rates in future (see Box 2). This policy would be in line with the National Energy Plan (RUEN) to reduce GHG emissions by 58 percent on BAU, which foresees the mass penetration of cleaner cars (see chapter 3).

108
Alternatively, the vehicle ownership progressive tax could be reformed at local level, in Jakarta, with differentiated tax rates in line with pollutant emissions, which would be possible under Law N. 28 2009 on local taxes and retribution. A feebate system is not recommended. Some countries have been able, after some initial problems with the feebate design, to successfully implement feebate systems that subsidise the purchase of cleaner vehicles and levy a differentiated fee on high-emitting vehicles, as in France (see section 4.3.1). Ultimately, such schemes can be designed to raise revenue, subsidise the renewal of the fleet, or to be revenue neutral. However, when a feebate is first introduced, it may prove difficult to predict revenue impacts accurately and higher costs than anticipated may result. Given the risk of a feebate policy leading to unpredictably high levels of government expenditure, it seems preferable to introduce a range of fees from a zero rate for low-emissions vehicles to higher rates for high polluting vehicles, as in the case of Norway (see section 4.3.1). Furthermore, from an equity perspective, subsidising individual private transport is undesirable, as these subsidies tend to benefit wealthier income groups, particularly in countries with a relatively unequal distribution of wealth. The differentiated tax proposed here would be paid at the point of purchase by the consumer and replace or reform the luxury tax at national level and/or the ownership progressive tax at local level, to avoid introducing further complications to vehicle purchase taxes. In both cases, existing collection mechanisms could be used. While it may be politically easier to reform the ownership progressive tax at local level, President Widodo has also called for the reform of the luxury tax to incorporate reduced rates for EVs in August 2019 and this may provide a possible opportunity to link the differentiated tax measures proposed here to ongoing reform processes at the national level. The possible rates shown in Table 19 are relatively low and geared towards the reform of the ownership progressive tax at local level, rather than the luxury tax. However, these rates should be understood as an illustration of the possible fee structure, rather than a concrete proposal.69 The tax rates and the vehicles to which they apply should be revised periodically as cleaner vehicles come into more widespread use to ensure that the charges create a dynamic incentive in favour of driving cleaner vehicles and reflect the newest technological developments in the vehicle market. Adjustments would also be important to ensure that revenues do not fall over time.
69 A table showing trends in fleet development in Jakarta from 2012 to 2016 is in annex 1. However, this does not include disaggregated data on the composition of the Jakarta fleet, as this is not available in the public domain: neither are sufficiently disaggregated data for Indonesia. Without this data, it has not been possible to develop specific proposals for tax rates within the confines of this study.

109
Table 190: Vehicle ownership tax differentiated by emissions: possible structure and rates
Source: Authors
It would also be possible to levy a zero rate of vehicle registration tax on electric vehicles (EVs), or to tax them at a lower rate than fossil fuel vehicles, to incentivise their deployment. This would be in line with Presidential Decrees no. 22/2017 and no. 55/2019: the former assumes that by 2025, there will be around 2,200 EVs and hybrid cars and 2.1 electric motorbikes on the road in Indonesia, while the latter calls for the implementation of fiscal incentives for electric and hybrid vehicles (for further comments on EVs, see Box 4).
70 Exchange rate October 2019 average 1USD = 14,165 / 1 IDR = 0.00007 USD taken from InforEuro https://ec.europa.eu/budget/graphs/inforeuro.html
Ownership tax IDR
Ownership tax USD70
Ownership tax IDR
Ownership tax USD
Motorcycles and scooters CO2 emissions component for all four-wheeled vehicles
Electric scooters 0 0 0-39g CO2/km 1,000,000 70
Under 100cc 1,000,000 70 40-70g CO2/km 2,000,000 140
100cc-150cc 1,200,000 84 71-95g CO2/km 3,000,000 210
150cc-250cc 1,400,000 98 96-125g CO2/km 4,000,000 280
250cc-500cc 1,600,000 112 126-194g CO2/km 6,000,000 420
Over 500cc 2,000,000 140 >195g CO2/km 8,000,000 560
AIR POLLUTANT EMISSIONS COMPONENT for the following vehicles
Gasoline-powered LDVs Diesel-powered LDVs
Retrofitted (filter) 500,000 35
Euro IV 250,000 17.50 Euro IV 500,000 35
Euro III 750,000 52.50 Euro III 1,000,000 70
Euro II 3,000,000 210 Euro II 4,000,000 280
Euro I 6,000,000 420 Euro I 8,000,000 560
Pre-Euro standard 8,000,000 560 Pre-Euro standard 10,000,000 700
Alternative fuelled LDVs Light commercial vehicles (gasoline powered)
Electric cars 0 0 Euro IV 2,000,000 140
CNG / LPG vehicles
500,000 35 Euro III 4,000,000 280
Hybrid vehicles 1,000,000 70 Euro II 6,000,000 420
3-wheelers 500,000 35 Euro I 10,000,000 700
3-wheelers CNG conv.
250,000 17.50 Pre-Euro standard 15,000,000 1,050
Light commercial vehicles (diesel powered) Heavy duty vehicles (HDVs) Public transport vehicles pay 50% of rate
Retrofitted 0 0 Retrofitted 0 0
Euro IV 3,000,000 210 CNG conversion 0 0
Euro III 5,000,000 350 Euro IV 2,000,000 140
Euro II 7,000,000 490 Euro III 6,000,000 210
Euro I 12,000,000 840 Euro II 8,000,000 280
Pre-Euro standard 15,000,000 1,050 Euro I 15,000,000 1,050
Pre-Euro standard 20,000,000 1400

110
Box 4: Electric vehicles in Indonesia Indonesia aims to become an EV hub for Asia and beyond and is aiming to start EV production in 2022 and achieve a 20 percent share of EVs in total manufacturing output from the automotive industry by 2025. Several fiscal support measures have been announced, including reduced export tariffs and reduced luxury taxes on electric cars. When President Widodo announced these measures in August 2019, he also called for DKI Jakarta to offer EVs free parking and or free administrative fees (Business Times 2019). There seem to be strong arguments in favour of fiscal measures to boost electric motorcycles in Jakarta, as they are space efficient means of transport in a congested city. The measures proposed above, as well as the tax measures proposed in sections 5.2.1, 5.3.2. and 5.3.3. will support this trend. However, the promotion of EVs is unlikely to bring about significant reductions in impacts on human health in Indonesia as a whole in the medium-term unless steps are taken to accelerate the deployment of renewable energy in parallel, although measures to increase the number of EVs in Jakarta may export some health impacts beyond the city’s boundaries. This is due to the important role played by coal in Indonesia’s energy mix: in 2016, coal accounted for 54 percent of electricity production (IEA 2019). In the period leading up to 2015, it has been estimated that coal-fired power plants in Indonesia caused 6,500 premature deaths annually. Each new coal-fired power station (1000MW capacity) built in Indonesia in the future is expected to result, on average, in 600 additional premature deaths each year (Greenpeace 2015). The IMF has estimated that in 2015, there were 5.9 deaths per million Gigajoules of energy produced by coal-fired power stations (Coady et al. 2019). Therefore, minimising additional health impacts resulting from rising demand for electricity in the transport sector calls for renewable energy deployment on a relatively large scale and the introduction of more stringent emissions standards for coal-fired power stations. The former is in line with the government target to increase renewables in the energy mix to 23 percent by 2025 and is feasible given Indonesia’s estimated 716 GW of theoretical potential for renewable power generation (IRENA 2017).71 However, it is uncertain whether these targets will be met and moreover, given rising energy consumption in the country, it is also not clear that meeting these targets will reduce the negative human health impacts of coal significantly (see e.g. Bridle et al. 2018). Interviews conducted during research for this report have indicated that the national government intends to pursue a two-pronged strategy, reducing power sector emissions while promoting EVs using fiscal incentives. Given the timescales typically required for EVs to penetrate a market on a large scale, this approach may prove to be a viable strategy to encourage first movers immediately with a view to the widespread deployment of EVs in the medium-term. In countries with a large proportion of fossil fuels in the energy mix, it has been demonstrated that using plug-in hybrids and EVs to replace gasoline engines reduces CO2 emissions, but results in increased emissions of particulates, NOx and SO2 (Wu and Zhang 2017). Thus, several measures are proposed in this study which will encourage the take-up of electric and hybrid vehicles, including the differentiated vehicle registration charges (5.2.1), a congestion charging scheme in Jakarta (5.3.2) and reforms to annual motorized vehicle tax (5.3.5). Direct subsidies for EVs are not proposed, due to the risk of higher impacts on human health as a result of increased coal combustion.
71 There are a number of publications which examine policy steps necessary to facilitate renewable energy deployment in the country, which are beyond the scope of their report: the reader is referred to IRENA (2017) and Braithwaite and Gerasimchuk (2019).
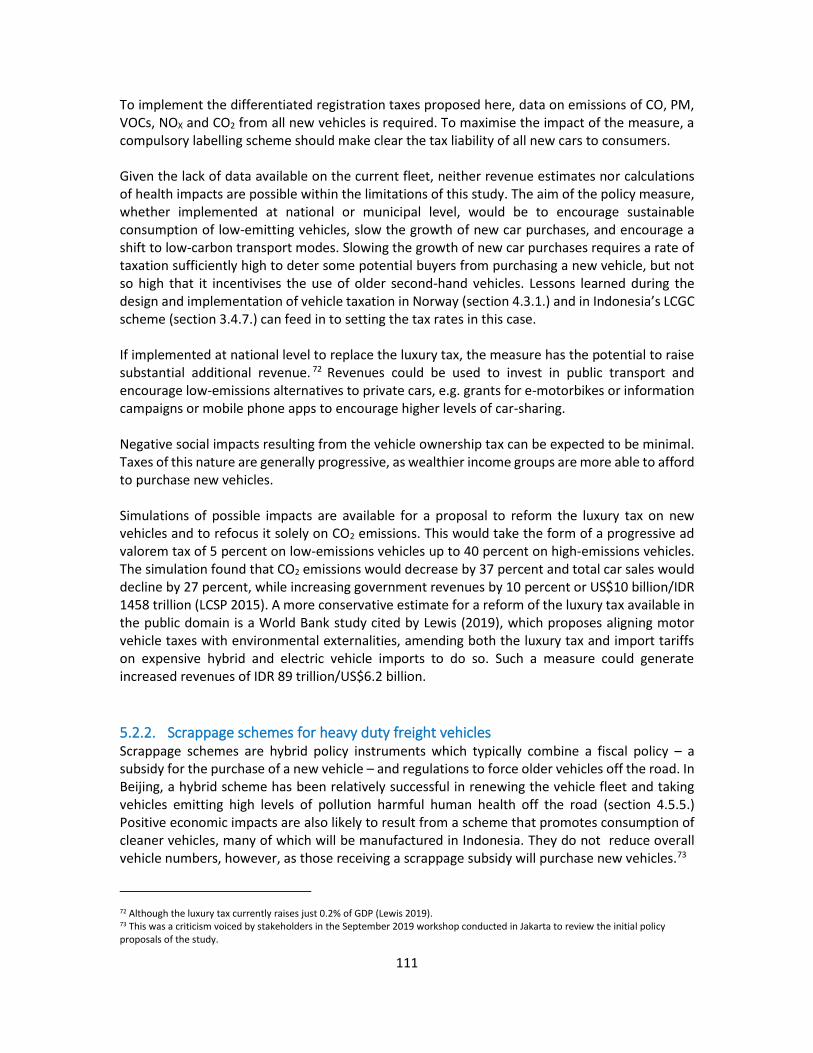
111
To implement the differentiated registration taxes proposed here, data on emissions of CO, PM, VOCs, NOX and CO2 from all new vehicles is required. To maximise the impact of the measure, a compulsory labelling scheme should make clear the tax liability of all new cars to consumers. Given the lack of data available on the current fleet, neither revenue estimates nor calculations of health impacts are possible within the limitations of this study. The aim of the policy measure, whether implemented at national or municipal level, would be to encourage sustainable consumption of low-emitting vehicles, slow the growth of new car purchases, and encourage a shift to low-carbon transport modes. Slowing the growth of new car purchases requires a rate of taxation sufficiently high to deter some potential buyers from purchasing a new vehicle, but not so high that it incentivises the use of older second-hand vehicles. Lessons learned during the design and implementation of vehicle taxation in Norway (section 4.3.1.) and in Indonesia’s LCGC scheme (section 3.4.7.) can feed in to setting the tax rates in this case. If implemented at national level to replace the luxury tax, the measure has the potential to raise substantial additional revenue. 72 Revenues could be used to invest in public transport and encourage low-emissions alternatives to private cars, e.g. grants for e-motorbikes or information campaigns or mobile phone apps to encourage higher levels of car-sharing. Negative social impacts resulting from the vehicle ownership tax can be expected to be minimal. Taxes of this nature are generally progressive, as wealthier income groups are more able to afford to purchase new vehicles. Simulations of possible impacts are available for a proposal to reform the luxury tax on new vehicles and to refocus it solely on CO2 emissions. This would take the form of a progressive ad valorem tax of 5 percent on low-emissions vehicles up to 40 percent on high-emissions vehicles. The simulation found that CO2 emissions would decrease by 37 percent and total car sales would decline by 27 percent, while increasing government revenues by 10 percent or US$10 billion/IDR 1458 trillion (LCSP 2015). A more conservative estimate for a reform of the luxury tax available in the public domain is a World Bank study cited by Lewis (2019), which proposes aligning motor vehicle taxes with environmental externalities, amending both the luxury tax and import tariffs on expensive hybrid and electric vehicle imports to do so. Such a measure could generate increased revenues of IDR 89 trillion/US$6.2 billion.
5.2.2. Scrappage schemes for heavy duty freight vehicles Scrappage schemes are hybrid policy instruments which typically combine a fiscal policy – a subsidy for the purchase of a new vehicle – and regulations to force older vehicles off the road. In Beijing, a hybrid scheme has been relatively successful in renewing the vehicle fleet and taking vehicles emitting high levels of pollution harmful human health off the road (section 4.5.5.) Positive economic impacts are also likely to result from a scheme that promotes consumption of cleaner vehicles, many of which will be manufactured in Indonesia. They do not reduce overall vehicle numbers, however, as those receiving a scrappage subsidy will purchase new vehicles.73
72 Although the luxury tax currently raises just 0.2% of GDP (Lewis 2019). 73 This was a criticism voiced by stakeholders in the September 2019 workshop conducted in Jakarta to review the initial policy proposals of the study.

112
In DKI Jakarta, a scrappage scheme for high-polluting HDVs would be preferable to a scheme for private vehicles, for several reasons (see section 4.7). Under current regulations in DKI Jakarta, public transport vehicles may be no more than ten years old and so, a scheme for freight vehicles is likely to be the most cost-effective means to reduce emissions harmful to human health. This could be implemented either at national or municipal level. The cost of the scheme would depend on the scrappage incentive per vehicle and could be capped at an upper limit. To take a hypothetical example: In Jakarta there are roughly 700,000 trucks. If a scrappage subsidy of IDR 21.2 million/US$1,500 for medium and heavy freight vehicles more than 10 years old had been taken up by 1 percent of the fleet in 2019, the total cost would have been IDR 149 billion/US$10.5 million, or 0.75 percent of the 2019 local government budget. 74 To achieve meaningful reductions in emissions harmful to human health, however, a higher take-up is required and possibly also higher scrappage rates, to encourage participation, particularly of SMEs. Doubling the subsidy and increasing participation to 5 percent would have cost IDR 1.5 trillion/US$105 million in 2019, or 7.5 percent of the local government budget in 2019. An estimate of the impacts of scrappage on human health is impossible given the lack of disaggregated data on freight vehicles. However, as demonstrated by the Beijing experience, scrappage schemes can target the highest emitting vehicles in the fleet and so realise major reductions in harmful emissions. A Euro IV HDV emits 78% less NOx than a Euro O HDV, 88% less CO than a Euro O HDV, and 95% less PM than a Euro I. Scrappage schemes can become expensive, as uptake and overall cost are difficult to estimate accurately, particularly given that very limited data is available on current vehicle ownership. This problem can be addressed by capping the amount of funds available and distributing the subsidy on a first-come first-served basis. Alternatively, a time limit for scrappage subsidies can encourage rapid take-up but is less predictable in terms of the overall cost of the measure. Scrappage schemes come at a sizeable cost to freight companies: SMEs dominate the sector in Indonesia and will struggle to cover the cost of new freight vehicles, and to access sufficient credit. To avoid job losses and failure of businesses in the sector, it may be more equitable and feasible to retrofit older vehicles or convert them to CNG and initiate scrappage schemes in the future, when more data is available on the fleet and sound policies to protect SMEs from negative impacts have been developed (proposed in section 5.3.6 below).
5.3. Proposals at the municipal level The measures proposed in section 5.1 can be implemented at national level and require actions on the part of the national government. Measures in section 0 can be implemented at national or municipal level. In this section short, medium and long-term policy approaches to reduce pollution harmful to human health which can be taken by the municipal government of DKI Jakarta are discussed.
74 The average rate offered in Beijing in 2013/14 for medium and heavy freight more than ten years old (Posada et al. 2015).

113
5.3.1. Electronic road pricing As discussed in chapter 3, in theory electronic road pricing (ERP) is set to be implemented in Jakarta. Possible models, e.g. Singapore, have been touched on above and have the potential to effectively address harmful pollution at hotspots in the city. Currently, it is unclear when the system will be up and running, inter alia due to difficulties in the tendering process which have led to several delays. Given political declarations that this measure will be implemented as soon as possible and that a second tendering process is well under way, it does not seem appropriate to make concrete recommendations for the design of the ERP design in this study. Nonetheless, it is important to note that one success factor for ERP in Singapore has been the perceived reliability of the system, which is likely to have been attributable to exhaustive testing prior to implementation. Detailed traffic monitoring is also required to permit the design of the scheme to address congestion effectively. Both these factors should be taken into account when developing, testing and rolling out ERP for Jakarta.
5.3.2. Low-tech congestion charging scheme for road vehicles in DKI Jakarta The odd-even policy was brought into force in response to delays in implementing ERP and the advantages and disadvantages of the scheme were discussed in chapter 3. A more targeted interim measure, such as the introduction of a low-tech congestion charge for entering a central zone, could address many of the problems of the odd/even policy by targeting vehicles on the basis of their harmful emissions, incorporating charging for scooters and motorcycles in the scheme, and reducing perverse incentives e.g. to obtain a second vehicle. A sticker system is a low-tech way of implementing a basic form of congestion charging in the city of Jakarta without requiring the installation of technology to charge vehicles for each trip they make to the city centre. A requirement for a sticker to be always displayed on a vehicle within the Jakarta Outer Ring Road (JORR) could address the policy gaps of the odd-even policy and act as an interim measure prior to the implementation of ERP. The sticker system would differentiate between high and low emissions vehicles, and hence create a strong price signal in favour of cleaner vehicles within the congestion charging zone. The approach is similar to the honour systems used for low-emissions zones in Germany (and London), where a sticker must be displayed if vehicles wish to access the low-emissions zone (see section 4.4.3). The cost of the sticker would be calculated based on two components: air pollutant emissions harmful to human health based on Euro standards for emissions of CO, NOx and PM, and a CO2 component. If vehicles conform to the Euro standard for some pollutant emissions, but deviate negatively for others, then the lowest category to which the vehicle conforms should be used for tax purposes. A possible tax structure is shown in Table 21. Motorists could be given the option of purchasing a monthly or an annual pass and would always be required to display the sticker on their vehicle . Such a measure could be enforced by means of an honour system, whereby all drivers are expected to purchase a sticker, and parking attendants and traffic police check vehicles and levy high fines for non-compliance. This low-tech congestion charging scheme offers policymakers a more targeted way of reducing air pollution in Jakarta than the current odd-even policy. The scheme could be implemented rapidly, without installing costly or complex technology. This is important, as the ERP has faced

114
many setbacks and it is not likely to be possible to install automatic number plate recognition software on ERP gantries around the city. Instead, stickers could be made available for purchase from several outlets, including automatic machines. To prevent theft, stickers would have to be clearly attributed to a vehicle number plate. Table 20: Proposed fee structure for the congestion charging scheme
Source: Authors
A proportion of the savings resulting from the failure to implement ERP in 2019 – IDR 39.3 billion in 2019/US$2.75 million – could be reinvested in the congestion charging scheme (Jakarta Post 2019b). A 2019 gubernatorial instruction foresees the implementation of ERP in 2021, when the sticker system could be replaced. However, independent experts have suggested that this timeline might also not prove realistic, given the time taken so far for the bidding process and the
75 Exchange rate October 2019 average taken from InforEuro https://ec.europa.eu/budget/graphs/inforeuro.html
Monthly cost IDR
Monthly cost USD75
Monthly cost IDR
Monthly cost USD
Motorcycles and scooters CO2 emissions component for all four-wheeled vehicles
Electric scooters
0 0 0-39g CO2/km 50,000 3.50
Under 100cc 50,000 3.50 40-70g CO2/km 100,000 7.00
100cc-150cc 60,000 4.20 71-95g CO2/km 150,000 10.50
150cc-250cc 70,000 4.90 96-125g CO2/km 200,000 14.00
250cc-500cc 80,000 5.60 126-194g CO2/km 300,000 21.00
Over 500cc 100,000 7.00 >195g CO2/km 400,000 28.00
AIR POLLUTANT EMISSIONS COMPONENT for the following vehicles
Gasoline-powered LDVs Diesel-powered LDVs
Retrofitted (filter) 50,000 3.50
Euro IV 25,000 1.75 Euro IV 50,000 3.50
Euro III 50,000 3.50 Euro III 100,000 7.00
Euro II 75,000 5.25 Euro II 150,000 10.50
Euro I 100,000 7.00 Euro I 200,000 14.00
Pre-Euro standard
300,000 21.00 Pre-Euro standard 400,000 28.00
Alternative fuelled LDVs Light commercial vehicles (gasoline powered)
Electric cars 0 0 Euro IV 50,000 3.50
CNG / LPG vehicles
50,000 3.50 Euro III 100,000 7.00
Hybrid vehicles 100,000 7.00 Euro II 150,000 10.50
3-wheelers 50,000 3.50 Euro I 200,000 14.00
3-wheelers CNG conv.
25,000 1.75 Pre-Euro standard 400,000 28.00
Light commercial vehicles (diesel powered) Heavy duty vehicles (HDVs) Public transport vehicles pay 50% of rate
Retrofitted 100,000 7.00 Retrofitted 0 0
Euro IV 100,000 7.00 CNG conversion 0 0
Euro III 200,000 14.00 Euro IV 200,000 14.00
Euro II 300,000 21.00 Euro III 300,000 21.00
Euro I 400,000 28.00 Euro II 400,000 28.00
Pre-Euro standard
600,000 42.00 Euro I 600,000 42.00

115
withdrawal of business that had tendered for the scheme, citing “continued uncertainty regarding the tendering timeline, project structure and financing, and project profitability” (Jakarta Post 2019b). Given the lack of data available on the Jakarta fleet, neither accurate revenue estimates nor calculations of health impacts are possible within the limitations of this study. We can however take an average of the impacts of congestion charging elsewhere on emissions. Timilsina and Dulal (2015) suggest that congestion charges generally reduce vehicle traffic by 9-12 percent. If we take the lower figure of 9%, we can sketch out a hypothetical case for health cost savings had congestion charging been implemented in 2016. Assuming a linear relationship between a fall in traffic volumes, harmful emissions, and health costs: If congestion charging reduces traffic by 9%, this would result in a 9% drop in transport sector related air pollutant emissions, and a 9% reduction in health costs, generating health cost savings of as much as IDR 1.6 trillion/US$120 million compared to a non-reduction scenario. Further possible impacts include: Higher use of cleaner vehicles; modal shift to public transport; reduced non-essential journeys; bundling of tasks in central Jakarta by travellers. As it is not transferable between vehicles, the sticker system may also encourage higher rates of car and motorcycle sharing. These changes in behaviour would reduce emissions harmful to human health, by reducing overall traffic volumes, congestion and idling. Positive outcomes will likely be maximised by implementing congestion charging in parallel to two further measures proposed below: a reform of municipal vehicle registration tax and the distribution of low-cost and free public transport tickets. Unlike the odd-even policy, introducing congestion charging would also have the potential to raise revenues for the city of Jakarta, which could be used to fund CNG conversions or retrofits to install diesel filters in heavy duty vehicles, including both freight vehicles and public transport (see below). Clearly, the revenue-raising potential of the measure is closely linked to how effectively the scheme is enforced, and there is a risk of evasion and corruption. Relatively high penalties can encourage compliance, offset the financial cost of tax evaders and raise additional revenue. In terms of revenue, in Berlin for example, 65,000 drivers annually on average, the vast majority not from the city, fail to comply with the low-emissions zone (for more information on lessons learned from the enforcement of low-emissions zones in Germany see 4.4.3.). Assuming 100 percent enforcement, penalty charges in Berlin have the potential to raise revenues of approximately US$5.7 million / IDR 81 billion annually. Furthermore, as noted above, honour systems also tend to see reduced levels of evasion over time, as compliance becomes the norm and drivers understand the system. In terms of public acceptability, the scheme is open to criticism, because it cannot differentiate between the time of travel or the distance travelled. However, this is also true of the odd/even policy, in comparison to which the proposed scheme represents a significant improvement in terms of fairness and more effective targeting of polluters. Concerns regarding possible negative impacts on poorer households may also be raised, although the differentiated charges, and low charges for motorcycles, mean that in many cases, the fee charges will have a progressive impact. It is proposed that accompanying measures to distribute

116
free public transport tickets to poorer households be introduced concurrently to encourage modal shift and prevent negative equity impacts on poorer households (see 5.3.4. below).
5.3.3. Increase Motorized Vehicle Fuel Tax differentiated by fuel type under Act 28/2009 Currently, Motorized Vehicle Fuel Tax is levied at 5 percent under Act 28/2009 in DKI Jakarta. Under this act, provinces can impose a tax on transport fuels of up to 10 percent on the sale price. However, this rate was capped at 5 percent by Presidential Decree in 2014. This 5 percent tax rate represents an effective carbon tax of IDR 323/US$9.24 on gasoline (RON 88), IDR 231/US$6.18 on diesel (CN48) and IDR 155/US$6.67 on CNG – an average of around US$7.37, which is low by international comparison and far below the recommended rates proposed by the High-Level Commission on Carbon Prices of US$40-80/tCO2e by 2020 and US$50-100/tCO2e by 2030 (OECD 2019a; HLCCP 2017).76 Lifting the cap set by the 2014 Decree with immediate effect would enable DKI Jakarta to impose higher taxes on transport fuels. The gradual implementation of a differentiated tax rate up to the upper limit of 10 percent would boost political acceptance for the measure and deliver stable and predictable tax increases upon which business and private consumers can base their decisions. Possible rates are shown in Table 22. Table 21: Proposed fuel tax escalator 2020-2022
Diesel Gasoline LPG / CNG Shipping fuel
2020 8% 6% 0% 0%
2021 9% 7% 0% 0%
2022 10% 8% 0% 0% Source: Authors
Levying an environmental tax on the price of transport fuels rather than on the quantity consumed is not recommended in the longer term. An ad quantum tax is more in line with the principles and rationale of environmental taxation, as it imposes a price on a unit of pollution, rather than deriving the tax payable from the price of the good or service. An ad valorem tax on the other hand risks amplifying fluctuations in the global oil price in a domestic setting. Furthermore, there is a risk that levying a tax on transport fuels at different rates in different provinces will create market distortions and result in “tank tourism” or fuel mixing. However, even taking these disadvantages into account, as an interim measure with the potential to be implemented relatively rapidly, a differentiated ad valorem tax would create a price signal in favour of cleaner fuel in the city. International experience has shown that the response to differentiated tax rates on transport fuels can be disproportionate to the amount of price increase, e.g. differentiated taxes on leaded and unleaded fuels in Thailand (see 4.2.3.). This measure has the potential to reduce consumption of transport fuels in general, encourage fuel switching from diesel to CNG/LPG and to gasoline vehicles, as well as encouraging modal shift from road freight to inland waterways/shipping in response to the rising cost of diesel and the zero rate of tax imposed on shipping fuels for shipping.
76 The rates calculated here use the same assumptions as for the calculation of the impact assessment in 2019.
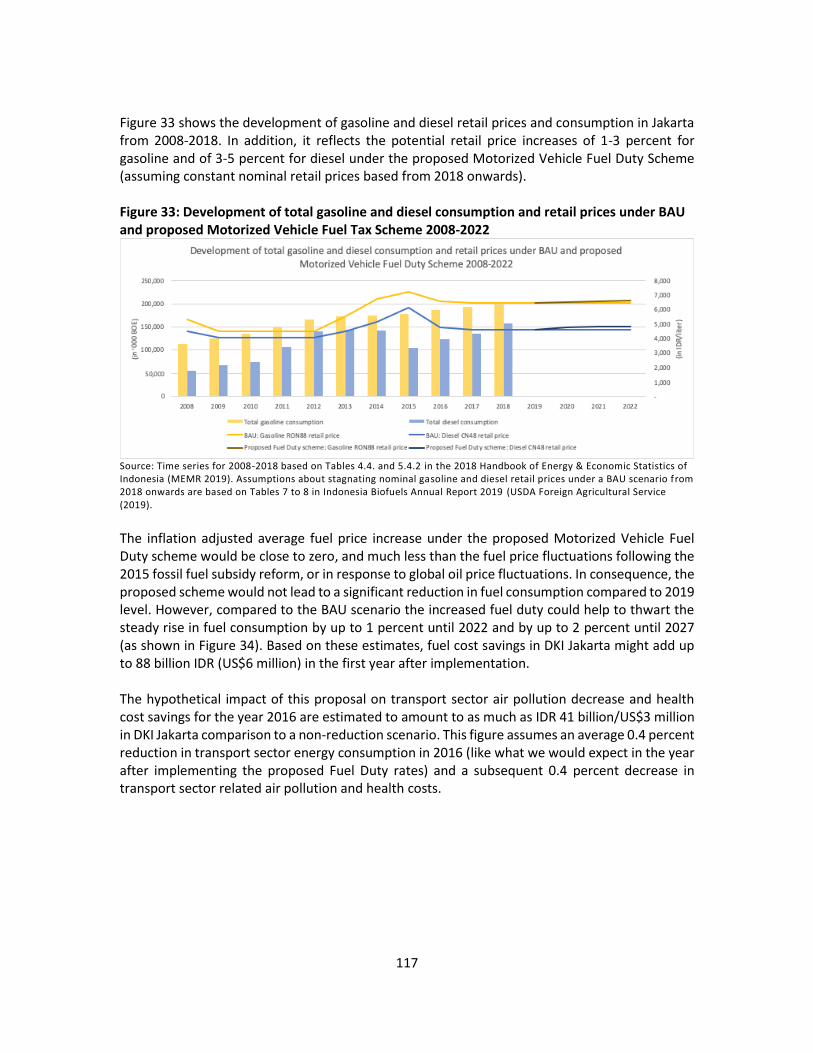
117
Figure 33 shows the development of gasoline and diesel retail prices and consumption in Jakarta from 2008-2018. In addition, it reflects the potential retail price increases of 1-3 percent for gasoline and of 3-5 percent for diesel under the proposed Motorized Vehicle Fuel Duty Scheme (assuming constant nominal retail prices based from 2018 onwards). Figure 33: Development of total gasoline and diesel consumption and retail prices under BAU and proposed Motorized Vehicle Fuel Tax Scheme 2008-2022
Source: Time series for 2008-2018 based on Tables 4.4. and 5.4.2 in the 2018 Handbook of Energy & Economic Statistics of Indonesia (MEMR 2019). Assumptions about stagnating nominal gasoline and diesel retail prices under a BAU scenario from 2018 onwards are based on Tables 7 to 8 in Indonesia Biofuels Annual Report 2019 (USDA Foreign Agricultural Service (2019).
The inflation adjusted average fuel price increase under the proposed Motorized Vehicle Fuel Duty scheme would be close to zero, and much less than the fuel price fluctuations following the 2015 fossil fuel subsidy reform, or in response to global oil price fluctuations. In consequence, the proposed scheme would not lead to a significant reduction in fuel consumption compared to 2019 level. However, compared to the BAU scenario the increased fuel duty could help to thwart the steady rise in fuel consumption by up to 1 percent until 2022 and by up to 2 percent until 2027 (as shown in Figure 34). Based on these estimates, fuel cost savings in DKI Jakarta might add up to 88 billion IDR (US$6 million) in the first year after implementation. The hypothetical impact of this proposal on transport sector air pollution decrease and health cost savings for the year 2016 are estimated to amount to as much as IDR 41 billion/US$3 million in DKI Jakarta comparison to a non-reduction scenario. This figure assumes an average 0.4 percent reduction in transport sector energy consumption in 2016 (like what we would expect in the year after implementing the proposed Fuel Duty rates) and a subsequent 0.4 percent decrease in transport sector related air pollution and health costs.
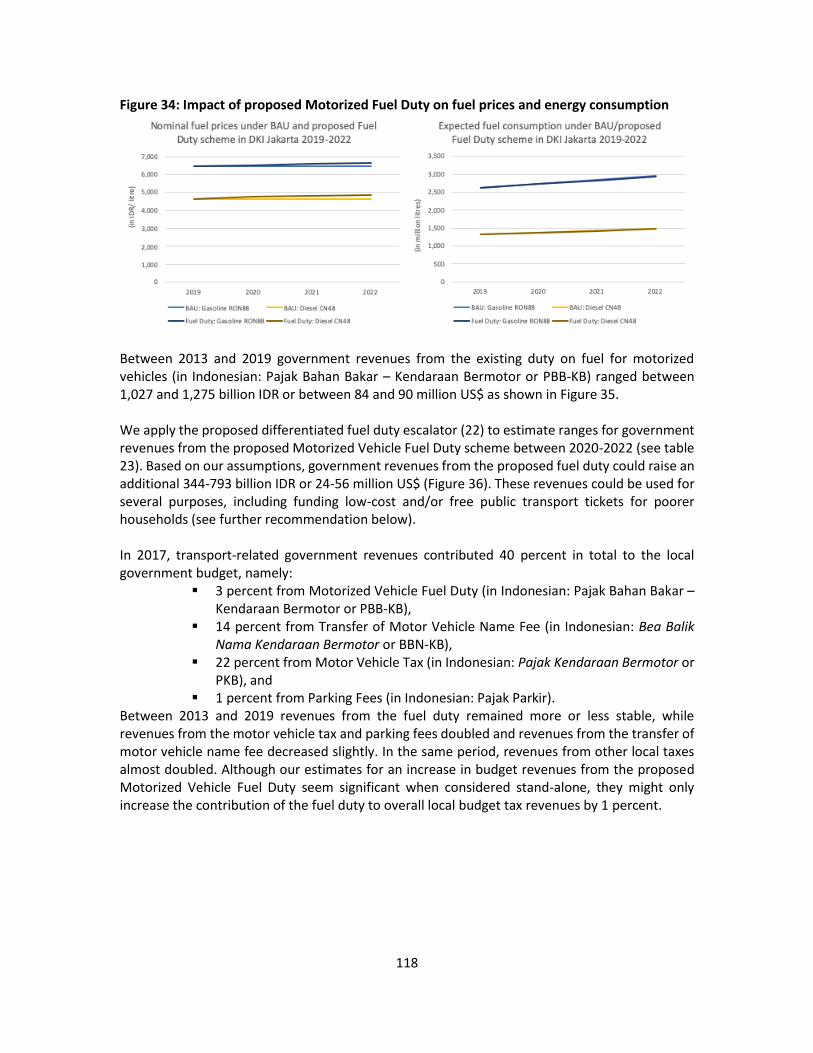
118
Figure 34: Impact of proposed Motorized Fuel Duty on fuel prices and energy consumption
Between 2013 and 2019 government revenues from the existing duty on fuel for motorized vehicles (in Indonesian: Pajak Bahan Bakar – Kendaraan Bermotor or PBB-KB) ranged between 1,027 and 1,275 billion IDR or between 84 and 90 million US$ as shown in Figure 35. We apply the proposed differentiated fuel duty escalator (22) to estimate ranges for government revenues from the proposed Motorized Vehicle Fuel Duty scheme between 2020-2022 (see table 23). Based on our assumptions, government revenues from the proposed fuel duty could raise an additional 344-793 billion IDR or 24-56 million US$ (Figure 36). These revenues could be used for several purposes, including funding low-cost and/or free public transport tickets for poorer households (see further recommendation below). In 2017, transport-related government revenues contributed 40 percent in total to the local government budget, namely:
▪ 3 percent from Motorized Vehicle Fuel Duty (in Indonesian: Pajak Bahan Bakar – Kendaraan Bermotor or PBB-KB),
▪ 14 percent from Transfer of Motor Vehicle Name Fee (in Indonesian: Bea Balik Nama Kendaraan Bermotor or BBN-KB),
▪ 22 percent from Motor Vehicle Tax (in Indonesian: Pajak Kendaraan Bermotor or PKB), and
▪ 1 percent from Parking Fees (in Indonesian: Pajak Parkir). Between 2013 and 2019 revenues from the fuel duty remained more or less stable, while revenues from the motor vehicle tax and parking fees doubled and revenues from the transfer of motor vehicle name fee decreased slightly. In the same period, revenues from other local taxes almost doubled. Although our estimates for an increase in budget revenues from the proposed Motorized Vehicle Fuel Duty seem significant when considered stand-alone, they might only increase the contribution of the fuel duty to overall local budget tax revenues by 1 percent.

119
Figure 35: Realised and targeted government revenues from the existing Motorized Vehicle Fuel Duty scheme/ PBB-KB in relation to gasoline and diesel retail prices between 2013-2019
Sources: Realized revenues from the existing Motorized Vehicle Fuel Duty scheme/ PBB-KB between 2013-2017 cited from Tables 2.9 to 2.13 in “Rencana Strategis (Renstra) Tahun 2017 -2022 (Badan Pajak dan Retribusi Daerah Provinsi (BPRDP) DKI Jakarta (2019); Gasoline, diesel and crude oil prices between 2013-2018 cited from Tables 1.5 and 4.4. in (MEMR 2019); assumptions about stabilized gasoline and diesel retail prices in 2019 are based on Tables 7 to 8 in (USDA Foreign Agricultural Service 2019); 2019 Motorized Vehicle Fuel Duty revenues represent the target of the Government of DKI Jakarta instead of realized revenues (APBD Jakarta 2019); due to a lack of data 2018 Motorized Vehicle Fuel Duty revenues were calculated as the mean of values for 2017 and 2019.
Table 22: Minimum and maximum estimated local tax revenues from the fuel duty in DKI Jakarta between 2020-2022
(billion IDR) Total minimum Total maximum Average increase as compared to BAU
Range 2013-2019 1,027 1,275
2020 1,334 1,656 344
2021 1,535 1,905 569
2022 1,734 2,153 793 Assumptions for 2020-2022: constant contribution to transport sector fuel sales of each fuel type (73% gasoline, 27% diesel) in DKI Jakarta as of 2015; constant Motorized Vehicle Fuel Duty revenues under BAU (ranging between 1,027-1,275 billion IDR).
Figure 36: Realised and estimated local tax revenues from the fuel duty between 2019-2022 (in billion IDR)
Assumptions for 2020-2022: constant contribution to transport sector fuel sales of each fuel type (73% gasoline, 27% diesel) in DKI Jakarta as of 2015; constant Motorized Vehicle Fuel Duty revenues under BAU (ranging between 1,027 -1,275 billion IDR).

120
A carbon tax on transport fuels in DKI Jakarta may pave the way for the imposition of a carbon tax on transport fuels at national level, if a national tax proves politically too difficult to implement. The national carbon tax could be linked to the collection mechanisms used for excise duty, targeting very few taxpayers to minimise the administrative cost. If the introduction of a national ad quantum carbon tax proves to be politically difficult, an alternative approach would be to reform Law 28/009 pertaining to the PBBKB law, to enable provinces to levy an ad quantum tax on the carbon content of transport fuels. Once this has been achieved, as with the proposal for a national carbon tax, a tax rate should be implemented gradually and by means of an escalator. Figure 37: Share of transport related local tax revenues of total local tax revenues between 2013-2019 (billion IDR)
Source: Realized revenues from Fuel Duty/ PBB-KB between 2013-2017 cited from Tables 2.9 to 2.13 in “Rencana Strategis (Renstra) Tahun 2017-2022” (Badan Pajak dan Retribusi Daerah Provinsi DKI Jakarta 2019); 2019 Fuel duty revenues represent the target of the Government of DKI Jakarta instead of realized revenues (APBD Jakarta 2019); due to a lack of data 2018 revenues were calculated as the mean of values for 2017 and 2019.
5.3.4. Allocation of free public transport tickets for poor households Packages of measures to foster transport policy objectives such as modal shift tend to be more effective than instruments implemented in isolation. Distribution of free tickets to poorer households for mass rapid transit and light rail transit in parallel to the introduction of higher taxes on transport fuels has the potential to increase the rate of modal shift to public transport. While it would not be possible to legally earmark revenues raised through the PBBKB, policymakers could communicate the political relationship between the two policies. Considering a current subsidy of 11,000-21,000 IDR per metro (MRT) ticket and 35,000 IDR per light rail transit (LRT) ticket (The Insider Stories 2019), the increase in government revenues from the proposed Motorized Fuel Duty Scheme (above) could help to subsidize 16-31 million MRT tickets or 10 million LRT tickets in 2020, 27-52 million MRT tickets or 16 million LRT tickets in 2021 and 38-72 million MRT tickets or 23 million LRT tickets in 2022 (see Table 23). The Jakarta MRT became operational at the beginning of 2019 and by July 2019, up to 94,000 passengers were using the MRT per day. A further decrease of ticket prices might help to increase the number of passengers (Kompas 2019).

121
Table 23: Number of MRT or LRT tickets that could be subsidized from the increase in government revenues from the proposed Motorized Vehicle Fuel Duty scheme 2020-2022
(IDR) MRT Minimum MRT Maximum LRT
Economic tariff 21.000 31.000 41.000
Ticket 10.000 10.000 6.000
Subsidy 11.000 21.000 35.000
Number of tickets that could be subsidized from the increase in government revenues from the proposed Motorized Vehicle Fuel Duty scheme
2020 31.278.782 16.384.124 9.830.474
2021 51.756.588 27.110.594 16.266.356
2022 72.134.735 37.784.861 22.670.917 Source: The Insider Story 2019
Such a policy could go some way to mitigating potentially negative impacts of the introduction of the congestion charging scheme and/or increased fuel prices resulting from the measures proposed above. Distribution could be linked to existing pro-poor mechanisms distributing low-cost tickets for public transport. The measure would also complement existing measures to subsidise public transport tickets.
5.3.5. Reform annual motorized vehicle tax in Jakarta (PKB) to differentiate based on harmful emissions
Reforming the annual motorized vehicle tax in Jakarta – the Pajak Kendaraan Bermotor or PKB) – to turn it into a tax differentiated based on vehicle emissions could follow the basic tax structure for the vehicle ownership tax proposed above. This measure is relatively important in terms of revenue in Jakarta and accounted for IDR 5.1 trillion/US$357 billion – 15.7 percent of all local tax income in the 2014 budget (LCSP 2015). Currently, to deter multiple car ownership, Jakarta charges a 2 percent PKB tax on the first car registered at an address, 4 percent on the second car, 6 percent on the third and 10 percent on the fourth. Given that the system is currently easily avoided by registering cars under different names, or even in different provinces, some caution in the implementation of these multipliers should be exercised to encourage compliance. Annual motorized vehicle taxes could be levied e.g. using a multiple of 1.5 for the second vehicle, x2 for the third, x2.5 for the fourth, etc. To implement, Law 28 of 2009 regarding Local Government Taxes and Retributions would have to be reformed. The implementation of this measure would also require additional data in vehicle registration certificates (STNK). For circulation charges to be implemented on the basis of the tax brackets proposed in Table 19, data on the Euro classification and CO2 emissions of all road vehicles in the fleet is required. It is unclear whether such data is currently available for all vehicles in Indonesia and as a result, this measure is recommended for implementation pending further analysis.

122
5.3.6. Subsidies for the installation of CNG conversion kits and particulate filters for diesel freight vehicles and diesel
However, emissions from freight vehicles are yet to be tackled effectively, although they are expected to account for 10 percent of SO2 emissions in Jakarta by 2030 in a BAU scenario (Haryanto 2017). A ban on the import of second-hand trucks from 2006-2015 was not enforced, which led to an estimated 2,000 trucks being illegally imported each year. Subsequent legislation reversed the policy (GIZ 2017). Small fiscal incentives to retrofit or convert freight vehicles to CNG would be created by the schemes proposed above to differentiate vehicle registration and circulation fees in line with emissions, as would the proposed introduction of congestion charging in Jakarta. However, the payback times would be relatively long. Subsidy schemes to fund or part-fund the installation of technologies to reduce emissions harmful to human health in diesel freight vehicles, e.g. conversion to CNG or retrofitting to recirculate exhaust gas, install diesel oxidation catalysts and implement selective catalytic reduction would encourage freight companies operating on narrow profit margins to invest in clean technologies. Low awareness of solutions to reduce emissions in a fragmented sector could be addressed by information campaigns to raise awareness of the subsidy. Revenues from fuel taxes or sale of stickers for the congestion charging scheme could be used to fund the programme. The subsidy could cover the cost of installation minus the annual savings resulting from the lower congestion charge payable and lower annual taxation of CNG-converted or retrofitted freight vehicles. Upgrading a Euro II HDV with emission control technologies necessary to comply with Euro IV standards costs approximately IDR 38 million/US$2,700 per vehicle (ICCT 2014). Some vehicle technologies are too old to be effectively retrofitted. In such cases, a scrappage scheme might be the most effective best policy response. It is not possible to predict the potential cost of this scheme, or its health impacts, as data is not available on the composition of the fleet and take-up is unpredictable. If 1% of freight vehicles in Jakarta took up the scheme, or 7,000 vehicles, it would cost IDR 268 billion/US$18.9 million. There is a risk that higher freight costs result in indirect price increases, such as higher food prices, which would impact negatively on poor households. Depending on their magnitude, economic growth may also be negatively affected by policies to increase the cost of freight. However, this must be weighed against the economic, social and environmental benefits of reduced air pollution.
5.3.7. Subsidies for electrification of public transport In the public transport sector, many efforts have already been made to reduce emissions from the fleet. Regulations to clean up the public transport fleet have resulted in buses over 10 years old with high levels of harmful emissions being taken off the road in Jakarta (see Perda no.5/2014). UN Environment and partners are currently supporting a program move towards electrifying the public transport fleet in Jakarta. Initial pilots of single and medium-size electric buses took place in May 2019 (UNEP 2019). Widespread deployment of electric buses in the capital is currently under consideration and could have significant effects on air pollution: There are more than 3,000 buses in Jakarta: if 30 percent of the fleet was made up of electric vehicles,

123
local emissions of harmful pollutants such as NOx and SO2 would fall by around 30 percent, particulate emissions would also fall to a lesser extent as some emissions are from braking and tyres. In terms of equity impacts, it would be important to ensure that public transport ticket prices do not increase as a result of the higher upfront costs of electric buses. Otherwise, only positive equity impacts are predicted due to improvements in human health outcomes and reduced health costs. As noted elsewhere in this study, these benefits will be disproportionately felt by poorer income quintiles. Increased revenues from the policies proposed above, including the congestion charge, could be used by the Jakarta government to build charging infrastructure and subsidise the deployment of electric buses, as has taken place in India and the UK (see section 4.5.1). In parallel, it is essential that Indonesia introduce higher emissions standards for coal plants to ensure that emissions are not simply shifted out of the city centre: otherwise, the human health benefits of introducing EVs in the public transport sector will be low.

124
6. Conclusions: Policy options and the way forward
6.1. Summary of key findings and proposed policy reform package Table 24 summarises the recommended fiscal policy package and proposes an implementation timeline. 77 The timeline is based on three main considerations. First, the need to sequence policies carefully and so minimise negative impacts on vulnerable households and small businesses. Second, to ensure that policymakers have time to respond gradually to political developments and potential negative impacts as they occur – particularly important in view of the political sensitivity of fuel prices in Indonesia. Third, to leave time for preparatory measures to be put in place prior to the implementation of the fiscal policies suggested. Purely fiscal policy measures and hybrid measures – which combine elements of regulatory measures and fiscal policies – are proposed. The fiscal policy measures which are the focus of this chapter should be complemented by additional non-fiscal recommendations outlined in this study, including efforts to improve data collection, transparency, monitoring and reporting capacities, more stringent fuel quality regulations, and efforts to update existing regulation and address overlaps (see section 6.2. on implementation challenges). Short-term measures focus on quick or easy wins, which can be implemented efficiently and are likely to be met with low resistance on the part of stakeholders or consist of measures which are necessary to pave the way for deeper reforms in the transport sector. These measures include a combination of regulations to reduce sulphur content in fuel and a fiscal measure – differentiated sulphur excise duty – to incentivise cleaner fuels and ensure that price signals work in favour of cleaner fuels throughout the economy. It is intended that some of these complementary measures will bring about relatively rapid reductions in emissions in Jakarta, e.g. differentiated sulphur taxation alongside better regulation of vehicle and fuel standards. The low-tech congestion charge proposed is a response to the delays to the implementation of ERP and could act as a stop gap to reduce traffic volumes in the interim and be replaced by the more targeted ERP as soon as possible. Medium term measures will take longer to prepare and implement, due to a greater level of consensus building that is required, or the need for further data analysis to inform policy development. Lower priority medium-term policies call for provincial and/or national government expenditure, and so might be more suitable for a second policy phase once additional revenues have been raised for investment. Some measures could be implemented at national or provincial level. Where this is the case, it has been clearly marked in the table. Without further analysis of the political economy from the perspectives of relevant policymakers and stakeholders, it is difficult to ascertain which level of government will prove to be more politically feasible in practice. In all cases, an effort was made to identify measures that are relatively simple and cost-effective, so as not to introduce additional complexity into the system. The administrative cost of levying
77 Detailed descriptions of all measures proposed, including, data permitting, analyses of their costs or potential revenue raised, as well as impacts on human health and broader environmental and climate impacts can be found in chapter 5.

125
taxes on transport fuels is low and such taxes are easy to implement as they target only a few taxpayers at the top of the value chain, whether the tax base is sulphur content, CO2 emissions or fuel type. The package prioritises the application of taxes, fees and charges to change behaviour and boost the revenue available to subsidise alternative transport modes and invest in public transport in Jakarta. These steps are essential to establish a viable alternative to private mobility and reduce congestion and traffic volumes. Such measures would build on and support ongoing initiatives to improve public transport by expanding LRT, MRT and BRT networks and efforts to better integrate public and private bus transport systems, as well as ongoing programmes to pilot electric buses and clean up the bus fleet by taking the oldest and most high polluting public transport vehicles off the road. Where the obstacles to the reduction of harmful emissions are related to lack of access to capital or lack of incentives to invest in lower-polluting alternatives, subsidy expenditures are proposed to bring about behavioural change and foster investment in clean alternatives. This is the case for road freight. On the one hand, freight will be affected by the proposed congestion charging scheme and fuel tax increases, which will encourage greater efficiency in the sector, fewer empty journeys and upgrading of the fleet. On the other hand, as a sector dominated by SMEs, many businesses are unlikely to be able to access sufficient credit to retrofit or replace older vehicles. For this reason, subsidies are also proposed. In this way, the package sets out to address multiple aspects of the pollution and health nexus in Jakarta and to systematically address the primary obstacles to behavioural change. Finally, this study proposes several measures to encourage the take-up of private low-emissions and electric vehicles, including the differentiated vehicle registration charges, a congestion charging scheme, and reforms to annual motorized vehicle tax. Further measures to subsidise electric motorcycles could be considered, as these are more energy-efficient and importantly, space efficient in the context of a highly congested city. For potential improvements in air quality and human health to be realised from electrification of the transport sector, the importance of reducing emissions of harmful pollutants and GHGs from power generation cannot be overemphasised. Renewable energy deployment is an absolute priority in this context, as are steps to tighten and enforce emissions standards in existing coal power stations. If a corresponding focus on tackling harmful emissions from coal and driving energy transition does not accompany EV penetration, the overall health benefits will be low. It should be noted that positive equity impacts result from improvements in human health outcomes and reduced health costs. These benefits will be disproportionately felt by poorer income quintiles, as they are more negatively affected by poor air quality. Communication strategies employed by the Jakarta government to build support for fiscal policies should emphasise these benefits and educate the public on the costs associated with poor ambient air quality and its impacts on human health. Such a strategy would feed into the current wave of increasing awareness of the negative impacts of air pollution on health amongst Jakarta’s population, which is simultaneously the cause and the result of the citizen’s lawsuit instigated in 2018.

126
Table 24: Fiscal policy recommendations Measure
National = N Provincial = P
Relationship to existing policies
Predicted revenue
Impacts on emissions
Health cost savings78
Social impacts and measures to
address
Further comments Priority and
timeline
Differentiated sulphur excise duty (N)
MoEF Decree No. 20/ 2017 regulates sulphur content of fuels
IDR 22,078 bn US$1.6 bn (2018)
Reduced fuel consumption: CN48 -4% Bio gasoil -1% Other fuels <1% 1.4% decrease in air pollution
IDR 258 billion US$19 million
Tax rate per litre for most fuels IDR 100 (0.7 US cents). IDR 700 on CN48 (5 US cents). Limited social impacts anticipated.
Essential to reinforce fuel standards and drive investment in desulphurisation of fuels. Easy to implement – targets a few large taxpayers. Will address perverse incentive that poor quality fuels are currently priced lower than high quality fuels.
Highest priority Short term (2020)
Reform of diesel subsidies, removal of price regulations (N)
Price regulations imposed by Presidential Decree will run out at end 2019. They should not be extended.
IDR 24 tr / US$1.7 bn in 2018
IDR 104 tr / USD 7 bn in 2019
Estimates for 2018 not available but international experience shows that a reduction in harmful emissions and CO2 is to be expected (see e.g. IMF 2019)
Estimates not available
Possible negative impacts on lower income groups. Cash transfers & higher spending on welfare, health, education
Fuel price regulation must be phased out (current presidential guarantees run until the end of 2019). In 2020, subsidies should be replaced with market-based fuel pricing and fuel taxes. Consensus building and sound welfare measures will be essential in parallel to reform.
Highest priority Short term (2020)
Measure National = N Provincial = P
Relationship to existing policies
Predicted revenue79
Impacts on emissions
Health cost savings80
Social impacts and measures to address
Further comments Priority
Congestion charging system
2019 gubernatorial instruction foresees
Estimates not
Congestion charging reduces
If the scheme reduces traffic
Distribution of free public
Low administrative cost (covered by revenues from sticker sales),
High priority
78 Health cost savings are calculated on the basis of total health costs in 2016 (the most recent year for which data is available). 79 Predicted revenues are based on costings for 2018 unless otherwise stated. 80 Health cost savings are calculated on the basis of total health costs in 2016 (the most recent year for which data is available).

127
in Jakarta within JORR (P)
ERP in 2021. A low-tech sticker system is proposed as a temporary measure to implement, in line with previous gubernatorial instructions.
possible due to lack of fleet data
traffic volumes on average by 9-12%. We assume roughly linear emissions reductions
by 9%: IDR 1.6 trillion / US$120 million
transport tickets to poor households to mitigate negative equity impacts
low-tech measure to reduce harmful emissions and discourage most polluting vehicles to travel in central Jakarta. Should reduce congestion and encourage modal shift. Requires further analysis of the fleet in Jakarta to finalise tax bands and tax rates and estimate revenue and impact.
Short term (2020)
Increased Motor Vehicle Fuel Tax differentiated by fuel type (P)
Under Act 28/2009 provinces can tax transport fuels up to
10% of the sale price. Rate capped at 5% by Presidential Decree in 2014. Cap needs to be lifted to implement.
IDR 344-793 bn US$24-56 mn (2020-2022)
Reduced fuel consumption: 1% by 2022 and 2% by 2027. Fuel cost savings IDR 88 billion / USD 6 million in first year
IDR 41 bn / US$3 mn
Negative equity impacts expected to be minimal: Distribution of free / low-cost public transport tickets to mitigate negative impacts
Low administrative cost, but may be challenging to build consensus and implement, as fuel prices highly politicised in Indonesia. Essential that lower taxes are levied on cleaner fuels (anything else distorts the market in favour of dirty fuel).
High priority Short term (2020)

128
Measure National = N Provincial = P
Relationship to existing policies
Predicted revenue81
Impacts on emissions
Health cost savings82
Social impacts and measures to
address
Further comments Priority
Differentiated vehicle ownership taxes levied on the purchase of new vehicles (N / P)
Amendment of Government regulation No. 41/ 2013 to amend luxury tax. RUEN foresees higher numbers of EVs, hybrids, low-emissions cars and urban access limitations on freight transport vehicles. Presidential Decree No. 55/ 2019 calls for fiscal measures in favour of EVs.
(N) Lewis 2019: USD 6.2 bn/ IDR 89 tr (N) LCSP 2015: USD 10 bn / IDR 1,458 tr (P) up to USD 1 bn / IDR 14 tr
Estimates for our proposal not possible due to lack of fleet data LCSP model (2015) reduced CO2 emissions by 37% = tax of 5%-40% on new cars in line with CO2 emissions
Estimates not possible
Negative social impacts limited, as vehicle purchase taxes tend to affect wealthier income deciles
National reform would have a greater impact on emissions. Current luxury tax rules distort the market and increase GHG emissions: reform is urgent! Information on new vehicles and analysis of luxury tax / municipal ownership tax revenues required. Policies that encourage EVs must be accompanied by higher rates of renewable energy deployment.
Highest priority Medium term (2021-2023)
Carbon tax on transport fuels at national level (N)
RUEN foresees the preparation and implementation of a carbon tax policy on fossil fuels.
Jakarta: IDR 1,447 bn / USD 102 mn in 2020 (3% of local tax revenue) Indonesia: IDR 23,550 bn / US$ 1,663 mn
Decreased consumption: Gasoline: 3% Diesel: 4% CNG: 4% (compared to BAU by 2031). Longer term impacts up to 7% less than BAU.
IDR 283 billion / US$21 million in Jakarta
Expected to be negligible given the proposed tax rate increases Revenues raised can be invested to address and minor impacts identified
To replace differentiated fuel taxes at provincial level. National measure is preferable to reduce distortions. National carbon tax has potential to raise twice as much revenue as an increase to Motor Vehicle Fuel Tax at municipal level
High priority Medium term (2020-2023)
81 Predicted revenues are based on costings for 2018 unless otherwise stated. 82 Health cost savings are calculated on the basis of total health costs in 2016 (the most recent year for which data is available).

129
Measure National = N Provincial = P
Relationship to existing policies
Predicted revenue83
Impacts on emissions
Health cost savings84
Social impacts and measures to
address
Further comments Priority
Subsidies for CNG conversion kits and particulate filters in HDVs (P)
Feeds into existing policies to distribute free conversion kits. RUEN foresees mass development of CNG stations.
1% take up would cost IDR 268 bn / USD 19 mio
Estimate not possible given lack of data on freight vehicles
Estimate not possible
Negative impacts on family-run SMEs: Subsidy will compensate for congestion charging scheme
Freight is not the highest priority in Jakarta, as other sectors – esp. diesel passenger vehicles – produce more harmful air pollution according to GAINS data (see chapter 2)
High priority Medium term (2021-2023)
Subsidies for electric buses and charging infrastructure (P)
Pilots currently underway in Jakarta
Dependent on revenue available (medium priority)
A 30% increase in electric buses would reduce harmful pollution by 30%
Estimate not possible based on available data
None required Must be implemented in parallel to efforts to increase the amount of renewable energy in the energy mix, and to tighten emissions standards on coal-fired power stations
Medium priority Medium term (2020-2025)
Scrappage scheme for heavy duty freight vehicles (P)
RUEN foresees clean-up of freight sector. Scrappage already implemented at municipal level for public transport vehicles.
IDR 149 bn US$10.5 mio (1% uptake of IDR 21.2 mio / USD 1,500)
Emissions reductions per HDV scrapped: NOx 78% CO 88% PM 95%
Estimate not possible given lack of data
Family-run SMEs may not be able to access credit or afford new vehicles: risk of job losses
Would remove oldest and dirtiest vehicles from Jakarta. Costly programme, could be funded by revenues from fuel taxes proposed above or the congestion charge
Medium priority Medium term
83 Predicted revenues are based on costings for 2018 unless otherwise stated. 84 Health cost savings are calculated on the basis of total health costs in 2016 (the most recent year for which data is available).

130
6.2. Challenges to the reform package and how they can be overcome
6.2.1. Lack of robust data on air pollution in Jakarta Monitoring of air pollutants in Indonesia is relatively inconsistent and highly politicized. Specifically, regular monitoring to identify pollution spikes – the most harmful to human health – would enable policymakers to tailor transport policies to the air quality situations on any day. It is also difficult to ascertain which are the most severe pollution hotspots in the city. This situation is a hindrance to evidence-based policymaking. There is a danger that this current lack of data will undermine future attempts of the national or Jakarta governments to communicate the rationale behind better and more targeted fiscal policy measures in the transport sector. This challenge can be overcome if the responsible agencies make a commitment to more detailed, transparent and regular reporting of pollution concentrations. In political economy terms, the implementation of measures to improve air quality might encourage such a commitment, as it would afford the responsible agencies the opportunity to prove that their policies are effective. Transparent and regular reporting could incorporate warning mechanisms if concentrations exceed NAAQS or are consistently higher than WHO guideline values. A warning mechanism could feed into the ERP scheme, e.g. by using monitoring data to set road prices for commuters on days or times of year where pollution concentrations are particularly high. Prior to ERP implementation, such a warning mechanism could lead to the temporary re-introduction of the odd/even policy (which we propose should be replaced by a congestion charge, see section 5.3.2. and Table 25).
6.2.2. Data and knowledge bias towards GHG emissions rather than emissions harmful to human health In general, data and research available in the public domain on transport policies tends to refer to GHG emissions reductions, rather than emissions harmful to human health. As a result, understanding and estimating the human health impacts of fiscal policies in the transport sector can be challenging for policymakers. This study aims to go some way to addressing this problem by collating the positive health impacts of fiscal transport policy measures. In the past, this focus on climate policy has posed a challenge to policymakers. It is not sufficient to assume that reducing GHG emissions will reduce emissions of pollutants harmful to human health: while there is in many cases a correlation between the two, this is not necessarily the case. Fiscal incentives put in place in the 1990s and 2000s in the European Union to shift the private vehicle fleet towards diesel vehicles are a case in point. The 406 percent increase in the proportion of diesel vehicles in the UK fleet over the past 20 years has resulted in significant and unintended increases in air pollutant emissions harmful to human health. In response, many European cities have set up low-emissions zones to prevent older diesel vehicles entering city centres, as described in section 4.4.3. Policymakers in Indonesia can learn from this problem when developing policies for the transport sector, whether fiscal or regulatory. In terms of regulations, the RUEN has foreseen the establishment of fuel economy standards for motorized vehicles, especially private vehicles, before 2020, although this is unlikely to be implemented in time. The adoption of fuel economy standards for all vehicles of 5 litres/100 km by 2020 and 3.75 litres/100 km by 2025 does have considerable potential to reduce GHG emissions from road transport: if enforced, by 2030 these

131
fuel standards could avoid emissions of 0.28 gigatons CO2e, deliver economic benefits worth IDR 4,444 trillion/US$311 billion through fuel efficiency, production savings and public health improvements, and generate roughly IDR 677 trillion/US$47 billion annually in fuel savings (Safrudin 2018). Notwithstanding these potentials, the missed 2020 deadline offers policymakers an opportunity to fine tune this policy. Focussing exclusively on fuel efficiency favours diesel cars, which generally emit higher volumes of pollutants harmful to human health: amending RUEN standards to include not only fuel economy but also emissions of harmful pollutants is well worth considering.
6.2.3. Addressing the trade-off between air quality and fiscal policy goals Policymakers often have to make a conscious effort to address and find solutions to potential trade-offs between fiscal and environmental objectives of green fiscal policies. For example, a primary source of revenue for the Jakarta government is motorised transport. If fiscal policies foster a preference for fuel-efficient vehicles that are liable for lower rates of registration and ownership tax, and a cheaper congestion charge, this will result – in the medium term at the latest – in reduced revenues. One example of such a conflict is the current delay to the implementation of a regulation to scrap vehicles more than ten years old. This regulation has been announced but will only be implemented in 2025, possibly so that the government can continue to benefit from fiscal revenues from vehicle ownership in the interim. Discouraging private vehicle ownership has very real consequences for the public purse in Jakarta. Policymakers can address these problems in several ways. For transport fuels this issue can be addressed by implementing a tax escalator to stabilise revenues over time. This approach has been proposed for carbon taxation of transport fuels at national level, and for taxation of fuels at provincial level. In both cases, such a policy will incentivise a dynamic response to the price signal and falling fuel consumption should be made up for by the gradually increasing tax rate. Such a policy also creates predictability and stability for transport fuel taxpayers over the medium term and so encourages investment in cleaner vehicles and vehicle technologies. This strategy has been implemented in many European countries, including in the UK and Germany. In Vietnam, the Environmental Protection Tax incorporates tax rate ranges that enable relatively depoliticised increases to tax rates decided by a parliamentary committee (Cottrell et al. 2016). Similarly, differentiated vehicle registration taxes and congestion charges should be regularly reviewed to ensure that tax rates and tax bands reflect technological developments and correspond with the development of the vehicle fleet. Hybrids, CNG vehicles, LCGCs, LCVs and EVs also contribute to congestion, particulate emissions, wear and tear of roads, GHG emissions, and air pollution: hence, in the medium term, they should not be exempt from transport taxation. Furthermore, the costs of inaction in Jakarta are proving to be extremely high: health costs resulting from poor air quality in Jakarta amounted to IDR 51.2 trillion/US$3.9 billion in 2016 (KPBB 2019). If the provincial government costed the environmental and health impacts and factored them into its calculations, then preventative approaches to air pollution and health would gain attractiveness and traction.

132
6.2.4. Revenue allocation between national and provincial government As provincial government budgets are quite limited and options to raise revenue are fewer than at national level, policymakers at provincial level are faced with split incentives when it comes to fiscal policy in the transport sector. For example: if the 5 percent cap on transport fuel tax is reformed, the provincial government will be able to increase the tax rate on transport fuels, as proposed in this study. By raising taxes, policymakers risk their political reputation and popularity. This may be worth the political risk if policymakers are able to transparently redistribute the revenues raised to fund e.g. free public transport tickets or conversion kits for freight vehicles. However, there is a fundamental lack of transparency in the ultimate distribution of additional revenue. Due to fiscal equalisation regulations, it is unclear that provincial governments will receive additional revenue from central government, even if they increase taxation. Thus, policymakers at the provincial level remain disincentivized from implementing environmentally-forward fiscal policies, for fear of political backlash.85 A similar split incentives problem has plagued the implementation of the ERP scheme: the lack of clarity on the destination of revenues is a significant obstacle to implementation. This is one underlying reason for the municipal government seeming to be reluctant to prioritise ERP, as it is unclear where it will be able to recoup its investment once the scheme is up and running. Legal advice on how to address this challenge in relation to ERP has not been made available in the public domain, according to experts interviewed during our research. The root of this problem of split incentives reaches back to laws enacting regional autonomy (Law 22 of 1999, revised by Law 32 of 2004), which created regional autonomy for a range of government functions but failed to match this with corresponding levels of fiscal autonomy. Instead, revenue is redistributed in line with a set of fixed revenue-sharing arrangements, which some authors have suggested are in practice “totally irrelevant for almost all regional governments” (McLeod and McLeod 2010, p.31). Moreover, fiscal equalisation regulations remove incentives for provincial governments to increase taxes since allocation rules do not reflect tax revenues raised by particular sub-national jurisdictions. Thus, at present increased revenues from a differentiated tax at provincial level may benefit central government, but not the provincial government responsible for the additional
revenues raised (McLeod and McLeod 2010). From 2020, the intergovernmental system of fiscal transfers governed under Act No. 32/ 2009 and Government Regulation No. 46/ 2017 will be amended to reflect ecological considerations. While this may not solve the general problem of split incentives for fiscal policies, or the obscure nature of fiscal transfers, this step will create incentives for the DKI Jakarta government to implement green fiscal policies as a route to increasing fiscal transfers from central government. A further solution to this problem might be to render it unambiguous during the drafting of fiscal policies which level of government (national or provincial) and which ministry or agency is entitled to receive the revenues. From the perspective of the provincial government, this can be achieved by referring to specific fiscal revenue-raising measures as “retributions”, which would guarantee
85 In a political environment in which fuel prices and transport are highly politicised, the problem of split incentives is just one of several factors that deter policymakers from implementing green taxes or charges: increasing taxation is seldom a vote winner.
133
that revenues flow to the provincial government. Experts interviewed for this study reported that the Ministry of Finance is considering whether to introduce similar unambiguous terminology on national level, although this has not yet been forthcoming.
6.2.5. Earmarking of revenue Legal earmarking of revenue or hypothecation is not possible in Indonesia or DKI Jakarta. Revenues from taxes are required to flow into the general budget, to be spent as the government sees fit. The absence of earmarking can be said to have a few advantages in situations when: collection volumes and required expenditure for the implementation of particular measures may not match; retaining a degree of freedom to make decisions in line with policy priorities is preferable for governments; revenues of green taxes might be too high to justify their being entirely channelled into a specific environmental policy. On the other hand, where transparency is lacking, the inability to earmark can undermine confidence and trust in government. One possible solution to this problem might be to introduce political or soft earmarking. This would imply that although government cannot legislate that tax revenue be used a specific purpose, it could clearly communicate its intention to do so. Although this approach is essentially a communication tool without legal force, it can be useful for make the objective of a particular measure clear and to make revenue use more transparent. If this strategy is used, it is important that such political earmarking be accompanied by a serious political commitment to deliver on these promises: otherwise, it may not be sufficient to reassure government entities that they will be the recipients of funding, or to reassure the public that revenues will be used as stated by government.
6.2.6. Overlapping and outdated regulations result in poor enforcement The analysis in chapter 3 showed the many ways in which regulations in Indonesia overlap, become obsolete when new measures are implemented, or are not updated and thus lose their relevance in the face of technology improvements. The challenge policymakers face is how to decide which law or decree has precedence, and how to proceed in relation to policymaking. This has slowed reform in several areas of transport policy. To address this issue, whenever a policy proposal is implemented, lawmakers should consider re-examining all related legislation and amend as appropriate or establish clearly in law which measure has precedence. A related problem is that the enforcement of acts, decrees and regulations is sometimes poor. This can be attributable to uncertainty regarding which policy has greater force; poor inter-ministerial cooperation and coordination; corruption amongst officials and in the civil service (for details of corruption charges in the civil service from 2013-16 see Jakarta Post 2017b); and officials or agencies / ministries with a vested interest in the status quo. Tackling corruption is a challenging process beyond the bounds of this study. However, two aspects are particularly relevant on this context. First, dealing with the petty corruption in DKI Jakarta – which has resulted in poor enforcement of the odd-even policy and poses a risk to the effective implementation of the sticker system proposed to implement congestion charging – might be possible if officials are both compensated at a level high enough to discourage cheating the system and if severe penalties are introduced (e.g. immediate dismissal for those who are caught cheating). To create a culture of compliance, a marketing campaign could be launched to explain the rationale behind the congestion charge – for example, under the narrative that
134
reducing harmful emissions is a shared responsibility to stop irreversible health damage among the most vulnerable.86 Second, it is important to note that the proposed carbon taxes and differentiated sulphur taxes on transport fuels would be difficult to evade, as they are levied upstream on relatively few taxpayers. The same is true of fiscal measures related to car purchase and registration, as these can be collected using existing mechanisms for the collection of luxury tax, or progressive taxes on vehicles at the local level.
6.2.7. Politicization of fuel prices Fuel and energy prices are highly politicised in Indonesia. Many of the fiscal measures proposed will result in higher prices for transport fuels and for individual mobility. Thus, political acceptability is likely to prove the single most critical issue and potential obstacle to implementation. If fiscal measures are implemented, a concerted effort will need to be made to communicate clearly the reasoning behind the measures: better outcomes for human health; better air quality in Jakarta; reduced congestion; shorter journey times; availability of additional revenues for continuous improvement to the system. Communication efforts conducted by provincial or national government may be able to draw on a growing awareness of the negative impacts of air pollution on human health, created i.e. as a result of the citizen’s civil lawsuit. Fossil fuel subsidy reform in 2015 led to substantial increases in funding for infrastructure, education and health and provides several lessons for the Government on how best implement such reforms. Subsidy reform laid the foundations for subsequent increases in energy prices and raised awareness amongst the general public on the reasoning behind such measures. The widespread understanding that spending on fossil fuels had become fiscally unsustainable by 2015 fostered political acceptance of reform at the time: today, these higher levels of understanding and awareness might create a window for government to implement a further round of pricing reforms in the transport sector. For this potential to be realised, however, the government will have to modify its approach on subsidies for transport fuels, take steps to develop and solidify a long-term strategy for permanent subsidy phase-out, and make a concerted effort to prevent policy reversals. Numerous experiences around the world from France to Ecuador have shown that increasing fuel prices without careful planning can be politically risky and result in policy reversals. In the past, cheap energy prices have been used as a means of redistributing natural resource wealth and as a rudimentary social welfare system. This has changed in recent years, with fossil fuel subsidy reform freeing up revenues for higher investment in education, improvements in healthcare (vaccination programmes, free access for the poor) and infrastructure. Nonetheless, fuel price increases remain politicised and the Presidential price freeze implemented in 2018, set to remain in place until at least the end of 2019, has proved to be a useful strategy for garnering additional support from the electorate, albeit an expensive one. It is not clear at this stage whether there will be further reforms of the subsidies in 2020, but no political commitments had been made to this effect at the time of writing.
86 The Transport for London campaign in London for the Low-Emissions Zone is a good example, see: https://tfl.gov.uk/corporate/about-tfl/air-quality (accessed on 8 December 2019).

135
Tackling the root cause of this politicisation is one way to address this challenge. Fossil fuel subsidy reform and fuel price rises should be planned carefully and accompanied by structural changes to ensure that higher spending on welfare continues, e.g. on healthcare and education, but is more accurately targeted to the vulnerable. Prices should be adjusted gradually or timed to coincide with falling global oil prices to alleviate the impact of reform. As in 2015, consensus building within ministries and amongst the general public will be vital to lock in reform in the long-term. Industrial stakeholders can be supported through the transition by way of support measures to mitigate the negative impacts of fuel price rises, i.e. grants and subsidies to purchase energy-efficient equipment, or low-emissions technologies for the freight sector, or subsidies to fund the installation of desulphurization technologies in refineries. In the transport sector, revenues can be used to invest in public transport and infrastructure to facilitate modal shift to public transport and freight rail and shipping. At the same time, better communication of policy logic and objectives – including data on the unfair and inequitable impact of the status quo, and the cost of inaction derived from the failure to address the public health crisis – can frame the reform process as part of a broader and more wide-ranging policy debate. In general, rising awareness of the public health crisis in Jakarta – including the citizen’s lawsuit – may create a political climate more receptive to fiscal policy reforms. Improved data on human health costs and impacts resulting from poor air quality which is widely publicized can also help inform the public discourse.
6.3. Policy synergies from a national and international perspective The objectives of the fiscal measures proposed in this study – to reduce emissions harmful to health from the transport sector – are closely related to several SDG targets and indicators. For example, SDG3 on Good Health and Well-Being, which has targets and indicators relating to deaths and illnesses from air pollution and health risks, or SDG 11 Sustainable Cities and Communities, which has targets and indicators relating to accessible public transport, air quality and particulate levels (for details see chapter 1). The connection to multiple SDG goals and targets may allow policymakers to identify possible sources of external finance to invest in measures to reduce harmful emissions. It may also be helpful for policymakers to explore synergies between existing transport policies and proposals in this study with policies and approaches in other sectors, e.g. industry policies, and urban planning, and consider how efforts to improve air quality and minimise negative impacts on human health can be mainstreamed in a range of portfolios. Urban planning for example can contribute massively to reduced exposure of populations to harmful emissions from the transport sector by creating safe routes for zero-carbon transport modes, such as cycling and walking.87 As highlighted in this study, GHG emissions in the transport sector and emissions harmful to human health are closely linked. The relationship is not always linear, e.g. in the case of (older) diesel vehicles or poor-quality transport fuels with high-sulphur content. However, the
87 A discussion of urban planning policy is beyond the bounds of this study but very important in the Indonesian context, given the declared intention to relocate the capital city away from Jakarta. Sustainable urban planning of the new capital emphasising public transport and sustainable transport modes, while minimising necessary travel distances has the potential to prevent poor air quality.

136
correlation between human health and CO2 emissions on a global scale is clearly demonstrated in chapter 2 in Figure 3, Figure 7 and Figure 8 for the case of Indonesia. For this reason, if the policies proposed here were to fulfil their objectives, the majority would bring about reductions in both CO2 emissions and pollutants harmful to human health. Thus, the proposals can support policymakers in their efforts to ensure that Indonesia achieves its climate mitigation targets laid down in its Nationally Determined Contribution (NDC) – of a 29 percent reduction of GHG emissions on BAU – as well as the achievement of the SDGs and the commitments of the Low-Carbon Development Initiative. Linking the human health, climate policy and sustainable development agendas might prove to be a helpful way of communicating about fiscal policies in the transport sector. Emphasising the co-benefits of policies can enhance their appeal to a wider audience and in the Jakarta case, can feed into growing awareness of the negative human health impacts of poor air quality. In general, transport strategies can target several objectives simultaneously and so, offer users lower travel costs, improved mobility, better health, greater energy security, improved safety, and time savings (Sims et al. 2014).
This study has focused on the severe health impacts of air pollution from the transport sector in Jakarta and has proposed a series of measures to address it. The findings of this study and the fiscal policies proposed are not only relevant for the case of DKI Jakarta, but also for other Asian cities facing similar challenges, such as Hanoi or Bangkok, and beyond to other developing and emerging economies facing the challenge of rapid urbanisation.
6.4. Further work and follow-up activities During the writing of this study, it became clear that better and more comparable data is required as a matter of urgency to inform policy formulation, including constant monitoring of air quality at a range of pollution hotspots in Jakarta. Currently, as noted in chapter 2, data on emissions harmful to human health is piecemeal at best, and data collection is poorly coordinated and unreliable. An in-depth analysis of the vehicle fleet in Jakarta, would be necessary to refine the proposal for the congestion charge and will be essential for the effective implementation of ERP in the future, was not possible based on the available data. It should be noted that those proposals that have been superficially costed in this study still merit further analysis with improved and more up-to-date data. Going forward, an impact assessment of any potential policies would be necessary to evaluate in-depth potential impacts and revenues, which should include an assessment of low- and high-end tax scenarios, to understand what level of tax is most likely to be effective. In terms of next steps, capacity building on the transport emissions / health nexus and transport policy design – fiscal and non-fiscal measures – might be helpful. This could include best practice in the development of transparent mechanisms for revenue allocation. Given the urgent need to make progress in Jakarta and reduce the frequency and severity of pollution spikes in the city, capacity building could focus first on 2-3 priority measures, e.g. differentiated sulphur duties; vehicle registration taxes; and the introduction of a congestion charge in Jakarta.

137
To create and maintain momentum for fiscal policy implementation, stakeholder engagement processes could be advanced by the creation of two inter-ministerial working groups, drawing in policymakers at both the national and provincial level. The high-level working group could bring together decision-makers to foster the exchange of policy perspectives and the exploration of possible approaches to air pollution from the transport sector (and beyond) in the city of Jakarta. The operational level working group could support the high-level group by conducting background research and upon request, developing concrete proposals and impact assessments. In several countries, green fiscal commissions have proven helpful to raise awareness of possible fiscal measures, explore their feasibility and engage with a range of stakeholders to build consensus on possible next steps. To deal with the range of complex issues currently facing the Indonesian government in meeting the targets of their NDC and domestic targets reflected in the RUEN and other documents, such a commission could illuminate possible ways forward. In Indonesia, or indeed at the provincial level in DKI Jakarta, a green fiscal and public health commission working across ministries and stakeholders could create the momentum necessary to implement some or indeed the majority of the measures recommended in this study and thus realize concrete health benefits for the citizens of Jakarta.

138
Annexes
Annex I. Methodology for calculation of policy impacts In chapter 5 of this study the potential impacts that some of the proposed policy instruments could have on fuel prices, transport fuel consumption and related potential fuel cost savings, government revenues and health cost savings were described. Some policy instruments had to be excluded from this impact assessment e.g. vehicle ownership tax or the proposed congestion charging system, because we were not able to access data in the required complexity and granularity. For example, there was no information available on the vehicle types currently in use (neither for Jakarta nor for Indonesia) including their engine sizes, fuel efficiency, fuel type, compliance with certain emission standards or vehicle kilometres travelled. In the following we describe the datasets, assumptions and methodologies underlying our impact assessments for the proposed Sulphur Content Excise Duty, the Carbon Tax and the Motorized Vehicle Fuel Duty schemes which were eventually included in the impact assessment. Future transport sector fuel prices under the BAU scenario Local fuel prices depend mainly on the crude oil price, but also on fuel price regulations such as subsidies, the ministerial-decree-regulated profit margins of the gas stations and the state-owned Oil and Natural Gas Mining Company Pertamina, local taxes, value added tax and the Motorized Vehicle Fuel Duty (PBB-KB) (CNN Indonesia, 2016). Predicting the future development of these price components was beyond both the scope and capacity of this study. The challenge posed when undertaking such predictions becomes clear when considering the significant variations in the crude oil price and fuel price regulations experienced in the past (Figure 38) which were changing four times within ten years from subsidisation to taxation and the other way around. Figure 38: Crude oil price, gasoline retail price and energy subsidy in Indonesia 2008-2018
Data sources: Average crude oil price/ gasoline retail price: Table 4.1 on Crude Oil Price and Table 4.4 on Energy Retail Price per Energy Unit in "2018 Handbook of Energy & Economic Statistics of Indonesia”; https://www.esdm.go.id/assets/media/content/content-handbook-of-energy-and-economic-statistics-of-indonesia-2018-final-edition.pdf Fuel & gas subsidy: Data for 2008-2010 from Table 1 on Government expenditures and subsidies (2005–2011) in International Institute for Sustainable Development (IISD), 2011: "A Citizens' Guide to Energy Subsidies in Indonesia"; https://www.iisd.org/pdf/2011/indonesia_czguide_eng.pdf; data for 2011 from slide on Energy Subsidies Budget Allocation in 2016 Ministry of Finance presentation on "Fiscal Reform on Energy Subsidy Policy in Indonesia"; http://www.greenfiscalpolicy.org/wp-content/uploads/2016/09/Noor-Iskandarsyah_Indonesia.pdf; data for 2012-2018 from table on Indonesia's Energy Subsidy Spending & Indonesian Crude Price published by Indonesia Investments online

139
media on 19.Nov 2018; https://www.indonesia-investments.com/news/news-columns/indonesia-s-energy-subsidy-spending-far-above-target-in-2018/item9036
For this reason, in this study we set out with the explicit aim of providing rough estimates on the potential magnitudes of future energy consumption, energy cost savings and government revenues under the proposed policy scenarios. Thus, we simply assumed that current fuel prices would stay constant under the business as usual (BAU) scenario. Assumptions are based on 2018 prices (see Table 25). The table below results from a time-consuming compilation of different data sources to reflect 2018 retail prices of all types of transport fuels. While the annual Energy Handbook published by the Ministry of Energy and Mineral Resources provides complete time series on energy consumption for all fuel types, it only compiles retail price time series for gasoline RON88 and diesel CN48. Hence – considering the timeframe of this study – contextual information given in the chapters is limited to those two fuel types e.g. graph on realized government revenues from the existing Motorized Vehicle Fuel Duty scheme in relation to gasoline and diesel retail prices between 2013-2019. Table 25: Detailed Transport Sector Fuel Retail Prices per Fuel Type in 2018
Fuel type Data source
Price (IDR/litre) Price (USD/litre)
CNG 4) 3,100 0.22
Gasoline
RON 88 1) 6,469 0.46
RON 95 3) 11,700 0.83
RON 98 2) 12,000 0.85
RON 92 2) 10,200 0.73
RON 90 – 91 2) 7,650 0.54
Diesel
CN 51 2) 10,300 0.73
CN 53 2) 11,750 0.84
CN 48 1) 4,627 0.33
Bio Diesel 5) 7,300 0.52
Data sources: 1) Table 4.4 on Energy Retail Price per Energy Unit in "2018 Handbook of Energy & Economic
Statistics of Indonesia”; https://www.esdm.go.id/assets/media/content/content-handbook-of-energy-and-economic-statistics-of-indonesia-2018-final-edition.pdf; conversion from energy into volume units based on Table 26 below.
2) Pertamina online price list as of 05th Jan. 2019; https://www.pertamina.com/id/news-room/announcement/daftar-harga-bbk-tmt-5-januari-2019
3) Online article as of 03rd July 2019; https://www.moneysmart.id/daftar-harga-bbm-terbaru/ 4) Okefinance online article “Kualitas Setara Pertamax, Harga BBG Hanya Rp3.100/Liter” as of 25th
April 2017; https://economy.okezone.com/read/2017/04/25/320/1675874/kualitas-setara-pertamax-harga-bbg-hanya-rp3-100-liter
5) Rounded average of monthly prices in 2018 published by the Ministry of Energy and Mineral Resources (ESDM): http://ebtke.esdm.go.id/category/22/hip.bbn
Note: IDR to USD conversion is based on 2018 exchange rates published in Table 1.5 on International Trade in "2018 Handbook of Energy & Economic Statistics of Indonesia"; https://www.esdm.go.id/assets/media/content/content-handbook-of-energy-and-economic-statistics-of-indonesia-2018-final-edition.pdf
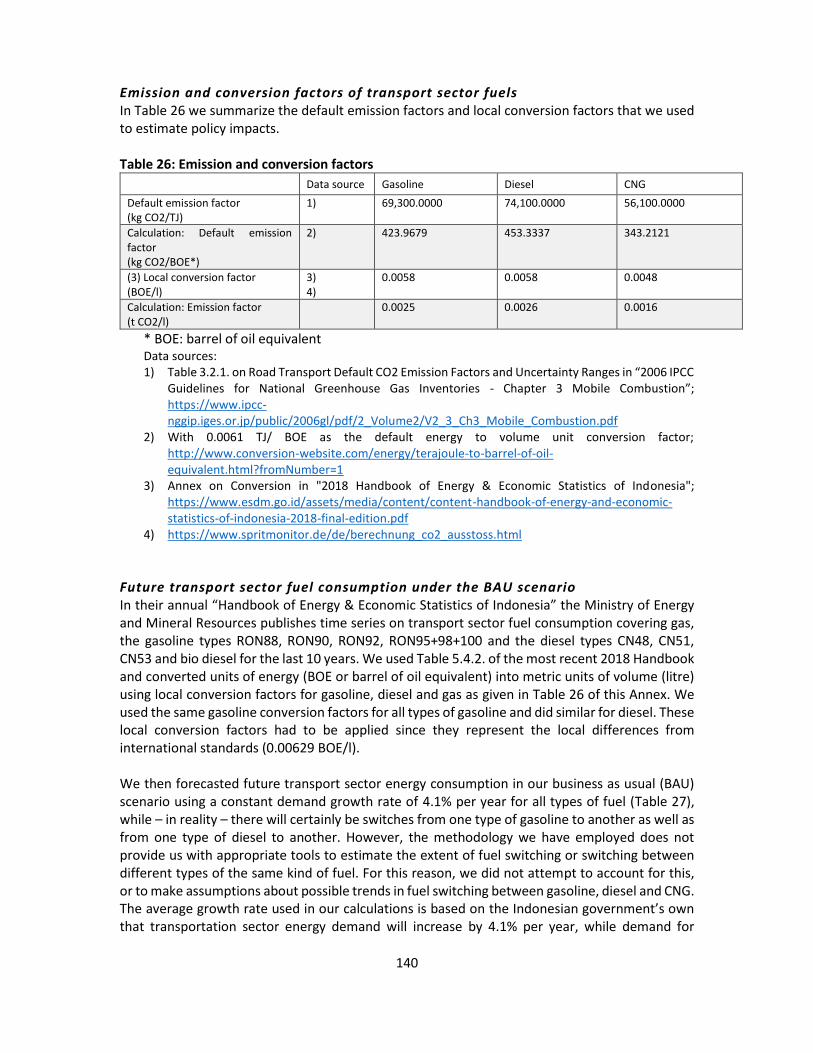
140
Emission and conversion factors of transport sector fuels In Table 26 we summarize the default emission factors and local conversion factors that we used to estimate policy impacts. Table 26: Emission and conversion factors
Data source Gasoline Diesel CNG
Default emission factor (kg CO2/TJ)
1) 69,300.0000 74,100.0000 56,100.0000
Calculation: Default emission factor (kg CO2/BOE*)
2) 423.9679 453.3337 343.2121
(3) Local conversion factor (BOE/l)
3) 4)
0.0058 0.0058 0.0048
Calculation: Emission factor (t CO2/l)
0.0025 0.0026 0.0016
* BOE: barrel of oil equivalent Data sources: 1) Table 3.2.1. on Road Transport Default CO2 Emission Factors and Uncertainty Ranges in “2006 IPCC
Guidelines for National Greenhouse Gas Inventories - Chapter 3 Mobile Combustion”; https://www.ipcc-nggip.iges.or.jp/public/2006gl/pdf/2_Volume2/V2_3_Ch3_Mobile_Combustion.pdf
2) With 0.0061 TJ/ BOE as the default energy to volume unit conversion factor; http://www.conversion-website.com/energy/terajoule-to-barrel-of-oil-equivalent.html?fromNumber=1
3) Annex on Conversion in "2018 Handbook of Energy & Economic Statistics of Indonesia"; https://www.esdm.go.id/assets/media/content/content-handbook-of-energy-and-economic-statistics-of-indonesia-2018-final-edition.pdf
4) https://www.spritmonitor.de/de/berechnung_co2_ausstoss.html
Future transport sector fuel consumption under the BAU scenario In their annual “Handbook of Energy & Economic Statistics of Indonesia” the Ministry of Energy and Mineral Resources publishes time series on transport sector fuel consumption covering gas, the gasoline types RON88, RON90, RON92, RON95+98+100 and the diesel types CN48, CN51, CN53 and bio diesel for the last 10 years. We used Table 5.4.2. of the most recent 2018 Handbook and converted units of energy (BOE or barrel of oil equivalent) into metric units of volume (litre) using local conversion factors for gasoline, diesel and gas as given in Table 26 of this Annex. We used the same gasoline conversion factors for all types of gasoline and did similar for diesel. These local conversion factors had to be applied since they represent the local differences from international standards (0.00629 BOE/l). We then forecasted future transport sector energy consumption in our business as usual (BAU) scenario using a constant demand growth rate of 4.1% per year for all types of fuel (Table 27), while – in reality – there will certainly be switches from one type of gasoline to another as well as from one type of diesel to another. However, the methodology we have employed does not provide us with appropriate tools to estimate the extent of fuel switching or switching between different types of the same kind of fuel. For this reason, we did not attempt to account for this, or to make assumptions about possible trends in fuel switching between gasoline, diesel and CNG. The average growth rate used in our calculations is based on the Indonesian government’s own that transportation sector energy demand will increase by 4.1% per year, while demand for

141
natural gas (4.1.% per year) and oil (4% per year) in general will also grow at high speed (Government of Indonesia 2017b). Table 27: Development of transport sector fuel consumption (thousands of litres) in Indonesia 2019-2031 (BAU scenario)
(thousands of litres)
CNG Gasoline RON88
Gasoline RON92
Gasoline RON95+98+100
Gasoline RON90
Gasoil CN51
Gasoil CN53
Gasoil CN48
Bio Gasoil Total transport fuel consumption
2019 50,978 10,844,978 5,874,438 401,752 18,432,711 772,064 231,691 6,886,231 20,333,932 63,828,774
2020 53,068 11,289,622 6,115,290 418,224 19,188,453 803,718 241,190 7,168,566 21,167,623 66,445,754
2021 55,244 11,752,497 6,366,016 435,371 19,975,179 836,671 251,079 7,462,477 22,035,496 69,170,030
2022 57,509 12,234,349 6,627,023 453,221 20,794,162 870,974 261,373 7,768,439 22,938,951 72,006,001
2023 59,867 12,735,957 6,898,731 471,803 21,646,722 906,684 272,089 8,086,945 23,879,448 74,958,247
2024 62,322 13,258,132 7,181,579 491,147 22,534,238 943,858 283,245 8,418,510 24,858,506 78,031,536
2025 64,877 13,801,715 7,476,024 511,284 23,458,142 982,557 294,858 8,763,668 25,877,704 81,230,829
2026 67,537 14,367,585 7,782,541 532,247 24,419,925 1,022,841 306,947 9,122,979 26,938,690 84,561,292
2027 70,306 14,956,656 8,101,625 554,069 25,421,142 1,064,778 319,532 9,497,021 28,043,176 88,028,305
2028 73,188 15,569,879 8,433,791 576,786 26,463,409 1,108,434 332,633 9,886,399 29,192,947 91,637,466
2029 76,189 16,208,244 8,779,577 600,434 27,548,409 1,153,880 346,271 10,291,741 30,389,857 95,394,602
2030 79,313 16,872,782 9,139,540 625,052 28,677,894 1,201,189 360,468 10,713,703 31,635,842 99,305,781
2031 82,565 17,564,566 9,514,261 650,679 29,853,687 1,250,437 375,247 11,152,964 32,932,911 103,377,318
Assumptions on the impact of fuel price increases on fuel consumption Being beyond the timeframe and data availability for this study, we also did not apply DKI Jakarta or Indonesia specific measures to shed light on the relationships between a change in:
• fuel price/ taxation (other than fuel)/ income/ population; and
• traffic volumes/ fuel consumption/ vehicle fuel economy/ total vehicle ownership. Instead we relied on a summary of elasticity studies from different countries and studies (Goodwin, Dargay and Hanly 2003)88. According to this summary each 1% of (inflation adjusted) fuel price increase will cause:
• Traffic volumes to fall about 0.1% within a year and 0.3% over the longer run (five years) which translates into price elasticities of demand of 10% respectively 30% which is comparable to international experiences.
• Fuel consumption to fall about 0.25% within a year and 0.6% over the longer run.
• Vehicle fuel economy to increase about 0.15% within a year and 0.4% over the longer run.
• Total vehicle ownership to fall less than 0.1% in the short run and 0.25% in the longer run. We defined the fuel price increase as the difference between the real fuel price of the policy scenario and the real fuel price of the BAU scenario of a certain year. Applying the four price elasticities of demand listed above, we assumed that for each 1% of real price increase in a certain
88 Understanding Transport Demands and Elasticities. Victoria Transport Policy Institute. Available at: https://www.vtpi.org/elasticities.pdf

142
year the fuel consumption of the policy scenario would be 0.25% lower than the fuel consumption predicted under the BAU scenario in that year (see Equation 1 and Equation 2). Equation 1: Fuel consumption change rate under a certain policy scenario in a certain year
𝐹𝑢𝑒𝑙𝐶𝑜𝑛𝑠𝑢𝑚𝑝𝑡𝑖𝑜𝑛𝐶ℎ𝑎𝑛𝑔𝑒𝑅𝑎𝑡𝑒𝑃𝑜𝑙𝑖𝑐𝑦𝑆𝑐𝑒𝑛𝑎𝑟𝑖𝑜,𝑡
= 0.25 ∗𝐹𝑢𝑒𝑙𝑃𝑟𝑖𝑐𝑒𝑃𝑜𝑙𝑖𝑐𝑦𝑆𝑐𝑒𝑛𝑎𝑟𝑖𝑜,𝑡 − 𝐹𝑢𝑒𝑙𝑃𝑟𝑖𝑐𝑒𝐵𝑎𝑢,𝑡
𝐹𝑢𝑒𝑙𝑃𝑟𝑖𝑐𝑒𝐵𝑎𝑢,𝑡
Equation 2: Estimating the fuel consumption under a certain policy scenario in a certain year
𝐹𝑢𝑒𝑙𝐶𝑜𝑛𝑠𝑢𝑚𝑝𝑡𝑖𝑜𝑛𝑃𝑜𝑙𝑖𝑐𝑦𝑆𝑐𝑒𝑛𝑎𝑟𝑖𝑜,𝑡
= 𝐹𝑢𝑒𝑙𝐶𝑜𝑛𝑠𝑢𝑚𝑝𝑡𝑖𝑜𝑛𝐶ℎ𝑎𝑛𝑔𝑒𝑅𝑎𝑡𝑒𝑃𝑜𝑙𝑖𝑐𝑦𝑆𝑐𝑒𝑛𝑎𝑟𝑖𝑜,𝑡 ∗ 𝐹𝑢𝑒𝑙𝐶𝑜𝑛𝑠𝑢𝑚𝑝𝑡𝑖𝑜𝑛𝐵𝑎𝑢,𝑡
See Table 25 for nominal transport sector fuel prices under the BAU scenario and Table 27 for transport sector fuel consumption under the BAU scenario. The methodology for calculating the fuel price time series differs under each policy scenario and depends on the taxation or pricing schemes proposed under the scenario (see chapters 5 and 6 for details of the proposals). To obtain cost savings from reduced consumption we multiplied the amount of transport sector fuels saved under each policy scenario with fuel prices under the BAU scenario (see Equation 3). Please note that cost savings are thus restricted to those directly related to the fuel costs, but they do e.g. not include costs savings from reduced depreciation/ use of the vehicles which tend to have a longer operation time overall. Equation 3: Estimating fuel cost savings under a certain policy scenario as compared to BAU in a certain year
𝐹𝑢𝑒𝑙𝐶𝑜𝑠𝑡𝑆𝑎𝑣𝑖𝑛𝑔𝑠𝑃𝑜𝑙𝑖𝑐𝑦𝑆𝑐𝑒𝑛𝑎𝑟𝑖𝑜,𝑡
= (𝐹𝑢𝑒𝑙𝐶𝑜𝑛𝑠𝑢𝑚𝑝𝑡𝑖𝑜𝑛𝐵𝑎𝑢,𝑡 − 𝐹𝑢𝑒𝑙𝐶𝑜𝑛𝑠𝑢𝑚𝑝𝑡𝑖𝑜𝑛𝑃𝑜𝑙𝑖𝑐𝑦𝑆𝑐𝑒𝑛𝑎𝑟𝑖𝑜,𝑡)
∗ 𝐹𝑢𝑒𝑙𝑃𝑟𝑖𝑐𝑒𝐵𝑎𝑢,𝑡 We used the inflation rates and consumer price indices (CPI) given in Table whenever adjusting for inflation. Table 29: Historic and estimated inflation rates and consumer price indices (CPI) 2015-2031
Year Data source Inflation rate Consumer Price Index (CPI)
2015
Historic data (2012 = 100) based on 1)
3.35% 122.99
2016 3.02% 126.71
2017 3.61% 131.28
2018 3.13% 135.39
2019
BAU estimate (2019 = 100) based on 2)
3.50% 100.00
2020 3.00% 103.00
2021 3.00% 106.09
2022 3.00% 109.27
2023 3.00% 112,55
2024 3.00% 115,93
2025 3.00% 119,41

143
2026 3.00% 122,99
2027 3.00% 126,68
2028 3.00% 130,48
2029 3.00% 134,39
2030 3.00% 138,42
2031 3.00% 142,58
Data sources: 1) National Statistics Agency (Badan Pusat Statistik or BPS): “Inflasi Umum , Inti, Harga Yang Diatur
Pemerintah, dan Barang Bergejolak Inflasi Indonesia”; https://www.bps.go.id/statictable/2012/02/02/908/inflasi-umum-inti-harga-yang-diatur-pemerintah-dan-barang-bergejolak-inflasi-indonesia-2009-2019.html
2) Bank of Indonesia cited in https://www.republika.co.id/berita/ekonomi/keuangan/19/06/15/pt44hu370-bi-prediksi-inflasi-2020-terkendali-di-tiga-persen
Assumptions on the impact of fuel price increases on government revenues When estimating the potential magnitude of government revenues raised from the Sulphur Content Excise Duty, the Carbon Tax or the Motorized Vehicle Fuel Duty schemes, we first calculated the difference between the fuel price of the related policy scenario and the fuel price of the BAU scenario in a certain year. We then multiplied this fuel price difference with the energy consumption predicted under each policy scenario for that year - also considering the energy consumption decrease potentially caused by the related scenario as compared to BAU (see Equation 4). Equation 4: Estimating the government revenue raised under a certain policy scenario in a certain year
𝐸𝑥𝑝𝑒𝑐𝑡𝑒𝑑𝐺𝑜𝑣𝑅𝑒𝑣𝑒𝑛𝑢𝑒𝑃𝑜𝑙𝑖𝑐𝑦𝑆𝑐𝑒𝑛𝑎𝑟𝑖𝑜,𝑡
= (𝐹𝑢𝑒𝑙𝑃𝑟𝑖𝑐𝑒𝑃𝑜𝑙𝑖𝑐𝑦𝑆𝑐𝑒𝑛𝑎𝑟𝑖𝑜,𝑡 − 𝐹𝑢𝑒𝑙𝑃𝑟𝑖𝑐𝑒𝐵𝑎𝑢,𝑡)
∗ 𝐹𝑢𝑒𝑙𝐶𝑜𝑛𝑠𝑢𝑚𝑝𝑡𝑖𝑜𝑛𝑃𝑜𝑙𝑖𝑐𝑦𝑆𝑐𝑒𝑛𝑎𝑟𝑖𝑜,𝑡

144
Assumptions on the impact of fuel price increases on health cost savings As we were lacking the necessary data, we were hesitant to draw a direct link between the estimated transport sector fuel consumption reduction, potential air pollution decrease, and health cost savings. For example, we do not have an up to date estimate for the cost of illnesses and diseases caused by transport sector air pollution. The latest related health cost data available refers to DKI Jakarta in 2016 (KPBB, 2018), while the transport sector’s contribution to this figure is not quantified and estimations had to be based on 2010 numbers. Many factors have changed since 2010, including health treatment costs, congestion, type of vehicles in use including their engine sizes, fuel efficiency, fuel type and vehicle kilometres driven, and the influence of other sectors on local air pollution etc. However, we decided to at least calculate a lower bound for potential health cost savings by drawing a hypothetical case based on 2016 data. For each policy scenario we applied the transport sector fuel consumption change rate predicted for the first year of implementation to the health costs that arose from transport sector air pollution in DKI Jakarta in 2016. Thus, we had to mix data of different years and based our calculations and estimates of the lower bound of possible health cost savings on the assumption that there was a perfect correlation between transport sector fuel consumption, air pollution attributable to the transport sector and related health cost. When applying this approach, we assumed that the transport sector’s contribution to local air pollution continuously accounted for 36% of the total, relying on statistics describing the situation in 2010. In 2010, the transport sector contributed 36% to PM10 emission in Jakarta (Breathe Easy Jakarta (BEJ) (2017). Although the transport sector’s share in final energy consumption rose steadily, we did not find data that showed that its contribution to local air pollution grew likewise. Hence, we took a conservative lower-bound-approach and kept with the 2010 ratio. However, what this implies is that potential health cost savings from the measures we propose may be considerably higher than the conservative estimates we put forward in the report. Equation 5: Estimating the potential change in health cost under a certain policy scenario in 2016
𝐻𝑒𝑎𝑙𝑡ℎ𝐶𝑜𝑠𝑡𝐶ℎ𝑎𝑛𝑔𝑒𝑃𝑜𝑙𝑖𝑐𝑦𝑆𝑐𝑒𝑛𝑎𝑟𝑖𝑜,2016
= (36% ∗ 𝐻𝑒𝑎𝑙𝑡ℎ𝐶𝑜𝑠𝑡2016)∗ 𝐹𝑢𝑒𝑙𝐶𝑜𝑛𝑠𝑢𝑚𝑝𝑡𝑖𝑜𝑛𝐶ℎ𝑎𝑛𝑔𝑒𝑅𝑎𝑡𝑒𝑃𝑜𝑙𝑖𝑐𝑦𝑆𝑐𝑒𝑛𝑎𝑟𝑖𝑜,2020

145
Annex II. Tables
Table 28: Comparison of WHO and National Air Quality Standards
Parameter WHO Air Quality Guidelines 89
(unit: g/m3)
Indonesia Ambient Air Quality Standard90
(unit: g/m3, excl. dust-fall)
SO2 500 (10 min); 20 (24h) 900 (h); 365 (24h); 60 (y)
CO 30.000 (h); 10.000 (day)
NO2 200 (h); 40 (y) 400 (h); 150 (24h); 100 (y)
O3 100 (8h) 235 (h); 50 (y)
HC 160 (3h)
PM10 50 (24h); 20 (y) 150 (24h)
PM2,5 25 (24h); 10 (y) 65 (24h); 15 (y)
TSP 230 (24h); 90 (y)
Pb 2 (24h); 1 (y)
Dust-fall 10 ton/km2/month (m) for settlement 20 ton/km2/month (m) for industry
89 WHO Air Quality Guidelines – Global Update 2005; https://www.who.int/airpollution/publications/aqg2005/en/ (Accessed September 2019).
90 Government Regulation No. 41 Year 1999; http://peraturan.go.id/common/dokumen/ln/1999/pp41-1999.pdf (Accessed September 2019); h = standard for an hour, 3h = 3 hours, 24h = 24 hours, m = a month, y = a year. As the DKI Jakarta Government Regulation No. 2 Year 2005, DKI Jakarta follows the national ambient air quality standard; http://hukum.unsrat.ac.id/perda/perda_dki_2_2005.pdf (Accessed September 2019)

146
Table 29: Types of legislation in Indonesia referred to in this study
Legislation Type English Translation Remarks*
Undang-Undang (UU) Act, Law Established by the People's Representative Council (the DPR) with the joint agreement of the President.
Peraturan Pemerintah (PP)
Government Regulation Set by the President to carry out the Act as it should.
Peraturan Daerah (Perda) Provinsi
Provincial Government Regulation
Established by the Provincial People's Representative Council (the DPRD Provinsi) with the joint agreement of the governor.
Peraturan Menteri (Permen)
Ministerial Regulation After 2011, Permen will be legally binding if it is ordered by higher regulation and formed based on authority.
Keputusan Presiden (Kepres)
Precedential Decree
Keputusan Menteri (Kepmen)
Ministerial Decree
Keputusan Gubernur (Kepgub)
Governor Decree
Peraturan Gubernur (Pergub)
Governor Regulation
Summarized from Act No 21/ 2011, http://peraturan.go.id/common/dokumen/ln/2011/uu12-
2011bt.pdf (Accessed October 2019)

147
Table 30: KSD for Environment and Transport Activity Lead agency/Supporting
Agency Indicator Means of
verification Target
Identification of air quality monitoring stations (parameter and measurement procedure including PM 2.5)
Environment Agency (DLH) Support: Bureau for Governance
Locations for monitoring stations are available, including pollutants parameter and measurement procedure
Air quality monitoring reports from each sampling station
Procurement of new monitoring instruments
Environment Agency Support: Procurement Bureau
New PM 2,5 measuring instruments are available
Integration of air quality monitoring information in JAKI (Jakarta Kini) Application
Information and communication agency Support: Environment Agency
Integration of monitoring results with JAKI App
Real time information is available on JAKI App
Revision of Governor Decree No. 92/2007 regarding emission check and inspection & maintenance
Environment Agency Support:
• Revenue agency
• Transport agency
• Agency for Industry and Energy
• Information and communication
• Legal Agency
• Cooperation Agency
Revised Governor Decree on emission check and inspection & maintenance
Study on PM 2.5 standard/threshold for Jakarta
Environment Agency
• Support: Cooperation Agency
• Legal Agency
PM 2.5 standard/threshold for Jakarta is available
Draft Governor Decree regarding PM 2.5 is available
Public display of air quality monitoring results
Information and communication agency Support:
• Mayors
• Environment agency
• Transport agency
• Agency for industry and energy
• Agency for forestry
• Agency for education
Public information on air pollution is available

148
• Agency for health
Traffic management
Transport Agency Support:
• Police department
• Information and communication agency
• Bureau for Economic
• Increase of average speed in Jakarta
• Expansion of odd-even policy in Jakarta
• To close 5 main U turn in Jakarta
Revision on Governor Decree No.31/2017 on Parking, Fine, and vehicle towing
Transport Agency Support:
• Revenue agency
• Environment agency
• Agency for Industry and Energy
Revised Governor Decree on Parking
Air pollution reduction from point sources/stationary sources
Environment Agency Support:
• Agency for industry and energy
Increase monitoring activity for approx. 1.150 stationary sources from 114 registered industries in Jakarta from industrial activities and to give disincentive for violation of emission regulation and additional 90 stationary sources will be directly monitored.
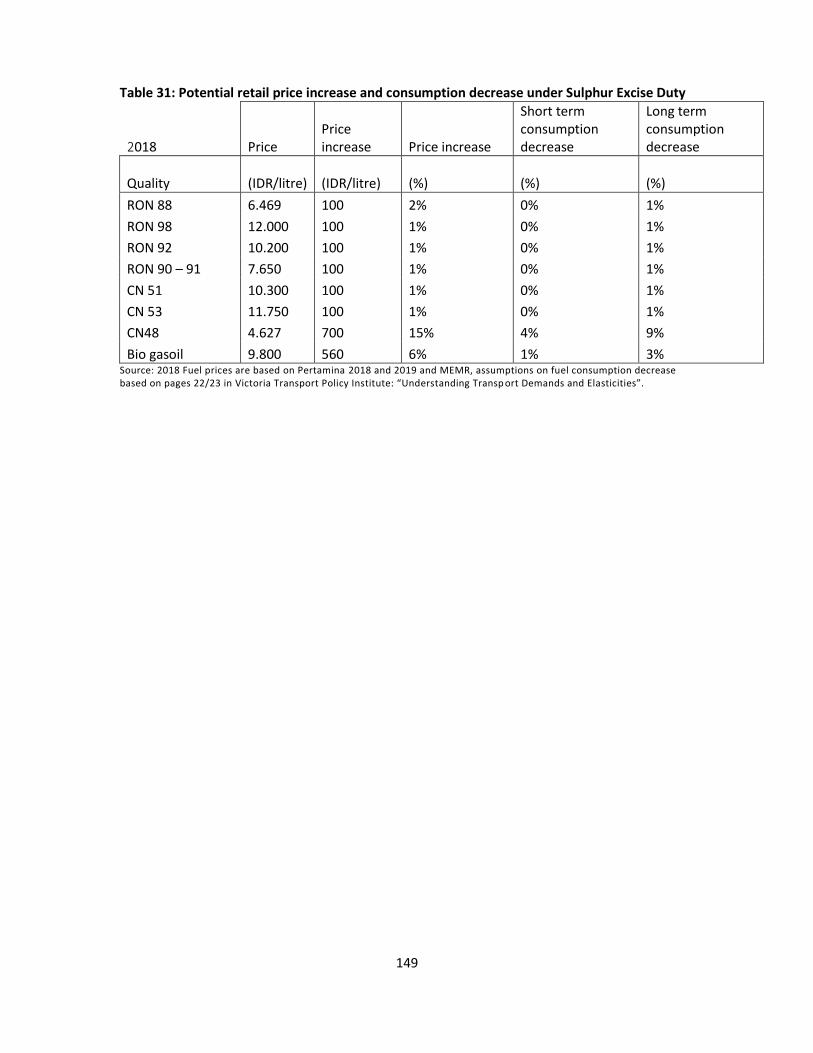
149
Table 31: Potential retail price increase and consumption decrease under Sulphur Excise Duty
2018 Price Price increase Price increase
Short term consumption decrease
Long term consumption decrease
Quality (IDR/litre) (IDR/litre) (%) (%) (%)
RON 88 6.469 100 2% 0% 1%
RON 98 12.000 100 1% 0% 1%
RON 92 10.200 100 1% 0% 1%
RON 90 – 91 7.650 100 1% 0% 1%
CN 51 10.300 100 1% 0% 1%
CN 53 11.750 100 1% 0% 1%
CN48 4.627 700 15% 4% 9%
Bio gasoil 9.800 560 6% 1% 3% Source: 2018 Fuel prices are based on Pertamina 2018 and 2019 and MEMR, assumptions on fuel consumption decrease based on pages 22/23 in Victoria Transport Policy Institute: “Understanding Transp ort Demands and Elasticities”.

150
Table 32: Impact of proposed Carbon Tax scheme on fuel prices and energy consumption
Nominal retail price Real price increase compared to BAU Energy consumption decrease compared to BAU
Gasoline RON88
Diesel CN48
CNG Gasoline RON88
Diesel CN48
CNG Fuel Average
Gasoline RON88
Diesel CN48
CNG Average short term
Average long term
(IDR/litre) (%) (%)
2019 6,469 4,627 3,100
2020 6,818 5,001 3,332 5% 8% 7% 6% 1% 2% 2% 1%
2021 6,818 5,001 3,332 5% 8% 7% 6% 1% 2% 2% 2%
2022 6,888 5,076 3,379 7% 10% 9% 7% 2% 2% 2% 2%
2023 6,888 5,076 3,379 7% 10% 9% 8% 2% 2% 2% 2%
2024 6,958 5,151 3,425 8% 12% 11% 9% 2% 3% 3% 2%
2025 6,958 5,151 3,425 8% 12% 11% 9% 2% 3% 3% 2%
2026 7,028 5,226 3,472 10% 14% 13% 11% 2% 4% 3% 3%
2027 7,028 5,226 3,472 10% 15% 14% 11% 3% 4% 3% 3%
2028 7,098 5,301 3,518 12% 17% 16% 13% 3% 4% 4% 3%
2029 7,098 5,301 3,518 12% 17% 16% 13% 3% 4% 4% 3%
2030 7,168 5,375 3,565 14% 19% 18% 15% 3% 5% 5% 4%
2031 7,168 5,375 3,565 14% 20% 19% 16% 3% 5% 5% 4% 9% Assumptions for 2020-2031: constant nominal fuel retail prices under BAU; constant inflation rate (3%); constant nat. transport sector fuel consum ption increase of 4.1% per year based on "Indonesia Third National Communication under the UNFCCC 2017"; fuel consumption decrease rates under carbon tax scheme based on pages 22/23 in Victori a Transport Policy Institute: “Understanding Transport Demands and Elasticities”; default emission factors based on table 3.2.1. of “2006 IPCC Guidelines for National Greenhouse Gas Inventories - Chapter 3 Mobile Combustion”; local volume conversion factors based MEMR "2018 Handbook of Energy & Economic Statistics of Indo nesia"

151
Table 33: Impact of proposed Motorized Fuel Duty on fuel prices and energy consumption
Nominal retail price Real price increase as compared to BAU
Energy consumption decrease as compared to BAU
Gasoline Ron88
Diesel CN48
Gasoline Ron88
Diesel CN48
Average Gasoline RON88
Diesel CN48
Average short term
Average long term
(IDR7litre) (%) (%)
2019 6,469 4,627
2020 6,530 4,759 1% 3% 1% 0% 1% 0%
2021 6,592 4,803 2% 4% 2% 0% 1% 1%
2022 6,653 4,847 3% 5% 4% 1% 1% 1% 2% Assumptions for 2020-2022: constant nominal fuel retail prices under BAU; constant inflation rate (3%) as predicted by the Bank of Indonesia for the year 2020; constant nat. transport sector fuel consumption increase of 4.1% per year ba sed on "Indonesia Third National Communication under the UNFCCC 2017"; constant contribution to transport sector fuel sales of each fuel type (73% gasoline, 27% diesel) in DKI Jakarta as of 2015.
Table 34: The fleet in Jakarta 2012-2016
Source: BPS 2018. Translation: Sepeda motor = motorcycle / Mobil penumpang = passenger car / Mobil beban = freight/truck / Mobil bus = bus / Ransus = special vehicle (e.g., three cycle, mobile crane, steam roller, special construction vehicles, etc .).

152
Annex III. Strategic Regional Activity (KSD) Jakarta (as of July 2019) Information on further inputs:
1. Relevant to transport
No. 28 Transit oriented development (TOD) No. 29 Integrated Transport Service through JAKLINGKO No. 30 Development of MRT No. 31 Development of LRT No. 31 Development of Electronic Road Pricing (ERP) No. 33 Bus drivers’ training and certification programme No. 34 Development of public transport through building new passenger terminals No. 35 Development of park and ride policy and optimalization of parking management No. 36 Development of elevated loopline No. 37 Development of electronic fare collection (EFC) No. 49 Development of an integrated water transport service
2. Relevant to Environment and Land Use
No. 43 Development of smart city No. 44 Expansion of green open space (ruang terbuka hijau) No. 71 Air pollution control No. 72 Mitigation and adaptation of climate change

153
Annex IV. Legal instruments hierarchy
1. Constitution (first order) 2. People’s Assembly Resolution or Tap MPR (second order) 3. Act (third order) 4. Government Regulation or PP (fourth order) 5. Presidential Decree (fifth order) 6. Governor Decree (sixth order) 7. Mayor/Head of District Decree (seventh order)
Source: https://www.hukumonline.com/klinik/detail/ulasan/cl4012/hierarki-peraturan-perundang-undangan-di-indonesia/

154
ANNEX V. List of roundtable participants 06.09.2019
1. Local Environmental Agency, DKI Jakarta 2. UNEP representative 3. Fiscal Policy Office within The Ministry of Finance 4. Vital Strategies Programme representative 5. International Council on Clean transportation (ICCT) 6. Indonesian Environmental Scientists Association (2x) 7. Komit Penghapusan Bensin Bertimbel (KPBB) – NGO 8. KPBB 9. Local sustainable Consulting firm 10. GIZ representative 11. Faculty of Public Health, University of Indonesia 12. Transport Agency

155
7. Bibliography Air Quality Expert Group (2007). Air Quality and Climate Change: A UK Perspective. London: Department for the Environment, Food and Rural Affairs (DEFRA). https://uk-air.defra.gov.uk/assets/documents/reports/aqeg/fullreport.pdf. Accessed on 2 December 2019. Akhmad, A., Romadhoni, B., Karim, K., Tajibu, M.J. and Syukur, M. (2019). The Impact of Fuel Oil Price Fluctuations on Indonesia’s Macro Economic Condition. International Journal of Energy Economics and Policy 9(2), 277-282. https://doi.org/10.32479/ijeep.7470. Amann, M., Cofala, J., Heyes, C., Klimont, Z., Mechler, R., Posch, M. et al. (2004). Interim Report: Rains Review 2004. Laxenburg: International Institute for Applied Systems Analysis. http://pure.iiasa.ac.at/id/eprint/7307/1/IR-04-075.pdf. Accessed on 2 December 2019. APBD Jakarta (2019). General Budget of DKI Jakarta 2016-2020. https://apbd.jakarta.go.id. Accessed on 9 December 2019. ASEAN Specialised Meterological Centre ASMC. Regional Haze Situation. http://asmc.asean.org/home/. Accessed on 9 December 2019. Asian Development Bank (ADB) (2009). The Economics of Climate Change in Southeast Asia: A Regional Review. Mandaluyong City. https://www.adb.org/sites/default/files/publication/29657/economics-climate-change-se-asia.pdf. Accessed on 30 July 2019. Asian Development Bank (ADB) (2012). Indonesia: Transport Sector Assessment, Strategy and Road Map. Mandaluyong City. https://www.adb.org/sites/default/files/institutional-document/33652/files/ino-transport-assessment.pdf. Accessed on 2 December 2019. Asian Development Bank (ADB) (2015). Fossil Fuel Subsidies in Indonesia: Trends, Impacts and Reforms. Mandaluyong City. https://www.adb.org/sites/default/files/publication/175444/fossil-fuel-subsidies-indonesia.pdf. Accessed on 2 December 2019. Attwood, C., Bridle, R., Gass, P., Halimanjaya, A.S., Laan, T., Lontoh, L., et al. (2017). Financial Supports for Coal and Renewables in Indonesia. Winnipeg: The International Institute for Sustainable Development. https://www.iisd.org/sites/default/files/publications/financial-supports-coal-renewables-indonesia.pdf. Accessed on 2 December 2019. Badan Meteorologi, Klimatologi, dan Geofisika (BMKG) (2019). Kualitas Udara (PM10) [Air Quality (PM10)]. https://www.bmkg.go.id/?lang=ID. Accessed on 25 November 2019. Badan Pajak dan Retribusi Daerah Provinsi (BPRDP) DKI Jakarta (2019). https://bprd.jakarta.go.id/wp-content/uploads/downloads/2019/09/RENSTRA-BPRD-2017-2022-FULL_newREV.pdf. Accessed on 31 December 2019. Badan Pengendalian Lingkungan Hidup Daerah (BPLHD) DKI Jakarta (2009). http://bplhd.jakarta.go.id/filing/materi%202_Bahan%20FGD%20pencegahan%20Dampak%20LLAJ%20pemprov%20DKI%20LH.pdf. Accessed on September 1 2019.

156
Badan Pengkajian dan Penerapan Teknologi (BPPT) (2016). Indonesia Energy Outlook 2016: Energy Development in Supporting Green Industry. Jakarta. https://www.bppt.go.id/outlook-energi/bppt-outlook-energi-indonesia-2016/download. Accessed on 2 December 2019. Badan Pusat Statistik (BPS) (2005). Survey Sosial Ekonomi Nasional (Susenas). [National Survey on Social and Economic Report 2004]. Jakarta. Badan Pusat Statistik (BPS) (2016). Jumlah Penduduk Miskin Menurut Provinsi, 2007-2019. Jakarta. https://www.bps.go.id/linkTableDinamis/view/id/1119. Accessed on 31 July 2019. Badan Pusat Statistik (BPS) DKI Jakarta (2019). DKI Jakarta Dalam Angka 2019. Jakarta. https://jakarta.bps.go.id/publication/download.html?nrbvfeve=ZWVhNGY0YjM4N2MzMDI0YmI0YTNhN2Zj&xzmn=aHR0cHM6Ly9qYWthcnRhLmJwcy5nby5pZC9wdWJsaWNhdGlvbi8yMDE5LzA4LzE2L2VlYTRmNGIzODdjMzAyNGJiNGEzYTdmYy9wcm92aW5zaS1ka2ktamFrYXJ0YS1kYWxhbS1hbmdrYS0yMDE5Lmh0bWw%3D&twoadfnoarfeauf=MjAxOS0xMi0wMiAyMjowNDozOA%3D%3D Bangkok Post (2018). Scant CO2 impact seen. https://www.bangkokpost.com/business/1420810/scant-co2-tax-impact-seen. Accessed 31 December 2019. Beaton, C., Gerasimchuk, I., Laan, T., Lang, K., Vis-Dunbar, D. and Wooders, P. (2013). A Guide to Fossil-Fuel Subsidy Reform for Policy-Makers in Southeast Asia. Winnipeg: The International Institute for Sustainable Development. https://www.iisd.org/gsi/sites/default/files/ffs_guidebook.pdf. Accessed on 2 December 2019. Berita Satu (2018). Sulitnya Menerapkan ERP di Jakarta. https://www.beritasatu.com/megapolitan/529620/sulitnya-menerapkan-erp-di-jakarta. Accessed 31 December 2019. Bisnis Indonesia (2017). Habis LCGC, Terbitlah LCEV. [Published on Ministry of Industry website]. http://www.kemenperin.go.id/artikel/16994/Habis-LCGC,-Terbitlah-LCEV. Accessed on 2 December 2019. Bloomberg (2019). 70 billion toll road splurge aims to connect Indonesia’s sprawl. https://www.bloomberg.com/news/articles/2019-06-19/-70-billion-toll-road-splurge-aims-to-connect-indonesia-s-sprawl. Accessed on 2 December 2019. Borjesson, M. (2018). Assessing the Net Overall Distributive Effect of a Congestion Charge. International Transport Forum Discussion Papers. Paris: OECD Publishing. https://www.itf-oecd.org/sites/default/files/docs/swedish-congestion-charges.pdf. Accessed on 30 July 2019. Braithwaite, D. and Gerasimchuk, I. (2019). Beyond Fossil Fuels: Indonesia’s Fiscal Transition. Winnipeg: The International Institute for Sustainable Development. https://www.iisd.org/sites/default/files/publications/beyond-fossil-fuels-indonesia-fiscal-transition.pdf. Accessed on 2 December 2019. Breathe Easy Jakarta (BEJ) (2017). Compendium Breathe Easy Jakarta: Urban Air Quality Management Program for Jakarta, A program from US-EPA: 2011-2016. Jakarta: KPBB.

157
Bridle, R., Gass, P., Halimajaya, A., Lontoh, L., McCulloch, N., Petrofsky, E., et al. (2018). Missing the 23 Per Cent Target: Roadblocks to the Development of Renewable Energy in Indonesia. Winnipeg: The International Institute for Sustainable Development. https://www.iisd.org/sites/default/files/publications/roadblocks-indonesia-renewable-energy.pdf Accessed on 2 December 2019. Burke, P.J., Batsuuri, T. and Yudhistira, M.H. (2017). Easing the Traffic: The effects of Indonesia’s Fuel Subsidy Reforms on Toll-Road Travel. Arndt-Corden Department of Economics Working Paper 2017/10. https://openresearch-repository.anu.edu.au/bitstream/1885/128512/3/01_Burke_Easing%20the%20traffic_2017.pdf. Accessed on 2 December 2019. Business Times (2019). Indonesia president signs new electric vehicle decree to bolster industry. https://www.businesstimes.com.sg/transport/indonesia-president-signs-new-electric-vehicle-decree-to-bolster-industry. Accessed 31 December 2019. Centre for Public Impact (2016). Case Study: London’s Congestion Charge, 15 April. https://www.centreforpublicimpact.org/case-study/demand-management-for-roads-in-london/. Accessed on 2 December 2019. Chelminski, K. (2018). Fossil Fuel Subsidy Reform in Indonesia: The Struggle for Successful Reform. In The Politics of Fossil Fuel Subsidies and their Reform. Skovgaard, J. & van Asselt, H. (eds.). Cambridge: Cambridge University Press. Clayton, N., Jeffrey, S. and Breach, A. (2017). Funding and Financing Inclusive Growth in Cities. London: Centre for Cities. https://www.centreforcities.org/wp-content/uploads/2017/12/17-12-11-Funding-and-Financing-for-Inclusive-Growth.pdf. Accessed on 2 December 2019. Climate and Clean Air Coalition (CCAC) (2016). Cleaning Up the Global On-Road Diesel Fleet: A Global Strategy to Introduce Low-Sulphur Fuels and Cleaner Diesel Vehicles. Paris. https://ccacoalition.org/en/file/2277/download?token=rRKxI5PN. Accessed on 2 December 2019. Climate and Clean Air Coalition (CCAC) (n.d.). ASEAN Senior Level Workshop on Clean Air, Health and Climate [Webpage]. Accessed through: https://www.ccacoalition.org/en/event/asean-senior-level-workshop-clean-air-health-and-climate. Climate and Clean Air Coalition (CCAC) and United Nations Environment Programme (UNEP) (2019). Air Pollution in Asia and the Pacific: Science-based Solutions. Nairobi. https://ccacoalition.org/en/file/5803/download?token=beQW7s0L. Accessed on 4 December 2019. CNN Indonesia (2016). Menkeu: Pemerintah Belum Putuskan Pajak Baru untuk BBM, 27 January. https://www.cnnindonesia.com/ekonomi/20160127145520-85-107084/menkeu-pemerintah-belum-putuskan-pajak-baru-untuk-bbm. Accessed on 2 December 2019. CNN Indonesia (n.d.). Begini Cara Gubernur Anies Atasi Polusi Udara di Jakarta [Statement of the Governor of Jakarta regarding the lawsuit filed in 2019 about upcoming planned measures of DKI Jakarta to curb air pollution]. [online video]. https://www.youtube.com/watch?v=rw1X1d3i-rU. Accessed on 30 July 2019.

158
CNN Indonesia (2019). KLHK Klaim Kualitas Udara di Jakarta Masih Kategori Sehat [The minister’s opening speech at Environmental and Forestry Week, Jakarta, July 2019]. https://www.cnnindonesia.com/nasional/20190711115305-20-411172/klhk-klaim-kualitas-udara-di-jakarta-masih-kategori-sehat. (Accessed September 2019). Coady. D., Parry, I., Nghia-Piotr, L., Baoping Shang (2019). Global Fossil Fuel Subsidies Remain Large: Amn Update Based on Country-level estimates. IMF Working Paper WP 19/89. Accessed on 8 December 2019. Cottrell, J. and Falcão, T. (2018). A Climate of Fairness: Environmental Taxation and Tax Justice in Developing Countries. Vienna: Vienna Institute for International Dialogue and Cooperation (VIDC). http://www.vidc.org/fileadmin/Bibliothek/DP/A_Climate_of_Fairness.pdf. Accessed on 2 December 2019. Cottrell, J., Ludewig, D., Runkel, M., Schlegelmilch, K. and Zerzawy, F. (2018). Environmental Taxation in Asia and the Pacific. In Tax Policy for Sustainable Development in Asia and the Pacific. Bangkok: United Nations, Economic and Social Commission for Asia and the Pacific. ST/ESCAP/2806. http://www.unescap.org/sites/default/files/publications/Tax%20Policy%20for%20Sustainable%20Development.pdf. Accessed on 2 December 2019. Cottrell, J., Schlegelmilch, K., Runkel, M. and Mahler, A. (2016). Environmental Tax Reform in Developing, Emerging and Transition Economies. Studies 93. Bonn: Deutsches Institut für Entwicklungspolitik. https://www.die-gdi.de/uploads/media/Study_93.pdf. Accessed on 2 December 2019. Cuevas, S. and Haines, A. (2016). Health benefits of a carbon tax. The Lancet. Vol. 387, Issue
10013: 7-9, January 2 2016. https://doi.org/10.1016/S0140-6736(15)00994-0. Accessed on 24 January 2020. D'Artagnan Pacific Pty Ltd (DPPL) and Ian Wallis Associates (IWA) (2018). Review of International Road Pricing Initiatives, Previous Reports and Technologies for Demand Management Purposes. Report commissioned by the Auckland Smarter Transport Pricing Project, Ministry of Transport, New Zealand. D'Artagnan Pacific Pty Ltd (DPPL), with Ian Wallis Associates (IWA). Auckland. https://www.transport.govt.nz/assets/Uploads/Land/Documents/3e828706f5/ASTPP-Scheme-review1.8.pdf. Accessed on 2 December 2019. Dartanto, T. (2013). Reducing Fuel Subsidies and the Implication on Fiscal Balance and Poverty in Indonesia: A Simulation Analysis. Energy Policy 58, 117-134. https://doi.org/10.1016/j.enpol.2013.02.040. Department for the Environment, Food and Rural Affairs (DEFRA) (2019). Clean Air Strategy 2019. London. https://assets.publishing.service.gov.uk/government/uploads/system/uploads/attachment_data/file/770715/clean-air-strategy-2019.pdf Accessed on 2 December 2019. Department of Land Transport (DLT) (2016). Number of Cumulative Vehicle Statistics 2007-2015.

159
Department of Renewable Energy Development and Energy Efficiency (DEDE) (2015). Alternative Energy Development Plan: AEDP2015. Bangkok. http://www.eppo.go.th/images/POLICY/ENG/AEDP2015ENG.pdf. Accessed on 2 December 2019. Detik News (2016). 2 Tahun Memimpin, Jokowi-JK Hapus Subsidi BBM Hingga Pangkas Izin Migas, 19 October. https://finance.detik.com/energi/d-3324663/2-tahun-memimpin-jokowi-jk-hapus-subsidi-bbm-hingga-pangkas-izin-migas Accessed on 2 December 2019. Detik News (2017). Berapa Ambang Batas Emisi Mobil yang Diusulkan?, 3 January. https://oto.detik.com/berita/d-3386357/berapa-ambang-batas-emisi-mobil-yang-diusulkan Accessed on 2 December 2019. Deutsche Gesellschaft für Internationale Zusammenarbeit (GIZ) (2015). Clean Air Plans for Palembang and Surakarta. Bonn and Eschborn. Deutsche Gesellschaft für Internationale Zusammenarbeit (GIZ) (2017). Towards Green Freight and Logistics in Indonesia. Bonn and Eschborn. Deutsche Gesellschaft für Internationale Zusammenarbeit (GIZ) (2018). Stocktaking Report for Sustainable Transport in Indonesia. Bonn and Eschborn. Deutsche Gesellschaft für Technische Zusammenarbeit (GTZ) (2004). Sustainable Transport: A Sourcebook for Policy-makers in Developing Cities. Module 1d: Economic Instruments. https://www.sutp.org/files/contents/documents/resources/A_Sourcebook/SB1_Institutional-and-Policy-Orientation/GIZ_SUTP_SB1d-Economic-Instruments_EN.pdf. Accessed on 15 July 2019. Diop, N. (2014). Why Is Reducing Energy Subsidies a Prudent, Fair, and Transformative Policy for Indonesia?. Economic Premise 148. Washington, DC: The World Bank. http://siteresources.worldbank.org/EXTPREMNET/Resources/EP140.pdf. Accessed on 2 December 2019. Dishub (2019). Presentation by Dishub, 29 August 2019. Unpublished. Provided by KPBB. Doll, C., Mejia-Dorantes, L., Vassallo, J.M. (2016). Economic Impact of Introducing Road Charging for Heavy Goods Vehicles. Report to Transport and Environment (T&E). Karlsruhe: Fraunhofer-Institute for Systems and Innovation Research ISI and Universidad Politecnica de Madrid (UPM). https://www.transportenvironment.org/sites/te/files/publications/2017_04_road_tolls_report.pdf. Accessed on 2 December 2019. Elgie, S. and McClay, J. (2013). BC’s Carbon Tax Shift is Working Well after Four Years (“Attention Ottawa”), Canadian Public Policy / Analyse de Politiques 39, S1-S10. https://www.jstor.org/stable/23594767. Accessed on 2 December 2019. Eliasson, J. (2014). The Stockholm Congestion Charges: An Overview. Centre for Transport Studies Working Paper 2014:7. http://www.transportportal.se/swopec/cts2014-7.pdf. Accessed on 29 August 2019.

160
Eskeland, G.S. and Lindstad, H. (2015). Environmental Taxation in Transport. Green Growth Knowledge Platform Working Paper 05/2015. https://www.greengrowthknowledge.org/sites/default/files/downloads/resource/Environmental_Taxation_in_Transport_GGKP_1.pdf. Accessed on 3 December 2019. European Commission (n.d.). Exchange Rate (InforEuro). https://ec.europa.eu/budget/graphs/inforeuro.html. Accessed on 3 December 2019. European Environment Agency (EEA) (2018). Appropriate Taxes and Incentives Do Affect Purchases of New Cars. Copenhagen. https://doi.org/10.2800/468924 Fay, M., Hallegatte, S., Vogt-Schilb, A., Rozenberg, J., Narloch, U. and Kerr, T. (2015). Decarbonizing Development: Three Steps to A Zero-Carbon Future. Washington, DC: World Bank. http://www.worldbank.org/content/dam/Worldbank/document/Climate/dd/decarbonizing-development-report.pdf. Accessed on 3 December 2019. Federal Environment Agency, Germany (2019). Information from the Federal Environment Agency website on Low-Emissions Zones in Germany. https://www.umweltbundesamt.de/themen/luft/luftschadstoffe/feinstaub/umweltzonen-in-deutschland#textpart-7 Accessed on 29 November 2019. Ginting, F. (n.d.). Toward A Better Jakarta Transportation. n.p.: Transportation Agency of DKI Jakarta Provincial Government. https://www.unescap.org/sites/default/files/4.1%20%20Planning%20and%20development%20of%20urban%20transport%20systems%20in%20Jakarta.pdf. Accessed on 30 July 2019. Givoni, M. (2012). Re-assessing the Results of the London Congestion Charging Scheme. Urban Studies 49(5), 1089-1105. https://doi.org/10.1177/0042098011417017. Global Green Growth Institute (GGGI) (2017). Case Study: Enabling Adoption of Electric Mobility in Public Transportation in India. Seoul. https://www.greengrowthknowledge.org/sites/default/files/downloads/best-practices/GGGI%20Case%20Study_Enabling%20Adoption%20of%20Electric%20Vehicles%20in%20India%20_June%202017.pdf. Accessed on 3 December 2019. Global Green Growth Institute (GGGI) and Center for Study of Science, Technology and Policy (2015). Electric Buses in India: Technology, Policy and Benefits. Seoul: GGGI. https://gggi.org/site/assets/uploads/2016/10/2016-08-Electric-Buses-in-India-Technology-Policy-and-Benefits.pdf. Accessed on 3 December 2019. Government of Indonesia (2017a). Kementerian Hukum dan HAM RI. PP 46/ 2017 tentang Instrumen Ekonomi Lingkungan Hidup [Government Regulation No. 46/ 2017 Environment Economic Instruments]. http://peraturan.go.id/peraturan/view.html?id=11e7ef72190442e68b65313130343538. Accessed on 24 November 2019. Government of Indonesia (2017b). Indonesia’s Third National Communication under the UNFCCC 2017. https://unfccc.int/sites/default/files/resource/8360571_Indonesia-NC3-2-Third%20National%20Communication%20-%20Indonesia%20-%20editorial%20refinement%2013022018.pdf. Accessed on 8 December 2019.
161
Green, C.P., Heywood, J.S. and Navarro, M. (2018). Did the London Congestion Charge Reduce Pollution? Lancaster University Management School Economics Working Paper Series 2018/007. https://eprints.lancs.ac.uk/id/eprint/124744/1/LancasterWP2018_007.pdf. Accessed on 3 December 2019. Greenpeace (2015). Human Cost of Coal Power: How Coal-Fired Power Plants Threaten the Health of Indonesians. Jakarta: Greenpeace Indonesia. http://www.greenpeace.org/archive-indonesia/PageFiles/695938/full-report-human-cost-of-coal-power.pdf. Accessed on 30 July 2019. Grütter Consulting (2019). E-Mobility for Jakarta. Unpublished report commissioned by ADB. Guardian (2015). Wide range of cars emit more pollution in real driving conditions tests show. https://www.theguardian.com/environment/2015/sep/30/wide-range-of-cars-emit-more-pollution-in-real-driving-conditions-tests-show. Accessed 29.11.2019. Gulia, S., Shiva Nagendra, S.M., Khare, M. and Khanna, I. (2015). Urban Air Quality Management: A Review. Atmospheric Pollution Research 6(2), 286-304. https://doi.org/10.5094/APR.2015.033. Haines, A., McMichael, A.J., Smith, K.R., Roberts, I., Woodcock, J., Markandya, A., et al. (2009). Public Health Benefits of Strategies to Reduce Greenhouse-Gas Emission: Overview and Implications for Policy Makers. Lancet 374(9707), 2104-2114. https://doi.org/10.1016/S0140-6736(09)61759-1. Harrison, K. (2013). The Political Economy of British Columbia's Carbon Tax. OECD Environment Working Papers No. 63. Paris: OECD Publishing. http://dx.doi.org/10.1787/5k3z04gkkhkg-en. Haryanto, B. (2010). GAINS Model Series of Air Pollutants in DKI Jakarta from 1990-2010. GAINS database accessed by B. Haryanto, University of Indonesia. Haryanto, B. (2017). Climate Change and Urban Air Pollution Health Impacts in Indonesia. In Climate Change and Air Pollution. Akhtar, R. and Palagiano, C. (eds.). New York: Springer. 215-239. https://www.researchgate.net/publication/320256920_Climate_Change_and_Urban_Air_Pollution_Health_Impacts_in_Indonesia. Accessed on 3 December 2019. Haryanto, B. and Franklin, P. (2011). Air Pollution: A Tale of Two Countries. Reviews on Environmental Health 26(1), 75–82. https://doi.org/10.1515/reveh.2011.008. Hedley, A.J., Wong, C.M., Thach, T.Q., MSat, S.M., Lam, T.H. and Anderson, H.R. (2002). Cardiorespiratory and all-cause mortality after restrictions on sulphur content of fuel in Hong Kong: an intervention study. The Lancet Vol.360, Issue 9346: 1646-1652. https://doi.org/10.1016/S0140-6736(02)11612-6 High-Level Commission on Carbon Prices (HLCCP) (2017). Report of the High-Level Commission on Carbon Prices. Washington, DC: The World Bank. https://static1.squarespace.com/static/54ff9c5ce4b0a53decccfb4c/t/59b7f2409f8dce5316811916/1505227332748/CarbonPricing_FullReport.pdf. Accessed on 2 December 2019.

162
Hung, W.T. (2006). Taxation on vehicle fuels: its impacts on switching to cleaner fuels. Energy Policy 34: 2566-2571. https://doi.org/10.1016/j.enpol.2004.08.018 Indonesian Automotive Industry Association (GAIKINDO) (n.d.). Indonesian Automobile Industry Data. https://www.gaikindo.or.id/indonesian-automobile-industry-data/. Accessed on 3 December 2019. Indonesian National Development Planning Agency (BAPPENAS) (2011). Guideline for Implementing Green House Gas Emission Reduction Action Plan. [Translated English Version]. Jakarta. http://ranradgrk.bappenas.go.id/rangrk/admincms/downloads/publications/Gudeline_for_implementing_green_house_gas_emission_reduction_action_plan.pdf Accessed on 2 December 2019. Institute for Health Metrics and Evaluation (IHME) (2019). Health data Indonesia. http://www.healthdata.org/indonesia. Accessed September 2019. Intergovernmental Panel on Climate Change (IPCC) (2006). Mobile Combustion. In 2006 IPCC Guidelines for National Greenhouse Gas Inventories vol. 2: Energy. Geneva. Chapter 3. https://www.ipcc-nggip.iges.or.jp/public/2006gl/pdf/2_Volume2/V2_3_Ch3_Mobile_Combustion.pdf. Accessed on 3 December 2019. International Carbon Action Partnership (ICAP) (2020). ETS detailed information: Indonesia. https://icapcarbonaction.com/en/?option=com_etsmap&task=export&format=pdf&layout=list&systems[]=104. Accessed on 24 January 2020. International Council on Clean Transportation (ICCT) (2009). Managing Motorcycles: Opportunities to Reduce Pollution and Fuel Use from Two- and Three-Wheeled Vehicles. Wilmington, DE. https://theicct.org/sites/default/files/publications/managing_motorcycles.pdf. Accessed on 3 December 2019. International Council on Clean Transportation (ICCT) (2014). Briefing: Opportunities to Reduce Vehicle Emissions in Jakarta. Wilmington, DE. https://theicct.org/sites/default/files/publications/ICCT_Jakarta-briefing_20141210.pdf. Accessed on 3 December 2019. International Council on Clean Transportation (ICCT) (2018). Compatibility of Mid-Level Biodiesel Blends in Vehicles in Indonesia. Working Paper 2018-08. https://theicct.org/sites/default/files/publications/Indonesian%20biofuel%20Working%20Paper-08%20v2.pdf Accessed on 3 December 2019. International Energy Agency (IEA) (2009). Transport, Energy and CO2: Moving Toward Sustainability. Paris. https://www.iea.org/publications/freepublications/publication/transport2009.pdf. Accessed on 3 December 2019. International Energy Agency (IEA) (2016). Fossil Fuel Subsidy Reform in Mexico and Indonesia. Paris.

163
https://www.iea.org/publications/freepublications/publication/PartnerCountrySeriesFossil_Fuel_Subsidy_Reform_Mexico_Indonesia_2016_WEB.pdf. Accessed on 30 July 2019. International Energy Agency (IEA) (2019). Statistics Indonesia. https://www.iea.org/statistics/?country=INDONESIA&year=2016&category=Electricity&indicator=ShareElecGenByFuel&mode=chart&dataTable=ELECTRICITYANDHEAT. Accessed on 3 December 2019. International Renewable Energy Agency (IRENA) (2017). Renewable Energy Prospects: Indonesia, a REmap Analysis. Abu Dhabi. https://www.irena.org/-/media/Files/IRENA/Agency/Publication/2017/Mar/IRENA_REmap_Indonesia_report_2017.pdf. Accessed on 3 December 2019. IQAir Air Visual (n.d). 2018 World Air Quality Report: Region & City PM2.5 Ranking. Goldach. https://www.airvisual.com/world-most-polluted-cities/world-air-quality-report-2018-en.pdf. Accessed on 3 December 2019. IQAir Air Visual (2019). Real-time status of Indonesia air quality index (AQI) and PM2.5 air pollution. https://www.airvisual.com/indonesia. Accessed 23 September 2019. Israngkura, A. (2014): An Analysis of Economic Instruments for GHG Mitigation in Thailand. Unpublished report produced for the UNEP/PAGE project in Thailand, Bangkok, 2014. Jaeger, A., Nugroho, S.B., Zusman, E., Nakano, R. and Daggy, R. (2014). Governing Sustainable Transport in Indonesia. IGES Working Paper No. 2014-01. https://www.files.ethz.ch/isn/183568/IGES_Working_Paper_No.2014-01.pdf. Accessed on 3 December 2019. Jakarta Open Data (2015). Data Penjualan dan Pajak BBM di DKI Jakarta. http://data.jakarta.go.id/dataset/data-penjualan-dan-pajak-bbm-di-dki-jakarta-tahun-2015. Accessed on 1 September 2019. Jakarta Post (2017a). Jakarta Implements Vehicle Tax Amnesty, 30 November. https://www.thejakartapost.com/news/2017/11/30/jakarta-implements-vehicle-tax-amnesty.html. Accessed on 15 July 2019. Jakarta Post (2017b). Most corruption involved civil servants. https://www.thejakartapost.com/news/2017/03/05/most-corruption-involves-civil-servants-icw.html. Accessed on 15 July 2019. Jakarta Post (2019a). Government adds 1.5 million kilolitres to this year’s subsidized diesel quota. https://www.thejakartapost.com/news/2019/12/02/government-adds-15-million-kl-to-this-years-subsidized-diesel-quota.html Accessed on 31 December 2019. Jakarta Post (2019b). New chapter of ERP: City to retender procurement. https://www.thejakartapost.com/news/2019/09/13/new-chapter-of-erp-city-to-retender-procurement.html. Accessed 31 December 2019. Japan International Cooperation Agency (JICA) and ALMEC Corporation Oriental Consultants Co., LTD. (2012). Project for the Study on Jabodetabek Public Transportation Policy Implementation Strategy in the Republic of Indonesia (JAPTraPIS) Summary and Final Report.

164
Jakarta: Directorate General of Land Transportation, Ministry of Transportation, The Republic of Indonesia. http://open_jicareport.jica.go.jp/pdf/12079000_01.pdf / http://open_jicareport.jica.go.jp/pdf/12078994_01.pdf. Accessed on 3 December 2019. Kementerial Lingkungan Hidup (KLH) (2012). Cost-Benefit Analysis Fuels Economy: Final report. Jakarta. https://wedocs.unep.org/bitstream/handle/20.500.11822/16842/CBA_Indonesia.pdf?sequence=1&isAllowed=y. Accessed on 3 December 2019. Kementerial Lingkungan Hidup dan Kehutanan (KLHK) (2019a). Data Kualitas Udara di Indonesia dalam Indeks Standar Pencemar Udara - ISPU [Air Quality Data in Indonesia in the Air Pollution Standards Index]. http://iku.menlhk.go.id/aqms/. Accessed on 25 November 2019. Kementerial Lingkungan Hidup dan Kehutanan (KLHK) (2019b). Data Pantau Parameter PM 2.5 [PM2,5 Monitoring Data]. http://iku.menlhk.go.id/aqms/pm25. Accessed on 25 November 2019. Kementerial Lingkungan Hidup dan Kehutanan (KLHK) (2019c). Daftar Stasiun [Data on monitoring stations]. http://iku.menlhk.go.id/aqms/stasiun. Accessed 9 December 2019. King’s College London (2019). Higher air pollution days trigger cardiac arrests and hospitalizations. https://www.kcl.ac.uk/news/higher-air-pollution-days-trigger-cardiac-arrests-and-hospitalisations. Accessed on 9 December 2019. Ko, J-H. (2015). A guide to transportation policy (general): Seoul Solution. https://www.seoulsolution.kr/en/content/guide-transportation-policy-general Accessed 20 January 2020. Kompas (2018). KPBB: Dampak Polusi Udara, Warga DKI Rugi RP 51,2 Triliun. https://megapolitan.kompas.com/read/2019/07/09/05322231/kpbb-dampak-polusi-udara-warga-dki-rugi-rp-512-triliun?page=all. Accessed on 3 December 2019. Kompas (2019). 90.000 Penumpang Naik MRT Jakarta Per Hari Pasca 4 Bulan Beroperasi. https://properti.kompas.com/read/2019/07/25/190000121/90.000-penumpang-naik-mrt-jakarta-per-hari-pasca-4-bulan-beroperasi. Accessed 31 December 2019. Kosonen, K. (2012). Regressivity of Environmental Taxation: Myth or Reality?. Taxation Papers: European Commission Working Paper N.32-2012. Luxembourg: Office for Official Publications of the European Communities. https://ec.europa.eu/taxation_customs/sites/taxation/files/docs/body/taxation_paper_32_en.pdf. Accessed on 3 December 2019. Laboratorium DLH DKI Jakarta [DKI Jakarta Environment Laboratory] (2019). Hasil Pemantauan SPKU [Air Quality Station Monitoring Data]. https://llhd.jakarta.go.id/pages/sensor/sensor.php. Accessed on 25 November 2019. Lee, C., Vandycke, N.L., Sung, N.M., Choi, S.D., Yi, E.J.A. and Lee, S. (2015). Leaping Forward in Green Transport: The Case of Korea. Green Growth in Action: Knowledge Note Series, 2. Washington, DC: The World Bank.

165
https://openknowledge.worldbank.org/bitstream/handle/10986/23230/Green0growth0i0000the0case0of0Korea.pdf?sequence=1&isAllowed=y Accessed on 3 December 2019. Leung, J., Perkins, S. and Wagner, L. (2018). The Social Impacts of Road Pricing: Summary and Conclusions. [Summary Report of the 170 ITF Roundtable Meeting]. International Transport Forum Discussion Papers. Paris: OECD Publishing. https://www.itf-oecd.org/sites/default/files/docs/social-impacts-road-pricing.pdf. Accessed on 3 December 2019. Low Carbon Support Programme to Ministry of Finance, Indonesia (LCSP) (2015). Options for Fiscal Policy Reforms to Assist Control Motor Vehicle Emissions: Final Discussion Paper. https://fiskal.kemenkeu.go.id/pkppim/en/public/2000/studies/download/Motor%20Vehicle%20Emission%20(bahasa%20Inggris).pdf. Accessed on 3 December 2019. Lovei, M. (1998). Phasing Out Lead From Gasoline: Worldwide Experience and Policy Implications. World Bank Technical Paper no. 397. http://siteresources.worldbank.org/INTURBANTRANSPORT/Resources/b09phasing.pdf. Accessed on 3 December 2019. McLeod, F. and McLeod, R. (2010). Fiscal transfers to regional governments in Indonesia. Working Papers in Trade and Development No. 2010/14. Arndt-Corden Department of Economics Crawford School of Economics and Government ANU College of Asia and the Pacific. https://acde.crawford.anu.edu.au/sites/default/files/publication/acde_crawford_anu_edu_au/2016-12/wp_econ_2010_14_fadliya_mcleod.pdf. Accessed on 8 December 2019. Menon, G. and Guttikunda, S. (2010). Electronic Road Pricing: Experience and Lessons from Singapore. SIM-air Working Paper Series: 33:2010. http://www.environmentportal.in/files/ERP-Singapore-Lessons.pdf. Accessed on 3 December 2019. Miharja, M. and Priadi, Y.N. (2018). Optimation of operation system integration between main and feeder public transport (case study: Trans Jakarta-Kopaja bus services). IOP conference series: Earth and Environmental Science 158 (012018), 1-13. doi:10.1088/1755-1315/158/1/012018. Accessed 17 December 2019. Ministry of Energy and Mineral Resources (MEMR) (2014). Statistik Minyak Bumi 2012. Pusat Data dan Teknologi Informasi ESDM. Kementerian Enerji dan Sumber Daya Mineral (ESDM). Ministry of Energy and Mineral Resources (MEMR) (2019). Handbook of Energy and Economic Statistics of Indonesia. Jakarta. https://www.esdm.go.id/assets/media/content/content-handbook-of-energy-and-economic-statistics-of-indonesia-2018-final-edition.pdf. Accessed on 3 December 2019. Ministry of Environment and KPBB (2006). Indonesian Fuel Quality Report 2006: Clean Fuel: A Requirement for Air Quality Improvement. Jakarta: Ministry of Environment. Ministry of Finance (2019). APBN (State Budget) 2019. http://www.anggaran.kemenkue.go.id/content/publikasi/NK%20APBN/2018%20Buku%2011%2020Nota%20Keuangan%20Beserta%20APBN%20TA%202019.pdf (link no longer functioning). Accessed on August 2019.
166
Ministry of Finance (n.d.). Peta Data APBN. https://www.peta.data-apbn.kemenkeu.go.id/?i=337&v=3&t=2010,2019&s=8&r=ci. (link no longer functioning). Accessed on 3 December 2019. Ministry of Finance (n.d.). UU Nomor 34 Tahun 2000 tentang Perubahan atas Undang-Undang Republik Indonesia No. 18 Tahun 1997 tentang Pajak dan Retribusi Daerah. http://www.djpk.kemenkeu.go.id/?p=355. Accessed on 3 December 2019. Ministry of Health (2015). Laporan Masalah Kesehatan akibat Kabut Asap Kebakaran Hutan dan Lahan Tahun 2015. Ministry of Transport and Deutsche Gesellschaft für Internationale Zusammenarbeit (GIZ) (2018). Indonesian Stocktaking Report on Sustainable Transport and Climate Change. Meduri, G.U., Mauldin, G.L., Wunderink, R.G., Leeper, K.V.Jr., Jones, C.B., Tolley, E., et al. (1994). Causes of Fever and Pulmonary Densities in Patients with Clinical Manifestations of Ventilator-Associated Pneumonia. Chest 106(1), 221-235. https://www.researchgate.net/profile/Richard_Wunderink/publication/200057743_Causes_of_fever_and_pulmonary_densities_in_patients_with_clinical_manifestations_of_ventilator-associated_pneumonia/links/09e415137aba33d6a9000000/Causes-of-fever-and-pulmonary-densities-in-patients-with-clinical-manifestations-of-ventilator-associated-pneumonia.pdf. Accessed on 4 December 2019. Morgenpost (2018). Grüne Plaketten: Viele Autofahrer ignorieren Umweltzonen. https://www.morgenpost.de/wirtschaft/article213618175/Gruene-Plaketten-Viele-Autofahrer-ignorieren-Umweltzonen.html Accessed 02.10.2019. Morris, D.F., and Sterner, T. (2013). Defying Conventional Wisdom: Distributional Impacts of Fuel Taxes. Mistra Indigo Policy Paper. Gothenburg: Mistra Indigo. http://indigo.ivl.se/download/18.1acdfdc8146d949da6d4b9a/1414743602551/Defying+Conventional+Wisdom+policy+paper+3.pdf. Accessed on 3 December 2019. NDTV India (2019). Shimla, The Queen Of Hills Gets 50 Electric Buses As Himachal Pradesh Accelerates Its Electric Vehicle Project. https://swachhindia.ndtv.com/queen-of-hills-gets-fifty-electric-buses-himachal-pradesh-flags-off-its-third-electric-vehicle-project-31278/. Accessed on 31 December 2019. Norwegian Institute for Public Health (2019). Public Health Report: Air pollution in Norway. Oslo. https://www.fhi.no/en/op/hin/environment/air-pollution-in-norway---public-he/. Accessed on 3 December 2019. Norwegian Ministry of Finance (2019). Proposition to the Storting (Bill and Draft Resolution) for the Fiscal Year 2019: Taxes 2019. [An unofficial English translation of Chapter 1 and 2 of Prop. 1 LS (2018-2019)]. https://www.statsbudsjettet.no/upload/Statsbudsjett_2019/dokumenter/pdf/tax_prop_1_LS_chap_1_2_eng.pdf. Accessed on 3 December 2019. Oehry, B. (2010). Critical Success Factors for Implementing Road Pricing Systems. [Prepared for the ITF/OECD Round Table of 4-5 February 2010 on Implementing Congestion Charging].

167
International Transport Forum Discussion Papers. Paris: OECD Publishing. https://www.itf-oecd.org/sites/default/files/docs/dp201003.pdf. Accessed on 30 July 2019. Organisation for Economic Co-operation and Development (OECD) (2011). Greening Household Behaviour: The Role of Public Policy. Paris. https://doi.org/10.1787/23081384. Organisation for Economic Co-operation and Development (OECD) (2014). The Cost of Air Pollution: Health Impacts of Road Transport. Paris. https://doi.org/10.1787/9789264210448-en. Organisation for Economic Co-operation and Development (OECD) (2018a). OECD Economic Surveys Indonesia: Overview. Paris. file:///Users/admin/Desktop/Indonesia-2018-OECD-economic-survey-overview.pdf. Organisation for Economic Co-operation and Development (OECD) (2018b). Effective Carbon Rates 2018: Pricing Carbon Emissions Through Taxes and Emissions Trading. Paris. https://doi.org/10.1787/9789264305304-en. Organisation for Economic Co-operation and Development (OECD) (2019a). OECD Environmental Performance Reviews: OECD Green Growth Policy Review of Indonesia 2019. Paris. https://doi.org/10.1787/1eee39bc-en. Organisation for Economic Co-operation and Development (OECD) (2019b). Indonesia’s Effort to Phase Out and Rationalise Its Fossil Fuel Subsidies: A Report on the G20 Peer Review of Inefficient Fossil-Fuel Subsidies That Encourage Wasteful Consumption in Indonesia. Paris. http://www.oecd.org/fossil-fuels/publication/G20%20peer%20review%20Indonesia_Final-v2.pdf. Accessed on 3 December 2019. Organisation for Economic Co-operation and Development (OECD) (2019c). Are Environmental Tax Policies Beneficial? Learning from Programme Evaluation Studies. Paper prepared for the Joint Meetings of Tax and Environment Experts. http://www.oecd.org/officialdocuments/publicdisplaydocumentpdf/?cote=COM/ENV/EPOC/CTPA/CFA(2018)2/FINAL&docLanguage=En. Accessed on 3 December 2019. Organisation for Economic Co-operation and Development (OECD) (2019d). The OECD Environment Statistics Database: Air Quality and Health: Exposure to PM2.5 in Countries and Regions. https://stats.oecd.org/viewhtml.aspx?datasetcode=EXP_PM2_5&lang=en. Accessed on 3 December 2019. Organisation for Economic Co-operation and Development (OECD) (n.d.). The Cost of Air Pollution. https://www.oecd.org/env/tools-evaluation/thecostofairpollution.htm. Accessed on 30 July 2019. Ostro, B. and Chestnut, L. (1994). Assessing the Health Benefits of Reducing Particulate Matter Air Pollution in the United States. Environmental Research 76(2), 94-106. https://doi.org/10.1006/enrs.1997.3799. Pemerintah Provinsi DKI Jakarta (n.d.). Amendment APBD 2019 DKI Jakarta. APBD Elektronik Pemerintah Provinsi DKI Jakarta. http://apbd.jakarta.go.id/main/pub/2019/8/1. Accessed on 30 July 2019.

168
Pertamina (2018). Daftar Harga BBK Tmt 10 Oktober 2018. https://www.pertamina.com/id/news-room/announcement/daftar-harga-bbk-tmt-10-oktober-2018. Accessed on 3 December 2019. Pertamina (2019). Daftar Harga BBK Tmt 5 Januari 2019. https://www.pertamina.com/id/news-room/announcement/daftar-harga-bbk-tmt-5-januari-2019. Accessed on 3 December 2019. Pizer, W. and Sexton, S. (2017). Distributional Impacts of Energy Taxes. NBER Working Paper No. 23318. https://www.nber.org/papers/w23318.pdf. Accessed on 3 December 2019. Pradiptyo, R., Susamto, A., Wirotomo, A. and Adisasmita, C. (2016). Financing Development with Fossil Fuel Subsidies: The Reallocation of Indonesia’s Gasoline and Diesel Subsidies in 2015. Winnipeg: The International Institute for Sustainable Development. https://www.iisd.org/sites/default/files/publications/financing-development-with-fossil-fuel-subsidies-indonesia.pdf. Accessed on 3 December 2019. Price Waterhouse Coopers (PWC) (2013). Thailand: revised excise tax calculation for motocycles. January 2013. https://customs.pwc.com/en/recent-developments/assets/th_motorcycles_excise_jan2013.pdf. Accessed 31 December 2019. Proost, S. (2018). Reforming Private and Public Urban Transport Pricing. International Transport Forum Discussion Papers. Paris: OECD Publishing. https://www.itf-oecd.org/sites/default/files/docs/private-public-urban-transport-pricing.pdf. Accessed on 3 December 2019. Public Health England (2019). Review of Interventions to Improve Outdoor Air Quality and Public Health. London. https://assets.publishing.service.gov.uk/government/uploads/system/uploads/attachment_data/file/795185/Review_of_interventions_to_improve_air_quality.pdf. Accessed on 29 August 2019. Public Health Foundation of India and Centre for Environmental Health (2017). Air pollution and health in India: A Review of the Current Evidence and Opportunities for the Future. https://www.ceh.org.in/wp-content/uploads/2017/10/Air-Pollution-and-Health-in-India.pdf. Accessed on 3 December 2019. Republic of Indonesia (2017). Indonesia: Third National Communication Under the United Nations Framework Convention on Climate Change. Jakarta. https://unfccc.int/sites/default/files/resource/8360571_Indonesia-NC3-2-Third%20National%20Communication%20-%20Indonesia%20-%20editorial%20refinement%2013022018.pdf. Accessed on 3 December 2019. Resosudarmo, Budy P. and Lucentezza Napitupulu (2004). Health and Economic Impact of Air Pollution in Jakarta. Economic Record 80(s1), S65-S75. https://doi.org/10.1111/j.1475-4932.2004.00184.x. Ricardianto, P., Gunawan, A., Suryobowono, A.A. and Hakim, A. (2018). Electronic Road Pricing 2 System Implementation: Case of Protocol Streets in Jakarta, Indonesia. International Journal of Economics, Commerce and Management 6(11), 421-437. http://ijecm.co.uk/wp-content/uploads/2018/11/61127.pdf. Accessed on 3 December 2019.

169
Rowshand, G. R., and others (2009). Impact of Air Pollution on Climate Fluctuations in Tehran City. Environ Sci 7, 173–191. Ruangkanchanasetr, S., Suepiantham, J., Chomchun, T. and Sangsajja, C. (1999). Blood lead level in Bangkok children. Journal of the Medical Association of Thailand 82(Suppl. 1), 154-161. http://www.jmatonline.com/files/journals/1/articles/3984/public/3984-13422-1-PB.pdf. Accessed on 3 December 2019. Safrudin, A. (2018). Vehicle emissions standard in Indonesia: status and roadmap. Workshop on Cleaner Fuels and Vehicles in Asia, Clean Air Week Unite Nation Conference Center, Thailand, 20 March 2018. https://cleanairasia.org/wp-content/uploads/2018/05/Ahmad-Safrudin-Vehicle-Emission-Standard-in-Indonesia.pdf. Accessed 9 December 2019. Samet, J. and Krewski, D. (2007). Health Effects Associated with Exposure to Ambient Air Pollution. Journal of Toxicology and Environmental Health, Part A: Current Issues 70(3-4), 227–242. https://doi.org/10.1080/15287390600884644. Schlegelmilch, K. (2011). Rapid Assessment on the Readiness of Indonesia Towards an Environmental Fiscal Reform for Greening the Economy. [Research conducted on behalf of Danida]. http://www.foes.de/pdf/2011-12-15-Rapid-Assessment-on-the-readiness-of-Indonesia.pdf. Accessed on 30 July 2019. Selenia (2018). Improvement of Urban Transport System in Greater Jakarta (LRT and MRT Progress). Presentation at the Capacity Building Workshop on Sustainable Urban Transport Index, September 12-13. https://www.unescap.org/sites/default/files/8.%20SUTI_Indonesia.pdf. Accessed on 15 July 2019. Setyawan, D. (2014). The Impacts of the Domestic Fuel Increases on Prices of the Indonesian Economic Sectors. Energy Procedia 47, 47-55. https://doi.org/10.1016/j.egypro.2014.01.195. Simeonova, E., Currie, J., Nilsson, P. And Walker, R. (2018). Congestion Pricing, Air Pollution and Children’s Health. NBER Working Paper No. 24410. https://www.nber.org/papers/w24410.pdf. Accessed on 3 December 2019. Sims R., R. Schaeffer, F. Creutzig, X. Cruz-Nunez, M. D’Agosto, D. Dimitriu, M.J. Figueroa Meza, L. Fulton, S. Kobayashi, O. Lah, A. McKinnon, P. Newman, M. Ouyang, J.J. Schauer, D. Sperling, and G. Tiwari (2014). Transport. In: Climate Change 2014: Mitigation of Climate Change. Contribution of Working Group III to the Fifth Assessment Report of the Intergovern- mental Panel on Climate Change [Edenhofer, O., R. Pichs-Madruga, Y. Sokona, E. Farahani, S. Kadner, K. Seyboth, A. Adler, I. Baum, S. Brunner, P. Eickemeier, B. Kriemann, J. Savolainen, S. Schlomer, C. von Stechow, T. Zwickel and J.C. Minx (eds.)]. Cambridge University Press, Cambridge, United Kingdom and New York, NY, USA. Small, K.A. and Kazimi, C. (1995). On the Costs of Air Pollution from Motor Vehicles. Journal of Transportation Economics & Policy 29(1), 7-32. https://escholarship.org/content/qt0sx81025/qt0sx81025.pdf. Accessed on 3 December 2019.
170
Statistics Indonesia (2017). Number of Motor Vehicles by Types, Indonesia 1949-2015. https://www.neliti.com/publications/51949/number-of-motor-vehicles-by-types-indonesia-1949-2015. Accessed 9 December 2019. Sterner, T. (2007). Fuel Taxes: An Important Instrument for Climate Policy. Energy Policy 35(6), 3194-3202. https://doi.org/10.1016/j.enpol.2006.10.025. Swisscontact (2006). Technical Assistance Consultant’s Report: Indonesia: Preparing the Urban Air Quality Improvement Sector Development Program (Financed by the Japan Special Fund). Mandaluyong City: Asian Development Bank and Indonesian National Development Planning Agency (BAPPENAS). https://www.adb.org/sites/default/files/project-document/66623/37301-ino-tacr.pdf. Accessed on 30 July 2019. Tempo News (2019). Regulasi Kendaraan Listrik Jadi Kado Manis HUT RI Ke 74, 17 August. https://otomotif.tempo.co/read/1236984/regulasi-kendaraan-listrik-jadi-kado-manis-hut-ri-ke-74/full&view=ok. Accessed August 2019. Times of India (2019). ECC fund for e-buses, can’t spare for RRTS: Delhi government. 18 February 2019. https://timesofindia.indiatimes.com/city/delhi/govt-ecc-fund-for-e-buses-cant-spare-for-rrts/articleshow/68054742.cms. Accessed on 17 December 2019. Timilsina, G.R. and Dulal, H.B. (2008). Fiscal Policy Instruments for Reducing Congestion and Atmospheric Emissions in the Transport Sector: A Review. World Bank Policy Research Working Paper 4652. https://www.researchgate.net/profile/Hari_Dulal2/publication/23550583_Fiscal_policy_instruments_for_reducing_congestion_and_atmospheric_emissions_in_the_transport_sector_a_review/links/09e4150c7f48a9fd0b000000/Fiscal-policy-instruments-for-reducing-congestion-and-atmospheric-emissions-in-the-transport-sector-a-review.pdf. Accessed on 4 December 2019. The Insider Stories (2019). Widodo: Jakarta Integrated Transportation Need Funds US$42T. https://theinsiderstories.com/widodo-jakarta-integrated-transportation-need-funds-us42t/ . Accessed on 31 December 2019. Tomonews (2019). NGO Filing Lawsuit Against the DKI Jakarta Government. [online video]. 7 July. https://www.youtube.com/watch?v=DYdDYCbA5oA. Accessed on 30 July 2019. Tonne, C., Beevers, S., Armstrong, B., Kelly, F. and Wilkinson, P. (2008). Air Pollution and Mortality Benefits of the London Congestion Charge: Spatial and Socioeconomic Inequalities. Occupational and Environmental Medicine 65(9), 620-627. https://doi.org/10.1136/oem.2007.036533. Tribunnews (2018). Harga BBM Naik, Pemda Diminta Turunkan Pajak Bahan Bakar. https://www.tribunsnews.com/nasional/2018/03/30/harga-bbm-naik-pemda-diminta-turunkan-pajak-bahan-bakar (link no longer functioning). Accessed August 2019. Tsai, P.L. and Hatfield, T.H. (2011). Global benefits from the phaseout of leaded fuel. Journal of Environmental Health 74 (5) 8-14. Sinaga, A., Jinca, A., Aniisah, S., Suryobuwono, A., Mahalana, A. (forthcoming). Assessing the impact of transport sector pricing policies on reducing greenhouse gas emissions in Indonesia.

171
A policy assessment framework report of the Initiative for Climate Action Transparency. Trisakti Institute of Transport and Logistic (ITL Trisakati). Tsai, S.S., Chiu, H.F., Liou, S.H. and Yang, C.Y. (2014). Short-Term Effects of Fine Particulate Air Pollution on Hospital Admissions for Respiratory Diseases: A Case-Crossover Study in a Tropical City. Journal of Toxicology and Environmental Health, Part A: Current Issues 77(18), 1091–1101. https://doi.org/10.1080/15287394.2014.922388. Tsangari, H. Paschalidou, A.K., Kassomenos, A.P., Vardoulakis, S., Heaviside, C., Georgiou, K.E., et al. (2016). Extreme Weather and Air Pollution Effects on Cardiovascular and Respiratory Hospital Admissions in Cyprus. Science of the Total Environment 542(Part A), 247-253. https://doi.org/10.1016/j.scitotenv.2015.10.106. UK Office of National Statistics (2018). Five facts about environmental taxes. https://www.ons.gov.uk/economy/environmentalaccounts/articles/fivefactsaboutenvironmentaltaxes/2018-10-09. Accessed on 9 December 2019. Umweltbundesamt (2017). Analyse der Wirksamkeit von Umweltzonen in drei deutschen Städten: Berlin, München und Augsburg: Endbericht. Texte 46/2017. Dessau-Roßlau. https://www.umweltbundesamt.de/sites/default/files/medien/1410/publikationen/2017-06-01_texte_46-2017_umweltzonenwirksamkeit.pdf. Accessed on 4 December 2019. United Nations Environment Programme (UNEP) (2015). Air Quality Policies in Indonesia. https://wedocs.unep.org/bitstream/handle/20.500.11822/17217/Indonesia.pdf?sequence=1&isAllowed=y. Accessed on 30 July 2019. United Nations Environment Programme (UNEP) (2019). Asia charged up: measuring costs and benefits of shifting to electric mobility. Clean air solutions: webinar series #2. Powerpoint presentation. Unpublished United Nations Environment Programme (UNEP) and World Health Organization (WHO) (2009). Healthy Transport in Developing Cities. Geneva: WHO. https://www.who.int/heli/risks/urban/transportpolicybrief2010.pdf?ua=1. Accessed on 4 December 2019. USDA Foreign Agricultural Service (2019). Indonesia Biofuels Annual Report 2019. https://apps.fas.usda.gov/newgainapi/api/report/downloadreportbyfilename?filename=Biofuels%20Annual_Jakarta_Indonesia_8-9-2019.pdf. Accessed 31 December 2019. van Dender, K. (2019). Taxing Vehicles, Fuels and Road Use: Opportunities for Improving Transport Tax Practice. OECD Taxation Working Papers No. 44. Paris: OECD Publishing. https://doi.org/10.1787/22235558. Victoria Transport Policy Institute (2019). Understanding Transport Demand and Elasticities: How Prices and other Factors Affect Travel Behavior. Victoria. https://www.vtpi.org/elasticities.pdf. Accessed on 4 December 2019. Wappelhorst, S., Mock, P. and Yang, Z. (2018). Using Vehicle Taxation Policy to Lower Transport Emissions: An Overview for Passenger Cars In Europe. Wilmington, DE: The International Council on Clean Transportation. https://theicct.org/sites/default/files/publications/EU_vehicle_taxation_Report_20181214_0.pdf. Accessed on 28 August 2019.

172
Wismadi, A., Soemardjito, J. and Sutomo, H. (2013). Transport Situation in Jakarta. In Study on Energy Efficiency Improvement in the Transport Sector through Transport Improvement and Smart Community Development in the Urban Area. [ERIA Research Project Report 2012-29]. Kutani, I. (ed.). Jakarta: Economic Research Institute for ASEAN and East Asia (ERIA). Chapter 4. 29-58. http://www.eria.org/RPR_FY2012_No.29_Chapter_4.pdf. Accessed on 30 July 2019. Withana, S. (2015). Overcoming Obstacles to Green Fiscal Reform. Paper presented at the Green Growth Knowledge Platform (GGKP)’s Third Annual Conference. Venice, January. http://www.greengrowthknowledge.org/sites/default/files/Withana_Overcoming_obstacles_to_green_fiscal_reform.pdf. Accessed on 30 July 2019. World Bank (2014). World Bank and Environment in Indonesia, August. https://www.worldbank.org/en/country/indonesia/brief/world-bank-and-environment-in-indonesia. Accessed on 30 July 2019. World Bank (2015). Indonesia’s Fire and Haze Crisis, November. http://www.worldbank.org/en/news/feature/2015/12/01/indonesias-fire-and-haze-crisis. Accessed on October 2019. World Bank (2019a). State and Trends of Carbon Pricing 2019. Washington, DC. http://documents.worldbank.org/curated/en/191801559846379845/pdf/State-and-Trends-of-Carbon-Pricing-2019.pdf. Accessed on 4 December 2019. World Bank (2019b). Using Carbon Revenues. Washington, DC. https://openknowledge.worldbank.org/bitstream/handle/10986/32247/UsingCarbonRevenues.pdf?sequence=7&isAllowed=y. Accessed on 4 December 2019. World Bank (2019c). Tax revenue (% of GDP) – Indonesia, South Asia, Malaysia, Thailand, Vietnam. https://data.worldbank.org/indicator/GC.TAX.TOTL.GD.ZS?locations=ID-8S-MY-TH-VN. Accessed 9 December 2019. World Bank and Institute for Health Metrics and Evaluation (2016). The Cost of Air Pollution: Strengthening the Economic Case for Action. Washington, DC: World Bank. http://documents.worldbank.org/curated/en/781521473177013155/pdf/108141-REVISED-Cost-of-PollutionWebCORRECTEDfile.pdf. Accessed on 30 July 2019. World Health Organization (WHO) (2014). Burden of Disease from Ambient Air Pollution for 2012: Summary of Results. http://www.who.int/phe/health_topics/outdoorair/databases/AAP_BoD_results_March2014.pdf. Accessed on 4 December 2019. World Health Organization (WHO) (2016). Public Health, Environmental and Social Determinants of Health (PHE): WHO Global Urban Ambient Air Pollution Database. https://www.who.int/phe/health_topics/outdoorair/databases/cities/en/. Accessed on 30 July 2019. World Health Organization (WHO) (2018a). 9 Out of 10 People Worldwide Breathe Polluted Air, but More Countries are Taking Action, May. Accessed on 27 November 2019. World Health Organization (WHO) (2018b). World Health Statistics 2018: Monitoring Health for the SDGs, Sustainable Development Goals. Geneva.

173
https://apps.who.int/iris/bitstream/handle/10665/272596/9789241565585-eng.pdf?ua=1. Accessed on 27 November 2019. World Health Organization (WHO) (2018c). 9 Out of 10 People Worldwide Breathe Polluted Air, but More Countries are Taking Action, May. https://www.who.int/news-room/detail/02-05-2018-9-out-of-10-people-worldwide-breathe-polluted-air-but-more-countries-are-taking-action. Accessed on 27 November 2019. World Health Organization (WHO) (2019). Key facts of Ambient (outdoor) air quality and health. https://www.who.int/news-room/fact-sheets/detail/ambient-%28outdoor%29-air-quality-and-health . Accessed September 2019. World Health Organization (WHO) (n.d. a). Air Pollution: Ambient Air Pollution - A Major Threat to Health and Climate. https://www.who.int/airpollution/ambient/en/. Accessed on 25 November 2019. World Health Organization (WHO) (n.d. b) Air Pollution: Ambient Air Pollution: Pollutants. https://www.who.int/airpollution/ambient/pollutants/en/. Accessed on 4 December 2019. World Health Organization (WHO) Western Pacific (n.d.). Seoul’s Challenges and Achievements for an Environmentally Sustainable Healthy Urban Transport System. http://www.wpro.who.int/environmental_health/documents/docs/SeoulReportonESHUT.pdf. Accessed on 4 December 2019. Wu, Y. and Zhang, L. (2017). Can the Development of Electric Vehicles Reduce the Emission of Air Pollutants and Greenhouse Gases in Developing Countries? Transportation Research Part D: Transport and Environment 51, 129-145. https://doi.org/10.1016/j.trd.2016.12.007. Yang, Z. (2018). Practical Lessons in Vehicle Efficiency Policy: The 10-Year Evolution of France's CO2-Based Bonus-Malus (Feebate) System, March. ICCT blog. https://theicct.org/blog/staff/practical-lessons-vehicle-efficiency-policy-10-year-evolution-frances-co2-based-bonus. Accessed on 4 December 2019. Yang, Z., Wang, H., Shao, Z. and Muncrief, R. (2015). Review of Beijing’s Comprehensive Motor Vehicle Control Programs. ICCT White Paper. https://theicct.org/sites/default/files/publications/Beijing_Emission_Control_Programs_201511%20.pdf. Accessed on 4 December 2019. Zhang, Y., Wang, S.G., Ma, Y.X., Shang, K.Z., Cheng, Y.F., Li, X., et al. (2015). Association Between Ambient Air Pollution and Hospital Emergency Admissions for Respiratory and Cardiovascular Diseases in Beijing: A Time Series Study. Biomedical and Environmental Sciences 28(5), 352–363. https://doi.org/10.3967/bes2015.049.