fiscal policy for growth - institute of policy studies of
TRANSCRIPT

Sri Lanka
State of the Economy Report 2016
Chapter 4 Fiscal Policy for Growth: Sustainable Financing
for Development
by
Raveen Ekanayake & Kithmina Hewage

STATE OF THE ECONOMY 2016
58
Sri Lanka's public finances are at a perilous
state. Already weakened by years of low
revenue growth and high external debt
to fund a public investment-led growth process,
systemic weaknesses coalesced in 2015 to put
the country on the cusp of falling into a public
debt triggered economic crisis. A ballooning
fiscal deficit and excessive public debt
accumulation has resulted in a rising debt
service burden; the conduct of monetary policy
and exchange rate management has been
compromised in attempts to deal with the fallout
of funding the fiscal deficit gap. A serious BOP
crisis has been averted, at least temporarily for
now, with the inevitable decision to seek
assistance from the IMF in its role as 'lender of
last resort'.
The risks to stability on the macroeconomic
front and growth prospects are high. Indeed,
Sri Lanka's post-independence history is dotted
with a failure to generate surpluses in public
finances, leading to structural deficits and
ingrained systemic weaknesses. Not
surprisingly, fiscal indiscipline and weak
institutional quality has led successive
governments to accumulate unsustainably
high-levels of public debt. From 2010, as the
country entered the ranks of a low middle-
income economy, this increasingly took the form
of high levels of foreign borrowing from external
capital markets. The high-risk strategy failed
abysmally to give the necessary attention to
domestic resource mobilization efforts, with the
country's revenue-to-GDP ratio in free fall over
the years.
Fiscal policy reforms are fundamentally vital for
Sri Lanka to navigate through this impending
crisis. At the outset, public expenditure needs
to be rationalized by diverting resources away
from loss-making public entities and towards
investments with high economic returns.
Simultaneously, the government's revenue
mobilizing framework should be re-evaluated
in view of broadening the revenue base and
maximizing revenue potential. Only
fundamental reforms to public finances will
guarantee a measure of macroeconomic
stability and improved growth outlook.
Against this backdrop, this chapter examines
the trends and patterns of Sri Lanka's fiscal
policy agenda and identifies avenues for
potential reform. At the outset, the chapter
establishes an analytical framework to identify
areas of fiscal policy reform within the context
of a developing economy. An overview of Sri
Lanka's fiscal position is followed by an analysis
of public spending and revenue patterns.
Finally, the chapter briefly discusses some key
areas of potential policy intervention.
4. Fiscal Policy for Growth: Sustai-nable Financing for Development4.1 Introduction
STATE OF THE ECONOMY 2016
59
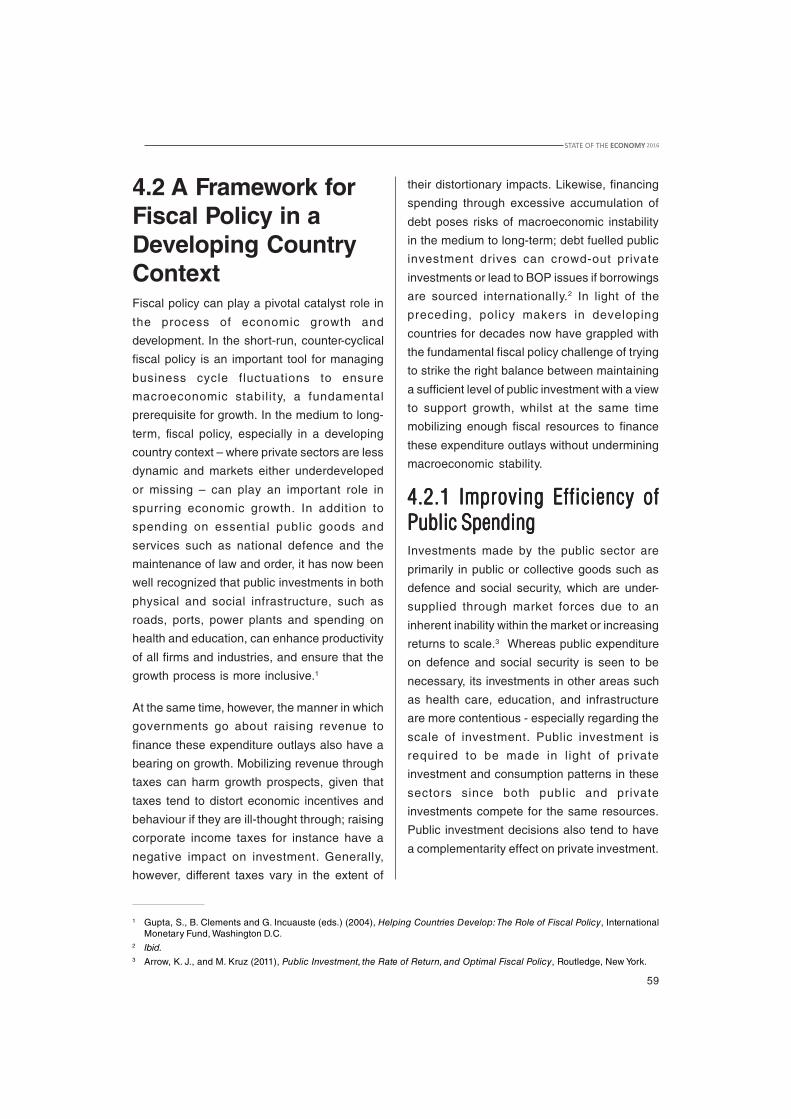
4.2 A Framework forFiscal Policy in aDeveloping CountryContextFiscal policy can play a pivotal catalyst role in
the process of economic growth and
development. In the short-run, counter-cyclical
fiscal policy is an important tool for managing
business cycle fluctuations to ensure
macroeconomic stability, a fundamental
prerequisite for growth. In the medium to long-
term, fiscal policy, especially in a developing
country context – where private sectors are less
dynamic and markets either underdeveloped
or missing – can play an important role in
spurring economic growth. In addition to
spending on essential public goods and
services such as national defence and the
maintenance of law and order, it has now been
well recognized that public investments in both
physical and social infrastructure, such as
roads, ports, power plants and spending on
health and education, can enhance productivity
of all firms and industries, and ensure that the
growth process is more inclusive.1
At the same time, however, the manner in which
governments go about raising revenue to
finance these expenditure outlays also have a
bearing on growth. Mobilizing revenue through
taxes can harm growth prospects, given that
taxes tend to distort economic incentives and
behaviour if they are ill-thought through; raising
corporate income taxes for instance have a
negative impact on investment. Generally,
however, different taxes vary in the extent of
their distortionary impacts. Likewise, financing
spending through excessive accumulation of
debt poses risks of macroeconomic instability
in the medium to long-term; debt fuelled public
investment drives can crowd-out private
investments or lead to BOP issues if borrowings
are sourced internationally.2 In light of the
preceding, policy makers in developing
countries for decades now have grappled with
the fundamental fiscal policy challenge of trying
to strike the right balance between maintaining
a sufficient level of public investment with a view
to support growth, whilst at the same time
mobilizing enough fiscal resources to finance
these expenditure outlays without undermining
macroeconomic stability.
4.2.1 Improving Efficiency of4.2.1 Improving Efficiency of4.2.1 Improving Efficiency of4.2.1 Improving Efficiency of4.2.1 Improving Efficiency ofPublic SpendingPublic SpendingPublic SpendingPublic SpendingPublic SpendingInvestments made by the public sector are
primarily in public or collective goods such as
defence and social security, which are under-
supplied through market forces due to an
inherent inability within the market or increasing
returns to scale.3 Whereas public expenditure
on defence and social security is seen to be
necessary, its investments in other areas such
as health care, education, and infrastructure
are more contentious - especially regarding the
scale of investment. Public investment is
required to be made in l ight of private
investment and consumption patterns in these
sectors since both public and private
investments compete for the same resources.
Public investment decisions also tend to have
a complementarity effect on private investment.
1 Gupta, S., B. Clements and G. Incuauste (eds.) (2004), Helping Countries Develop: The Role of Fiscal Policy, InternationalMonetary Fund, Washington D.C.
2 Ibid.3 Arrow, K. J., and M. Kruz (2011), Public Investment, the Rate of Return, and Optimal Fiscal Policy, Routledge, New York.

STATE OF THE ECONOMY 2016
60
The presumed effect of government spending
on economic growth can occur through its
influence on consumption, investment, and
transfer payments. The neo-classical school of
thought argues that a shock to government
consumption generates negative wealth
effects.4 It is argued that high levels of
government spending lead to high levels of
taxation, which consequently leads to
households feeling poor. The impact on the
representative household, in this instance,
leads to an increase in labour supply, reducing
consumption and lowering real wages.
Contrastingly, neo-Keynesian thought posits
that government spending causes an outward
shift in the demand for goods, due to the
presence of nominal rigidities, or
countercyclical mark-ups.5 Moreover,
government spending is also seen as a positive
influencer on growth due to increasing returns
to scale.6
Macroeconomic stability is an essential
prerequisite for strong and lasting growth, both
in developed as well as developing countries.
Unviable feasible fiscal policy measures that
result in high levels of public debt hamper
growth by increasing uncertainty, over-taxation,
crowding out private investment, and
weakening a country's resilience to shocks. As
growth friendly reforms require fiscal space,
revenue measures should ideally focus on
broadening the tax base and minimizing
distortions, while expenditure measures should
aim at rationalizing spending and improving
efficiency.7
Unlike industrialized economies, the budgets
of developing economies are typically smaller
(as shares of GDP). Moreover, while most of
their revenue is gained through indirect taxes,
the biggest share of government spending is
accounted through the consumption of goods
and services. Among spending on public goods
and services, payment of public sector wages
accounts for a significant proportion. The
effectiveness of public spending is heavily
dependent on its composition and developing
countries are often seen to misallocate
resources, whereby seemingly productive
expenditure may become unproductive due to
an excessive amount of them.8
Public spending on infrastructure, education,
health, and pensions play an important role in
determining the developmental impact of fiscal
policy. Infrastructure spending can occur as
recurrent expenditure, directly through the
government budget or as part of an investment
made by an SOE. Public investment in
infrastructure considers two components that
have diverging relationships with each other.
The rationalization of public finances for public
goods such as roads is wholly different to that
of the utility subsector and travel infrastructure
such as railways. For utilities, the basic public
finance commitment should be to: (i)
compensate for operational expenses that
cannot be funded by tariffs - namely, public
service obligations and essential service to
users genuinely unable to pay, and (ii) create
fiscal space for necessary investments where
4 Baxter, M., and R. King (1993), “Fiscal Policy in General Equilibrium”, American Economic Review, 83(3).5 Perotti, R. (2007), “Fiscal Policy in Developing Countries: A Framework and Some Questions”, World Bank, Washington D.C.6 Devereux, M. B., et al. (1996), “Monopolistic Competition, Increasing Returns, and the Effects of Government Spending”,
Journal of Money, Credit and Banking , 28(2).7 IMF (2015), Fiscal Policy and Long-Term Growth, International Monetary Fund, Washington D.C.8 Devarajan, S., et al. (1996), “The Composition of Public Expenditure and Economic Growth”, Journal of Monetary Economics,
37(2).

STATE OF THE ECONOMY 2016
61
these also cannot be covered by tariffs, ideally
through medium or long-term loans to be repaid
by the util ity revenues, or through loan
guarantees.9 However, the inability of service
providers to achieve commercial viability leads
to governments assuming even more, and often
unsustainable, financial commitments.
For example, some studies note that public
investment in transport and communications in
developing countries leads to higher economic
growth.10 Similarly, others find that higher
infrastructure quantity and quality reduces
income inequality.11 Comparatively, these
positive effects of infrastructure investments and
economic growth are more pronounced in
developing countries than in developed
countries. However it is important to note that
the positive effect on a country's developmental
prospects is dependent on investing in
infrastructure that can have high rates of return
for the investment. Infrastructure spending on
non-viable or 'white elephant' projects may
increase the financial burden of governments
to unsustainable levels, and reduce the scope
for more efficient public investments as well.
Public investment in the education sector is
universally considered to be positively
associated with economic growth. For example,
across countries, more schooling is observed
to result in higher individual earnings, with a
rate of return of approximately 10 per cent per
additional year of schooling.12 In addition to
private returns of investment in education,
positive externalities associated with a more
educated citizenry leads to positive social
returns as well. Improvements in education
levels are seen to reduce crime rates, improve
health standards, and increase labour force
participation.13
Moreover, investment in education affects
labour productivity, improve an economy's
innovative capacity, and increase the ability to
replicate technology created abroad.14
However, returns of public investment in
education are not wholly dependent on
continued increases in spending, but rather,
focus on efficient spending. Middle-income
countries, in particular, require investments in
education that fulfill the needs of the economy
that bridge the skills gap between demand and
supply of labour.15 In addition to efficiency, the
inter-sectoral allocation of public spending,
private education spending, and governance
are also considered to be influential factors in
influencing the link between public investment
in education and education outcomes.16
9 Ibid.10 Easterly, W., and S. Rebelo (1993), Fiscal Policy and Economic Growth: An Empirical Investigation, National Bureau of
Economic Research, Cambridge.11 Serven, L., and C. Calderon (2004), The Effects of Infrastructure Development on Growth and Income Distribution, World
Bank, Washington D.C.12 Psacharopoulos, G., and H.A. Patrinos (2004), “Returns to Investment in Education: A Further Update”, Education Economics,
12(2).13 See Lochner, L., and E. Moretti (2004), “The Effect of Education on Crime: Evidence from Prison Inmates, Arrests, and Self-
Reports”, American Economic Review , 94(1); Currie, J., & Moretti, E. (2003), “Mother’s Education and the IntergenerationalTransmission of Human Capital: Evidence from College Openings”, The Quarterly Journal of Economics, 118(4); Bowen, W. G.,and T.A. Finegan (2015), The Economics of Labour Force Participation, Princeton University Press, Princeton.
14 Hanushek, E. A., and L. Wössmann (2007), Education Quality and Economic Growth, World Bank, Washington D.C.15 Eichengreen, B., et al. (2013), Growth Slowdowns Redux: New Evidence on the Middle-Income Trap, The National Bureau of
Economic Research, Cambridge.16 Abu-Ghaida, D. (2007), “Education”, in C. Gray, et al., Fiscal Policy and Economic Growth: Lessons for Eastern Europe and
Central Asia, World Bank, Washington D.C.
STATE OF THE ECONOMY 2016
62
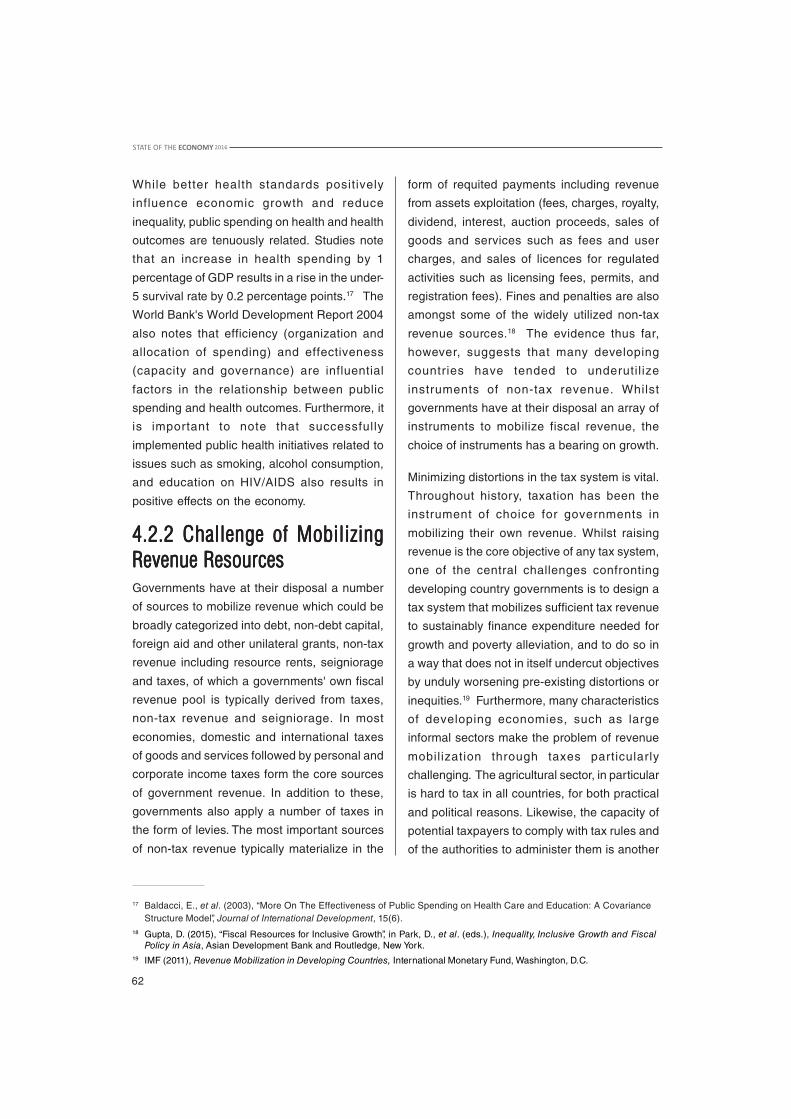
While better health standards positively
influence economic growth and reduce
inequality, public spending on health and health
outcomes are tenuously related. Studies note
that an increase in health spending by 1
percentage of GDP results in a rise in the under-
5 survival rate by 0.2 percentage points.17 The
World Bank's World Development Report 2004
also notes that efficiency (organization and
allocation of spending) and effectiveness
(capacity and governance) are influential
factors in the relationship between public
spending and health outcomes. Furthermore, it
is important to note that successfully
implemented public health initiatives related to
issues such as smoking, alcohol consumption,
and education on HIV/AIDS also results in
positive effects on the economy.
4.2.2 Challenge of Mobilizing4.2.2 Challenge of Mobilizing4.2.2 Challenge of Mobilizing4.2.2 Challenge of Mobilizing4.2.2 Challenge of MobilizingRevenue ResourcesRevenue ResourcesRevenue ResourcesRevenue ResourcesRevenue ResourcesGovernments have at their disposal a number
of sources to mobilize revenue which could be
broadly categorized into debt, non-debt capital,
foreign aid and other unilateral grants, non-tax
revenue including resource rents, seigniorage
and taxes, of which a governments' own fiscal
revenue pool is typically derived from taxes,
non-tax revenue and seigniorage. In most
economies, domestic and international taxes
of goods and services followed by personal and
corporate income taxes form the core sources
of government revenue. In addition to these,
governments also apply a number of taxes in
the form of levies. The most important sources
of non-tax revenue typically materialize in the
form of requited payments including revenue
from assets exploitation (fees, charges, royalty,
dividend, interest, auction proceeds, sales of
goods and services such as fees and user
charges, and sales of licences for regulated
activities such as licensing fees, permits, and
registration fees). Fines and penalties are also
amongst some of the widely utilized non-tax
revenue sources.18 The evidence thus far,
however, suggests that many developing
countries have tended to underutil ize
instruments of non-tax revenue. Whilst
governments have at their disposal an array of
instruments to mobilize fiscal revenue, the
choice of instruments has a bearing on growth.
Minimizing distortions in the tax system is vital.
Throughout history, taxation has been the
instrument of choice for governments in
mobilizing their own revenue. Whilst raising
revenue is the core objective of any tax system,
one of the central challenges confronting
developing country governments is to design a
tax system that mobilizes sufficient tax revenue
to sustainably finance expenditure needed for
growth and poverty alleviation, and to do so in
a way that does not in itself undercut objectives
by unduly worsening pre-existing distortions or
inequities.19 Furthermore, many characteristics
of developing economies, such as large
informal sectors make the problem of revenue
mobilization through taxes particularly
challenging. The agricultural sector, in particular
is hard to tax in all countries, for both practical
and political reasons. Likewise, the capacity of
potential taxpayers to comply with tax rules and
of the authorities to administer them is another
17 Baldacci, E., et al. (2003), “More On The Effectiveness of Public Spending on Health Care and Education: A CovarianceStructure Model”, Journal of International Development, 15(6).
18 Gupta, D. (2015), “Fiscal Resources for Inclusive Growth”, in Park, D., et al. (eds.), Inequality, Inclusive Growth and FiscalPolicy in Asia, Asian Development Bank and Routledge, New York.
19 IMF (2011), Revenue Mobilization in Developing Countries, International Monetary Fund, Washington, D.C.
STATE OF THE ECONOMY 2016
63
challenge. Moreover, many of them are
themselves likely to be affected by the tax
system in force. For instance, heavy taxation of
the formal sector will tend to encourage growth
of the informal sector, and an inappropriate tax
design may provide further opportunities for
corruption.20 All these features constrain
effective taxation. Different taxes vary in terms
of their long-term efficiency and equity effects.
As such employing the right mix of tax
instruments to suit individual country
characteristics are critical to ensure that the tax
system generates sufficient revenue at
minimum costs.
Another important aspect to be kept in mind is
the growth and distributional effects of taxes.
As noted earlier, taxes tend to distort economic
incentives and behaviour. Any change in the
taxation system would require a change in the
base or rate of some taxes. Firms and
households would then respond by shifting
resources from highly taxed activities to lesser
taxed ones. When market prices reflect social
costs and benefits reasonably well, this poses
a trade-off between revenue and efficiency.
Sometimes market prices may not reflect social
costs and benefits; taxes can then improve the
allocation of resources, but only if market
imperfections can be quantified so as to guide
the design of the tax structure. As a rule, the
economic cost of taxation increases more than
proportionately with the rate of taxation. The
narrower the base, the higher the tax rate will
have to be to generate a given amount of
revenue. This is one of the strongest arguments
in favour of broad based taxes.21
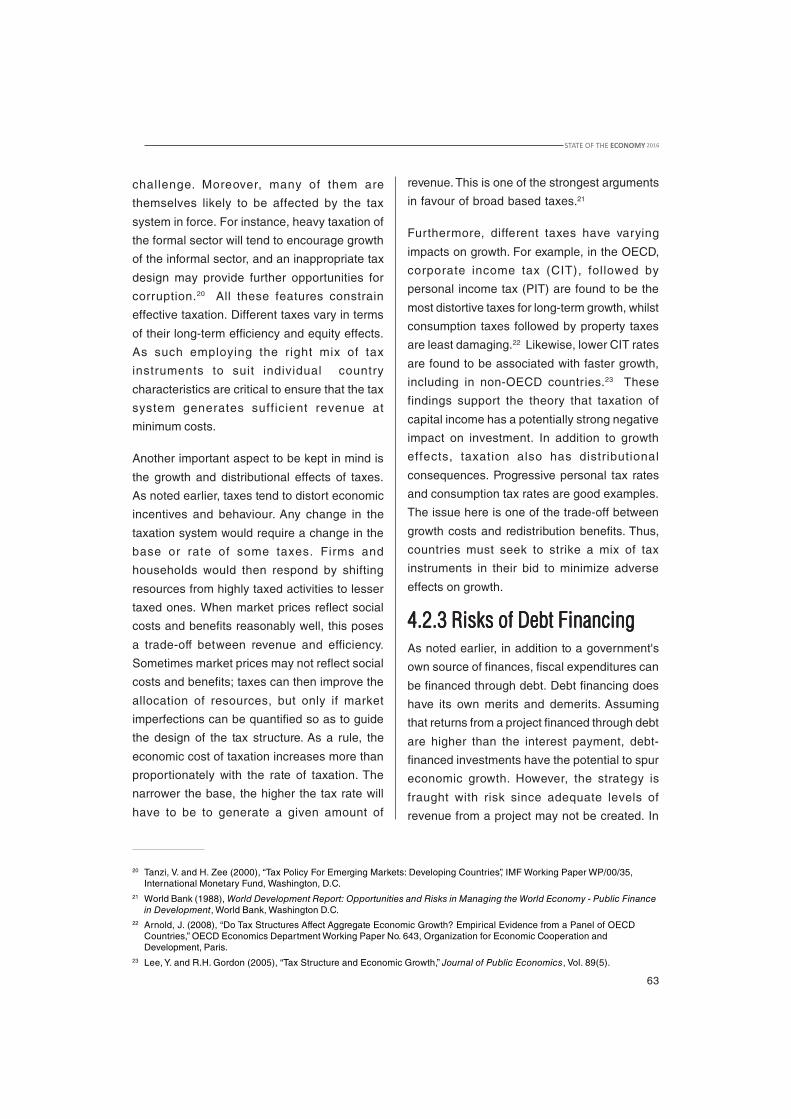
Furthermore, different taxes have varying
impacts on growth. For example, in the OECD,
corporate income tax (CIT), followed by
personal income tax (PIT) are found to be the
most distortive taxes for long-term growth, whilst
consumption taxes followed by property taxes
are least damaging.22 Likewise, lower CIT rates
are found to be associated with faster growth,
including in non-OECD countries.23 These
findings support the theory that taxation of
capital income has a potentially strong negative
impact on investment. In addition to growth
effects, taxation also has distributional
consequences. Progressive personal tax rates
and consumption tax rates are good examples.
The issue here is one of the trade-off between
growth costs and redistribution benefits. Thus,
countries must seek to strike a mix of tax
instruments in their bid to minimize adverse
effects on growth.
4.2.3 Risks of Debt Financing4.2.3 Risks of Debt Financing4.2.3 Risks of Debt Financing4.2.3 Risks of Debt Financing4.2.3 Risks of Debt FinancingAs noted earlier, in addition to a government's
own source of finances, fiscal expenditures can
be financed through debt. Debt financing does
have its own merits and demerits. Assuming
that returns from a project financed through debt
are higher than the interest payment, debt-
financed investments have the potential to spur
economic growth. However, the strategy is
fraught with risk since adequate levels of
revenue from a project may not be created. In
20 Tanzi, V. and H. Zee (2000), “Tax Policy For Emerging Markets: Developing Countries”, IMF Working Paper WP/00/35,International Monetary Fund, Washington, D.C.
21 World Bank (1988), World Development Report: Opportunities and Risks in Managing the World Economy - Public Financein Development, World Bank, Washington D.C.
22 Arnold, J. (2008), “Do Tax Structures Affect Aggregate Economic Growth? Empirical Evidence from a Panel of OECDCountries,” OECD Economics Department Working Paper No. 643, Organization for Economic Cooperation andDevelopment, Paris.
23 Lee, Y. and R.H. Gordon (2005), “Tax Structure and Economic Growth,” Journal of Public Economics, Vol. 89(5).

STATE OF THE ECONOMY 2016
64
addition, it is particularly important to note that
high public debt has a tendency to hamper
growth given that it increases uncertainty over
future taxation, leading to a crowding out of
private investment, and weakening a country's
resilience to shocks.
Theoretical literature on the relationship
between the stock of external debt and growth
has largely focused on the adverse effects of
'debt overhang'. Debt overhang is defined as a
situation where the expected repayment on
external debt falls short of the contractual value
of debt.24 If a country's debt level is expected to
exceed its repayment ability with some
probability in the future, expected debt service
is likely to be an increasing function of the
country's output level. Thus, some of the returns
from investing in the domestic economy are
effectively 'taxed away' by existing foreign
creditors, and investment by domestic and
foreign investors - and thus economic growth -
is discouraged.25
Figure 4.1Fiscal Deficits and Public Debt
Governmentrevenuemobilizationefforts havefailed to evenadequatelycover publicrecurrentexpenditureneeds, letalone capitalinvestmentrequirements.
Source: Estimated using data from Ministry of Finance and Planning, AnnualReport, Colombo, various years.
Figure 4.2Revenue and Expenditure
24 Krugman, P. (1988), “Financing vs. Forgiving a Debt Overhang”, National Bureau of Economic Research Working Paper No.2486, Cambridge.
25 IMF (2011), Revenue Mobilization in Developing Countries, International Monetary Fund, Washington D.C.
% o
f GD
P
Public debtPrimary deficitOverall deficit
Capital expenditureRecurrent expenditureRevenue
Per
cent
of G
DP
2001 2002 2003 2004 2005 2006 2007 2008 2009 2010 2011 2012 2013 2014 2015

STATE OF THE ECONOMY 2016
65
Debt overhang also depresses investment and
growth by increasing uncertainty. As the size of
the public debt increases, there will be growing
uncertainty about actions and policies that the
government will resort to in order to meet its
debt servicing obligations, with adverse effects
on investment. In particular, as the stock of
public sector debt increases, there may be
expectations that the government's debt service
obligations will be financed by distortionary
measures. External debt service (in contrast to
the total debt stock) can also potentially affect
growth by crowding out private investment or
altering the composition of public spending.
Other things being equal, higher debt service
can raise the government's interest bill and the
budget deficit, reducing public savings; this, in
turn, may either raise interest rates or crowd
out credit available for the private investment,
dampening economic growth. Higher debt
service payments can also have adverse effects
on the composition of public spending by
squeezing the amount of resources available
for infrastructure and human capital, with
negative effects on growth.
Amidst extensive research on debt and growth,
there is no consensus on the optimal level of
public debt. Yet, numerous studies recognize
that a nonlinear relationship between debt and
growth exists. Increases in debt at a higher level
tend to affect growth more negatively than the
same debt increase at a lower level of debt. In
their seminal study, Reinhart and Rogoff (2010)
find that countries with debt above 90 per cent
of GDP experience significant weakening of
growth.26 Other studies also find similar
nonlinearity at the same level of debt.27
4.3 Overview of SriLanka's Fiscal PositionThroughout Sri Lanka's post-independence
history, successive Sri Lankan governments
have racked up unsustainable fiscal deficits.
The implementation of the Accelerated
Mahaweli Development Project during the
period 1978-1983, in tandem with the first wave
of economic reforms, saw the fiscal deficit
balloon into unsustainably high double-digit
levels, where the deficit peaked to 19.2 per cent
in 1980. The second highest deficit of 12.7 per
cent was recorded in 1988, which marked the
commencement of a fiscal stabilization
programme under a second wave of economic
reforms. Despite some improvements as shown
in Figure 4.1, deficits have continued to
average 7-8 per cent of GDP with knock-on
effects on other critical areas of macroeconomic
policy management, most notably fuelling high
and volatile rates of inflation. With rising fiscal
imbalances, the country's indebtedness also
rose - peaking most recently at 105 per cent of
GDP in 2002 - narrowing the options for policy
manoeuverability and limiting the ability to
respond appropriately to domestic and external
shocks.
Figure 4.1 also shows that the government has
been a continuous dis-saver, running primary
deficits in the range of 2-3 per cent of GDP. This
reflects the fact that government revenue
mobilization efforts have failed to even
adequately cover public recurrent expenditure
needs, let alone capital investment
requirements (Figure 4.2).
26 Reinhart, C. M., and K.S. Rogoff (2010), Growth in a Time of Debt, National Bureau of Economic Research, Cambridge.27 Kumar, M. S., and J. Woo (2010), Public Debt and Growth, International Monetary Fund, Washington D.C.
STATE OF THE ECONOMY 2016
66
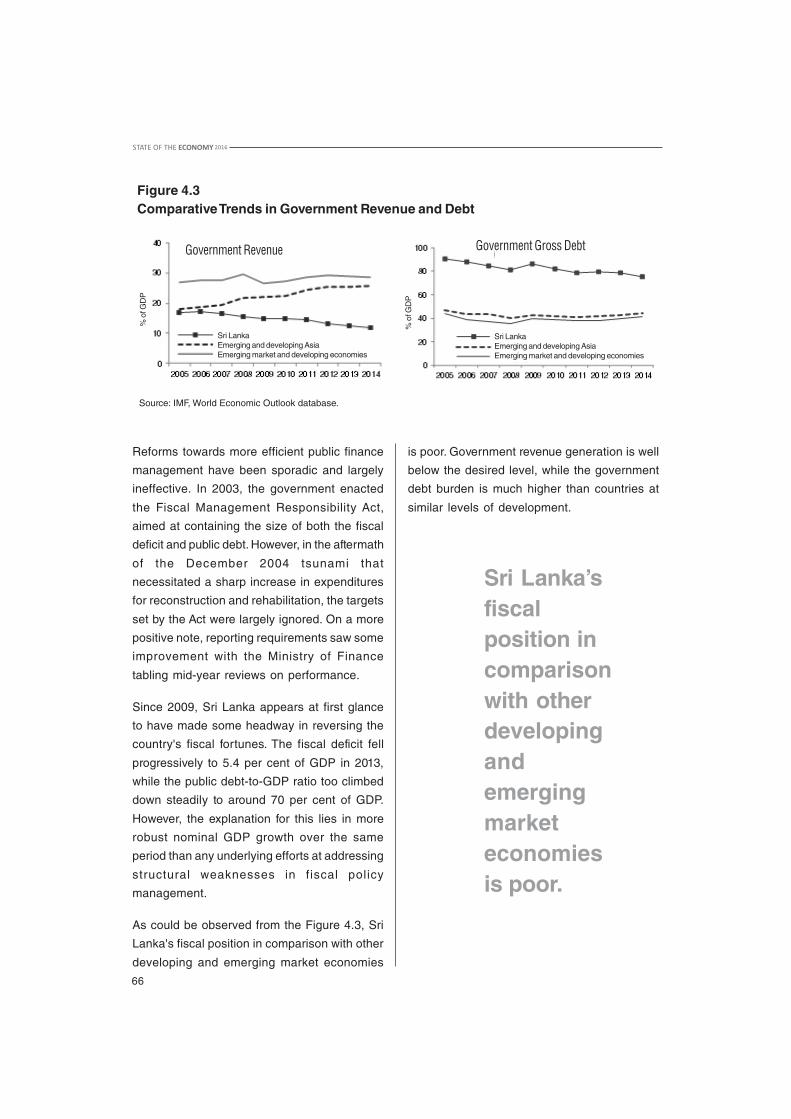
Figure 4.3Comparative Trends in Government Revenue and Debt
Source: IMF, World Economic Outlook database.
Reforms towards more efficient public finance
management have been sporadic and largely
ineffective. In 2003, the government enacted
the Fiscal Management Responsibility Act,
aimed at containing the size of both the fiscal
deficit and public debt. However, in the aftermath
of the December 2004 tsunami that
necessitated a sharp increase in expenditures
for reconstruction and rehabilitation, the targets
set by the Act were largely ignored. On a more
positive note, reporting requirements saw some
improvement with the Ministry of Finance
tabling mid-year reviews on performance.
Since 2009, Sri Lanka appears at first glance
to have made some headway in reversing the
country's fiscal fortunes. The fiscal deficit fell
progressively to 5.4 per cent of GDP in 2013,
while the public debt-to-GDP ratio too climbed
down steadily to around 70 per cent of GDP.
However, the explanation for this lies in more
robust nominal GDP growth over the same
period than any underlying efforts at addressing
structural weaknesses in fiscal policy
management.
As could be observed from the Figure 4.3, Sri
Lanka's fiscal position in comparison with other
developing and emerging market economies
Sri Lanka’sfiscalposition incomparisonwith otherdevelopingandemergingmarketeconomiesis poor.
is poor. Government revenue generation is well
below the desired level, while the government
debt burden is much higher than countries at
similar levels of development.
Government Revenue Government Gross Debt
Sri LankaEmerging and developing AsiaEmerging market and developing economies
Sri LankaEmerging and developing AsiaEmerging market and developing economies
% o
f GD
P
% o
f GD
P
STATE OF THE ECONOMY 2016
67
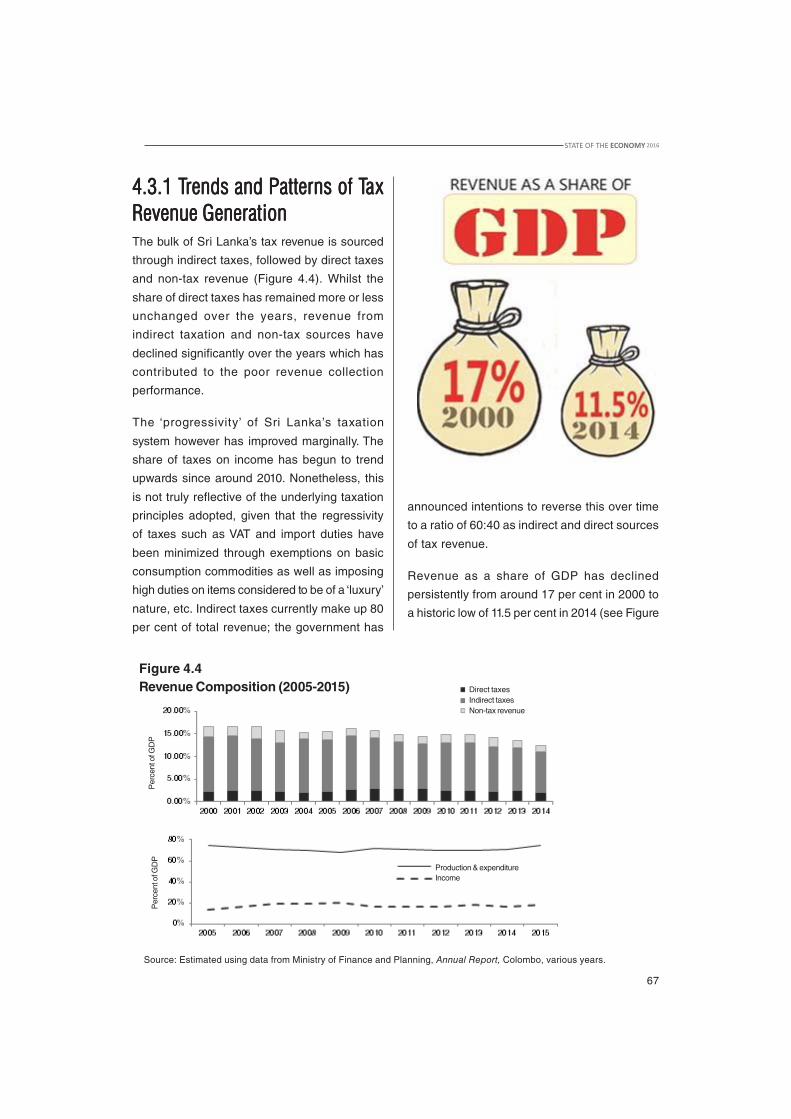
4.3.1 T4.3.1 T4.3.1 T4.3.1 T4.3.1 Trends and Patterns of Trends and Patterns of Trends and Patterns of Trends and Patterns of Trends and Patterns of TaxaxaxaxaxRevenue GenerationRevenue GenerationRevenue GenerationRevenue GenerationRevenue GenerationThe bulk of Sri Lanka’s tax revenue is sourced
through indirect taxes, followed by direct taxes
and non-tax revenue (Figure 4.4). Whilst the
share of direct taxes has remained more or less
unchanged over the years, revenue from
indirect taxation and non-tax sources have
declined significantly over the years which has
contributed to the poor revenue collection
performance.
The ‘progressivity’ of Sri Lanka’s taxation
system however has improved marginally. The
share of taxes on income has begun to trend
upwards since around 2010. Nonetheless, this
is not truly reflective of the underlying taxation
principles adopted, given that the regressivity
of taxes such as VAT and import duties have
been minimized through exemptions on basic
consumption commodities as well as imposing
high duties on items considered to be of a ‘luxury’
nature, etc. Indirect taxes currently make up 80
per cent of total revenue; the government has
announced intentions to reverse this over time
to a ratio of 60:40 as indirect and direct sources
of tax revenue.
Revenue as a share of GDP has declined
persistently from around 17 per cent in 2000 to
a historic low of 11.5 per cent in 2014 (see Figure
Source: Estimated using data from Ministry of Finance and Planning, Annual Report, Colombo, various years.
Direct taxesIndirect taxesNon-tax revenue
Per
cent
of G
DP
Production & expenditureIncome
Per
cent
of G
DP
Figure 4.4Revenue Composition (2005-2015)

STATE OF THE ECONOMY 2016
68
4.2). This is despite a steady rise in per capita
income in the country over the same period. As
noted earlier, consistent with the characteristics
of a developing economy, the bulk of Sri Lanka's
tax revenue is sourced through indirect taxation,
Value Added Tax (VAT) and a Nation Building
Tax (NBT) being the main indirect tax sources
(Figure 4.5). There has been a significant drop
in revenue generated from VAT, from a high of
5.9 per cent of GDP in 2004 to a historic low of
2.6 per cent of GDP by 2015 which has been a
major contributory factor behind the steady
decline in the tax-to-GDP ratio over the last
decade.
In terms of the direct tax revenue, corporate
income tax accounts for the major portion of
direct taxes, followed by taxes on interest
income and personal income tax. Revenue
generated from direct taxes has remained
stagnant over the past decade. In an ideal
scenario revenue from direct taxes should
increase given the progressive nature of such
taxes; however, in Sri Lanka's case, despite the
high growth rates enjoyed by the country over
the past decade, tax revenue mobilization from
direct tax sources have been stagnant. Sri
Lanka has a long history of offering tax
incentives as an instrument to attract
investments with limited success, which has
Figure 4.5Breakdown of Tax Revenue by Instrument, 2000-2015
Source: Estimated using data from Ministry of Finance and Planning, Annual Report, Colombo, various years.
also led to the erosion of the tax base and
complicated the tax structure further (Box 4.1).
It is important to note that revenue from trade
taxes and excise taxes has helped off-set the
decline in indirect tax revenue to a large extent.
Whilst there was a decline in revenue
generated through Customs duties as a
consequence of greater trade openness up to
2003, a more restrictive trade policy outlook
post-2004 through the application of a less
transparent para-tariffs regime - the Port and
Airpor t Levy (PAL), CESS and a Special
Commodity Levy - have off-set the fall in
Custom duty revenues and contributed
significantly to the overall growth of trade tax
revenue. In terms of excise taxes, whilst taxes
collected from tobacco and liquor account for
the lion share of excise revenue, there has been
a notable increase in excise collected on motor
vehicle sales.
The inability to reverse the country's weakening
revenue base comes despite a slew of
recommendations to address tax administration
and policy under a 2010 Presidential
Commission on Taxation. The implementation
of reforms at best has been ad hoc and
incomplete, weakening overall public finance
management in the country.
Per
cent
age
shar
e
Other taxes and levies
International tax
Excise tax
Nation building tax
VAT
Direct tax

STATE OF THE ECONOMY 2016
69
Sri Lanka has a long history of offering tax incentives to attract investment dating back to theheights of the import substitution industrialization era. Up until 1977, keeping with the inward-looking economic policy that prevailed, they were offered to certain import-substitutionindustries, agriculture, housing, non-traditional exports, tourism and gem industry, in additionto the specific incentives offered to the crop sectors of tea, rubber and coconut. All suchincentives were offered under the authority of the Inland Revenue Department (IRD).
With the shift towards a market led growth strategy and the emphasis on attracting FDI tocatalyze the export sector, tax incentives were offered to foreign investors setting up operationswithin designated free trade zones owned and operated by the Greater Colombo EconomicCommission (GCEC). The amalgamation of the GCEC and the Foreign Investment AdvisoryCouncil (FIAC) to form the Board of Investment in 1992, saw the BOI being vested withpowers to grant tax incentives to foreign investors. The BOI Act superseded the provisions setout in the Inland Revenue Act with regard to tax incentives offered to BOI projects. Projectsreceiving 'BOI status' were granted generous income tax concessions and Customs dutyexemptions, subject to meeting criteria based on the size of investment, export orientationand employment generation. This however created a dichotomy between local and foreigninvestors. Thus, recognizing the 'uneven playing field', the government extended BOI taxincentives to local companies from the early 1990s.
In 2006, the government introduced the Nipayum Sri Lanka, 300 enterprise programmewhich offered a special tax incentive package to investors setting up enterprise outside theColombo and Gampaha districts. The lead agencies in the implementation of this programmewere the Ministry of Industries and the BOI. The tax incentives for projects under this programmewere granted both under the BOI and under the IRD, and new projects had the option ofavailing themselves of either, not both.
Sri Lanka took an important step in streamlining tax incentives through the Budget 2011. Alltax incentives offered related to corporate income tax were written into the Inland RevenueAct. From there onward, tax incentives for new projects are granted in line with the country'sgeneral income tax provisions, and the BOI was relieved of the authority to introduce any newincentive packages on its own.
In the meanwhile, for pioneering investments, special incentives packages are to be negotiatedon a case-by-case basis under the provisions set out in the Strategic Development Projects(SDP) Act of 2008. These are only in respect of investments that require incentives exceedingthose stipulated in the tax holiday provisions of the IRD tax code.
In addition to tax incentive offered under the BOI Act, successive government budgets overthe years have seen the introduction of tax incentives targeted at SMEs. Incentives includepre-establishment cost write-offs, tax holidays for both new investments and expansionsranging from 3-6 years depending on the volume of investment, triple deductions on R&Dexpenditure undertaken by SMEs and VAT and duty exemptions for selected manufacturingactivities such as handlooms, agriculture processing, fisheries, poultry and rice milling toname a few.
Box 4.1History of Tax Incentives in Sri Lanka

STATE OF THE ECONOMY 2016
70
4.3.2 T4.3.2 T4.3.2 T4.3.2 T4.3.2 Trends and Patterns ofrends and Patterns ofrends and Patterns ofrends and Patterns ofrends and Patterns ofPublic ExpenditurePublic ExpenditurePublic ExpenditurePublic ExpenditurePublic ExpenditureAs evident from Figure 4.6, Sri Lanka has seen
a steady decline in fiscal expenditure from a
high of nearly 27 per cent of GDP in 2000 to
17.2 per cent in 2014. This has come about
through a better mix of expenditure, focused on
restraining current spending whilst accelerating
capital investment.
The bulk of Sri Lanka's fiscal expenditure over
the past decade has been expended on
financing recurrent government expenditure.
Whilst this figure has been falling over the years,
it still accounts for a significant portion of
expenditure outlays. The composition of current
expenditures - primarily made up of salaries
and wages, interest payments on public debt,
and transfers and subsidies - has hardly
changed either, underlying the lack of
meaningful reform efforts in public finance
management.
Of the three main recurrent expenditure
categories, reform initiatives have hardly
touched on the country's large public sector or
subsidies and welfare measures in place. This
is despite the fact that in the case of the latter, a
host of subsidies (e.g., fertilizer) and transfers
(e.g., Samurdhi) where issues of targeting and
the effectiveness of outcomes have been
subject to considerable debate.28 Public
finances are heavily burdened by a non-
contributory pension scheme, whilst at the same
time leaving a large share of Sri Lanka's elderly
and vulnerable population without adequate
means of social protection.29
Sri Lanka has a large and growing cadre of
public sector employees, estimated to account
for approximately 15 per cent of the total
Source: Estimated using data from Ministry of Finance and Planning, Annual Report, Colombo, various years.
Figure 4.6Government Expenditure Trends (2000-2015)
28 Tilakaratna, G., A. Galappattige and R. Jayaweera (2013), “Safety Nets in Sri Lanka: An Overview”, report prepared for theWorld Bank, Colombo.
29 IPS (2015), “Reforming Sri Lanka’s Social Protection System” in Sri Lanka: State of the Economy 2015, Institute of PolicyStudies of Sri Lanka, Colombo.
Composition of Current Expenditure 2015
Total expenditureRecurrent expenditureCapital expenditure Personal
Emoluments
Other purchasesof goods andservices
Interestpayments
Transferpayments

STATE OF THE ECONOMY 2016
71
employed in 2015. Aside from the heavy fiscal
recurrent expenditure burden of salaries and a
non-funded public sector pension scheme, the
Treasury must also grapple with transfers to loss
making SOEs.
Sri Lanka currently hosts 245 SOEs under
different legal structures such as statutory
bodies, limited companies, subsidiary firms, and
even government departments. As Table 4.1
illustrates, several loss-making and non-
functional SOEs rely heavily on the government
budget for recurrent expenditures. Most of the
minority share-holding companies fail to pay
dividends to the government and accrue heavy
debts, which have impacts on bank
performance, and an unusual accumulation of
inter-SOE debts as well. Among the 245 SOEs,
the government has identified 55 SOEs as
strategically important. Eleven SOEs among
these too have incurred heavy losses -
especially in the commercial operations of the
energy, aviation, commuter transport, and
plantations sectors.
The governmenthas identified 55SOEs as strategi-cally important.Eleven SOEsamong these toohave incurredheavy losses –especially in thecommercialoperations of theenergy, aviation,commuter trans-port, and planta-tions sectors.

STATE OF THE ECONOMY 2016
72
Table 4.1Profitability of Selected SOEs (Rs. mn.)
Profit/(Loss) Budgetary Support (2014)
2005 2012 2013 2014 Recurrent CapitalSri Lankan Airlines Ltd 480 (21,751) (32,358) (16,181) - -
Ceylon Electricity Board (6,852) (61,447) 22,945 (13,303) - 16,793
Sri Lanka Transport Board (1,119) (2,964) (10,640) (9,407) 6,965 1,597
Mihin Lanka (Pvt) Ltd (2,866) (2,566) (1,187) - 6,528
Enterprise
Source: MOFP, Annual Report 2014, Ministry of Finance and Planning, Colombo.
In addition to direct budgetary assistance, in
order to sustain the operation of SOEs, the
government has also resorted to issuing
Treasury guarantees. Sri Lanka's Fiscal
Management Responsibility Act of 2003 capped
such contingent liabilities at 4.5 per cent of GDP;
this was amended and raised to 7 per cent in
2013. Contingent liabilities have increased
sharply from 1.6 per cent of GDP in 2006 to 5.7
per cent of GDP in 2014 (Figure 4.7).
These contingent l iabil it ies, therefore,
effectively increase the level of government
liabilities. As Table 4.2 indicates, many non-
revenue generating entities that previously
depended on fiscal transfers have resorted to
direct borrowing with Treasury guarantees.
Among state institutions issued with
government-backed guarantees, the Ceylon
Petroleum Corporation (CPC) has been issued
the most contingent liabilities. Moreover, the
Road Development Authority (RDA) has also
been granted significant guarantees. This
indicates the vicious cycle associated with the
subsidization of loss-making SOEs and their
impact on ancillary institutions. For instance, the
CPC continues to provide fuel to loss-making
enterprises such as SriLankan Airlines, Mihin
Lanka, and the Ceylon Electricity Board (CEB)
that are consequently unable to fulfil financial
obligations. In turn, the CPC absorbs a financial
loss that is eventually borne by the state.
Figure 4.7Treasury Contingent Liabilities
Source: MOFP, Annual Report, Ministry of Finance and Planning, Colombo, various years.
Rs.
mn.
Treasury guarantees (Rs. mn.)
% of GDP
% o
f GD
P

STATE OF THE ECONOMY 2016
73
Table 4.2Contingent Liabilities Granted to Select Government Agencies, 2014
Value (Rs. mn.) Capital on TreasuryGuarantee (Rs. mn.)
Airport and Aviation Service Ltd 32,587.23 445.46
CEB 17,985.11 13,876.05
CPC 206,426.00 205,950.00
CPC Storage Terminals Ltd 4,634.50 2,374.50
Lakdhanavi Ltd 5,984.00 5,984.00
Ministry of Defence and Urban Development 7,550.00 7,017.59
National School and Business Management Ltd 8,600.00 2,856.46
Paddy Marketing Board 6,493.00 6,377.01
People Bank Pension Trust Fund 5,000.00 5,000.00
RDA 97,961.81 71,560.45
Sir John Kotalawala Defence University 27,726.39 27,152.53
UDA 21,372.37 21,222.37
West Coast Power 21,993.75 11,184.08
Total 465,784.03 382,261.20
Source: MOFP, Annual Report 2014, Ministry of Finance and Planning, Colombo.
In critical areas for funding such as education
and health, the share of public expenditures as
a percentage of GDP has been declining. For
example, current expenditure on health and
education as a share of total government
current expenditure has remained the same
(Figure 4.8).
Adequate investments in health and education
are important not only to ensure a skilled and
productive work force, but also to meet broader
objectives of socio-economic development and
equity. Available evidence suggests that
although, education and health services are
provided free of user fees, households on
average spend 6.2 per cent of their monthly
expenditure on health and education.30 Further,
these incidence of out-of-pocket expenditure
on health and education is regressive,
indicating that this could contribute to widening
the existing inequalities in quality and access
to these services.
In contrast to recurrent expenditures, there has
been a significant change in Sri Lanka’s capital
investment profile. Sri Lanka’s public investment
lagged behind for years as other expenditure
priorities, particularly spending on defence, took
precedence during three decades of armed
conflict. This clearly is costly for long-term
sustained growth; inadequate attention to
30 Arunatilake, N., N. Attanayake and P. Jayawardena (2010), “Equitability in Education and Health Services in Sri Lanka”, reportprepared for the Asian Development Bank, Manila.

STATE OF THE ECONOMY 2016
74
Value Capital on Treasury
(Rs. mn.)
Figure 4.8Breakdown of Current Expenditure, 2005 and 2015
capital spending, especially in investments that
have higher returns, reduces the government’s
capital formation and consequently inhibits the
development potential of the country.
Capital expenditure, in non-military productive
purposes, is seen to create multiplier effects
that stimulate growth and expand economic
activities in the private sector in the medium to
long-run. As previously noted, capital spending
was raised to an average of 6 per cent of GDP
post-2006 in support of the government’s
infrastructure investment led growth strategy.
While some projects were clearly justifiable,
there were also many that will perhaps not
generate returns to repay costs incurred. Given
that the bulk of public infrastructure investment
was financed through external borrowing, the
long-term fiscal implications on debt financing
is increasingly of growing concern.
4.3.3 Public Debt and Debt4.3.3 Public Debt and Debt4.3.3 Public Debt and Debt4.3.3 Public Debt and Debt4.3.3 Public Debt and DebtServicingServicingServicingServicingServicingSuccessive governments have pursued debt-
financed investment as well as debt-financed
consumption through both domestic and foreign
means of borrowing. For example, the
Accelerated Mahaweli Development
Programme (AMDP) was mainly a foreign debt-
financed investment. Such policy prescriptions
led to the accumulation of debt that amounted
Since becom-ing a lowermiddle-incomecountry, SriLanka hasbecome lessqualified forconcessionalloans, and is-sues pertain-ing to debtaccumulationand repay-ments havebecome moreacute.Source: MOFP, Annual Report, Ministry of Finance and Planning,
Colombo, various years.

STATE OF THE ECONOMY 2016
75
to 105 per cent of GDP in 2002. Notably, as a
low-income country, Sri Lanka was granted
access to concessional foreign loans with long
repayment periods and low interest rates.
However, since becoming a lower middle-
income country, Sri Lanka has become less
qualified for concessional loans, and issues
pertaining to debt accumulation and
repayments have become more acute.
The negative impacts of debt-financed
investments are somewhat ameliorated with
pertinent investments in projects that produce
high returns in dollars (or other exchange)
through direct or indirect means. Such returns
would better facilitate the repayment of debts.
Politically motivated investments with low
returns result in a necessity for debt rollovers,
as the government requires more loans to repay
previous loans. As evident from Figure 4.9, a
vast proportion of debt expenditure has been
spent on investments that have low financial
returns such as roads, bridges and ground
transport with fewer resources dedicated to
Figure 4.9Composition of Foreign Debt Expenditure, 2005-2014
A vast pro-portion ofdebt expen-diture hasbeen spenton invest-ments thathave lowfinancialreturnssuch asroads,bridges andgroundtransportwith fewerresourcesdedicated toinvestmentswith highreturnssuch aseducation.
Source: Estimated based on data from MOFP, Annual Report, Ministry of Finance and Planning, Colombo, various years.
Health and social welfare
Ports and shipping
Education and training
Other
Roads, bridges andground transport
Power and energy, waterand irrigation
Rehabilitation, housingand urban development
STATE OF THE ECONOMY 2016
76
investments with high returns such as
education. The situation is worsened even
further if the investments fail to generate
employment for domestic citizens.
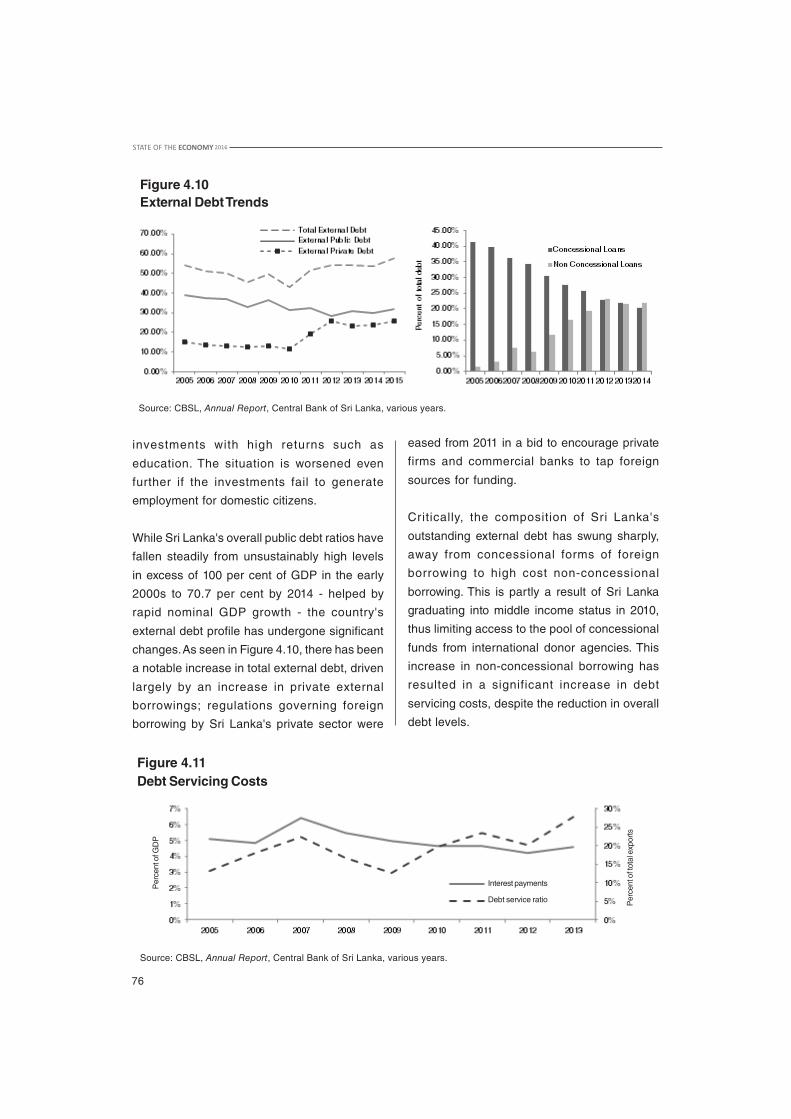
While Sri Lanka's overall public debt ratios have
fallen steadily from unsustainably high levels
in excess of 100 per cent of GDP in the early
2000s to 70.7 per cent by 2014 - helped by
rapid nominal GDP growth - the country's
external debt profile has undergone significant
changes. As seen in Figure 4.10, there has been
a notable increase in total external debt, driven
largely by an increase in private external
borrowings; regulations governing foreign
borrowing by Sri Lanka's private sector were
Figure 4.10External Debt Trends
eased from 2011 in a bid to encourage private
firms and commercial banks to tap foreign
sources for funding.
Critically, the composition of Sri Lanka's
outstanding external debt has swung sharply,
away from concessional forms of foreign
borrowing to high cost non-concessional
borrowing. This is partly a result of Sri Lanka
graduating into middle income status in 2010,
thus limiting access to the pool of concessional
funds from international donor agencies. This
increase in non-concessional borrowing has
resulted in a significant increase in debt
servicing costs, despite the reduction in overall
debt levels.
Figure 4.11Debt Servicing Costs
Source: CBSL, Annual Report, Central Bank of Sri Lanka, various years.
Source: CBSL, Annual Report, Central Bank of Sri Lanka, various years.
Interest payments
Debt service ratio
Per
cent
of G
DP
Per
cent
of t
otal
exp
orts

STATE OF THE ECONOMY 2016
77
Total interest payments on debt as a percentage
of GDP has reduced from progressively from
6.4 per cent to 4.2 per cent between 2009 and
in 2014 before reversing in 2015 (Figure 4.11).
The reduction was primarily due to lower
domestic interest rates, as well as foreign
currency interest rates in the aftermath of the
global financial crisis. However, Sri Lanka's debt
service ratio has risen progressively over the
same period, with growth in earnings from
exports of goods and services lagging behind
high external debt accumulation.
4.4 Areas for ReformAs Sri Lanka continues to face a rapid
demographic transition associated with an
ageing population and dwindling numbers
entering the labour force, the pressures on
public finances will grow. The necessity is not
only to rationalize current spending patterns,
but also to focus on better directed public
spending in areas such as education and
health, to be in l ine with the changing
demographic profile of the country.
4.4.1 Rationalizing Fiscal4.4.1 Rationalizing Fiscal4.4.1 Rationalizing Fiscal4.4.1 Rationalizing Fiscal4.4.1 Rationalizing FiscalExpenditureExpenditureExpenditureExpenditureExpenditureReforms to fiscal policy in an economy similar
to Sri Lanka's require a careful balance of
imposing policy disciplines while maintaining
its development objectives. On the expenditure
front, it is imperative that an expenditure policy
aims to restrain the expansion of non-
developmental expenditure while adequately
providing for important social and infrastructure
needs of a developing economy. Within the
government's current fiscal policy reform
agenda, some focus has been given to public
expenditure, especially in the SOE sector. The
IMF intervention of a 36-month Extended Fund
Facility (EFF) of US$ 1.5 emphasis has been
placed on reforming SOEs and reducing the
subsidy bill. However, the extent of expenditure
reforms is severely constrained by the political-
economy of the country and populist measures
- such as the public sector salary increase of
Rs. 10,000 through the interim-budget of 2015 -
which are counter-intuitive to the reform agenda.
As noted previously, loss-making SOEs have
become a severe burden on the taxpayer and
immediate reform is required to stem the
wastage of resources. Moreover, the state-led
development agenda pursued during the past
decade or so has crowded-out private
investment and has led to the public sector
becoming one of the main employment
generators in the country, leading to a bloated
and inefficient public sector. In recognition of
these pitfalls, the government proposed to
create a State Holding Corporation Limited in
order to manage and establish fiscal and
institutional disciplines across SOEs. Even
though the exact nature of the State Holding
Corporation is yet to be finalized, the process
will possibly be developed along the lines of
the Temasek Company of Singapore.
Simultaneously, the government has proposed
to sell shares of ventures deemed to be
incongruent to the core competencies of SOEs
while creating a 'Special Purpose Vehicle' to
concentrate on infrastructural development
initiatives.31
Cognizant of the political-economy of the
country, the pursuit of PPPs is regarded as a
more viable option in this regard since complete
privatization will require significant political
political capital. The adoption of PPPs enables
31 Economic Policy Statement by Hon. Prime Minister, Ranil Wickremesinghe in Parliament, 5th November 2015.

STATE OF THE ECONOMY 2016
78
a developing country to sequence its
liberalization process by gradually exposing
SOEs and the public sector to increasing levels
of private sector participation (especially
foreign) and competition.32 Joint-ventures
enable transfers of skills that improves local
private sector capabilities while also extracting
long-term value-for-money through appropriate
transfer of risk to the private sector. In doing so,
the government is better capable of stemming
a significant outflow of revenue towards
subsidizing loss-making SOEs and to direct its
expenditure into more efficient investments.
Another area for reform is subsidies and
transfers. Given Sri Lanka's fiscal position and
its economic growth trends, inclusive growth is
becoming a more pertinent policy issue.
Towards that end, it is vital that scarce
government resources are directed towards
policies that will have the most significant impact
in alleviating poverty while also mitigating
wastage. Conditional cash transfers (CCTs) -
both direct and indirect - have been identified
as an important tool that balances these needs
well in developing economies. Conditional cash
transfers, which are also provided in the form
of means tested subsidies, can provide a
valuable safety net along with investment in
human development that benefits the poor.
CCT programmes require recipients to
undertake certain behavioural changes in
return for the cash transfer, such as enroling
children in school and maintaining adequate
attendance levels, receiving prenatal and
postnatal treatment, and encouraging
immunization. It is assumed that major changes
in human capital investment can be stimulated
through income transfers. Similar programmes
have been particularly successful in Latin
American and Caribbean nations such as Brazil,
Mexico and Jamaica. However, it is important
that where necessary, supply-side constraints
are also addressed along with stimulating
demand in order to fully realize the benefits of
a CCT programme.33 Such targeted
programmes are more cost effective than
blanket subsidies that have the potential of
crowding out low-income individuals from vital
services such as health care and education.
It is important to note that as with many
developing countries, subsidies are a key
component of Sri Lanka's economic policies as
well. The fer tilizer subsidy and subsidies
associated with school uniforms have gained
particular focus recently due to policy changes.
In order to achieve a 'social market economy',
the government initially replaced the granting
of fertilizer and uniforms at subsidized rates,
with a voucher system. The voucher system was
expected to reduce bureaucratic inefficiencies
associated with government procurement and
also reduce the associated cost burden on the
government. In the face of opposition to the new
system, the voucher, however, has now been
replaced with a cash transfer to target recipients.
4.4.2 Rethinking Sri Lanka's T4.4.2 Rethinking Sri Lanka's T4.4.2 Rethinking Sri Lanka's T4.4.2 Rethinking Sri Lanka's T4.4.2 Rethinking Sri Lanka's TaxaxaxaxaxPolicyPolicyPolicyPolicyPolicyAn IMF assessment carried out in 2005 set out
a revenue-to-GDP target of 15-20 per cent as a
reasonable minimum 'threshold' for developing
countries.34 Sri Lanka's revenue to GDP ratio
32 IMF (2015), “Making Public Investment More Efficient”, International Monetary Fund, Washington, D.C.33 Son. Hyun H. (2008), Conditional Cash Transfer Programmes: An Effective Tool for Poverty Alleviation?, Asian
Development Bank, Manila.34 IMF (2005), “Monetary and Fiscal Policy Design Issues in Low Income Countries,” International Monetary Fund,
Washington, D. C.
STATE OF THE ECONOMY 2016
79
has been on a steady decline and currently
stands at 13 per cent which is well below the
minimum threshold, raising concerns with
respect to the effectiveness and efficiency of
the existing tax system. Furthermore, Sri Lanka's
tax structure remains highly regressive with
close to 80 per cent of revenue being generated
through indirect tax, thus having distributional
consequences.
Most economists and policymakers today are
of the belief that high tax rates not only
discourage and distort economic activity, but
are also ineffective in redistributing income and
wealth. The common mantra today is to apply
lower tax rates on broader bases. As such, the
'holy trinity' of options, proposed by most fiscal
experts are broadening bases, lowering rates,
and better administration. Consistent with this
premise, the budget proposals for 2016 saw
the government lowering tax rates on a number
of key revenue instruments; however, the
narrow tax base continues to remain
unaddressed. Whist the government's economic
policy statement unveiled in November 2015
expressed the intention to make the tax system
more progressive, a number of recently
introduced changes to the tax structure run
counter to this objective and are regressive in
nature, thus having important distributional
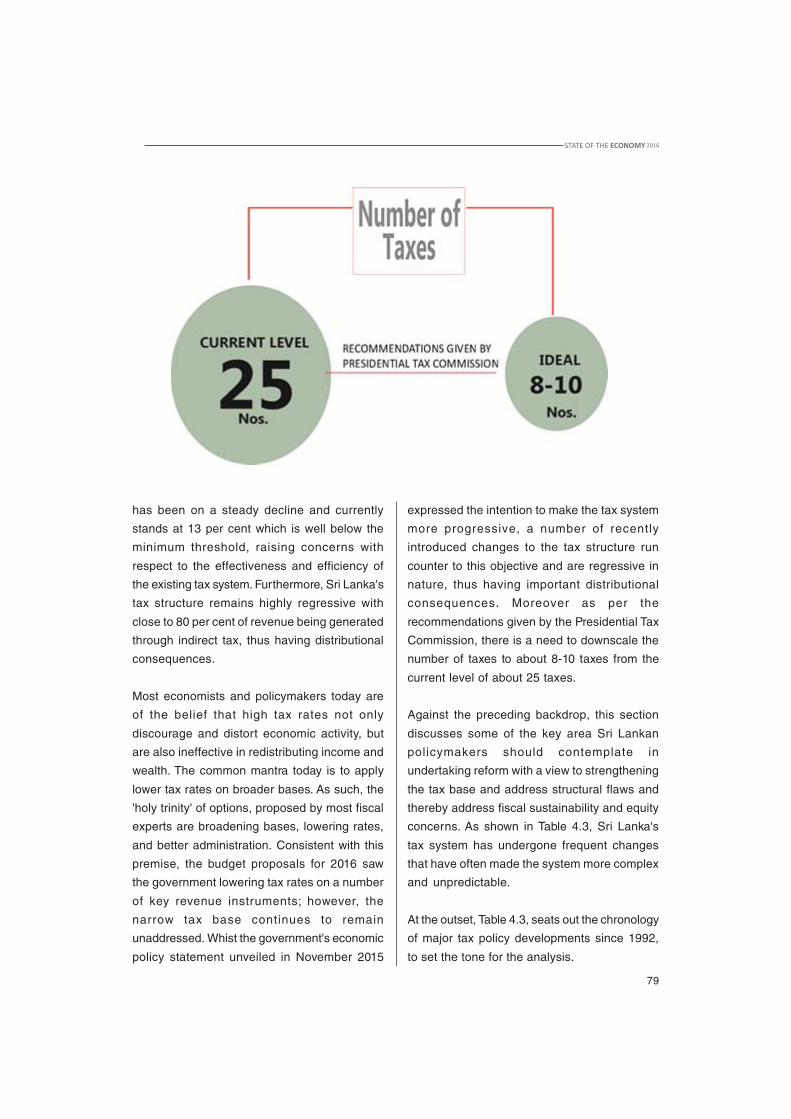
consequences. Moreover as per the
recommendations given by the Presidential Tax
Commission, there is a need to downscale the
number of taxes to about 8-10 taxes from the
current level of about 25 taxes.
Against the preceding backdrop, this section
discusses some of the key area Sri Lankan
policymakers should contemplate in
undertaking reform with a view to strengthening
the tax base and address structural flaws and
thereby address fiscal sustainability and equity
concerns. As shown in Table 4.3, Sri Lanka's
tax system has undergone frequent changes
that have often made the system more complex
and unpredictable.
At the outset, Table 4.3, seats out the chronology
of major tax policy developments since 1992,
to set the tone for the analysis.

STATE OF THE ECONOMY 2016
80
Successful tax reform efforts in developing countries have been few and far to come by. How-ever, a number of interesting cases exist. Indonesia's tax reform programme during the 1980shas been one to stand out. Prior to 1983, the bulk of Indonesia's fiscal resources were sourcedthrough non-tax oil revenue. The oil crisis of the early 1980s compelled Indonesian authoritiesto diversify revenue sources paving the way for a comprehensive tax reform agenda. Reformssaw the introduction of a VAT, together with a luxury sales tax. Both personal and corporateincome tax bases were broadened by eliminating special tax preferences, and tax rates werelowered to encompass a three-rate structure down from 17 personal income taxes and threebusiness taxes. In addition, Indonesia introduced a property tax and a comprehensive restruc-turing of the tax administration was carried out. The outcomes of the reforms were impressive;within a period of three years, the share of non-oil revenues as a share of GDP increased byalmost 50 per cent.
Vietnam's tax reform experience is another interesting case. Even though Vietnam had at-tempted to reform its tax system for well over two decades, a new round of comprehensive taxreforms was undertaken in 2006. This new round was necessitated by a relative decline ofrevenue for SOEs - the major payer of corporate income tax and VAT at the time - the anticipateddecline in oil output and hence oil revenues, the rise of the private sector, increased FDI flowsinto the country, and a decline in trade taxes. The reform package encompassed a reduction incorporate income tax (CIT) rates, the simplification of incentives, and the reduction of exemp-tions. VAT was modified to reduce the number of exemptions and reduce the number of itemsthat benefitted from a lower tax rate. In addition, the country's tax administrator, the GeneralDepartment of Taxation (GDT) which had a reputation for red tape and corruption was subject tocomprehensive governance reform. To overhaul governance, the government sought to: a)simplify tax administrative procedures, b) enhance and diversify tax services, c) promulgateregulations on audit and examination on the basis of risk management, d) modernise, automateand integrate a single system of tax management, and e) enhance cooperation with foreign taxauthorities and international institutions.
The lowering of CIT rates, the introduction of a much revised personal income tax (PIT), andnotwithstanding the decline in oil output and the resultant drop in revenues had left the overalltax ratio in 2012 at about the same level as in 2005. This was despite the fact that tax revenuesfrom the oil sector declined from 35 per cent of all tax revenues in 2005 to only 12 per cent in2012. The revenue levels had been maintained as a result of the improvement in the CIT fromnon-oil sector companies, as well as from a tripling in revenues from the tax on individuals. Inaddition, due to legal changes and fierce enforcement, the number of active, registered taxpay-ers soared from about 4 million in 2006 to about 15 million by 2014. In terms of taxpayercompliance requirements, World Bank reporting indicates that procedures have been stream-lined and that the new laws and their regulations are more user-friendly.
Source: Khalidzadeh-Shiraz J and A. Shah (1991), "Tax Reform in Developing Countries, What Consti-tutes Successful Tax Reform, A Review of Developing Country Experiences", Finance andDevelopment, 28(2); ITC-OECD (2015), "Examples of Successful DRM Reforms and the Roleof International Co-operation", Discussion Paper, available at https://www.oecd.org/ctp/tax-glo-bal/examples-of-successful-DRM-reforms-and-the-role-of-international-co-operation.pdf.
Box 4.2Successful Tax Reform Experiences in Developing Countries
STATE OF THE ECONOMY 2016
81
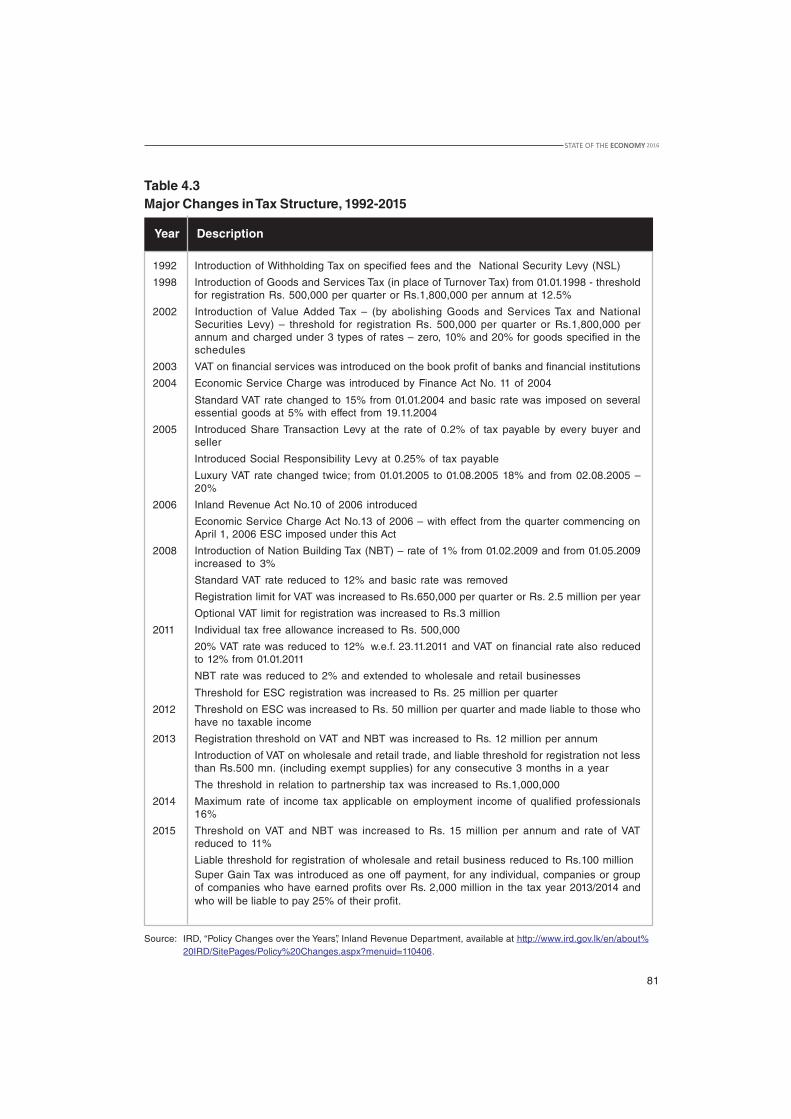
Table 4.3Major Changes in Tax Structure, 1992-2015
Year Description
1992 Introduction of Withholding Tax on specified fees and the National Security Levy (NSL)
1998 Introduction of Goods and Services Tax (in place of Turnover Tax) from 01.01.1998 - thresholdfor registration Rs. 500,000 per quarter or Rs.1,800,000 per annum at 12.5%
2002 Introduction of Value Added Tax – (by abolishing Goods and Services Tax and NationalSecurities Levy) – threshold for registration Rs. 500,000 per quarter or Rs.1,800,000 perannum and charged under 3 types of rates – zero, 10% and 20% for goods specified in theschedules
2003 VAT on financial services was introduced on the book profit of banks and financial institutions
2004 Economic Service Charge was introduced by Finance Act No. 11 of 2004
Standard VAT rate changed to 15% from 01.01.2004 and basic rate was imposed on severalessential goods at 5% with effect from 19.11.2004
2005 Introduced Share Transaction Levy at the rate of 0.2% of tax payable by every buyer andseller
Introduced Social Responsibility Levy at 0.25% of tax payable
Luxury VAT rate changed twice; from 01.01.2005 to 01.08.2005 18% and from 02.08.2005 –20%
2006 Inland Revenue Act No.10 of 2006 introduced
Economic Service Charge Act No.13 of 2006 – with effect from the quarter commencing onApril 1, 2006 ESC imposed under this Act
2008 Introduction of Nation Building Tax (NBT) – rate of 1% from 01.02.2009 and from 01.05.2009increased to 3%
Standard VAT rate reduced to 12% and basic rate was removed
Registration limit for VAT was increased to Rs.650,000 per quarter or Rs. 2.5 million per year
Optional VAT limit for registration was increased to Rs.3 million
2011 Individual tax free allowance increased to Rs. 500,000
20% VAT rate was reduced to 12% w.e.f. 23.11.2011 and VAT on financial rate also reducedto 12% from 01.01.2011
NBT rate was reduced to 2% and extended to wholesale and retail businesses
Threshold for ESC registration was increased to Rs. 25 million per quarter
2012 Threshold on ESC was increased to Rs. 50 million per quarter and made liable to those whohave no taxable income
2013 Registration threshold on VAT and NBT was increased to Rs. 12 million per annum
Introduction of VAT on wholesale and retail trade, and liable threshold for registration not lessthan Rs.500 mn. (including exempt supplies) for any consecutive 3 months in a year
The threshold in relation to partnership tax was increased to Rs.1,000,000
2014 Maximum rate of income tax applicable on employment income of qualified professionals16%
2015 Threshold on VAT and NBT was increased to Rs. 15 million per annum and rate of VATreduced to 11%
Liable threshold for registration of wholesale and retail business reduced to Rs.100 millionSuper Gain Tax was introduced as one off payment, for any individual, companies or groupof companies who have earned profits over Rs. 2,000 million in the tax year 2013/2014 andwho will be liable to pay 25% of their profit.
Source: IRD, “Policy Changes over the Years”, Inland Revenue Department, available at http://www.ird.gov.lk/en/about%20IRD/SitePages/Policy%20Changes.aspx?menuid=110406.

STATE OF THE ECONOMY 2016
82
Despite being a major source of revenue,
mirroring the global trend, revenue generation
through corporate income tax (CIT) has been a
challenge for Sri Lanka owing to downward
pressure exerted on CIT rates as a
consequence of global competition. In view of
encouraging investments, the 2016 budget
lowered CIT tax rates to a single rate of 15 per
cent from a progressive tiered rate structure and
subsequently increased to 17.5 per cent in May
2016. This move has two impor tant
consequences; firstly, lowering the tax rate whilst
the base remains narrow will see revenues
from CIT taking a further hit; secondly, a single
CIT rate eliminates any sense of progressivity
in the CIT structure, working counter to the stated
objective of making the tax system more
progressive.
Sri Lanka offers corporate tax holidays and
concessions as incentives to encourage
investment. International experience, however,
suggests that despite their continued popularity,
tax incentives are often redundant and
ineffective and tend to reduce revenue and
complicate the fiscal system without achieving
their stated objectives.35 In addition, excessive
use of tax incentives complicates tax
administration, facil itating evasion and
corruption. With a view to maximize the
likelihood of beneficial results from tax
incentives and to reduce the damage that may
be caused by poorly designed and
implemented incentives, countries should at the
very least try to offer as minimum number of
concessions as possible, and as simple in
structure as possible. Moreover, one of the key
recommendations of the Presidential Tax
Commission of 2010 has been to move towards
as system of (i) accelerated depreciation
allowances and (ii) interest relief as a
replacement for tax holidays.
In light of the above, Sri Lanka should revisit its
tax incentive structure and better rationalize its
policy with a view to prevent the erosion of its
tax base to ensure that revenue considerations
are not undermined in the attempt to attract
investment. Furthermore, policymakers must
rethink the design of the CIT structure with a
view to addressing regressive concerns.
Current VAT exemptions are also an area
needing reform. As alluded to earlier, VAT
accounts for the lion's share of Sri Lanka’s tax
revenue; however, its share over the last decade
or so has been on a gradual decline raising
concerns on its effectiveness in sustaining the
required level of revenue. VAT in Sri Lanka is a
single rate tax and a number of essential goods
and services are zero rated. The VAT rate was
increased in May 2016 from 11 per cent to 15
per cent and the base widened to cover some
of previously untaxed goods and services. This
move whilst contribution to improving revenues
is bound to have adverse distributional
consequences.
Whilst most developing countries around the
wor ld have adopted VAT, international
experiences suggest that in many instances
flawed design and implementation often
undermine the effectiveness of VAT. One of the
most common issues that has emerged in
developing countries has been the fact that
whilst at the time of initial implementation of
VAT, most VAT structures usually stand close to
the standard broad-based international model,
however as time passes by VAT structures tend
35 Bird, R. (2008) “Tax Challenges Facing Developing Countries”, Working Paper 9, Institute for International Business.

STATE OF THE ECONOMY 2016
83
to be littered with privileges and exemptions
that gradually erodes the base, thereby
minimizing its revenue impact and creating
administration difficulties. Ad hoc and extensive
exemptions and zero rating also creates
classification disputes and increasing
compliance costs, opening up scope for VAT
evasion, and corruption.36 As in the case of CIT
incentives, Sri Lanka has introduced a number
of tax concessions and exemptions with a view
to encourage investment in the country. This
has been carried out in a rather ad hoc manner
which has led to the erosion of the VAT base; it
has also complicated the VAT structure, leading
to compliance issues.
Unlike in developed countries, receipts from
personal income tax (PIT) in developing
countries are low and stagnant, and come
predominantly from wage withholding on large
enterprises and public sector employee.37 Sri
Lanka's experience reflects this; Pay-As-You-
Earn (PAYE) is the principal PIT collected from
both private and public sector employees. Like
the CIT, the PAYE tax was initially applied on a
tiered rate structure; however, as of 2016 this
was moved to a single rate system, where the
standard rate is 16 per cent. As with the CIT, the
move to a single rate structure eliminates any
sense of progressivity, working contrary to the
stated objective of making the tax regime more
progressive.
Curbing tax evasion and avoidance by high-
income individuals is seen as a potential area
for generating additional revenue. Establishing
dedicated units within the tax administration to
high-income/wealth individuals could provide
a focus for enforcement efforts, with high profile
prison terms sending a salutary lesson. Strong
audit power, including the possibility to use
indirect methods to assess tax liabilities, is an
effective tool for increasing the effectiveness of
audit operations; these enable revenue
agencies to use third party information,
particularly related to assets and flow of
investments, to estimate the taxpayer's income.
Taxing property is also seen as a powerful
means of taxing the better-off.38
4.5 SummaryThe legacy of Sri Lanka's welfare-state, history
of populist public spending programmes, poorly
managed SOEs, and a bloated public sector
bureaucracy have made rationalization of
expenditures an uphill task. If performance of
public finance management on the expenditure
front has been mixed, fiscal performance on
the revenue front has clearly been very poor
since the early 1990s.
The fiscal landscape - marked by high deficits
and government borrowing - leaves little leeway
to reorient public investment toward high return,
high productivity sectors such as education and
health care. Some degree of expenditure
rationalization is necessary, particularly with
regard to the loss making SOEs, poorly targeted
subsidies and transfers and populist spending
measures adopted from time to time; much will
depend on the political will to tackle these and
which are perceived as highly sensitive to voter
sentiment.
36 Ibid.37 Carnahan. M. (2015), ‘Taxation Challenges in Developing Countries’, Asia & the Pacific Policy Studies, 2(1).38 IMF (2011), Revenue Mobilization in Developing Countries, International Monetary Fund, Washington D.C.

STATE OF THE ECONOMY 2016
84
Property taxes refer to "recurrent taxes on immovable property, measured gross of debt, levied on propri-etors or tenants" . While there exists a dearth in research regarding such forms of taxes, analyses andestimates deduce that a nation tends to utilize Immovable Property (IP) taxes as it progresses towards thehigh income threshold.
The primary advantage of IP taxes is that it provides the state with a stable and predictable revenue source.Property taxes maintain high 'cyclical resiliency' in comparison to other sources of government revenue -i.e., the funds collected through property taxes tend to not fluctuate heavily during swings in the economiccycle. For instance, during 2007-09, when the US found itself in the midst of a pronounced depression, therevenue derived from individual income tax and sales tax plunged between 7.5-17 per cent. However, incomparison, revenue from property taxes increased by 5 per cent during the given time period. As such, theuse of such taxes appears to provide much needed relief during times of great financial constraints. Further-more, by compelling owners to bear a cost for holding property, IP taxes incentivize the efficient allocation ofresources to increase productivity. Thus, such taxes can act as a check on unbridled speculative pricingduring economic booms. In addition, the immovability and tangibility of the tax base reduces the chance ofevasion. Finally, since land taxes are considered to be an endogenous mode of revenue collection, itsimplementation does not require an impetus on international tax coordination. The possible advantages of IPtaxes have encouraged several contemporary developing nations such as Vietnam, Cambodia and Singaporeto take the lead in implementing a more refined property tax mechanism. Vietnam, for example, has adoptedan area-based tax on non-agricultural land (excluding houses), and is considering further reforms in thisparticular area. The tax is levied on the value of the land area, with additional improvements exempted fromtaxation. By enacting such a policy, the Vietnamese policy makers aim to ensure that economic and industrialactivities are not discouraged. Furthermore, Singapore has increased the tax levied on home buyers as ameans of safeguarding the housing market from rapid appreciation.
However, IP taxes are no golden eggs. The general lack of contemporary enthusiasm in regard to suchmodes of taxation indicates the presence of drawbacks that need to be considered when analyzing policydecisions. For instance, unlike other forms of taxes, the value of IP cannot be self-assessed. Therefore, thestate has to bear the additional costs incurred in assessing rates and collecting revenue from the tax base.This lowers the revenue to expense ratio, thus making the tax a less appealing proposition to law makers.Furthermore, the implementation of a property tax scheme is hindered by the unpopularity of such revenuecollection methods amongst general voters. According to Bahl and Bird (2008) for each "per dollar of revenueraised, property taxes generate more negative reaction than any other levy". Thus, politicians tend to bereluctant to campaign for property taxes for fear of losing political mileage. Dissent against property taxesarise, paradoxically, due to its transparency, as the burden is not hidden from taxpayers. Furthermore, sucha tax is often considered to be unfair as it assumes that it does delineate between ownership and payability.For instance, citizens who are property rich but income poor, tend to be victimized. Hypothetically, the use ofproperty taxes encourages the efficient reallocation of land. However, when examined from an altruisticmanner, it may be a bitter pill to swallow.
The implementation of an IP tax in Sri Lanka can aid the government in combating fiscal vulnerability, andincentivizing the efficient reallocation of (land) resources. In Sri Lanka, the decision making authority inregard to property taxes lies with the Provincial Councils. While such a system reduces the burden ofgovernmental transfers, it prohibits the Centre from maximizing revenue, especially from its urban localities.With Sri Lanka embarking on a massive urbanization endeavour, the base for property taxes is bound toincrease. Thus, at this conjuncture - when taking the country's fiscal position and its development trajectoryinto account - the government has an opportunity to re-evaluate its IP tax policies and verify the feasibility ofutilizing such taxes to increase revenues.
Source: Bahl, R., and R. Bird (2008), "The Property Tax in Developing Countries: Current Practices and Prospects", in Towarda 2015 Vision of Land, Lincoln Institute of Land Policy, Taiwan; Trin, H..L. and W. McCluskey (2012). "Property TaxReform in Vietnam: A Work in Progress" in Papers on Municipal Finance and Governance, Volume VIII, Institute ofMunicipal Finance and Governance, Toronto.
Box 4.3Property Tax

STATE OF THE ECONOMY 2016
85
In the near term, the solution lies squarely in
reversing the progressive decline in Sri Lanka's
revenue collection efforts. The widespread and
ad hoc use of tax incentives as a tool to entice
investments has led to a severe erosion of the
tax base. This has also contr ibuted to
increasing the complexity of the tax structure,
leading to issues of monitoring and compliance.
Sri Lanka must urgently reevaluate this policy
stance in view of broadening the tax base and
rationalizing the tax structure with the broad
aim of simplifying revenue administration and
increasing compliance.
Another critical area of intervention that needs
attention is to address distributional
weaknesses of the current tax system.
Historically, Sri Lanka's tax structure has been
a regressive one, with the bulk of revenue
generated through production taxes. Whilst the
government expressed its intention to arrest this
trend and make the structure more progressive,
a number of recent tax policy changes
introduced in 2016 work counter to this stated
objective. With limited fiscal resources
constraining investments in social sectors such
as health and education and gaps in fiscal
support for social protection, especially of the
more vulnerable such as the elderly, regressive
tax structures will further undermine efforts
towards equitable growth and development in
the country.