fiscal policy in india: trends and trajectory - ministry of finance
TRANSCRIPT
0
Fiscal Policy in India: Trends and Trajectory
Supriyo De*
January, 2012
* Officer on Special Duty to the Chief Economic Adviser, Ministry of Finance, Government of India
1
Content
Page No.
Foreword 2
Disclaimer and acknowledgements 3
Abstract 3
Introduction 4
Basic concepts 5
India‟s fiscal policy architecture 6
Evolution of Indian fiscal policy till 1991 8
Liberalization, growth, inclusion and fiscal consolidation (1991-2008) 14
Crisis and return to fiscal consolidation: The maturing of Indian fiscal policy? 20
Conclusion 25
References 26
2
Foreword
In the rush to produce urgent policy documents and briefing notes that any
government has to do, it is easy to let matters that may not be quite as urgent
to go unattended. However, the not-so-urgent often includes matters of great
importance for the long-run well-being of the nation and its citizenry.
Research papers on topics of strategic economic policy fall in this category.
The Economic Division in the Department of Economic Affairs, Ministry of
Finance, has initiated this Working Paper series to make available to the
Indian policymaker, as well as the academic and research community
interested in the Indian economy, papers that are based on research done in
the Ministry of Finance and address matters that may or may not be of
immediate concern but address topics of importance for India‟s sustained
and inclusive development. It is hoped that this series will serve as a forum
that gives shape to new ideas and provides space to discuss, debate and
disseminate them.
Kaushik Basu
January 18, 2011 Chief Economic Adviser
3
Disclaimer and Acknowledgements
The author would like to express his gratitude to the Australia India Institute, University
of Melbourne for hosting him for the Emerging Leaders Fellowship Programme during
which this paper was largely written. Special thanks are due to the Director of the
Institute, Professor Amitabh Mattoo for encouraging this effort. The author wishes to
thank Professor Kaushik Basu, Dipak Dasgupta, Professor Tsunao Okumura and
Professor Etsuro Shioji for encouragement for participating in the Emerging Leaders
Fellowship Programme of the Australia India Institute. Furthermore, the author thanks
Professor Kaushik Basu for his invaluable suggestions and comments. Thanks are also
due to Monica Sengupta De, without whose help and support, this endeavour would have
been impossible.
The views expressed in this essay are purely personal and do not necessarily express the
views of the institutions the author is associated with. This is a technical, academic and
research output.
Abstract
This essay examines the trajectory of India‟s fiscal policy with a focus on historical
trends, fiscal discipline frameworks, fiscal responses to the global financial crisis and
subsequent return to a fiscal consolidation path. The initial years of India‟s planned
development strategy were characterised by a conservative fiscal policy whereby deficits
were kept under control. The tax system was geared to transfer resources from the private
sector to fund the large public sector driven industrialization process and also cover
social welfare schemes. However, growth was anaemic and the system was prone to
inefficiencies. In the 1980s some attempts were made to reform particular sectors. But the
public debt increased, as did the fiscal deficit. India‟s balance of payments crisis of 1991
led to economic liberalisation. The reform of the tax system commenced. The fiscal
deficit was brought under control. When the deficit and debt situation again threatened to
go out of control in the early 2000s, fiscal discipline legalisations were instituted. The
deficit was brought under control and by 2007-08 a benign macro-fiscal situation with
high growth and moderate inflation prevailed. During the global financial crisis fiscal
policy responded with counter-cyclical measures including tax cuts and increases in
expenditures. The post-crisis recovery of the Indian economy is witnessing a correction
of the fiscal policy path towards a regime of prudence. In the future, the focus would
probably be on bringing in new tax reforms and better targeting of social expenditures.
4
Introduction
Fiscal policy deals with the taxation and expenditure decisions of the government.
Monetary policy, deals with the supply of money in the economy and the rate of interest.
These are the main policy approaches used by economic managers to steer the broad
aspects of the economy. In most modern economies, the government deals with fiscal
policy while the central bank is responsible for monetary policy. Fiscal policy is
composed of several parts. These include, tax policy, expenditure policy, investment or
disinvestment strategies and debt or surplus management. Fiscal policy is an important
constituent of the overall economic framework of a country and is therefore intimately
linked with its general economic policy strategy.
Fiscal policy also feeds into economic trends and influences monetary policy. When the
government receives more than it spends, it has a surplus. If the government spends more
than it receives it runs a deficit. To meet the additional expenditures, it needs to borrow
from domestic or foreign sources, draw upon its foreign exchange reserves or print an
equivalent amount of money.1 This tends to influence other economic variables. On a
broad generalisation, excessive printing of money leads to inflation. If the government
borrows too much from abroad it leads to a debt crisis. If it draws down on its foreign
exchange reserves, a balance of payments crisis may arise. Excessive domestic borrowing
by the government may lead to higher real interest rates and the domestic private sector
being unable to access funds resulting in the „crowding out‟ of private investment.
Sometimes a combination of these can occur. In any case, the impact of a large deficit on
long run growth and economic well-being is negative. Therefore, there is broad
agreement that it is not prudent for a government to run an unduly large deficit. However,
in case of developing countries, where the need for infrastructure and social investments
may be substantial, it sometimes argued that running surpluses at the cost of long-term
growth might also not be wise (Fischer and Easterly, 1990). The challenge then for most
developing country governments is to meet infrastructure and social needs while
managing the government‟s finances in a way that the deficit or the accumulating debt
burden is not too great.
This essay examines the trajectory of India‟s fiscal policy with particular focus on
historical trends, the development of fiscal discipline frameworks, the recent experience
of fiscal response to the global financial crisis and subsequent return to a fiscal
consolidation path. The initial years of India‟s planned development strategy were
characterised by a conservative fiscal policy whereby deficits were kept under control.
The tax system was geared to transfer resources from the private sector to fund the large
public sector driven industrialization process and also cover social welfare schemes.
Indirect taxes were a larger source of revenue than direct taxes. However, growth was
anaemic and the system was prone to inefficiencies. In the 1980s some attempts were
made to reform particular sectors and make some changes in the tax system. But the
public debt increased, as did the fiscal deficit. Triggered by higher oil prices and political
uncertainties, the balance of payments crisis of 1991 led to economic liberalisation. The
reform of the tax system commenced with direct taxes increasing their share in
1 The government‟s exclusive right and privilege to print money is known as „seigniorage‟.
5
comparison to indirect taxes. The fiscal deficit was brought under control. When the
deficit and debt situation again threatened to go out of control in the early 2000s, fiscal
discipline legalisations were instituted at the central level and in most states. The deficit
was brought under control and by 2007-08 a benign macro-fiscal situation with high
growth and moderate inflation prevailed. The global financial crisis tested the fiscal
policy framework and it responded with counter-cyclical measures including tax cuts and
increases in expenditures. The post-crisis recovery of the Indian economy is witnessing a
correction of the fiscal policy path towards a regime of prudence. In the future, the focus
would probably be on bringing in new tax reforms and better targeting of social
expenditures.
The paper is organised into seven sections. Section 1 is introductory in nature, Section 2
clarifies certain basic concepts and Section 3 outlines India‟s fiscal policy architecture.
Section 4 delineates the fiscal policy developments from the period of planned
development in the 1950s to the eve of the country‟s balance of payments crisis in 1991.
Section 5 describes developments following economic liberalisation and the move
towards fiscal consolidation till the global financial crisis in 2008. Section 6 traces the
role of fiscal policy during the crisis and post-crisis recovery of the Indian economy.
Section 7 concludes.
2. Basic concepts
At the outset, it is important to clarify certain basic concepts. The most elementary is
perhaps the difference between revenue and capital flows, be they receipts or
expenditures. While there are various complex legal and formal definitions for these
ideas, presenting some simplified and stylised conceptual clarifications is deemed
appropriate. A spending item is a capital expenditure if it relates to the creation of an
asset that is likely to last for a considerable period of time and includes loan
disbursements. Such expenditures are generally not routine in nature. By the same logic a
capital receipt arises from the liquidation of an asset including the sale of government
shares in public sector companies (disinvestments), the return of funds given on loan or
the receipt of a loan. This again usually arises from a comparatively irregular event and is
not routine. In contrast, revenue expenditures are fairly regular and generally intended to
meet certain routine requirements like salaries, pensions, subsidies, interest payments,
and the like. Revenue receipts represent regular „earnings‟, for instance tax receipts and
non-tax revenues including from sale of telecom spectrums.
There are various ways to represent and interpret a government‟s deficit. The simplest is
the revenue deficit which is just the difference between revenue receipts and revenue
expenditures.
Revenue Deficit = Revenue Expenditure – Revenue Receipts (that is Tax + Non-tax
Revenue)
A more comprehensive indicator of the government‟s deficit is the fiscal deficit. This is
the sum of revenue and capital expenditure less all revenue and capital receipts other than
6
loans taken. This gives a more holistic view of the government‟s funding situation since
it gives the difference between all receipts and expenditures other than loans taken to
meet such expenditures.
Fiscal Deficit = Total Expenditure (that is Revenue Expenditure + Capital Expenditure) –
(Revenue Receipts + Recoveries of Loans + Other Capital Receipts (that is all Revenue
and Capital Receipts other than loans taken))
“The gross fiscal deficit (GFD) of government is the excess of its total expenditure,
current and capital, including loans net of recovery, over revenue receipts (including
external grants) and non-debt capital receipts.” The net fiscal deficit is the gross fiscal
deficit reduced by net lending by government (Dasgupta and De, 2011). The gross
primary deficit is the GFD less interest payments while the primary revenue deficit is the
revenue deficit less interest payments.
3. India’s fiscal policy architecture
The Indian Constitution provides the overarching framework for the country‟s fiscal
policy. India has a federal form of government with taxing powers and spending
responsibilities being divided between the central and the state governments according to
the Constitution. There is also a third tier of government at the local level. Since the
taxing abilities of the states are not necessarily commensurate with their spending
responsibilities, some of the centre‟s revenues need to be assigned to the state
governments. To provide the basis for this assignment and give medium term guidance
on fiscal matters, the Constitution provides for the formation of a Finance Commission
(FC) every five years. Based on the report of the FC the central taxes are devolved to the
state governments. The Constitution also provides that for every financial year, the
government shall place before the legislature a statement of its proposed taxing and
spending provisions for legislative debate and approval. This is referred to as the Budget.
The central and the state governments each have their own budgets.
The central government is responsible for issues that usually concern the country as a
whole like national defence, foreign policy, railways, national highways, shipping,
airways, post and telegraphs, foreign trade and banking. The state governments are
responsible for other items including, law and order, agriculture, fisheries, water supply
and irrigation, and public health. Some items for which responsibility vests in both the
Centre and the states include forests, economic and social planning, education, trade
unions and industrial disputes, price control and electricity. There is now increasing
devolution of some powers to local governments at the city, town and village levels. The
taxing powers of the central government encompass taxes on income (except agricultural
income), excise on goods produced (other than alcohol), customs duties, and inter-state
sale of goods. The state governments are vested with the power to tax agricultural
income, land and buildings, sale of goods (other than inter-state), and excise on alcohol.
7
Besides the annual budgetary process, since 1950, India has followed a system of five-
year plans for ensuring long-term economic objectives. This process is steered by the
Planning Commission for which there is no specific provision in the Constitution. The
main fiscal impact of the planning process is the division of expenditures into plan and
non-plan components. The plan components relate to items dealing with long-term socio-
economic goals as determined by the ongoing plan process. They often relate to specific
schemes and projects. Furthermore, they are usually routed through central ministries to
state governments for achieving certain desired objectives. These funds are generally in
addition to the assignment of central taxes as determined by the Finance Commissions.
In some cases, the state governments also contribute their own funds to the schemes.
Non-plan expenditures broadly relate to routine expenditures of the government for
administration, salaries, and the like.
While these institutional arrangements initially appeared adequate for driving the
development agenda, the sharp deterioration of the fiscal situation in the 1980s resulted in
the balance of payments crisis of 1991, which would be discussed later. Following
economic liberalisation in 1991, when the fiscal deficit and debt situation again seemed
to head towards unsustainable levels around 2000, a new fiscal discipline framework was
instituted. At the central level this framework was initiated in 2003 when the Parliament
passed the Fiscal Responsibility and Budget Management Act (FRBMA).
Taxes are the main source of government revenues. Direct taxes are so named since they
are charged upon and collected directly from the person or organisation that ultimately
pays the tax (in a legal sense).2 Taxes on personal and corporate incomes, personal wealth
and professions are direct taxes. In India the main direct taxes at the central level are the
personal and corporate income tax. Both are till date levied through the same piece of
legislation, the Income Tax Act of 1961. Income taxes are levied on various head of
income, namely, incomes from business and professions, salaries, house property, capital
gains and other sources (like interest and dividends).3 Other direct taxes include the
wealth tax and the securities transactions tax. Some other forms of direct taxation that
existed in India from time to time but were removed as part of various reforms include
the estate duty, gift tax, expenditure tax and fringe benefits tax. The estate duty was
levied on the estate of a deceased person. The fringe benefits tax was charged on
employers on the value of in-kind non-cash benefits or perquisites received by employees
from their employers. Such perquisites are now largely taxed directly in the hands of
employees and added to their personal income tax. Some states charge a tax on
professions. Most local governments also charge property owners a tax on land and
buildings.
2 Economic theory indicates that the incidence of a tax depends on various factors. In the case of
commodity taxes these include the respective elasticties of supply and demand. 3 A capital gain (or loss) arises when a person sells off a capital asset. The gain (or loss) is the difference
between the price at which the asset was purchased and the price at which it is sold and represents an
appreciation (or fall) in value. Often an adjustment to the basic value of the asset is made to include factors
like cost inflation or economic depreciation due to wear and tear.
8
Indirect taxes are charged and collected from persons other than those who finally end up
paying the tax (again in a legal sense). For instance, a tax on sale of goods is collected by
the seller from the buyer. The legal responsibility of paying the tax to government lies
with the seller, but the tax is paid by the buyer. The current central level indirect taxes are
the central excise (a tax on manufactured goods), the service tax, the customs duty (a tax
on imports) and the central sales tax on inter-state sale of goods. The main state level
indirect tax is the post-manufacturing (that is wholesale and retail levels) sales tax (now
largely a value added tax with intra-state tax credit). The complications and economic
inefficiencies of this multiple cascading taxation across the economic value chain
(necessitated by the constitutional assignment of taxing powers) are discussed later in the
context of the proposed Goods and Services Tax (GST).
4. Evolution of Indian fiscal policy till 1991
India commenced on the path of planned development with the setting up of the Planning
Commission in 1950. That was also the year when the country adopted a federal
Constitution with strong unitary features giving the central government primacy in terms
of planning for economic development (Singh and Srinivasan, 2004). The subsequent
planning process laid emphasis on strengthening public sector enterprises as a means to
achieve economic growth and industrial development. The resulting economic framework
imposed administrative controls on various industries and a system of licensing and
quotas for private industries. Consequently, the main role of fiscal policy was to transfer
private savings to cater to the growing consumption and investment needs of the public
sector. Other goals included the reduction of income and wealth inequalities through
taxes and transfers, encouraging balanced regional development, fostering small scale
industries and sometimes influencing the trends in economic activities towards desired
goals (Rao and Rao, 2006).
In terms of tax policy, this meant that both direct and indirect taxes were focussed on
extracting revenues from the private sector to fund the public sector and achieve
redistributive goals. The combined centre and state tax revenue to GDP ratio increased
from 6.3 percent in 1950-51 to 16.1 percent in 1987-88.4 For the central government this
ratio was 4.1 percent of GDP in 1950-51 with the larger share coming from indirect taxes
at 2.3 percent of GDP and direct taxes at 1.8 percent of GDP. Given their low direct tax
levers, the states had 0.6 percent of GDP as direct taxes and 1.7 percent of GDP as
indirect taxes in 1950-51 (Rao and Rao, 2006).
The government authorised a comprehensive review of the tax system culminating in the
Taxation Enquiry Commission Report of 1953. However, the government then invited
the British economist Nicholas Kaldor to examine the possibility of reforming the tax
system. Kaldor found the system inefficient and inequitable given the narrow tax base
and inadequate reporting of property income and taxation. He also found the maximum
marginal income tax rate at 92 percent to be too high and suggested it be reduced to 45
4 The Indian financial year commences on the 1
st of April of a calendar year and ends on the 31
st of March
of the next calendar year.
9
percent. In view of his recommendations, the government revived capital gains taxation,
brought in a gift tax, a wealth tax and an expenditure tax (which was not continued due to
administrative complexities) (Herd and Leibfritz, 2008).
Despite Kaldor‟s recommendations income and corporate taxes at the highest marginal
rate continued to be extraordinarily high. In 1973-74, the maximum rate taking in to
account the surcharge was 97.5 percent for personal income above Rs. 0.2 million. The
system was also complex with as many as eleven tax brackets. The corporate income tax
was differential for widely held and closely held companies with the tax rate varying
from 45 to 65 percent for some widely held companies. Though the statutory tax rates
were high, given a large number of special allowances and depreciation, effective tax
rates were much lower. The Direct Taxes Enquiry Committee of 1971 found that the high
tax rates encouraged tax evasion. Following its recommendations in 1974-75 the personal
income tax rate was brought down to 77 percent but the wealth tax rate was increased.
The next major simplification was in 1985-86 when the number of tax brackets was
reduced from eight to four and the highest income tax rate was brought down to 50
percent (Rao and Rao, 2006).
In indirect taxes, a major component was the central excise duty. This was initially used
to tax raw materials and intermediate goods and not final consumer goods. But by 1975-
76 it was extended to cover all manufactured goods. The excise duty structure at this time
was complicated and tended to distort economic decisions. Some commodities had
specific duties while others had ad valorem rates.5 The tax also had a major „cascading
effect‟ since it was imposed not just on final consumer goods but also on inputs and
capital goods. In effect, the tax on the input was again taxed at the next point of
manufacture resulting in double taxation of the input. Considering that the states were
separately imposing sales tax at the post-manufacturing wholesale and retail levels, this
cascading impact was considerable. The Indirect Tax Enquiry Report of 1977
recommended introduction of input tax credits to convert the cascading manufacturing
tax into a manufacturing value added tax (MANVAT). Instead, the modified value added
tax (MODVAT) was introduced in a phased manner from 1986 covering only selected
commodities (Rao and Rao, 2006).
The other main central indirect tax is the customs duty. Given that imports into India
were restricted, this was not a very large source of revenue. The tariffs were high and
differentiated. Items at later stages of production like finished goods were taxed at higher
rates than those at earlier stages, like raw materials. Rates also differed on the basis of
perceived income elasticities with necessities taxed at lower rates than luxury goods. In
1985-86 the government presented its Long-Term Fiscal Policy stressing on the need to
reduce tariffs, have fewer rates and eventually remove quantitative limits on imports.
Some reforms were attempted but due to revenue raising considerations the tariffs in
terms of the weighted average rate increased from 38 percent in 1980-81 to 87 percent in
5 Specific duties are levied in terms of a certain amount for every unit, for instance a tax amount per litre of
alcohol or per hundred cigarettes. Ad valorem taxes are based on the value of the article or service to be
taxed at a certain rate. For instance a ten percent ad valorem sales or consumption tax rate would mean that
if a good worth Rs. 100 were purchased, a tax of Rs. 10 would be paid.
10
1989-90. By 1990-91 the tariff structure had a range of 0 to 400 percent with over 10
percent of imports subjected to tariffs of 120 percent or more. Further complications
arose from exemptions granted outside the budgetary process (Rao and Rao, 2006).
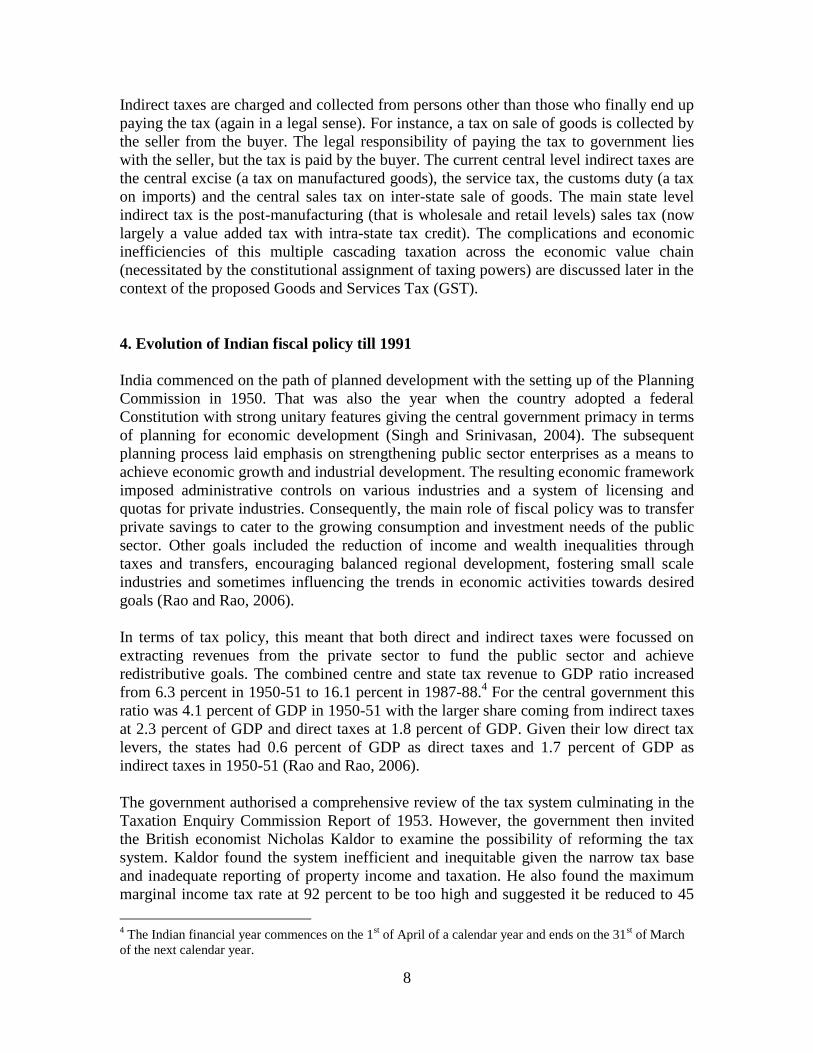
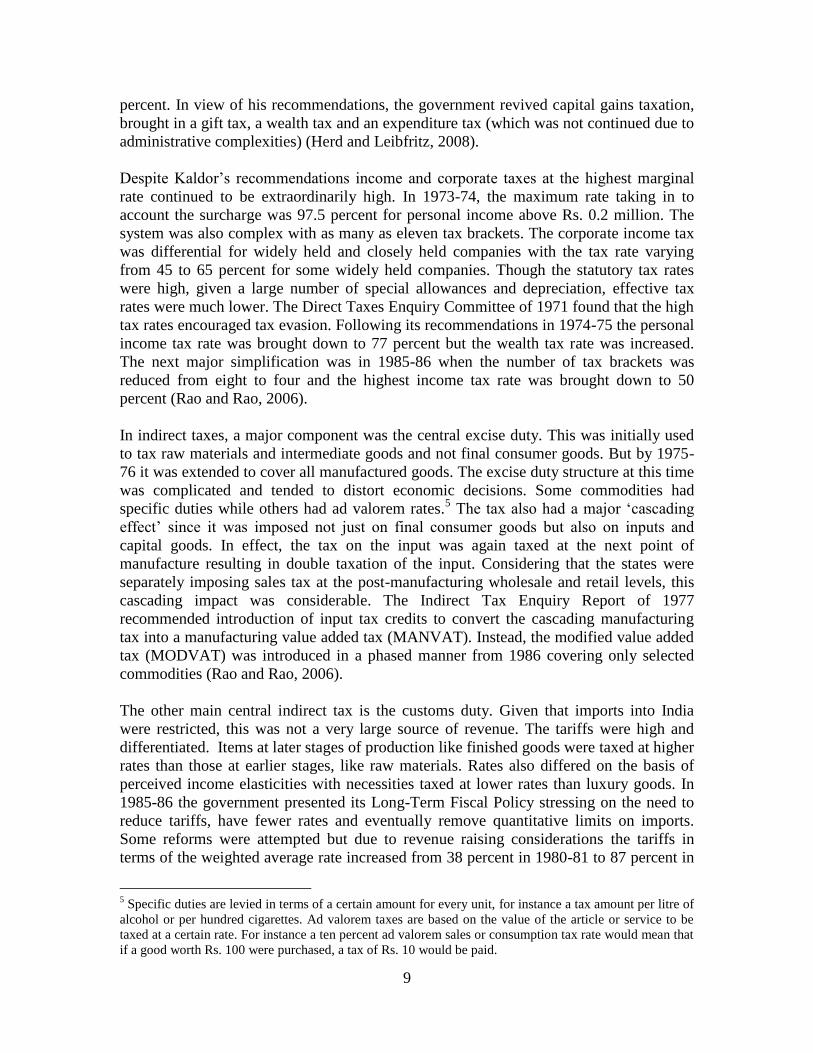
In 1970-71, direct taxes contributed to around 16 percent of the central government‟s
revenues, indirect taxes about 58 percent and the remaining 26 percent came from non-
tax revenues (Figure 1). By 1990-91, the share of indirect taxes had increased to 65
percent, direct taxes shrank to 13 percent and non-tax revenues were at 22 percent
(Figure 2).
Figure 1: Composition of central government revenues (1970-71)
1970-71
16%
58%
26%
Direct Tax
Indirect Tax
Non-tax Revenue
Data source: Database on the Indian Economy, http://dbie.rbi.org.in (Reserve Bank of India, 2011)
Figure 2: Composition of central government revenues (1990-91)
1990-91
13%
65%
22%
Direct Tax
Indirect Tax
Non-tax Revenue
Data source: Database on the Indian Economy, http://dbie.rbi.org.in (Reserve Bank of India, 2011)
11
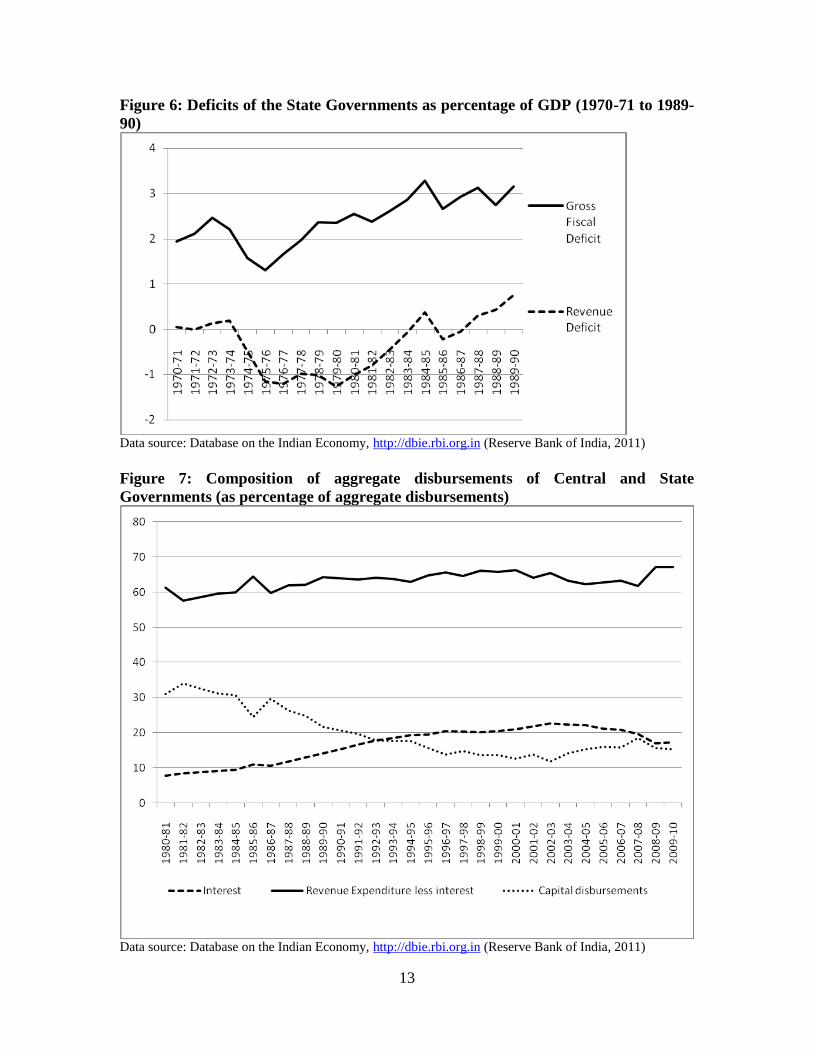
India‟s expenditure norms remained conservative till the 1980s. From 1973-74 to 1978-
79 the central government continuously ran revenue surpluses. Its gross fiscal deficit also
showed a slow growth with certain episodes of downward movements (Figure 5). The
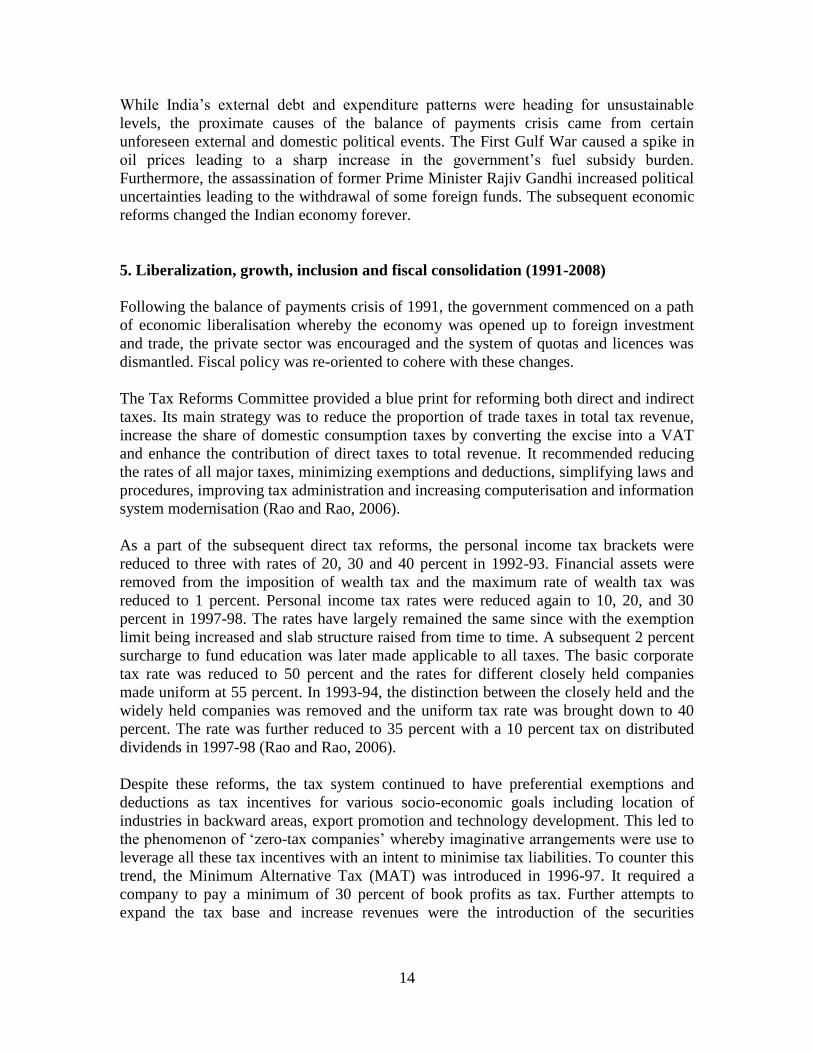
state governments also ran revenue surpluses from 1974-75 to 1986-87, barring only
1984-85 (Figure 6). Thereafter, limited reforms in specific areas including trade
liberalisation, export promotion and investment in modern technologies were
accompanied by increased expenditures financed by domestic and foreign borrowing
(Singh and Srinivasan, 2004). The central revenue deficit climbed from 1.4 percent of
GDP in 1980-81 to 2.44 percent of GDP by 1989-90. Across the same period the centre‟s
gross fiscal deficit (GFD) climbed from 5.71 percent to 7.31 percent of GDP. Though the
external liabilities of the centre fell from 7.16 percent of GDP in 1982-83 to 5.53 percent
of GDP by 1990-91, in absolute terms the liabilities were large. Across the same period
the total liabilities of the centre and the states increased from 51.43 percent of GDP to
64.75 percent of GDP.
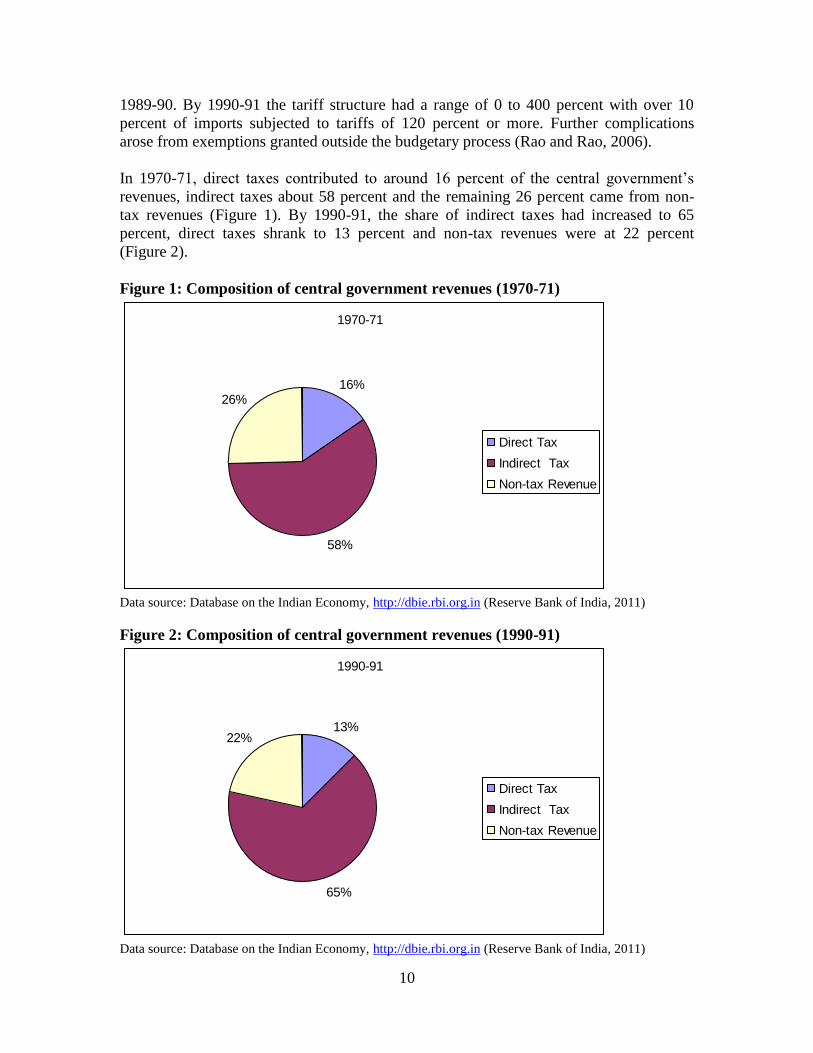
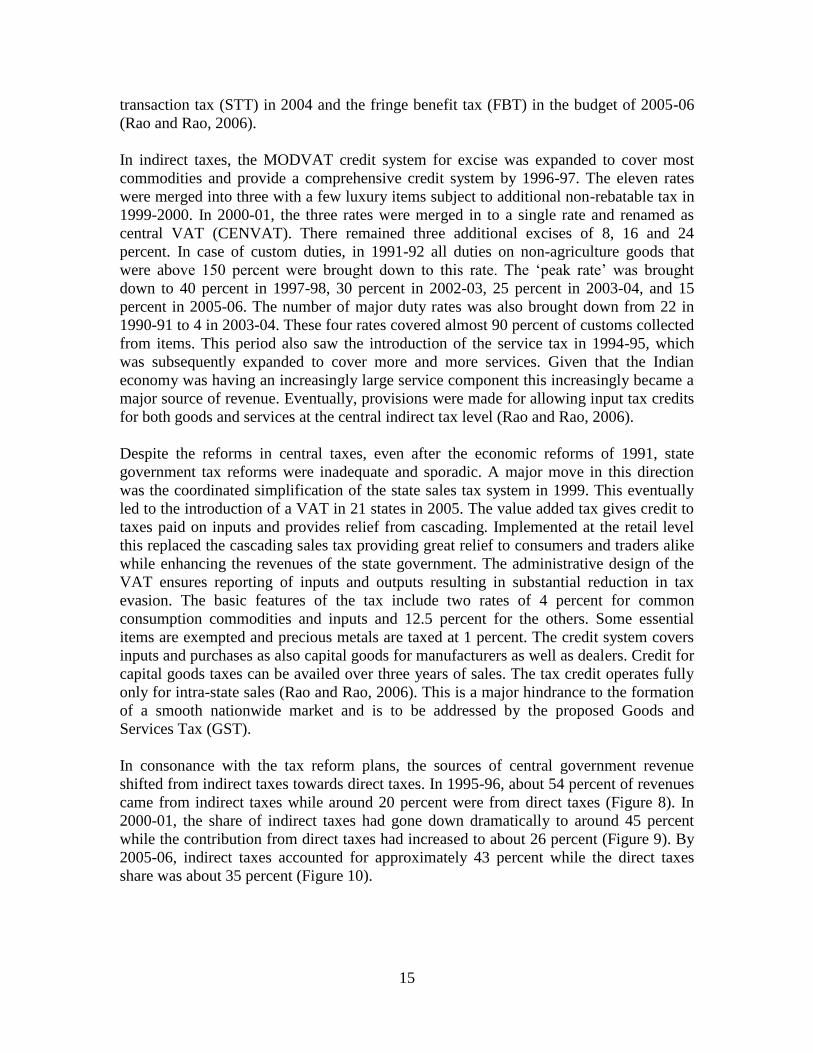
This came at the cost of social and capital expenditures. The interest component of
aggregate central and state government disbursements reflects this quite clearly. The
capital disbursements decreased from around 30 percent in 1980-81 to about 20 percent
by 1990-91. In contrast, the interest component increased from around 8 percent to about
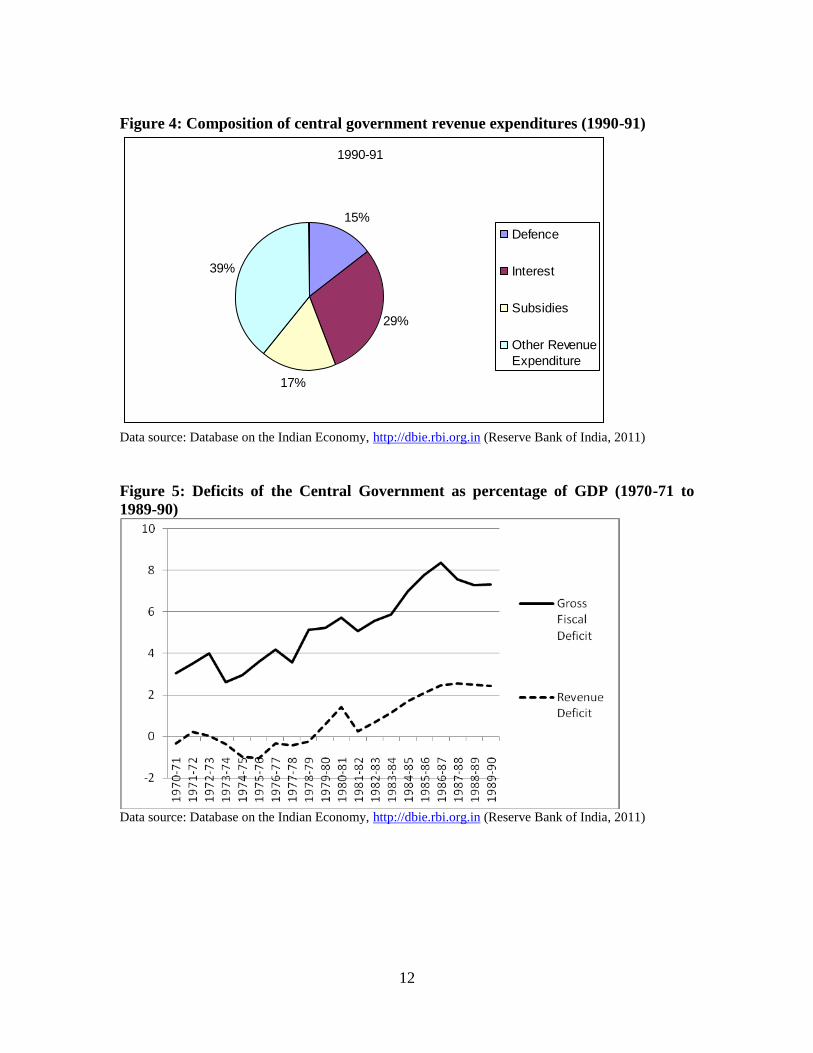
15 percent across the same period (Figure 7). Within revenue expenditures, in 1970-71,
defence expenditures had the highest share of 34 percent, interest component was 19
percent while subsidies were only 3 percent (Figure 3). However, by 1990-91, the largest
component was the interest share of 29 percent with subsidies constituting 17 percent and
defence only 15 percent (Figure 4). Therefore, besides the burden of servicing the public
debt, the subsidy burden was also quite great.
Figure 3: Composition of central government revenue expenditures (1970-71)
1970-71
34%
19%3%
44%
Defence
Interest
Subsidies
Other Revenue
Expenditure
Data source: Database on the Indian Economy, http://dbie.rbi.org.in (Reserve Bank of India, 2011)
12
Figure 4: Composition of central government revenue expenditures (1990-91)
1990-91
15%
29%
17%
39%
Defence
Interest
Subsidies
Other Revenue
Expenditure
Data source: Database on the Indian Economy, http://dbie.rbi.org.in (Reserve Bank of India, 2011)
Figure 5: Deficits of the Central Government as percentage of GDP (1970-71 to
1989-90)
Data source: Database on the Indian Economy, http://dbie.rbi.org.in (Reserve Bank of India, 2011)
13
Figure 6: Deficits of the State Governments as percentage of GDP (1970-71 to 1989-
90)
Data source: Database on the Indian Economy, http://dbie.rbi.org.in (Reserve Bank of India, 2011)
Figure 7: Composition of aggregate disbursements of Central and State
Governments (as percentage of aggregate disbursements)
Data source: Database on the Indian Economy, http://dbie.rbi.org.in (Reserve Bank of India, 2011)
14
While India‟s external debt and expenditure patterns were heading for unsustainable
levels, the proximate causes of the balance of payments crisis came from certain
unforeseen external and domestic political events. The First Gulf War caused a spike in
oil prices leading to a sharp increase in the government‟s fuel subsidy burden.
Furthermore, the assassination of former Prime Minister Rajiv Gandhi increased political
uncertainties leading to the withdrawal of some foreign funds. The subsequent economic
reforms changed the Indian economy forever.
5. Liberalization, growth, inclusion and fiscal consolidation (1991-2008)
Following the balance of payments crisis of 1991, the government commenced on a path
of economic liberalisation whereby the economy was opened up to foreign investment
and trade, the private sector was encouraged and the system of quotas and licences was
dismantled. Fiscal policy was re-oriented to cohere with these changes.
The Tax Reforms Committee provided a blue print for reforming both direct and indirect
taxes. Its main strategy was to reduce the proportion of trade taxes in total tax revenue,
increase the share of domestic consumption taxes by converting the excise into a VAT
and enhance the contribution of direct taxes to total revenue. It recommended reducing
the rates of all major taxes, minimizing exemptions and deductions, simplifying laws and
procedures, improving tax administration and increasing computerisation and information
system modernisation (Rao and Rao, 2006).
As a part of the subsequent direct tax reforms, the personal income tax brackets were
reduced to three with rates of 20, 30 and 40 percent in 1992-93. Financial assets were
removed from the imposition of wealth tax and the maximum rate of wealth tax was
reduced to 1 percent. Personal income tax rates were reduced again to 10, 20, and 30
percent in 1997-98. The rates have largely remained the same since with the exemption
limit being increased and slab structure raised from time to time. A subsequent 2 percent
surcharge to fund education was later made applicable to all taxes. The basic corporate
tax rate was reduced to 50 percent and the rates for different closely held companies
made uniform at 55 percent. In 1993-94, the distinction between the closely held and the
widely held companies was removed and the uniform tax rate was brought down to 40
percent. The rate was further reduced to 35 percent with a 10 percent tax on distributed
dividends in 1997-98 (Rao and Rao, 2006).
Despite these reforms, the tax system continued to have preferential exemptions and
deductions as tax incentives for various socio-economic goals including location of
industries in backward areas, export promotion and technology development. This led to
the phenomenon of „zero-tax companies‟ whereby imaginative arrangements were use to
leverage all these tax incentives with an intent to minimise tax liabilities. To counter this
trend, the Minimum Alternative Tax (MAT) was introduced in 1996-97. It required a
company to pay a minimum of 30 percent of book profits as tax. Further attempts to
expand the tax base and increase revenues were the introduction of the securities
15
transaction tax (STT) in 2004 and the fringe benefit tax (FBT) in the budget of 2005-06
(Rao and Rao, 2006).
In indirect taxes, the MODVAT credit system for excise was expanded to cover most
commodities and provide a comprehensive credit system by 1996-97. The eleven rates
were merged into three with a few luxury items subject to additional non-rebatable tax in
1999-2000. In 2000-01, the three rates were merged in to a single rate and renamed as
central VAT (CENVAT). There remained three additional excises of 8, 16 and 24
percent. In case of custom duties, in 1991-92 all duties on non-agriculture goods that
were above 150 percent were brought down to this rate. The „peak rate‟ was brought
down to 40 percent in 1997-98, 30 percent in 2002-03, 25 percent in 2003-04, and 15
percent in 2005-06. The number of major duty rates was also brought down from 22 in
1990-91 to 4 in 2003-04. These four rates covered almost 90 percent of customs collected
from items. This period also saw the introduction of the service tax in 1994-95, which
was subsequently expanded to cover more and more services. Given that the Indian
economy was having an increasingly large service component this increasingly became a
major source of revenue. Eventually, provisions were made for allowing input tax credits
for both goods and services at the central indirect tax level (Rao and Rao, 2006).
Despite the reforms in central taxes, even after the economic reforms of 1991, state
government tax reforms were inadequate and sporadic. A major move in this direction
was the coordinated simplification of the state sales tax system in 1999. This eventually
led to the introduction of a VAT in 21 states in 2005. The value added tax gives credit to
taxes paid on inputs and provides relief from cascading. Implemented at the retail level
this replaced the cascading sales tax providing great relief to consumers and traders alike
while enhancing the revenues of the state government. The administrative design of the
VAT ensures reporting of inputs and outputs resulting in substantial reduction in tax
evasion. The basic features of the tax include two rates of 4 percent for common
consumption commodities and inputs and 12.5 percent for the others. Some essential
items are exempted and precious metals are taxed at 1 percent. The credit system covers
inputs and purchases as also capital goods for manufacturers as well as dealers. Credit for
capital goods taxes can be availed over three years of sales. The tax credit operates fully
only for intra-state sales (Rao and Rao, 2006). This is a major hindrance to the formation
of a smooth nationwide market and is to be addressed by the proposed Goods and
Services Tax (GST).
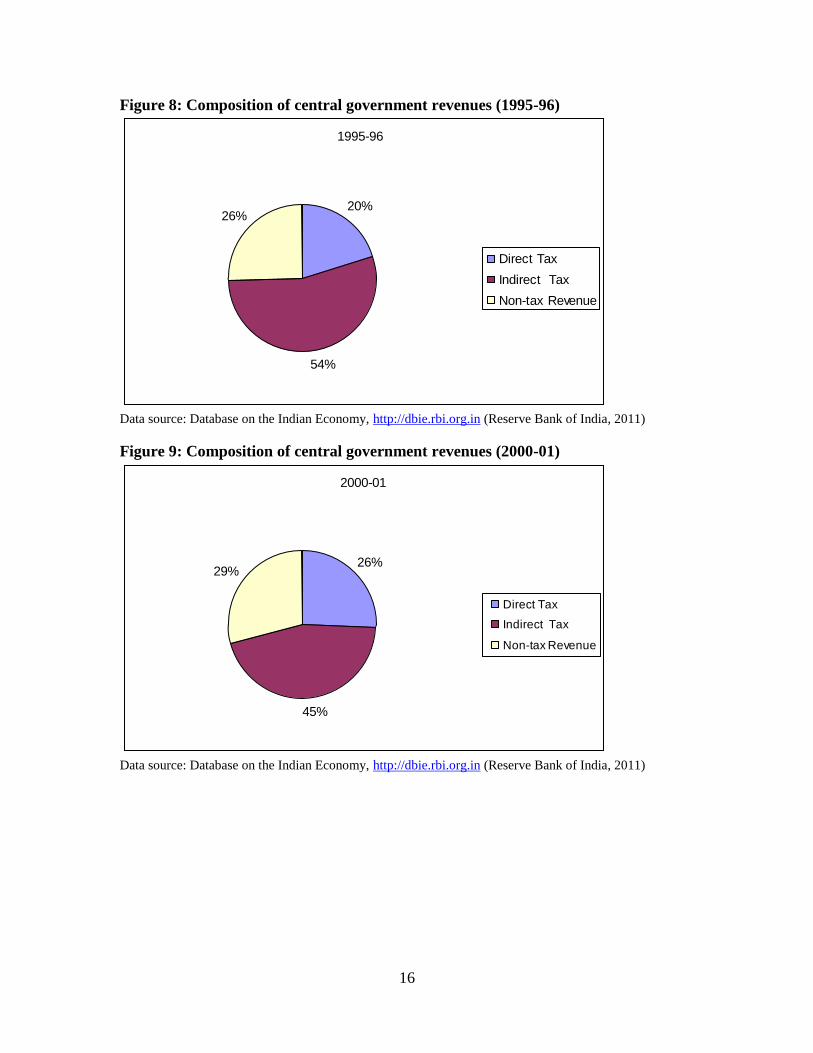
In consonance with the tax reform plans, the sources of central government revenue
shifted from indirect taxes towards direct taxes. In 1995-96, about 54 percent of revenues
came from indirect taxes while around 20 percent were from direct taxes (Figure 8). In
2000-01, the share of indirect taxes had gone down dramatically to around 45 percent
while the contribution from direct taxes had increased to about 26 percent (Figure 9). By
2005-06, indirect taxes accounted for approximately 43 percent while the direct taxes
share was about 35 percent (Figure 10).
16
Figure 8: Composition of central government revenues (1995-96)
1995-96
20%
54%
26%
Direct Tax
Indirect Tax
Non-tax Revenue
Data source: Database on the Indian Economy, http://dbie.rbi.org.in (Reserve Bank of India, 2011)
Figure 9: Composition of central government revenues (2000-01)
2000-01
26%
45%
29%
Direct Tax
Indirect Tax
Non-tax Revenue
Data source: Database on the Indian Economy, http://dbie.rbi.org.in (Reserve Bank of India, 2011)
17
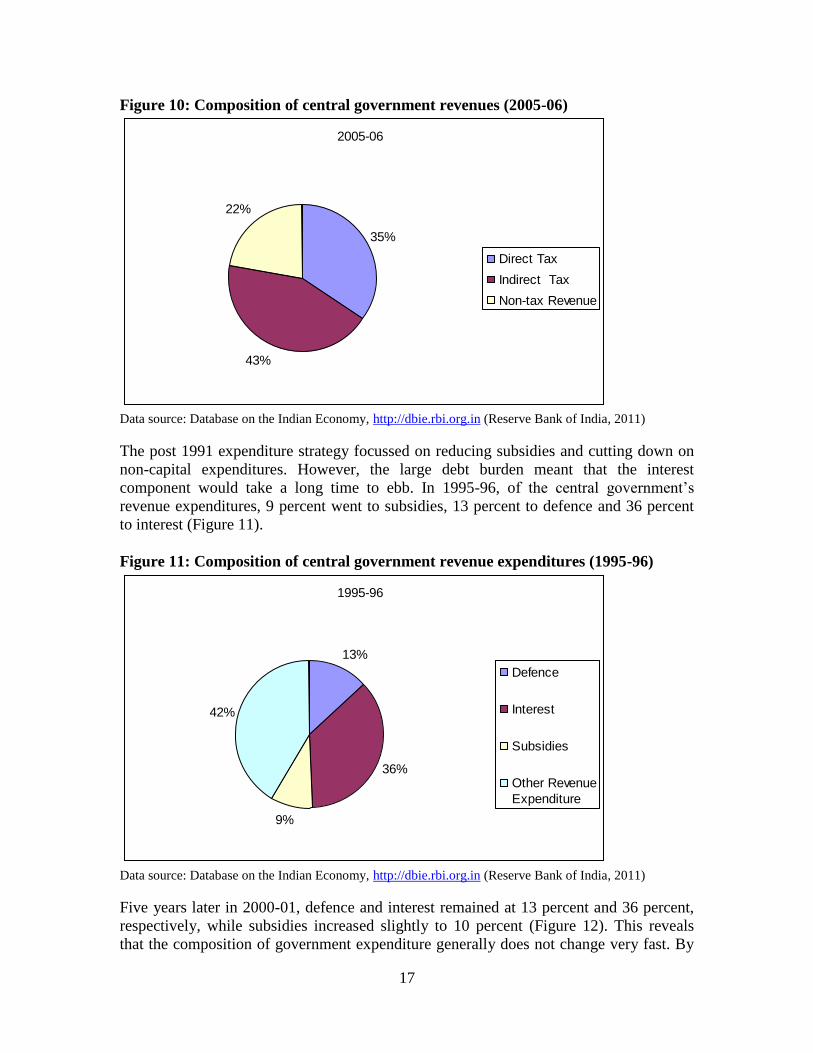
Figure 10: Composition of central government revenues (2005-06)
2005-06
35%
43%
22%
Direct Tax
Indirect Tax
Non-tax Revenue
Data source: Database on the Indian Economy, http://dbie.rbi.org.in (Reserve Bank of India, 2011)
The post 1991 expenditure strategy focussed on reducing subsidies and cutting down on
non-capital expenditures. However, the large debt burden meant that the interest
component would take a long time to ebb. In 1995-96, of the central government‟s
revenue expenditures, 9 percent went to subsidies, 13 percent to defence and 36 percent
to interest (Figure 11).
Figure 11: Composition of central government revenue expenditures (1995-96)
1995-96
13%
36%
9%
42%
Defence
Interest
Subsidies
Other Revenue
Expenditure
Data source: Database on the Indian Economy, http://dbie.rbi.org.in (Reserve Bank of India, 2011)
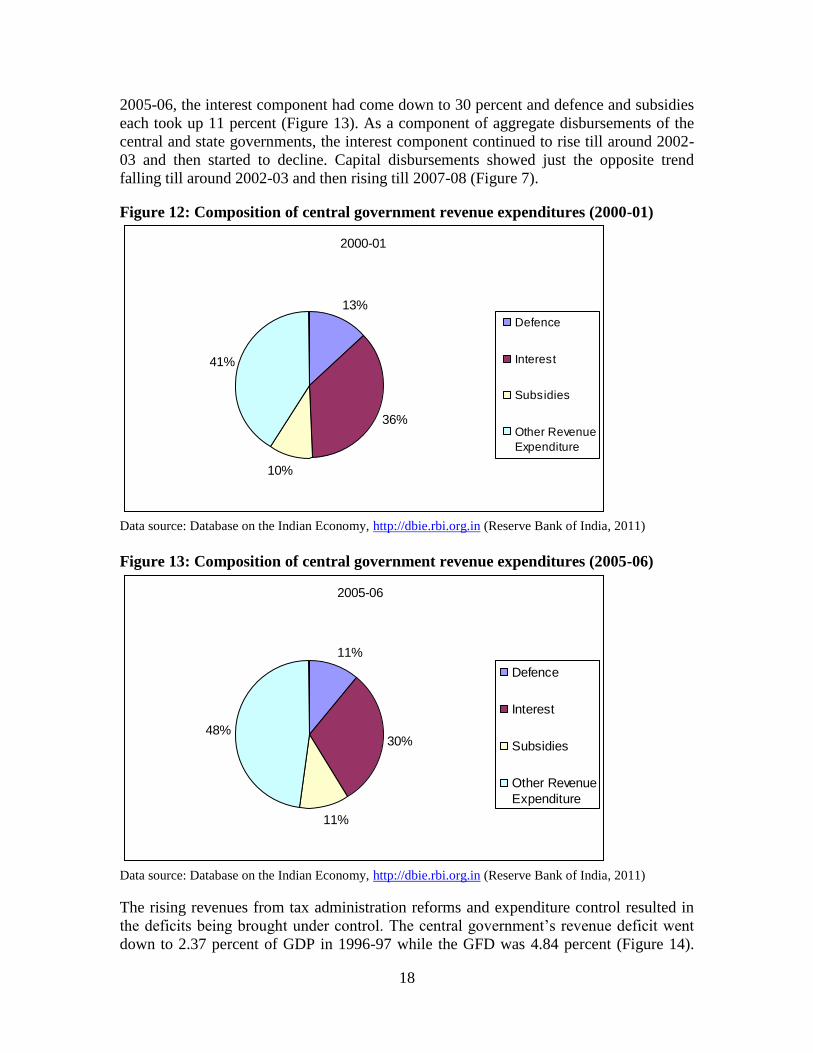
Five years later in 2000-01, defence and interest remained at 13 percent and 36 percent,
respectively, while subsidies increased slightly to 10 percent (Figure 12). This reveals
that the composition of government expenditure generally does not change very fast. By
18
2005-06, the interest component had come down to 30 percent and defence and subsidies
each took up 11 percent (Figure 13). As a component of aggregate disbursements of the
central and state governments, the interest component continued to rise till around 2002-
03 and then started to decline. Capital disbursements showed just the opposite trend
falling till around 2002-03 and then rising till 2007-08 (Figure 7).
Figure 12: Composition of central government revenue expenditures (2000-01)
2000-01
13%
36%
10%
41%
Defence
Interest
Subsidies
Other Revenue
Expenditure
Data source: Database on the Indian Economy, http://dbie.rbi.org.in (Reserve Bank of India, 2011)
Figure 13: Composition of central government revenue expenditures (2005-06)
2005-06
11%
30%
11%
48%
Defence
Interest
Subsidies
Other Revenue
Expenditure
Data source: Database on the Indian Economy, http://dbie.rbi.org.in (Reserve Bank of India, 2011)
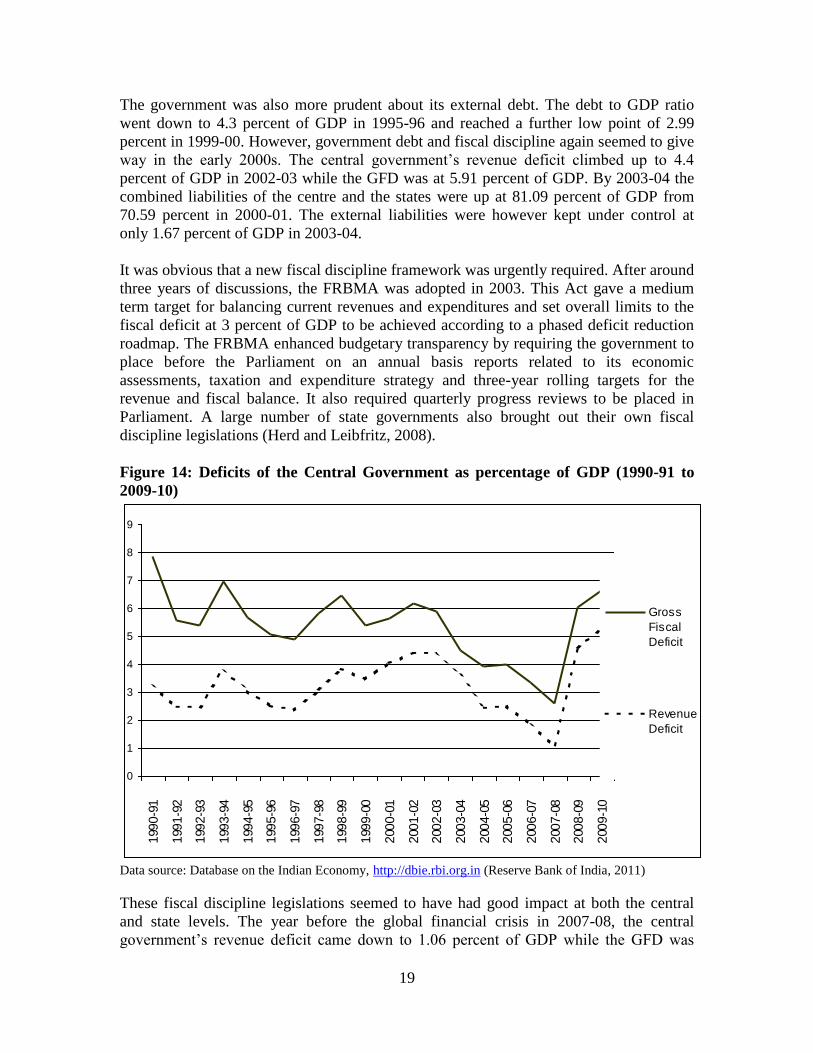
The rising revenues from tax administration reforms and expenditure control resulted in
the deficits being brought under control. The central government‟s revenue deficit went
down to 2.37 percent of GDP in 1996-97 while the GFD was 4.84 percent (Figure 14).
19
The government was also more prudent about its external debt. The debt to GDP ratio
went down to 4.3 percent of GDP in 1995-96 and reached a further low point of 2.99
percent in 1999-00. However, government debt and fiscal discipline again seemed to give
way in the early 2000s. The central government‟s revenue deficit climbed up to 4.4
percent of GDP in 2002-03 while the GFD was at 5.91 percent of GDP. By 2003-04 the
combined liabilities of the centre and the states were up at 81.09 percent of GDP from
70.59 percent in 2000-01. The external liabilities were however kept under control at
only 1.67 percent of GDP in 2003-04.
It was obvious that a new fiscal discipline framework was urgently required. After around
three years of discussions, the FRBMA was adopted in 2003. This Act gave a medium
term target for balancing current revenues and expenditures and set overall limits to the
fiscal deficit at 3 percent of GDP to be achieved according to a phased deficit reduction
roadmap. The FRBMA enhanced budgetary transparency by requiring the government to
place before the Parliament on an annual basis reports related to its economic
assessments, taxation and expenditure strategy and three-year rolling targets for the
revenue and fiscal balance. It also required quarterly progress reviews to be placed in
Parliament. A large number of state governments also brought out their own fiscal
discipline legislations (Herd and Leibfritz, 2008).
Figure 14: Deficits of the Central Government as percentage of GDP (1990-91 to
2009-10)
0
1
2
3
4
5
6
7
8
9
199
0-9
1
199
1-9
2
199
2-9
3
199
3-9
4
199
4-9
5
199
5-9
6
199
6-9
7
199
7-9
8
199
8-9
9
199
9-0
0
200
0-0
1
200
1-0
2
200
2-0
3
200
3-0
4
200
4-0
5
200
5-0
6
200
6-0
7
200
7-0
8
200
8-0
9
200
9-1
0
Gross
Fiscal
Deficit
Revenue
Deficit
Data source: Database on the Indian Economy, http://dbie.rbi.org.in (Reserve Bank of India, 2011)
These fiscal discipline legislations seemed to have had good impact at both the central
and state levels. The year before the global financial crisis in 2007-08, the central
government‟s revenue deficit came down to 1.06 percent of GDP while the GFD was
20
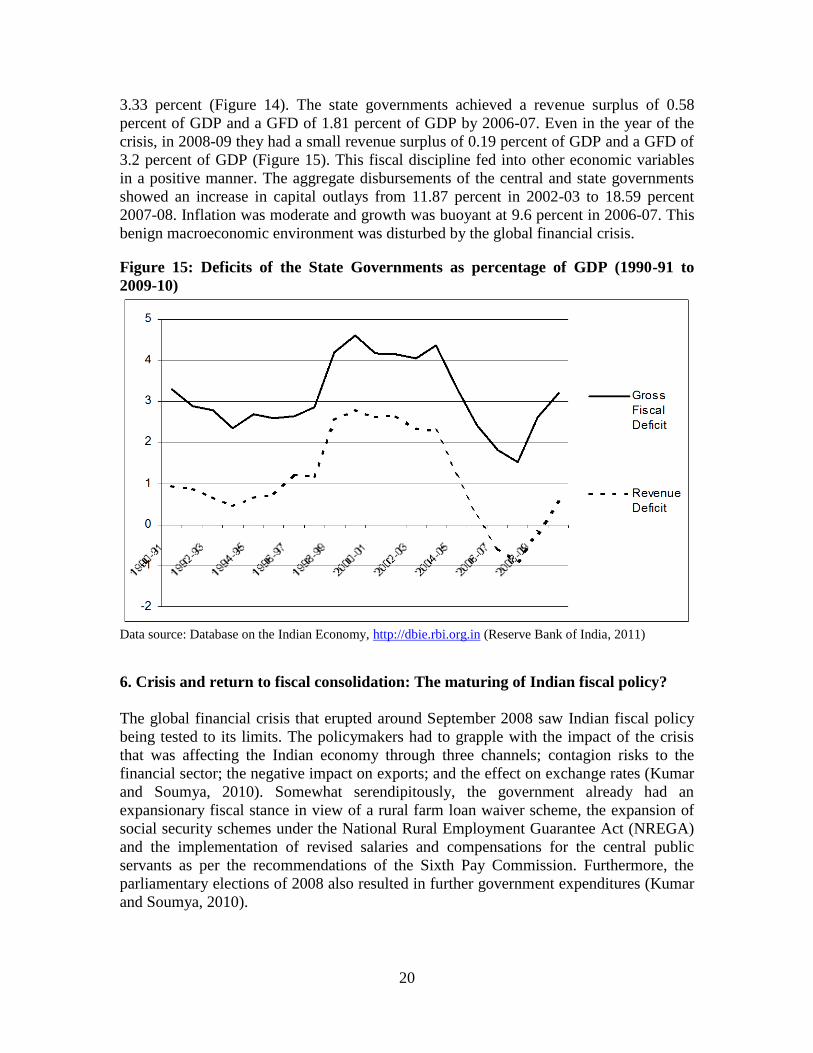
3.33 percent (Figure 14). The state governments achieved a revenue surplus of 0.58
percent of GDP and a GFD of 1.81 percent of GDP by 2006-07. Even in the year of the
crisis, in 2008-09 they had a small revenue surplus of 0.19 percent of GDP and a GFD of
3.2 percent of GDP (Figure 15). This fiscal discipline fed into other economic variables
in a positive manner. The aggregate disbursements of the central and state governments
showed an increase in capital outlays from 11.87 percent in 2002-03 to 18.59 percent
2007-08. Inflation was moderate and growth was buoyant at 9.6 percent in 2006-07. This
benign macroeconomic environment was disturbed by the global financial crisis.
Figure 15: Deficits of the State Governments as percentage of GDP (1990-91 to
2009-10)
Data source: Database on the Indian Economy, http://dbie.rbi.org.in (Reserve Bank of India, 2011)
6. Crisis and return to fiscal consolidation: The maturing of Indian fiscal policy?
The global financial crisis that erupted around September 2008 saw Indian fiscal policy
being tested to its limits. The policymakers had to grapple with the impact of the crisis
that was affecting the Indian economy through three channels; contagion risks to the
financial sector; the negative impact on exports; and the effect on exchange rates (Kumar
and Soumya, 2010). Somewhat serendipitously, the government already had an
expansionary fiscal stance in view of a rural farm loan waiver scheme, the expansion of
social security schemes under the National Rural Employment Guarantee Act (NREGA)
and the implementation of revised salaries and compensations for the central public
servants as per the recommendations of the Sixth Pay Commission. Furthermore, the
parliamentary elections of 2008 also resulted in further government expenditures (Kumar
and Soumya, 2010).
21
As the crisis unfolded, the government activated a series of stimulus packages on 7th
December 2008, 2nd
January 2009 and 24th
February 2009. Actions included an overall
central excise duty cut of 4 percent, ramping up additional plan expenditure of about Rs.
200 billion, further state government borrowings for planned expenditure amounting to
around Rs. 300 billion, interest subsidies for export finance to support certain export
oriented industries, a further 2 percent reduction of central excise duties and service tax
for export industries (that is a total 6 percent central excise reduction). The impact of
these measures is estimated to be around 1.8 percent of GDP in 2008-09. If the increase
in public expenditure across the budgets of 2007-08 and 2008-09 is taken together it
amounted to about 3 percent of GDP (Kumar and Soumya, 2010).
Given its inherent strengths like a strong and prudently regulated financial sector, a well
managed capital account policy, large foreign exchange reserves, strong domestic
consumption and effective fiscal policy interventions, the Indian economy weathered the
financial crisis rather well. GDP growth declined to 5.8 percent (year-on-year) in the
second half of 2008-09 compared to 7.8 percent in the first half. By 2009-10 India‟s GDP
was growing at 8 percent (quick estimates (QE)). This increased to 8.5 percent in 2010-
11 (revised estimates (RE)).
It was now important that the process of fiscal consolidation be reinstated. This was a
delicate process where the fiscal tightening had to be achieved without prematurely
choking off the growth process. The Thirteenth Finance Commission (13th
FC) in its
report was keenly conscious of the need to return to the path of fiscal prudence and
provided a road map charting a set of desired fiscal deficit targets. The budget of 2010-11
adopted a calibrated exit policy targeting a fiscal deficit of 5.5 percent of GDP in 2010-11
from a level of 6.5 percent (inclusive of bonds in lieu of securities) in 2009-10 (Ministry
of Finance, 2011).
In course of 2010-11 the non-tax revenues from auction of telecom spectrum (3G and
broadband) resulted in higher than anticipated receipts. A conscious decision was taken
to increase allocation to priority sectors while adhering to the fiscal deficit target.
Ultimately the fiscal deficit for 2010-11 declined to a better than targeted 5.1 percent of
GDP. This was also an improvement over the 13th
FC roadmap target of 5.7 percent. The
government‟s medium term fiscal policy statement as mandated by the FRBMA for the
annual Budget 2011-12 projected continuing on a path of gradual adjustment at a pace
faster than that prescribed by the 13th
FC. The 2011-12 fiscal deficit target was set at 4.6
percent of GDP as against the 13th
FC target of 4.8 percent. The rationale for this was that
reducing the debt to GDP ratio at an accelerated pace would unlock more resources for
use in developmental programmes instead of debt servicing (Ministry of Finance, 2011).
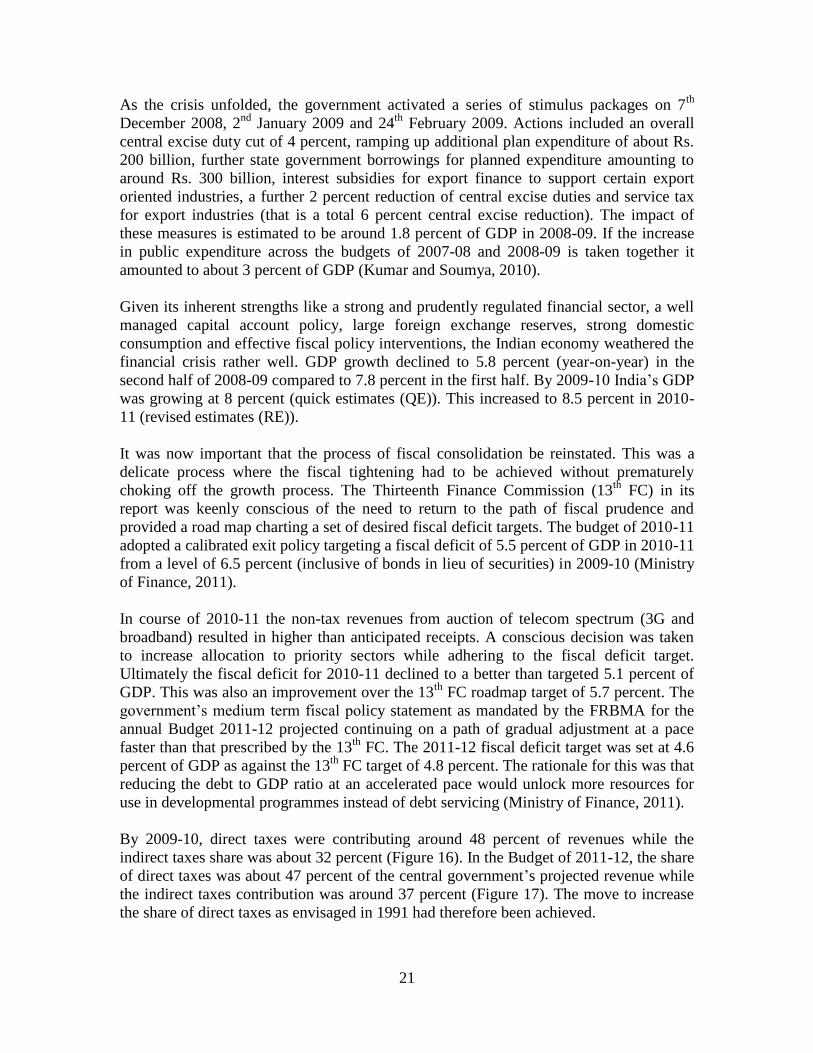
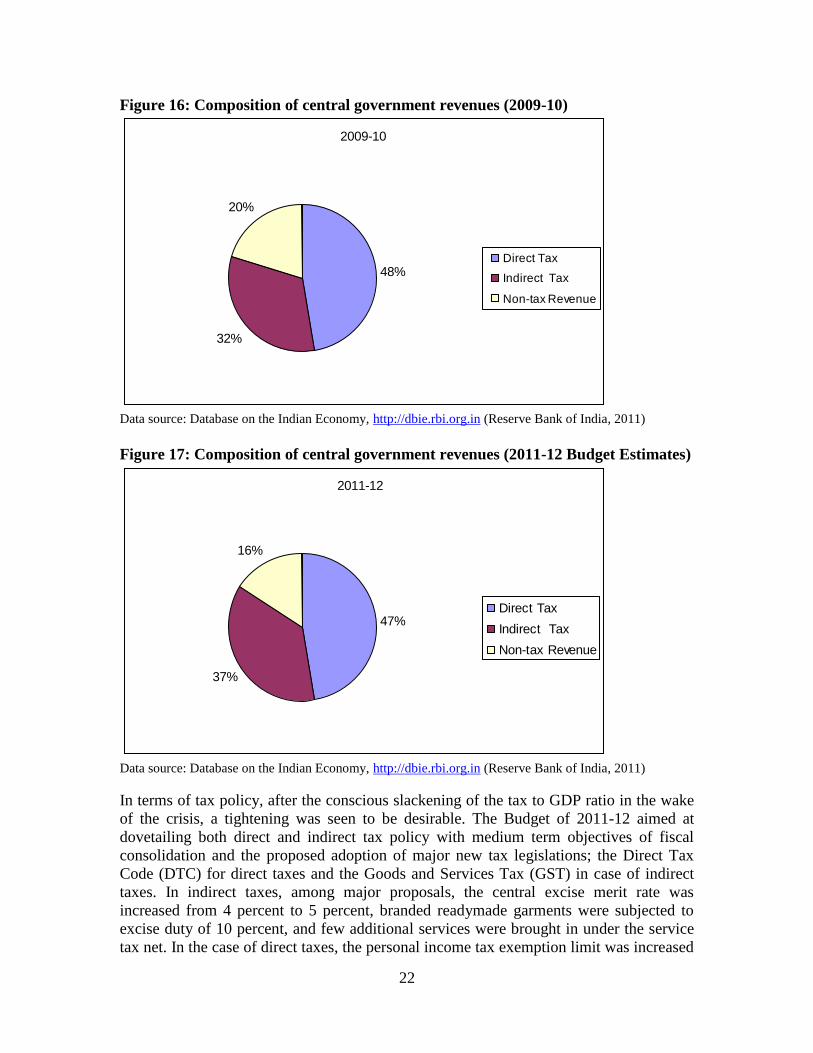
By 2009-10, direct taxes were contributing around 48 percent of revenues while the
indirect taxes share was about 32 percent (Figure 16). In the Budget of 2011-12, the share
of direct taxes was about 47 percent of the central government‟s projected revenue while
the indirect taxes contribution was around 37 percent (Figure 17). The move to increase
the share of direct taxes as envisaged in 1991 had therefore been achieved.
22
Figure 16: Composition of central government revenues (2009-10)
2009-10
48%
32%
20%
Direct Tax
Indirect Tax
Non-tax Revenue
Data source: Database on the Indian Economy, http://dbie.rbi.org.in (Reserve Bank of India, 2011)
Figure 17: Composition of central government revenues (2011-12 Budget Estimates)
2011-12
47%
37%
16%
Direct Tax
Indirect Tax
Non-tax Revenue
Data source: Database on the Indian Economy, http://dbie.rbi.org.in (Reserve Bank of India, 2011)
In terms of tax policy, after the conscious slackening of the tax to GDP ratio in the wake
of the crisis, a tightening was seen to be desirable. The Budget of 2011-12 aimed at
dovetailing both direct and indirect tax policy with medium term objectives of fiscal
consolidation and the proposed adoption of major new tax legislations; the Direct Tax
Code (DTC) for direct taxes and the Goods and Services Tax (GST) in case of indirect
taxes. In indirect taxes, among major proposals, the central excise merit rate was
increased from 4 percent to 5 percent, branded readymade garments were subjected to
excise duty of 10 percent, and few additional services were brought in under the service
tax net. In the case of direct taxes, the personal income tax exemption limit was increased
23
and the surcharge on corporate income tax for domestic companies was reduced from 7.5
percent to 5 percent resulting in the overall rate coming down from 33.2 percent to 32.4
percent. Certain changes were also made to the Minimum Alternate Tax (MAT)
provisions to maintain revenue neutrality and preserve horizontal equity as far as possible
(Ministry of Finance, 2011).
Figure 18: Composition of central government revenue expenditures (2009-10)
2009-10
10%
23%
16%
51%
Defence
Interest
Subsidies
Other Revenue
Expenditure
Data source: Database on the Indian Economy, http://dbie.rbi.org.in (Reserve Bank of India, 2011)
Figure 19: Composition of central government revenue expenditures (2011-12
Budget Estimates)
2011-12
9%
24%
13%
54%
Defence
Interest
Subsidies
Other Revenue
Expenditure
Data source: Database on the Indian Economy, http://dbie.rbi.org.in (Reserve Bank of India, 2011)
24
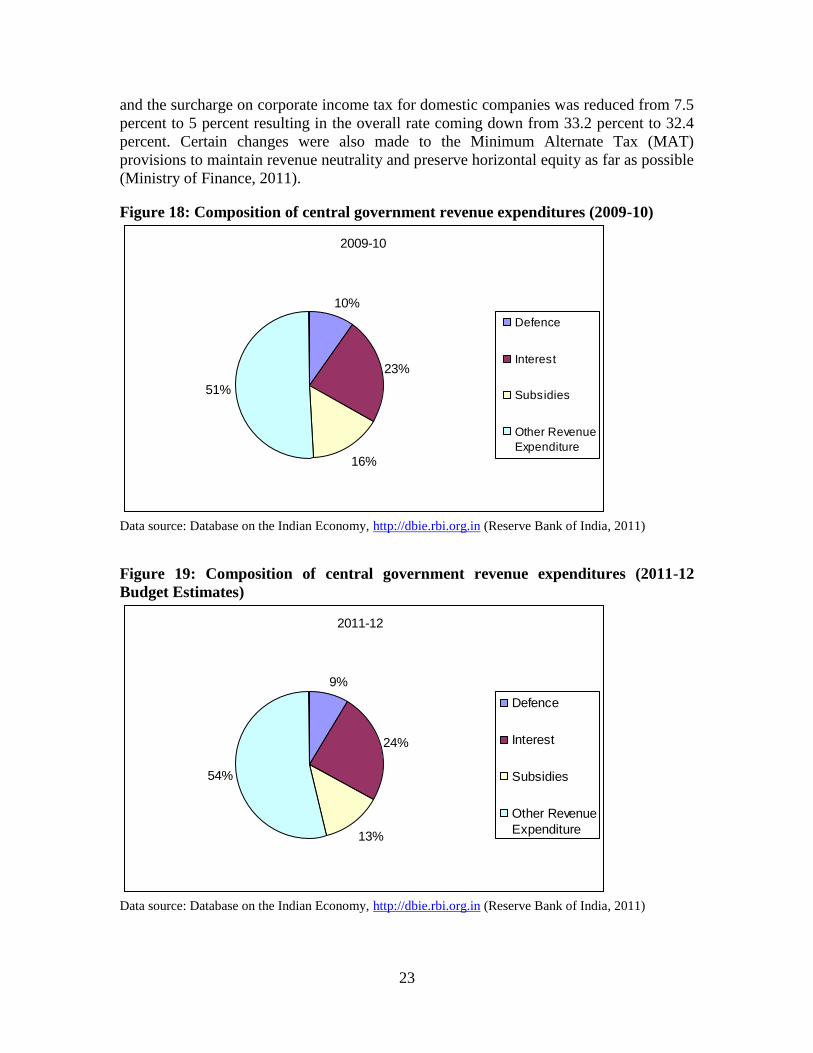
The government‟s expenditure management initiatives also seemed to have gathered
momentum with a focus on outcomes rather than allocations. For this select departments
are mandated to develop their „Result Framework Document‟ with an emphasis on
tracking measurable outcomes. In 2009-10, defence expenditures made up around 10
percent, subsidies 16 percent and interest 23 percent of revenue expenditures (Figure 18).
The situation remained more or less the same in the Budget of 2011-12, revealing once
again the largely slow changing nature of the composition of government expenditures.
Of the government‟s projected revenue expenditures for 2011-12, defence constitutes 9
percent, subsidies 13 percent and interest 24 percent (Figure 19).
It now appears that fiscal prudence and the desire to limit the public debt through better
revenue and expenditure outcomes has been fairly institutionalised in the Indian policy
matrix. This is probably partly attributable to the anchoring role played by the FRBMA
and the deficit reduction roadmaps put forward by the 13th
FC. Despite the temporary
deviation from stringent fiscal consolidation targets necessitated by the global financial
crisis, Indian fiscal policy is being steered rapidly back to the path of prudence. The
determination displayed by policymakers to set for themselves strict deficit reduction
targets, often exceeding those mandated by the 13th
FC appear to demonstrate that fiscal
discipline is here to stay.
Recent developments indicate that policymakers have come to accept strict budgetary
constraints, while attempting to maximise resources for developmental activities. The
Planning Commission abundantly reveals this in its preparatory reports for the 12th
Five
Year Plan (2012-17). The approach paper to the plan while projecting the centre‟s fiscal
resources assiduously envisages an average fiscal deficit of 3.25 percent of GDP for the
entire plan period with the fiscal deficit projected to come down from 4.1 percent in
2012-13 to 3.5 percent in 2013-14.It is then expected to remain at 3 percent of GDP for
the next three financial years. The gross budgetary support for the plan is kept realistic. It
is projected to increase from 4.92 percent of GDP in 2011-12 to 5.75 percent by the end
of the 12th
Plan. Similarly, revenue targets are projected at conservative levels. Net tax
revenue for the centre is expected to increase from 7.4 percent of GDP in 2011-12 to 8.91
percent in 2016-17. The gross tax to GDP ratio is projected to be 10.36 percent of GDP in
2011-12 rising to 12.3 percent by 2016-17. This is somewhat optimistic given that this
ratio previously peaked at 11.9 percent in 2007-08. It appears that the planners are relying
on critical tax reforms, especially the GST to deliver the much needed revenue boost.
Since chances of large non-tax revenues like spectrum auctions are unlikely, such
revenues are expected to fall from 1.4 percent of GDP in 2011-12 to 0.88 percent of GDP
in 2016-17. Similarly, non-debt capital receipts (mainly proceeds from disinvestment) are
expected to fall (Planning Commission, 2011).
Rather than rely on revenue performance alone, expenditure reforms with effective
targeting of subsidies appears to be a major policy strategy. For the 12th
Plan with regard
to non-plan expenditure, defence expenditure is projected to fall from 1.83 percent of
GDP in the base year (2011-12) to 1.56 percent in the final year (2016-17). Subsidies are
forecast to decline from 1.6 percent of GDP in 2011-12 to 1.24 percent of GDP in 2016-
17. They would still account for 18.8 percent of total projected non-plan expenditure
25
during the 12th
Plan. The ability to control subsidies would hinge critically on global oil
prices and the success of planned measures to target subsidies through improved delivery
mechanisms. While the former is beyond the control of policymakers, the latter would
then be a key focus area (Planning Commission, 2011).
Looking ahead, the government would probably focus on reforms on both the tax and
expenditure fronts. With regard to tax policy, changes can be expected in terms of
legislation as well as administrative reforms to improve efficiency. The main legislative
proposals are the DTC and the GST both of which are in various stages of legislative
consultation. The DTC seeks to simplify the tax code, revamp the system of tax
deductions and remove ambiguities of law. The GST aims at bringing a fairly unified
system of input tax credits across the value chain and at an interstate level. Currently the
central excise and service taxes have limited credit facilities up to the manufacturing
stage. The state VAT is not geared to provide interstate input tax credits. It is proposed to
institute a dual GST structure with separate central and state GSTs. This would require a
constitutional amendment to allow both the central and state governments to have
concurrent jurisdiction over the entire value chain. Interstate GST credit and full credit
for the central GST is envisaged. This would also require an advanced information
technology (IT) infrastructure (Empowered Committee, 2009). IT is also likely to be
further leveraged for improving the direct tax administration. Moves in this direction
include increasing the number of Centralised Processing Centres (CPCs) that carry out
bulk processing functions from one to four. The number of taxpayer help centres and
web-based taxpayer interface facilities are also to be increased substantially (Ministry of
Finance, 2011).
It also appears that there are moves to improve social expenditure outcomes and target
subsidies in a better manner. With respect to energy related subsidies in particular, given
the Integrated Energy Policy of 2009, the basic principle would be to equalise the prices
of domestic energy with that of imported energy while targeting subsidies to the poor and
needy (Planning Commission, 2011). Much of this would hinge on the adoption of new
techniques and technologies including IT based identification systems as proposed by the
Aadhar Unique Identification system.
7. Conclusion
This essay traced the major developments in India‟s fiscal policy from the early stages of
planned development in the 1950s, through the country‟s balance of payments crisis of
1991, the subsequent economic liberalisation and rapid growth phase, the response to the
global financial crisis of 2008 and the recent post-crisis moves to return to a path of fiscal
consolidation. India‟s fiscal policy in the phase of planned development commencing
from the 1950s to economic liberalisation in 1991 was largely characterised by a strategy
of using the tax system to transfer private resources to the massive investments in the
public sector industries and also achieve greater income equality. The result was high
maximum marginal income tax rates and the consequent tendency of tax evasion. The
public sector investments and social expenditures were also not efficient. Given these
apparent inadequacies, there were limited attempts to reform the system in the 1980s.
26
However, the path of debt-induced growth that was pursued partly contributed to the
balance of payments crisis of 1991.
Following the crisis of 1991, the government charted out a path of economic
liberalisation. Tax reforms focussed on lowering of rates and broadening of the tax base.
There were attempts to curb subsidies and disinvest the government holdings in the
public sector industries. While initially the fiscal deficit and public debt were brought
under control, the situation again started to deteriorate in the early 2000s. This induced
the adoption of fiscal responsibility legislations at the central and state levels. There were
also reforms in the state level tax system with the introduction of VAT. Consequently
there were major improvements in the public finances. This probably contributed to the
benign macro-fiscal environment of high growth, low deficits and moderate inflation that
prevailed around 2008. The global financial crisis brought an end to this phase as the
government was forced to undertake sharp counter-cyclical measures to prop up growth
in view of the global downturn. Measures included, excise duty cuts, fiscal support to
selected export industries and ramping up public expenditure.
The Indian economy weathered the global crisis rather well with growth going down to
5.8 percent in the second half of 2008-09 and then bouncing back to 8.5 percent in 2009-
10. In view of the recovery, a slow exit from the fiscal stimulus was attempted in a
manner whereby fiscal consolidation was achieved without hurting the recovery process.
Recent policy documents like the 12th
Plan Approach Paper and the government‟s Fiscal
Policy Strategy Statement of 2011-12 appear to indicate that the fiscal consolidation
mindset is fairly well institutionalised in the country‟s policy establishment (Planning
Commission, 2011; Ministry of Finance, 2011). This is partly reinforced by institutional
structures like fiscal responsibility legislations and the regular Finance Commissions that
mandate the federal fiscal transfer regime. In the future, it appears that the government
would focus on tax reforms and better targeting of social expenditures to achieve fiscal
consolidation while maintaining the process of inclusive growth.
References
Dasgupta, Dipak and Supriyo De. 2011. "Fiscal Deficit," in New Oxford Companion to
Economics in India. Kaushik Basu and Annemie Maertens eds. New Delhi: Oxford
University Press.
Empowered Committee of State Finance Ministers. 2009. "First Discussion Paper on
Goods and Services Tax in India."
Fischer, Stanley and William Easterly. 1990. "The Economics of the Government Budget
Constraint." The World Bank Research Observer, 5:2 (July 1990), pp. 127-42.
Herd, Richard and Willi Leibfritz. 2008. "Fiscal Policy in India: Past Reforms and Future
Challenges." Organisation for Economic Co-operation and Development, Economics
Department Working Paper No. 595.
Kumar, Rajiv and Alamuru Soumya. 2010. "Fiscal Policy Issues for India after the
Global Financial Crisis (2008-2010)." Asian Development Bank Institute, Working
Paper No. 249.
Ministry of Finance. 2011. "Fiscal Policy Strategy Statement (Budget 2011-12)."
27
Planning Commission. 2011. "Approach to the Twelfth Five Year Plan."
Rao, N. Govinda and R. Kavita Rao. 2006. "Trends and Issues in Tax Policy and Reform
in India." India Policy Forum, NCAER, www.ncaer.org/downloads/Journals/ipf0506-
paper2.pdf.
Reserve Bank of India. 2011. "Database on the Indian Economy, http://dbie.rbi.org.in,
date accessed 19th October 2011."
Singh, Nirvikar and T. N. Srinivasan. 2004. "Fiscal Policy in India: Lessons and
Priorities." Paper for the NIPFP-IMF conference on Fiscal Policy in India, New
Delhi.