fiscal policy statement 2008-09 - finance · fiscal policy statement, 2008 ‐ 09 acknowledgement...
TRANSCRIPT
Fiscal Policy Statement 2008-09
Debt Policy coordination Office (DPCO) Ministry of Finance
Government of Pakistan Islamabad, January 31, 2009
|Fiscal Policy Statem
ent, 2008‐09
TABLE OF CONTENTS
Table of Contents ................................................................................................ i
List of Tables ....................................................................................................... iii
Acknowledgements............................................................................................. v
List of Acronyms .................................................................................................. vii
I. Introduction ......................................................................................... 1
II. Fiscal Policy Statement…………………………………………… .......................... 3
III. Principles of Tax and Expenditure Policy .............................................. 4
III‐i. Principles of Tax Policy ............................................................... 4
III‐ii. Principles of Expenditure Policy ................................................. 6
IV. Fiscal Policy Developments ................................................................... 7
IV‐i. Fiscal Performance during 2007‐08 ............................................ 9
a) FBR Tax Collection & Refunds 2007‐08 ............................. 9
b) Review of Expenditure 2007‐08 ........................................ 24
c) Slippages in Budget 2007‐08 ............................................. 25
IV‐ii. Fiscal Projections for 2008‐09 .................................................... 29
V. Review of Public Debt .................................................................... 33
VI. Sustainability of Fiscal Policy ......................................................... 36
VII. Medium‐Term Budgetary Framework ........................................... 37
VIII. Public‐Private Partnership ............................................................. 37
IX. Report on Compliance with FRDL Act 2005 ................................... 38
X. Concluding Remarks ...................................................................... 40
i
| Fiscal Policy Statem
ent, 2008‐09
LIST OF TABLES
Table 1 : Fiscal Indicators as percent of GDP ...................................................... 7
Table 2 : Net Tax Collection (2006‐07 and 2007‐08) .......................................... 10
Table 3 : Contribution of Corporate Sector in Income Tax (Gross) ..................... 12
Table 4 : Withholding Tax Collection ................................................................. 14
Table 5 : Contribution of Major Revenue Spinners in Indirect Taxes ................. 15
Table 6 : Comparisons of Sales Tax Collection from Domestic Activity .............. 16
Table 7 : Sales Tax Collection at Import Stage (Major Items) ............................. 19
Table 8 : Sectoral Collection and Growth in Custom Duties ............................... 20
Table 9: Performance of Major Revenue Spinners of FED .................................. 23
Table 10: Consolidated Revenue & Expenditure Performance .......................... 24
Table 11: Variations in Budget 2007‐08.............................................................. 26
Table 12: Consolidated Government Budget 2007‐08 ....................................... 30
Table 13: Comparison of Revenue ...................................................................... 31
Table 14: FBR Revenue Collection July‐December 2008 .................................... 31
Table 15: Trends in Public Debt ......................................................................... 34
iii
|Fiscal Policy Statem
ent, 2008‐09
Acknowledgement This report has been prepared by the Debt Policy Coordination Office (DPCO) to fulfill the requirement laid out under Section 6 of the Fiscal Responsibility and Debt Limitation Act 2005. It is a result of concerted efforts of the core team of this office. I would like to thank various Ministries, Departments and Divisions for providing data in time to the DPCO. In particular, we would like to acknowledge the support from the Budget and External Finance Wings of the Ministry of Finance (MoF), the Federal Board of Revenue (FBR) and the Economic Affairs Division (EAD). I would also like to recognize the hard work put in by Fahd A. Zaidi, Economist and Shafaq Zaheer, Junior Economist at the Debt Office. Thanks are also due to Zafar‐ul‐Hassan, Deputy Economic Adviser, Economic Adviser Wing, for his valuable comments and inputs on the earlier draft of the report.
Dr. Ashfaque Hasan Khan Special Secretary Finance/ Director General (Debt Office) Ministry of Finance
v

| Fiscal Policy Statem
ent, 2008‐09
LIST OF ACRONYMS
BE Budget Estimate CBU Completely Built Unit CDNS Central Directorate of National Savings CKD Complete Knock Down COD Collection on Demand DPCO Debt Policy Coordination Office DSC Defense Saving Certificate FBR Federal Board of Revenue (formerly Central Board of Revenue) FED Federal Excise Duty FPS Fiscal Policy Statement FRDL Fiscal Responsibility and Debt Limitation Act 2005 GDP Gross Domestic Product GDR Global Depository Receipt GST General Sales Tax HSD High Speed Diesel IT Income Tax KESC Karachi Electric Supply Corporation LTU Large Taxpayer Unit MoF Ministry of Finance, Government of Pakistan MTBF Medium‐Term Budget Framework MTDF Medium Term Development Framework NAM New Accounting Model NSS National Saving Scheme PCT Pakistan Customs Tariff PIB Pakistan Investment Bonds POL Petroleum Oil and Lubricants PSDP Public Sector Development Program Q1 First Quarter of fiscal year RE Revised Estimate RTO Regional Tax Office SBP State Bank of Pakistan SED Special Excise Duty SNGPL Sui Northern Gas Pipe Line SSGPL Sui Southern Gas Pipe Line ST Sales Tax T‐Bills Treasury Bills USAS Universal Self Assessment Scheme VAT Value Added Tax VP Voluntary Payments WAPDA Water and Power Development Authority WCO World Customs Organization WHT Withholding Tax
vii
I . Introduction
1. The importance of a prudent fiscal policy cannot be overemphasized. A sound fiscal policy is essential for preventing macroeconomic imbalances and realizing full growth potential. Over the past several decades, there has been increasing acceptance worldwide that financial discipline over a prolonged period is essential for maintaining macroeconomic stability. There is also a general consensus that a prolonged commitment to financial discipline can only come from a rule‐based fiscal policy. A rule‐based fiscal policy basically represents the constraints and prevents government taking fiscally irresponsible route. International experience suggests that countries that have adopted well designed fiscal rules and implemented effective operational mechanism for enforcing them have made important credibility gains, reflected by cheaper access to financial markets and greater electoral support.
2. Fiscal policy rules require the government to commit to specific fiscal targets such as fiscal deficit; primary deficit or revenue deficit; debt reduction etc. The rationale for the rules mainly rests on the need for achieving objectives of macroeconomic stability, longer‐term sustainability of growth, support for other policies and overall policy transparency and credibility. In theory, most of these objectives can be met with discretionary fiscal measures within the ambit of a medium‐term budgetary framework. Decades of experience suggests that discretionary measures have often not been successful in achieving fiscal consolidation. This is because discretionary fiscal policy has inherent deficit ‘bias’ as benefits of profligate fiscal stance accrue entirely today and that too, only to the targeted group; while its costs show up after a lag and are borne by everyone in terms of higher taxes and lower spending. It is in this perspective that a well designed fiscal policy rules may offer a useful second best solution to counter pressures on fiscal policy making. A fiscal policy rule can be used as an instrument to get around deficit ‘bias’ and encourage fiscal sustainability and macroeconomic stability.
3. Pakistan has experienced serious macroeconomic imbalances in recent past mainly on account of its fiscal profligacy and accordingly paid a heavy price in terms of deceleration in economic growth and investment and the associated rise in the levels of poverty. It is in this perspective that a rule‐based fiscal policy, enshrined in the Fiscal Responsibility and Debt Limitation (FRDL) Act 2005, was passed by the Parliament in June 2005. The purpose of this Act was to inject financial discipline in the country. This Act ensures responsible and accountable fiscal management by all governments – the present and the future, and would encourage informed public debate about fiscal policy. It requires the government to be transparent about its short and long‐term fiscal intension and imposes high standards of fiscal disclosure.
4. This document, the Fiscal Policy Statement (FPS), reviews the overall fiscal developments of the last (2007‐08) as well as of the current fiscal years (2008‐09) with a view to fulfilling the legal requirement of Section 6 of the FRDL Act 2005. In
1
|Fiscal Policy Statem
ent, 2008‐09
particular, the Act requires that the FPS would analyze the performance of key fiscal indicators such as total revenue, overall fiscal deficit, revenue deficit and public debt. Besides, the FPS would also analyze whether any deviation with respect to fiscal targets has taken place during the period under review and whether the policies of the Federal Government have remained in conformity with the principles of sound fiscal and debt management and the targets set forth in the medium‐term budgetary statement in Section 5 of the Act. Furthermore, the FPS would also analyze, to the fullest extent possible, of all policy decisions made by the Federal Government that may have a material effect on meeting fiscal targets for the period under review as specified in the medium‐term budgetary statement.
5. Fiscal year 2007‐08 has been a difficult year for Pakistan’s economy in which many events transpired unexpectedly on both domestic and external fronts. Unstable political environment and adverse security developments owing to the intensification of the war against terror on domestic front; and unprecedented rise in oil, food and other commodity prices at breakneck pace along with slowdown in global economic activity on external front, adversely affected the performance of the economy in general and fiscal balance in particular. Absence of effective policy response during the political transition to a new government further accentuated the macroeconomic difficulties. Long delays in passing the large increases in international oil and food prices to the domestic consumers resulted in marked deterioration of fiscal and external positions. Monetization of the fiscal deficit contributed to the build up of inflationary pressure.
6. All these events have had adverse consequences for fiscal discipline. The hard earned macroeconomic stability underpinned by fiscal discipline has been undermined. One year of fiscal indiscipline was enough to cause severe macroeconomic imbalances for which Pakistan is likely to pay a heavy price in terms of sharp deceleration of economic growth and investment and the associated rise in unemployment and poverty; the widening of fiscal and current account deficits and the attendant rise in public and external debt burden; a loss of foreign exchange reserves and the associated pressure on exchange rate; and most importantly, higher inflation and the associated rise in interest rates. There is no better way to explain the central importance of fiscal discipline in promoting growth and investment. Fiscal year 2007‐08 will continue to remind that even one year of fiscal indiscipline can damage years of stable macroeconomic environment. The sooner Pakistan improves its fiscal position by making sharp fiscal adjustments, the lesser the price it is likely to pay for its fiscal indiscipline. The newly elected government is fully aware of the consequences of lax fiscal policy stance and has already taken several budgetary measures to restore fiscal balance. It has already eliminated oil subsidies and is committed to eliminating power subsidies by June 2009. It has also raised the support price of wheat to eliminate subsidies on wheat. It is reviewing the development outlay to restrict its size with available resources and also rationalizing its current expenditure.

2
| Fiscal Policy Statem
ent, 2008‐09
I I . Fiscal Policy Statement
7. The Fiscal Policy Statement is presented to fulfill the requirement in Section 6 of the Fiscal Responsibility and Debt Limitation (FRDL) Act 2005. The statement provides an overview of government revenues and expenditures during the course of the fiscal year and explains the changes in key macroeconomic indicators over 2007‐08 and early 2008‐09.
Section 6 of the FRDL Act 2005 requires that:
1) The Federal Government shall cause to be laid before the National Assembly the Fiscal Policy Statement by the end of January each year.
2) The Fiscal Policy Statement shall, inter alia, analyze the following key macroeconomic indicators, namely:‐
a) Total expenditures;
b) Total revenues;
c) Total fiscal deficit;
d) Revenue deficit; and
e) Total public debt
3) The Federal Government shall explain how fiscal indicators accord with the principles of sound fiscal and debt management.
4) The Fiscal Policy Statement shall also contain:‐
a) The key measures and rationale for any major deviation in fiscal measures pertaining to taxation, subsidy, expenditure, administrated pricing and borrowing;
b) An update on key information regarding macroeconomic indicators;
c) The strategic priorities of the Federal Government for the financial year in the fiscal area;
d) The analysis to the fullest extent possible of all policy decisions made by the Federal Government and all other circumstances that may have a material effect on meeting the targets for economic indicators for that fiscal year as specified in the Medium‐Term Budgetary Statement; and
e) An evaluation as to how the current policies of the Federal Government are in conformity with the principle of sound fiscal and debt management and the targets set forth in the Medium‐Term Budgetary Statement.
3
|Fiscal Policy Statem
ent, 2008‐09
I I I . Principles of Tax and Expenditure Policy
8. The central objective of government’s economic policy is to build a strong economy with a view to creating employment opportunities for all and improving the standards of living of the people of Pakistan. To achieve the objective, the government requires adequate resources. Taxation is an important tool to mobilize resources to meet expenditure requirements. However, in Pakistan’s economic history, the mismatch between revenue requirements and expenditure needs has been a norm rather than an exception. It is not surprising that Pakistan faced serious difficulties on the fiscal side and relied heavily on borrowing from both domestic and external sources to bridge the revenue – expenditure gap.
9. Why Pakistan faced large revenue – expenditure gap? The principal reason lies in the structural weaknesses of Pakistan’s tax system which is complex, that is, difficult to administer and comply with; it is inelastic, that is, unresponsive to growth and discretionary policy measures; it is inefficient because it raises little revenue but introduces serious economic distortion; it is inequitable as it treats individual and business in similar circumstances differently; and it is unfair because tax enforcement is selective and skewed in favour of those who have the ability to defeat the system.
10. The combined effects of these weaknesses resulted in low and stagnant tax‐to‐GDP ratio which compelled the successive governments to generate resources through surcharges and non‐tax revenues. The tax‐to‐GDP ratio, which represents the country’s fiscal effort, has remained stagnant in the neighborhood of 10‐12 percent over the last many years. Successive governments have introduced a number of wide‐ranging reforms since the 1990s which improved the structure of taxation but did not yield sufficient revenue as tax‐to‐GDP ratio remained low and stagnant. There is a general agreement that the present tax system can no longer serve the needs of the country. It is time to take a fresh look on Pakistan’s tax system and tax administration and propose options for reform.
III-i : Principles of Tax Policy
11. The guiding principles of an efficient tax system includes, (i) widening the tax base by reducing exemptions, incentives and concessions; (ii) reducing multiplicity of tax rates; (iii) lowering tax rates; (iv) shifting the incidence of tax burden from production to consumption; (v) moving away from the excessive reliance on manufacturing and taxing all value additions including services; (vi) enhancing the neutrality of the tax system to forms of business organizations and sources of finance; (vii) re‐engineering the business process of the tax system to overcome the culture of tax avoidance and evasion; and (viii) effecting business process changes in tax administration to establish an effective and efficient tax system.
4
| Fiscal Policy Statem
ent, 2008‐09
12. It should be the continuing endeavor of the government to operationalize these principles. An efficient tax system should raise enough resources to finance essential expenditures without recourse to excessive public sector borrowing and raise the revenues in ways that are equitable and that minimizes its disincentive effects on economic activities. Successive governments have introduced a number of wide ranging reforms since the 1990’s with a view to making tax policy more equitable, bringing more tax payers into the net, reducing the tax rates, streamlining the tax laws so as to make them tax‐payer friendly, improving tax enforcement and putting in place a tax administration that is efficient and responsive.
13. In recent years, there has been progress in the form of development of a strong taxpayer facilitation culture with a view to promoting voluntary tax compliance in a self‐assessment system of tax administration, tax‐payer education and facilitation; development of IT systems in some critical areas; significant progress in e‐filling and establishment of a modern Large Taxpayer Units (LTUs) / Regional Tax Offices (RTO’s) with upgraded infrastructure at many centers. In addition to this, some progress on the broadening of tax bases and strengthening of tax administration has also been made. Notwithstanding these developments, the facts remain that Pakistan’s tax‐to‐GDP ratio has remained stagnant during these periods. Therefore, there is a need to re‐examine the tax system and tax administration going forward.
14. There is increasing evidence that the present tax system can no longer serve the needs of the country. Pakistan’s economy has witnessed a major economic transformation over the last decade and accordingly its fiscal needs have also increased substantially. A rising level of economic activity and a growing population require massive investment in physical and human infrastructure to promote higher economic growth on a sustainable basis. Pakistan’s current tax system is not in a position to generate adequate resources to meet the growing needs of development. It is in this background that the present government is undertaking wide‐ranging tax policy and tax administration reforms. The objective of these reforms is to increase the tax‐to‐GDP ratio from 10.4% last year to 14.4% in the next five years. A number of tax policy and administrative measures are envisaged during this period. Specifically, an integrated tax administration organization on a functional basis which integrates both Income Tax and Sales Tax administration is to be established at the Federal Board of Revenue. In addition, audits will be reintroduced as part of a risk‐based audit strategy. As part of the process, the government plans to harmonize the Income Tax and GST laws, including for tax administration purposes, and reduce exemptions for both taxes.
15. On the tax policy agenda, the government will be working on improving the coverage and implementation of the GST so that it becomes a proper Value‐Added Tax (VAT). In terms of broadening the tax bases, the government is working towards global treatment of income under the Income Tax. This is needed to ensure greater equity in the tax system and also to prevent loopholes that encourage tax evasion and
5
|Fiscal Policy Statem
ent, 2008‐09
avoidance. The overall services sector, including wholesale, and retail trade, as well as agriculture are potential candidates for broadening the tax bases. The government is of the view that the broadening of tax bases will enable them to reduce marginal tax rates which will help further stimulate investment and production and will promote voluntary tax compliance. It will also ensure fair distribution of the tax burden among various sectors of the economy.
III-ii : Principles of Expenditure Policy
16. Raising the level and efficiency of public spending to achieve development goals expeditiously and at the least cost are guiding principles of the expenditure policy. The government is continuously making efforts to operationalize efficiency and efficacy of public spending. The government believes that resource allocation does not necessarily mean outcomes. What is needed is to re‐orient expenditures to extract better value of money. It is in this perspective that the government is striving for improving the quality of implementation and enhancing the efficiency and accountability of the delivery mechanism. It is equally true that when the effectiveness of public expenditure is found to be low, it is not always to do with under‐provisioning of key projects such as schools, hospitals, teachers, doctors etc. Rather, it is sometimes the result of a mismatch between demand and supply of public services (for example, in some instances the schools have been constructed far away from the main locality) ‐‐‐ resulting in weak demand and low utilization of public assets. Poor monitoring and evaluation systems and inadequate consultations with the beneficiaries about their needs appear to be the main reasons for low effectiveness of public spending.
17. In recent years, the government has introduced measures to increase the effectiveness, transparency and speed of implementation of public sector projects and schemes. The funds release procedures for development projects have been streamlined and are now linked to the approved cash/work‐plan of a project. As a result, the release of funds is now made according to the needs of the project, and not a predetermined schedule of release, thus improving the utilization of government expenditures.
18. Notwithstanding considerable improvements in effectiveness of public spending in recent years, there exists considerable scope for further improvements in the system. Many spending programs are being announced that are inconsistent with the resource base of the country and giving rise to the issue of throw forward, long delays in completion of projects/schemes and cost over‐run. The government is in the process of reviewing all the development projects with a view to prioritizing them, dropping the ones with low economic and social returns, and restricting the size of the development program with available resources.
6
| Fiscal Policy Statem
ent, 2008‐09
IV. Fiscal Policy Developments
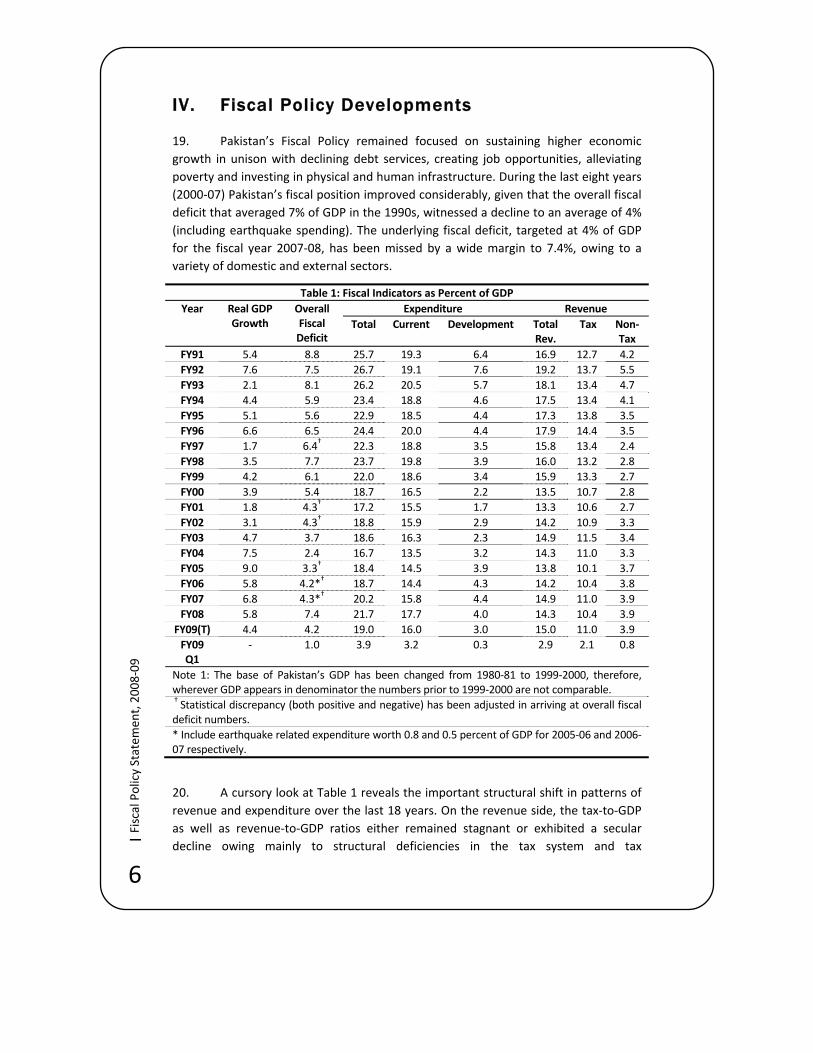
19. Pakistan’s Fiscal Policy remained focused on sustaining higher economic growth in unison with declining debt services, creating job opportunities, alleviating poverty and investing in physical and human infrastructure. During the last eight years (2000‐07) Pakistan’s fiscal position improved considerably, given that the overall fiscal deficit that averaged 7% of GDP in the 1990s, witnessed a decline to an average of 4% (including earthquake spending). The underlying fiscal deficit, targeted at 4% of GDP for the fiscal year 2007‐08, has been missed by a wide margin to 7.4%, owing to a variety of domestic and external sectors.
Table 1: Fiscal Indicators as Percent of GDP Year Real GDP
Growth Overall Fiscal Deficit
Expenditure Revenue Total Current Development Total
Rev. Tax Non‐
Tax FY91 5.4 8.8 25.7 19.3 6.4 16.9 12.7 4.2 FY92 7.6 7.5 26.7 19.1 7.6 19.2 13.7 5.5 FY93 2.1 8.1 26.2 20.5 5.7 18.1 13.4 4.7 FY94 4.4 5.9 23.4 18.8 4.6 17.5 13.4 4.1 FY95 5.1 5.6 22.9 18.5 4.4 17.3 13.8 3.5 FY96 6.6 6.5 24.4 20.0 4.4 17.9 14.4 3.5 FY97 1.7 6.4† 22.3 18.8 3.5 15.8 13.4 2.4 FY98 3.5 7.7 23.7 19.8 3.9 16.0 13.2 2.8 FY99 4.2 6.1 22.0 18.6 3.4 15.9 13.3 2.7 FY00 3.9 5.4 18.7 16.5 2.2 13.5 10.7 2.8 FY01 1.8 4.3† 17.2 15.5 1.7 13.3 10.6 2.7 FY02 3.1 4.3† 18.8 15.9 2.9 14.2 10.9 3.3 FY03 4.7 3.7 18.6 16.3 2.3 14.9 11.5 3.4 FY04 7.5 2.4 16.7 13.5 3.2 14.3 11.0 3.3 FY05 9.0 3.3† 18.4 14.5 3.9 13.8 10.1 3.7 FY06 5.8 4.2*† 18.7 14.4 4.3 14.2 10.4 3.8 FY07 6.8 4.3*† 20.2 15.8 4.4 14.9 11.0 3.9 FY08 5.8 7.4 21.7 17.7 4.0 14.3 10.4 3.9
FY09(T) 4.4 4.2 19.0 16.0 3.0 15.0 11.0 3.9 FY09 Q1
‐ 1.0 3.9 3.2 0.3 2.9 2.1 0.8
Note 1: The base of Pakistan’s GDP has been changed from 1980‐81 to 1999‐2000, therefore, wherever GDP appears in denominator the numbers prior to 1999‐2000 are not comparable. † Statistical discrepancy (both positive and negative) has been adjusted in arriving at overall fiscal deficit numbers. * Include earthquake related expenditure worth 0.8 and 0.5 percent of GDP for 2005‐06 and 2006‐07 respectively.
20. A cursory look at Table 1 reveals the important structural shift in patterns of revenue and expenditure over the last 18 years. On the revenue side, the tax‐to‐GDP as well as revenue‐to‐GDP ratios either remained stagnant or exhibited a secular decline owing mainly to structural deficiencies in the tax system and tax
7
|Fiscal Policy Statem
ent, 2008‐09
Fig 1: Total Expenditures and Revenues as % of GDP
12
14
16
18
20
22
24
26
28
FY91FY92
FY93FY94
FY95FY96
FY97FY98
FY99FY00
FY01FY02
FY03FY04
FY05FY06
FY07FY08
FY09 (T
)
1990-91 to 2008-09(T)
(%)
Budget Deficit
Total Expenditures
Total Revenues
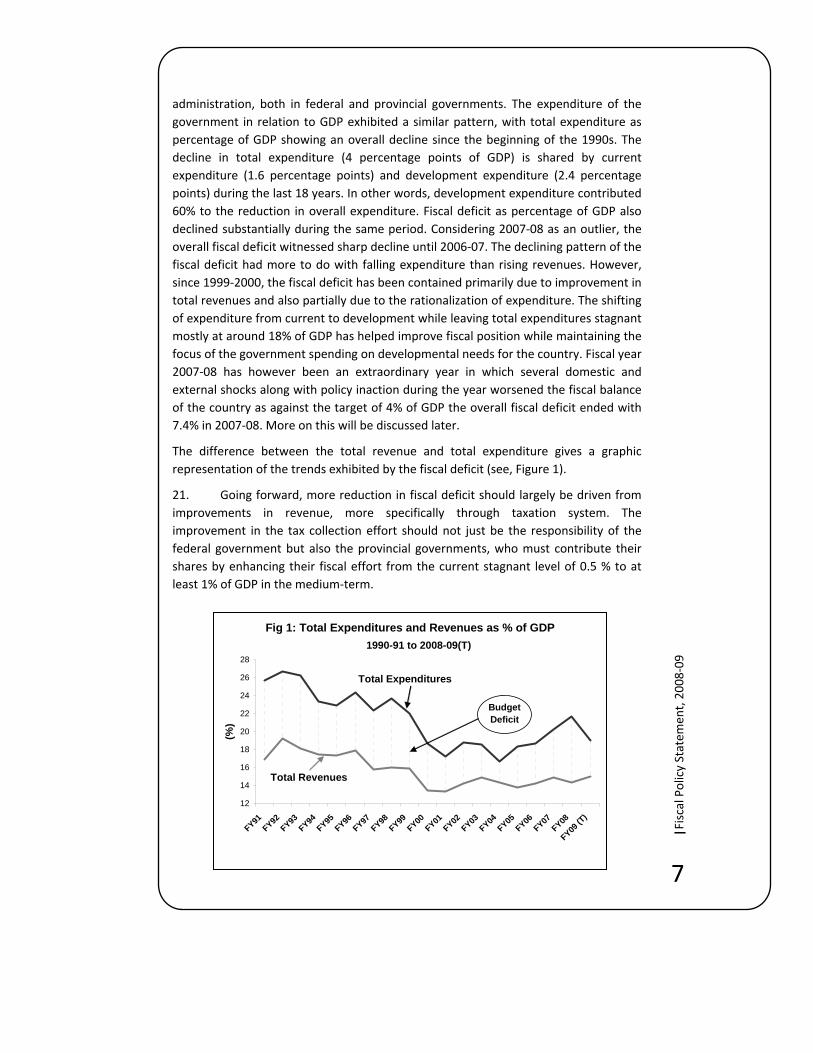
administration, both in federal and provincial governments. The expenditure of the government in relation to GDP exhibited a similar pattern, with total expenditure as percentage of GDP showing an overall decline since the beginning of the 1990s. The decline in total expenditure (4 percentage points of GDP) is shared by current expenditure (1.6 percentage points) and development expenditure (2.4 percentage points) during the last 18 years. In other words, development expenditure contributed 60% to the reduction in overall expenditure. Fiscal deficit as percentage of GDP also declined substantially during the same period. Considering 2007‐08 as an outlier, the overall fiscal deficit witnessed sharp decline until 2006‐07. The declining pattern of the fiscal deficit had more to do with falling expenditure than rising revenues. However, since 1999‐2000, the fiscal deficit has been contained primarily due to improvement in total revenues and also partially due to the rationalization of expenditure. The shifting of expenditure from current to development while leaving total expenditures stagnant mostly at around 18% of GDP has helped improve fiscal position while maintaining the focus of the government spending on developmental needs for the country. Fiscal year 2007‐08 has however been an extraordinary year in which several domestic and external shocks along with policy inaction during the year worsened the fiscal balance of the country as against the target of 4% of GDP the overall fiscal deficit ended with 7.4% in 2007‐08. More on this will be discussed later.
The difference between the total revenue and total expenditure gives a graphic representation of the trends exhibited by the fiscal deficit (see, Figure 1).
21. Going forward, more reduction in fiscal deficit should largely be driven from improvements in revenue, more specifically through taxation system. The improvement in the tax collection effort should not just be the responsibility of the federal government but also the provincial governments, who must contribute their shares by enhancing their fiscal effort from the current stagnant level of 0.5 % to at least 1% of GDP in the medium‐term.
8
| Fiscal Policy Statem
ent, 2008‐09
IV-i : Fiscal Performance during 2007-08
22. Fiscal year 2007‐08 has been a difficult year for Pakistan’s economy as many events occurred unexpectedly on domestic and external fronts. Heightened political tensions and adverse security developments owing to the intensification of the war against terror on the domestic front, and surge in oil, food and other commodity prices at unprecedented pace along with the turmoil in the international financial markets leading to a global economic meltdown on the external front, have had serious consequences for fiscal discipline. Absence of an effective policy response during the political transmission to a new government further accentuated the difficulties not only on the fiscal front but caused serious damages to the economy as a whole. The hard earned macroeconomic stability underpinned by fiscal discipline just evaporated in thin air, for which Pakistan is expected to pay a heavy price in terms of slower economic growth and investment with associated rise in unemployment and poverty; higher current account deficit and the attendant rise in the country’s debt burden; a loss of foreign exchange reserves and the concomitant pressure on exchange rate; and most importantly, higher inflation and the associated rise in interest rates. This section reviews the performance of revenue and expenditure during the fiscal year 2007‐08. In particular, it attempts to answer as to what happened in terms of slippages of revenue and massive overspending, resulting in the surge in fiscal deficit for the year 2007‐08
23. The total revenue collected during the year 2007‐08 stood at Rs 1,499 billion against the budget estimate of Rs. 1,476 billion, thus surpassing the target by Rs 23 billion, mainly on account of higher‐than‐targeted non‐tax revenues. Tax revenue at Rs. 1,051 billion, witnessed a decline of Rs 45 billion from the target for the year. Within overall tax revenue, the collection by the FBR showed a decline of Rs 18 billion, that is, the FBR collected Rs. 1,007 billion against the target of Rs. 1,025 billion. Since FBR revenue accounts for almost 96 percent of total tax revenue, therefore it deserves an in‐depth analyses of total FBR revenue as well as its various components. In doing so, we also highlight the major revenue spinners of direct and indirect taxes. This will reveal how narrow the various tax bases are.
IV-i-a : FBR Tax Collection and Refunds During 2007-08
24. The Federal Board of Revenue (FBR) was assigned an ambitious tax collection target of Rs 1025 billion for the fiscal year 2007‐08. To reach this target, a reasonably high growth of 21 percent was required over the previous year (2006‐07) collection of Rs 847 billion. With a booming economy, the possibility of achieving the target was bright. However, revenue collection efforts were severely hampered owing to the disturbed political environment, deteriorating law and order situation, and grave power shortages resulting in long hours of load shedding adversely affecting
9
|Fiscal Policy Statem
ent, 2008‐09
commercial activity in general and industrial production in particular. Resultantly, the FBR suffered a revenue loss of Rs. 18 billion in the fiscal year 2007‐08. The FBR collected Rs 1007 billion, or over 98 percent of the ambitious target surpassing the trillion Rupee mark for the first time, which was 19 percent higher than the previous year.
Overall FBR Tax Collection and Refunds during 2007-08
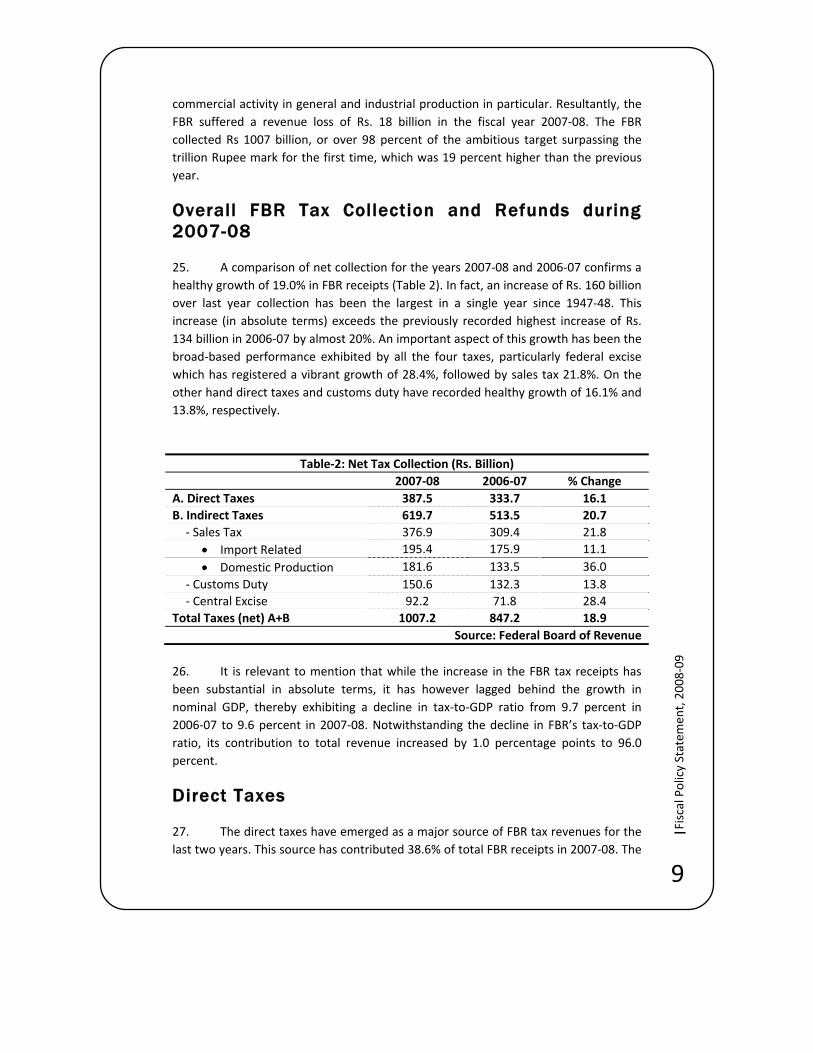
25. A comparison of net collection for the years 2007‐08 and 2006‐07 confirms a healthy growth of 19.0% in FBR receipts (Table 2). In fact, an increase of Rs. 160 billion over last year collection has been the largest in a single year since 1947‐48. This increase (in absolute terms) exceeds the previously recorded highest increase of Rs. 134 billion in 2006‐07 by almost 20%. An important aspect of this growth has been the broad‐based performance exhibited by all the four taxes, particularly federal excise which has registered a vibrant growth of 28.4%, followed by sales tax 21.8%. On the other hand direct taxes and customs duty have recorded healthy growth of 16.1% and 13.8%, respectively.
Table‐2: Net Tax Collection (Rs. Billion) 2007‐08 2006‐07 % Change A. Direct Taxes 387.5 333.7 16.1 B. Indirect Taxes 619.7 513.5 20.7
‐ Sales Tax 376.9 309.4 21.8 • Import Related 195.4 175.9 11.1 • Domestic Production 181.6 133.5 36.0
‐ Customs Duty 150.6 132.3 13.8 ‐ Central Excise 92.2 71.8 28.4
Total Taxes (net) A+B 1007.2 847.2 18.9 Source: Federal Board of Revenue
26. It is relevant to mention that while the increase in the FBR tax receipts has been substantial in absolute terms, it has however lagged behind the growth in nominal GDP, thereby exhibiting a decline in tax‐to‐GDP ratio from 9.7 percent in 2006‐07 to 9.6 percent in 2007‐08. Notwithstanding the decline in FBR’s tax‐to‐GDP ratio, its contribution to total revenue increased by 1.0 percentage points to 96.0 percent.
Direct Taxes
27. The direct taxes have emerged as a major source of FBR tax revenues for the last two years. This source has contributed 38.6% of total FBR receipts in 2007‐08. The
10
| Fiscal Policy Statem
ent, 2008‐09
net collection was estimated at Rs. 387.5 billion against the yearly target of Rs. 385 billion. An amount of Rs. 25.8 billion refunds have been paid back to the refunds claimants as against Rs. 32.2 billion refund paid during 2006‐07. The declining trend in refund payments indicates that the stock of arrears has been reduced and the income tax department is current with the refund cases. It may be recalled that the collection of direct taxes comprises of income tax and other direct taxes (Capital Value Tax, Worker Welfare Fund and Worker Participatory Fund). The contribution of income tax in total direct taxes has been 94 percent; therefore, our focus should be on income tax as far as direct taxes are concerned.
28. The structure of income tax is based on withholding taxes (WHT), voluntary payments (VP) and collection on demand (COD). The collection during 2007‐08 shows that the share of WHT, VP and COD in gross collection has been 52.3 %, 36.8 % and 10.9%, respectively. Whereas, the contribution of WHT remains historically high, the change in the configuration of other two components is inconsistent with the way the taxation system has been re‐designed in recent years. It was anticipated that with the introduction of Universal Self‐Assessment Scheme (USAS), more revenue would come under VP, rather than WHT and COD.
29. If we look at the performance of direct taxes in historical perspective the improved tax effort and effective implementation of tax policy and tax administrative reforms has resulted in higher collection over the years. The share of direct taxes in federal tax receipts has increased from around 15% in early 1990s to 32% in 2000‐01. It has touched new heights at 39.4% in 2006‐07, but declined slightly to 38.6% in 2007‐08. Similarly, the growth patterns of direct taxes also witnessed a deceleration, growing by 48.3 percent in 2006‐07 but slowed to 16.1 percent in 2007‐08. Apart from political unrest, strikes and load‐shedding during the period under review, the major set back has been due to significant reduction in voluntary compliance. Payment with returns has declined by 80.9%, thus disturbing the entire pattern of tax collection.
30. Notwithstanding the weaknesses observed in voluntary payments, direct taxes has, however, emerged as the leading revenue contributor to federal taxation receipts ‐ a transition that had always been desired on equity and efficiency grounds.
Analysis of Components of Direct Taxes
Voluntary Payments (VP):
31. This component includes payments with return and advances. In net terms, Rs. 145.5 billion have been collected during 2007‐08 as against Rs. 165.7 billion in the corresponding period last year. Thus, around 12% decline has been witnessed in collection from this important component. It may be recalled that the basic objective behind implementation of the USAS was to minimize interface between the taxpayer and tax administration, repose confidence in the system and eliminate the element of corruption. It was anticipated that voluntary compliance will play an important role in
11
|Fiscal Policy Statem
ent, 2008‐09
maintaining overall equity in the taxation system because the incidence of presumptive taxes is fairly debatable. No doubt, that the USAS has been successful since its implementation in achieving these objectives and till 2006‐07 the VP had emerged as a leading source of revenue. However, the fiscal year 2007‐08 was quite difficult and the analysis reveals that payments with return have declined by 81 percent A paltry sum of Rs. 9.2 billion with returns have been collected in 2007‐08 against Rs. 48.6 billion in 2006‐07.
Contribution of Corporate Sector in Income and Corporate Taxes
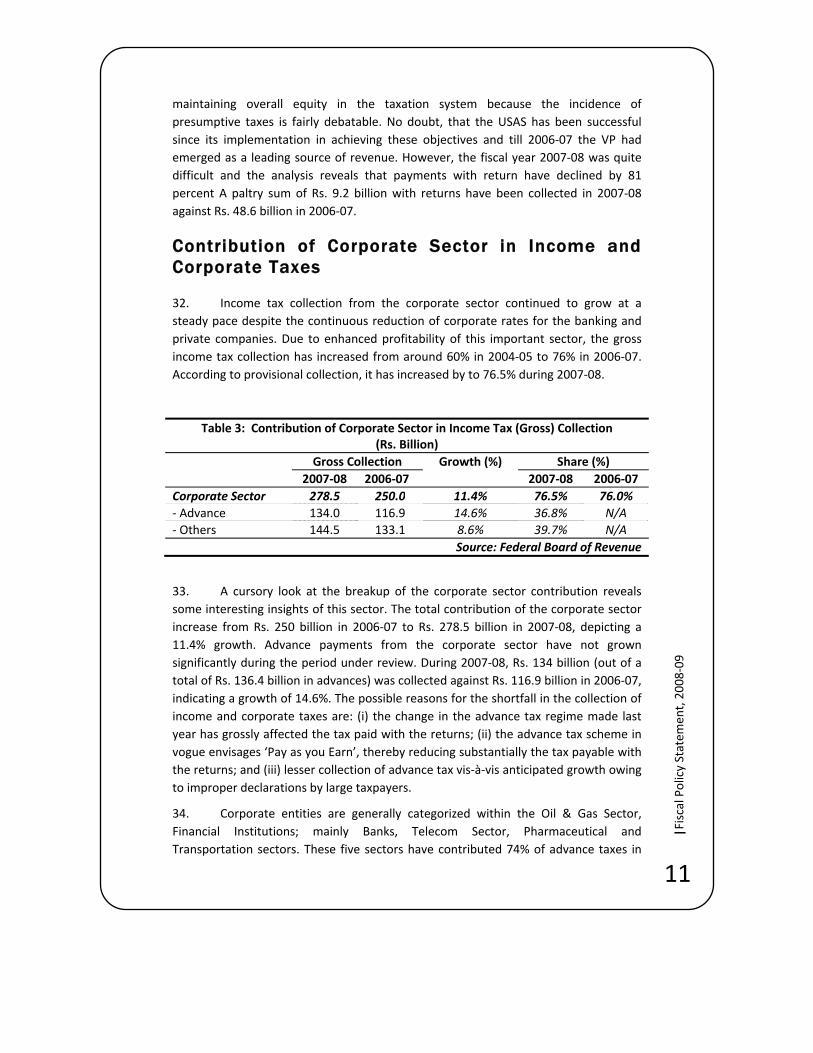
32. Income tax collection from the corporate sector continued to grow at a steady pace despite the continuous reduction of corporate rates for the banking and private companies. Due to enhanced profitability of this important sector, the gross income tax collection has increased from around 60% in 2004‐05 to 76% in 2006‐07. According to provisional collection, it has increased by to 76.5% during 2007‐08.
Table 3: Contribution of Corporate Sector in Income Tax (Gross) Collection (Rs. Billion)
Gross Collection Growth (%) Share (%) 2007‐08 2006‐07 2007‐08 2006‐07
Corporate Sector 278.5 250.0 11.4% 76.5% 76.0% ‐ Advance 134.0 116.9 14.6% 36.8% N/A ‐ Others 144.5 133.1 8.6% 39.7% N/A
Source: Federal Board of Revenue
33. A cursory look at the breakup of the corporate sector contribution reveals some interesting insights of this sector. The total contribution of the corporate sector increase from Rs. 250 billion in 2006‐07 to Rs. 278.5 billion in 2007‐08, depicting a 11.4% growth. Advance payments from the corporate sector have not grown significantly during the period under review. During 2007‐08, Rs. 134 billion (out of a total of Rs. 136.4 billion in advances) was collected against Rs. 116.9 billion in 2006‐07, indicating a growth of 14.6%. The possible reasons for the shortfall in the collection of income and corporate taxes are: (i) the change in the advance tax regime made last year has grossly affected the tax paid with the returns; (ii) the advance tax scheme in vogue envisages ‘Pay as you Earn’, thereby reducing substantially the tax payable with the returns; and (iii) lesser collection of advance tax vis‐à‐vis anticipated growth owing to improper declarations by large taxpayers.
34. Corporate entities are generally categorized within the Oil & Gas Sector, Financial Institutions; mainly Banks, Telecom Sector, Pharmaceutical and Transportation sectors. These five sectors have contributed 74% of advance taxes in
12
| Fiscal Policy Statem
ent, 2008‐09
2007‐08. It may not be out of place to mention that around 71% of the total advance taxes are paid by three sectors, namely Oil & Gas (47.9%), Banks (20.5%) and Telecommunication (5.8%). Furthermore, barring the telecom and banking sectors, the remaining three sectors had made substantially higher payments than last year.
Income Tax Returns Analysis: The number of Income Tax Returns and statements received by the end of 2007‐08 were 2,139,397 ‐‐ higher by 327,046 as compared to last year, indicating a growth of about 18%. While the number of returns registered a decline of 1.2%, the statements have increased by 32.7%. On the other hand, the total tax received with returns has declined sharply to Rs. 9.2 billion against Rs. 48.6 billion. The number of corporate returns has slightly increased from 15,481 during 2006‐07 to 15,871 in 2007‐08, however the collection with corporate returns has dropped from Rs. 42.6 billion to Rs. 7.6 billion. A similar outcome has been noticed for other categories of taxpayers including individuals, and AOPs. In respect of the statements, despite a rise in number, by 32.7%, the collection has declined by around 5.9% which also needs deeper analysis.
35. As mentioned earlier, the change introduced in the tax system has certainly affected the collection but the sharp reduction in collection under VP appears to be on the higher side. It seems that, the USAS is on track as it has been functioning successfully for the past few years and yielded substantial revenue through it. However, the problem lies with audit which needs to be initiated for selected corporate cases. The efforts made by the LTUs need to be strengthened so that delinquent taxpayers are identified. It is relevant to mention that the planning stage has been over; full implementation of audit program should not be delayed any further, especially when there is strong evidence of low voluntary compliance due to inadmissible claims. At the same time it is also essential to have effective enforcement in place. Unfortunately, the enormous gap exists between corporations who have got NTN and those who file returns. Nearly two‐thirds of the corporations declaring nil income and business losses within those who file returns are ‘known’ facts for quite some time and needs to be addressed urgently. Now that the process of re‐organization of field formations has been completed, the processing of returns for raising demand in a professional manner should not be delayed any further. Here again, the audit teams will have to take the leadership role, which unfortunately remains a missing link in the entire equation.
Withholding Taxes (WHT):
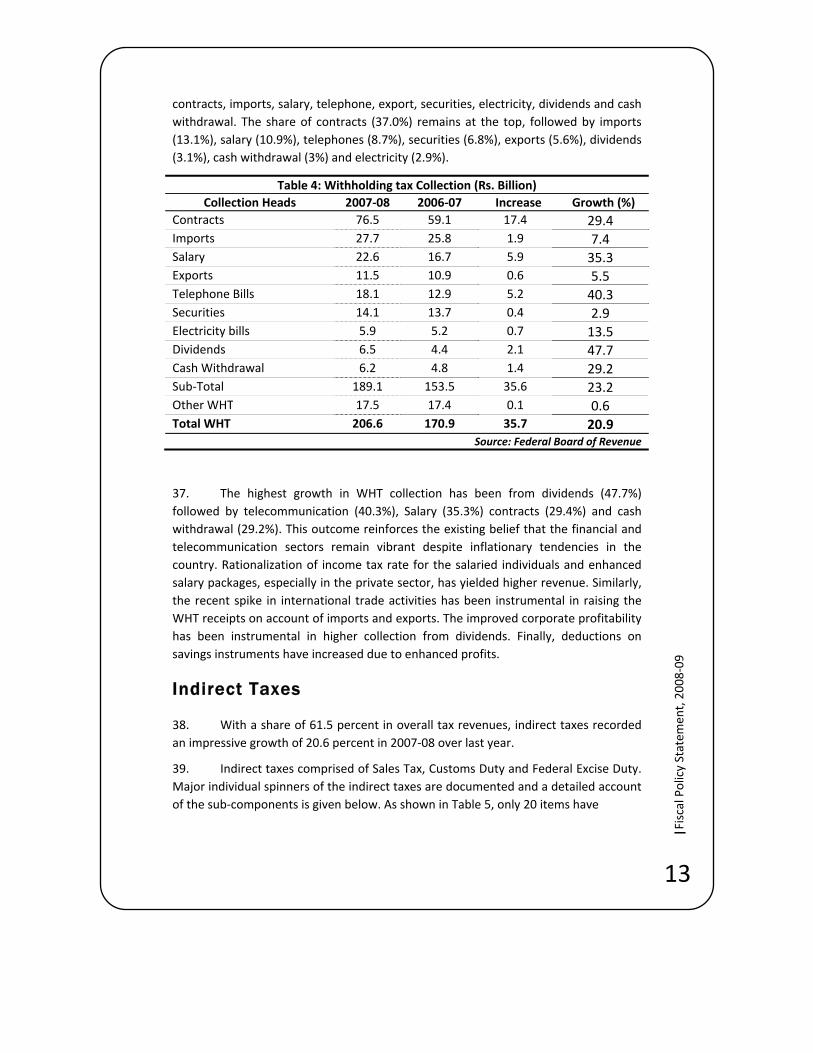
36. The WHT continues to be the leading source of direct tax receipts in view of the large undocumented sector of the economy. However, despite its large contribution, there is ample scope to enhance this collection further. The WHT collection during 2007‐08 has been Rs. 206.6 billion against Rs. 170.9 billion during 2006‐07, indicating a healthy growth of 21%. The ten major withholding taxes constituting 91.5% of total WHT collection remain the same as before. These are:
13
|Fiscal Policy Statem
ent, 2008‐09
contracts, imports, salary, telephone, export, securities, electricity, dividends and cash withdrawal. The share of contracts (37.0%) remains at the top, followed by imports (13.1%), salary (10.9%), telephones (8.7%), securities (6.8%), exports (5.6%), dividends (3.1%), cash withdrawal (3%) and electricity (2.9%).
Table 4: Withholding tax Collection (Rs. Billion)Collection Heads 2007‐08 2006‐07 Increase Growth (%)
Contracts 76.5 59.1 17.4 29.4 Imports 27.7 25.8 1.9 7.4 Salary 22.6 16.7 5.9 35.3 Exports 11.5 10.9 0.6 5.5 Telephone Bills 18.1 12.9 5.2 40.3 Securities 14.1 13.7 0.4 2.9 Electricity bills 5.9 5.2 0.7 13.5 Dividends 6.5 4.4 2.1 47.7 Cash Withdrawal 6.2 4.8 1.4 29.2 Sub‐Total 189.1 153.5 35.6 23.2 Other WHT 17.5 17.4 0.1 0.6 Total WHT 206.6 170.9 35.7 20.9
Source: Federal Board of Revenue
37. The highest growth in WHT collection has been from dividends (47.7%) followed by telecommunication (40.3%), Salary (35.3%) contracts (29.4%) and cash withdrawal (29.2%). This outcome reinforces the existing belief that the financial and telecommunication sectors remain vibrant despite inflationary tendencies in the country. Rationalization of income tax rate for the salaried individuals and enhanced salary packages, especially in the private sector, has yielded higher revenue. Similarly, the recent spike in international trade activities has been instrumental in raising the WHT receipts on account of imports and exports. The improved corporate profitability has been instrumental in higher collection from dividends. Finally, deductions on savings instruments have increased due to enhanced profits.
Indirect Taxes
38. With a share of 61.5 percent in overall tax revenues, indirect taxes recorded an impressive growth of 20.6 percent in 2007‐08 over last year.
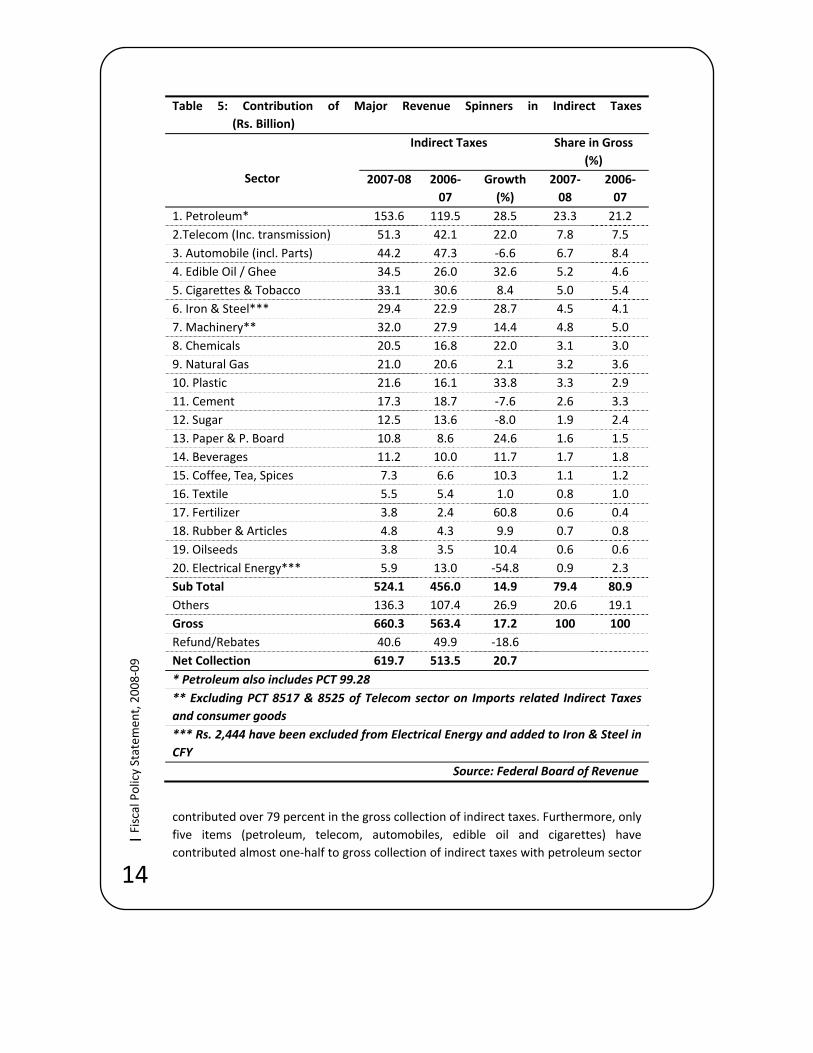
39. Indirect taxes comprised of Sales Tax, Customs Duty and Federal Excise Duty. Major individual spinners of the indirect taxes are documented and a detailed account of the sub‐components is given below. As shown in Table 5, only 20 items have
14
| Fiscal Policy Statem
ent, 2008‐09
Table 5: Contribution of Major Revenue Spinners in Indirect Taxes (Rs. Billion)
Sector
Indirect Taxes Share in Gross (%)
2007‐08 2006‐07
Growth (%)
2007‐08
2006‐07
1. Petroleum* 153.6 119.5 28.5 23.3 21.2 2.Telecom (Inc. transmission) 51.3 42.1 22.0 7.8 7.5 3. Automobile (incl. Parts) 44.2 47.3 ‐6.6 6.7 8.4 4. Edible Oil / Ghee 34.5 26.0 32.6 5.2 4.6 5. Cigarettes & Tobacco 33.1 30.6 8.4 5.0 5.4 6. Iron & Steel*** 29.4 22.9 28.7 4.5 4.1 7. Machinery** 32.0 27.9 14.4 4.8 5.0 8. Chemicals 20.5 16.8 22.0 3.1 3.0 9. Natural Gas 21.0 20.6 2.1 3.2 3.6 10. Plastic 21.6 16.1 33.8 3.3 2.9 11. Cement 17.3 18.7 ‐7.6 2.6 3.3 12. Sugar 12.5 13.6 ‐8.0 1.9 2.4 13. Paper & P. Board 10.8 8.6 24.6 1.6 1.5 14. Beverages 11.2 10.0 11.7 1.7 1.8 15. Coffee, Tea, Spices 7.3 6.6 10.3 1.1 1.2 16. Textile 5.5 5.4 1.0 0.8 1.0 17. Fertilizer 3.8 2.4 60.8 0.6 0.4 18. Rubber & Articles 4.8 4.3 9.9 0.7 0.8 19. Oilseeds 3.8 3.5 10.4 0.6 0.6 20. Electrical Energy*** 5.9 13.0 ‐54.8 0.9 2.3 Sub Total 524.1 456.0 14.9 79.4 80.9 Others 136.3 107.4 26.9 20.6 19.1 Gross 660.3 563.4 17.2 100 100 Refund/Rebates 40.6 49.9 ‐18.6 Net Collection 619.7 513.5 20.7 * Petroleum also includes PCT 99.28** Excluding PCT 8517 & 8525 of Telecom sector on Imports related Indirect Taxes and consumer goods *** Rs. 2,444 have been excluded from Electrical Energy and added to Iron & Steel in CFY
Source: Federal Board of Revenue
contributed over 79 percent in the gross collection of indirect taxes. Furthermore, only five items (petroleum, telecom, automobiles, edible oil and cigarettes) have contributed almost one‐half to gross collection of indirect taxes with petroleum sector
15
|Fiscal Policy Statem
ent, 2008‐09
contributing almost one‐fourth alone. This simply shows as how narrow the tax bases are in Pakistan. Tax collection cannot increase substantially without bringing more area under the tax net.
Sales Tax
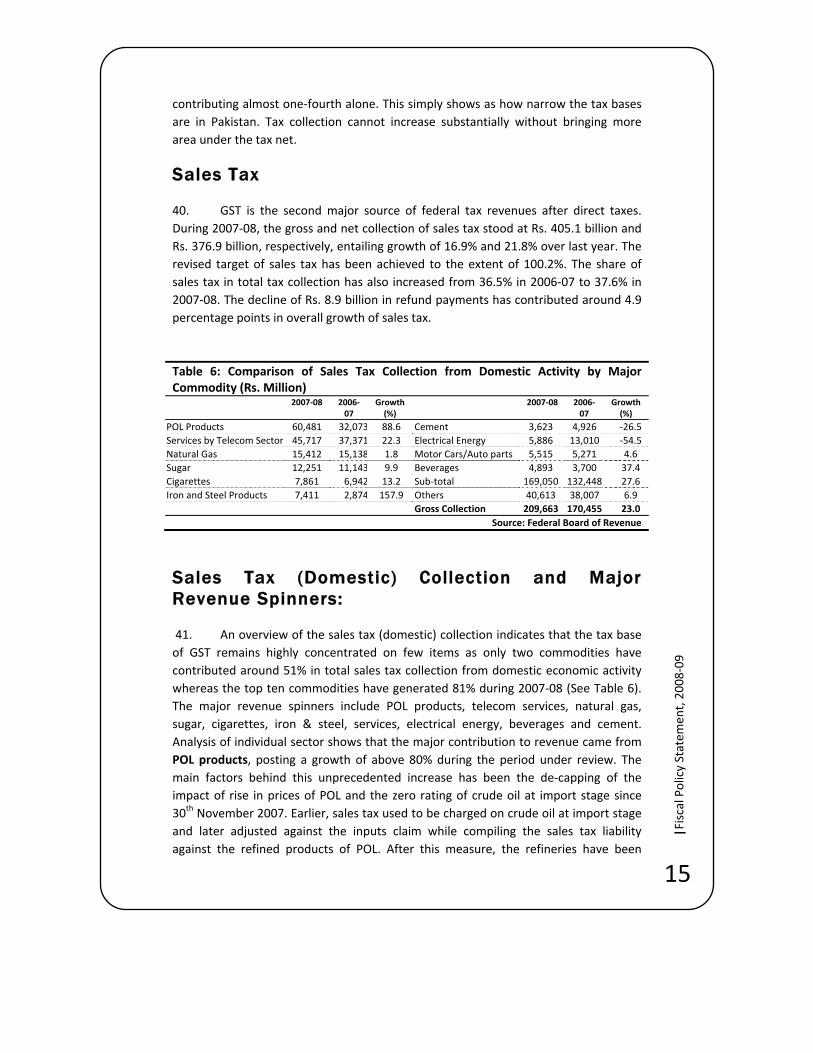
40. GST is the second major source of federal tax revenues after direct taxes. During 2007‐08, the gross and net collection of sales tax stood at Rs. 405.1 billion and Rs. 376.9 billion, respectively, entailing growth of 16.9% and 21.8% over last year. The revised target of sales tax has been achieved to the extent of 100.2%. The share of sales tax in total tax collection has also increased from 36.5% in 2006‐07 to 37.6% in 2007‐08. The decline of Rs. 8.9 billion in refund payments has contributed around 4.9 percentage points in overall growth of sales tax.
Table 6: Comparison of Sales Tax Collection from Domestic Activity by Major Commodity (Rs. Million)
2007‐08 2006‐07
Growth (%)
2007‐08 2006‐07
Growth (%)
POL Products 60,481 32,073 88.6 Cement 3,623 4,926 ‐26.5 Services by Telecom Sector 45,717 37,371 22.3 Electrical Energy 5,886 13,010 ‐54.5 Natural Gas 15,412 15,138 1.8 Motor Cars/Auto parts 5,515 5,271 4.6 Sugar 12,251 11,143 9.9 Beverages 4,893 3,700 37.4 Cigarettes 7,861 6,942 13.2 Sub‐total 169,050 132,448 27.6 Iron and Steel Products 7,411 2,874 157.9 Others 40,613 38,007 6.9 Gross Collection 209,663 170,455 23.0
Source: Federal Board of Revenue
Sales Tax (Domestic) Collection and Major Revenue Spinners:
41. An overview of the sales tax (domestic) collection indicates that the tax base of GST remains highly concentrated on few items as only two commodities have contributed around 51% in total sales tax collection from domestic economic activity whereas the top ten commodities have generated 81% during 2007‐08 (See Table 6). The major revenue spinners include POL products, telecom services, natural gas, sugar, cigarettes, iron & steel, services, electrical energy, beverages and cement. Analysis of individual sector shows that the major contribution to revenue came from POL products, posting a growth of above 80% during the period under review. The main factors behind this unprecedented increase has been the de‐capping of the impact of rise in prices of POL and the zero rating of crude oil at import stage since 30th November 2007. Earlier, sales tax used to be charged on crude oil at import stage and later adjusted against the inputs claim while compiling the sales tax liability against the refined products of POL. After this measure, the refineries have been
16
| Fiscal Policy Statem
ent, 2008‐09
relieved of getting their money stuck and pay tax at the time of sales of their product. On the other hand, it has also minimized the chances of evasion on account of value addition of the products. Despite a time lag of two months in translation of impact of zero rating on sales tax collection at domestic stage, the increase in collection has been spectacular. The average increase in collection from POL during last five months i.e., February 2008 to June 2008 has been around 174 percent, mainly on account of unprecedented increase in international price of oil as well as sharp depreciation of Rupee viz. US dollar.
42. The telecom sector continued its notable performance with above 20% growth in collection during 2007‐08. The tempo of development and economic activities gives impetus to the collection from this source. So far 59% tele‐density till 2007‐08 indicates the availability of further scope of expansion in this industry. The recent move by the government to get disabled all the un‐notified/un‐registered SIMS, may have an adverse effect in collection of sales tax due to the huge size of unregistered SIMS, however, organized management of this sector will have a far reaching positive impact on administrative as well as economic spectrum and will certainly pay the dividend in the long run.
43. A nominal growth in collection from natural gas is attributed to various factors i.e., i) withdrawal of business by a major unit namely Occidental Gas from the extraction activities, which contributed over Rs. 1 billion of sales tax last year, ii) decline in sales tax payment by the leading unit of the industry holding over 40% in collection, and iii) unusual refund payments to SSGPL during the reference period. A significant addition by the SNGPL could hardly compensate for the shortfall in collection pattern. The collection from sugar has improved during the last three months of 2007‐08 and has posted a modest growth of 10% that indicates the positive impacts of special audit conducted during the period. The growth in collection from cigarette is in line with projection estimates. The factors like increase in prices on account of increase in excise duty rates and growth in production contributed positively.
44. The collection from iron & steel has been phenomenal and registered a growth of 168 percent in 2007‐08, mainly on account of policy intervention in the Budget 2007‐08. The sales tax is being charged on the basis of electricity consumed at the rate of Rs.4.15/unit and being collected by the electricity billing agencies i.e., WAPDA and KESC. This change has significantly facilitated the sales tax collection from iron & steel units and reduced the tax evasion. The overall performance of services has been encouraging with above 20% growth in collection which is associated with better contribution by airlines, courier and media services. This performance has been despite a decline in collection from prominent hotel and restaurant industry units during the period under review. The decline in collection from electrical energy is as per expectation because FBR opted for the policy of net rather than gross collection. This policy intervention has reduced the refund payments by almost Rs. 11 billion in
17
|Fiscal Policy Statem
ent, 2008‐09
2007‐08. The modest growth in collection from automotive industry (Motor cars/Motorcycles/Auto Parts) is indicative of the fact that the boom in the industry prevailed during 2006‐07 is almost over as the major factor for the boom i.e., the financial support by the financial institutions is no more available on cheaper rates. Therefore, the tempo of production in automobile industry has slowed during the period. A healthy growth in collection from beverages is the impact of increase in prices as well as the continued demand for the branded beverages products.
Sales Tax (Import) Collection
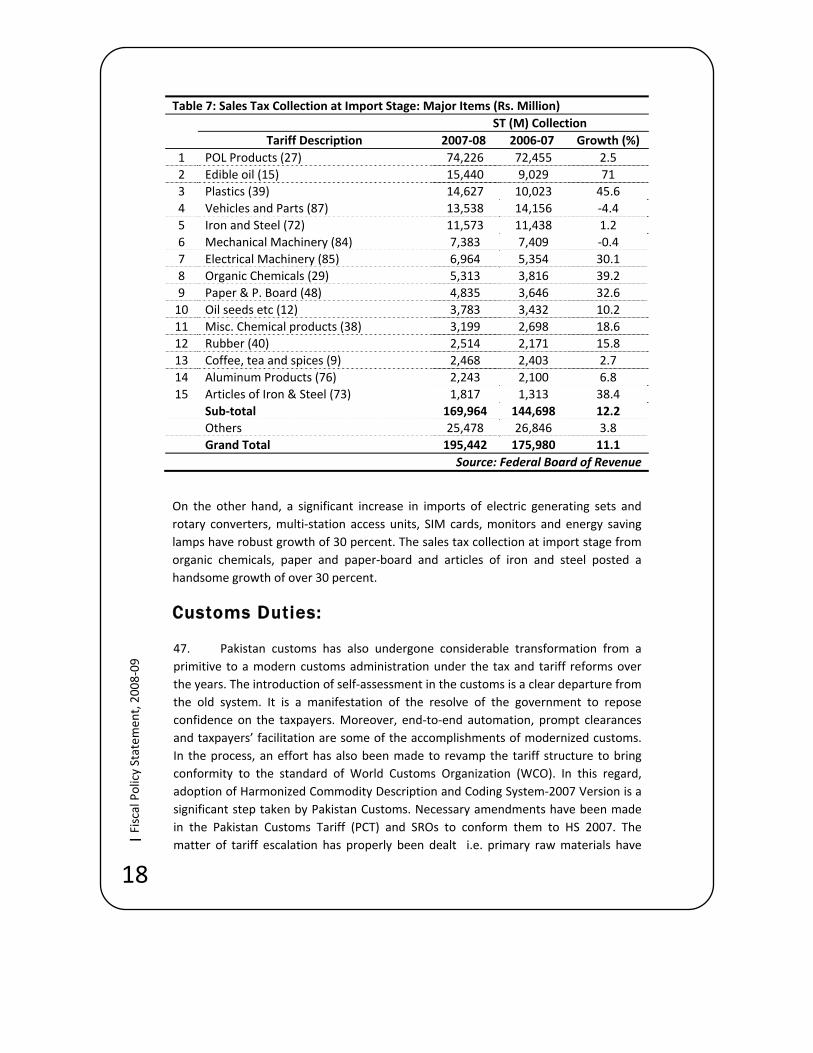
45. The collection of sales tax at imports depends on the value of imports. A healthy growth of 35.7% in value of imports has been observed during 2007‐08 as compared to 8.1% in the previous year. However, significant import of zero‐rated raw material and zero rating of crude oil since 30th November 2007, vide SRO No.1164(1)/2007, has affected the growth tempo of sales tax at import stage. The gross collection of sales tax at import stage has contributed around 48.4% in the total sales tax collection during 2007‐08. However, its share has increased to 52% in net terms as all the refund claims are entertained from the domestic collection of sales tax. The collection of sales tax at import stage stood at Rs.195.4 billion, entailing a growth of 11.1% over last year. Fifteen major commodity groups have contributed around 87% of total sales tax collection at import stage (see Table 7). Infact, only five commodity groups (POL products, edible oil, plastics, vehicles and parts, and iron and steel) contributed two‐third of total sales tax collection at import stage. Such a high level of concentration of taxes in few commodity groups is a dangerous sign for meeting tax target going forward. The collapse of the prices of POL products and edible oil on the one hand and decline in the imports of vehicle and parts, and iron and steel on account of depressed level of industrial activity in the fiscal year 2008‐09 do not augur well for tax collection.
46. A high double‐digit growth has been recorded in collection from edible oil, plastic products, electrical machinery, organic chemicals, paper and paper board and oil seeds. However, the collection from vehicles and machinery have declined marginally i.e., by 4.4% and 0.4%, respectively because of the depressed level of domestic economic activity. The collection from POL products has exhibited a nominal growth of 2.5% mainly on account of zero rating of crude oil for the purpose of sales tax as per above mentioned SRO. The significant increase in collection from edible oil owes heavily to an increase in the international prices of the products. In the Budget 2007‐08, a bulk of the plastic products rates were increased from 15% to 20 % and as such sales tax collection registered an impressive growth of 46 percent over last year. In case of Iron & Steel, sales tax collection has observed a nominal growth of only 1.2%, mainly on account of large imports at zero rated during the period under review.
18
| Fiscal Policy Statem
ent, 2008‐09
Table 7: Sales Tax Collection at Import Stage: Major Items (Rs. Million) ST (M) Collection
Tariff Description 2007‐08 2006‐07 Growth (%) 1 POL Products (27) 74,226 72,455 2.5 2 Edible oil (15) 15,440 9,029 71 3 Plastics (39) 14,627 10,023 45.6 4 Vehicles and Parts (87) 13,538 14,156 ‐4.4 5 Iron and Steel (72) 11,573 11,438 1.2 6 Mechanical Machinery (84) 7,383 7,409 ‐0.4 7 Electrical Machinery (85) 6,964 5,354 30.1 8 Organic Chemicals (29) 5,313 3,816 39.2 9 Paper & P. Board (48) 4,835 3,646 32.6 10 Oil seeds etc (12) 3,783 3,432 10.2 11 Misc. Chemical products (38) 3,199 2,698 18.6 12 Rubber (40) 2,514 2,171 15.8 13 Coffee, tea and spices (9) 2,468 2,403 2.7 14 Aluminum Products (76) 2,243 2,100 6.8 15 Articles of Iron & Steel (73) 1,817 1,313 38.4 Sub‐total 169,964 144,698 12.2 Others 25,478 26,846 3.8 Grand Total 195,442 175,980 11.1
Source: Federal Board of Revenue
On the other hand, a significant increase in imports of electric generating sets and rotary converters, multi‐station access units, SIM cards, monitors and energy saving lamps have robust growth of 30 percent. The sales tax collection at import stage from organic chemicals, paper and paper‐board and articles of iron and steel posted a handsome growth of over 30 percent.
Customs Duties:
47. Pakistan customs has also undergone considerable transformation from a primitive to a modern customs administration under the tax and tariff reforms over the years. The introduction of self‐assessment in the customs is a clear departure from the old system. It is a manifestation of the resolve of the government to repose confidence on the taxpayers. Moreover, end‐to‐end automation, prompt clearances and taxpayers’ facilitation are some of the accomplishments of modernized customs. In the process, an effort has also been made to revamp the tariff structure to bring conformity to the standard of World Customs Organization (WCO). In this regard, adoption of Harmonized Commodity Description and Coding System‐2007 Version is a significant step taken by Pakistan Customs. Necessary amendments have been made in the Pakistan Customs Tariff (PCT) and SROs to conform them to HS 2007. The matter of tariff escalation has properly been dealt i.e. primary raw materials have
19
|Fiscal Policy Statem
ent, 2008‐09
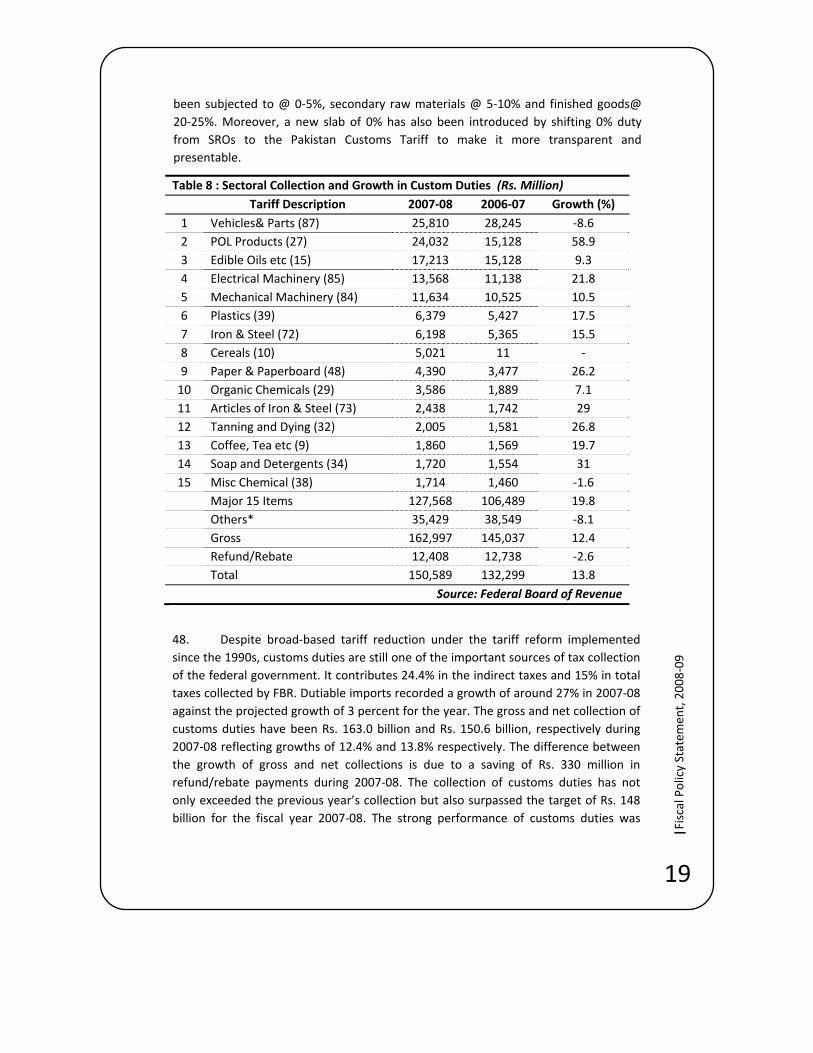
been subjected to @ 0‐5%, secondary raw materials @ 5‐10% and finished goods@ 20‐25%. Moreover, a new slab of 0% has also been introduced by shifting 0% duty from SROs to the Pakistan Customs Tariff to make it more transparent and presentable.
Table 8 : Sectoral Collection and Growth in Custom Duties (Rs. Million) Tariff Description 2007‐08 2006‐07 Growth (%) 1 Vehicles& Parts (87) 25,810 28,245 ‐8.6 2 POL Products (27) 24,032 15,128 58.9 3 Edible Oils etc (15) 17,213 15,128 9.3 4 Electrical Machinery (85) 13,568 11,138 21.8 5 Mechanical Machinery (84) 11,634 10,525 10.5 6 Plastics (39) 6,379 5,427 17.5 7 Iron & Steel (72) 6,198 5,365 15.5 8 Cereals (10) 5,021 11 ‐ 9 Paper & Paperboard (48) 4,390 3,477 26.2 10 Organic Chemicals (29) 3,586 1,889 7.1 11 Articles of Iron & Steel (73) 2,438 1,742 29 12 Tanning and Dying (32) 2,005 1,581 26.8 13 Coffee, Tea etc (9) 1,860 1,569 19.7 14 Soap and Detergents (34) 1,720 1,554 31 15 Misc Chemical (38) 1,714 1,460 ‐1.6 Major 15 Items 127,568 106,489 19.8 Others* 35,429 38,549 ‐8.1
Gross 162,997 145,037 12.4 Refund/Rebate 12,408 12,738 ‐2.6 Total 150,589 132,299 13.8
Source: Federal Board of Revenue
48. Despite broad‐based tariff reduction under the tariff reform implemented since the 1990s, customs duties are still one of the important sources of tax collection of the federal government. It contributes 24.4% in the indirect taxes and 15% in total taxes collected by FBR. Dutiable imports recorded a growth of around 27% in 2007‐08 against the projected growth of 3 percent for the year. The gross and net collection of customs duties have been Rs. 163.0 billion and Rs. 150.6 billion, respectively during 2007‐08 reflecting growths of 12.4% and 13.8% respectively. The difference between the growth of gross and net collections is due to a saving of Rs. 330 million in refund/rebate payments during 2007‐08. The collection of customs duties has not only exceeded the previous year’s collection but also surpassed the target of Rs. 148 billion for the fiscal year 2007‐08. The strong performance of customs duties was
20
| Fiscal Policy Statem
ent, 2008‐09
mainly attributable to the surge in the POL products, increased imports of most of the major items like edible oil, machinery, plastic, cereals, paper & paperboard.
49. Although the maximum tariff rate has been 25% for the last few years, but tariff reduction within the slabs has been continuously pursued. It is evident from Table 8 that around 1/4th of the collection of CD has been fetched from application of 10% tariff rate, other double‐digit contributions were made by the slabs such as 20%, 5%, 25% and specific rates.
Performance of Major Revenue Spinners of Customs: Only 15 major commodity groups (chapters) contributed 78 % to the total collection of customs. It is evident from Table 8 that out of 15 major commodity groups, 13 items have registered positive growth in the collection of CD. Only auto sector and miscellaneous chemicals have registered negative growth.
The Automobile Sector is the top revenue generating source of customs duties. The collection of customs duties from this sector has declined by 8.6% due to a decline in dutiable imports by 3.2%. Import of motor cars/jeeps has been the major source of custom collection in 2007‐08. The government policy to restrict the import of old and used motor vehicles of more than 3 years of age has vastly discouraged the import of motorcars. The import of number of motorcars/jeeps has dropped from 26,967 in 2006‐07 to 17,301 in 2007‐08. Thus, the collection of customs duty from motorcars/jeeps has declined marginally to Rs. 6.9 billion during 2007‐08 as compared to Rs 7.3 billion last year. On the other hand, the number of imported CKD kits of motor vehicles has also come down from 196,070 in 2006‐07 to 147,374 in 2007‐08, entailing a loss of Rs. 2.3 billion in CD as compared to last year. Thus, overall loss of Rs. 2.8 billion has been recorded in the collection of CD from CKD/CBU motor cars/jeeps.
The Petroleum Sector is the second major source of revenue from customs duties. Most of the items of POL products have been exempted from the CD. Despite 70% duty free imports of POL products, the collection from POL products has exhibited a robust growth of 59% in the collection of CD with 69% growth in dutiable imports. The collection from POL products has increased from Rs.15.1 billion to Rs. 24 billion during the period under review. Main factor behind this vibrant performance is the spiraling prices of petroleum products. In fact, a major chunk of the collection of POL products is realized from the import of High Speed Diesel (HSD). The collection of CD from HSD has gone up from Rs. 13.7 billion in 2006‐07 to Rs. 23 billion during 2007‐08, yielding a stellar growth of 67%. Apart from increased prices, higher quantity of imported HSD by 33% is also responsible for strong growth in the collection of customs duties in 2007‐08.
The Edible Oils Sector is the third higher source of custom duties. The value of import of edible oil has recorded a massive growth of 90.4% but its collection of CD grew only by 9.3%. This gap is understandable as prices of edible oil have gone up significantly which has resulted into higher growth in value of import of edible oils. Since edible
21
|Fiscal Policy Statem
ent, 2008‐09
oils are subjected to specific customs duty rates, therefore, this huge growth in the value of imports has not helped in boosting the customs’ revenue accordingly. Thus, the growth in the collection of edible oil has been attained due to growth in the collection of crude palm oil and crude soybean due to increased imported quantities of these items by 22% and 281% respectively.
Machinery Group: The availability of machinery at cheaper rates has been the priority of the government to boost the industrial sector. Despite zero rating and lower rates for many items, machinery (electrical and mechanical) is still contributing substantially to the customs duties. A considerable growth of 21.8% in the collection of CD from electrical machinery was mainly due to increased collection from telecommunication and transmission equipments, transformers and generating sets.
Iron and Steel Sector: The value of dutiable imports of mechanical machinery has manifested a growth of 7.6% while collection grew by 10.5%. This growth has mainly been driven by improved collection of industrial goods, construction machinery, pumps and engines. On the other hand, the import of textile machinery has declined by 4.5%, resulting in decline in the collection of CD by 12.3%. Similarly, the collection of plastic has also recorded a growth of 17.5% against dutiable import of 16.9% which also reflects consistency of collection with its base. Some other groups like iron and steel, paper & paper board, tanning & dying, tea & coffee have also improved their collection due to increased dutiable imports. Owing to tariff reduction, the collection from organic chemical has posted a modest growth while collection from miscellaneous chemicals has declined during 2007‐08 as compared to last year. Due to food crisis in the country, a bulk of cereals has been imported which has contributed Rs. 5 billion to the national exchequer in the form of customs duties.
Federal Excise Duties (FED):
50. During the fiscal year 2007‐08, Rs. 92.2 billion has been collected against Rs. 71.8 billion in the same period last year. The collection is 28.4% higher than the previous year. The quarterly collection trend indicates a healthy growth in the second and third quarters, whereas same pace of growth could not continue in the last quarter. Within fourth quarter, the performance during April and May has been excellent with 24.7% and 36.5% growth, but growth in tax collection slowed to 18.9% in June, which is unusual, showing meager efforts by the field formations.
51. It has been noted that the FED collection has again become an important source of federal tax revenues during the last three years. Historically the share of FED in total federal taxes has been declining since 1998‐99 and until 2005‐06 ‐‐‐ declining from 19.7% to 7.7%. Owing to various budgetary measures like FED on services including Air Travel, Non Fund Services and levy of 1% SED at domestic and import stage during last two years, the FED share has jumped to 9.2% in 2007‐08.
22
| Fiscal Policy Statem
ent, 2008‐09
Analysis of Major Commodities of FED
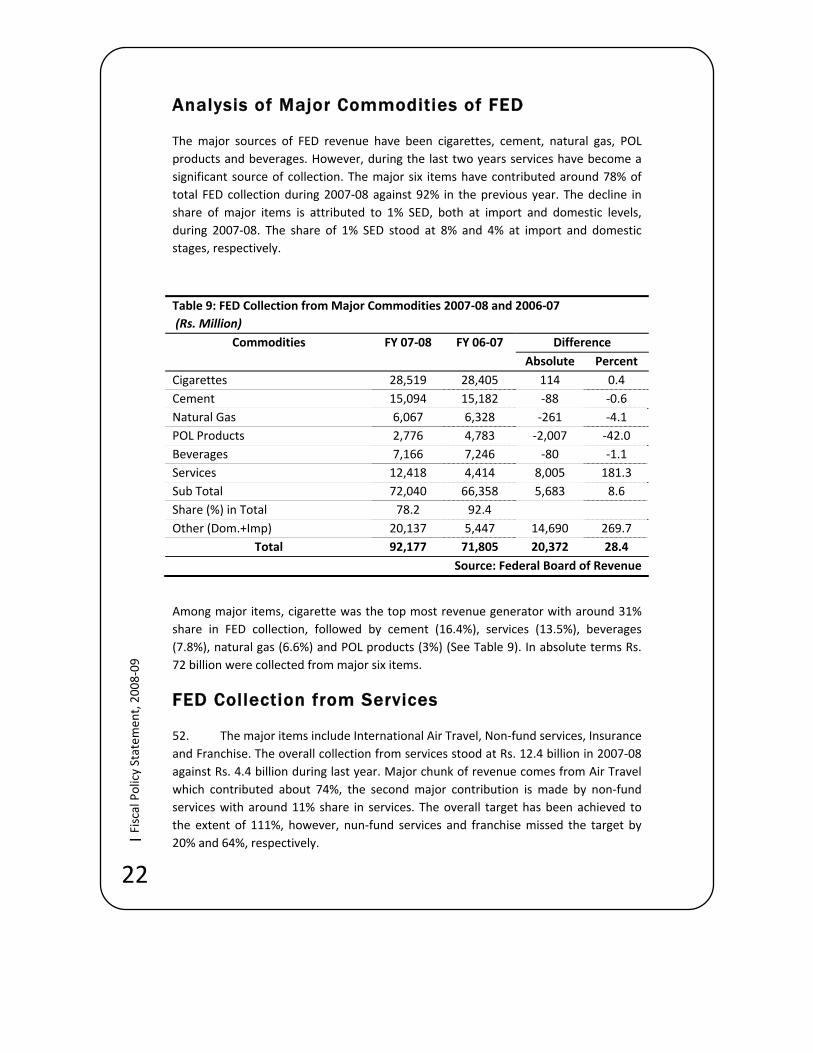
The major sources of FED revenue have been cigarettes, cement, natural gas, POL products and beverages. However, during the last two years services have become a significant source of collection. The major six items have contributed around 78% of total FED collection during 2007‐08 against 92% in the previous year. The decline in share of major items is attributed to 1% SED, both at import and domestic levels, during 2007‐08. The share of 1% SED stood at 8% and 4% at import and domestic stages, respectively.
Table 9: FED Collection from Major Commodities 2007‐08 and 2006‐07 (Rs. Million)
Commodities FY 07‐08 FY 06‐07 Difference Absolute Percent
Cigarettes 28,519 28,405 114 0.4 Cement 15,094 15,182 ‐88 ‐0.6 Natural Gas 6,067 6,328 ‐261 ‐4.1 POL Products 2,776 4,783 ‐2,007 ‐42.0 Beverages 7,166 7,246 ‐80 ‐1.1 Services 12,418 4,414 8,005 181.3 Sub Total 72,040 66,358 5,683 8.6 Share (%) in Total 78.2 92.4 Other (Dom.+Imp) 20,137 5,447 14,690 269.7
Total 92,177 71,805 20,372 28.4 Source: Federal Board of Revenue
Among major items, cigarette was the top most revenue generator with around 31% share in FED collection, followed by cement (16.4%), services (13.5%), beverages (7.8%), natural gas (6.6%) and POL products (3%) (See Table 9). In absolute terms Rs. 72 billion were collected from major six items.
FED Collection from Services
52. The major items include International Air Travel, Non‐fund services, Insurance and Franchise. The overall collection from services stood at Rs. 12.4 billion in 2007‐08 against Rs. 4.4 billion during last year. Major chunk of revenue comes from Air Travel which contributed about 74%, the second major contribution is made by non‐fund services with around 11% share in services. The overall target has been achieved to the extent of 111%, however, nun‐fund services and franchise missed the target by 20% and 64%, respectively.
23
|Fiscal Policy Statem
ent, 2008‐09
IV-i-b: Review of Expenditure During 2007-08
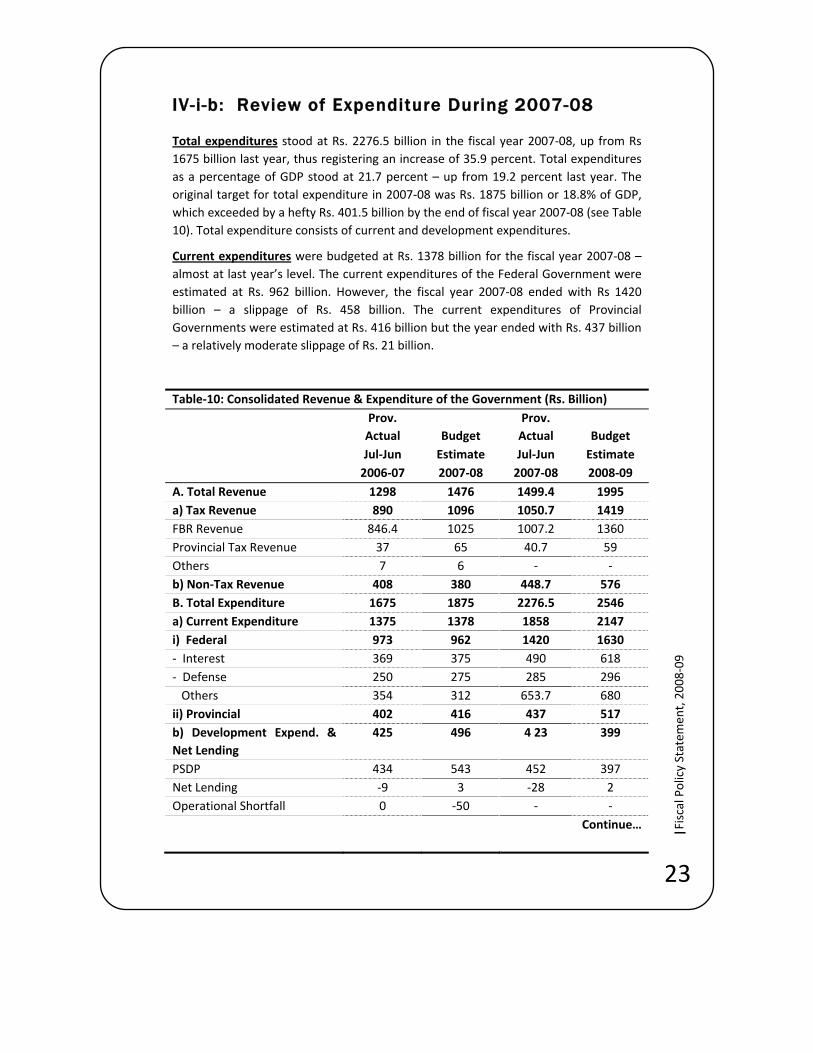
Total expenditures stood at Rs. 2276.5 billion in the fiscal year 2007‐08, up from Rs 1675 billion last year, thus registering an increase of 35.9 percent. Total expenditures as a percentage of GDP stood at 21.7 percent – up from 19.2 percent last year. The original target for total expenditure in 2007‐08 was Rs. 1875 billion or 18.8% of GDP, which exceeded by a hefty Rs. 401.5 billion by the end of fiscal year 2007‐08 (see Table 10). Total expenditure consists of current and development expenditures.
Current expenditures were budgeted at Rs. 1378 billion for the fiscal year 2007‐08 – almost at last year’s level. The current expenditures of the Federal Government were estimated at Rs. 962 billion. However, the fiscal year 2007‐08 ended with Rs 1420 billion – a slippage of Rs. 458 billion. The current expenditures of Provincial Governments were estimated at Rs. 416 billion but the year ended with Rs. 437 billion – a relatively moderate slippage of Rs. 21 billion.
Table‐10: Consolidated Revenue & Expenditure of the Government (Rs. Billion) Prov.
Actual Budget Prov. Actual
Budget
Jul‐Jun Estimate Jul‐Jun Estimate 2006‐07 2007‐08 2007‐08 2008‐09
A. Total Revenue 1298 1476 1499.4 1995 a) Tax Revenue 890 1096 1050.7 1419 FBR Revenue 846.4 1025 1007.2 1360 Provincial Tax Revenue 37 65 40.7 59 Others 7 6 ‐ ‐ b) Non‐Tax Revenue 408 380 448.7 576 B. Total Expenditure 1675 1875 2276.5 2546 a) Current Expenditure 1375 1378 1858 2147 i) Federal 973 962 1420 1630 ‐ Interest 369 375 490 618 ‐ Defense 250 275 285 296 Others 354 312 653.7 680 ii) Provincial 402 416 437 517 b) Development Expend. & Net Lending
425 496 4 23 399
PSDP 434 543 452 397 Net Lending ‐9 3 ‐28 2 Operational Shortfall 0 ‐50 ‐ ‐ Continue…
24
| Fiscal Policy Statem
ent, 2008‐09
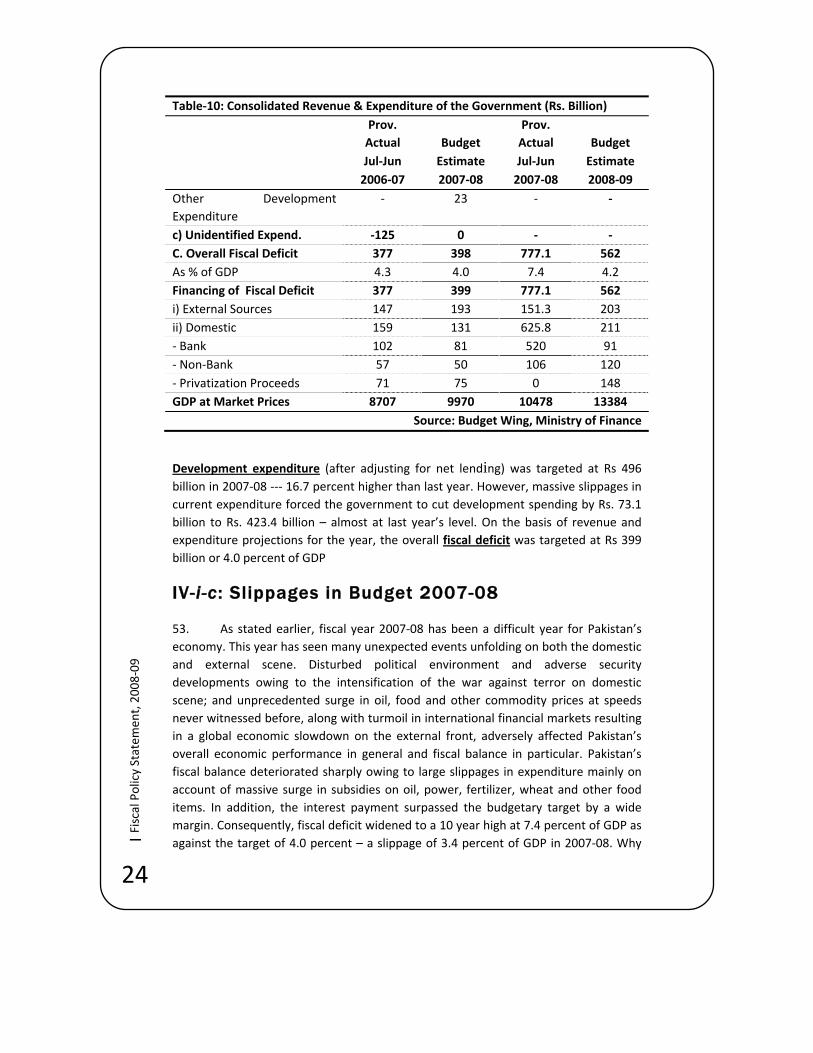
Table‐10: Consolidated Revenue & Expenditure of the Government (Rs. Billion) Prov.
Actual Budget Prov. Actual
Budget
Jul‐Jun Estimate Jul‐Jun Estimate 2006‐07 2007‐08 2007‐08 2008‐09
Other Development Expenditure
‐ 23 ‐ ‐
c) Unidentified Expend. ‐125 0 ‐ ‐ C. Overall Fiscal Deficit 377 398 777.1 562 As % of GDP 4.3 4.0 7.4 4.2 Financing of Fiscal Deficit 377 399 777.1 562 i) External Sources 147 193 151.3 203 ii) Domestic 159 131 625.8 211 ‐ Bank 102 81 520 91 ‐ Non‐Bank 57 50 106 120 ‐ Privatization Proceeds 71 75 0 148 GDP at Market Prices 8707 9970 10478 13384
Source: Budget Wing, Ministry of Finance
Development expenditure (after adjusting for net lending) was targeted at Rs 496 billion in 2007‐08 ‐‐‐ 16.7 percent higher than last year. However, massive slippages in current expenditure forced the government to cut development spending by Rs. 73.1 billion to Rs. 423.4 billion – almost at last year’s level. On the basis of revenue and expenditure projections for the year, the overall fiscal deficit was targeted at Rs 399 billion or 4.0 percent of GDP
IV-i-c: Slippages in Budget 2007-08
53. As stated earlier, fiscal year 2007‐08 has been a difficult year for Pakistan’s economy. This year has seen many unexpected events unfolding on both the domestic and external scene. Disturbed political environment and adverse security developments owing to the intensification of the war against terror on domestic scene; and unprecedented surge in oil, food and other commodity prices at speeds never witnessed before, along with turmoil in international financial markets resulting in a global economic slowdown on the external front, adversely affected Pakistan’s overall economic performance in general and fiscal balance in particular. Pakistan’s fiscal balance deteriorated sharply owing to large slippages in expenditure mainly on account of massive surge in subsidies on oil, power, fertilizer, wheat and other food items. In addition, the interest payment surpassed the budgetary target by a wide margin. Consequently, fiscal deficit widened to a 10 year high at 7.4 percent of GDP as against the target of 4.0 percent – a slippage of 3.4 percent of GDP in 2007‐08. Why

25
|Fiscal Policy Statem
ent, 2008‐09
such large slippages took place on the fiscal side in general and expenditures in particular? Table 11 documents the detailed account of slippages.
Table‐11: Variation in Budget 2007‐08 (Rs. Billion)
Budget 2007‐08
Revised Budget 2007‐
08
Variations A. Total Revenue 1475.9 1499.4 23.5 ‐ Tax Revenue 1095.5 1050.7 ‐44.8 ‐ Non‐Tax Revenue 380.4 448.7 68.3 B. Total Expenditure 1875 2276.5 401.5 ‐ Current Expenditure 1378 1858 480 Of which ‐ Interest Payment 374.6 490 115.4 ‐ Grants 37.8 87.3 49.5 ‐ Subsidies 100.4 369.7 269.3 ‐ WAPDA 52.9 113.7 60.8 ‐ Oil 15.0 165.9 150.9 ‐ Wheat 0 40 40 ‐ R & D Textile 0 17.5 17.5 ‐ TCP 8.7 5.7 ‐3 ‐ Development Expenditure 496.5 423.4 ‐73.1 ~ Statistical Discrepancy 0 ‐5.4 ‐5.4 ‐ Budget Deficit (A‐B) ‐399 ‐777.1 ‐378.1 As % of GDP 4.0 7.4 3.4
Source: Budget wing
54. Total expenditure was targeted at Rs 1875 billion, however the fiscal year 2007‐08 ended with Rs 2276.5 billion expenditure ‐‐ sum Rs 401.5 billion more than the target, purely on account of over spending in current expenditure (see Table 11). Interest payment is the single largest component of current expenditure. A sum of Rs 374.6 was budgeted for interest payments in 2007‐08. The year, however, ended with interest payments surpassing the target by Rs 115.4 billion to Rs 490 billion on account of two factors. Firstly, a slippage of Rs 54 billion occurred in the instrument (Defence Savings Certificate [DSC]) of National Savings Scheme (NSS). The DSC is a 10‐year paper and the investment made in this paper during 1997‐98 was to be matured in 2007‐08. Investment in this paper was made at 18 percent per annum, however, because of the compounding nature of interest payment associated with DSCs, a large chunk of investment matured in 2007‐08. The Central Directorate of National Savings (CDNS), who manages investment in NSS, was ill‐equipped to determine as to how many of DSC would be encashed by the end of the maturity period. Failure to correctly
26
| Fiscal Policy Statem
ent, 2008‐09
predict the maturing instruments or lack of information about pre‐mature encashment of NSS instruments caused massive slippages in interest payments.
55. Secondly, because of the slippage on fiscal deficit to the extent of Rs 378.1 billion, the borrowing requirements of the government also surged. The less‐than‐the targeted inflows from the external sources to finance fiscal deficit forced the government to rely heavily on domestic sources of financing, that is, on floating and permanent debt. With rising interest rates accompanied by large volumes of borrowing resulted in slippages in interest payments. Thus, a combination of underestimation of maturing NSS instruments, substantial rise in volume of borrowing and the consequential rise in interest rates were responsible for the slippages in interest payments.
56. Massive slippages (Rs. 269.3 billion) took place on account of not passing the rising international cost of fuel and food to domestic consumers. Oil subsidy was budgeted at Rs 15 billion and the international price of oil was hovering around $50‐55 per barrel (Arab Gulf Mean) at the time of preparing the Budget 2007‐08. It was also assumed that the government would be passing the rising cost of oil to domestic consumers. However, oil prices continued to rise at an unprecedented pace, reaching as high as $124 per barrel by June 2008 (that is, by the end of the fiscal year 2007‐08). The surge in oil prices in the range of 145‐150 percent at breakneck pace took place at a time when the country was passing through political transition to a new government. Long delays in passing the higher international price of oil to domestic consumers led to the rise in oil subsidy to Rs 166 billion, that is, Rs 151 billion more than the budgeted amount. Similarly, the higher cost of furnace oil, used in power generation, was not allowed to pass to domestic consumer by raising electricity tariff. Therefore, against the budgeted subsidy of Rs 53 billion, the power subsidy increased to Rs 114 billion – slippage of Rs 61 billion. Furthermore, at the time of preparation of the Federal Budget 2007‐08 the government never thought of importing wheat as the country reaped a bumper wheat crop (23.3 million tons) in 2006‐07. Hoarding, smuggling and mismanagement of wheat operation forced the government to import 1.7 million tons of wheat at all time high prices. The government had to import wheat at much higher prices and sold in the domestic market at a much cheaper price, the difference of these two prices were picked up by the government in terms of Rs 40 billion subsidy. Similarly, the government had to make payment to textile sector under R&D, amounting to Rs 17.5 billion. Such amount was not earmarked for the textile sector in the Budget 2007‐08.
57. Owing to the intensification of the war against terror the government had to spend Rs 49 billion more than the budgeted amount (See Table 11). As a result of these developments, the current expenditure surged to Rs 1858 billion – Rs 480 billion more than the targeted amount.
58. In order to minimize the damages caused by slippages in current expenditure, the government had to make extra‐ordinary efforts, both on revenue and
27
|Fiscal Policy Statem
ent, 2008‐09
development expenditure sides. The development expenditure was cut to the extent of Rs 73 billion by postponing various projects as well as by rationalizing expenditure. The government also made efforts on revenue front. While there was a slippage on tax revenue side to the extent of Rs 45 billion, it was over compensated by mobilizing Rs 68 billion additional non‐tax revenue. Thus, the overall revenue was almost Rs 24 billion more than the targeted amount which reduced the slippages on expenditure side to that extent and the fiscal year 2007‐08 ended with revenue‐expenditure gap of Rs 777 billion – Rs 378 billion more than the target for the year. In other words, fiscal deficit jumped to a ten year high at 7.4 percent of GDP in 2007‐08 as against the target of 4.0 percent for the year.
59. Such a large slippage in fiscal deficit in 2007‐08 has caused severe macroeconomic imbalances. The government is rightly pursuing tight fiscal and monetary policies to reduce the imbalances in a shortest possible time because the longer the imbalances persist the greater will be the adjustment required to restore macroeconomic stability with its associated pain to the general public. The tight monetary and fiscal policies currently being pursued are likely to cause economic growth to decelerate, investment rate to decline, and unemployment and poverty to rise. But this is the price the country will have to pay for its fiscal profligacy. It is in this background that the government has already launched a safety‐net program under the title of Benazir Income Support Program to protect the poor and vulnerable segments of society from adjustment cost.
60. While domestic and external shocks of extra‐ordinary proportions caused large slippages on the fiscal account, the financing plan of the fiscal deficit was also affected by these shocks. The overall fiscal deficit of Rs 399 billion was to be financed by external sources (Rs. 193 billion), and domestic sources (Rs 131 billion). The remaining Rs 75 billion was to come from privatization proceeds. Within domestic sources, Rs 81 billion financing was to come from banking sources while the remaining Rs 50 billion was to come from non‐bank sources. The domestic and external shocks not only increased the size of the fiscal deficit but also changed the composition of financing.
61. External resource inflows were adversely affected by these shocks. As against the budgeted external financing of Rs 193 billion, only Rs 151 billion could be materialized. Pakistan could neither complete the transaction of Global Depository Receipts (GDRs) of the National Bank of Pakistan nor could it launch sovereign and exchangeable bonds in 2007‐08. Furthermore, some of the lending from the multilateral banks did not materialize. Thus, the brunt of adjustments on the financing side fell on domestic sources. The borrowing requirements from domestic sources increased from Rs 131 billion to Rs 626 billion (with negligible privatization proceeds)—an increase of Rs 495 billion. Within domestic sources, the bulk (82.8 percent) of financing came from banks while the remaining Rs 108 billion or 17.2 percent came from non‐bank sources. Most importantly, the borrowings from the
28
| Fiscal Policy Statem
ent, 2008‐09
State Bank of Pakistan (SBP) reached an alarming level of Rs 677 billion. Such an elevated level of borrowing from the SBP was not only inflationary but also posed serious difficulties for the conduct of effective monetary policy. Due to the excessive borrowing from the SBP, the broad money supply grew by 15.3 percent and reserve money posted a growth of 21.6 percent in 2007‐08.
62. The Revenue balance, which is defined as the difference between the total revenue and current expenditures, representing the government’s savings or dis‐savings behaviour, was in deficit to the extent of Rs 359 billion or 3.4 percent of GDP in fiscal year 2007‐08. Under the FRDL Act 2005, the government was required to achieve zero revenue deficit or total revenue should have been sufficient to finance current expenditure by June 30, 2008 (or by the end of fiscal year 2007‐08). Accordingly, the government had infact targeted a revenue surplus of 1.0 percent of GDP in 2007‐08. However, the extra‐ordinary developments on fiscal side prevented the government to achieve the target set out in the FRDL Act 2005. The year, infact, ended with a revenue deficit of 3.4 percent of GDP – the highest revenue deficit in the last 18 years with the exception of 1998‐99 and as such violated one of the five elements of the Act.
63. The Primary balance, which is the difference between the total revenues and non‐interest‐total expenditure, measures the current fiscal policy stance of the government affecting the country’s indebtedness. During the fiscal year 2007‐08, the primary balance remained in deficit to the extent of Rs 287.1 billion or 2.7 percent of GDP. Interest payments in the current fiscal year reflects the fiscal stance adopted in the past. Therefore, excluding interest payments from the overall fiscal balance provides a clearer picture of the current fiscal efforts of the government. In order to stabilize or reduce public debt, it is necessary for the government to maintain a primary surplus. The developments on the fiscal side during 2007‐08 have taken Pakistan much further from a sustainable debt burden. The sooner Pakistan achieves a primary surplus, the better it is for stabilizing the country’s debt burden.
IV- ii : Fiscal Projections for 2008-09
Revenue Collection Comparison between 2007-08 and 2008-09
64. Lax fiscal policy pursued during the fiscal year 2007‐08 has created serious macroeconomic imbalances which need to be corrected at the earliest. Budget 2008‐09 has been prepared with a view to correcting imbalances in general and moving towards a sustainable fiscal position in particular.
65. The fiscal deficit is projected to decline to 4.2% of GDP in 2008‐09 from 7.4% in 2007‐08. In order to achieve fiscal deficit target for the year 2008‐09, tax revenues is targeted to increase by 0.6 percentage point to 10.6% and non‐interest current
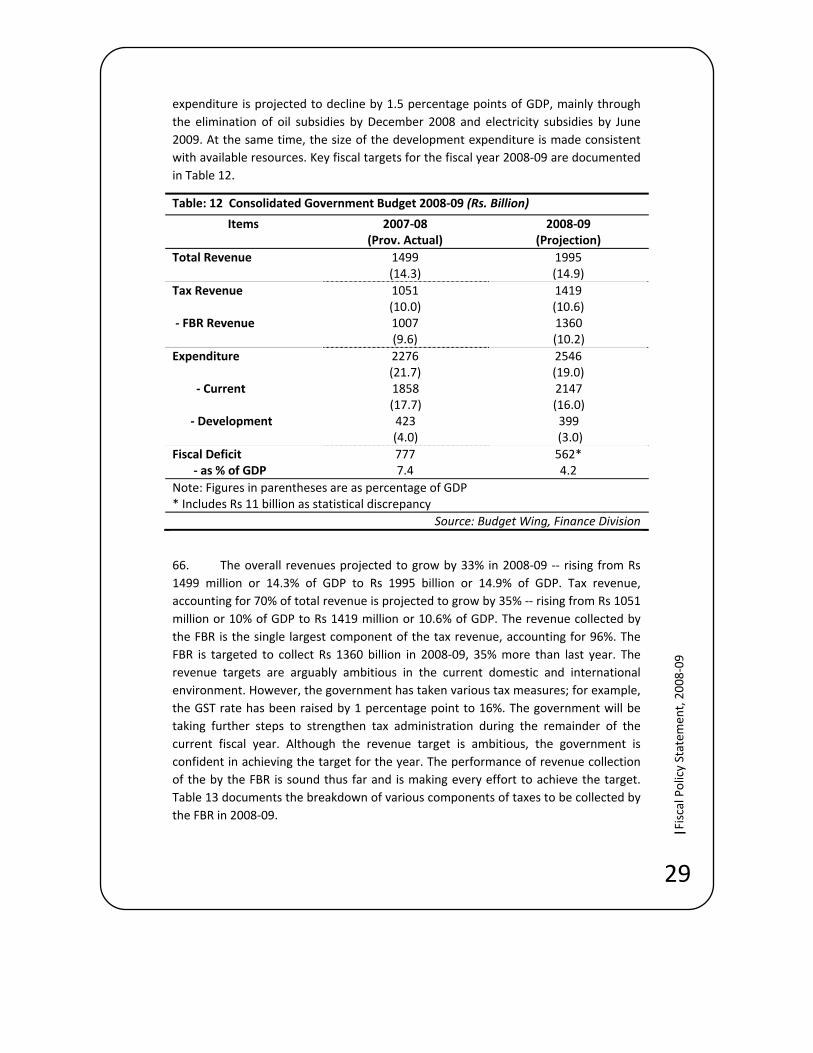
29
|Fiscal Policy Statem
ent, 2008‐09
expenditure is projected to decline by 1.5 percentage points of GDP, mainly through the elimination of oil subsidies by December 2008 and electricity subsidies by June 2009. At the same time, the size of the development expenditure is made consistent with available resources. Key fiscal targets for the fiscal year 2008‐09 are documented in Table 12.
Table: 12 Consolidated Government Budget 2008‐09 (Rs. Billion)
Items 2007‐08(Prov. Actual)
2008‐09 (Projection)
Total Revenue 1499(14.3)
1995 (14.9)
Tax Revenue ‐ FBR Revenue
1051(10.0) 1007 (9.6)
1419 (10.6) 1360 (10.2)
Expenditure
‐ Current
‐ Development
2276(21.7) 1858 (17.7) 423 (4.0)
2546 (19.0) 2147 (16.0) 399 (3.0)
Fiscal Deficit ‐ as % of GDP
7777.4
562* 4.2
Note: Figures in parentheses are as percentage of GDP* Includes Rs 11 billion as statistical discrepancy
Source: Budget Wing, Finance Division
66. The overall revenues projected to grow by 33% in 2008‐09 ‐‐ rising from Rs 1499 million or 14.3% of GDP to Rs 1995 billion or 14.9% of GDP. Tax revenue, accounting for 70% of total revenue is projected to grow by 35% ‐‐ rising from Rs 1051 million or 10% of GDP to Rs 1419 million or 10.6% of GDP. The revenue collected by the FBR is the single largest component of the tax revenue, accounting for 96%. The FBR is targeted to collect Rs 1360 billion in 2008‐09, 35% more than last year. The revenue targets are arguably ambitious in the current domestic and international environment. However, the government has taken various tax measures; for example, the GST rate has been raised by 1 percentage point to 16%. The government will be taking further steps to strengthen tax administration during the remainder of the current fiscal year. Although the revenue target is ambitious, the government is confident in achieving the target for the year. The performance of revenue collection of the by the FBR is sound thus far and is making every effort to achieve the target. Table 13 documents the breakdown of various components of taxes to be collected by the FBR in 2008‐09.

30
| Fiscal Policy Statem
ent, 2008‐09
Table 13: Comparison of Revenue (Rs. Billion) 2007‐08 2008‐09
Growth (%) R.E ProjectedTotal Revenue 1499 1995 33.0 Tax Revenue 1051 1419 35.0 FBR Revenue 1007 1360 35.0 Direct Taxes 387.5 530.0 36.8
Indirect Taxes 619.7 830.0 33.9 ‐ Sales Tax 376.9 516.0 36.9 ‐ Federal Excise 92.2 121.0 31.2 ‐ Customs Duty 150.6 193.0 28.2
Source: Federal Board of Revenue
Revenue Collection July-December 2008
67. The FBR was initially assigned the target to collect Rs 1250 billion for the fiscal year 2008‐09. However, given the impressive performance of their tax collection for the first four months of the fiscal year, the FBR is now assigned an ambitious target to collect Rs 1360 billion for the current fiscal year which is estimated to be 35 percent higher than last year. During the first six months (July‐December) of the current fiscal year, the FBR has provisionally collected Rs 552.5 billion against the initial target of Rs 548.8 billion and the revised target of Rs 580.7 billion for the same period. In other words, FBR has already surpassed the original target and achieved 95.1 percent of the revised target during the first six months of the current fiscal year.
68. The FBR, as stated earlier, has provisionally collected Rs 552.5 billion (net) during the first six months of the current fiscal year as compared to Rs 435.1 billion in the same period last year, thereby posting an increase of 27 percent. Direct taxes are up by 27.8% while indirect taxes registered a growth of 26.6 percent in the first six months of the current fiscal year. Within indirect taxes, Sales Tax grew by 28.3 percent, Federal Excise is up by 32.2 percent and Custom Duty posted a growth of 18.2 percent. The share of direct taxes at 38.1 percent has remained more or less of last year’s level. Details for the FBR collection for the period July – December 2008 are documented in Table 14.
Table‐14: FBR Revenue Collection July‐December 2008 (Net) (Rs. Billion)
Direct Taxes Indirect Taxes Total Tax
Collection Sales Excise Customs TotalJuly 18.5 33.5 8.2 12.3 54.0 72.5 August 22.2 36.6 8.9 11.1 56.6 78.8 September 47.6 40.1 8.3 14.7 63.1 110.7 Continue…
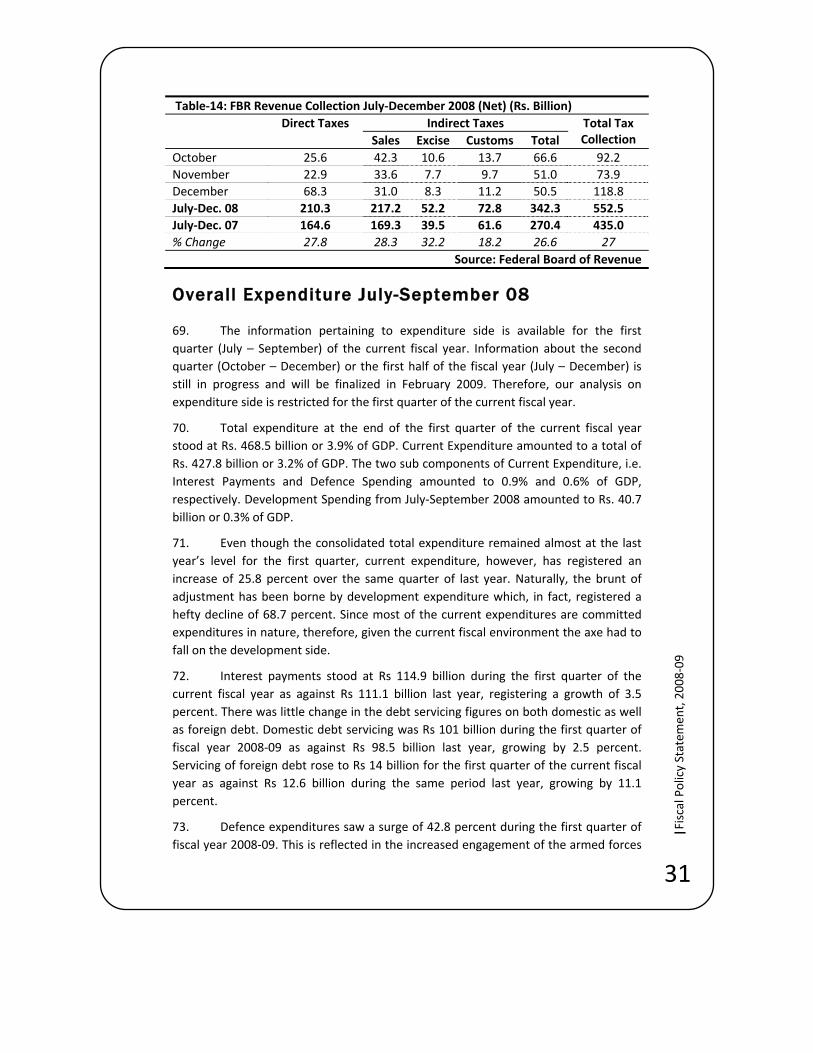
31
|Fiscal Policy Statem
ent, 2008‐09
Table‐14: FBR Revenue Collection July‐December 2008 (Net) (Rs. Billion)
Direct Taxes Indirect Taxes Total Tax
Collection Sales Excise Customs TotalOctober 25.6 42.3 10.6 13.7 66.6 92.2 November 22.9 33.6 7.7 9.7 51.0 73.9 December 68.3 31.0 8.3 11.2 50.5 118.8 July‐Dec. 08 210.3 217.2 52.2 72.8 342.3 552.5 July‐Dec. 07 164.6 169.3 39.5 61.6 270.4 435.0 % Change 27.8 28.3 32.2 18.2 26.6 27
Source: Federal Board of Revenue
Overall Expenditure July-September 08
69. The information pertaining to expenditure side is available for the first quarter (July – September) of the current fiscal year. Information about the second quarter (October – December) or the first half of the fiscal year (July – December) is still in progress and will be finalized in February 2009. Therefore, our analysis on expenditure side is restricted for the first quarter of the current fiscal year.
70. Total expenditure at the end of the first quarter of the current fiscal year stood at Rs. 468.5 billion or 3.9% of GDP. Current Expenditure amounted to a total of Rs. 427.8 billion or 3.2% of GDP. The two sub components of Current Expenditure, i.e. Interest Payments and Defence Spending amounted to 0.9% and 0.6% of GDP, respectively. Development Spending from July‐September 2008 amounted to Rs. 40.7 billion or 0.3% of GDP.
71. Even though the consolidated total expenditure remained almost at the last year’s level for the first quarter, current expenditure, however, has registered an increase of 25.8 percent over the same quarter of last year. Naturally, the brunt of adjustment has been borne by development expenditure which, in fact, registered a hefty decline of 68.7 percent. Since most of the current expenditures are committed expenditures in nature, therefore, given the current fiscal environment the axe had to fall on the development side.
72. Interest payments stood at Rs 114.9 billion during the first quarter of the current fiscal year as against Rs 111.1 billion last year, registering a growth of 3.5 percent. There was little change in the debt servicing figures on both domestic as well as foreign debt. Domestic debt servicing was Rs 101 billion during the first quarter of fiscal year 2008‐09 as against Rs 98.5 billion last year, growing by 2.5 percent. Servicing of foreign debt rose to Rs 14 billion for the first quarter of the current fiscal year as against Rs 12.6 billion during the same period last year, growing by 11.1 percent.
73. Defence expenditures saw a surge of 42.8 percent during the first quarter of fiscal year 2008‐09. This is reflected in the increased engagement of the armed forces
32
| Fiscal Policy Statem
ent, 2008‐09
in parts of NWFP and other tribal areas as well as the maintenance of the law and situation after a string of domestic terrorist attacks because of the intensification of the war against terror.
Overall Fiscal Deficit July-September 08
74. The Fiscal Deficit for the first quarter of 2008‐09 stood at Rs. 139.5 billion which is 1.0% of the projected GDP. The fiscal deficit is lower by Rs. 18.6 billion or 11.7 percent than it was last year during the same period which is a welcome sign. The government has done a good job in containing the fiscal deficit during the first quarter of the current fiscal year by raising revenues and curtailing expenditures. The revenue balance for the first quarter is in deficit by Rs 42.8 billion while the primary balance is in deficit by Rs 24.5 billion. If current trends persist, and strong corrective measures are not undertaken promptly, the annual fiscal deficit target of 4.2 percent of GDP for 2008‐09 may not be met. It is very crucial that the government makes an effort to achieve the fiscal deficit target as this would send a strong signal of the government’s commitment to fiscal discipline and macroeconomic stability
V. Review of Public Debt
75. Total government (public) debt contains both debt denominated in Rupees as well as debt denominated in foreign currency. Pakistan’s public debt grew by a considerable 22.6 percent in 2007‐08 whereas the nominal GDP grew at a rate of 20.1 percent over the same period. This marks the first time since 2000‐01 that the growth in public debt out paced the growth in nominal GDP, which was the norm in the 1980s (18% growth in public debt, 11.9% growth in nominal GDP) and 1990s (15% growth in public debt, 13.9% growth in nominal GDP)
76. Consequently, public debt as a percentage of GDP rose from 55.2 percent from the end of June 2007 to 56.3 percent by the end of June 2008. The last time the figure of public debt as percentage of GDP went up was at the end of June 2001 but had exhibited a downward trend up until end June 2007. Although Pakistan has done well to reduce its debt as percentage of GDP ratio from nearly 100 percent from end June 1999 to 56.3 percent in end June 2008, the fact that it has risen from last year is a source of concern. The higher growth in debt is partly a result of higher fiscal and current account deficits for fiscal year 2008, which stood at 7.4 percent and 8.6 percent of GDP, respectively.
77. The debt strategy put in place by the government has performed reasonably well over the past 8 years despite the setback in fiscal year 2008. Back in 2000, the government had set up a high level Debt Committee to examine the root cause of the rising debt burden and suggest a debt reduction strategy to stabilize the debt situation. Reduction in the fiscal and current account deficits, lowering the cost of borrowing, raising revenue and foreign exchange earnings, and debt re‐profiling from
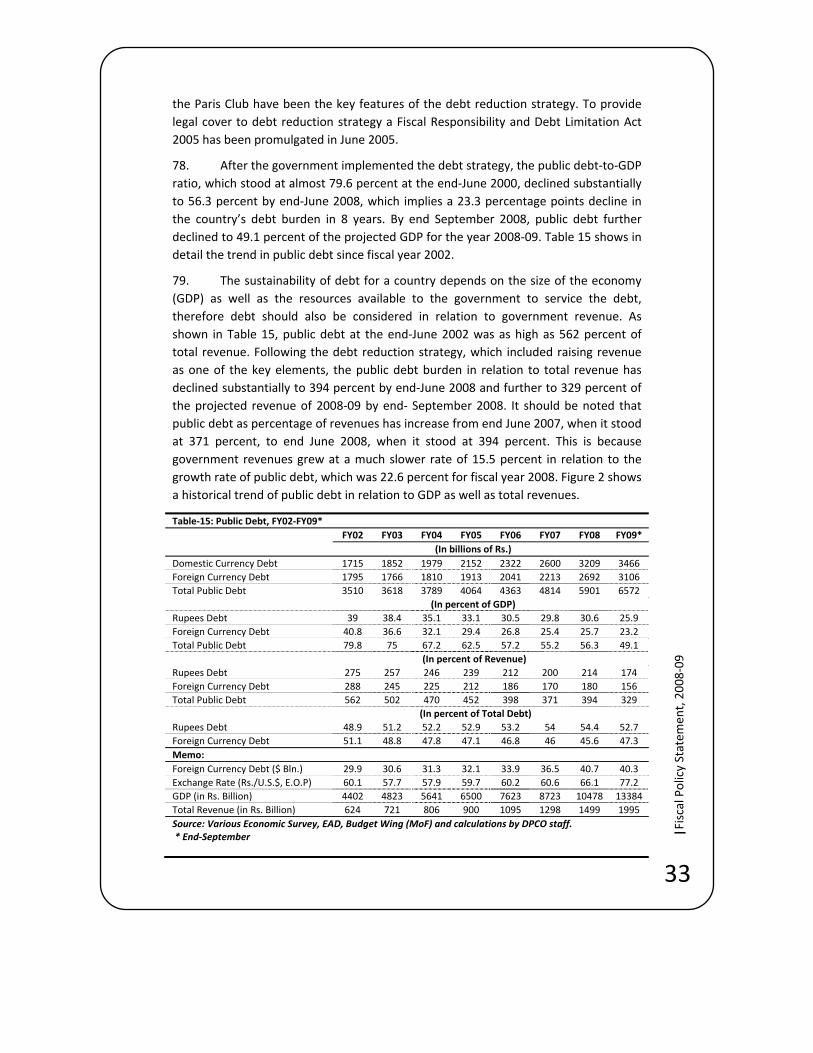
33
|Fiscal Policy Statem
ent, 2008‐09
the Paris Club have been the key features of the debt reduction strategy. To provide legal cover to debt reduction strategy a Fiscal Responsibility and Debt Limitation Act 2005 has been promulgated in June 2005.
78. After the government implemented the debt strategy, the public debt‐to‐GDP ratio, which stood at almost 79.6 percent at the end‐June 2000, declined substantially to 56.3 percent by end‐June 2008, which implies a 23.3 percentage points decline in the country’s debt burden in 8 years. By end September 2008, public debt further declined to 49.1 percent of the projected GDP for the year 2008‐09. Table 15 shows in detail the trend in public debt since fiscal year 2002.
79. The sustainability of debt for a country depends on the size of the economy (GDP) as well as the resources available to the government to service the debt, therefore debt should also be considered in relation to government revenue. As shown in Table 15, public debt at the end‐June 2002 was as high as 562 percent of total revenue. Following the debt reduction strategy, which included raising revenue as one of the key elements, the public debt burden in relation to total revenue has declined substantially to 394 percent by end‐June 2008 and further to 329 percent of the projected revenue of 2008‐09 by end‐ September 2008. It should be noted that public debt as percentage of revenues has increase from end June 2007, when it stood at 371 percent, to end June 2008, when it stood at 394 percent. This is because government revenues grew at a much slower rate of 15.5 percent in relation to the growth rate of public debt, which was 22.6 percent for fiscal year 2008. Figure 2 shows a historical trend of public debt in relation to GDP as well as total revenues.
Table‐15: Public Debt, FY02‐FY09*
FY02 FY03 FY04 FY05 FY06 FY07 FY08 FY09* (In billions of Rs.)
Domestic Currency Debt 1715 1852 1979 2152 2322 2600 3209 3466 Foreign Currency Debt 1795 1766 1810 1913 2041 2213 2692 3106 Total Public Debt 3510 3618 3789 4064 4363 4814 5901 6572 (In percent of GDP)Rupees Debt 39 38.4 35.1 33.1 30.5 29.8 30.6 25.9 Foreign Currency Debt 40.8 36.6 32.1 29.4 26.8 25.4 25.7 23.2 Total Public Debt 79.8 75 67.2 62.5 57.2 55.2 56.3 49.1 (In percent of Revenue)Rupees Debt 275 257 246 239 212 200 214 174 Foreign Currency Debt 288 245 225 212 186 170 180 156 Total Public Debt 562 502 470 452 398 371 394 329 (In percent of Total Debt)Rupees Debt 48.9 51.2 52.2 52.9 53.2 54 54.4 52.7 Foreign Currency Debt 51.1 48.8 47.8 47.1 46.8 46 45.6 47.3 Memo: Foreign Currency Debt ($ Bln.) 29.9 30.6 31.3 32.1 33.9 36.5 40.7 40.3 Exchange Rate (Rs./U.S.$, E.O.P) 60.1 57.7 57.9 59.7 60.2 60.6 66.1 77.2 GDP (in Rs. Billion) 4402 4823 5641 6500 7623 8723 10478 13384 Total Revenue (in Rs. Billion) 624 721 806 900 1095 1298 1499 1995 Source: Various Economic Survey, EAD, Budget Wing (MoF) and calculations by DPCO staff. * End‐September
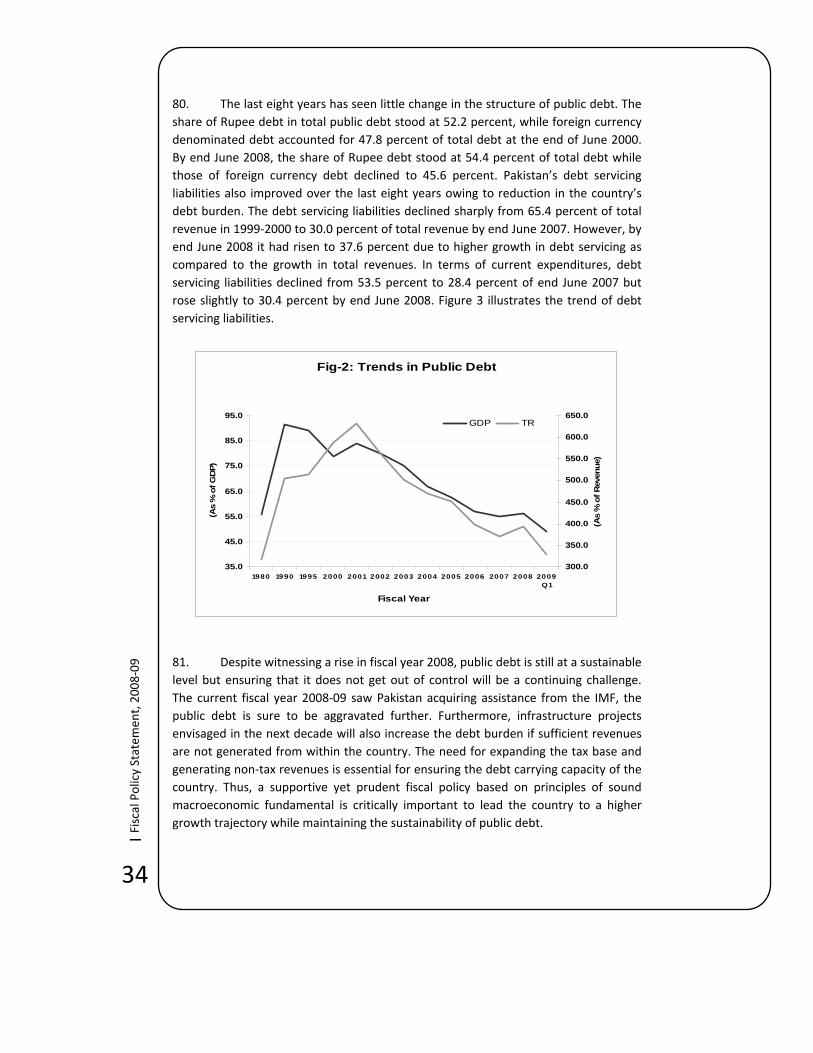
34
| Fiscal Policy Statem
ent, 2008‐09
Fig-2: Trends in Public Debt
35.0
45.0
55.0
65.0
75.0
85.0
95.0
1980 1990 1995 2000 2001 2002 2003 2004 2005 2006 2007 2008 2009Q1
Fiscal Year
(As
% o
f GD
P)
300.0
350.0
400.0
450.0
500.0
550.0
600.0
650.0
(As
% o
f Rev
enue
)
GDP TR
80. The last eight years has seen little change in the structure of public debt. The share of Rupee debt in total public debt stood at 52.2 percent, while foreign currency denominated debt accounted for 47.8 percent of total debt at the end of June 2000. By end June 2008, the share of Rupee debt stood at 54.4 percent of total debt while those of foreign currency debt declined to 45.6 percent. Pakistan’s debt servicing liabilities also improved over the last eight years owing to reduction in the country’s debt burden. The debt servicing liabilities declined sharply from 65.4 percent of total revenue in 1999‐2000 to 30.0 percent of total revenue by end June 2007. However, by end June 2008 it had risen to 37.6 percent due to higher growth in debt servicing as compared to the growth in total revenues. In terms of current expenditures, debt servicing liabilities declined from 53.5 percent to 28.4 percent of end June 2007 but rose slightly to 30.4 percent by end June 2008. Figure 3 illustrates the trend of debt servicing liabilities.
81. Despite witnessing a rise in fiscal year 2008, public debt is still at a sustainable level but ensuring that it does not get out of control will be a continuing challenge. The current fiscal year 2008‐09 saw Pakistan acquiring assistance from the IMF, the public debt is sure to be aggravated further. Furthermore, infrastructure projects envisaged in the next decade will also increase the debt burden if sufficient revenues are not generated from within the country. The need for expanding the tax base and generating non‐tax revenues is essential for ensuring the debt carrying capacity of the country. Thus, a supportive yet prudent fiscal policy based on principles of sound macroeconomic fundamental is critically important to lead the country to a higher growth trajectory while maintaining the sustainability of public debt.

35
|Fiscal Policy Statem
ent, 2008‐09
Fig-3: Trends in Debt Servicing
25
30
35
40
45
50
55
60
65
70
1997-98 1998-99 1999-00 2000-01 2001-02 2002-03 2003-04 2004-05 2005-06 2006-07 2007-08
Fiscal Year
(as
% o
f TR
and
CE)
Total RevenuesCurrent Expenditures
VI. Sustainability of Fiscal Policy
82. Fiscal year 2007‐08 showed that a loose fiscal policy is the first step towards an unsustainable debt path that can lead to a macroeconomic crisis. The fiscal discipline shown between 2001‐02 and 2006‐07 has been reversed because of the difficulties faced last year. There is a consensus that the sustainability of fiscal policy could be gauged by simply answering the following questions: “Can the current course of fiscal policy be sustained without exploding debt? Or will the government have to sharply increase taxes, decrease spending, have recourse to monetization, or even repudiation of debt?”
83. The sustainability of fiscal policy is built‐in in the Fiscal Responsibility and Debt Limitation Act 2005. Some aspects of the Act were violated during 2007‐08, for instance, the 2.5 percentage points reduction in debt‐to‐GDP ratio every year could not be achieved. On the contrary, the debt‐to‐GDP ratio increased by 1.1 percent of GDP. Also, the elimination of revenue deficit by end June 2008 was missed as the revenue balance eroded substantially. For a sustainable fiscal policy the economy needs primary surplus in excess of one percent of GDP. A credible and prudent fiscal policy comprised of; (i) a balanced tax structure based on rational and affordable rates with minimal exemptions covering a broad range of taxpayers, (ii) an expenditure policy that aims to moderate growth in non‐developmental expenditure and adequately accommodate the pressing social and infrastructure needs of a developing economy, and (iii) a prudent debt management policy.
36
| Fiscal Policy Statem
ent, 2008‐09
VII. Medium-Term Budgetary Framework (MTBF)
84. The Budget 2008‐09 has been prepared within the Medium Term Budgetary Framework (MTBF) which is consistent with the country’s overall macroeconomic framework and legal obligation under Section‐5 and 6 of the Fiscal Responsibility and Debt Limitation Act 2005. To enable ministries/spending agencies to prioritize their spending plan within the indicated envelope in a consistent and coherent manner, the Government has initiated the process of putting in place a Medium–Term Budgetary Framework (MTBF). Such a framework will, to a greater extent, reduce the uncertainties that impede effective planning. This will be a rolling resource envelope and will target outcome rather than financial input and expenditure.
85. The fiscal aspect of the macroeconomic framework adheres to the limit set by the Act, and accordingly a revenue surplus is maintained throughout the period of the Medium‐Term. Within this framework, current expenditures decline from nearly 17.7 percent of GDP in 2007/08 to 13.6 percent in 2012/13. This restraint is largely brought about by declining payments for interest. Development expenditure is projected to increase from around 4 percent of GDP in 2007/08 to 6.3 percent of a much larger GDP in 2012/13.
VIII. Public – Private Partnership
86. The Government recognizes the importance of improving and expanding infrastructure services for sustaining economic and social development in its Medium Term Development Framework (MDTF) 2005‐2010. Pakistan's infrastructure needs are massive and its resources are limited. Not only is there limited fiscal space, there are also huge gaps in public sector capacity to build and operate infrastructure. Improved quality and service coverage in power and water supply, sewerage treatment, transport and logistics are vital for Pakistan's economy and the livelihood of its people. Tight fiscal constraints require innovative approaches, away from the traditional role of the Government as the service provider, to ensure that the massive investment needs are financed with the assistance of the private sector. The Government estimates that less than half of the infrastructure investment needs can be covered by public funds under the Medium Term Development Framework. A combination of policy reforms, institutional support, incentives and financing modalities is required to encourage private‐sector participation in financing, constructing and managing infrastructure projects. In order to structure a comprehensive Public Private Partnership (PPP) program for Pakistan, the Government has looked at global best practice and sought the advice of multilaterals. Based on participant feedback and inline with global best practice, it was concluded that in order to have a successful PPP program, the country needs:
• Commitment and participation at the highest levels within the Government; a conducive policy framework;

37
|Fiscal Policy Statem
ent, 2008‐09
• An institutional set up containing core expertise to coordinate and promote PPP activities;
• A communication strategy;
• A policy on targeted subsidies; and
• Availability of long term fixed rate financing in local currency.
As a follow‐up to above, and with the assistance of the Asian Development Bank, the Government has structured a PPP program that includes;
1. Establishment of a PPP Task Force that is chaired by the Advisor to the Prime Minister on Finance and includes all key stakeholders. The purpose of the Task Force is to formulate a policy, regulatory and legislative structure that is conducive to creating a PPP market in Pakistan;
2. Establishment of the Infrastructure Project Development Facility that serves as the Secretariat to the Task Force, provides 'hands‐on' technical assistance to implementing agencies at all tiers of government, builds their implementation capacity, and provides inputs financing, guarantees, subsidies etc.; and
87. Formulating a business plan to establish the Infrastructure Project Financing Facility (IPFF) to provide 'residual' long term fixed rate local currency financing. Global experience suggests that the magnitude of investment required is such that it is neither prudent nor efficient to fund this from the Budget. The Government therefore, plans to make far greater use of public–private partnership in developing infrastructure to a level that is consistent with the Governments’ economic growth target of 6‐8 percent over the long‐run. The principal benefit of using PPPs to develop infrastructure is that they allow governments to allocate risks more efficiently than if the infrastructure were developed and operated only by the government. Sharing risks between the two parties means that each party will bear those project risks that is it best placed to manage.
IX. Report on Compliance with FRDL Act 2005
88. The Fiscal Responsibility and Debt Limitation Act, 2005 requires that the federal government take measures to reduce total public debt and maintain it within prudent limits thereof. The following sections identifies the various limits prescribed by the FRDL Act 2005 and reports on progress thereof.
89. The FRDL Act 2005 requires the following:
(1) Reducing the revenue deficit to nil not later than the thirteenth June, 2008 and thereafter maintaining a revenue surplus
Revenue balance (Total Revenue minus current expenditure) not only breached the performance target but, infact, deteriorated significantly during the fiscal year 2007‐08. As against the target of achieving revenue deficit to zero, the fiscal year 2007‐08
38
| Fiscal Policy Statem
ent, 2008‐09
has ended up with an all time high revenue deficit of 3.4 percent of GDP. In other words, current expenditure exceeded the total revenue by Rs 359 billion or 3.4 percent of GDP, mainly on account of massive slippages that took place in interest payments and oil and power subsidies during 2007‐08. Revenue deficit is also the dis‐saving of the government which contributed to reducing overall national saving rate (national savings as percent of GDP). Serious corrective measures are required to bring current expenditures at least at the level of total revenue. In other words, total revenue should be sufficient to finance at least the current expenditure and if there is a need to borrow, the government can borrow for development purpose. It is in this perspective that the government has targeted to bring revenue deficit down to Rs 152 billion or 1.1 percent of GDP in 2008‐09. It is expected that the government will achieve the target of bringing revenue deficit to zero by 2009‐10 and will maintain revenue surplus thereafter.
90. (2) Ensure “that within a period of ten financial year, beginning from the first July, 2003 and ending on thirtieth June, 2013, the total public debt at the end of the tenth financial year does not exceed sixty percent of the estimated gross domestic product for that year and thereafter maintaining the total public debt below sixty percent of gross domestic product for any given year.”
Government has already met and actually exceeded the requirement on the level of public debt as a percentage of GDP. The Government has achieved the goal of reducing public debt as percentage of GDP below 60 percent well ahead of time. Furthermore, this limit has been realized within three financial years instead of ten years as envisaged by the FRDL Act. At the beginning of July 2003, the total public debt stood at 75.1 percent of GDP while at the end of June 2008, the same figure stood at 56.3 percent of GDP. By the end‐September 2008, the public debt‐to‐GDP ratio stood at 49.1 percent of the projected GDP for 2008‐09.
91. (3) Ensure “that in every financial year, beginning from the first July, 2003, and ending on the thirtieth June 2013, the total public debt is reduced by no less than two and a half percent of the estimated gross domestic product for any given year, provided that social and poverty alleviation related expenditures are not reduced below 4.5 percent of the estimated gross domestic product for any given year and budgetary allocation to education and health, will be doubled from the existing level in terms of percentage of gross domestic product during the next ten years.”
The government did not meet this requirement in fiscal year 2007‐08. Public debt stood at 55.2 percent of GDP by end June 2007 but increased to 56.3 percent of GDP by end‐June 2008, which implies a 1.3 percentage point rise in the public debt‐to‐GDP ratio instead of a reduction of 2.5 percentage points. Even though the reduction in
39
|Fiscal Policy Statem
ent, 2008‐09
public debt‐to‐GDP ratio did not meet the target of 2.5 percentage points per annum, this part of the FRDL Act 2005 was meant to be a vehicle in achieving the more important target of reducing the public debt‐to‐GDP ratio to less than 60 percent within a ten year span. Achieving the target of debt‐to‐GDP ratio ahead of time notwithstanding, the reversal of the declining trend in debt burden is a serious matter. Instead of reducing public debt by 2.5 percentage points, it has, infact, registered an increase of 1.3 percentage points. The government should be vigilant in ensuring that the rise in the debt to GDP ratio during 2007‐08 is not allowed to continue otherwise it will breach the 60 percent targeted level as required by the FRDL Act 2005. By end‐September 2008, the public debt‐to‐GDP ratio declined to 49.1 percent of the projected GDP for 2008‐09. An important aspect about fiscal prudence is that it is not achieved at the expense of reduction in social sector and poverty related expenditure. These expenditures were 4.9 percent of GDP in 2006‐07 but increased to 5.5 percent of GDP in 2007‐08. Poverty and social sector related expenditure is targeted at 6 percent of GDP for the year 2008‐2009. It means legal obligation to keep these expenditures at 4.5 percent of GDP has been met with great ease. Expenditure on education and health are also growing briskly, and there are indications that expenditure on these items will be doubled in terms of percentage of GDP by 2012‐13.
92. (4) Not issue “new guarantees, including those for rupee lending, bonds, rates of return, output purchase agreements and all other claims and commitments that may be prescribed, from time to time, for any amount exceeding two percent of the estimated gross domestic product in any financial year: Provided that the renewal of existing guarantees shall be considered as issuing a new guarantee.”
The government remained within this required limit of 2% of GDP by issuing Rs. 88.5 billion new guarantees which is 0.85% of GDP for fiscal year 2007‐08. For the first quarter of the current fiscal year of 2008‐09, the government has issued Rs. 84.6 billion of new guarantees which amount to 0.63% of GDP which is a fraction of what is required by the FRDL 2005.
X. Concluding Remarks
93. Pakistan’s fiscal position deteriorated considerably during the fiscal year 2007‐08, mainly on account of events that occurred unexpectedly on domestic and external scene. Absence of effective policy response to address domestic and external shocks further accentuated difficulties on the fiscal front. Fiscal deficit widened to a ten year high at 7.4 percent of GDP as against the target of 4 percent. Under projection of interest payments, massive surge in subsidies in oil, power, wheat, fertilizer, and other food items; increase in security related expenditure; and payments against non‐budgeted items were responsible for substantially higher‐than‐targeted fiscal deficit. Consequently, Pakistan failed to fulfill two elements of the FRDL
40
| Fiscal Policy Statem
ent, 2008‐09
Act 2005 in the fiscal year 2007‐08. Under the FRDL Act 2005, the government was required to achieve zero revenue deficit by the end of the fiscal year 2007‐08. Instead of achieving zero revenue deficit, it jumped to an 18 year high (with the exception of 1998‐99), increasing by Rs 359 billion or 3.4 percent of GDP. The Act also requires that the government would reduce public debt at least 2.5 percentage points of GDP every year. The government did not meet this requirement as well. Public debt, instead of declining by 2.5 percentage points of GDP, has infact increased by 1.1 percentage points.
94. The lax fiscal policy pursued during 2007‐08 for whatever reason, has weakened Pakistan’s fiscal position. The hard earned macroeconomic stability underpinned by fiscal discipline evaporated in this year, for which Pakistan is going to pay a heavy price in terms of growth deceleration, decline in investment rate, rise in unemployment and poverty, higher current account deficit, rising debt burden, a loss of foreign exchange reserves, higher inflation and rise in interest rate.
95. Budget 2008‐09 has been prepared with a view to correcting macroeconomic imbalances in general and moving a towards a sustainable fiscal position in particular. The government is making serious efforts to reduce imbalances in the shortest possible time because it believes that the longer the imbalances persist, the greater will be the adjustment requirement and more will be the associated pain for the common man. It is expected that the government will return to a rule‐based fiscal policy and will adhere to the principles as laid down in the FRDL Act 2005, in the next two years, that is, by the end of the fiscal year 2009‐10.
96. There is increasing evidence that the present tax system can no longer serve the needs of the country. Pakistan’s tax system faces several structural weaknesses that resulted into the stagnation of tax‐to‐GDP ratio at around 10 to 12 percent over the last many years. It is time to take a fresh look at Pakistan’s tax system and tax administration which require far‐reaching reforms. Widening the tax base by reducing exemptions, incentives and concessions is one of the guiding principles of an efficient tax system. No country can develop on a sustained basis with tax‐to‐GDP ratio at 10 percent. Broadening the tax bases by bringing sectors which are either un‐taxed or under‐taxed into the tax net is the only way forward in achieving a tax‐to‐GDP ratio at 16 to 17 percent which is the average tax efforts of developing countries. Going forward, Pakistan will be needing large resources to build and strengthen the country’s physical and human infrastructure. With current limited tax bases, it will be next to impossible to generate adequate resources to fund these infrastructure programs. Besides broadening of tax bases, the strengthening of tax administration will be vital for generating adequate resources. Broadening of tax bases and strengthening of tax administration require political commitment which at present is very much there.
___________________________