fiscal risks statement - dbm.gov.ph · npl non-performing loan nrps national retail payment system...
TRANSCRIPT

FISCAL RISKS
STATEMENT 2017
Development Budget Coordination Committee

i
List of Acronyms and Abbreviations
ASEAN Association of Southeast Asian Nations
BCLTE Basic Competency for Local Treasury Examination
BCMA Basic Course on Mass Appraisal
BESF Budget of Expenditures and Sources of Financing
BIR Bureau of Internal Revenue
BLGF Bureau of Local Government Finance
BNM Bank Negara Malaysia
BOC Bureau of Customs
BPF Budget Priorities Framework
BPO Business Process Outsourcing
BRPS Budget Reporting and Performance Standards
BSF Bond Sinking Fund
BSFIs BSP-Supervised Financial Institutions
BSP Bangko Sentral ng Pilipinas
BTMS Budget and Treasury Management System
BTr Bureau of the Treasury
CAR Capital Adequacy ratio
CET Common Equity Tier
CCET Climate Change Expenditures Tagging
CMTA Customs Modernization and Tariff Act
CO Capital Outlays
CFO Commission on Filipinos Overseas
COA Commission on Audit
CPCS Compensation and Position Classification System
CPD Continuous Professional Development
CPE Continuing Professionalization Education
CRM Cash Register Machines
CSC Civil Service Commission
DBCC Development Budget Coordination Committee
DBM Department of Budget and Management

ii
DC Department Circular
DepEd Department of Education
DILG Department of Interior and Local Government
DND Department of National Defense
DO Department Order
DOF Department of Finance
DOJ Department of Justice
DOLE Department of Labor and Employment
DOTC Department of Transportation and Communication
DOTr Department of Transportation
DPWH Department of Public Works and Highways
DRRM Disaster Risk and Reduction Management
EITI Extractive Industries Transparency Initiative
ENRDMT Environment and Natural Resources Data Management Tool
EOPT Ethic-Oriented Personality Test
FCP Financial Consumer Protection
FIU Fiscal Intelligence Unit
FIR Fiscal Incentives Rationalization
FSCC Financial Stability Coordination Council
FSF Financial Sector Forum
FSS Fiscal Sustainability Scorecard
FX Foreign Exchange
FXRC Foreign Exchange Risk Cover
GAA General Appropriations Act
GCG Governance Commission for GOCCs
GDP Gross Domestic Product
GFIs Government Financial Institutions
GOCC Government-Owned and Controlled Corporations
GSIS Government Service Insurance System
HGC Home Guaranty Corporation
HoA Heads of Agreement
ICD Institute of Corporate Directors
iii
ICRS Integrated Corporate Reporting System
IMF International Monetary Fund
IP Interest Payments
IPP Independent Power Producers
IRA Internal Revenue Allotment
LCR Liquidity Coverage Ratio
LGC Local Government Code
LGU Local Government Unit
LIBOR London Inter-Bank Offer Rate
LRTA Light Rail Transit Authority
LSR Locally-Sourced Revenues
LWUA Local Water Utilities Administration
MB Monetary Board
MNFGCs Major Non-Financial Government Corporations
MOOE Maintenance and Other Operating Expenditures
MPBF Miscellaneous Personnel Benefits Fund
MWSS Metropolitan Waterworks and Sewerage System
NDC National Development Company
NDF Non-deliverable forward
NDRRMC National Disaster Risk Reduction Management Council
NEA National Electrification Administration
NEDA National Economic and Development Authority
NFA Net Foreign Assets
NG National Government
NGP National Greening Program
NHA National Housing Authority
NIA National Irrigation Administration
NLP Net Lending Program
NPC National Power Corporation
NPL Non-Performing Loan
NRPS National Retail Payment System
NSFI National Strategy for Financial Inclusion
iv
OF Overseas Filipinos
OPG Operational Performance Goals
OSBP Online Submission of Budget Proposal
OSBPS Online Submission of Budget Proposal System
OSBR Online Submission of Budgetary Reports
OWWA Overseas Workers Welfare Administration
PBOC People’s Bank of China
PDIC Philippine Deposit Insurance Corporation
PED Performance Evaluation Directors
PES Performance Evaluation System
PEZA Philippine Economic Zone Authority
PGF Pension and Gratuity Fund
PHIC Philippine Health Insurance Corporation
PNOC Philippine National Oil Company
PNR Philippine National Railways
POS Point-of-Sales
PPA Philippine Ports Authority
PPP Public-Private Partnership
PSALM Power Sector Assets and Liabilities Management Corporation
PVS Philippines Valuation Standards
QABs Qualified ASEAN Banks
RATE Run After Tax Evaders
RATS Run After the Smugglers
ROA Return on Asset
ROE Return on Equity
RPT Real Property Tax
RRP Reverse Repurchase
SC Supreme Court
SDA Special Deposit Accounts
SER Socioeconomic Reports
SFDRR Sendai Framework for Disaster Risk Reduction
SMV Schedule of Market Values
v
SRE Statement of Receipts and Expenditures
SSIs Social Security Institutions
TCVC Tax Compliance Verification Code
TIMTA Tax Incentive Management and Transparency Act
TransCo National Transmission Corporation
TRO Temporary Restraining Order
TSA Treasury Single Account
UACS Unified Accounts Code Structure
U/KB Universal and Commercial Bank
VRA Valuation Reform Act
2TBA Two-Tier Budgeting Approach
vi
List of Tables
Table 1. Philippines: Macroeconomic Performance for 2013-2015 and NG Budget
Assumptions for 2016
Table 2. Philippines: Revenue Program, 2014-2017
Table 3. Philippines: RATE Program as of 30 June 2016
Table 4. Philippines: Status of RATS Cases
Table 5. Philippines: Budget Sensitivity to Macroeconomic Parameters, 2016 and 2017
Table 6. Philippines: Foregone Revenues from Different Tax Measures and Practices
Table 7. Philippines: Differences Between Target and Outturn of Expenditures, 2011-
2015
Table 8. Philippines: Expenditure Program, Selected Departments, 2016-2017
Table 9. Philippines: National Government Debt Indicators, 2011- June 2016
Table 10. Philippines: Sensitivity of Debt Service Flows to Market Shocks
Table 11. Philippines: Consolidated Public Sector Financial Position, 2013 -2017
Table 12. Philippines: Liabilities of the Government Corporate Sector and 14 Major Non-
Financial Government Corporations (MNFGCs), 2014
Table 13. Philippines: Outstanding Government Guaranteed Debt to GOCCs,
2014-2015
Table 14. Philippines: Outstanding NG Advances to GOCCs, 2013-2015
Table 15. Philippines: Net Budgetary Flows to GOCCs, 2013-2015
Table 16. Philippines: List of Awarded Projects
Table 17. Philippines: Local Government Units: Ratio of LSR to GDP
Table 18. Philippines: LGUs Debt Data, FY 2009-FY2015
Table 19. Philippines: Impact of Disasters on the Economy, 2015
vii
List of Figures
Figure 1. Sustainability Analysis of Nominal Debt to GDP
Figure 2. Sustainability Analysis of Gross Financing Need to GDP
Figure 3. Gross Nominal Public Debt
Figure 4. Evolution of Debt-to-GDP Ratio
Figure 5. Dependence in Locally-Sourced Income
Figure 6. Dependence in IRA

viii
ix
Table of Contents
I. Introduction……………………………………………………….……………...1
II. Macroeconomic Assumptions/Performance………………………..………..….2
A. Macroeconomic Assumptions and Performance…………………………..……2
B. Macroeconomic Risks……………………………………………………..……5
III. Fiscal Performance ………………………………………………….…….…..…7
A. Revenue Performance……………………………………..…………..…….…7
B. Expenditure Performance...…………………………………………... ……..13
IV. Public Debt…………………….……………………………………….………..19
V. Monetary Performance …………...……………………………………………24
VI. Financial Sector ………………………….……………………………………..26
VII. Other Contingent Central Government Obligations …...…………………….37
A. Government-Owned and -Controlled Corporations…………………...………37
B. Public-Private Partnerships and other Contingent Liabilities…………………42
C. Local Government Units……………………………………………………....45
D. Natural Disasters …………………………………………….……………….52

x

1
I. INTRODUCTION
A. The 2017 Fiscal Risks Statement underscores the continued efforts of the
National Government in strengthening its fiscal resilience against various
shocks. On the revenue side, the NG remains committed to raise tax effort of the
revenue generation agencies by means of continued implementation of the various
tax administration reforms that the government started back in 2010. Despite the
adjustment in deficit-to-GDP target to 3% from 2% in the previous administration,
the NG debt continued to exhibit sustainability as demonstrated by declining debt-
to-GDP ratio owing to the government’s prudent debt management and strong
economic growth. Meanwhile, interest payment as a proportion of expenditures
continues to decline providing the government ample fiscal space for more
productive spending such as infrastructure and social services.
B. The current administration has promised to deliver better and more effective
public services to the Filipino people. This will be achieved by addressing the
gaps in infrastructure, social services, peace and order, and national security. The
DBM will also address risk of underspending in order to accelerate government
spending via sustaining the policies on “early procurement, short of” award and the
GAA-as-a-Release document. Further, the new administration is introducing a 24/7
operation and monitoring policy to fast track the implementation of projects.
C. Meanwhile, Philippine banking system registered strong financial condition
with sustained asset quality, improved profitability and strong capitalization.
The BSP actively pursues regulatory initiatives to mitigate systemic risk through
broad-based regulatory reforms, cross-sectoral cooperative arrangements and
advocacies toward promoting financial inclusion, consumer education and
protection.
D. The NG also continued to reinforce its risk mitigating measures in managing
the contingent liabilities arising from Public Private Partnerships (PPPs)
projects. The Technical Working Group on Contingent Liabilities is consistently
monitoring the PPP projects while improving the valuation of contingent liability
stock and flows. With respect to NG guarantees to Government-Owned and –
Controlled Corporations (GOCCs), the NG also developed and adopted a risk-based
methodology for the computation of guarantee and foreign exchange risk cover
fees. Further, the NG continued to provision a Risk Management Program in the
national budget amounting to P30 billion for potential claims made against existing
PPP projects.
E. The country’s vulnerability to natural disasters continued to pose risk to fiscal
sustainability. Hence, the government has fortified its reforms, mitigating
measures and policy directions on disaster risk and reduction management.
Meanwhile, the NG needs to allocate funds not only for post-calamity, but more
importantly for the preparation and mitigation of the impacts of these natural
calamities.

2
II. MACROECONOMIC ASSUMPTIONS/PERFORMANCE
A. ASSUMPTIONS AND PERFORMANCE
1. The first and second quarters of 2016 registered a growth of 6.8 percent and
7.0 percent, respectively, which brings the first semester real GDP growth to
6.9 percent. The strong growth recorded in the first two quarters in 2016 raises the
probability of attaining the full-year 2016 BESF real GDP growth assumption.
Given the revised DBCC-approved real GDP growth projection of 6.0 to 7.0 percent
for FY 2016, a second semester GDP growth of 5.1 percent is needed to attain at
least the low-end of the growth target.
On the expenditure side, domestic demand provided most support to the economic
growth which made up for the sluggishness of external demand. On the production
side, the services sector registered faster growth, while the decline in agriculture
moderated. Meanwhile, industry growth remained robust despite the slowdown.
Table 1. Philippines: Macroeconomic Performance for 2013-2015 and NG Budget
Assumptions for 2016a/
(in percentage point, unless otherwise specified)
Particulars 2013 2014 2015 2016
BESF Actual BESF Actual BESF Actual BESF Actual
Real GDP growth 6.0-7.0 7.1 6.5-7.5 6.1 7.0-8.0 5.9 7.0-
8.0
6.9
Inflation 3.0-5.0 3.0 3.0-5.0 4.1 2.0-4.0 1.4 2.0-
4.0 1.3
364-day T-bill rate b/
3.0-5.0 0.7 2.0-4.0 1.8 2.0-4.0 2.1 2.0-
4.0 1.8
6-month LIBOR 0.5-1.5 0.4 0.5-1.5 0.3 1.0-2.0 0.5 1.0-
2.0 0.9
Exchange rate
(₱/US$1)
42.00-
45.00 42.45
41.00-
43.00 44.40
42.00-
45.00 45.50
43.00-
46.00 46.90
Dubai crude oil
price (US$/barrel)
90.00-
110.00 105.52
90.00-
110.00 96.61
90.00-
110.00 50.92
55.00-
75.00 36.80
Merchandise
exports growth c/ 12.0 -3.6 14.0 7.3 8.0 -13.1 6.0 -5.2
Merchandise
imports growth c/ 14.0 -3.1 14.0 2.3 10.0 -3.2 12.0 18.3
Sources: NEDA, PSA, BTr, and BSP
a/ Macroeconomic assumptions adopted by the Development Budget Coordination Committee (DBCC), as published in the
annual Budget of Expenditures and Sources of Financing (BESF) that the Executive branch submitted to the Congress for the
preparation of the General Appropriations Act (GAA)
b/ Based on average primary market rates
c/ Based on the Balance of Payments and International Investment Position Manual, 6th Edition (BPM6) concept

3
2. In 2015, the economy posted a respectable real GDP growth of 5.9 percent
despite the difficult external environment, the negative impacts of the El Nino
phenomenon to agriculture as well as the challenges in government spending
in the first semester. Coming from a slow growth of 5.5 percent in the first half of
2015, GDP growth accelerated to 6.3 percent in the second half, partly due to faster
government spending. While the FY GDP growth was below the official growth
target of 7.0-8.0 percent, the Philippines remains to be one of the best economic
performers in the region behind India (7.5%), PR China (6.9%), and Vietnam
(6.7%).
On the demand side, growth was mainly driven by the strong domestic demand,
supported by household and government consumption (6.3% and 7.8%,
respectively) and gross capital formation (15.1%), which more than double from
the 5.2 percent growth registered in 2014. The gains in capital formation can be
traced from the increased public construction (19.0 %) from a contraction of 1.4
percent in 2014. On the supply side, growth is supported mainly by the services
sector (which registered a growth of 6.8% in 2015 from 6.2% in 2014). This is
followed by industry (6.0%), which was partly affected by the slowdown in
manufacturing due to weak external demand. Agriculture output growth, on the
other hand, remains subdued with a 0.1 percent growth in 2015 following the
negative impacts brought by the El Nino phenomenon.
3. Average inflation for 2015 settled below the government target. Headline
inflation averaged 1.4 percent in 2015, below the government target of 3.0 percent
±1.0 percentage point for the year, from 4.1 percent in the previous year.1 The lower
inflation in 2015 was attributed mainly to adequate domestic supply of key food
items along with the sustained decline in petroleum prices as international crude oil
prices continued to fall.
Moreover, inflation decelerated further from January to June 2016 to average at
1.3 percent. The relatively benign inflation environment was attributed largely to
lower domestic petroleum prices, downward adjustment in electricity rates, and the
provisional rollback in jeepney fares. The risk of a deflation over the policy horizon
is minimal as prospects for domestic demand remain firm and wages are generally
rigid downward given the approval process for wage adjustment petitions.
4. Market anticipation of the US federal funds rate lift-off in 2015 contributed to
a slightly higher domestic and foreign interest rates for the year relative to the
previous year. The 364-day Treasury bill rate averaged 2.1 percent in 2015 in the
primary market, within the 2.0 – 4.0 percent Budget of Expenditures and Sources
of Financing (BESF) assumption for the year and greater than the 1.8-percent
average in 2014. Subsequently, the lower one-year Treasury bill rate in the first six
auctions of 2016 at 1.79 percent average offered by the Bureau of the Treasury
reflected strong demand for short-term government securities.
1 An Open Letter to the President was published on 28 January 2016 explaining the factors behind the deviation of inflation from the target for 2015. This is in accordance with the accountability and transparency procedure under the BSP Inflation Targeting framework. Available online at www.bsp.gov.ph/monetary/open_2015.asp.

4
The 180-day average LIBOR rose to 0.5 percent in 2015 from the 0.3-percent
average in 2014, but fell below the BESF assumption of 1.0 – 2.0 percent for 2015.
The slightly higher 6-month LIBOR in 2015 and in the first half of 2016 (0.9
percent) reflects potential higher path of global interest rates due to the expected
policy normalization by the US Federal Reserve.
5. The peso weakened against the US dollar in 2015 amid uncertainties over the
timing and potential impact of federal funds rate lift-off in the US as well as
concerns over China’s economic slowdown. The US dollar strengthened as the
recovery of the US economy gained traction and the market anticipated the start of
federal funds rate hikes in 2015. In addition, the fall in Chinese equity and the
devaluation of Chinese yuan posed depreciation pressures on the peso. The peso-
dollar exchange rate averaged ₱45.50/US$1 in 2015, slightly weaker than the
₱42.00 – 45.00/US$1 BESF assumption for the year and the 2014 average of
₱44.40/US$1. Meanwhile, the peso continued to weaken in January to June 2016
with average at ₱46.90/US$1, weaker than the ₱43.00 – 46.00/US$1 BESF
assumption for the year, given expectations of possible slower pace in US monetary
policy tightening.
6. The per barrel price of Dubai crude oil continued to slide in 2015 and early
2016, influenced mainly by persistent abundance of global oil inventories,
concerns over the slowdown in emerging markets, particularly China, and the
re-entry of Iranian crude oil exports2. In 2015, Dubai crude oil prices plunged to
US$50.92 per barrel, below the BESF assumption for the year of US$90 – 110 per
barrel and significantly lower relative to the 2014 average of US$96.61 per barrel.
Crude oil price continued to slide at the start of 2016 dropping to as low as
US$22.80 per barrel on 21 January 2016 but has since recovered, trading above
US$45.00 per barrel in June 2016.3 Consequently, the YTD average Dubai crude
oil price as of 30 June 2016 remained low at US$36.80 per barrel. The decline in
oil prices was due mainly to the continued abundance of global oil inventories and
the re-entry of Iranian crude oil exports amid sluggish demand, given concerns over
the slowdown in emerging markets, particularly China. Meanwhile, the recent
upward trend in crude oil prices was attributed mainly to prospects of pickup in
global oil consumption, slowdown in crude oil production, and increase in oil
supply outages (e.g., in Canada due to wildfire4 and in Nigeria due to unrest
affecting oil and gas infrastructure in the Niger Delta). 5
2 On 16 January 2016, the European Council lifted all nuclear-related economic and financial EU sanctions against Iran. This follows verification by the International Atomic Energy Agency (IAEA) on 16 January 2016 that Iran has implemented the agreed nuclear-related measures as set out in the Joint Comprehensive Plan of Action (JCPOA). Source: European Council. Iran has successfully delivered around 1 million barrel of crude oil exports to Europe on 6 March 2016, the first since the oil sanction was imposed in 2012. The National Iranian Oil Company (NIOC) is expected to deliver about 0.3 million barrels per day to Europe in March 2016 after it has finalized a contract with France’s Total and Spanish refiner, Cepsa. Source: Bloomberg and Reuters. 3 Dubai crude oil price averaged US$46.26/bbl on 1-30 June 2016, almost double the January 2016 average of US$26.81/bbl. 4 EIA expects Canadian production in Q2 2016 to fall by an average of 0.5 million b/d from Q1 2016 levels, before returning to Q1 levels in Q3 2016. Source: Short-Term Energy Outlook May 2016, available online at www.eia.gov. 5 EIA, Short-Term Energy Outlook, April and May 2016 reports, available online at www.eia.gov.
5
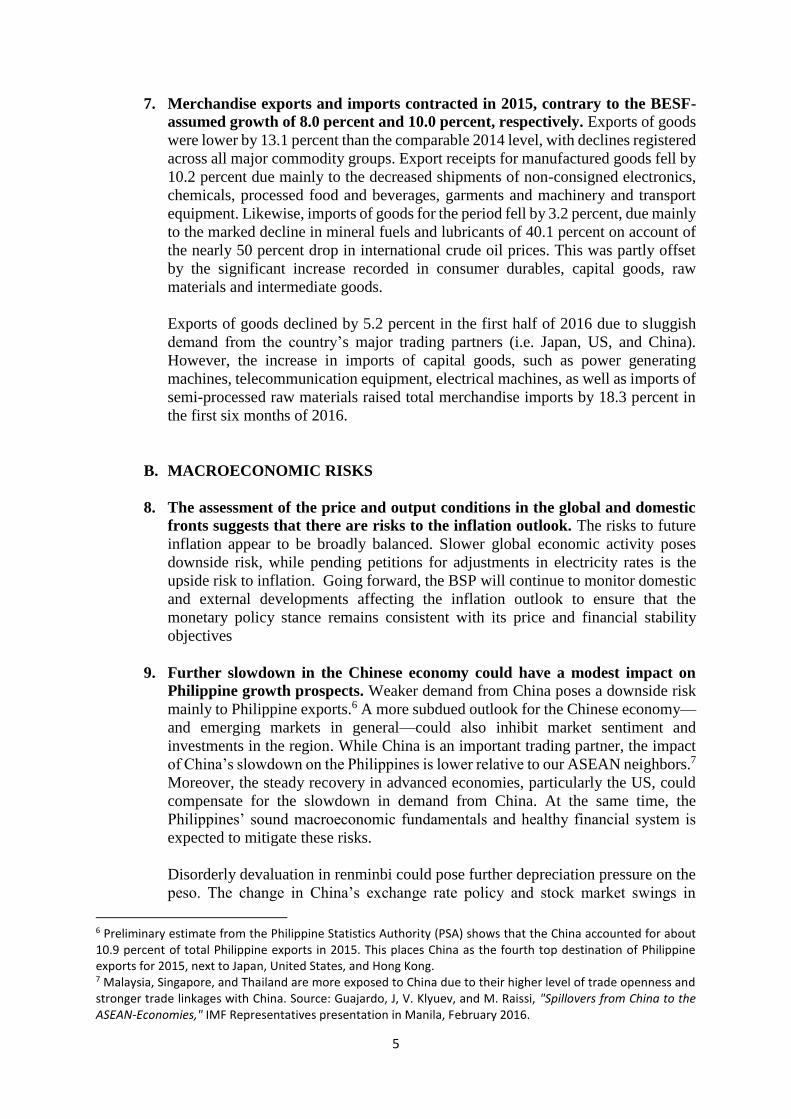
7. Merchandise exports and imports contracted in 2015, contrary to the BESF-
assumed growth of 8.0 percent and 10.0 percent, respectively. Exports of goods
were lower by 13.1 percent than the comparable 2014 level, with declines registered
across all major commodity groups. Export receipts for manufactured goods fell by
10.2 percent due mainly to the decreased shipments of non-consigned electronics,
chemicals, processed food and beverages, garments and machinery and transport
equipment. Likewise, imports of goods for the period fell by 3.2 percent, due mainly
to the marked decline in mineral fuels and lubricants of 40.1 percent on account of
the nearly 50 percent drop in international crude oil prices. This was partly offset
by the significant increase recorded in consumer durables, capital goods, raw
materials and intermediate goods.
Exports of goods declined by 5.2 percent in the first half of 2016 due to sluggish
demand from the country’s major trading partners (i.e. Japan, US, and China).
However, the increase in imports of capital goods, such as power generating
machines, telecommunication equipment, electrical machines, as well as imports of
semi-processed raw materials raised total merchandise imports by 18.3 percent in
the first six months of 2016.
B. MACROECONOMIC RISKS
8. The assessment of the price and output conditions in the global and domestic
fronts suggests that there are risks to the inflation outlook. The risks to future
inflation appear to be broadly balanced. Slower global economic activity poses
downside risk, while pending petitions for adjustments in electricity rates is the
upside risk to inflation. Going forward, the BSP will continue to monitor domestic
and external developments affecting the inflation outlook to ensure that the
monetary policy stance remains consistent with its price and financial stability
objectives
9. Further slowdown in the Chinese economy could have a modest impact on
Philippine growth prospects. Weaker demand from China poses a downside risk
mainly to Philippine exports.6 A more subdued outlook for the Chinese economy—
and emerging markets in general—could also inhibit market sentiment and
investments in the region. While China is an important trading partner, the impact
of China’s slowdown on the Philippines is lower relative to our ASEAN neighbors.7
Moreover, the steady recovery in advanced economies, particularly the US, could
compensate for the slowdown in demand from China. At the same time, the
Philippines’ sound macroeconomic fundamentals and healthy financial system is
expected to mitigate these risks.
Disorderly devaluation in renminbi could pose further depreciation pressure on the
peso. The change in China’s exchange rate policy and stock market swings in
6 Preliminary estimate from the Philippine Statistics Authority (PSA) shows that the China accounted for about 10.9 percent of total Philippine exports in 2015. This places China as the fourth top destination of Philippine exports for 2015, next to Japan, United States, and Hong Kong. 7 Malaysia, Singapore, and Thailand are more exposed to China due to their higher level of trade openness and stronger trade linkages with China. Source: Guajardo, J, V. Klyuev, and M. Raissi, "Spillovers from China to the ASEAN-Economies," IMF Representatives presentation in Manila, February 2016.

6
August 2015 have contributed to the weakening of the peso against US dollar in H2
2015. Looking ahead, market concerns over China’s continued slowdown and
future trends in Chinese yuan would continue to influence currency markets.
Further devaluation in Chinese yuan could heighten global risk aversion and
exacerbate portfolio outflows from emerging markets, consequently, weakening
further the peso.
However, Governor Zhou Xiaochuan of the People’s Bank of China (PBOC)
underscored that China’s economic growth remains relatively resilient amid the
fragile global economic environment and financial market turmoil. In addition, he
stressed that the PBOC has no motivation to allow a depreciation in Chinese yuan
to stimulate exports and domestic growth given that net exports performed well in
2015.8 Moreover, differentiation among emerging market currencies is expected to
continue even during periods of adjustments and market stress. The peso is expected
to draw its support from the country’s firm macroeconomic fundamentals along
with sustained foreign exchange flows from overseas Filipino (OF) remittances,
business process outsourcing (BPO) earnings, and tourist receipts. The country’s
robust external position with the international reserves reaching US$83.97 billion
as of end-June 2016 also provides the Philippines additional buffer in times of
financial market stress.
10. The timing and pace of policy normalization in the US could influence trends
in the peso-dollar exchange rate. The US Federal Reserve raised the target federal
funds rate in December 2015 to 0.25 – 0.50 percent from the historic low of 0 –
0.25 percent. Subsequent interest rate hikes by the US Federal Reserve could trigger
further portfolio rebalancing, resulting in tighter financial market conditions as well
as exchange rate pressures in emerging markets, including the Philippines.
However, the lingering weaknesses in global economy and financial conditions as
well as the significant decline in the path of the federal funds rate futures from
December 2015 to June 2016 point to a potential delay in the US Federal Reserve’s
tightening cycle. This view is further reinforced by the latest decision of the US
Federal Reserve to keep the federal funds target rate at 0.25 – 0.50 percent during
its June 2016 meeting. Moreover, more dovish stance was reflected in the Federal
Open Market Committee members’ lower median federal funds rate forecast for
2016 to 2018 compared to the forecasts in the December 2015 meeting.
Subsequent interest rate hikes by the US Federal Reserve could likewise contribute
to higher domestic and foreign interest rates in 2016 and 2017. Meanwhile, further
monetary easing by the European Central Bank and the Bank of Japan along with
additional accommodation by PBOC could help calm markets and thus, support
external liquidity conditions as the US Federal Reserve continues its gradual policy
normalization.
8 Transcript of Governor Zhou Xiaochuan’s Exclusive Interview with Caixin Weekly. Source: The People’s Bank of China.

7
11. The considerable and protracted decline in international prices of
commodities, such as mineral and agro-based products, continues to pose
downside risks to the country’s exports earnings. Both weak commodity prices
and slowdown in external demand influenced the country’s trade performance in
2015.9 With softer growth prospects for emerging market economies and continued
favorable supply conditions, the decline in all major commodity price indices is
likely to continue.10 In particular, global metals prices are seen to fall in 2016 due
to slower demand in China and the increase in supplies from earlier investments.
III. FISCAL PERFORMANCE
A. REVENUE PERFORMANCE
12. The National Government (NG) recorded a P121.7 billion budget deficit for
2015, 66.5 percent higher than the deficit in 2014. The deficit was at 0.9 percent
of GDP, lower than the 2.0 percent program but 0.3 percent higher than the 0.6
percent recorded in 2014. Total 2015 revenue collections stood at P2,109.0 billion,
which demonstrated an increase of 10.5 percent over 2014 collections resulting in
a 0.8 percentage point improvement in the revenue effort. The transfer of coco levy
funds amounting to P62.5 billion to the Special Account under the General Fund,
inclusive of earnings therefrom contributed to the growth. Expenditures amounted
to P2,230.6 billion for the year to reflect a 12.6 percent year-on-year expansion.
13. From January to December 2015 tax revenues which accounted for 86.1% of
total revenues, reached PHP1,815.5 billion, 5.6% or PHP96.5 billion higher
than tax revenues in 2014. Collections from the Bureau of Internal Revenue
(BIR) net of tax refund amounting to P8.3 billion improved by 7.4 percent to
P1,433.3 billion. Incremental collections from the sin tax law contributed a total of
P73.1 billion or 0.6% of GDP. BIR Tax effort increased to 10.8% in 2015 from
10.6% in 2014.
On the other hand, the Bureau of Customs (BOC) collected P367.5 billion which is
0.5% percent lower from the previous year. BOC collection was adversely affected
by the drop in the price of crude and petroleum products despite the increase in the
volume of oil imports.
14. Meanwhile, non-tax revenues which accounted for 10.9% of total revenues
reached PHP230.7B or 23% or PHP43.1B higher than 2014. Non-tax revenues
include the Income from Treasury Operations, National Government (NG) income
collected by the Bureau of the Treasury (BTR) such as GOCC dividends and other
statutory obligations of the GOCCs, fees and charges collected by NG agencies.
BTR income from its Treasury operations and collections in behalf of the NG
amounted to P110.0 billion, exceeding 2014 by P16.6B or by 17.8 percent. This
was mainly due to higher collections of dividends on shares of stocks which
9 Based on preliminary estimates from the PSA for 2015, the fall in global commodity prices associated with the slowdown in global demand resulted in a more pronounced negative trade balance of US$8.0 billion than the year-end balances in the past two years of negative US$5.7 billion in 2013 and negative US$3.3 billion in 2014. 10 World Bank Commodity Markets Outlook, April 2016

8
increased to P32.3 billion from P24.4B in 2014, and higher income from
investments.
15. Lastly, revenues from privatization increased to P62.8B. This represents transfer
of the Coco Levy Funds inclusive of earnings therefrom, to the Special Account
under the General Fund pursuant to Executive Order 180.
REVENUE PROGRAM
16. The emerging risks to growth have implications on fiscal outturns and in the
medium term revenue program. These will require higher tax administrative
efficiency in order to offset potential negative impact on the revenue performance.
The 2016 BESF revenue program carries with it a high aspiration on administrative
efficiency. While there are ongoing reforms to boost tax administrative efficiency,
remarkable gains from these reforms will not be immediate. As we recognize this
limitation and the impact of the emerging external risks such as the drop in oil
prices, the 2017 revenue targets were set on more realistic grounds. Accordingly,
as a result of these limitations, revenue outlook for 2016 is expected to be 83.7% of
the 2016 BESF target. The revenue target for 2017, will still allow us to finance
higher social and infrastructure spending without compromising our fiscal
sustainability, despite the emerging risks and a more realistic level of current
administrative efficiency.
Table 2. Philippines Revenue Program, 2014-2017 2014
Jan-Dec % Growth
Actual Program Actual Program Outlook BESF
Total Revenues 1,908.5 2,275.2 2,109.0 10.5% 2,696.8 2,256.7 2,481.5
Tax Revenues 1,719.0 2,127.7 1,815.5 5.6% 2,543.3 2,044.0 2,313.0
BIR 1,334.8 1,673.9 1,433.3** 7.4% 2,025.7 1,620.0 1,829.3
BOC 369.3 436.6 367.5 -0.5% 498.7 409.0 467.9
Other Offices 14.9 17.1 14.6 -2.1% 19.0 15.0 15.9
Non-Tax Revenues 187.6 145.6 230.7 23.0% 151.4 210.7 166.5
Fees and Charges 32.8 36.4 36.4 11.1% 40.0 40.0 44.0
Bureau of Treasury 93.4 60.7 110.0 17.8% 58.3 90.0 58.6
Other Existing Non- Tax 61.1 48.6 84.1 37.5% 53.2 80.7 64.0
Grants 0.2 0.0 0.2 -29.5% 0.0 0.0 0.0
Privatization 1.9 2.0 62.8 3126.3% 2.0 2.0 2.0
Expenditures 1,981.6 2,558.9 2,230.6 12.6% 2,992.9 2,645.6 2,959.7
Surplus/(Deficit) -73.1 -283.7 -121.7 -66.5% -296.2 -388.9 -478.1
(In Billion Pesos)
2015
Jan-Dec2016 2017
Source: Medium Term Revenue Program
**Note: BIR FY2015 Collection is Net of tax refund – P8.3 billion.

9
REFORMS IN REVENUE STRUCTURE AND ADMINISTRATION
17. Tax Administration Reforms stayed on track. The continued implementation of
the various tax administration reforms that the government initiated back in 2010
indicate that the NG is committed to raise the tax efforts of the revenue generation
agencies. With the creation of the Fiscal Incentive Unit (FIU) and the Revenue
Integrity Protection Service (RIPS) within the DOF, we are confident that the
government will continue with its drive to protect revenue integrity, uproot
corruption within the government, and eliminate tax evasion and smuggling.
18. The BIR is expected to continue its revenue-raising activities to achieve higher
tax effort. In addition, the BIR, together with the DOF continues to identify and
takes legal action against tax evaders, as well as conducts campaigns to discourage
tax evasion through its Run After Tax Evaders (RATE) Program. Since the launch
of the Program in 2005, the BIR has filed a total of six hundred twenty (620) cases
as of June 30, 2016.
However, the various temporary restraining orders (TROs) issued by the Supreme
Court (SC) prevent the BIR from implementing several issuances and transparency
measures restraining the government from properly assessing tax payments of
professionals and employers.

10
Table 3. Philippines: RATE Program as of 30 June 2016
A. Under the Aquino Administration (July 2010-June 2016)
DOJ
Cases recently filed 26
Cases for and/or pending preliminary investigation 127
Cases submitted for resolution
Cases pending before Prosecutor 214
Cases pending before Prosecutor with MR 28
Cases pending before DOJ Sec 6
Cases pending before DOJ Sec with MR -
Cases resolved in favor of the BIR 13
COURTS
Cases pending before the Supreme Court -
Cases pending before the Court of Appeals 1
Cases pending before the CTA 60
Cases pending before the Regular Courts 20
DECIDED
Cases remanded to BIR -
Cases dismissed by the DOJ with finality 2
Cases dismissed by the SC with finality 1
Cases dismissed by the CTA and regular Courts 3
Total Cases 492
Total Estimated Liabilities P84.46 B
B. Under GMA (2005-June 2010) - Total Cases 128
TOTAL CASES 620
Status of the RATE Program
as of 30 June 2016
19. Aside from the RATE Program, the Bureau implemented various programs
and initiatives which contributed to the improved collection performance of
the BIR. These include Oplan Kandado, Internal Revenue Stamps Integrated
System (RSIS) for Alcohol Products (Distilled Spirits) whose primary objective is
to ensure collection of correct excise taxes on alcohol products. Revenues generated
in 2015 amounted to P136.9B.
20. The BOC aggressively pursued existing reforms and implemented additional
measures to improve collection efficiency and plug leakages. The Run After the
Smugglers (RATS) Program carries out continuous monitoring and action against
smuggling. Since the launch of the Program in 2005, there were two hundred fifty
three (253) RATS cases filed by the BOC as of June 30, 2016.
Aside from RATS, BOC implemented various services and projects in the pipeline
such as the BOC Cares, the Bureau's Call Center unit, Customs ng Bayan Helpdesk,
and tied up with private courier and the Sugar Regulatory Authority to curb
smuggling, among others.
11
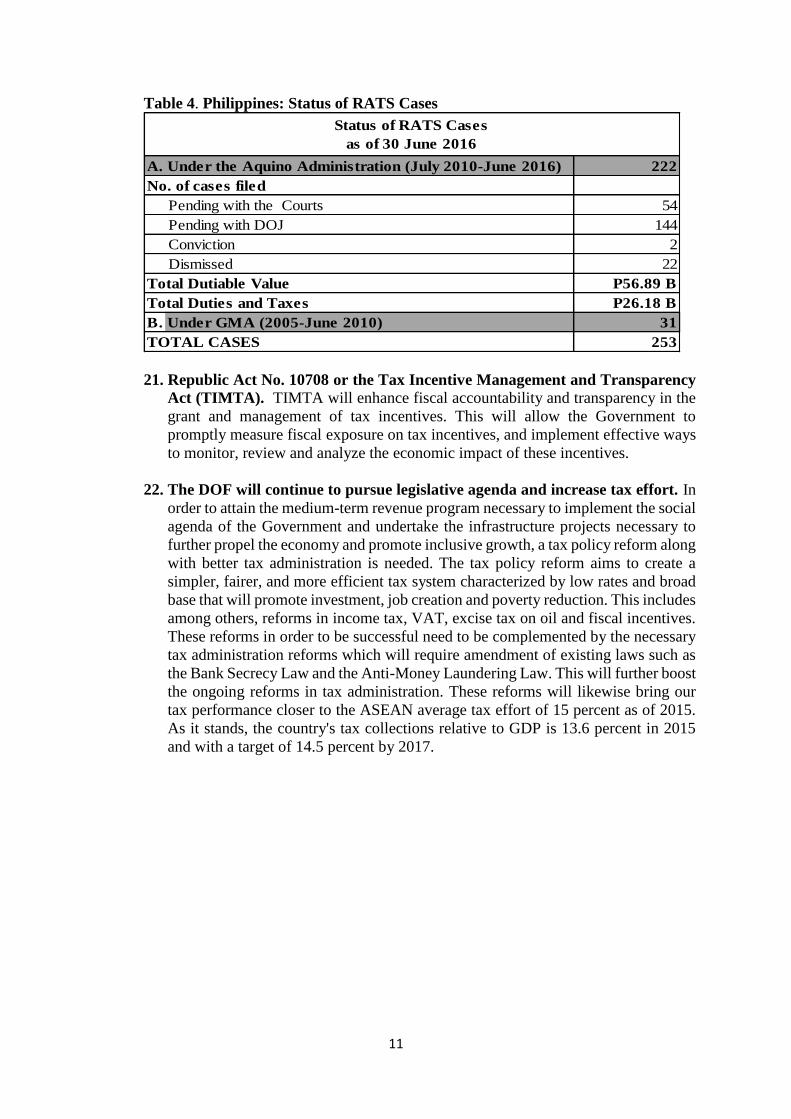
Table 4. Philippines: Status of RATS Cases
A. Under the Aquino Administration (July 2010-June 2016) 222
Pending with the Courts 54
Pending with DOJ 144
Conviction 2
Dismissed 22
P56.89 B
P26.18 B
B. Under GMA (2005-June 2010) 31
253
Status of RATS Cases
as of 30 June 2016
TOTAL CASES
No. of cases filed
Total Dutiable Value
Total Duties and Taxes
21. Republic Act No. 10708 or the Tax Incentive Management and Transparency
Act (TIMTA). TIMTA will enhance fiscal accountability and transparency in the
grant and management of tax incentives. This will allow the Government to
promptly measure fiscal exposure on tax incentives, and implement effective ways
to monitor, review and analyze the economic impact of these incentives.
22. The DOF will continue to pursue legislative agenda and increase tax effort. In
order to attain the medium-term revenue program necessary to implement the social
agenda of the Government and undertake the infrastructure projects necessary to
further propel the economy and promote inclusive growth, a tax policy reform along
with better tax administration is needed. The tax policy reform aims to create a
simpler, fairer, and more efficient tax system characterized by low rates and broad
base that will promote investment, job creation and poverty reduction. This includes
among others, reforms in income tax, VAT, excise tax on oil and fiscal incentives.
These reforms in order to be successful need to be complemented by the necessary
tax administration reforms which will require amendment of existing laws such as
the Bank Secrecy Law and the Anti-Money Laundering Law. This will further boost
the ongoing reforms in tax administration. These reforms will likewise bring our
tax performance closer to the ASEAN average tax effort of 15 percent as of 2015.
As it stands, the country's tax collections relative to GDP is 13.6 percent in 2015
and with a target of 14.5 percent by 2017.

12
Sources of Fiscal Risks
23. The accuracy of the macroeconomic assumptions used in setting the fiscal
targets and projections have implications on the fiscal outturns. Significant
deviation from said assumptions (See Table 1) will impact both the revenue and
expenditure and the fiscal balance as indicated in Table 5.
Table 5. Philippines: Budget Sensitivity to Macroeconomic Parameters, 2016 and 2017
(in billion pesos)
Indicator Change Revenues Disbursements Budget
Balance1/ 2016 2017 2016 2017 2016 2017
Peso-to-US Dollar Exchange
Rate P1.00 depreciation 10.5 9.2 2.1 2.0 8.4 7.2
Treasury Bill Rate (all
maturities) 1 percentage point increase 0.6 0.5 3.2 3.2 (2.6) (2.7)
LIBOR (180-day) 1 percentage point increase 4.2 4.6 (4.2) (4.6)
Inflation Rate 1 percentage point increase 20.8 18.4 20.8 18.4
Real GDP Growth Rate 1 percentage point increase 21.6 19.3 21.6 19.3
Growth Rate of Imports 1 percentage point increase 4.3 3.7 4.3 3.7
Source: Department of Finance and Bureau of the Treasury
1/A negative figure in the budget balance means an increase in deficit
24. Legislative measures with tax exemption and funding provisions proposed
under the 16th Congress have a negative impact on the revenues and budget
of the National Government. If refiled and passed under the 17th Congress
without compensating revenue measures, the estimated revenue losses and
budgetary requirements of P392.53 billion to P435.77 billion is equivalent to 2.70
to 3.00 percent of GDP, posing a risk to the present economic momentum and fiscal
stability.
Table 6. Philippines: Foregone Revenues from Different Tax Measures
Particulars Amount (as percent of GDP)
Total Estimated Foregone Revenue P48.4 B – P60.2 B 0.33 - 0.42
Total Estimated Additional Budgetary
RequirementP344.12 B – 375.34 B 2.37 - 2.58
TOTALP392.53 B - P435.77
B2.70 - 3.00
Source: Research and Information Office, Domestic Finance Group, DOF a) Based on signed DOF position papers on tax proposals in the 16th Congress.
b) Impact/requirement of groups of proposals with similar intent but varying provisions are reflected
by putting a low estimate on proposal with the most minimal revenue eroding provisions/ budgetary
requirement while putting higher estimate on those with the most revenue eroding provisions or
those that require largest budgetary support.
c) Total estimated additional budgetary requirement includesP150 billion capital infusion to BSP
under the bill proposing the amendment of BSP Charter. d) The GDP figure is based on the low end 2016 nominal GDP Medium Term macroeconomic
assumptions of the DBCC as of July 21, 2016.

13
25. Ballooning uniformed personnel pension cost. The problem, which continues to
be a source of fiscal risk, is mainly attributable to the features present in all existing
retirement laws of the uniformed services - a) pension entitlement of a retiree is
automatically adjusted based on the prevailing scale of base pay for similarly ranked
active personnel; b) pension is non-contributory in nature hence budget comes from
the annual general appropriations of the government; and c) early entitlement to
pension benefits even before attaining the compulsory retirement age of fifty-six
(56).
For 2016, the pension budget amounts to P71.0 billion which is projected to reach
more than double in eight years at P187.9 billion. In view of the foregoing, a reform
must be effected for a more sustainable pension system.
The Technical Working Group composed of DND, DBM, DOF, DILG and GSIS
recommended the creation of a seed fund necessary for the purpose of generating
sufficient interest income to fund the annual pension requirements of all uniformed
services. According to the latest actuarial study conducted by GSIS, if no reforms
are introduced to the existing pension system, the seed fund shall require an amount
equivalent to P5.57178 trillion. However, if reforms are implemented, specifically
the deletion of the automatic indexation feature, the formulation of a mandatory
contribution and the designation of a minimum pensionable age- then the amount
required for the seed fund is significantly lowered to P2.03588 trillion.
B. EXPENDITURE PERFORMANCE
26. The actual National Government spending for 2015 amounted to P2,230.6
billion, an increase of P249 billion or 12.6 percent from the P1,981.6 billion
disbursed in 2014. This is the fastest year-on-year growth in the last three years,
rebounding from the mere 5.8 percent and 5.4 percent increase in 2013 and 2014,
respectively. Disbursements picked up as a result of higher maintenance and
personnel services expenditures, and huge capital spending to account for almost
P225.0 billion or 90.3 percent of the P249.0 billion additional outlays for the year.
Disbursements for maintenance and other operating expenditures expanded by
nearly P95.0 billion or 30.7 percent to reach P403.4 billion due to the government’s
implementation of social services such as CCT and shelter and cash assistance to
victims of disasters or calamities of the DSWD; immunization programs and
provision of drugs and medicines of the DOH; basic education and scholarship
programs of the DepEd; and Bottom-Up Budgeting programs and other community
development projects of the DILG. Maintenance spending also include the expenses
of the COMELEC for the preparatory works for the conduct of the 2016 National
and Local Elections, as well as the requirements for the hosting of the APEC 2015
Summit held in November.
Infrastructure and other capital outlays, on the other hand, accelerated by some
P69.3 billion or 25.1 percent closing in to P345.3 billion for the year. This is a
significant improvement from the minimal 5.4 percent growth in 2014 as a number
of infrastructure projects have been rolled out and completed including repair,
rehabilitation and upgrading of road networks of the DPWH; repair and

14
rehabilitation of LRT Lines 1 and 2 of the DOTC; and aircraft acquisition under the
AFP Modernization Program of the DND.
Meanwhile, personnel services expenditures grew by P60.8 billion or 10.1 percent
from 2015 largely due to the grant of one-time Performance Enhancement Incentive
(PEI) in June 2015. The PEI is a performance-based bonus equivalent to one-month
basic salary given to government employees whose offices have successfully met
at least 90.0 percent of at least two (2) of their committed outputs or outcomes and
complied with good governance conditions. Personnel services expense has
likewise increased from the creation and filling up of positions in key agencies such
as the DepEd, DILG, DND and DOH, DPWH to increase their staffing complement
and capacitate them in areas of procurement and program implementation.
As the disbursement rate of line agencies started to improve in the second quarter,
underspending was trimmed down to 12.8 percent at the end of 2015, slightly
narrower than the 13.3 percent gap recorded in 2014. In nominal terms, however,
the underperformance was higher at PHP328.3 billion against the PHP302.7 billion
in the previous year. It should be noted though that the disbursement program for
2015 was also higher by 12.0 percent at PHP2,558.9 billion vis-à-vis PHP2,284.3
billion in 2014.
Table 7. Differences Between Target and Outturn of Expenditures, 2011-2015
(as percent of GDP)1/
Particulars 2011 2012 2013 2014 2015Average Difference
2011-2015
Total Expenditures -1.2 -0.3 -0.4 -2.1 -1.6 -1.1
Current Operating Expenditures -0.5 -0.3 -0.2 -1.3 -0.9 -0.6
Personnel Services -0.3 -0.3 -0.2 -0.4 -0.3 -0.3
MOOE -0.2 -0.1 -0.2 -0.5 0.0 -0.2
Subsidy 0.3 0.1 0.2 -0.2 -0.3 0.0
Allotments to LGUs 0.1 0.0 0.1 0.0 0.1 0.1
Interest Payments -0.4 0.0 0.0 -0.2 -0.3 -0.2
Tax Expenditures -0.1 0.0 0.0 0.0 0.0 0.0
Capital Outlays2/ -0.6 -0.1 -0.2 -0.8 -0.7 -0.5
Infrastructure and Other CO -0.8 -0.7 -0.3 -0.7 -0.5 -0.6
Equity 0.1 0.2 0.1 0.0 0.0 0.1
Net Lending 0.0 0.0 0.0 -0.1 -0.1 0.0
Memo Item:
Nominal GDP (in million Pesos) 9,708,333 10,561,089 11,538,410 12,645,271 13,307,265
Notes:
1/ A positive value indicates that the actual is higher than the budgeted
2/ Capital Outlays include Capital Transfers to LGUs, CARP-Land Acquisition and Credit, and Debt Management Program For the period 2011-2015, actual government spending or cash disbursements was
below program by 1.1 percent of GDP on the average. This was mainly due to
consistent underspending in the major expense classes – PS, MOOE, and
Infrastructure and other CO, with average underspending at 0.3 percent of GDP, 0.2
percent of GDP, and 0.6 percent of GDP, respectively.

15
27. Interest payments (IP) remained to be a source of underspending due to lower
domestic borrowings brought about by lower deficit and and proactive cash
management, lower interest payments due to liability management
transactions and lower domestic interest rates during the year . IP amounted to
P309.4 billion, P52.5 billion lower than the projected level, and P11.8 billion lower
than the previous year’s actual level. As a result, its share to the total disbursements
has declined to 13.9 percent from 16.2 percent in 2014.
Moreover, net lending amounted to P9.7 billion, lower by P16.8 billion compared
to the projected level of P26.5 billion, and by P3.7 billion compared to the year-ago
actual level of P13.4 billion as a result of the commitment of GOCCs to fiscal
discipline and prudent cash management.
Expenditure Outlook and Reforms
28. For 2017, the Proposed Budget is P3.350 trillion, 11.6 percent higher than the
2016 Budget of P3.002 trillion. This Budget intends to address the gaps identified
in the 2015 Socioeconomic Report (SER), and the emerging concerns and priorities
of the new administration. This Budget, which is the first to be crafted under the
new administration, reflects the commitment of the President in providing the
Filipino people with equal opportunity to prosper in a peaceful and orderly
environment. Provision for basic education [Department of Education (DepEd)] is
allocated with the biggest share of the budget, followed by infrastructure
development [Department of Public Works and Highways (DPWH)] and public
order and safety (DILG).
Table 8. Philippines: Expenditure Program, Selected Departments, 2016-2017
(in billion pesos)
Departments 2016
GAA
2017
NEP
Department of Education 433.4 567.6
Department of Public Works and Highways 397.1 458.6
Department of Interior and Local Government 125.4 150.1
Department of Health 125.0 144.2
Department of National Defense 117.7 134.5
Department of Social Welfare and Development 110.9 129.9
Department of Transportation and Communications 44.3 55.5
Department of Agriculture 48.9 45.3
Department of Environment and Natural Resources 22.3 29.4
Department of Finance 20.2 23.0
Source: Department of Budget and Management

16
29. The Philippines Open Data Initiative entails the opening up of all public
information and datasets, making them more accessible, understandable, and
reusable by the public. The primary objective of the initiative is to foster a
citizenry that are empowered to make informed decisions, and to promote efficiency
and transparency in government.
30. The government is sustaining the Two-Tier Budgeting Approach (2TBA) in
the preparation of the budget. This approach divides the preparation process into
two tiers – the first involves the discussions of ongoing programs and projects of
departments and agencies, while the second involves the deliberations of new
spending or expansion proposals. This approach will shun the complex process of
combining the existing expenditure items with the new ones in the budget
preparation. This will provide room for the executive to properly allocate the fiscal
space strategically based on the government’s priority and emerging concerns.
31. The government will also pursue the operationalization of the Budget and
Treasury Management System (BTMS), an interagency project that will
provide reliable and accurate information to support better fiscal planning,
operational budgeting, cash programming and management, timely financial
reports, and effective enforcement of financial accountability rules and
regulations.
To support the operationalization of the BTMS, the Budget Reporting and
Performance Standards (BRPS) was created. The Unified Accounts Code Structure
(UACS) is one of the components of the BPRS. It aims to unify all account
transaction codes used for budgeting, cash management, accounting, and auditing
throughout the government. This will improve budget integrity as well as promote
efficiency in the budget implementation with further disaggregation of
department/agency programs and projects. Online platforms such as the Online
Submission of Budget Proposals (OSBPS) and the Online Submission of Budgetary
Reports (OSBR) are also being institutionalized based on the UACS to further
facilitate timely submission of documents for budget preparation, execution, and
monitoring.
Meanwhile, the Bureau of the Treasury is prioritizing the full implementation of the
Treasury Single Account (TSA), which will enable the government to consolidate
all cash resources in a unified bank account and to optimize financing by reducing
borrowings caused by perceived cash shortages. Moreover, the TSA will foster
transparency in public financial management, improve cash management, increase
liquidity in the domestic financial market, facilitate accurate accounting, and
reporting, and reduce transaction cost, and thereby increasing government earnings.

17
Sources of Fiscal Risks
Government Underspending
32. The majority of the underspending in previous years can be attributed to the
structural flaws in program/project preparation and implementation. In
particular, weaknesses were seen in the following areas:
Asynchronous and poor planning resulting to untimely revisions in project
specifications;
Procurement issues, including frequent bidding failures, delays in complying
with required bidding documents, weak capacity of procurement staff, and the
rigid rules of the procurement process;
Implementation bottlenecks, including difficulties in securing clearances and
permits, right-of-way, support from local government units, and contractors’
non-compliance to documentary requirements; and
Inept organizational structure, including mismatched technical capacity and lack
of manpower.
Climate Change and Natural Disasters
33. The Philippines faces extreme risks because of its vulnerability to the impacts
of climate change and natural disasters. The damages brought about by typhoon
Yolanda in the Central Philippine Region in 2013 left important lessons to
policymakers, both in the local and national level as well as in the private sector. In
the following year, significant funding under the Comprehensive Rehabilitation and
Recovery Plan was provided for the provinces and regions that were greatly affected
by that typhoon. Based on scenarios that were presented in several climate-related
conferences, the frequency and intensity of typhoons is projected to increase.
Hence, the government needs to allocate funds not only for post-calamity, but more
importantly for the preparation and mitigation of the impacts of these natural
calamities.
Because of its location and topography, combined with an underdeveloped public
infrastructure and poor urban planning, the country has become more exposed to
various climate change hazards – communities and their livelihood become
threatened, and business operations and prospects are affected. Although
government service is expected to provide the necessary intervention in the
occurrence of natural disasters, programs and projects can also be disrupted such as
in the construction of public infrastructure during the wet season, or implementation
of agriculture projects in extended dry season.
New Administration
34. The current administration has promised a better and more effective delivery
of public services to the Filipino people. This change in administration however
poses risks as new heads of agencies take over bringing in new set of policies and
familiarizing on old ones. While previous administrations were confronted with
challenges and fell short in these areas, the Duterte administration is willed to
address the gaps in infrastructure, social services, peace and order, and national
security.

18
35. For 2017, the government will be allocating around P1.3 trillion for the social
sector equivalent to 40.1 percent share in the overall budget. Provision of basic
education, social assistance, and health services will be a priority consistent with
the government’s goal of investing on the most important resources-its people. The
amount of P860.6 billion, equivalent to 5.4 percent of GDP will be provided as part
of the Administration’s commitment to accelerate and improve public
infrastructure, including the construction of roads, bridges, ports, airports and
railways. Moreover, around P383.3 billion will be allocated to the state forces for
the maintenance of public order, security, and the rule of law.
Raising the base pay of military and uniformed personnel
36. President Duterte promised to support the increase in the compensation for
military and uniformed personnel. The proposed increase in the base pay and
allowances are to be implemented in three tranches from 2017 to 2019 with total
annual incremental cost amounting to P111.5 billion.
RISK MITIGATION MEASURES
Address Underspending in Departments and Agencies
37. The policy on “early procurement, short of award” policy will be sustained.
Not only will it facilitate the bidding out of projects, but more importantly, it will
allow agencies to prepare action plans in time for project implementation at the start
of the fiscal year. Alongside this, the GAA-as-a-Release Document will be
sustained to streamline the budget execution process, which is often lengthy and
repetitive. This will also foster accountability among departments and agencies as
funds are readily available for utilization.
38. The government is introducing a 24/7 operation and monitoring policy to fast
track the implementation of projects. This policy will adopt a 3-shift
implementation scheme, which would require contractors to work round-the-clock
under the supervision of a project monitoring team.
Natural Disasters and Climate Change-Related Issues
39. The government acknowledges the importance of creating a climate-resilient
environment for the Filipino people. As such, the promotion of integrity of the
environment was one of the priorities identified in the Budget Priorities Framework
(BPF). The BPF was issued to serve as guide for departments and agencies to align
their programs and projects with the administration’s priorities.
Moreover, the implementation of the Climate Change Expenditure Tagging (CCET)
system, which was established by the DBM and the CCC in 2013, is sustained for
FY 2017 budget preparation to facilitate the identification, monitoring and
evaluation of climate change-related expenditure items necessary. This system uses
existing budgeting system and is already integrated in the OSBPS.
19
40. For 2017, the Department of Environment and Natural Resources is allocated
with P29.4 billion for the National Greening Program (NGP), National
Geohazard Assessment Program, and Air Quality Monitoring Projects, among
others. The Department of Public Works and Highways is provided with P71.3
billion for the construction and rehabilitation of flood control and drainage systems
to mitigate flooding in flood-prone areas in the metropolis.
To provide speedy disaster relief, P37.3 billion is allocated for the Calamity Fund.
The Quick Release Fund, formerly lodged in each agency budget, is now included
under the Calamity Fund to limit its use to disaster operations.
IV. PUBLIC DEBT
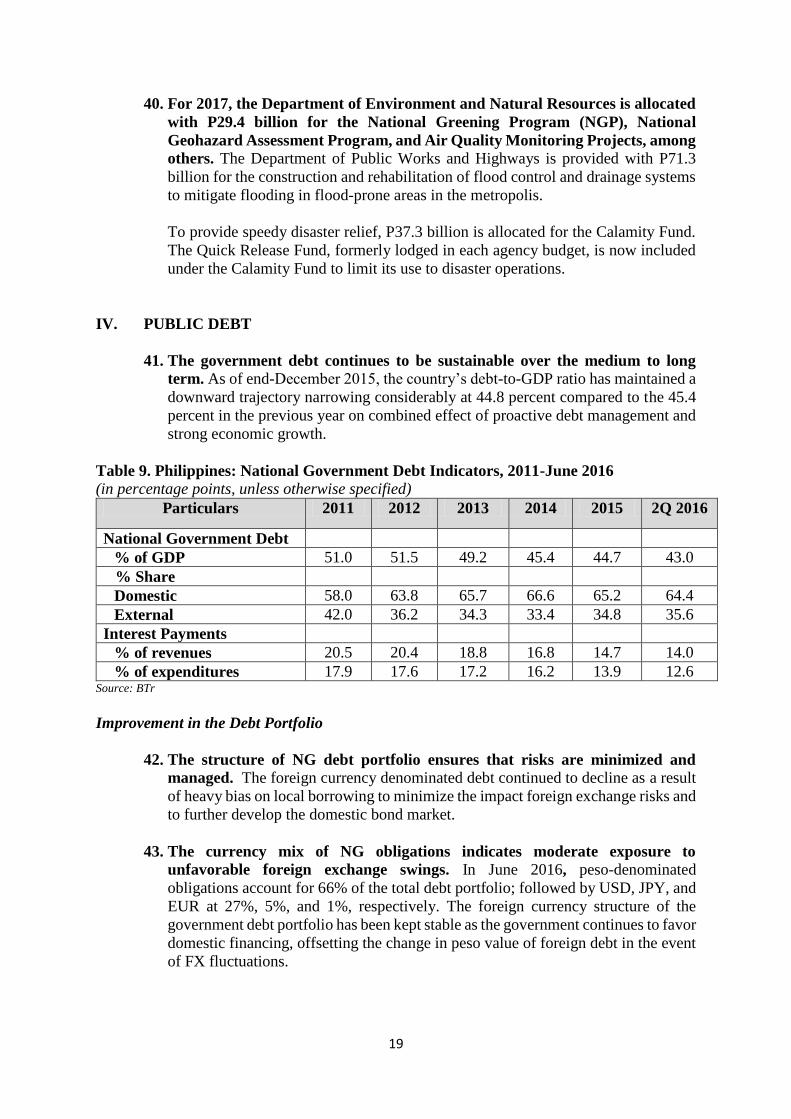
41. The government debt continues to be sustainable over the medium to long
term. As of end-December 2015, the country’s debt-to-GDP ratio has maintained a
downward trajectory narrowing considerably at 44.8 percent compared to the 45.4
percent in the previous year on combined effect of proactive debt management and
strong economic growth.
Table 9. Philippines: National Government Debt Indicators, 2011-June 2016
(in percentage points, unless otherwise specified)
Particulars 2011 2012 2013 2014 2015 2Q 2016
National Government Debt
% of GDP 51.0 51.5 49.2 45.4 44.7 43.0
% Share
Domestic 58.0 63.8 65.7 66.6 65.2 64.4
External 42.0 36.2 34.3 33.4 34.8 35.6
Interest Payments
% of revenues 20.5 20.4 18.8 16.8 14.7 14.0
% of expenditures 17.9 17.6 17.2 16.2 13.9 12.6 Source: BTr
Improvement in the Debt Portfolio
42. The structure of NG debt portfolio ensures that risks are minimized and
managed. The foreign currency denominated debt continued to decline as a result
of heavy bias on local borrowing to minimize the impact foreign exchange risks and
to further develop the domestic bond market.
43. The currency mix of NG obligations indicates moderate exposure to
unfavorable foreign exchange swings. In June 2016, peso-denominated
obligations account for 66% of the total debt portfolio; followed by USD, JPY, and
EUR at 27%, 5%, and 1%, respectively. The foreign currency structure of the
government debt portfolio has been kept stable as the government continues to favor
domestic financing, offsetting the change in peso value of foreign debt in the event
of FX fluctuations.

20
44. Refinancing risk is very minimal. In June 2016, the average maturity of the debt
portfolio has maintained a comfortable average of 10.23 years, residing on the upper
bound of the country’s medium-term debt target of 7 to 10 years. Approximately
93% of the country’s total outstanding debt is at the longer-end, which diminishes
the country’s exposure to refinancing risks. Domestic and external debt has average
maturities of 9.05 and 12.36 years, respectively. Meanwhile, the Bond Sinking Fund
has sufficient assets to cover the repayment of maturing domestic obligations.
45. The average cost of borrowing has remained low and stable despite the rising
interest rate environment. The Weighted Average Interest Rate (WAIR) for
domestic and foreign borrowings is at 5.40% and 4.46% as of end-May 2016 from
5.42% and 4.48% for the previous month, respectively. The trend continued from
2015-year-end WAIR for outstanding domestic and foreign obligations which were
at 5.46% and 4.67%, respectively.
46. Debt servicing flows continue to be sustainable. The government has taken
advantage of a period of very low borrowing costs. Moreover, the government‘s
proactive stance in managing the debt profile through several liability management
transactions has contributed in strengthening the debt metrics. As a result, interest
payments as a portion of expenditures continue to decline, allowing more fiscal
space for productive spending. For 2015, the share of interest payments to revenue
and expenditure were reduced to 14.7% and 13.9%, from 16.8% and 16.2% in 2014,
respectively. In 2017, interest payment as a percentage of revenues and
expenditures are expected to decline at 13.5% and 11.3%, respectively.
47. The interest structure of the NG debt portfolio ensures minimal exposure to
adverse swings of interest rates. In June 2016, only 8.46% of the total debt
portfolio pays floating-interest rate, limiting the scope for possible interest-payment
escalation in the event of tighter borrowing conditions in the financial markets.
48. Sensitivity analysis of NG debt to changes in interest and exchanges rates
demonstrates the resilience of the government debt portfolio against market
shocks. The table below shows that sensitivity to interest and exchange rates
fluctuations will be more or less maintained.
a. For 2017, a temporary 100 basis points increase in the average effective
interest rate on NG debt would increase interest payments by a total of 2.44%
or P8.153 billion, an improvement from the 2.85% or P9.365 total impact in
2016.
b. A 1-peso depreciation against the US dollar would result in an aggregate
impact of 0.64% or P2.135 billion on the 2017 budget for interest payments for
US dollar-, Japanese Yen-, and Euro-denominated debt, slightly lower than the
0.71% or P2.315 billion gross impact in 2016 budget.
c. A combined shock wherein interest rates rise by 100 basis points and the 1-
peso depreciation against US dollar increases the 2017 interest payment by only
3.01% or P10.095 billion compared to the 3.49% or P11.440 billion aggregate
impact in the previous year.

21
d. Meanwhile, the 1-peso sensitivity against the US dollar increases the
principal payment for US dollar-, Japanese Yen- and Euro- denominated debt
by P1.738 billion, P453.61 million and P48.10 million, respectively. Table 10. Philippines: Sensitivity of Debt Service Flows to Market Shocks
49. Non-resident investors only hold 6.2 percent of the total domestic government
securities which indicates a very low exposure in the event of
capital outflow. Peculiar mechanisms, such as the need to go through custodians,
deter foreign investors in investing in government debt papers. Moreover, frictional
costs are also a consideration such the administrative and custodian’s fees,
withholding periods and other issues on tax systems. Hence, the risks of the
government to a sudden capital outflow as well as its impact on currency
depreciation and upward adjustment in local interest rates are minimal.
50. The BTr conducted debt sustainability analysis (DSA) to analyze the future
path of government debt dynamics. Using the approved medium-term
macroeconomic assumptions set by the DBCC and projections in the World
Economic Outlook (5-year projection period), the future path of debt (baseline
scenario) is created without taking into considerations the shocks on
macroeconomic variables and assuming no changes in the fiscal stance over the
medium term which is set at 3% of GDP.

22
30
32
34
36
38
40
42
2017 2018 2019 2020 2021 2022
Baseline
51. The baseline macroeconomic and fiscal targets reveal that the Philippine’s NG
debt remains broadly sustainable even if the deficit-to-GDP target has been
adjusted to 3% from 2% target in the next six years. Similarly, the
government’s gross financing need as a percentage of GDP continues to exhibit a
downward trend, indicating improved capacity of the government to repay its
maturing obligations.
Figure 1. Sustainability Analysis of Nominal Debt to GDP
Source: Based on the IMF DSA Model run by the BTr
Figure 2. Sustainability Analysis of Gross Financing Need to GDP
Source: Based on the IMF DSA Model run by the BTr
52. Based on the stress test, the debt-to-GDP ratio will continue to decline over the
projection period even in the occurrence of various macro-fiscal shocks. The
analysis shows that a shock in 2017-2018 in real GDP by 1 standard deviation
increases the debt-to-GDP ratio by 2.3 percentage points from the baseline scenario
to 37.6% in the year 2022. Meanwhile, a 15% depreciation of the Philippine peso
applied over the same period (2017-2018) against the US dollar would have
minimal effect on the debt-to-GDP ratio, which will only increase by 0.2 percentage
point to 35.3 percent from the baseline scenario of 35.1%. The limited impact of
foreign exchange movement on the debt-to-GDP reflects the small percentage of
FX debt to total debt as a result of heavy biased towards domestic financing.
0
1
2
3
4
5
6
2017 2018 2019 2020 2021 2022
Baseline
23
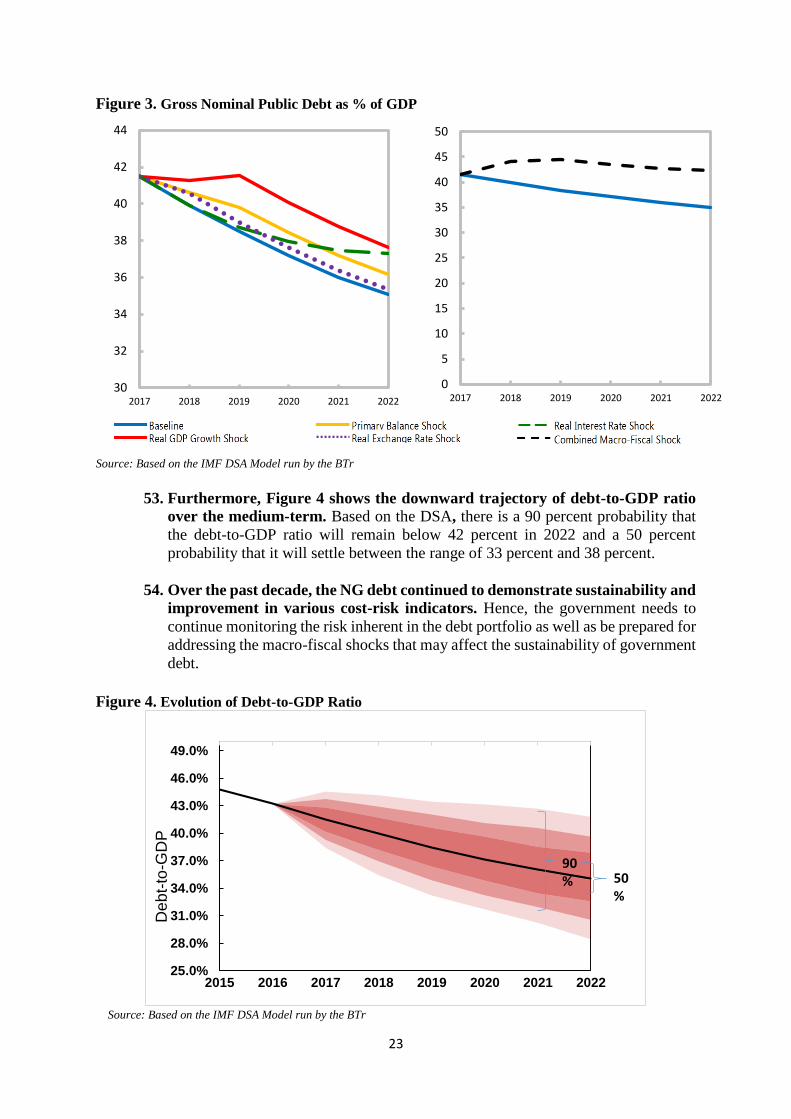
Figure 3. Gross Nominal Public Debt as % of GDP
Source: Based on the IMF DSA Model run by the BTr
53. Furthermore, Figure 4 shows the downward trajectory of debt-to-GDP ratio
over the medium-term. Based on the DSA, there is a 90 percent probability that
the debt-to-GDP ratio will remain below 42 percent in 2022 and a 50 percent
probability that it will settle between the range of 33 percent and 38 percent.
54. Over the past decade, the NG debt continued to demonstrate sustainability and
improvement in various cost-risk indicators. Hence, the government needs to
continue monitoring the risk inherent in the debt portfolio as well as be prepared for
addressing the macro-fiscal shocks that may affect the sustainability of government
debt.
Figure 4. Evolution of Debt-to-GDP Ratio
Source: Based on the IMF DSA Model run by the BTr
25.0%
28.0%
31.0%
34.0%
37.0%
40.0%
43.0%
46.0%
49.0%
2015 2016 2017 2018 2019 2020 2021 2022
De
bt-
to-G
DP
50%
90%
0
5
10
15
20
25
30
35
40
45
50
2017 2018 2019 2020 2021 202230
32
34
36
38
40
42
44
2017 2018 2019 2020 2021 2022

24
V. MONETARY PERFORMANCE
A. MONETARY AGGREGATES
55. Domestic liquidity or M3 grew by 12.4 percent as of end-June 2016, faster than
the 9.2-percent expansion recorded in the same period in 2015. The increase in
money supply remained consistent with the robust expansion in domestic demand.
56. The growth in domestic liquidity was driven largely by the sustained expansion
in domestic claims or credits to the domestic economy. Domestic claims rose by
16.9 percent, supported by the continued increase in claims on the private sector,
reflecting the steady growth in bank lending. Meanwhile, the bulk of bank loans as
of end-June 2016 was channeled to key production sectors such as real estate
activities; electricity, gas, steam and air-conditioning supply; and wholesale and
retail trade, repair of motor vehicles and motorcycles.
a. Outstanding loans of commercial banks, net of reverse repurchase (RRP)
placements with the BSP, grew by 17.6 percent in June 2016 from 14.5 percent
in June 2015. Similarly, bank lending inclusive of RRPs increased by 16.6
percent in June 2016 from 14.2 percent in the previous year.
b. Bank loans for production activities—which comprised more than 80.0 percent
of banks’ aggregate loan portfolio—expanded by 17.7 percent in June 2016
from 14.5 percent in June 2015. The expansion in production loans was driven
primarily by increased lending to the following sectors: real estate activities
(20.7 percent); electricity, gas, steam and air-conditioning supply (30.0
percent); wholesale and retail trade, repair of motor vehicles and motorcycles
(15.3 percent); financial and insurance activities (19.4 percent); and
manufacturing (9.3 percent).
c. Loans for household consumption increased by 18.8 percent in June 2016 from
14.9 percent in the previous year due to the expansion in motor vehicle loans,
and salary-based general purpose loans and sustained growth in credit card
loans, which offset the decline in other types of household loans.
Meanwhile, net claims on the central government rose by 25.3 percent.
57. Net foreign assets (NFA) in peso terms rose by 11.1 percent in June 2016. The
BSP’s NFA position continued to expand on the back of robust foreign exchange
inflows coming mainly from OF remittances, business process outsourcing receipts,
and portfolio investments. Meanwhile, the NFA of banks increased as banks’
foreign assets expanded at a faster pace than their foreign liabilities. Banks’ foreign
assets increased due largely to the growth in their investments in marketable debt
securities and interbank loans, while banks’ foreign liabilities grew mainly on
account of deposits made by foreign banks.

25
B. POLICY ACTIONS
58. The Monetary Board (MB) kept the BSP’s key policy rates unchanged in 2015
up to May 2016. The overnight borrowing or reverse repurchase (RRP) and
overnight lending or repurchase (RP) rates were retained at 4.0 percent and 6.0
percent, respectively. The interest rates on term RRPs, RPs and special deposit
accounts (SDA) were also kept steady. The reserve requirement ratios were likewise
left unchanged.
On 3 June 2016, the BSP formally shifted its monetary operations framework to an
interest rate corridor (IRC) system for guiding short-term market rates towards the
BSP policy interest rate to help improve the transmission of monetary policy. The
IRC system consists of the rates on the following instruments: standing liquidity
facilities, (namely, the overnight lending facility (OLF) and the overnight deposit
facility (ODF)); the overnight RRP facility; and term deposit auction facilities
(TDF).
The interest rates for the standing liquidity facilities form the upper and lower bound
of the corridor while the overnight RRP rate is set at the middle of the corridor. The
RP and SDA windows were replaced by standing overnight lending and overnight
deposit facilities, respectively. Meanwhile, the RRP facility was modified to a
purely overnight RRP. In addition, the TDFs serve as the main tool for absorbing
liquidity.11
Consequently, the interest rate was set at 3.5 percent in the overnight lending
facility, 3.0 percent in the overnight RRP facility, and 2.5 percent in the overnight
deposit rate. It should be noted that the shift to the IRC system does not represent a
change in the BSP’s stance of monetary policy. The IRC reforms are primarily
operational in nature and will not materially affect prevailing monetary policy
settings upon implementation.
59. The policy decisions of the MB were based on the BSP’s assessment of the
dynamics and risks in the inflation environment over the policy horizon. Notwithstanding the decline in inflation below the government inflation target, the
BSP made clear in its policy communications to the public that domestic price
movements in 2015 and in the first half of 2016 were being driven largely by
transitory supply-side factors that were outside the influence of monetary policy.
The BSP likewise noted that domestic economic activity was at a solid pace during
the year, supported by robust domestic spending, favorable business and consumer
sentiment as well as ample domestic liquidity and credit. In addition, inflation
expectations continued to be well-anchored and aligned with the NG’s inflation
target. Finally, there were no firm indications of second-round effects, such as a
slowdown in domestic economic activity or petitions for wage and transport fare
adjustments that would warrant monetary policy action from the BSP.
At the same time, the MB noted that the challenging external environment and
uneven growth prospects in advance and key emerging economies supported the
decision to keep policy settings steady.
11 BSP, “BSP Implements Interest Rate Corridor (IRC) System in Q2 2016”, available online at http://www.bsp.gov.ph/publications/media.asp?id=4063.

26
60. In its policy pronouncements, the BSP also emphasized that the benign
inflation environment and the economy’s underlying growth momentum
provide adequate room to maintain monetary policy settings. The BSP also
noted that it would continue to monitor emerging price and output conditions to
ensure price and financial stability conductive to sustainable economic growth.
VI. FINANCIAL SECTOR
61. The Philippine banking system registered strong financial condition with
sustained asset quality, improved profitability and strong capitalization. The
BSP actively pursues regulatory initiatives to mitigate systemic risk through broad-
based regulatory reforms, cross-sectoral cooperative arrangements and advocacies
toward promoting financial inclusion, consumer education and protection.
A. PERFORMANCE OF THE BANKING SYSTEM
62. Banks’ balance sheet continued to expand, marked by sustained growth in
assets and deposits. Total resources of the banking system expanded by 12.5
percent to P= 11,317.2.12 This was primarily funded by deposits and capital at 76.7
percent and 12.0 percent, respectively. Deposits continued to be mostly peso-
denominated (81.6 percent) and sourced from residents (99.5 percent). Total loan
portfolio of P= 5,940.3 billion grew by 16.2 percent year-on-year, brought about by
a 17.0 percent growth in core lending13 amounting to P= 5,444.3 billion. Despite the
robust expansion in banking system assets, banks continued to adhere to high credit
underwriting standards which led to the further improvement in their non-
performing assets ratio (at 1.6 percent of gross assets) and gross non-performing
loan (NPL) ratio (at 1.7 percent of total loan portfolio) as of end-June 2016. Gross
NPL ratio was 2.3 percentage points lower than the pre-1997 Asian Financial Crisis
level of around 4 percent and a significant turnaround from the 16 percent peak
during the Oil Crisis in 2001.
63. Banks sustained profitability, reporting net income of P= 70.5 billion, buoyed
by interest income on core lending operations. Banks registered higher cost-to-
income ratio (63.9 percent) due to expenses related to expansionary banking
operations such as insurance, rent, security, messengerial and janitorial services and
compensation expenses. Return on assets (ROA) and return on equity (ROE) ratios
declined slightly to 1.2 percent and 9.8 percent, respectively.14
64. There was also ample liquidity in the system to support credit. Liquid assets-to-
total assets ratio of banks stood at 42.4 percent as of end-June 2016.
12 Investments in financial assets account for 21.3 percent (P= 2,410.0 billion) of UKBs total assets. 64.0 percent
(P= 1541.4 billion) of banks’ investments consists of securities issued by the National Government. 13 Core lending refers to total loan portfolio, exclusive of interbank loans and reverse repurchase (RRP)
transactions with the BSP and other banks. 14 ROA and ROE ratios of U/KBs as of end-June 2015 were at 1.3 percent and 10.7 percent, respectively.

27
65. Bank lending continued to contribute to the country’s positive economic
development. Banks’ lending was mostly channelled to productive activities, with
real estate activities continuing to have the largest share (16.7 percent), followed by
manufacturing (13.7 percent), and wholesale and retail trade (13.3 percent).
66. Banks’ capital position remained strong despite reduced buffer. U/KBs posted
lower risk-based capital adequacy ratio (CAR) of 15.0 percent (solo) and 15.8
percent (consolidated)15 as of end-March 2016 brought about by risk-weighted
activities outpacing growth in regulatory capital. The ratios are comparable to
ASEAN-516 counterparts and indicate that banks maintain adequate buffer against
unexpected losses within the region. The banks’ CAR were well above the 10
percent BSP regulatory threshold and 8 percent international minimum, composed
predominantly of the highest quality common equity tier (CET) 1 amounting to 13.0
percent (solo) and 13.8 percent (consolidated), respectively of risk-weighted assets
(RWA), which were slightly lower compared to the end-December 2015 figures.
67. International credit agencies still consider Philippine banks resilient on the
back of the country’s strong economy and stable banking system. Fitch Ratings
affirmed the country’s investment grade rating on the back of robust economic
growth and stable banking system.17 Standard and Poor’s (S&P) Global Rating has
similarly kept the country’s rating a notch above investment grade with a stable
outlook.18
B. RISK FROM THE BANKING SECTOR
68. Direct and indirect exposures of the National Government (NG) to the banking
sector is marginal. The Philippine Government’s exposure to the banking system
was mostly in the form of deposit liabilities amounting to P= 1,126.9 billion,
representing 13.0 percent of the P= 8,681.1 billion total deposit liabilities of the
banking system. The share of NG’s deposits to total deposit liabilities of the
banking system slightly declined with the operationalization of the Treasury Single
Account (TSA) by the Bureau of the Treasury (BTr) which receives remittance of
collections from Bureau of Internal Revenue (BIR) /Bureau of Customs’ (BOC)
authorized agent banks.19 The maintenance by banks of a 50 percent liquidity floor
also serves as a liquidity buffer to service withdrawals and payments on deposits
of, borrowings from and all other liabilities that banks may owe the Government.
NG’s capital contribution in three government-owned banks as of end-December
2015 is estimated at P= 25.5 billion.20
15 Source: BSP Website. Select Performance Indicators. 16 Source: IMF data. As of first quarter of 2016, Indonesia’s CAR was 20.6 percent, Thailand at 17.2 percent,
Malaysia at 16.7 percent, Singapore, at 16.4 percent and Philippines at 15.3 percent. 17 From “Fitch Affirms the Philippines at 'BBB-'; Outlook Positive” published by FitchRatings on 08 April 2016. 18 From “Ratings on the Republic of the Philippines Affirmed at ‘BBB/A-2’; Outlook Stable” published by S&P Global Ratings
21 September 2016. 19 Deposits representing collections from the BIR/BOC declined by 41 percent with the operationalization of the
TSA. In accordance with Executive Order No. 55 s. 2011, the BTr shall operate a TSA to receive remittance of collections of internal revenue taxes/customs duties from BIR/BOC authorized agent banks as well as other national collections of NG Agencies from authorized government depository banks. The TSA, which shall be maintained at the BSP, will align the government policy of greater financial management and control of its cash resources and allow the unification of the structure of government bank accounts to enable consolidation and optimum utilization of government cash resources.
20 Based on 2015 audited financial statements of government banks.
28
69. The NG also extends guarantees (i.e., FX cover) on foreign currency
denominated borrowings of government banks from multilateral lenders,
which are intended for re-lending to priority sectors. The notional amount of
the FX cover on such borrowings is estimated at US$1.4 billion (or P= 66.8 billion).
PHP-denominated borrowings of government banks amounting to P= 4.5 billion for
re-lending to priority sectors/projects21 are, likewise, guaranteed by the NG.
C. RISK MITIGATION MEASURES
70. The BSP continues to enhance its regulatory framework through broad-based
and well-calibrated reforms that are aligned with evolving trends and reforms
in international standards and best practices consistent with its commitment
to promote a dynamic and stable, yet truly inclusive banking system. Major
initiatives were in the area of Basel III capital standards and corporate
governance and risk management standards. The BSP remains committed to
safeguard the stability of the financial system against shocks through the continuous
strengthening of financial system surveillance and analytics to proactively institute
measures to manage emerging risks. These are complemented by various
advocacies on capital market reforms, financial inclusion and consumer protection
and active engagement of stakeholders to maintain financial stability, which is key
to the attainment of sustainable, equitable and inclusive economic growth. These
initiatives are matched by infrastructure- and capacity-building for bank
supervisors.
71. Financial stability initiatives. The BSP continues to implement prudential policies
that are in line with its broad-based objective of promoting financial stability to
foster a regulatory environment that promotes prudent risk-taking of financial
institutions while continuing to nurture creativity and responsiveness in the delivery
of financial products and services.
a. Basel III reforms. In line with the BSP’s capital reform agenda22, the BSP
adopted the Basel III Leverage Ratio23 and Liquidity Coverage Ratio (LCR),
which takes full effect on 1 January 2017 and 1 January 2019, respectively. The
minimum 5 percent leverage ratio sets a bank’s maximum on- and off-book
(non-risk-weighted) exposures at 20x its Tier 1 capital to mitigate the build-up
of risks with system-wide consequences. Meanwhile, the LCR24 promotes
21 These include borrowings for re-lending to micro-enterprise financing, housing, and other countryside
projects. 22 The capital reform agenda earlier implemented by the BSP includes the adoption of higher quality capital
adequacy standards and capital conservation buffer under Basel III starting 1 January 2014, revised capital framework for foreign banks in the Philippines, higher required minimum capital for all bank categories and implementation of the Domestic Systemically Important Banks (DSIBs) framework.
23 Applicable only to universal and commercial banks as well as their subsidiary banks and quasi-banks. Compliance with the five percent leverage ratio is subject to a monitoring period up to end-2016. Final guidelines with a view to migration from monitoring to a Pillar 1 requirement will be issued before the requirement takes full effect on 1 January 2017.
24 Compliance with the LCR is subject to an observation period from 1 July 2016 to end-2017 during which banks shall report their LCR to the BSP. Banks shall be required to meet 90 percent of the LCR beginning 1 January 2018, which will then be increased to 100 percent beginning 1 January 2019.
29
discipline in mitigating liquidity risk by requiring U/KBs to hold sufficient
liquidity buffer, i.e., high quality liquid assets that can be easily converted into
cash to service liquidity requirements over a 30-day stress period. In addition,
the BSP required Domestic Systemically Important Banks (DSIBs) to draw up
and maintain a recovery plan that prepares them for future destabilizing events
and/or crisis. Forthcoming initiatives25 under Basel III include the adoption of
the net stable funding ratio, which provides for a minimum bank liquidity metric
that should be complied over a longer period of one year.
b. Heightened corporate governance and intensified risk management26.
b.1 Stronger corporate governance. To promote good corporate governance,
BSP dispensed with the prior BSP verification of dividend declaration
requirements and shifted the accountability for dividend declaration to the
board of directors and senior management of banks/QBs. The guidelines
also enabled publicly-listed banks/ QBs to comply with ASEAN
Corporate Governance Standards.27 To further promote transparency in
BSP’s evaluation process, the BSP communicated its supervisory
enforcement policy, which sets BSP’s expectations when deploying
enforcement actions and the consequences when expected actions are not
performed within timelines.
b.2 Intensified risk management. As part of the BSP’s continuing initiatives
to strengthen risk management systems of BSP-supervised financial
institutions (BSFIs) and foster their sustained safe and sound operations,
the BSP issued guidelines on various facets of risk management, as
follows:
i. Operational risk management;
ii. Treasury operations;
iii. Early detection and proactive management of cyber-security risks28
associated with fraudulent emails or websites. The BSP also
communicated the guidelines on BSP’s Information Technology (IT)
Rating System, which serve as a tool for evaluating BSFI’s IT risk
management systems and practices against acceptable levels/standards
given the BSFI’s risk profiles; and
iv. Credit standards and policies on salary-based general purpose
consumption loans to ensure that these loans are prudently managed
and adhere to BSP’s regulations on consumer protection.
25 Other facets of Basel III reforms seen to boost the banking system’s capacity to endure stress conditions
include ground rules on market risks trading book reforms and counterparty credit risk. 26 The BSP upholds, among others, the exercise of good corporate governance, which is the basic foundation of a safe and sound banking system, and the institution of appropriate risk management systems commensurate to the size and complexities of the banking system. 27 The ASEAN Corporate Governance Standards require dividends to be paid within 30 days after declaration/approval. 28 The BSP, in partnership with BancNet, Inc. and the Information Security Officer Group held the very first Cybersecurity Summit for the financial services industry on 24 November 2015.
30
Enhancements to risk management guidelines that are in the pipeline include
business continuity management, market risk management, intraday
liquidity risk management and large exposure framework.
c. Proactive macro-prudential measures and enhanced financial surveillance.
Consistent with the objective of fostering financial stability amidst the
increasingly complex and sophisticated global financial services industry, BSP
continues to enhance financial surveillance through the implementation of new
reporting/disclosure requirements, which serves as a tool for formulating
evidence-based macro-prudential policies in order to expand its macro-
prudential toolkit to timely identify and mitigate the build-up of systemic risk.29
The new reporting requirements30 included, among others, (1) the quarterly
reports on residential real estate loans to support the generation of the residential
real estate price index, which serves as a valuable tool for assessing real estate
and credit market conditions in the country, and (2) monthly report on
repurchase agreements which will require banks to disclose their outstanding
repo balances and fair value of related security on a daily basis as well as
transactional, counterparty information and details on underlying securities
information on repos, including those with short tenors.
The BSP also further liberalized the foreign exchange (FX) rules, not only to
facilitate access of the private sector to bank financing but also to improve
monitoring of FX trades in the economy.31,32
29 This include adoption of macroprudential limits (i.e., 20 percent and 100 percent of unimpaired capital for
domestic banks and foreign bank branches, respectively) on non-deliverable forward (NDF) transactions involving the Philippine Peso, assigning higher risk weight on banks’ net open position for NDFs, expanding the reporting framework for measuring banks’ real estate exposures and requiring banks to implement real estate stress test limits as a pre-emptive measure to ensure the banking system’s healthy exposure to real estate activities.
30 The BSP also redefined (1) motor vehicle loans, which are segregated as to (i) auto loans, and (ii) motorcycle loans, and (2) past due credit card loans.
31 BSP Circular No. 925 dated 13 September 2016: Amendments to Foreign Exchange Regulations. 32 The amendments include: (1) increasing the amount of FX that Philippine residents may purchase from the
banking system without supporting documentation (other than an application to purchase FX) for legitimate transactions from US$120,000 to US$500,000 (for individuals) and US$1 million (for corporates); (2) allowing Philippine residents to deposit FX purchased from banks for certain underlying transactions (such as for travel abroad and payment of certain obligations to non-residents) into their Foreign Currency Deposit Unit (FCDU) accounts, prior to outward remittance to the intended non-resident beneficiaries; (3) lifting of the prohibition on the sale of FX by banks; and their forex corporations for resident-to-resident transactions; (4) lifting of prior BSP approval and registration requirements for private sector loans to be obtained from FCDUs/Expanded FCDUs of banks, and (5) increasing the amount of legal tender Philippine currency that may be brought into/out of the country from P= 10,000 to P= P50,000.
31
d. Comprehensive consumer protection framework. Following the institution
by the BSP of a financial consumer protection (FCP) framework33, the BSP
issued an advisory to inform the public of its rights to “cooling-off34”, which
empowers the client of the BSFI to cancel his contract within the cooling off
period, i.e., at least two banking days from signing of the contract, without
penalty, provided the client has provided written notification of his intention to
terminate the agreement within the cooling-off period to the BSFI. Aside from
communicating BSP’s minimum expectations for BSFI’s sales and marketing
practices to ensure suitability of investment products offered to clients, the BSP
also reminded banks of their duty to accept unfit currency notes and coins from
the depositing public free of charge and required banks to segregate customer
funds received under securities brokering arrangement (i.e., in a fiduciary
capacity) from funds received from its deposit taking activities.
e. Greater financial inclusion. The Philippines continues to be a thought leader
in financial inclusion35 with the launching of the (1) National Strategy for
Financial Inclusion (NSFI), and (2) National Retail Payment System (NRPS) in
July 2015, and December 2015, respectively. These are significant milestones
towards the attainment of a broad-based and truly inclusive Philippine financial
system that is both accessible and responsive to the needs of the Filipino people,
including those belonging to the unserved, underserved or marginalized sectors.
e.1 NSFI. The NSFI will optimize collective efforts from both public36 and
private sector stakeholders toward financial inclusion in the Philippines
through four key areas: (i) policy and regulation, (ii) financial education
and consumer protection, (iii) advocacy programs, and (iv) data and
measurement, that will serve as the framework in crafting evidence-based
regulations, designing and implementing programs and monitoring
progress relevant to financial inclusion, which is a means to reduce income
33 The BSP’s FCP framework is based on the fundamental tenets of consumer empowerment, market conduct
and collective responsibility to promote greater confidence in the financial system and to empower consumers to make informed decisions, was cited as impressive by the World Bank in its “Republic of the Philippines: Diagnostic Review of Consumer Protection in the Banking Sector” as the BSP’s approach to consumer protection compares well with 114 other economies. The BSP’S FCP framework sets out minimum consumer protection standards in five key areas, namely: disclosure and transparency, protection of client information, fair treatment, effective resolution, and financial education. The public’s right to cooling-off is part of the fair treatment standards of the FCP framework.
34 Right to “cooling-off” is applicable only to: (1) individuals and not corporations, partnerships and associations; and (2) investment in long-term financial instruments with a remaining term of at least one year. The client shall shoulder only reasonable amount of processing or administrative fees plus any mark to market costs from the signing of the contract up to its cancellation. The BSFI is expected to disclose these costs, including the benchmark from which market value of the financial instrument will be determined, prior to the signing of the agreement or in the agreement.
35 The BSP is the first central bank in the world to establish a unit dedicated to financial inclusion – the Inclusive Finance Advocacy Staff. The Philippines has been ranked first in terms of the policy and regulatory framework for microfinance by the Economic Intelligence Unit (EIU) of The Economist for five consecutive years (i.e., from 2009 -2013). In 2014, the country also ranked first in Asia and top three in the world in terms of having a conducive environment for financial inclusion according to the EIU maiden survey “Global Microscope on the Enabling Environment for Financial Inclusion”.
36 A total of 13 government agencies collaborated on the crafting of the NSFI as financial inclusion is a key component in the Government’s drive to ensure inclusive growth, which is consistent with the Philippine Development Plan that envisions a regionally-responsive, development-oriented and inclusive financial system.

32
inequality and poverty, as well as achieve social cohesion and shared
economic development.
e.2 NRPS. The NRPS aims to fast track the establishment of a safe, efficient
and reliable electronic retail payment system that is interconnected and
inter-operable to facilitate the country’s transition to a “cash-lite”
economy. This will improve the country’s economic competitiveness thru
increased transaction speed and efficiency, reduced costs, improved
transparency, enhanced security and expanded access to financial
services.
e.3 Recent initiatives and milestones include:
e.3.1. Monitoring and Evaluation (M&E) System. The BSP, together
with the assistance of the World Bank (WB) recently set up an
appropriate and practical M&E system for the implementation of
NSFI. Its objectives include monitoring program implementation
and national progress, addressing data gaps and promoting
accountability of government agencies involved in the NSFI
implementation.
e.3.2. Financial Inclusion Steering Committee (FISC). The Office of
the President issued Executive Order (EO) No. 208 on 02 June 2016
to institutionalize the FISC, the governing body tasked to provide
strategic direction, guidance and oversight in the implementation of
the NSFI.
e.3.3. 2016 Financial and Digital Inclusion Project Report. The
Philippines gained the biggest improvement in overall score in
digital and financial inclusion for the year 2016. According to the
Brooking Institution’s37 report,38 the increase of eight percentage
points compared to the previous year was attributed to the launch
of the NSFI, strong performance in terms of mobile capacity, and
highest rate of adoption of mobile money accounts among the South
East Asian countries. The Report also acknowledged the work of
the BSP in shepherding implementation of the NSFI and advancing
the formalization of the Financial Inclusion Steering Committee.
Further, the Report also noted the ongoing collaborative work
among regulators and industry stakeholders to boost inter-
operability, efficiency, convenience and utility of the country’s
digital ecosystem through the NRPS.
37 The Brookings Institution is one of the oldest think tank institutions in America which conducts research and
education in the social sciences, primarily in economics, metropolitan policy, governance, foreign policy, and global economy and development.
38 The report was entitled 2016 Financial and Digital Inclusion Project Report: Advancing Equitable Financial Ecosystems.

33
BSP continues to expand the menu of available products and
services39 that are fine-tuned to the evolving needs of a diverse
Filipino public by increasing the range of services performed by
micro-banking offices to include approval and opening of micro-
deposits subject to establishment of appropriate internal controls,
and issuing guidelines on the establishment and operations of trust
corporations that are expected to increase market players and
competition in the asset management business. This can benefit the
investing public through more innovative products and services.
72. Development of the Local Capital Market. The BSP continues to initiate capital
market reforms40 in close coordination with financial regulators and the private
sector to strengthen the domestic capital market by enhancing price transparency
and promoting market discipline/conduct to prepare market participants in the
forthcoming regional economic integration. The BSP also prescribed the
immediate listing of long-term negotiable certificates of time deposits in accredited
exchanges to promote price transparency and allowed the offering of unit
investment trust fund with unit paying feature that provides distribution of non-
guaranteed unit income to investors to allow them to enjoy the fruits of their
investment without having to redeem the actual principal investment.
73. Government infrastructure programs/financing initiatives. The BSP
selectively eased restrictions on lending to directors, officers, stockholders, and
related interests (DOSRI), affiliates, and other related parties to support the
financing of productive sectors and projects that are considered as priority programs
under the Philippine Development Plan (PDP)/Public Investment Program (PIP).41
The definitions of “related interest” and “affiliates” were also fine-tuned to
effectively calibrate the prudential requirements with the degree of potential abuse
in the relationship.42
39 As of end-September 2015, the total number of banking offices increased from 7,585 in 2001 to 10,615, of
which 106 are microfinance-oriented branches and 537 are microfinance-oriented other banking offices. A faster rate of expansion was observed in the distribution of ATMs, which significantly increased from 3,882 in 2001 to 16,781 in end-September 2015. 117 of these banks offer e-banking services like ATM facilities, mobile and internet banking, electronic wallet and phone banking to provide convenience and access to financial consumers.
40 The BSP’s capital market reforms are geared towards promotion of fair market access and level playing field, expansion of available products and markets, fostering investor confidence and enhancing transparency, disclosures and good governance. The reforms instituted by the BSP to further develop the local capital market include: (1) issuance of accreditation guidelines for Personal Equity Retirement Act (PERA) market participants, (2) allowing cross-selling of collective investment schemes, (3) creation of the multi-class unit investment trust fund product to promote operational efficiency and improve economies of scale, and (4) allowing an independent and SEC-authorized Central Securities Depository to act as securities custodian for investors. Other ongoing capital market reforms include the interbank repo, single price convention for trading of government securities, enhancement of the overnight index swap structure, Philippine Stock Exchange acquisition of the Philippine Dealing System Group and institutionalization of standards for financial benchmarks that are aligned with the developments in the international capital markets.
41 BSP Circular 914 dated 23 June 2016: Amendments to Prudential Policy Other Credit Accommodations, and Guarantees Granted to Directors, Officers, Stockholders, and their Related Interests (DOSRI), Subsidiaries and Affiliates.
42 Media Release Article “MB Adopts Risk-Based Approach on Revised Lending Rules to Related Parties” published 14 June 2016.

34
74. ASEAN Banking Integration. The BSP is committed to maintain the
competitiveness of the banking sector through responsive regulation43 to prepare
domestic banks for the ASEAN banking integration that is expected to result
inimproved financial infrastructure through technological transfers and innovations.
In this line, the BSP approved a two-phased44 liberalization of the grant of new
banking licenses or establishment of new banks, which provides local businesses
with the avenue to explore opportunities in the banking sector amidst its opening to
foreign capital infusion. A two-year transition period was also provided to give
interested parties ample time to strategically position themselves in line with
evolving policy reforms and regional integration efforts. The BSP will continue to
pursue initiatives to ensure that the benefits of integration will be realized and risks
will be well-managed.
The BSP and Bank Negara Malaysia (BNM), on 14 March 2016, signed a Heads of
Agreement (HoA) which is one of the first of such bilateral agreements under the
ASEAN Banking Integration Framework. The HoA provides the operational
framework regarding the entry of Qualified ASEAN Banks (QABs)45 between the
Philippines and Malaysia. It allows the entry of up to three QABs from each
jurisdiction to operate in the host country in the form of a subsidiary of the parent
bank that is domiciled in the home jurisdiction.
D. ENSURING FINANCIAL STABILITY
75. Strengthened coordination mechanism with stakeholders and other
counterpart regulators. The BSP actively coordinates with relevant stakeholders
such as industry associations to ensure responsiveness of its reform agenda as well
as with domestic regulators through the Financial Sector Forum (FSF)46 to
harmonize and coordinate supervisory and regulatory methods, policies and
reporting requirements. The BSP also coordinates across government agencies
through the Financial Stability Coordination Council (FSCC)47 in order to take
43 The enactment of Republic Act (RA) No. 10641 ‘An Act Allowing the Full Entry of Foreign Banks in the
Philippines, Amending For this Purpose R.A. No. 7721, and the approval by the Monetary Board of its Implementing Rules and Regulations, fully liberalized the Philippine banking system as it opened up the modes of entry for foreign banks, liberalized branching opportunities and increased the ownership ceiling of foreign banks to 100 percent of the voting stock of an existing domestic bank/new banking subsidiary in the Philippines.
44 Phase 1, which takes effect in March 2016 until end-2017, allows an existing domestic thrift bank to upgrade to a universal bank subject to conditions. Phase 2, on the other hand, fully lifts the moratorium on the establishment of new domestic banks and fully liberalizes the locational restrictions starting 1 January 2018.
45 QABs are strong and well-managed banks, headquartered in ASEAN and majority owned by ASEAN nationals. Banks that apply for QAB status must be endorsed by the home country regulator and accepted by the host regulator. A QAB that enters the Philippines will be regulated under applicable BSP regulations and within the legal framework defined under RA No. 10641.
46 The FSF is chaired by the BSP Governor with heads of the Securities and Exchange Commission (SEC), Insurance Commission (IC) and the Philippine Deposit Insurance Corporation (PDIC) as members. Part of the thrust of the FSF is to develop comprehensive rules on disclosure, create database linkages to facilitate accurate transfer of information which improves supervision oversight of financial conglomerates and activities of entities that operate in the gray areas of supervisory boundaries.
47 The FSCC was, created in October 2011 by the FSF, as a voluntary interagency council whose key objective is to identify, manage and mitigate the buildup of systemic risk consistent with the overall prudential objective of financial stability, was formalized through a Memorandum of Agreement dated 29 January 2014 executed between the BSP, Department of Finance, IC, PDIC and the SEC.
35
proactive measures to manage and address the build-up of system-wide risks which
could arise from financial and non-financial sectors of the economy.
76. Recent signing of a Memorandum of Agreement (MOA) between the FSCC
and the Housing and Land Use Regulatory Board (HLURB)48 to foster
financial stability. The MOA aims to facilitate information sharing among the
agencies as a proactive initiative of the FSCC to better understand
interconnectedness and to mitigate the buildup of systemic risk in the financial
system.
77. The BSP also collaborates with international standard setters49 to develop and
align local regulations and standards with evolving reforms and developments
under international standards and best practices. The BSP actively participates
in regional and international cooperation fora50 to contribute to the formation of a
collective/regional position in areas involving financial stability and bank
supervision.
78. Cross-sectoral cooperative arrangements. Together with financial regulators,
legislators, and the private sector, to align local banking standards and best practices
with international norms.
a. Cross-border liquidity arrangement (CBLA). The guidelines governing the
liquidity facility to operationalize the CBLA between the BSP and the Bank of
Japan (BOJ) took effect last 26 August 2016. The BOJ and the BSP agreed to
establish the CBLA to enhance financial stability in the Philippines, which was
announced in February 2015. The establishment of the facility allows banks
operating in the Philippines, including Japanese banks, to access Philippine peso
liquidity against their Japanese yen holdings during emergency situations.
b. Implementation of Republic Act (RA) No. 10667 (Philippine Competition
Act) with due consideration to the impact of the competition law’s
implementation on bank mergers and consolidations approved by the BSP.
The Philippine Competition Commission (PCC) and the BSP are looking into
executing a Memorandum of Agreement (MOA) to enable a harmonized
regulatory approach consistent with their respective mandates of competition
and financial stability. Discussions among representatives of the BSP and the
PCC have commenced for this purpose.
c. Legislative Sector
The BSP is working closely with both houses of Congress for the timely passage
of critical financial sector reform legislations such as the amendment of the BSP
Charter, passage of the Payment Systems Act, Islamic Banking Framework, to
name a few.
48 The agreement was signed on 30 September 2016 at the BSP Complex with the principals of the agencies in
attendance. 49 Includes the Basel Committee on Banking Supervision and Financial Stability Board Regional Consultative
Group for Asia. 50 Includes the Executives’ Meeting of East Asia Pacific Central Bank (EMEAP), Association of SouthEast Asian
Nations, ASEAN+3 i.e., ASEAN member states plus China, Japan and Korea.

36
c.1 BSP Charter Act. The salient features of the bill are: (1) strengthening
BSP’s monetary stability function; (2) strengthening BSP’s financial
stability function; and (3) strengthening BSP’s corporate and financial
viability. House Bill (HB) No. 5875 was approved by the plenary on third
reading on 09 October 2015. The Senate’s version of the bill that is authored
by Senator Francis G. Escudero is Senate Bill No. 1027.
c.2 Amendment of Republic Act Nos. 1405 (Law on Secrecy of Bank
Deposits) and 6426 (Foreign Currency Deposit Act). The proposed bills
aim to address the call of the global community for a more transparent
financial system environment while ensuring ample safeguards to protect
the rights of bank depositors from unwarranted intrusion.
c.3 Payment Systems Act. The draft bill seeks to promote through the BSP, as
operator of PhilPaSS,51 the safe, efficient and reliable operation of payment
systems in order to manage payment and settlement risk including the risks
of liquidity crunch and contagion by providing a seamless oversight of
national payment highway supportive of the sustainable growth of the
economy.
c.4 Amendment to the Charter of the Al Amanah Islamic Investment Bank
of the Philippines (AIIBP) and Providing for the Regulation of an
Expanded Islamic Banking System in the Philippines. The proposed bill
aims to among others, provide regulation and organization of an expanded
Islamic Banking in the Philippines to serve as the legal and regulatory
framework for other banks operating in the Philippines in the conduct of
Islamic banking business.
c.5 Anti-Money Laundering Act (AMLA) Amendment. Revisions to the
AMLA are being proposed in order to make it more effective in combatting
money laundering, terrorist financing, and cybercrimes.
79. Filipino Identification System Act. This facilitates the provision of government
services and consummation of financial transactions which will thereby, allow
financially-excluded markets to have easier access to the formal financial system.
A national level identification mechanism and infrastructure can also be a key
safeguard against financial crimes, thus ensuring financial integrity.
51 Real time gross settlement system for large value payments in the Philippines.
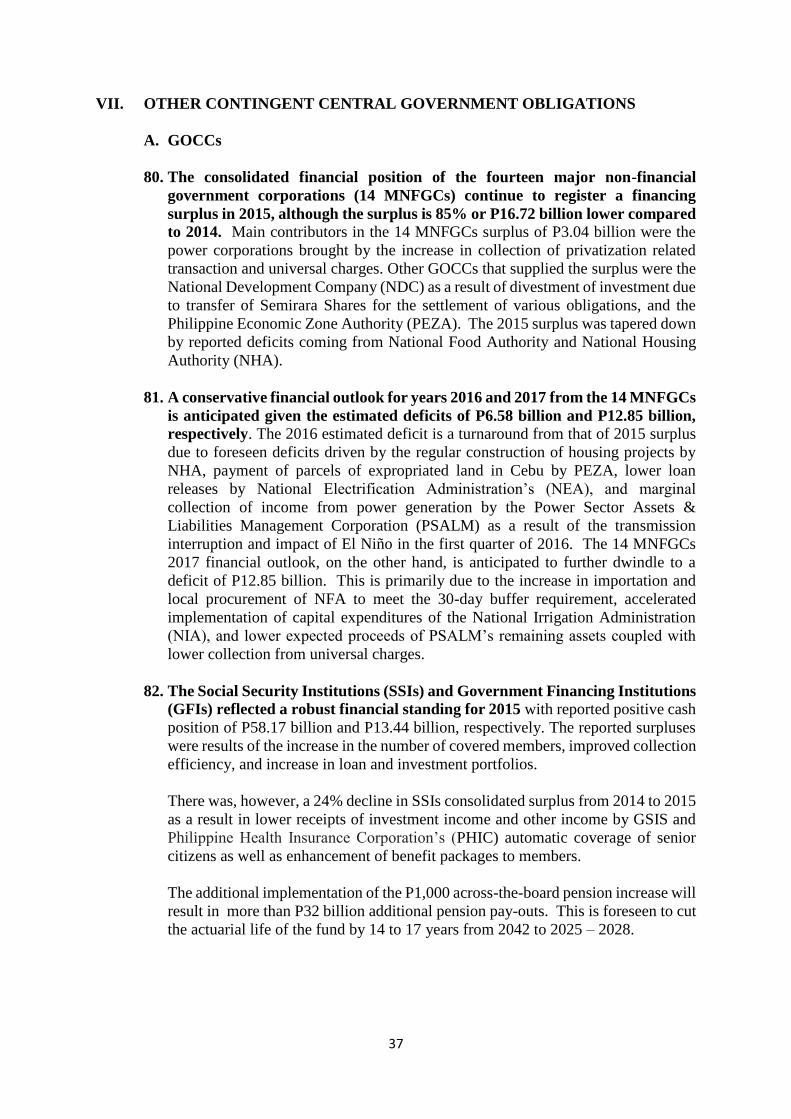
37
VII. OTHER CONTINGENT CENTRAL GOVERNMENT OBLIGATIONS
A. GOCCs
80. The consolidated financial position of the fourteen major non-financial
government corporations (14 MNFGCs) continue to register a financing
surplus in 2015, although the surplus is 85% or P16.72 billion lower compared
to 2014. Main contributors in the 14 MNFGCs surplus of P3.04 billion were the
power corporations brought by the increase in collection of privatization related
transaction and universal charges. Other GOCCs that supplied the surplus were the
National Development Company (NDC) as a result of divestment of investment due
to transfer of Semirara Shares for the settlement of various obligations, and the
Philippine Economic Zone Authority (PEZA). The 2015 surplus was tapered down
by reported deficits coming from National Food Authority and National Housing
Authority (NHA).
81. A conservative financial outlook for years 2016 and 2017 from the 14 MNFGCs
is anticipated given the estimated deficits of P6.58 billion and P12.85 billion,
respectively. The 2016 estimated deficit is a turnaround from that of 2015 surplus
due to foreseen deficits driven by the regular construction of housing projects by
NHA, payment of parcels of expropriated land in Cebu by PEZA, lower loan
releases by National Electrification Administration’s (NEA), and marginal
collection of income from power generation by the Power Sector Assets &
Liabilities Management Corporation (PSALM) as a result of the transmission
interruption and impact of El Niño in the first quarter of 2016. The 14 MNFGCs
2017 financial outlook, on the other hand, is anticipated to further dwindle to a
deficit of P12.85 billion. This is primarily due to the increase in importation and
local procurement of NFA to meet the 30-day buffer requirement, accelerated
implementation of capital expenditures of the National Irrigation Administration
(NIA), and lower expected proceeds of PSALM’s remaining assets coupled with
lower collection from universal charges.
82. The Social Security Institutions (SSIs) and Government Financing Institutions
(GFIs) reflected a robust financial standing for 2015 with reported positive cash
position of P58.17 billion and P13.44 billion, respectively. The reported surpluses
were results of the increase in the number of covered members, improved collection
efficiency, and increase in loan and investment portfolios.
There was, however, a 24% decline in SSIs consolidated surplus from 2014 to 2015
as a result in lower receipts of investment income and other income by GSIS and
Philippine Health Insurance Corporation’s (PHIC) automatic coverage of senior
citizens as well as enhancement of benefit packages to members.
The additional implementation of the P1,000 across-the-board pension increase will
result in more than P32 billion additional pension pay-outs. This is foreseen to cut
the actuarial life of the fund by 14 to 17 years from 2042 to 2025 – 2028.

38
Table 11. Philippines: Consolidated Public Sector Financial Position 2013 -2017
(As percent of GDP, unless otherwise specified)
Particulars
2013
Audited
2014 2015
Prelim
Actual
2016
Revised
2017
Program
Consolidated Public Sector
Financial Position (% to GDP)
In Billion Pesos
0.39%
44.80
0.96%
121.80
0.60%
79.55
-1.53%
(222.84)
-1.95%
(310.65)
Non-Financial Public Sector
Financial Position (% to GDP)
In Billion Pesos
-0.80%
(92.72)
-0.32% (40.86)
-0.85%
(113.49)
-2.59%
(375.68)
-3.02%
(480.79)
Financing Position of 14 MNFGCs
in Billion Pesos
60.87
19.76
3.04
(6.58)
(12.85)
Financing Position of GFIs
in Billion Pesos
15.32
12.53
13.44
15.03
16.03
Financing Position of SSIs
in Billion Pesos
62.49
76.31
58.17
57.89
67.29
83. Financial outlook for years 2016 and 2017. SSIs will maintain its status as a large
government corporation in terms of assets and revenue size. It will continue to
post positive cash flows from their diversified investment portfolio, including
loans to its members.
84. The GFIs remain the major partners of the government in providing priority
sectors access to various credit facilities. GFIs would remain resilient and would
continue to strive for growth and pursue their respective mandate.
To promote and instil fiscal discipline to National Government Agencies (NGAs),
GOCCs, and Local Government Units (LGUs) contribute to the improvement of
judicious cash management, Department Order (DO) No. 001-2015 was issued on
June 1, 2015 to strengthen the Government’s overall fiscal position. It mandated
all NGAs, GOCCs, and LGUs specifically allowed by law, rules, and regulations to
retain income and/or for operations and/or working balances to deposit and maintain
accounts with GFIs with a universal bank license and a CAMELS rating of at least
“3”.
These agencies were granted extension to transfer all funds and cash balance to
compliant banks until June 30, 2017 following the Department Circular (DC) Order
No. 002-2016 signed by Secretary Carlos G. Dominguez on July 8, 2016 to
minimize operational impact among NGAs, GOCCs and LGUs. The extension
allows NGAs, GOCCs, and LGUs to maintain existing accounts with non-
compliant banks but may not increase deposit balances beyond what they were as
of the effectivity of DC No. 002-2016.
85. Total liabilities of the government corporate sector in 2014 amounted to
P3,792.15 billion according to the COA audited reports. Meanwhile, the liabilities
of the 14 MNFGCs represent 39.76% of the total liabilities or equivalent to about
11.91% of the GDP.

39
Table 12. Philippines: Liabilities of the Government Corporate Sector and 14 Major Non-
Financial Government Corporation (MNFGCs), 2014
(in billion pesos, unless otherwise specified)
Particulars Total Liabilities % of GDP
Total GOCCs *
Share of 14 MNFGCs (%)
TOTAL 14 MNFGCs
NPC
TRANSCO
PSALM
PNOC and Subsidiaries
MWSS
NIA
NDC
LRTA
LWUA
NEA
NHA
PNR
PPA
NFA
PEZA
HGC
3,792.15
39.76%
1,507.88
56.55
140.75
824.84
10.52
13.13
108.03
9.84
63.23
7.42
31.09
13.29
26.48
9.00
166.94
1.09
25.68
30.00%
11.91%
0.45%
1.11%
6.52%
0.08%
0.10%
0.85%
0.08%
0.50%
0.06%
0.25%
0.11%
0.21%
0.07%
1.32%
0.01%
0.20% Based on COA Audited Report for 135 GOCCs
Excluding BSP Liabilities of P 4,043.152 Billion
GDP = P12,645.27 Billion
86. National Government (NG) Guarantee. Bulk of the GOCCs borrowings were
covered by NG guarantee through explicit provision in the GOCC charter or
Republic Act (RA) 4860, as amended (Foreign Borrowing Act). In 2015, the
outstanding guaranteed debt to GOCC accounted to 4.11% of GDP, a slight decline
from 4.41% in 2014 (see below table). This is mainly due to the prudent debt
management efforts of the government which resulted in the Philippines having the
capacity to repay debt. The drop in debt burden was also credited partly to the
country’s growing economy.

40
Table 13. Philippines: Outstanding Government Guaranteed Debt to GOCCs,
2014-2015 (in billion pesos)
MNFGCs 2014 2015
PSALM 281.98 267.26
NFA 130.44 136.75
LRTA 5.59 5.42
MWSS 9.79 9.30
PPA 3.77 3.71
LWUA 3.01 2.90
PNR 1.82 1.67
NPC 0.76 0.68
NHA 0.34 0.34
PEZA 0.10 0.10
NEA 0.02 -
GFIs
DBP 53.88 53.77
LBP 19.69 20.91
TIDCORP 1.35 0.90
SBGFC 1.29 1.21
OTHERS
BCDA 19.07 19.43
SBMA 5.39 5.38
MIAA 3.71 3.21
NLRC(NORTHRAIL) 2.16 1.63
Partido 0.20 0.15
TIEZA 0.27 0.26
NHMFC 13.34 12.09
PFDA 0.02 0.01
Total Outstanding Guaranteed Debt 557.98 547.09
% of GDP 4.41% 4.11%
Further, to mitigate the risks arising from guarantees and foreign exchange risk
cover (FXRC) fees on GOCC borrowings, the DOF has issued Department Circular
(DC) No. 001-2016 on April 21, 2016 that promulgates guidelines and procedures
governing the extension of guarantees by the NG for the borrowings of GOCCs and
GFIs. The said DC aims to improve the management of guaranteed debt, recognize
the real cost of a guarantee and FXRC for the NG as it relates to the financial
conditions of GOCCs, and align the guarantee framework to internationally
recognized principle.
87. Annual Net Lending Program (NLP). The NG extends advances for the debt
servicing of the guaranteed GOCCs’ obligations after a thorough assessment of
GOCCs’ need for financial support to pay off the maturing obligation. The
extension of advances/credit by the NG, through the Bureau of the Treasury, to
GOCC for the settlement of maturing obligations, domestic or foreign, as approved
by the Secretary of Finance, is a process observed to mitigate the event of default
on GOCCs’ obligations. Table 14 summarizes the outstanding NG advances to
GOCCs from 2013-2015.

41
Table 14. Philippines: Outstanding NG Advances to GOCCs, 2013 – 2015
(in billion pesos)
Particulars 2013 2014 2015
Of the 14 MNFGCs
PSALM
NIA
NDC
LRTA
NEA
PNR
NFA
HGC
17.40
51.57
4.21
29.13
20.07
22.39
19.34
12.01
19.79
55.12
7.35
31.72
20.14
22.73
19.60
11.60
20.50
58.91
4.89
34.27
20.25
23.36
24.01
11.65
Other GOCCs 25.33 28.71 30.32
TOTAL 201.44 216.78 228.16 Sources: BTr Reports
Major increase in the outstanding NG advances in 2015 included the payment for
NIA’s contractual obligation for the Casecnan Project as well as loan amortizations
of Light Rail Transit Authority (LRTA) and NFA.
Further, reduction of outstanding and future NG advances is foreseen through
implementation of reforms and identification of other sources of repayment from
the GOCCs other than cash.
The government has been continuously formulating policy initiatives that promote
and institutionalize fiscal discipline for the GOCCs and improve prudent NG cash
management. This includes the amendment on Department Circular No. 2-99 to
further strengthen the procedures for setting annual net lending and conversion of
NG advances to equity or subsidies to GOCCs to optimize the process and more
accurately reflect current practice.
88. Budgetary Support to GOCCs. The budgetary flows to the GOCCs are offset by
the revenue generated by the NG in the form of dividend, other fees and shares in
GOCC revenue. In 2015, the total revenue earned by the NG was 33% higher than
2014 due to the increase in the dividend remittances and NG Share on net income
of GOCCs. However, the budgetary supports extended to GOCCs were higher by
about 150% than the total income earned by the NG. As a result, net flows to
GOCCs in 2015 resulted to negative balance of P29.41 billion.
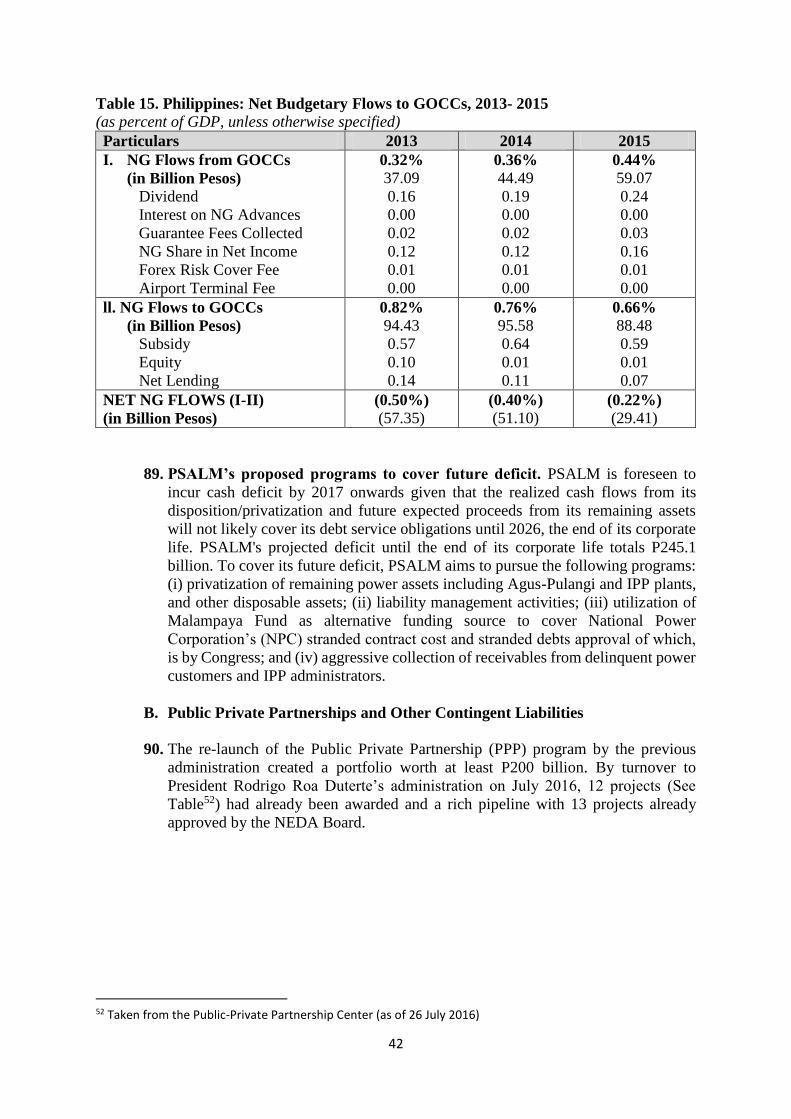
42
Table 15. Philippines: Net Budgetary Flows to GOCCs, 2013- 2015
(as percent of GDP, unless otherwise specified)
Particulars 2013 2014 2015
I. NG Flows from GOCCs
(in Billion Pesos)
Dividend
Interest on NG Advances
Guarantee Fees Collected
NG Share in Net Income
Forex Risk Cover Fee
Airport Terminal Fee
0.32%
37.09
0.16
0.00
0.02
0.12
0.01
0.00
0.36%
44.49
0.19
0.00
0.02
0.12
0.01
0.00
0.44%
59.07
0.24
0.00
0.03
0.16
0.01
0.00
ll. NG Flows to GOCCs
(in Billion Pesos) Subsidy
Equity
Net Lending
0.82%
94.43
0.57
0.10
0.14
0.76%
95.58
0.64
0.01
0.11
0.66%
88.48
0.59
0.01
0.07
NET NG FLOWS (I-II)
(in Billion Pesos)
(0.50%)
(57.35) (0.40%)
(51.10) (0.22%)
(29.41)
89. PSALM’s proposed programs to cover future deficit. PSALM is foreseen to
incur cash deficit by 2017 onwards given that the realized cash flows from its
disposition/privatization and future expected proceeds from its remaining assets
will not likely cover its debt service obligations until 2026, the end of its corporate
life. PSALM's projected deficit until the end of its corporate life totals P245.1
billion. To cover its future deficit, PSALM aims to pursue the following programs:
(i) privatization of remaining power assets including Agus-Pulangi and IPP plants,
and other disposable assets; (ii) liability management activities; (iii) utilization of
Malampaya Fund as alternative funding source to cover National Power
Corporation’s (NPC) stranded contract cost and stranded debts approval of which,
is by Congress; and (iv) aggressive collection of receivables from delinquent power
customers and IPP administrators.
B. Public Private Partnerships and Other Contingent Liabilities
90. The re-launch of the Public Private Partnership (PPP) program by the previous
administration created a portfolio worth at least P200 billion. By turnover to
President Rodrigo Roa Duterte’s administration on July 2016, 12 projects (See
Table52) had already been awarded and a rich pipeline with 13 projects already
approved by the NEDA Board.
52 Taken from the Public-Private Partnership Center (as of 26 July 2016)

43
Table 16. Philippines: List of Awarded Projects
Project
NEDA
Board
Approved
Project Cost
(PHP billion)
NEDA
Board
Approved
Project Cost
(USD
billion)53
Implementing
Agency
Daang Hari-SLEX Link Road54 2.23 0.05 DPWH
PPP for School Infrastructure Project
Phase I55 9.89 0.22 DepEd
NAIA Expressway Phase II Project56 17.93 0.39 DPWH
PPP for School Infrastructure Project
Phase II57 3.86 0.08 DepEd
Modernization of the Philippine
Orthopedic Center58 5.61 0.12 DOH
Automatic Fare Collection System (AFCS) 1.72 0.04 DOTC
Mactan-Cebu International Airport
Passenger Terminal Building 17.52 0.38 DOTC
LRT Line 1 Cavite Extension and O&M59 64.90 1.41 DOTC
Southwest Integrated Transport System
(ITS) Project 2.50 0.05 DOTC
Cavite-Laguna Expressway60 35.43 0.77 DPWH
South Integrated Transport System
Project61 5.20
0.11 DOTC
Bulacan Bulk Water Supply Project 24.41 0.53
MWSS
91. The newly-elected administration of President Duterte has promised to build
upon the success of the PPP program of its predecessor. To achieve this, the
government will accelerate spending, with PPPs playing a key role, to address
critical gaps in infrastructure that would benefit the common Filipino.
53 USD 1 = PHP 46.0 54 Original project cost approved by the NEDA Board on 8 July 2011 was PHP 1.956 billion. The cost increased to PHP 2.23 billion due to the payment for the advance works improvements amounting to PHP 0.050 billion as approved by the ICC-CC on 29 November 2011, and Variation Cost amounting to PHP 0.223 billion 55 Approved Budget Ceiling (ABC) of the Build-Lease-Transfer (BLT) contract is PHP 16.43 billion which
includes PHP 9.891 billion project cost approved by the NEDA Board 56 Original project cost approved by the NEDA Board on 30 May 2012 was PHP 15.86 billion; the cost
increased to PHP 17.93 billion due to the Variation Order amounting to PHP 2.07 billion 57 The original project cost approved by the NEDA Board on 29 November 2012 was PHP 13.14 billion.
However, only two out of the five contract packages were successfully procured amounting to PHP 3.86 billion
58 Project cost does not include the O&M Cash Support amounting to PHP 600 million for the first five (5) years of operation
59 Project cost is inclusive of the PHP 19.83 billion ODA component 60 Project cost does not include the approved minimum bid price amounting to PHP 20.105 billion 61 Project cost includes the cost of the C5-FTI-Skyway Connector Road (access ramp) of PHP 1,198.093 million,
and cost of land

44
92. With the government’s increasing reliance on delivering projects through the
PPP scheme, a growing portfolio would entail higher potential costs in terms
of materializing contingent liabilities. A rough estimate62 of the government’s
contingent liabilities for 2016 is PHP 286 billion for the stock and around PHP 22
billion for the flow.
93. The government has continuously provisioned for potential claims made
against existing PPP projects. In 2014, the Risk Management Program was first
incorporated into the budget under the Unprogrammed Fund with an amount of PHP
20 billion. For both 2015 and 2016, PHP 30 billion each was provisioned in order
to answer for these potential calls. Similarly, the same amount of PHP 30 billion is
proposed for FY 2017.
94. Several reforms to strengthen the overall CL management framework are
being developed by the National Government. In relation to CLs arising from
PPPs, the Technical Working Group on Contingent Liabilities is working on
consistent monitoring of PPP projects, while the Bureau of the Treasury is
improving the valuation of contingent liability stock and flows. With an improved
methodology that should more accurately capture the potential costs of PPPs, the
National Government would be less susceptible to fiscal shocks and would
effectively see the completion of important projects.
95. With respect to NG guarantees to GOCCs, the Bureau of the Treasury
championed the development and adoption of a risk-based methodology in the
computation of guarantee and foreign exchange risk cover fees. This change is
expected to better reflect the actual cost of issuing a guarantee to GOCC obligations.
Moreover, it should aid the government in choosing the type of government support
– whether to provide a guarantee or a subsidy – it should issue to GOCCs.
96. Impact of the PPP Project to LRTA. As a result of the implementation of the
PPP project, LRTA will only have minimal collections of non-rail revenues which
will come from those properties not covered by the Concession Agreement. LRTA
revenue will continue to decline due to the possible concession of LRTA’s line 2 to
the private sector. With LRTA’s Line 1 & 2 operations and maintenance being
concessioned out, a restructuring/reorganization plans is in the offing. The
Department of Transportation (DRR) needs to revisit the role and mandate of rail
entities under its supervision given the current policy on PPP.
97. Meanwhile, several GOCCs/Implementing Agencies of the National
Government are involved in a number of disputes with operators of joint
venture or PPP projects. These cases are at various stages of dispute resolution
and cover a diverse set of claims and possible resolutions. Among others, these
include:
a. Maynilad Water Services, Inc. Maynilad Water is seeking PhP 3.44 billion in
compensation for revenue losses from the non-implementation of tariff
increases for the period January 2013 to February 2015. Additionally, Maynilad
Water is seeking PhP 208 million for every month of delayed implementation.
62 The CL stock and flow estimates above were estimated using a high-level methodology. The amounts could
possibly change as the government is in the process of developing a more reliable valuation procedure.

45
b. Manila Water Company, Inc. Manila Water is seeking compensation for
revenue losses stemming from alleged changes in the implementation of the
water concession agreement. Manila Water is seeking compensation of PhP 572
million for 2015 and PhP 79 billion for the period 2016 to the end of the
concession period.
c. Manila North Tollway Corporation. Manila North Tollway Corporation sent
a Notice of Dispute for non-implementation of the toll rate increases claiming
revenue losses of PhP 2.44 billion.
d. Cavitex Infrastructure Corporation. Cavitex Infrastructure Corporation sent
a Notice of Dispute for non-implementation of the toll rate increases claiming
revenue losses of PhP719 million.
98. The NAPOCOR has a contingent liability amounting to PhP 62 billion, as
demanded by the Ex Officio Sheriffs of the Regional Trial Court of Quezon City,
arising from the case NPC Drivers and Mechanics Association (NPC DAMA) et
al. vs. The National Power Corporation, National Power Board of Directors
(NPB), et al. The case is under appeal.
99. The National Government has contingent liabilities arising from the case filed by
Banco de Oro, Bank of Commerce, China Banking Corp., Metropolitan Bank &
Trust Company, Philippine Bank of Communications, Philippine National Bank,
Philippine Veterans Bank, and Planters Development Bank, holders of 10-year Zero
Coupon Bonds which matured on October 18, 2011. The Supreme Court ordered
payment in the amount of P4,97 billion, which represents the 20% final withholding
tax on the bonds, with legal interest from maturity date. The imposition of legal
interest is under appeal.
C. LOCAL GOVERNMENT UNITS
100. The implementation of Local Government Code (LGC) of 1991 has provided a legal
platform for reconfiguration of the country’s political space to grant LGUs more
autonomy and enable them attain their fullest development as self-reliant
communities. The decentralization vested local governments with political and
fiscal autonomy, but with corresponding responsibility in the delivery of a large
number of basic services such as health, education, agriculture, environment,
natural resources, local public works, etc.
To make decentralization possible, LGUs receive share from the national
government, in the form of Internal Revenue Allotment (IRA) and were given the
authority to levy their own taxes, fees and other revenue sources. Local revenues
are largely sourced from real property taxes, business taxes, fees and charges, and
income from economic enterprises. Through the LGC, local governments were also
authorized borrow, contract loans, credits and other forms of indebtedness with
domestic private and government financial institutions which can be used to finance
capital investment projects.

46
Currently, there are 81 provinces63, 145 cities, 1489 municipalities and 42,036
barangays which serve as the agencies of the national government in the matter of
collection of local taxes, assessment of properties, law enforcement and other public
services. Twenty-five (25) years of implementation of the LGC, but still, local
governments are facing challenges in the practice of functions devolved to them.
Risks/Challenges
101. Gradual increase in locally-sourced revenues (LSR64) dependence indicates
slow growth in LGUs revenue base. While LGUs are vested with taxing powers
and can levy taxes, fees and charges to create their own sources of revenues, revenue
trends shows very minimal increase in the local government units’ LSR as a
proportion of the annual regular income (ARI65). Overall, the share of LGUs tax
and non-tax revenues to regular income or the LSR dependence is 31% in FY
201566.
Among the three LGU types, the Cities are the most self-sufficient having the
highest LSR dependence at 54% which translates that more than half of their ARI
were contributed by the cities’ own revenue source. On the other hand, only 24%
and 22% of the Provinces’ and Municipalities’ ARI, respectively, were contributed
by local sources, with the remaining revenues from central transfers. In case of
provinces, this could be due to their limited taxing powers as compared to the cities
and municipalities.
Despite the recent progress, LGUs have to practice more of their tax administration
power and explore other revenue mobilization options in order to achieve greater
sustainability for more efficient and effective implementation of development plans
and programs.
63 Number of provinces, cities, municipalities and barangays as of January, 2016 64 LSR = Real Property Tax (Basic) + Business Tax + Fees and Charges + Receipts from Economic Enterprises 65 ARI = LSR + IRA (CY) + Others Shares from National Tax Collection + Interest Income 66 Based on FY 2015 SRE reports as of July 7, 2016

47
Figure 5. Dependence in Locally-Sourced Income
Figure 6. Dependence in IRA
102. On the average, IRA has been the biggest source of revenue of LGUs
accounting for 67% of the local government’s regular income. It is evident that
despite the fiscal decentralization, LGUs economic activities still rely on national
government transfers. IRA was created to serve as an augmentation fund to support
the LGUs in the delivery of basic services, however, this is contrary to what
financial report of the LGUs show. For 2015, reports show that IRA remains to be
the main source of funds for provinces and municipalities, having contributed 75%
and 74% of their regular income, respectively. Cities, on the other hand, exhibits
improvement with only 46% dependence on IRA. Conversely, LGUs have not
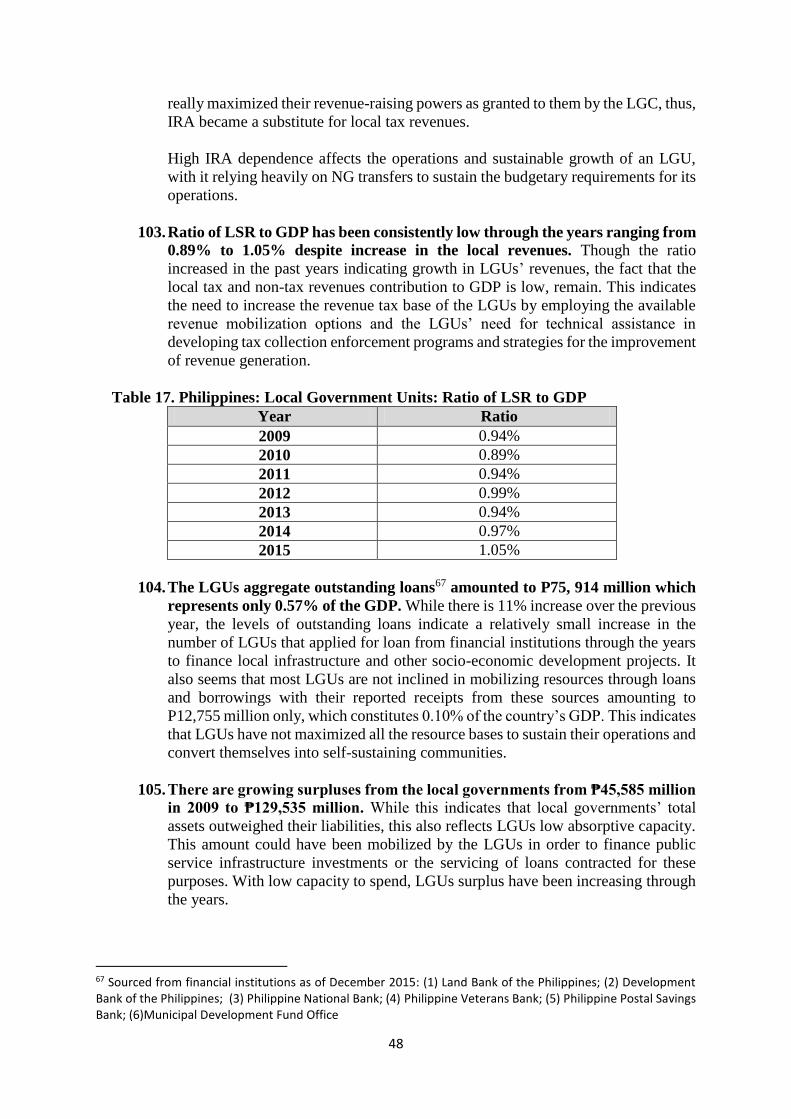
48
really maximized their revenue-raising powers as granted to them by the LGC, thus,
IRA became a substitute for local tax revenues.
High IRA dependence affects the operations and sustainable growth of an LGU,
with it relying heavily on NG transfers to sustain the budgetary requirements for its
operations.
103. Ratio of LSR to GDP has been consistently low through the years ranging from
0.89% to 1.05% despite increase in the local revenues. Though the ratio
increased in the past years indicating growth in LGUs’ revenues, the fact that the
local tax and non-tax revenues contribution to GDP is low, remain. This indicates
the need to increase the revenue tax base of the LGUs by employing the available
revenue mobilization options and the LGUs’ need for technical assistance in
developing tax collection enforcement programs and strategies for the improvement
of revenue generation.
Table 17. Philippines: Local Government Units: Ratio of LSR to GDP
Year Ratio
2009 0.94%
2010 0.89%
2011 0.94%
2012 0.99%
2013 0.94%
2014 0.97%
2015 1.05%
104. The LGUs aggregate outstanding loans67 amounted to P75, 914 million which
represents only 0.57% of the GDP. While there is 11% increase over the previous
year, the levels of outstanding loans indicate a relatively small increase in the
number of LGUs that applied for loan from financial institutions through the years
to finance local infrastructure and other socio-economic development projects. It
also seems that most LGUs are not inclined in mobilizing resources through loans
and borrowings with their reported receipts from these sources amounting to
P12,755 million only, which constitutes 0.10% of the country’s GDP. This indicates
that LGUs have not maximized all the resource bases to sustain their operations and
convert themselves into self-sustaining communities.
105. There are growing surpluses from the local governments from ₱45,585 million
in 2009 to ₱129,535 million. While this indicates that local governments’ total
assets outweighed their liabilities, this also reflects LGUs low absorptive capacity.
This amount could have been mobilized by the LGUs in order to finance public
service infrastructure investments or the servicing of loans contracted for these
purposes. With low capacity to spend, LGUs surplus have been increasing through
the years.
67 Sourced from financial institutions as of December 2015: (1) Land Bank of the Philippines; (2) Development Bank of the Philippines; (3) Philippine National Bank; (4) Philippine Veterans Bank; (5) Philippine Postal Savings Bank; (6)Municipal Development Fund Office

49
Table 18. Philippines: LGUs Debt Data, FY 2009-FY 2015
Particulars 2009 2010 2011 2012 2013 2014 2015
LGUs Loans and
Borrowings68
11,110 13,228 10,586 7,797 10,490 8,587 12,755
Debt Service69
13,087
12,492
14,371 14,688 15,479 16,750
16,171
LGUs Outstanding
Loans70
57,523
68,239
69,899 69,984 70,887 68,115
75,914
LGUs
Surplus/(Deficit)71
45,585 49,185 65,398 53,593 57,550 88,988 129,53
5
Ratio of LGU
Loans and
Borrowings to GDP
0.14% 0.15% 0.11% 0.07% 0.09% 0.07% 0.10%
Ratio of LGUs
Outstanding Loans
to GDP
0.72% 0.76% 0.72% 0.66% 0.61% 0.54% 0.57%
Ratio of LGUs
Surplus(Deficit) to
GDP
0.60% 0.50% 0.67% 0.50% 0.50% 0.70% 0.97%
GDP (in current
price)
8,026,
143
9,003,
480
9,708,
332
10,561,
089
11,538,4
10
12,645,
052
13,307
,357
Note: Amounts is in million pesos
106. Outdated Schedule of Market Values (SMVs) resulting to low Real Property
Tax (RPT) collections and foregone revenues of P18, 579 million. Under the
Local Government Code (LGC) of 1991, provinces and cities are mandated to
update the SMV and to conduct general revision of property assessments and
classification once every three years for more accurate property valuation. Records
show that only 2972 or 36% of the provinces and 29 or 20% of cities uses an updated
SMV for real property valuation. Consequently, local government units’ collection
in RPT (Basic) is relatively low comprising only ₱24,139 million or 17% of the
locally-sourced revenues. It is estimated that local governments could generate
additional ₱18,579 million if SMV will be updated combined with optimized RPT
collection efficiency. Ideally, land-based revenue sources should be the most stable
and major source of LGUs local revenues, if this LGC provision relative to property
valuation is properly implemented partnered with efficient real property tax
assessment.
68 Sourced from SRE reports of LGUs as of January 4, 2016. FY 2015 data is as of 3rd quarter only. 69 LGUs reported debt service payments (Principal and Interest) submitted through the eSRE System. The Principal Cost refers to the Payment of Loan Amortization and Retirement/Redemption of Bonds/Debt Securities while the Interest covers the expenditures for payment of loan principal, interest and other service charges for debts of LGUs. 70 Sourced from government financial institutions as of June 2015: (1) Land Bank of the Philippines; (2) Philippine Veterans Bank; (3) Philippine National Bank; (4) Development Bank of the Philippines; (5) Philippine Postal Savings Bank 71 Adjusted for the Consolidated Public Sector Financial Position (CPSFP) 72Data as of January 2016
50
107. Foregone revenues with the issuance of Executive Order (EO) 173 granting
reduction and/or condonation of real property taxes on independent power
producers (IPPs). LGUs have the power to impose real property tax (RPT) on IPPs
as provided in Section 129 of the RA 7160 however, payment of these taxes have
been contractually assumed by GOCCs. In order to address the possible increase in
power rates or instability in energy prices that this may cause, EO 173 was
implemented to relieve IPPs from payment of fines, penalties and interests such as
deficiency and real property tax liabilities which the local government units collect.
Through the executive order, 80% Assessment Level Rate based on R.A. 7160 was
reduced to 15%.
Considering that RPT is one of the major sources of local revenues of LGUs, the
executive order caused a significant decline in the revenue of LGUs affected by
IPP properties. Estimated revenue loss for the affected LGUs is P9,08173 million
or 90% of the total RPT due computed per RA 7160.
108. Lowered IRA share of the LGUs with the implementation of Republic Act
(RA) No. 10653. RA 10653 provides provision for higher tax-exemption cap on
13th month pay and other benefits from gross income, from P30,000 to P82,000, of
private and public employees. Its implementation shall mean revenue shortfall on
the national internal revenue taxes collection of the BIR which therefore will affect
the IRA being received by the LGUs from the national government.
As stated in Section 284 of the Local Government Code, LGUs shall have 40%
share from the gross internal revenue collection based on the third preceding
calendar year. Although IRA meant to support LGUs in the delivery of basic
services to their constituents, the reduction in the IRA share will adversely affect
the LGUs, particularly the provinces and municipalities with high IRA
dependence.
Risk Mitigation Measures
109. Standardized Examination and Assessment for Local Treasury Service
(SEAL) Program. The Department of Finance, through the Bureau, established a
3-level competency certification system to improve the quality of local treasury
service by requiring examinations and capacity build up interventions for treasurers
and assistant treasurers. The program sets benchmarks on the technical proficiency
and competencies of local treasurers in managing LGU fiscal and financial affairs.
SEAL is comprised of Level 1 (Basic), Level 2 (Intermediate), and Level 3
(Advanced) examinations and assessment mechanisms.
In December 2015, Level 1 or the Basic Competency for Local Treasury
Examination (BCLTE), including Ethics-Oriented Personality Test (EOPT) was
administered nationwide, in cooperation with the Civil Service Commission (CSC).
73 Based on the submitted reports from the LGUs affected by EO 173. (1) Ilocos Sur; (2) San Nicolas, Pangasinan; (3) San Manuel, Pangasinan; (4) Sual, Pangasinan; (5) Pelaway, Nueva Ecija; (6) Pagbilao, Quezon; (7) Batangas City

51
110. Evaluation of the LGUs overall financial management performance through
the LGU Fiscal Sustainability Scorecard (FSS). LGU FSS was institutionalized
to address the minimal contribution of locally sourced income of the LGUs to the
country’s GDP and aims to encourage all LGUs to improve their revenue generation
efforts. The LGUs’ performance are being rated in terms of Financial Indicators
(90%) which includes revenue generation capacity, local collection growth,
expenditure management and Non-Financial Indicators (10%) which are mostly
reportorial compliance. Based on the analysis of the reports for FY 2010 to FY
2012, 17% of provinces, 18% of cities, and 6% of municipalities got failing remarks
for three consecutive years. Given these baseline results, the BLGF anticipates for
better LGU performance rating for FY 2012 to FY 2014 LGU FSS which will be
released in the FY 2016. The LGU FSS of all the provinces, cities and
municipalities are available online via http://iskor.blgf.gov.ph.
The result of the LGU FSS could serve as a basis in policy making process to further
develop the financial management of local governments for them to become self-
reliant and less dependent on national government subsidies, particularly, it could
provide specific areas for improvement, e.g. increase collection from other revenue
source, improve the capacity of local treasurers, and enhance systems.
111. Performance Evaluation of the Local Treasurers and Assistant Treasurers
through the Performance Standards. In line with BLGF’s mandate to supervise
the local treasurers and assistant treasures, Performance Standards was created for
the purpose enhancing the professionalism and competence of local treasurers in
their role as local finance managers so that they may better serve their LGUs and
the public. It consists of the Operational Performance Goals (OPGs) which are
mostly eSRE based standards intended to measure the technical competence of
treasurers and Competency Performance Goals which measure their basic universal
skills.
The preliminary results of the assessment of 2014 performance is already available
and being validated before the official release slated in 2016.
112. Continuous Professional Development (CPD) of Local Assessors through the Continuing Professionalization Education (CPE). The BLGF regularly conducts
CPD courses on valuation accredited by the Professional Regulation Commission:
(1) Philippine Valuation Standards (PVS); (2) Basic Course on Mass Appraisal
(BCMA) and (3) Skills Development in SMV Updating and Conduct of General
Revision. These CPE courses aim to improve the valuation and assessment
operation in the LGUs. In FY 2015, a total of six trainings in SMV Updating were
conducted for local assessors and treasurers.
113. Monitoring of reportorial compliance with the submission of quarterly
electronic Statement of Receipts and Expenditures (eSRE). The DOF requires
all local treasurers to submit quarterly eSRE report which serves as the official
financial report of the LGUs submitted to BLGF’s eSRE System. Aside from
serving as data capturing tool, the system also generates financial indicators to
reflect how well the LGUs funds were managed. Trend shows increase in the timely
submission of eSRE report as compared to the previous years with 99.5%
submission rate for the FY 2015. Failure to comply with the timely and accurate
reporting is critical in the evaluation of financial health of the local government.

52
114. Inclusion of the Philippine Extractive Industries Transparency Initiative (PH-
EITI) Data Requirements in the Electronic Statement of Receipts and
Expenditures (eSRE) System. Part of the country’s commitment to EITI Standard
is the thrust towards transparency and good governance in the natural resources
management. LGUs as the host to mining sites, oil, gas fields, and other extractive
industries, plays a critical role in the EITI implementation in the country.
To be able to capture the data on extractive industries at the local level, the PPEI
and EITI, in coordination with the BLGF, initiated the development of Environment
and Natural Resources Data Management Tool (ENRDMT). The ENRDMT further
promotes transparency and accountability through data and information
management at the local level leading to appropriate budget allocation for their
revenue shares in the national wealth.
Pursuant to DOF DO 49-201674, starting FY 2017, the annual submission of LGUs’
eSRE report shall include PH-EITI data requirement.
D. NATURAL DISASTERS
Impact of Disasters to the Philippine Economy
115. On average, the Philippines is being hit by twenty (20) typhoons and tropical
depressions annually and these resulted in production losses and disruptions in
economic activity. Between 2011 and 2015, 94 typhoons visited the country. This
is 9.3% more than the number of typhoons during 2006-2010. Moreover, the
cumulative cost of damages from typhoons has almost tripled to reach Php242.9
billion in 2011-2015 compared to the previous 5 years. Overall, disasters can negate
the gains in the growth process of the country and create additional cost to the
government, which must ensure that the poor and the vulnerable sectors of society
are protected.
74 Inclusion of Environment and Natural Resources Data in the Electronic Statement of Receipts and Expenditures System for Local Treasurers

53
Table 19. Philippines: Impact of Disasters on the Economy, 2015
Disaster/Event
(Dates of
Occurrence)
Affected
Regions
Direct
Damage
and Loss
(in
PhPMn)
Indirect
Loss
(in
PhPMn)
Total
Damage
and Losses
(in
PhPMn)
Direct
Damage
and Loss
(% of
GDP)
Indirec
t Loss
(% of
GDP)
Total
Damag
e and
Losses
(% of
GDP)
Impac
t to
GDP
ALL TYPHOONS 31,958.43 7,712.09 39,670.52 0.241 0.058 0.299 -0.200
Typhon Ineng
(18Aug-08Sept)
CAR, 1, 2,
3, 4A, & 4B 4,473.27 308.29 4,781.56 0.034 0.002 0.036 -0.025
Typhoon Lando
(14Oct -19Oct)
NCR,CAR,
1, 2, 3, 4A,
& 5
13,316.55 2,123.11 15,439.66 0.100 0.016 0.116 -0.083
Typhoon Nona
(12Dec-19Dec)
3, 4A, 4B,
5, & 8 14,168.60 5,280.70 19,449.30 0.107 0.040 0.146 -0.092
i. Figures on direct damage and loss were based on NDRRMC Situational Report No. 23, 5:00 PM, 08 September 2015
(Ineng); No. 26, 6:00 AM, 03 November 2015 (Lando), and No. 19, 6:00 AM, 24December 2015 (Nona).
ii. Direct damage to property and infrastructure includes immovable objects or property such as buildings, roads, bridges,
houses and other infrastructure, as well as damages to economic installations like power, transportation and
communication, machinery, equipment, damage to farmlands, irrigation systems including the destruction of crops to
harvest.
iii. Direct production losses takes into account lost inventory of goods such as agricultural products, finished goods and raw
materials for production, among others.
iv. Indirect costs represent the current value of goods and services that were and will not be produced or rendered over a
time span due to the disaster such as interrupted business operations due to power and water shortages as well as
suspension of work. Other examples are the losses of future harvests due to flooding or prolonged droughts, losses in
industrial production.
v. Details may not add up to total due to rounding.
116. In 2015 for instance, total damages to infrastructure and agriculture, including
indirect economic loss, from the three major typhoons (namely Ineng, Lando, and
Nona) reached PhP 39.67 billion, or about 0.30 percent of GDP. This is estimated
to have reduced the country’s real GDP growth by 0.20 percentage point. Typhoon
Nona contributed the biggest share of damages and losses estimated at PhP
19.45billion, affecting Regions 3, 4A, 4B, 5, and 8. Typhoon Lando on the other
hand, has combined damages and losses amounting to PhP15.44 billion affecting
Regions NCR, CAR, 1, 2, 3, 4A, and 5 in October 2015 (see Table 14).
Reforms, Mitigating Measures and Policy Directions on Disaster Risk and Reduction
Management (DRRM)
117. The national DRR policy direction is guided by the Sendai Framework for Disaster
Risk Reduction (SFDRR) 2015 – 2030, which is the global framework for DRR,
adopted by 187 UN Member States including the Philippines in March 2015.
The SFDRR has four priorities of actions, namely: (a) understanding disaster risk,
(b) strengthening disaster risk governance to manage disaster risk, (c) investing in
DRR for resilience, and (d) enhancing disaster preparedness for effective response
and to “Build Back Better” in recovery, rehabilitation and reconstruction. DRR
policy directions will also align with relevant Sustainable Development Goals.
In addition, the National Government is in the process of reviewing the
implementation of Philippine Disaster Risk Reduction and Management Act of
2010 for possible enhancement of the law.
54
118. The year 2015 saw the adoption of four international documents which laid out
plans of action and set targets in addressing complex issues regarding international
development: Addis Ababa Action Agenda under the Financing for Development,
2030 Sustainable Development Agenda and the Paris Agreement under the United
Nations Framework Convention on Climate Change. Such actions underscore the
need for the widest possible international cooperation among developed and
developing countries, especially on climate change.
119. In 2016, the V20 Group has welcomed the addition of 23 developing countries
which are systematically susceptible to the havocs of climate change. The V20
Body agreed on implementation plans aimed at mobilizing significant levels of
finance to fund climate actions which include the following among others:
innovations in climate finance, implementation of carbon pricing regimes, creation
of Financial Transaction Tax. Acknowledging the role of the private sector in
implementing such reforms, the Finance Ministers agreed on the creation of a
platform for collaboration between the public and private sectors. In addition, the
Body has also divided the members into three focus groups to work on the
following: inclusion of climate change costs in public and private accounting,
raising awareness of V20 goals in the international financial system and setting-up
of a V20 Risk Pooling Mechanism.