fiscal sustainability of national food security act, 2013 ... 332 - krishanu p pradhan_proof.pdf ·...
TRANSCRIPT

Fiscal Sustainability ofNational Food Security Act,2013 in India
Krishanu Pradhan

ISBN 978-81-7791-188-6
© 2014, Copyright Reserved
The Institute for Social and Economic Change,Bangalore
Institute for Social and Economic Change (ISEC) is engaged in interdisciplinary researchin analytical and applied areas of the social sciences, encompassing diverse aspects ofdevelopment. ISEC works with central, state and local governments as well as internationalagencies by undertaking systematic studies of resource potential, identifying factorsinfluencing growth and examining measures for reducing poverty. The thrust areas ofresearch include state and local economic policies, issues relating to sociological anddemographic transition, environmental issues and fiscal, administrative and politicaldecentralization and governance. It pursues fruitful contacts with other institutions andscholars devoted to social science research through collaborative research programmes,seminars, etc.
The Working Paper Series provides an opportunity for ISEC faculty, visiting fellows andPhD scholars to discuss their ideas and research work before publication and to getfeedback from their peer group. Papers selected for publication in the series presentempirical analyses and generally deal with wider issues of public policy at a sectoral,regional or national level. These working papers undergo review but typically do notpresent final research results, and constitute works in progress.

FISCAL SUSTAINABILITY OF NATIONAL FOOD SECURITY ACT,
2013 IN INDIA
Krishanu Pradhan∗
Abstract Forward looking approach to fiscal sustainability generally seeks to assess the fiscal implication of expected program specific expenditure in future. In this regard, the paper attempts to assess the future fiscal implication of National Food Security Act (NFSA), 2013 in India. The results, under baseline scenario based on projected debt/GDP ratio shows modest increase in it till 2021-22, and then declines towards the current level of 70% in 2012-13 and hence signify fiscal sustainability. The dynamics of projected baseline debt/GDP ratio is largely shaped by the provisions in the Act and underlying demographic factors to be experienced by India during the projection horizon. The sensitivity analysis under different assumptions about productivity growth, interest rate on government borrowing and primary deficits/GDP ratio show mixed results and hence provide necessary policy implication to restore fiscal sustainability under the Act. Keeping the primary deficits/GDP ratio below 1.5% by way of periodic upward revision of issue price of food grains, as envisaged in the Act, coupled with higher productivity growth and lower interest on government debt would ensure long-term fiscal sustainability of the Act. Key Words: GDP, Food Subsidy, Budget Deficits, Fiscal Projection, Budget deficits,
Demographic Transition and Food Security. JEL Code: E01, H24, H62, H68, J11 and Q18.
1. Introduction Fiscal sustainability is a multi-dimensional concept. It incorporates government solvency, stable and
robust growth, buoyant and stable tax regimes, capacity to absorb adverse macroeconomic shock, and
generational equity (OECD, 2009). There are different approaches to define and assess the long-term
fiscal sustainability in a country. For example, solvency of government and stability of key deficits and
debt indicators are two desirable requirement of fiscal sustainability. Solvency requires that government
should repay all its liabilities either in finite or infinite future in a dynamically efficient economy1. It
crucially depends on currency composition, ownership pattern and maturity profile of debt, and overall
macroeconomic health. Stability implies the debt/GDP ratio or deficits/GDP ratio is either to fall or
remain constant over the time to ensure macro objectives like growth and stabilization. In generational
accounting framework, a fiscal policy is sustainable if the estimated ‘generational imbalance’ is non-
positive. In the budget forecasting models, a fiscal policy is sustainable when the forecasted debt/GDP
ratio does not explode in the context of projected revenues and expenditures or programme specific
expenditures or reforms.
∗ Research Scholar at Centre of Economics Studies and Policy, Institute for Social and Economic Change (ISEC),
Bangalore -72, India. Email: [email protected]
The present paper is based on the author’s ongoing PhD at ISEC under the supervision of Prof M R Narayana under the ICSSR Institutional Doctoral Fellowship scheme.
Grateful thanks are due to Dr Elumalai Kannan for valuable comments and suggestions on the paper. In addition, I sincerely acknowledge the anonymous referee whose comments and suggestions have been instrumental in revising this paper. However, the usual disclaimer applies.
1 Cost of borrowing (r) on government debt strictly not less than growth rate of economy (g) i.e. r≥g.
2
However, in practice the assessment of fiscal sustainability mainly focuses on either the
backward looking or forward looking indicator analysis (UK’s HM Treasury Report, 2008). Assessment
based on backward looking analysis focuses on time series analysis of historically given information on
important fiscal and macro variables. Applying time series econometric techniques, the stationary
properties of discounted or undiscounted debt and deficits series, or co-integration between
government revenue/GDP and expenditures/GDP series, or the functional response of primary
surplus/GDP to the debt/GDP ratio overtime are checked. It implicitly assumes the continuation of
historical trends and patterns of the relevant variables and empirical results in future, and accordingly
addresses the issue of fiscal sustainability (Hamilton and Flavin, 1986, Wilcox 1989, Buiter and Patel,
1992; Bohn, 1998 and Afonso, 2005). A major limitation of the backward looking analysis is that it
focuses on past and says nothing about the future sustainability of fiscal policy. The forward-looking
analysis focuses on the comprehensive projection of future expenditures and revenues of government
and their impact on future debt and deficits. As forward looking analysis focuses on projection of
important fiscal and macroeconomic variables, it entails wide-ranging indicators like demographic
changes, productivity, and growth of GDP, interest rate on government borrowing, and impact of
expected program specific expenditures.
In the present context, an attempt is made to assess the fiscal implication of National Food
Security Act (NFSA), 2013. To maintain the spirit of forward looking approach to fiscal sustainability in
India, the present study is focused to assess the future fiscal implication of the Act. The concern of
fiscal sustainability of the Act haunts the policy makers in India due to the gigantic financial burden of
existing food security system in India. The combined Central and State government spending on
existing food subsidy as a share of total revenue deficits exceeded 25% during 2004-05 to 2011-122.
Similarly, the share of spending on food subsidy in total primary revenue expenditures and revenue
receipts of combined Central and State governments stood at 4.5% and 4.1% respectively during 2004-
05 to 2011-12, and the ratio of food subsidy to GDP has far exceeded 1% mark since 2008-09
(Government of India, 2013). Hence, it necessitates to study whether the provisions and
implementation of the Act would be fiscally sustainable in India. However, in the present context, we
define that the Act would be fiscally sustainable3, if its implementation does not cause the debt/GDP
2 In the absence of data on effective revenue deficits (ERD), a new deficit concept introduced in Union government
budget since 2009-10, for combined Central and State governments, the share of Central government spending on food subsidy in its ERD stood at 38% in 2010-11. If, before the implementation of NFSA, 2013, total food subsidy burden (including State government spending on it) were financed from Central budget, the computed ratio of food subsidy to Central ERD would have been at 41% in 2010-11.
3 Determining optimum or sustainable level of debt/GDP ratio is difficult. It depends on variety of factors like taxable capacity, currency composition, maturity and ownership structure of debt, and overall macro health, which vary from country to country. In the absence of such clearly defined sustainable level, current level of debt/GDP ratio has been considered as a measure of ‘benchmark’ in present context. The rational of such consideration is the need to assess how much extra pressure the implementation of NFSA would exert to cause the debt/GDP ratio to grow or not grow from current level. However, grateful thanks are due to the referee for suggesting to shed some light and discussion on the issue of optimum or sustainable level of debt/GDP ratio and then to assess the fiscal implication of the Act.
3
ratio to grow from the current level of 70% (Revised Estimate) in 2011-12 (Government of India, 2013)
explosively during the projection horizon from 2013-14 to 2030-314.
Pioneering research on empirically examining the future sustainability of public debt based on a
particular fiscal structure in global context can be found in Chouraqui et.al (1986), Blanchard (1990),
Auerbach (1994), HM Treasury Report of UK (2008), Fiscal Sustainability Report (2011) of government
of Canada and Miller et.al (2011) for Latin American countries. Most of the above studies made
projection of GDP based on projected population, labour force participation, labour productivity and
international migration. Based on GDP projection, revenue and expenditure have been projected using
baseline value of revenue/GDP and expenditure/GDP to derive baseline primary deficits/GDP ratio. For
sensitivity analysis, expenditure/GDP has been projected based on expected reforms, mainly because of
population ageing, growing social security burden etc. As the projection of debt/GDP ratio crucially
depends on primary deficits/GDP ratio, borrowing cost to finance deficits and GDP growth rates,
different hypothetical interest rates on borrowing, GDP or productivity growth rates and primary
deficits/GDP ratio have been assumed in the studies to provide necessary policy prescriptions.
In Indian context, the official reports like Reports of Taskforce on Implementation of the Fiscal
Responsibility and Budget Management (FRBM) Act (2003) in 2004, Report of Twelfth Finance
Commission (2004a), and Report of Thirteenth Finance Commission (2010) mostly provide medium term
projection of key fiscal variables on the specific objectives entrusted to them. Individual researchers like
Pattnaik et.al (2004) projected key fiscal variables to assess sustainability of India’s fiscal policy with
respect to fiscal rules like FRBM Act for Central government and Fiscal Responsibility Legalization (FRL)
for State governments. Rangarajan and Srivastava (2005) projected debt/GDP ratio from 2004-05 to
2036-37 based on policy simulation. Assuming nominal GDP growth of 12% and fiscal deficits/GDP ratio
of 6% of combined Central and State governments under FRBM Act for Central government and under
FRL for State governments, they have shown that debt/GDP ratio will stabilize around at 60% by 2036-
37. According to them, in longer-term, India will achieve sustainable debt/GDP ratio if the high growth
continues and fiscal reforms started both by Centre and State governments are implemented effectively.
Using the integrated methodology of the National Transfer Accounts and Budget Forecasting Model,
Narayana (2012) forecasted the impact of population ageing on India’s public finance from 2005
through 2050, based on the fiscal structure in 2004–2005. The results showed that forecasted share of
total public expenditure on elderly individuals increases largely accounted for expenditure on civilian
pensions and other cash transfers, government services, and poverty and other social protection.
Overall, elderly individuals are found to be not very expensive in terms of public health expenditure. Tax
revenues increase results in a decline of debt-to-GDP ratio because population ageing does not lower
tax buoyancy in the long run. Overall, the increasing total budget surplus and fiscal support ratio
implied that the long-term impact of population ageing might be fiscally sustainable.
4 The period is considered to have a medium-term perspective of assessing the fiscal implication of the Act from the
viewpoint of policy makers. The long-term projection (generally 50 years or more) is based on several assumptions about the relevant variables and estimated parameter values under study, and any change in the assumptions or the estimated parameter value would dramatically change the results and implications. Moreover, without accommodating numerous policy changes and possible future reforms due to the reality of political business cycles in a country like India, the long-term projection might end up as a hollow technical exercise.

4
Based on the key objective and review of literature, the focus of the study is to project
debt/GDP ratio of combined Union and State governments from 2013-14 to 2030-31 in order to assess
the fiscal impact of NFSA (2013) under a baseline scenario. Towards this end, sensitivity analysis is
carried out with respect to different productivity growth, interest rates and primary deficits to provide
essential policy guidelines.
Organization of rest of the paper is as following. Section.2 briefly describes the salient features
of the NFSB, 2011 and the NSFA, 2013 and their differences. Section.3 depicts the analytical framework
to assess the fiscal implication of NFSA, 2013, while Section.4 presents the description, measurement
and data sources of different variables. Section.5 is devoted to the baseline values of required variables
like GDP growth, borrowing cost, primary deficits/GDP ratio under baseline scenario. Section.6 illustrates
the projection of additional financial burden of NFSA, 2013 and its baseline fiscal impact on projected
debt/GDP ratio. Section.7 highlights the subsequent sensitivity. The major conclusions and implications
are in Section.8.
2. Salient Features of NFSB, 2011 and NFSA, 2013 The National Food Security Bill (NFSB), 2011 introduced in Indian parliament has been a paradigm shift
in the discourse on addressing the issue of food security – from the currently welfare based approach to
right based approach. The main objective of the Bill is to provide highly subsidized food grain to around
67% of country’s 1.24 billion populations (2011 Census figures). The provisions of the Bill would be
perhaps the biggest ever experiment in the world to distribute subsided food grain to ensure food and
nutritional security. The Bill provides legal entitlement to receive food grain at subsidized prices by the
persons belonging to priority household (PHH) and general household (GHH) under the targeted public
distribution scheme. The other provisions of the Bill are to provide guaranteed nutritional supports to
special groups like – pregnant and lactating mother (PLM); children aged 6 months to 6 years and 6
years to 14 years, destitute and homeless persons, people affected by disaster, calamities and people
living under starvation. The NFSB, 2011 could not become Act due to longstanding debate and
discussion in Indian parliament over the identification of PHH and GHH, the perceived differences in
providing subsidized food grains and differential allocation to the PHH and GHH. Subsequently, the
NFSB, 2013 after having resolved the contentious issues of NFSB, 2011 was introduced again in Indian
parliament for debate and discussion. The NFSB, 2013 has removed the concept of PHH and GHH, and
instead has merged the GHH into PHH to simplify the identification of beneficiaries. The individuals or
the beneficiaries indentified under PHH are entitled to receive, per month, 5 kg of food grains at a price
of Rs. 3, Rs. 2 and Rs. 1 for rice, wheat and coarse grains respectively. The individuals of Antyodaya
Anna Yojana (AAY) households will receive additional 10 kg per month to protect their existing
allocations (i.e. 7 kg, per month/persons, means total 35 kg subsidized food grains). Rest of the
provisions under the NFSB, 2013 to other and special groups remain broadly same as mentioned in
NFSB, 2011. The Indian parliament passed the NFSB, 2013 in its present form to make it Act on 12th
September 2013, and named it as National Food Security Act (NFSA), 2013. The detailed provision of
entitlements for different group of population under NFSB, 2011 and NFSA, 2013 is provided in Table.1.
The long-term feasibility of NFSA, 2013 broadly depends on three distinct issues – fiscal burden,

5
operational challenges and ramification on Indian agriculture in implementing the provisions of the Act
in full spirit (Basu, 2011 and Galati et.al, 2012). However, the focus of the present study is the
assessment of the fiscal burden of the Act under study. The fiscal burden is the additional expenditures
over and above the existing spending on different food and nutritional security programmes. Assuming
other things remaining the same, the question in this context is how it would affect the debt/GDP ratio
in future years if the additional financial burden of the Act is debt financed,
Table 1: Provision of entitlements for different group of population under NFSB, 2011 and
NFSA, 2013.
Provisions to PHH and GHH under NFSB, 2011 Modification under NFSA, 2013
PHH GHH Coverage under PHH AAY HH
Food grain entitlement
7 kg per person per month
3 kg per person per month
5 kg per person per month
7 kg per person per month
Price
Not exceeding Rs. 3 per kg for rice, Rs. 2 per kg for, Rs. 1 per kg for coarse grains
Not exceeding 50% of the MSP for wheat & coarse grains; not exceeding 50% of derived MSP for rice.
Not exceeding Rs. 3 per kg for rice, Rs. 2 per kg for, Rs. 1 per kg for coarse grains
Not exceeding Rs. 3 per kg for rice, Rs. 2 per kg for, Rs. 1 per kg for coarse grains
Periodic revision of issue price (IP) No mention of periodic revision of IP
Mention to revise IP after three years of implementing the Act, i.e. after 2016.
Coverage – Rural Population – 75%, Urban Population - 50%
At least 46% of rural population. At least 28% of urban population
Up to 29% of rural Population. Up to 22% of urban population
It will cover 75% of rural and 50% of urban population including the existing 2.5 crore AAY households or 12.5 crore AAY individuals.
Provisions for Nutritional Security and Entitlements to Others and Special Groups
Other Target Groups Entitlements under NFSB, 2011 and NFSA, 2013
Pregnant and Lactating mother (PLM)
Meal free of charges during pregnancy and six months after child birth, calories 600 kcal and protein 18-20 gm. Maternity benefits of Rs. 1000 per months for a period of six months
Children 6 months to 3 years Take home ration calories 500 kcal and 12 to 15 gm protein
Children 3 years to 6 years Morning snacks and hot cooked meals calories, 500 kcal and 12 - 15 gm protein
Children 6 months to 6 years who are malnourished Take home ration calories 800 kcal and 20 -25 gm protein
Lower primary classes Hot cooked meals, calories 450 kcal and 12 gm protein
Upper primary classes Hot cooked meals, calories 70 kcal and 20 gm protein
Special Groups Entitlements under NFSB, 2011 Entitlements under NFSA, 2013
Destitute Persons At least one meal everyday free of change
There is no detailed definitions of these special groups, but the Act mentions special focus on ‘destitute’, ‘vulnerable’ ‘disabled’ ‘needy’ and people living in ‘remote’, ‘hilly’ and other areas which are difficult to access to ensure their food security.
Homeless persons Affordable meals at community kitchen Emergency and disaster affected persons.
Two meals free of charges for a period of 3 months from the date of disaster.
Persons living in starvation
Free meals two times in a day for 6 months from the date of identification.
Source: NFSB, 2011 and NFSB, 2013 as introduced in Lok Sabha, the respective Bill no. 132 of 2011 and 109 of 2013

6
3. Analytical Framework
To project debt/GDP ratio, the following simple framework is developed. Let, Dt and Dt-1 be the stock of
debt at period t and t-1. Yt, gt, rt and PDt be the nominal GDP, its annual growth rate, interest rate on
government borrowing (i.e. bond yield), and primary deficits at period t, respectively. We know that
change in stock of debt at period t, denoted, as ∆Dt (i.e. Dt – Dt-1) is the amount of borrowing called
fiscal deficit is defined as the sum of primary deficits at period t and interest payments on the stock of
debt in previous period, t-1. Thus, we have,
∆Dt = Dt – Dt-1 = rtDt-1 + PDt (1)
Rearranging eq. (1), we get Dt = (1+rt ) Dt-1 + PDt (2)
Dividing eq. (2) by GDP, the resultant equation can be re-written as
dt = {(1+rt)/(1+gt)}dt-1 + pdt (3)
Thus, to project debt/GDP ratio (i.e. future path of dt in eq. 3), we need projected information
on rt, gt and pdt, as the debt/GDP ratio in previous year (i.e. t-1) is currently known. Future dynamics of
debt/GDP ratio depends on how the aforementioned elements evolve in future.
To assess the fiscal implication of NFSA, 2013, we need to evaluate whether the additional
expenditures over and above the existing expenditure on food security and other welfare schemes like
Mid Day Meal (MDM) and Integrated Child Development Scheme (ICDS) would be sustainable or not. In
other words, whether additional expenditure on account of NFSA, 2013, would have make debt/GDP
ratio to grow explosively in future or not. Accordingly, the eq. (3), is modified as
dt = {(1+rt)/(1+gt)}dt-1 + pdt + xt (4)
where xt is the additional expenditure/GDP over and above the existing spending on food
security and other welfare schemes because of the NFSA, 2013. Without xt, the pdt in (3) takes into
account the existing spending on food security and other welfare schemes. Thus, the sum of pdt and xt
in eq. (4) can be called as modified primary deficits/GDP ratio because of NFSA, 2013. In this context, it
can be pointed out that so long pdt remains positive (i.e. deficits), xt would be financed by debt or
borrowing5. Thus, apart from projecting, rt, gt, pt, we need to project the value of xt to evaluate the
fiscal implication of NFSA, 2013.
5 The future value of xt can be affected by several factors. The most important is the change in issue price, which is
subject to review after three years as per the Act, and any short fall in production of food grain causing import and escalating the cost of implementing the Act in spirit. In present context, primary deficits (PD) or fiscal deficits (FD) are more important than revenue deficits (RD) to project the debt/GDP ratio and to assess the additional fiscal burden of the Act. Thus, so long PD or FD is positive, any additional spending on account of implementing the Act would be debt financed. However, the referee has rightly pointed that if the revised roadmap for fiscal consolidation under FRBM is achieved by 2016-17 and ongoing subsidy reforms (eliminating petroleum and diesel subsidies) might cause the RD to be zero, but not necessarily the PD or FD. Though, the spending to implement the Act is considered as revenue expenditure, in present context, it is treated as part of total expenditures including revenue expenditures, and hence is part of PD or FD. However, grateful thanks are due to the referee for providing an elaborate discussion and comments on this aspect.

7
4. Data and Variable Descriptions Table.2 summarizes the description, measurement and data sources of different fiscal and non-fiscal
variables used to compute the additional financial burden of NFSA, 2013 and projection of debt/GDP
ratio under different scenarios to assess the fiscal implication of the Act.
Table 2: Variable description, measurement and data sources for
projection of debt/GDP ratio
Variable Measurement Data Source (s)
Nominal interest rate on government borrowing
Average of long-term government bond yield with maturity of 10 years or more of Union and State governments, and effective average interest on government borrowing defined as the ratio of interest paid in a year to the stock of debt in previous year from 1999-2000 to 2009-2010.
RBI Handbook of Statistics on Indian Economy, 2012
Growth rate of productivity (i.e. technical progress)
Average annual growth rate of GDP at constant prices per worker, using 2005 purchasing power parity (PPP) over the period 2000-2005 and 2005-2010.
Asian Productivity Organization (2012), APO Productivity Data book.
Inflation rate
Wholesale Price Index (WPI) based inflation assumed at 5% per annum based on Reserve Bank of India’s upper limit of comfort level of inflation.
Not Applicable
GDP Gross Domestic Product at current market prices (base year 2004-05)
RBI Hand Book of Statistics on Indian Economy, 2012
Total Outstanding debt stock
Liabilities position of Central and State government at the end of March 2013.
Indian Public Finance Statistics, Government of India, 2013
Total government revenue
Combined revenue receipts of Central and State governments
Various issues of Indian Public Finance Statistics since 1995 to 2012, Government of India
Total government expenditures
Combined revenue and capital expenditure of Central and State governments
Food Subsidy Average share of expenditure to GDP incurred by Central and State governments on food subsidy, Mid-Day Meal (MDM) and Integrated Child Development Scheme (ICDS) since 2007-08 to 2011-12.
Indian Public Finance Statistics since 1995 to 2013 by Government of India and www.indiastat.com
Spending on Mid-Day Meal
Spending on ICDS
AAY beneficiaries Number of AAY HH or individuals as identified by Central and State government as available in 2012
www.indiastat.com
Projection of growth of labour force
Growth of population in the age group 15 to 64 for India from 2013-14 to 2030-31.
UN’s Population Division, World Population Prospects, The 2010 Revision.
Projection of Rural and Urban PHH population
Projection of Rural and Urban population for India from 2013-14 to 2030-31 to determine the number of people intended to be identified under PHH category based on NFSA, 2013 definition.
UN’s Population Division, World Urbanization Prospect, The 2011 Revision.
Projection of Pregnant and Lactating Mother (PLM)
Projection of childbearing age female population in age group 15 to 49. Estimated ratio of PLM to total child bearing age female population in 2012 by Kannan (2012) is used to project the number of PLM from 2013-14 to 2030-31.
UN’s Population Division, World Population Prospects, The 2010 Revision and Kannan (2012).

8
Projection of Malnourished Children (MC) in age group 6 months to 6 years
Estimated ratio of MC in age group 6 months to 6 years to total number of child population in the same age group in 2011 by Kannan (2012) is used to project the number of MC from 2013-14 to 2030-31.
UN’s Population Division, World Population Prospects, The 2010 Revision and Kannan (2012)
Projection of Children in the age group 6 to 14 years
Due to lack of data on number of children with age group 6 years to 14 years, the child population with age group 5 to 14 years is used as proxy.
UN’s Population Division, World Population Prospects, The 2010 Revision
Destitute and Homeless and such other persons.
Estimated ratio of number of such people to total population in the Census of 2011 by Kannan (2012)
Kannan (2012)
Food grain required for Pregnant and Lactating Mother
Yearly estimate of food grain needed to supplement the nutritional requirement of every pregnant and lactating mother by Kannan (2012).
Kannan (2012)
Food grain for children in age 6 months to 6 years, including MC and children with age 6 to 14 years
Yearly estimate of food grain needed to supplement the nutritional requirement for every child in each group of children by Kannan (2012).
Kannan (2012)
Food grain required for Destitute, Homeless and etc.
Yearly estimate of food grain needed for such people by Kannan (2012).
Kannan (2012).
Source: Author
5. Baseline projected values of GDP growth, interest rate and
primary deficits/GDP To assess the fiscal implication of the NFSA, 2013, we need projected information on nominal GDP and
its growth rate, interest rate, primary deficits/GDP ratio and additional spending over and above the
spending on existing food security and other welfare schemes.
5.1. Nominal GDP
To project growth of real GDP, we need to assume that the economy stays in steady state as the
growth of GDP can be inferred from the growth rate of employment and labor productivity (Government
of Canada 2010). To project real growth rate of GDP, the following equations are used.
Y = (Y/L).L (5)
where Y = real GDP, L = labour employment and (Y/L) = average labor productivity.
Expressing eq. (5) in growth rate form we have,
(dY/dt)/Y = (dy/dt)/y + (dL/dt)/L (6)
where y = Y/L. Eq. (6) states that the growth rate of real GDP (Y) is equal to the sum of
growth rate of labor productivity and growth rate of employment. To project GDP growth rate from
2013-14 to 2030-31, we need to have projected growth rate of labor productivity and employment
growth. Growth rate of employment has been projected based on projected workforce for India from
2013-14 to 2030-31 by the UN Population Division – The 2010 Revision. For labor productivity growth,
the ‘Asian Productivity Organization (APO) Productivity Data Book – 2012 has been used. The average

9
of labor productivity growth as reported by the APO (2012) during 2000-2005 to 2005-2010 has been
assumed to remain fixed at 5.5% during the projection period. The nominal GDP growth rate is
obtained by adding the wholesale price index (WPI) inflation at 5% per annum to real GDP growth rate.
Table 3: Projected real GDP growth and nominal GDP (2010-11 to 2030-31)
Year
Labor productivity growth rate
(%)
Growth rate of employment
(%)
Real GDP Growth rate (%)
Average WPI inflation
(%)
Nominal GDP Growth
rate (%)
2013-14 to 2014-15 5.5 1.74 7.24 5 12.24
2015-16 to 2019-20 5.5 1.4 6.9 5 11.9
2020-21to 2024-25 5.5 1.2 6.7 5 11.7
2025-26 to 2029-30 5.5 1.01 6.51 5 11.51
2030-31 5.5 1.01 6.51 5 11.51 Source: Author’s computation based on UN Population Division – 2010 Revision and Asian Productivity
Organization’s Productivity Data Book – 2012 data.
5.2. Interest rate
One method of projecting interest rates on government borrowing is the decadal average of bond yield
of Central and State governments taken together. An alternative method of projecting interest rate is
the computation of long run average of effective interest rates defined as the ratio of total interest
payment in a year to the total stock of debt in previous year. In India, automatic monetization of deficit
ceased to exist in 1997-98, and since then cost of borrowing has been largely market determined. Due
to growing importance of long-term debt financing as an important objective of debt management
policy in India, it is logical to expect that the average of Central and State governments long-term bold
yield and effective average interest rate would converge. This argument gets support when one
computes the decadal average of bond yield and effective average interest rate, which stood at 8.3%
and 8.07% respectively during 1999-2000 to 2009-10. There are arguments in favor of effective interest
rate, as it is neutral to the maturity structure of debt. The bond yield, even if it is long-term, varies
depending on maturity structures, currency composition, liquidity and other factors. However, bond
yield figures indicate soundness of fiscal health and creditworthiness of government, which might not be
possible to know from a simple computation of effective interest rates on government debt. Given these
premise, it is reasonable to assume that the average of effective interest rates and long-term bond yield
from 1999-2000 to 2010-11 would remain constant during the projection period at 8.2%.
5.3. Primary Deficits/GDP
Primary deficits are the difference between the fiscal deficits and interest payments. Interest payments
depend on the stock of debt and its future path is determined by the interest rate on existing debt and
on fresh borrowing to finance deficits. However, in Section 5.2, the average interest rate on government
borrowing is assumed to be around 8.2% per annum during the projection period. Thus, the exercise
left is the primary deficits/GDP ratio, which is the difference between non-interest expenditures and

10
total non-debt creating revenue and capital receipts. Therefore, to project the primary deficits/GDP
ratio, it is important to focus on the different components of non-debt creating receipts and non-interest
expenditures.
Table.4 provides a detailed summary of different components of revenue, spending and deficits
as percentage of GDP. In revenue structure, tax and non-tax sources of revenue, on an average
contributed to around 86% and 14% of total revenue receipts from 1990-91 to 2010-11 in India, as
revealed in Table.4. Indirect tax and direct tax contributed respectively around 77% and 33% to total
tax revenue during the same period. However, contribution of direct and indirect tax have changed over
the years. A substantial increase in direct tax buoyancy during 1991-95 to 2006-10 has occurred due to
almost a three-fold jump in personal income tax and corporate tax collection. However, there was a
decline in contribution of indirect tax during the same period due to reduction in customs revenue
resulting from the WTO led reforms and rationalization of customs tariffs. The average tax/GDP from
1990-91 to 2009-10 stood around 15%. The collection of both the taxes depends on the tax base (i.e.
GDP) and tax rates. The high revenue buoyancy of direct tax reflected in the higher contribution of
income tax and corporate tax during 2005-06 to 2009-10 is unlikely to hold in future as argued by the
report of Thirteenth Finance Commission (2010). It is likely to be moderated in future due to
moderation in GDP growth in recent years and ongoing direct tax reforms in the form of Direct Tax
Code (DTC) which seek to simplify tax laws, reduce tax rates and compliance cost will increase
exemption limit of income tax, and reduction in corporate tax rates. The Committee on Roadmap for
Fiscal Consolidation (Government of India; 2012) in its report supported the above view and expressed
concern about the revenue loss from implementation of DTC. Given this premise, it is reasonable to
assume that the direct tax to GDP ratio during the projection horizon to be around 4.6% which is the
average of direct tax to GDP ratio from 2000-01 to 2009-10.
Similarly, for indirect tax, there is likely to be slight reduction in the contribution of customs
revenues due to phasing out of protectionism and a move towards ASEAN (Association of South East
Asian Nations) tariff level in the coming years (Government of India; 2004b). Besides, there is an
ongoing reform in indirect taxes in the form of Goods and Service Tax (GST). Being revenue neutral in
principle, the GST is expected to stabilize the collection of indirect taxes. However, according to
Thirteenth Finance Commission report, implementation of GST would boost the overall revenue in
coming years. Thus, higher revenue buoyancy of GST would compensate or outweigh the fall in
customs revenue. Based on this, it is reasonable to assume that during projection horizon contribution
of indirect taxes would be around 11.2% of GDP, which is the average contribution since 1900-91 to
2009-10. The non-tax revenue would maintain or increase its contribution around 2.64% of GDP, which
is the average contribution since 2000-01 to 2009-10, due to growing importance on disinvestment and
higher realization of dividends from the public sector undertaking in recent years.
While looking at the expenditure side, total expenditures are classified into revenue and capital
expenditures. To determine primary deficits, it is more important to focus on the non-interest revenue
expenditures and capital expenditures. There are numerous components under non-interest
expenditures. The most notable are spending on defense, compensation of employees, pensions and
other retirement benefits, major subsidies and others. It is extremely difficult to project each and every

11
item separately. Moreover, considering the objective, scope and simplicity of this study, it has not
attempted to project each and every component of non-interest expenditure items6. However, for
projection purposes, the average of non-interest revenue expenditure to GDP ratio, which stood at
16.8% during 2005-06 to 2009-10, is assumed to remain constant during the projection horizon.
Ongoing expenditure reforms, especially by Central government to limit subsidies (elimination of
petroleum and diesel subsidies in recent times), targeting the intended beneficiaries and direct cash
transfers to reduce wastage, and other efforts to reduce non-plan expenditures would certainly exert
downward pressure on total non-interest spending. However, experience shows that attempts to cut
Central government expenditures have been mostly sporadic in nature and does not cause any
substantial decline in total expenditures7. Given such experience, it is only natural to peg the average
ratio of non-interest expenditures to GDP at 16.8% during the projection horizon.
Table 4: Average of revenues, expenditures and deficits as a percentage of GDP for
Combined Central and State Governments (1990-91 to 2009-10)
1990-91
to 1994-95
1995-96 to
1999-00
2000-01 to
2004-05
2005-06 to
2009-10
2000-01to
2009-10
1995-96 to
2009-10
1990-91 to
2009-10Total Revenue 16.61 16.26 16.93 19.24 18.09 17.48 17.26
Tax 14.57 13.7 14.58 16.46 15.52 14.91 14.83
of which Direct Tax 2.45 2.86 3.59 5.6 4.60 4.02 3.63
Income tax 1.02 1.21 1.45 1.91 1.68 1.52 1.40
Corporate tax 1.13 1.36 1.96 3.51 2.74 2.28 1.99
Indirect Tax 12.12 10.84 10.99 10.86 10.93 10.90 11.20
Customs 2.99 2.63 1.83 1.78 1.81 2.08 2.31
Union Excise 3.89 3.11 3.45 2.35 2.90 2.97 3.20
Service tax N.A 0.09 0.23 0.9 0.57 0.41 0.41
State excise 0.83 0.71 0.72 0.74 0.73 0.72 0.75
State Sales Tax/VAT 3.15 2.88 3.4 3.56 3.48 3.28 3.25 Stamp and Registrations Fee 0.41 0.44 0.52 0.69 0.61 0.55 0.52
Non-Tax 2.61 2.41 2.61 2.67 2.64 2.56 2.58
Total Expenditures 25.27 24 25.78 26.14 25.96 25.31 25.30 of which Total Defense 2.4 2.21 2.25 2.05 2.15 2.17 2.23
Defense (Revenue) 1.67 1.62 1.56 1.26 1.41 1.48 1.53
Interest payments 4.65 5.07 6 5.17 5.59 5.41 5.22 Employee Compensations N.A N.A 6.82 6.36 6.59 N.A N.A
Pension & Other retirement benefits 0.98 1.3 1.7 1.73 1.72 1.58 1.43
Social Security and Welfare benefits 0.64 0.69 0.63 0.99 0.81 0.77 0.74
6 Grateful thanks are due to referee for commenting to provide some explanations on why the ratio of non-interest
spending to GDP is fixed at 16.8% during the projection horizon. 7 For reference, see Premchand and Chattopadhay (2002), NIPFP WP # 3.
12
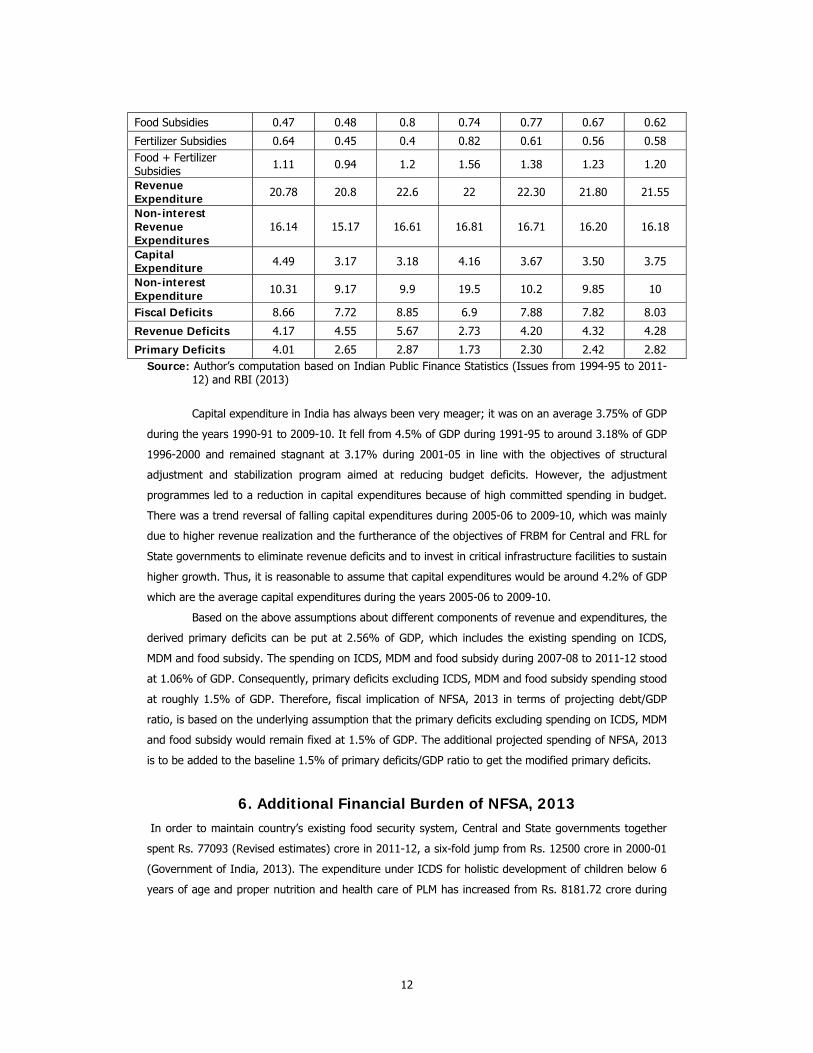
Food Subsidies 0.47 0.48 0.8 0.74 0.77 0.67 0.62
Fertilizer Subsidies 0.64 0.45 0.4 0.82 0.61 0.56 0.58 Food + Fertilizer Subsidies 1.11 0.94 1.2 1.56 1.38 1.23 1.20
Revenue Expenditure 20.78 20.8 22.6 22 22.30 21.80 21.55
Non-interest Revenue Expenditures
16.14 15.17 16.61 16.81 16.71 16.20 16.18
Capital Expenditure 4.49 3.17 3.18 4.16 3.67 3.50 3.75
Non-interest Expenditure 10.31 9.17 9.9 19.5 10.2 9.85 10
Fiscal Deficits 8.66 7.72 8.85 6.9 7.88 7.82 8.03
Revenue Deficits 4.17 4.55 5.67 2.73 4.20 4.32 4.28
Primary Deficits 4.01 2.65 2.87 1.73 2.30 2.42 2.82 Source: Author’s computation based on Indian Public Finance Statistics (Issues from 1994-95 to 2011-
12) and RBI (2013)
Capital expenditure in India has always been very meager; it was on an average 3.75% of GDP
during the years 1990-91 to 2009-10. It fell from 4.5% of GDP during 1991-95 to around 3.18% of GDP
1996-2000 and remained stagnant at 3.17% during 2001-05 in line with the objectives of structural
adjustment and stabilization program aimed at reducing budget deficits. However, the adjustment
programmes led to a reduction in capital expenditures because of high committed spending in budget.
There was a trend reversal of falling capital expenditures during 2005-06 to 2009-10, which was mainly
due to higher revenue realization and the furtherance of the objectives of FRBM for Central and FRL for
State governments to eliminate revenue deficits and to invest in critical infrastructure facilities to sustain
higher growth. Thus, it is reasonable to assume that capital expenditures would be around 4.2% of GDP
which are the average capital expenditures during the years 2005-06 to 2009-10.
Based on the above assumptions about different components of revenue and expenditures, the
derived primary deficits can be put at 2.56% of GDP, which includes the existing spending on ICDS,
MDM and food subsidy. The spending on ICDS, MDM and food subsidy during 2007-08 to 2011-12 stood
at 1.06% of GDP. Consequently, primary deficits excluding ICDS, MDM and food subsidy spending stood
at roughly 1.5% of GDP. Therefore, fiscal implication of NFSA, 2013 in terms of projecting debt/GDP
ratio, is based on the underlying assumption that the primary deficits excluding spending on ICDS, MDM
and food subsidy would remain fixed at 1.5% of GDP. The additional projected spending of NFSA, 2013
is to be added to the baseline 1.5% of primary deficits/GDP ratio to get the modified primary deficits.
6. Additional Financial Burden of NFSA, 2013 In order to maintain country’s existing food security system, Central and State governments together
spent Rs. 77093 (Revised estimates) crore in 2011-12, a six-fold jump from Rs. 12500 crore in 2000-01
(Government of India, 2013). The expenditure under ICDS for holistic development of children below 6
years of age and proper nutrition and health care of PLM has increased from Rs. 8181.72 crore during

13
2009-10 to Rs. 111768 crore during 2011-12. Similarly, under MDM, the expenditure has increased
substantially from Rs. 5835 crore in 2007-08 to Rs. 99029 core in 2012-13. Thus, while computing the
additional cost of implementing the Act, one should take care of the program specific spending under
existing food security and welfare schemes, because the question of fiscal sustainability of the Act
essentially depends on whether additional expenditure under the Act would be fiscally sustainable or not
in terms of debt/GDP ratio criterion.
To project the future expenditure for different beneficiary groups under the Act, we need to
have the number of intended beneficiaries in future, and the associated costs for each group of
beneficiaries. Based on the Act, Table.1 provides information about different targeted and beneficiary
groups and their entitlement. The computation of financial burden of different targeted groups under
the Act is performed in the following steps.
First, compute the projected number of beneficiaries under PHH in rural and urban areas
including AAY households, children in the age group of 6 months to 6 year and 6 years to 14 years,
pregnant and lactating mother, destitute, homeless and such other such needy persons as per the
provision of the NFSA, 2013, and their corresponding food grain requirement and cash subsidy.
Second, compute the aggregate financial burden as per the NFSA, 2013 entitlement and arrive
at the additional fiscal-financial burden.
Key assumptions for the above computations are given below.
6.1. Assumptions
(1) The NFSA, 2013 coverage of 75% of rural and 50% of urban population including the existing 2.5
crore AAY households in 2012 to remain fixed till the projection period.
(2) The Issue Price (IP) of food grain to PHH and AAY households to remain fixed till the end of
projection. Subsidy of providing food grain is the difference between Economic Cost (EC), which
includes Minimum Support Price (MSP), storage, transportation etc., and the IP. Therefore, subsidy
is equal to EC – IP. Based on the assumption of Gulati et.al (2012), the EC of rice and wheat is
assumed to increase by 10% annually till the projection horizon. The share of rice and wheat off
take through PDS based on Gulati et.al (2012) study at 58% and 42% is to remain same.
(3) The estimate of per year per capita food grain requirement for children in age group from 6 months
to 6 years including MC and 6 to 14 years as estimated by Kanna (2012) to remain fixed.
(4) The estimate of ratio of PLM to the female population in childbearing age from 15 to 49 years
based on Census-2011 and per year per capita food grain requirement of PLM as estimated by the
Kannan (2012) to remain the same.
(5) The proportion of destitute and homeless population in total population based on as Census-2011 is
arrived at 0.26% to remain fixed till the end of projection of horizon.
8 http://www.indiastat.com/table/socialandwelfareschemes/27/financialprogressunderintegratedchilddevelopment
servicesicdsscheme19912014/449688/540283/data.aspx (accessed on 16/11/2014). 9 http://mdm.nic.in/Union%20Budgetary.html (accessed on 03/24/2014)
14
Based on the above assumptions and the detailed provision of entitlement to different targeted
group of population as defined by the Act, Table.5 provides the details of financial burden.
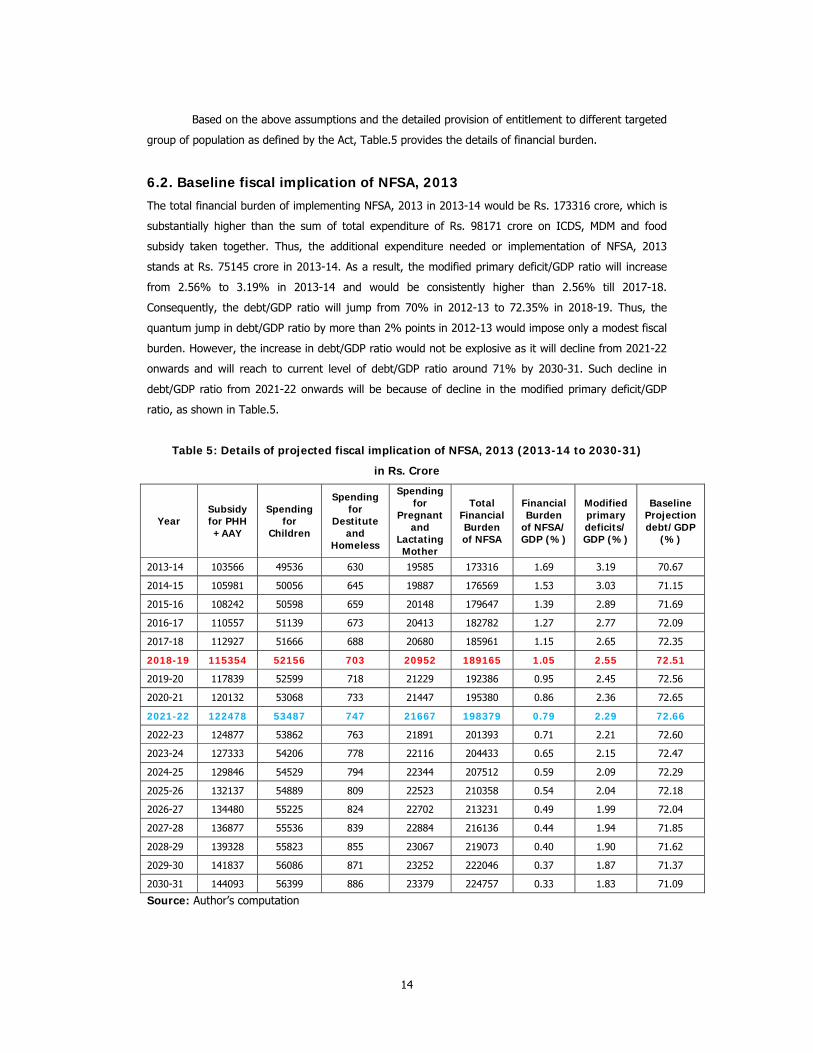
6.2. Baseline fiscal implication of NFSA, 2013
The total financial burden of implementing NFSA, 2013 in 2013-14 would be Rs. 173316 crore, which is
substantially higher than the sum of total expenditure of Rs. 98171 crore on ICDS, MDM and food
subsidy taken together. Thus, the additional expenditure needed or implementation of NFSA, 2013
stands at Rs. 75145 crore in 2013-14. As a result, the modified primary deficit/GDP ratio will increase
from 2.56% to 3.19% in 2013-14 and would be consistently higher than 2.56% till 2017-18.
Consequently, the debt/GDP ratio will jump from 70% in 2012-13 to 72.35% in 2018-19. Thus, the
quantum jump in debt/GDP ratio by more than 2% points in 2012-13 would impose only a modest fiscal
burden. However, the increase in debt/GDP ratio would not be explosive as it will decline from 2021-22
onwards and will reach to current level of debt/GDP ratio around 71% by 2030-31. Such decline in
debt/GDP ratio from 2021-22 onwards will be because of decline in the modified primary deficit/GDP
ratio, as shown in Table.5.
Table 5: Details of projected fiscal implication of NFSA, 2013 (2013-14 to 2030-31)
in Rs. Crore
Year Subsidy for PHH +AAY
Spending for
Children
Spending for
Destitute and
Homeless
Spending for
Pregnant and
Lactating Mother
Total Financial Burden of NFSA
Financial Burden
of NFSA/ GDP (%)
Modified primary deficits/ GDP (%)
Baseline Projection debt/GDP
(%)
2013-14 103566 49536 630 19585 173316 1.69 3.19 70.67
2014-15 105981 50056 645 19887 176569 1.53 3.03 71.15
2015-16 108242 50598 659 20148 179647 1.39 2.89 71.69
2016-17 110557 51139 673 20413 182782 1.27 2.77 72.09
2017-18 112927 51666 688 20680 185961 1.15 2.65 72.35
2018-19 115354 52156 703 20952 189165 1.05 2.55 72.51
2019-20 117839 52599 718 21229 192386 0.95 2.45 72.56
2020-21 120132 53068 733 21447 195380 0.86 2.36 72.65
2021-22 122478 53487 747 21667 198379 0.79 2.29 72.66
2022-23 124877 53862 763 21891 201393 0.71 2.21 72.60
2023-24 127333 54206 778 22116 204433 0.65 2.15 72.47
2024-25 129846 54529 794 22344 207512 0.59 2.09 72.29
2025-26 132137 54889 809 22523 210358 0.54 2.04 72.18
2026-27 134480 55225 824 22702 213231 0.49 1.99 72.04
2027-28 136877 55536 839 22884 216136 0.44 1.94 71.85
2028-29 139328 55823 855 23067 219073 0.40 1.90 71.62
2029-30 141837 56086 871 23252 222046 0.37 1.87 71.37
2030-31 144093 56399 886 23379 224757 0.33 1.83 71.09
Source: Author’s computation

15
7. Sensitivity Analysis The fiscal implication of NFSA, 2013 is sensitive to the key assumptions on productivity growth rate,
interest rates on government borrowing and primary deficits/GDP ratio. We assume that the inflation
rate is fixed at benchmark year (5%) and simulate the projected debt/GDP ratio for alternative values of
primary deficits/GDP ratio (1.25% and 1.75%), productivity growth rates (5% and 6%) and interest
rates on government borrowing (8.5%). The results of simulated debt/GDP ratio are presented in Table.
6. For given values of productivity growth rate and interest rate, assigning lower primary deficits than
baseline would lower projected debt/GDP ratio and vice-versa. On the other hand, for a given value of
primary deficits/GDP ratio, assigning lower productivity growth rate and higher interest rate on
borrowings would be detrimental in terms of higher projected debt/GDP ratio and vice-versa.
Table 6: Projection of debt/GDP ratio under different values of productivity growth (P),
interest rate (r) and primary deficits/GDP (pd)
Source: Author’s computation
A lower primary deficits/GDP ratio (1.25%) than the baseline value (1.5%) is assumed due to
the ongoing fiscal reforms to augment revenue and to contain unproductive and non-plan-non-
developmental expenditures by Central government in recent times. Moreover, the provision in the Act
for an upward revision of the issue price of food grains after 2015-16 would dispel the fear as expressed
by some prominent researchers like Gulati.et.al, (2012) that the cost of implementing the Act would
Year Projected debt/GDP for
alternative primary deficits/GDP
Projected debt/GDP for alternative interest rate, productivity growth
rate and primary deficits/GDP P =5.5, r = 8.2,
pd =1.25 P = 5.5, r = 8.2,
pd =1.75 P =5, r = 8.5,
pd =1.25 P = 6, r = 8.5,
pd= 1.25 2013-14 70.42 70.92 71.01 70.30
2014-15 70.66 71.64 71.83 70.44
2015-16 70.97 72.42 72.69 70.64
2016-17 71.14 73.04 73.39 70.70
2017-18 71.18 73.52 73.96 70.65
2018-19 71.13 73.89 74.39 70.49
2019-20 70.97 74.14 74.71 70.25
2020-21 70.86 74.43 75.07 70.04
2021-22 70.68 74.64 75.33 69.77
2022-23 70.43 74.76 75.50 69.43
2023-24 70.12 74.82 75.61 69.04
2024-25 69.76 74.81 75.65 68.60
2025-26 69.48 74.89 75.76 68.25
2026-27 69.16 74.91 75.82 67.85
2027-28 68.81 74.88 75.83 67.42
2028-29 68.43 74.82 75.80 66.97
2029-30 68.02 74.72 75.73 66.49
2030-31 67.59 74.59 75.63 66.00
16
jump substantially in the years to come. Therefore, such provision in the Act would certainly reduce the
financial burden and keep the primary deficits under check. In contrast, fiscal slippage due to political
compulsions for not revising the issue price upwardly, as conceded for AAY beneficiaries to keep the
issue price fixed since 2002, or inclusion of more beneficiaries and more generous provisions under the
Act as demanded by the National Advisory Council (NAS) in 2011 as part of the comprehensive food
security right, higher primary deficits/GDP ratio (1.75%) than the baseline value are considered. The
results show that, for lower primary deficits at 1.25% of GDP, the projected debt/GDP ratio would
increase slightly till 2020-21 and would fall below current level thereafter. However, the higher primary
deficits would have explosive effects on debt/GDP ratio and make public debt unsustainable. Therefore,
containing the primary deficits/GDP ratio below 1.5% of GDP is imperative if the Act is to be fiscally
sustainable in future.
Finally, Table.6 presents figures on whether a higher interest rate (8.5%) with lower (5%) and
higher (6%) productivity growth than baseline and fiscal reforms (pd = 1.25%) would be fiscally
sustainable or not. The results show that higher interest rate and lower productivity growth, even with
fiscal reforms, would not be enough to restore the fiscal sustainability if the NFSA, 2013 is implemented.
However, a higher productivity growth (6%) with higher interest rates and fiscal reforms would be
fiscally sustainable.
8. Major Conclusion and Implications The major conclusions of the study are as following.
Firstly, the fiscal implication of NFSA, 2013 under baseline scenario does not show
explosive growth of debt/GDP ratio till the end of projection horizon 2030-31 and hence the Act might
be fiscally sustainable. However, projection of debt/GDP ratio under implementation of the Act shows
modest increase in it till 2021-22 and a decline towards the level of debt/GDP ratio in 2012-13. The
dynamics of projected debt/GDP ratio under baseline scenario is mainly shaped by the provisions of the
Act and underlying demographic changes to be experienced by India during the projection horizon.
Decline in child population both in absolute numbers as well as in share of total population, would
substantially reduce the future fiscal burden of the Act. Growing rural to urban migration will cause a
decline in the ratio of intended beneficiaries under PHH category to total population from about 67% in
2013-14 to roughly about 64% in 2030-31. Such a demographic transition would reduce the modified
primary deficits/GDP ratio and its beneficial impact on projected debt/GDP ratio would ensure fiscal
sustainability.
Secondly, the projections of debt/GDP ratio under different scenarios of sensitivity
analysis shows mixed results about the fiscal implication of NFSA, 2013. Out of four types of sensitivity
analysis results, two indicate towards fiscal unsustainability and hence provide necessary inputs for
policy recommendations. The results of sensitivity analysis suggests that if the Act is to be fiscally
sustainable, necessary policy corrections like periodic upward revision of issue price of food grains to
keep primary deficits below 1.5% of GDP are required while maintaining productivity growth rate at
5.5% and interest rate below 8.5%. Any fiscal slippage due to political compulsion for not revising the
issue prices or more generous provision and inclusion of more beneficiaries as demanded by the

17
National Advisory Council (NAC) in 2011 would pose challenges to the implementation of the Act in full
spirit. .
References Afonso, A (2005). Fiscal Sustainability: The Unpleasant European Case. FinanzArchiv/Public Finance
Analysis, 61 (1): 19-44.
Asian Productivity Organization (2012). APO Productivity Data book, Tokyo, Japan, Available at
http://www.apo-tokyo.org/files/ind_APO_Productivity_Databook_2012.pdf (Accessed on
24/12/2012).
Auerbach, A J (1994). The U.S. Fiscal Problem: Where we are, how we got here, and where we’re
going. National Bureau of Economic Research, Macroeconomic Manual, Cambridge. Pp 141-75.
Basu, K (2011). India’s Food grain Policy: An Economic Theory Perspective. Economic and Political
Weekly, 46 (5): 37-45.
Blanchard O, J C Chouraqui, R P Hagemann and N Sartor (1990). The Sustainability of Fiscal Policy:
New answer to an old question. OECD Economic Studies, 15: 7-36.
Bohn, H (1995). The Behavior of US Public Debt and Deficits. Quarterly Journal of Economics, 113 (3):
949-63.
Buiter, W H and U R Patel (1992). Debt, Deficits and Inflation: An Application to the Public Finances of
India. Journal of Public Economics, 47 (2): 171-205.
Chouraqui, J C, B Jones and R B Montador (1986). Public Debt in a Medium-term Perspective, OECD
Economic Studies, 7: 103-39.
Giammarioli, N, C Nickel, P Rother and J P Vidal (2007). Assessing Fiscal Soundness: Theory and
Practice. Occasional Paper Series # 56, European Central Bank.
HM Treasury (2008). Long-term Public Finance Report: An analysis of Fiscal Sustainability. HM Treasury,
United Kingdom (UK).
Government of Canada, (2010). Estimating Potential GDP and the Government Structural Budget
Balance. Available at http://www.pbo-dpb.gc.ca/files/files/Publications/Potential_CABB_EN.pdf
(accessed on 08.09.12).
————— (2011). Fiscal Sustainability Report 2011. Ottawa, Canada: Parliamentary Budget Officer.
Available at http://www.parl.gc.ca/pbo- dpb/documents/FSR_2011.pdf (accessed on
08.09.12).
Government of India (2000). Report of the Eleventh Finance Commission.
————— (2004a). Report of the Twelfth Finance Commission.
————— (2004b). Report of Task Force on Implementation of the FRBM Act.
————— (Various issues). Indian Public Finance Statistics, Various Issues from 1995 to 2013. New
Delhi: Ministry of Finance, Department of Economic Affairs.
————— (2010). Report of the Thirteenth Finance Commission.
————— (2011). National Food Security Bill, 2011.
————— (2013). National Food Security Bill, 2013.

18
Gulati, A, J Gujral and T Namdakumar (With other associates) (2012). National Food Security Bill
Challenges and Options. Discussion Paper No. 2, New Delhi: Commission for Agricultural Costs
and Prices.
Kannan, E (2012). Issues related to Target Population and Entitlements under National Food Security
Bill. Paper presented at the Seminar on National Food Security Bill, organized by Indian School
of Political Economy, Pune, India.
Miller, T, C Mason and M Holz (2011). The Fiscal Impact of Demographic Change in Ten Latin American
Countries: Projecting Public Expenditures in Education, Health, and Pensions. In Daniel Cotlear
(ed), Population Aging Is Latin America Ready?. The World Bank, Washington DC. Pp. 233-73.
Narayana, M R (2012). Impact of Population Ageing on India’s Public Finance: New Evidence and
Implications. Asian Population Studies, 8: 301-26.
OECD (2009). The Benefits of Long-term Fiscal Projections. OECD Policy Brief.
Pattnaik, R K, A Prakash and Mishra, B S (2004). Sustainability of Public Debt in India: An Assessment in
the context of Fiscal Rules. Paper presented at the Banca d’Italia Workshop held in Rome. Pp
679-735.
Premchand, A and S Chattopadhyay (2002). Fiscal Adjustment and Expenditure Management. NIPFP,
Working Paper No. 3.
Rangarajan, C and D K Srivastava (2005). Fiscal Deficits and Government Debt: Implications for Growth
and Stabilization. Economic and Political Weekly, 4 (27): 2919-34.
RBI (2012). Interest Rates on Central and State Governments’ Dated Securities. RBI Handbook of
Statistics on Indian Economy.
UN Population Division (2011). World Population Prospects: The 2010 Revision. Department of Social
and Economic Affairs, Population Division.
UN Population Division (2012). World Urbanization Prospects: The 2011 Revision. Department of Social
and Economic Affairs, Population Division.
Web link: www.indiasta.com
State-wise Number of Identified Families under Antyodaya Anna Yojana (AAY) (Initial and Additional) in
India (As on 03/04/2012). Accessed on 01/10/2013.
State-wise Funds Release under Integrated Child Development Scheme (ICDS) (General) and
Supplementary Nutrition Programme (SNP) in India (up to 30.09.2012). Accessed on
01/10/2013.

271 Decentralisation and Interventions inHealth Sector: A Critical Inquiry into theExperience of Local Self Governments inKeralM Benson Thomas and K Rajesh
272 Determinants of Migration andRemittance in India: Empirical EvidenceJajati Keshari Parida and S Madheswaran
273 Repayment of Short Term Loans in theFormal Credit Market: The Role ofAccessibility to Credit from InformalSourcesManojit Bhattacharjee and Meenkashi Rajeev
274 Special Economic Zones in India: Arethese Enclaves Efficient?Malini L Tantri
275 An Investigation into the Pattern ofDelayed Marriage in IndiaBaishali Goswami
276 Analysis of Trends in India’s AgriculturalGrowthElumalai Kannan and Sujata Sundaram
277 Climate Change, Agriculture, Povertyand Livelihoods: A Status ReportK N Ninan and Satyasiba Bedamatta
278 District Level NRHM Funds Flow andExpenditure: Sub National Evidence fromthe State of KarnatakaK Gayithri
279 In-stream Water Flows: A Perspectivefrom Downstream EnvironmentalRequirements in Tungabhadra RiverBasinK Lenin Babu and B K Harish Kumara
280 Food Insecurity in Tribal Regions ofMaharashtra: Explaining Differentialsbetween the Tribal and Non-TribalCommunitiesNitin Tagade
281 Higher Wages, Cost of Separation andSeasonal Migration in IndiaJajati Keshari Parida and S Madheswaran
282 Pattern of Mortality Changes in Kerala:Are they Moving to the Advanced Stage?M Benson Thomas and K S James
283 Civil Society and Policy Advocacy inIndiaV Anil Kumar
284 Infertility in India: Levels, Trends,Determinants and ConsequencesT S Syamala
285 Double Burden of Malnutrition in India:An InvestigationAngan Sengupta and T S Syamala
286 Vocational Education and Child Labour inBidar, Karnataka, IndiaV Anil Kumar
287 Politics and Public Policies: Politics ofHuman Development in Uttar Pradesh,IndiaShyam Singh and V Anil Kumar
Recent Working Papers288 Understanding the Fiscal Implications of
SEZs in India: An Exploration in ResourceCost ApproachMalini L Tantri
289 Does Higher Economic Growth ReducePoverty and Increase Inequality?Evidence from Urban IndiaSabyasachi Tripathi
290 Fiscal DevaluationsEmmanuel Farhi, Gita Gopinath and Oleg Itskhoki
291 Living Arrangement Preferences andHealth of the Institutionalised Elderly inOdishaAkshaya Kumar Panigrahi and T S Syamala
292 Do Large Agglomerations Lead toEconomic Growth? Evidence from UrbanIndiaSabyasachi Tripathi
293 Representation and Executive Functionsof Women Presidents andRepresentatives in the GramaPanchayats of KarnatakaAnand Inbanathan
294 How Effective are Social Audits underMGNREGS? Lessons from KarnatakaD Rajasekhar, Salim Lakha and R Manjula
295 Vulnerability Assessment Of TheAgricultural Sector In Yadgir District,Karnataka: A Socio-Economic SurveyApproachSarishti Attri and Sunil Nautiyal
296 How Much Do We Know about theChinese SEZ Policy?Malini L Tantri
297 Emerging Trends in E-Waste Management- Status and IssuesA Case Study of Bangalore CityManasi S
298 The Child and the City: AutonomousMigrants in BangaloreSupriya RoyChowdhury
299 Crop Diversification and Growth of Maizein Karnataka: An AssessmentKomol Singha and Arpita Chakravorty
300 The Economic Impact of Non-communicable Disease in China and India:Estimates, Projections, and ComparisonsDavid E Bloom, Elizabeth T Cafiero, Mark EMcGovern, Klaus Prettner, Anderson Stanciole,Jonathan Weiss, Samuel Bakkia and LarryRosenberg
301 India’s SEZ Policy - Retrospective AnalysisMalini L Tantri
302 Rainwater Harvesting Initiative inBangalore City: Problems and ProspectsK S Umamani and S Manasi
303 Large Agglomerations and EconomicGrowth in Urban India: An Application ofPanel Data ModelSabyasachi Tripathi
304 Identifying Credit Constrained Farmers: AnAlternative Approach
Manojit Bhattacharjee and Meenakshi Rajeev

305 Conflict and Education in Manipur: AComparative AnalysisKomol Singha
306 Determinants of Capital Structure ofIndian Corporate Sector: Evidence ofRegulatory ImpactKaushik Basu and Meenakshi Rajeev
307 Where All the Water Has Gone? AnAnalysis of Unreliable Water Supply inBangalore CityKrishna Raj
308 Urban Property Ownership Records inKarnataka: Computerized LandRegistration System for Urban PropertiesS Manasi, K C Smitha, R G Nadadur, N Sivanna, PG Chengappa
309 Historical Issues and Perspectives ofLand Resource Management in India: AReviewM S Umesh Babu and Sunil Nautiyal
310 E-Education: An Impact Study of SankyaProgramme on Computer EducationN Sivanna and Suchetha Srinath
311 Is India’s Public Debt Sustainable?Krishanu Pradhan
312 Biomedical Waste Management: Issuesand Concerns - A Ward Level Study ofBangalore CityS Manasi, K S Umamani and N Latha
313 Trade and Exclusion: Review of ProbableImpacts of Organised Retailing onMarginalised Communities in IndiaSobin George
314 Social Disparity in Child Morbidity andCurative Care: Investigating forDetermining Factors from Rural IndiaRajesh Raushan and R Mutharayappa
315 Is Access to Loan Adequate for FinancingCapital Expenditure? A Household LevelAnalysis on Some Selected States of IndiaManojit Bhattacharjee and Meenakshi Rajeev
316 Role of Fertility in Changing Age Structurein India: Evidence and ImplicationsC M Lakshmana
317 Healthcare Utilisation Behaviour in India:Socio-economic Disparities and the Effectof Health InsuranceAmit Kumar Sahoo
318 Integrated Child Development Services inIndia – A Sub-National ReviewJonathan Gangbar, Pavithra Rajan and K Gayithri
319 The Infrastructure-Output Nexus:Regional Experience from IndiaSumedha Bajar
320 Uncertainty, Risk and Risk Mitigation: FieldExperiences from Farm Sector inKarnatakaMeenakshi Rajeev and B P Vani
321 Socio-Economic Disparities in Health-Seeking Behaviour, Health Expenditureand Sources of Finance in Orissa: Evidencefrom NSSO 2004-05Amit Kumar Sahoo and S Madheswaran
322 Does Living Longer Mean Living Healthier?Exploring Disability-free Life Expectancyin IndiaM Benson Thomas, K S James and S Sulaja
323 Child and Maternal Health and Nutrition inSouth Asia - Lessons for IndiaPavithra Rajan, Jonathan Gangbar and K Gayithri
324 Reflecting on the Role of Institutions inthe Everyday Lives of Displaced Women:The Case of Ganga-Erosion in Malda, WestBengalPriyanka Dutta
325 Access of Bank Credit to VulnerableSections: A Case Study of KarnatakaVeerashekharappa
326 Neighbourhood Development and CasteDistribution in Rural IndiaRajesh Raushan and R Mutharayappa
327 Assessment of India’s Fiscal and ExternalSector Vulnerability: A Balance SheetApproachKrishanu Pradhan
328 Public Private Partnership’s GrowthEmpirics in India’s InfrastructureDevelopmentNagesha G and K Gayithri
329 Identifying the High Linked Sectors forIndia: An Application of Import-AdjustedDomestic Input-Output MatrixTulika Bhattacharya and Meenakshi Rajeev
330 Out-Of-Pocket (OOP) Financial RiskProtection: The Role of Health InsuranceAmit Kumar Sahoo and S Madheswaran
331 Promises and Paradoxes of SEZs Expansionin IndiaMalini L Tantri
Price: ` 30.00 ISBN 978-81-7791-188-6
INSTITUTE FOR SOCIAL AND ECONOMIC CHANGEDr V K R V Rao Road, Nagarabhavi P.O., Bangalore - 560 072, India
Phone: 0091-80-23215468, 23215519, 23215592; Fax: 0091-80-23217008E-mail: [email protected]; Web: www.isec.ac.in