fiscal year 2016 public budget hearing newark … year 2016 public budget hearing newark public ......
TRANSCRIPT
1
Fiscal Year 2016 Public Budget Hearing
Newark Public Schools
2
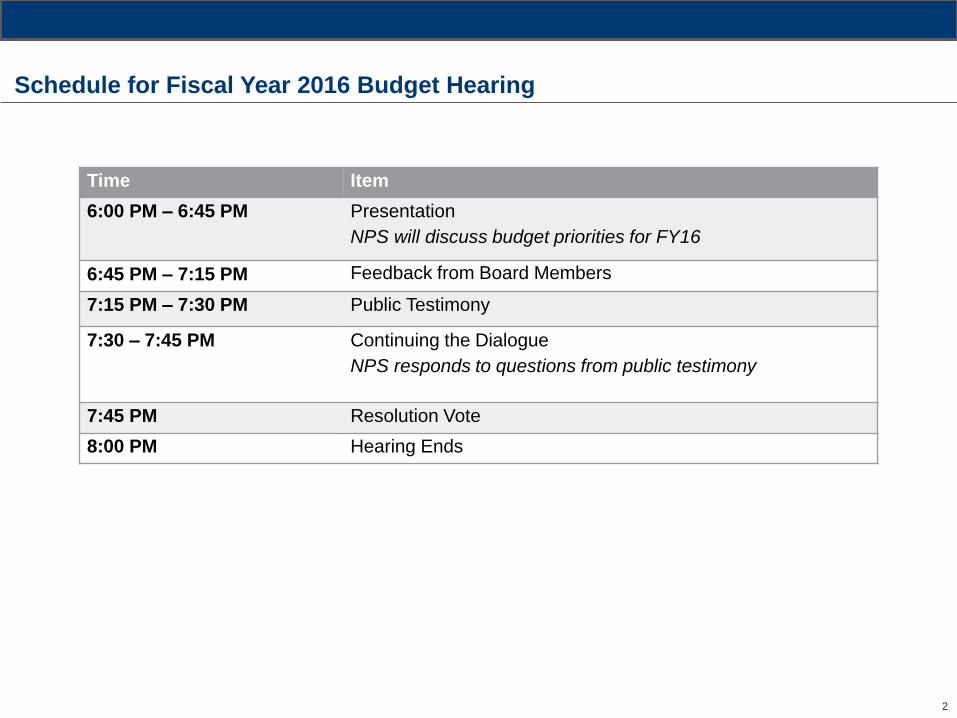
Schedule for Fiscal Year 2016 Budget Hearing
Time Item
6:00 PM – 6:45 PM Presentation
NPS will discuss budget priorities for FY16
6:45 PM – 7:15 PM Feedback from Board Members
7:15 PM – 7:30 PM Public Testimony
7:30 – 7:45 PM Continuing the Dialogue
NPS responds to questions from public testimony
7:45 PM Resolution Vote
8:00 PM Hearing Ends
3
1. Fiscal Year 2016 Budget Priorities
2. Revenue Picture
3. School Budgets
4. Non School-based Budgets
District Presentation | Agenda
4
FY2016 Budget Priorities
1. Celebrate successes to date
2. Understand how the budget process is designed to support district
goals

5
NPS Key Accomplishments (2011-Present)
• We added 1,000 PK seats and the majority of families eligible for free PK are now enrolled
• NPS became the 2nd school district in the nation to receive a $7M Head Start grant to further improve our
early childhood facilities and family supports
Early
Childhood
• The number of K-8 schools characterized as “good” increased from 14 to 20 and the number characterized as “on the move” increased from 6 to 12 (as of SY13 NJASK)
• Our first cohort of Renew Schools saw gains in reading and/or math, 5 Renew Schools saw gains in both 8 Renew Schools launched this school year (as of SY14 NJASK)
• While research shows effective turn-around schools take 3 to 5 years to see major gains, we already see leading indicators such as increased enrollment in our Renew Schools
Elementary
Schools
• The overall graduation rate increased by approx. 10 percentage points and the number of students passing
the HSPA graduation test increased by approx. 11 percentage points (as of SY13)
• 500 fewer students have dropped out because we have far more options for all students High Schools
• The Brookings Institute recently named NPS the #3 District in the country for the quality and diversity of
school choices
• Nearly 75% of families received one of their top 5 choices in the Universal Enrollment process
• Community Engagement Specialists have been hired in the majority of schools to increase the partnership
between families and schools
• NPS launched 4 new high schools – Bard Early College, Eagle Academy for Young Men, Girls Academy of
Newark, and Newark Leadership Academy – and obtained the first International Baccalaureate status in
NPS’ history
Family Choice

6
NPS Key Accomplishments (2011-Present)
• We negotiated with our charter partners to ensure they serve the District’s highest need students equitably
and to learn from their promising models
• Three high-performing charter schools with a track record of results agreed to take over whole schools where
there was a high demand for charter seats, and initial implementation has yielded positive family feedback
Charter
Collaboration
• We kept 95% of our highly effective and effective teachers while nearly 40% of our ineffective teachers exited
the system
• We implemented a restorative justice approach to school culture and discipline which has decreased all
suspensions by 37%, and out-of school suspensions by 23%
• We’ve invested $50M to improve our facilities and broke ground on two new schools whose construction had
been stalled for years
Systems
Reform
We achieved these successes while having to cut approximately $30M each
year (about $100M overall) in spending, and while keeping the percentage
of funds spent at the school-level nearly constant.
7
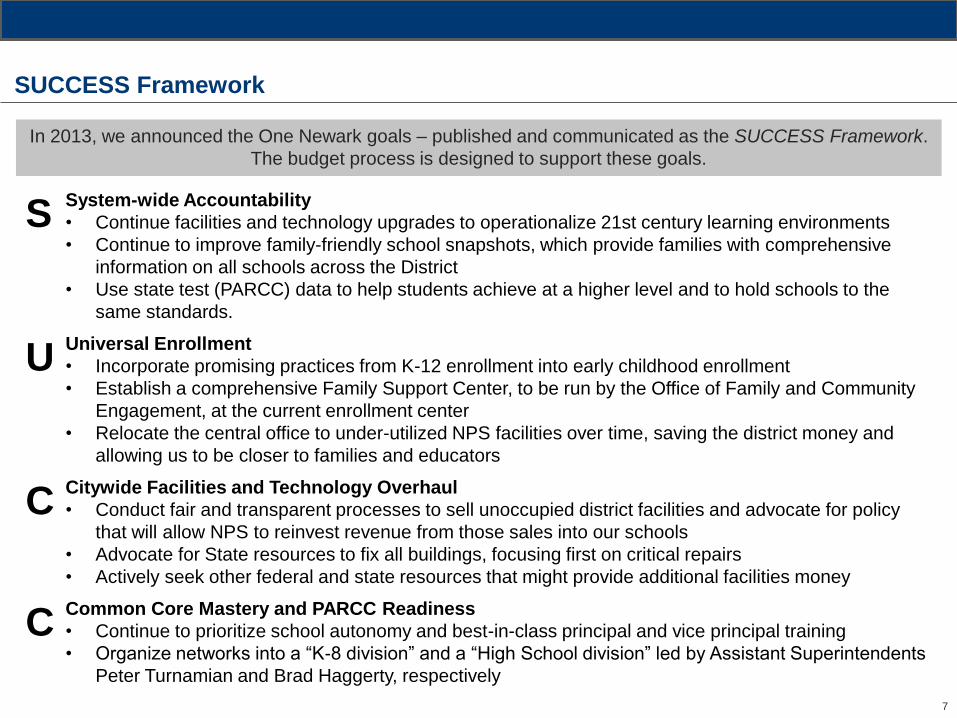
In 2013, we announced the One Newark goals – published and communicated as the SUCCESS Framework.
The budget process is designed to support these goals.
SUCCESS Framework
S System-wide Accountability
• Continue facilities and technology upgrades to operationalize 21st century learning environments
• Continue to improve family-friendly school snapshots, which provide families with comprehensive
information on all schools across the District
• Use state test (PARCC) data to help students achieve at a higher level and to hold schools to the
same standards.
U Universal Enrollment
• Incorporate promising practices from K-12 enrollment into early childhood enrollment
• Establish a comprehensive Family Support Center, to be run by the Office of Family and Community
Engagement, at the current enrollment center
• Relocate the central office to under-utilized NPS facilities over time, saving the district money and
allowing us to be closer to families and educators
C Citywide Facilities and Technology Overhaul
• Conduct fair and transparent processes to sell unoccupied district facilities and advocate for policy
that will allow NPS to reinvest revenue from those sales into our schools
• Advocate for State resources to fix all buildings, focusing first on critical repairs
• Actively seek other federal and state resources that might provide additional facilities money
C Common Core Mastery and PARCC Readiness
• Continue to prioritize school autonomy and best-in-class principal and vice principal training
• Organize networks into a “K-8 division” and a “High School division” led by Assistant Superintendents
Peter Turnamian and Brad Haggerty, respectively
8
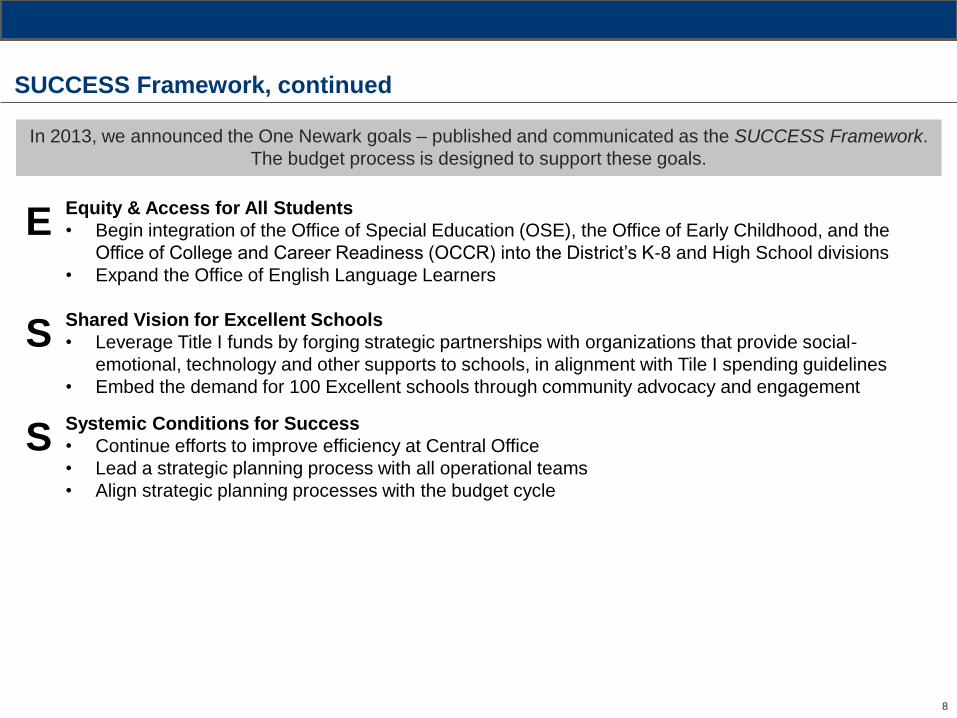
In 2013, we announced the One Newark goals – published and communicated as the SUCCESS Framework.
The budget process is designed to support these goals.
SUCCESS Framework, continued
E Equity & Access for All Students
• Begin integration of the Office of Special Education (OSE), the Office of Early Childhood, and the
Office of College and Career Readiness (OCCR) into the District’s K-8 and High School divisions
• Expand the Office of English Language Learners
S Shared Vision for Excellent Schools
• Leverage Title I funds by forging strategic partnerships with organizations that provide social-
emotional, technology and other supports to schools, in alignment with Tile I spending guidelines
• Embed the demand for 100 Excellent schools through community advocacy and engagement
S Systemic Conditions for Success
• Continue efforts to improve efficiency at Central Office
• Lead a strategic planning process with all operational teams
• Align strategic planning processes with the budget cycle

9
Revenue Picture
1. Understand total available revenue, including earmarked funds
2. Understand decrease in available revenue and why
10
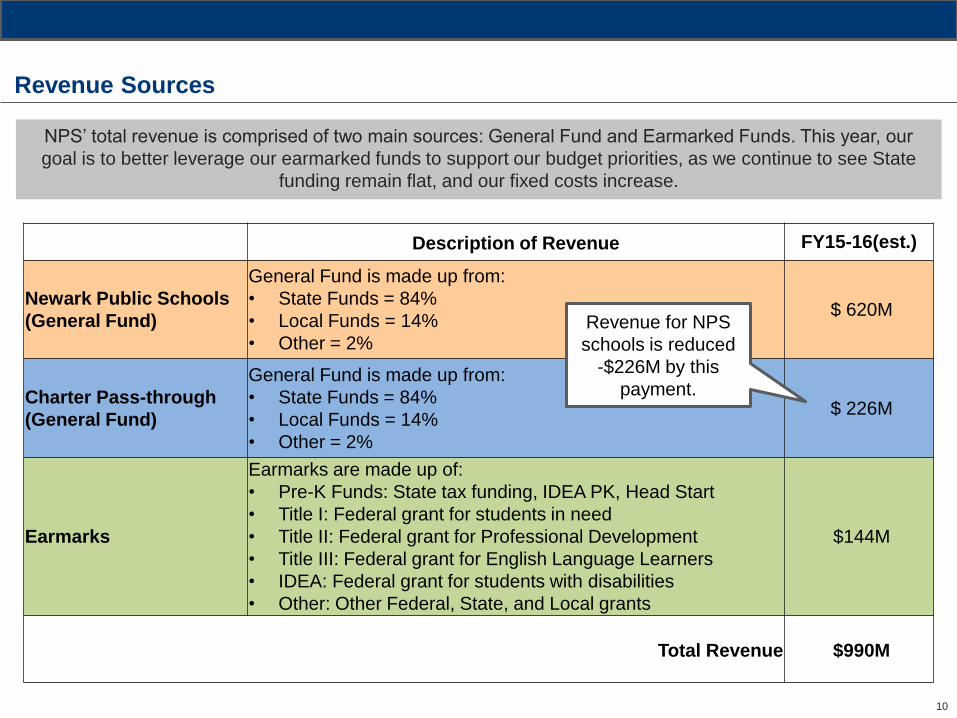
NPS’ total revenue is comprised of two main sources: General Fund and Earmarked Funds. This year, our
goal is to better leverage our earmarked funds to support our budget priorities, as we continue to see State
funding remain flat, and our fixed costs increase.
Revenue Sources
Description of Revenue FY15-16(est.)
Newark Public Schools
(General Fund)
General Fund is made up from:
• State Funds = 84%
• Local Funds = 14%
• Other = 2%
$ 620M
Charter Pass-through
(General Fund)
General Fund is made up from:
• State Funds = 84%
• Local Funds = 14%
• Other = 2%
$ 226M
Earmarks
Earmarks are made up of:
• Pre-K Funds: State tax funding, IDEA PK, Head Start
• Title I: Federal grant for students in need
• Title II: Federal grant for Professional Development
• Title III: Federal grant for English Language Learners
• IDEA: Federal grant for students with disabilities
• Other: Other Federal, State, and Local grants
$144M
Total Revenue $990M
Revenue for NPS
schools is reduced
-$226M by this
payment.
11
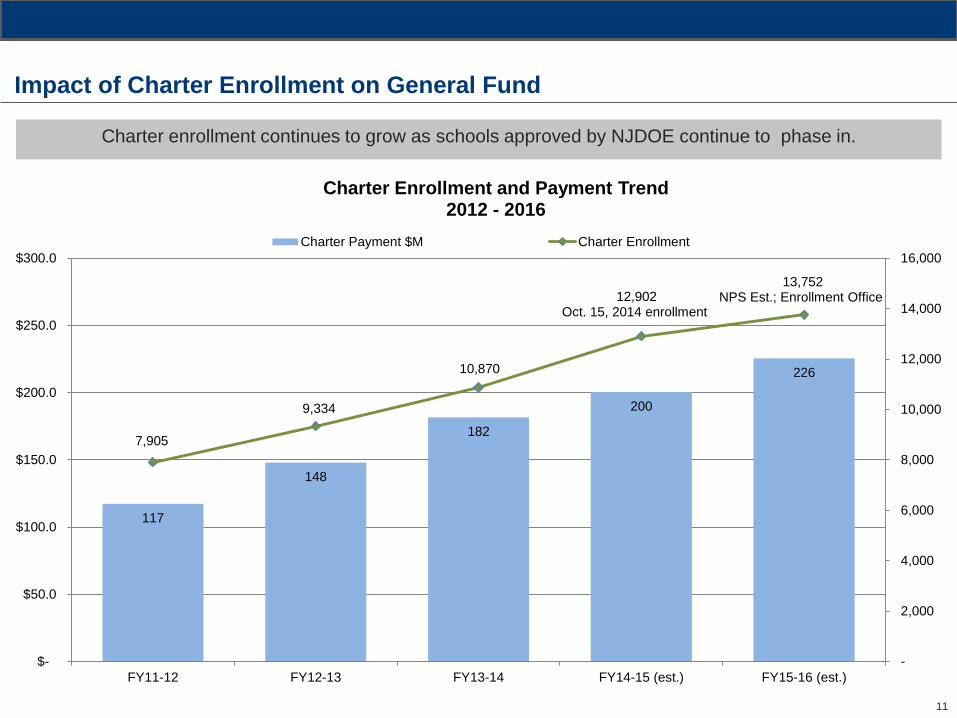
Charter enrollment continues to grow as schools approved by NJDOE continue to phase in.
Impact of Charter Enrollment on General Fund
117
148
182
200
226
7,905
9,334
10,870
12,902 Oct. 15, 2014 enrollment
13,752 NPS Est.; Enrollment Office
-
2,000
4,000
6,000
8,000
10,000
12,000
14,000
16,000
$-
$50.0
$100.0
$150.0
$200.0
$250.0
$300.0
FY11-12 FY12-13 FY13-14 FY14-15 (est.) FY15-16 (est.)
Charter Enrollment and Payment Trend 2012 - 2016
Charter Payment $M Charter Enrollment

12
While overall revenue has been generally flat – the portion available to NPS schools has declined significantly
Impact of Charter Enrollment on General Fund, continued
NPS’ total available
revenue is $765M.
Our strategy for
FY16 is maximize
the General Fund
and Earmarks.
$127 $137 $129 $148 $144
$740 $728 $685 $656
$620
$117 $148 $182
$200 projected
$226 projected
$-
$200
$400
$600
$800
$1,000
$1,200
FY11-12 FY12-13 FY13-14 FY14-15 (est.) FY15-16 (est.)
$M
il
NPS General Fund and Other Revenues 2012 - 2016
Charter Payment $M General Fund (less Charter Pymnt) Earmarks (i.e. grants)

13
NPS’ total available revenue has decreased since FY2014-15. As a result, we will have to reduce our
spending.
Decreased Available Revenue
FY14-15 FY15-16(est.) $ Change % Change
General Fund less
Charter Pass-
through
$656M $ 620M $ (36M) -5%
Earmarks $148M $144M $(3M) -2%
Total Revenue $ 804 $ 765 $(39M) -4.9%
14
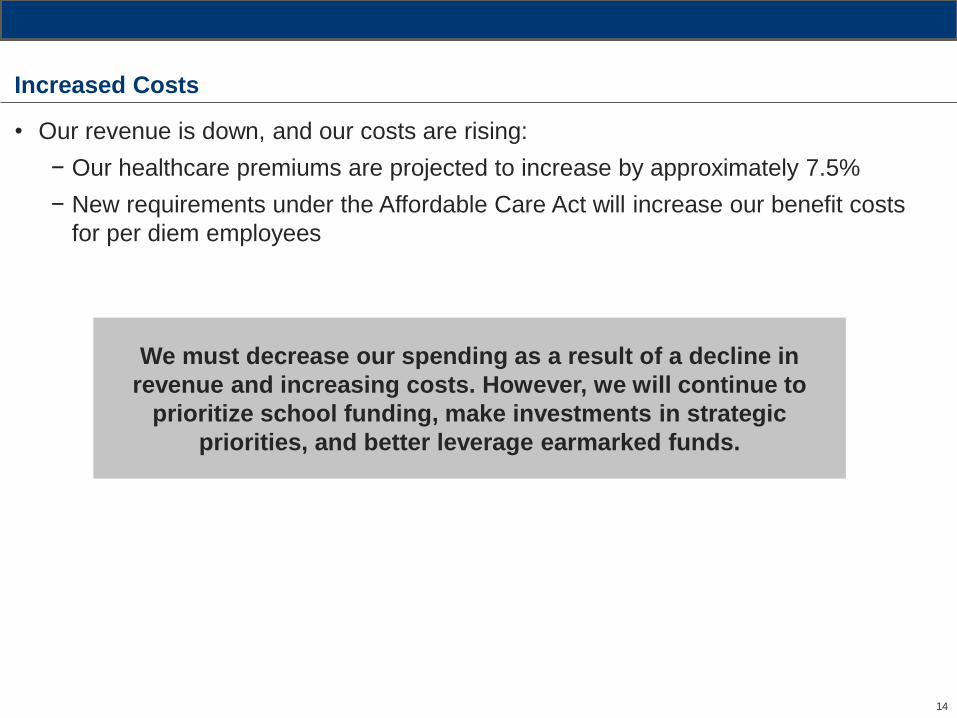
• Our revenue is down, and our costs are rising:
− Our healthcare premiums are projected to increase by approximately 7.5%
− New requirements under the Affordable Care Act will increase our benefit costs
for per diem employees
Increased Costs
We must decrease our spending as a result of a decline in
revenue and increasing costs. However, we will continue to
prioritize school funding, make investments in strategic
priorities, and better leverage earmarked funds.
15
School Budgets
1. Understand how individual school budgets are created
2. Highlight our work to increase equity and access for all students
16
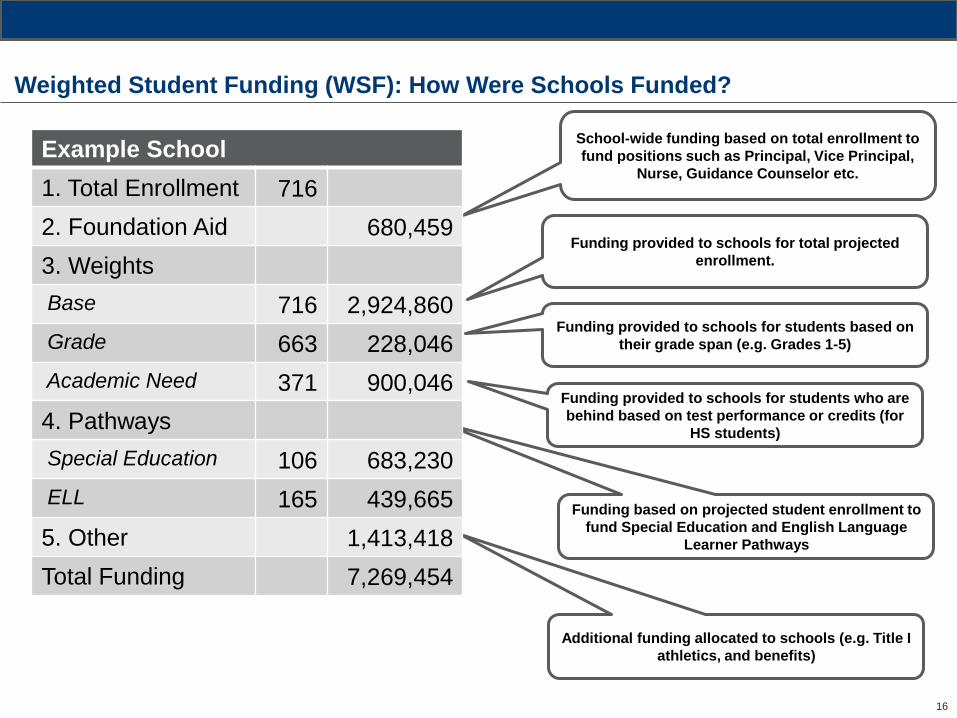
Weighted Student Funding (WSF): How Were Schools Funded?
School-wide funding based on total enrollment to
fund positions such as Principal, Vice Principal,
Nurse, Guidance Counselor etc.
Funding provided to schools for total projected
enrollment.
Funding provided to schools for students based on
their grade span (e.g. Grades 1-5)
Funding provided to schools for students who are
behind based on test performance or credits (for
HS students)
Funding based on projected student enrollment to
fund Special Education and English Language
Learner Pathways
Additional funding allocated to schools (e.g. Title I
athletics, and benefits)
Example School
1. Total Enrollment 716
2. Foundation Aid 680,459
3. Weights
Base 716 2,924,860
Grade 663 228,046
Academic Need 371 900,046
4. Pathways
Special Education 106 683,230
ELL 165 439,665
5. Other 1,413,418
Total Funding 7,269,454
17
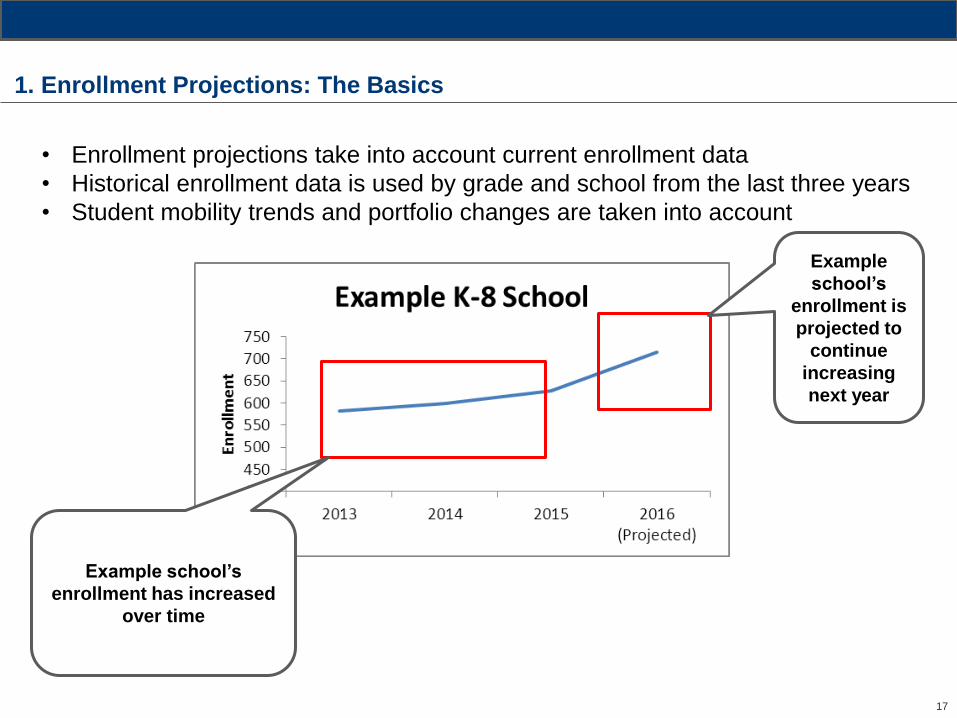
1. Enrollment Projections: The Basics
• Enrollment projections take into account current enrollment data
• Historical enrollment data is used by grade and school from the last three years
• Student mobility trends and portfolio changes are taken into account
Example school’s
enrollment has increased
over time
Example
school’s
enrollment is
projected to
continue
increasing
next year
18
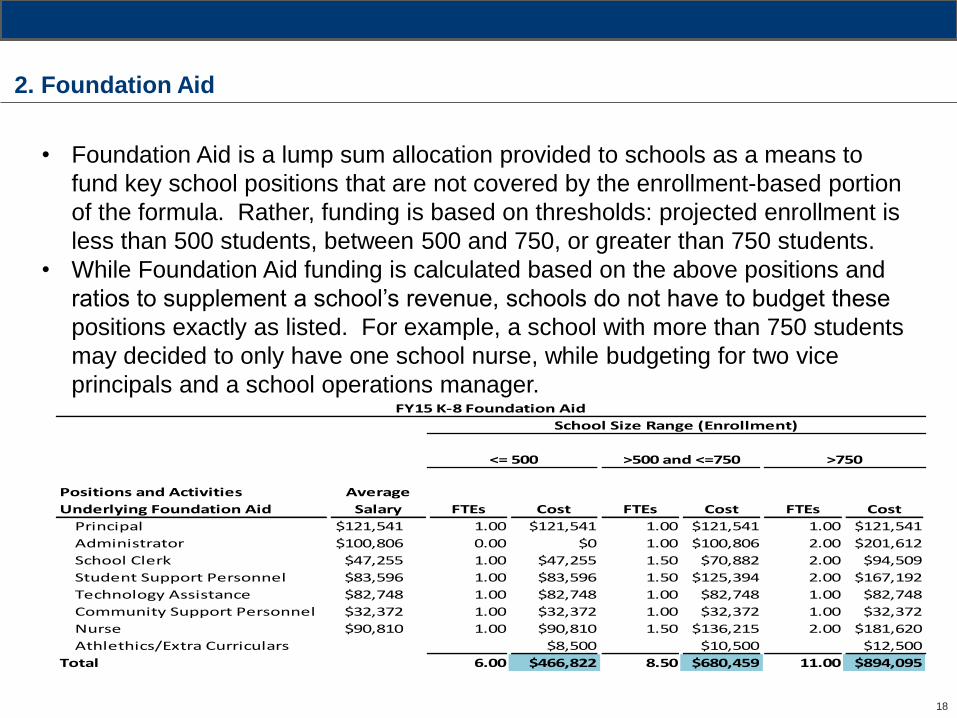
2. Foundation Aid
• Foundation Aid is a lump sum allocation provided to schools as a means to
fund key school positions that are not covered by the enrollment-based portion
of the formula. Rather, funding is based on thresholds: projected enrollment is
less than 500 students, between 500 and 750, or greater than 750 students.
• While Foundation Aid funding is calculated based on the above positions and
ratios to supplement a school’s revenue, schools do not have to budget these
positions exactly as listed. For example, a school with more than 750 students
may decided to only have one school nurse, while budgeting for two vice
principals and a school operations manager. FY15 K-8 Foundation Aid
School Size Range (Enrollment)
<= 500 >500 and <=750 >750
Positions and Activities
Underlying Foundation Aid
Average
Salary FTEs Cost FTEs Cost FTEs Cost
Principal $121,541 1.00 $121,541 1.00 $121,541 1.00 $121,541
Administrator $100,806 0.00 $0 1.00 $100,806 2.00 $201,612
School Clerk $47,255 1.00 $47,255 1.50 $70,882 2.00 $94,509
Student Support Personnel $83,596 1.00 $83,596 1.50 $125,394 2.00 $167,192
Technology Assistance $82,748 1.00 $82,748 1.00 $82,748 1.00 $82,748
Community Support Personnel $32,372 1.00 $32,372 1.00 $32,372 1.00 $32,372
Nurse $90,810 1.00 $90,810 1.50 $136,215 2.00 $181,620
Athlethics/Extra Curriculars $8,500 $10,500 $12,500
Total 6.00 $466,822 8.50 $680,459 11.00 $894,095
19
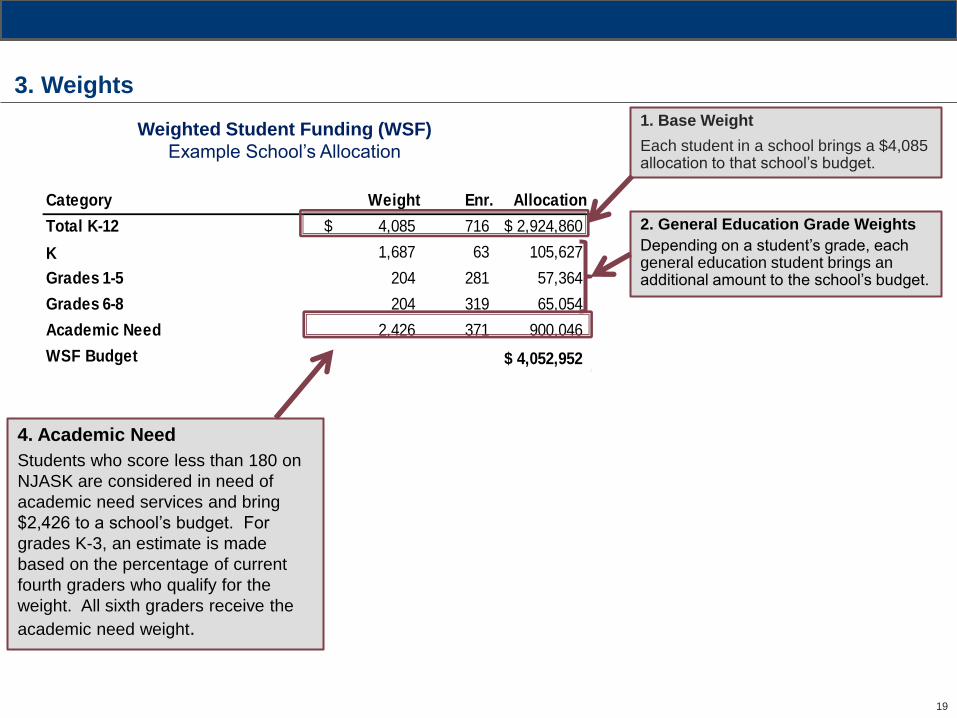
Category Weight Enr. Allocation
Total K-12 4,085$ 716 2,924,860$
K 1,687 63 105,627
Grades 1-5 204 281 57,364
Grades 6-8 204 319 65,054
Academic Need 2,426 371 900,046
WSF Budget 4,052,952$
3. Weights
1. Base Weight
Each student in a school brings a $4,085 allocation to that school’s budget.
Weighted Student Funding (WSF)
Example School’s Allocation
4. Academic Need
Students who score less than 180 on
NJASK are considered in need of
academic need services and bring
$2,426 to a school’s budget. For
grades K-3, an estimate is made
based on the percentage of current
fourth graders who qualify for the
weight. All sixth graders receive the
academic need weight.
2. General Education Grade Weights
Depending on a student’s grade, each general education student brings an additional amount to the school’s budget.
20
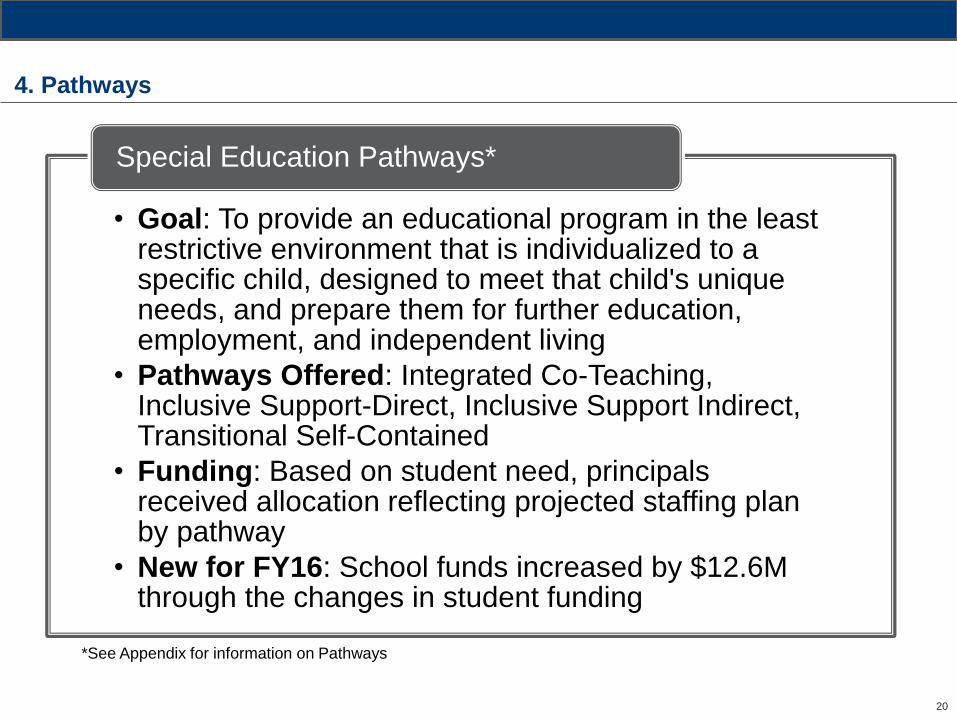
4. Pathways
• Goal: To provide an educational program in the least restrictive environment that is individualized to a specific child, designed to meet that child's unique needs, and prepare them for further education, employment, and independent living
• Pathways Offered: Integrated Co-Teaching, Inclusive Support-Direct, Inclusive Support Indirect, Transitional Self-Contained
• Funding: Based on student need, principals received allocation reflecting projected staffing plan by pathway
• New for FY16: School funds increased by $12.6M through the changes in student funding
Special Education Pathways*
*See Appendix for information on Pathways
21
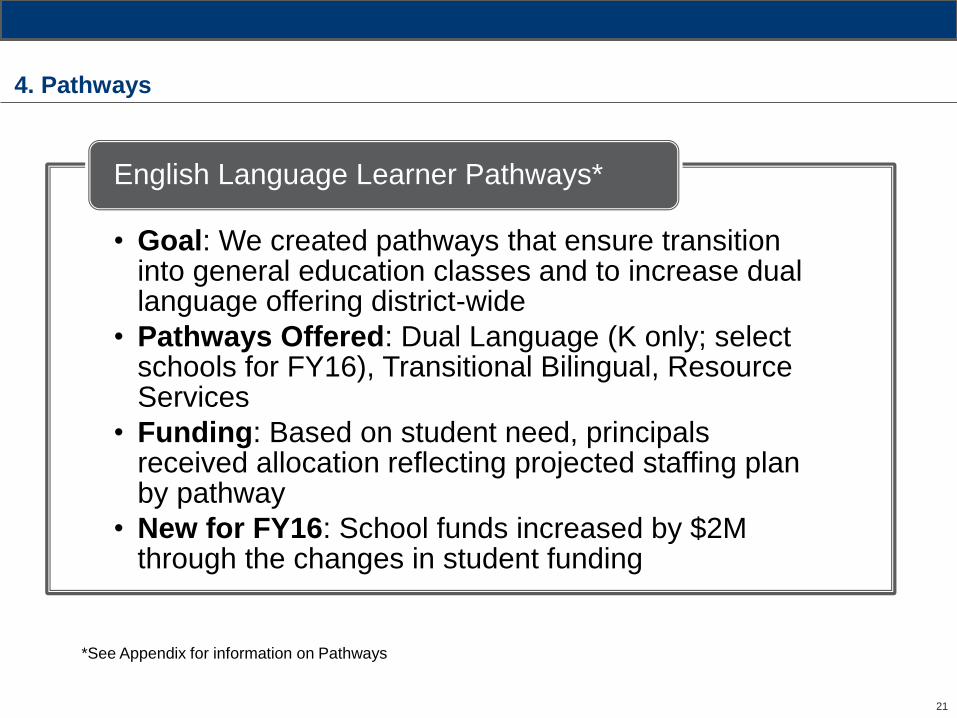
4. Pathways
• Goal: We created pathways that ensure transition into general education classes and to increase dual language offering district-wide
• Pathways Offered: Dual Language (K only; select schools for FY16), Transitional Bilingual, Resource Services
• Funding: Based on student need, principals received allocation reflecting projected staffing plan by pathway
• New for FY16: School funds increased by $2M through the changes in student funding
English Language Learner Pathways*
*See Appendix for information on Pathways

22
Foundation Aid 680,459
Title I Allocation 271,882
Benefits 1,066,845
Security 74,421
Total Budget 7,269,454
5. Other
1. Foundation Aid
See slide 18
2. Title I
Title I school-wide funds are blended
into a schools budget and are
intended to supplement the overall
general fund allocation. They are
calculated based on a projection of the
Federal Title I grant and the percent of
students in a school that register for
free and reduced lunch.
4. Total Allocation
A school’s total budget is the sum of the
weighted student funding budget (see previous
slide) and the additional lump sum allocations
detailed above
Key Budget Components
Example School’s Allocation
3. Benefits and Security
An allocation is added to a school’s budget to cover the cost of providing benefits to the school’s employees. The school must budget for benefits at the same amount. Security funding is loaded to cover security guards in the building. Guards may not be cut out of a budget, though schools can budget for more guards if desired.

23
School Funding Outlook: Per Pupil for FY15-16
• Overall, per pupil funding will increase by approx. 3.6% ($380)*
• That said, some schools might enact strategic staffing reductions as a result of:
− Better alignment of budgeting to strategic goals
− New costs for schools to budget for (e.g. paraprofessionals)
• By including paraprofessional costs in school budgets, we are able to
− Provide clear and comprehensive roster data to Principals
− Ensure clear management and oversight of spending
− Ensure accountability on the part of personnel and Principals
* Assumes district is able to meet all budget priorities. Per pupil figures do NOT include funds budgeted centrally.
24
Non-School Based Budgets
1. Identify areas in need of new investments
2. Identify areas of decreased spending

25
Examples of Needed Investments (Not Comprehensive)
The Arts: We are expanding the successful “Renew the Arts” program and
strengthening community arts partnerships with the Passport program. ~$720K
Health: We are expanding the 2014 SPARK PE curriculum pilot to all K-8 schools
continuing to improve athletics programming. ~$1M
Common Core Mastery: We are continuing our investments in ELA, Math, Science and
Social Studies. ~$5M
Educator Effectiveness: We are continuing our investments high quality evaluation and
coaching systems, as well as leadership development for teachers and principals. ~$1.6M
PARCC-Readiness: We are continuing our investments in instructional technology,
technical assistance for schools (e.g., Help Desk), and additional access points and
servers to support PARCC implementation.
~$1M

26
Areas of Reduction in Spending
1. Leveraging Earmarked Funds
− We are aligning the spending of earmarked funds with our budget priorities
− I.D.E.A. funding and Title spending will support programs that are strategic and
align with student needs
~$6M in Savings
We must reduce our spending as a result of the decrease in available revenues.
2. Obtaining an Equivalency from NJDOE to Implement a Performance-Based
Lay-off
− This would give NPS an opportunity to retain our best teachers and create a
sustainable system of excellence
~$10M in
Savings
3. Achieving Efficiencies in Central Office
− We are decreasing overtime, per diem, and professional services spending
− We will need to implement a lay-off as we continue to bring staffing levels to
ratios of districts of similar size
~$20M in
Savings

27
1: Leveraging Earmarked Funds
We are better leveraging earmarked funding to support students’ needs and
strategically align with available General Fund (reduced) revenue.
~$4M: I.D.E.A.
~$2M: Title I
Curriculum
K-8 & HS
Networks
K-8 and HS
Schools
Extended
School Day
Earmarked Funds: Strategic
Allocation
Areas of
Investments
~$6M in
Earmarked
Funding

28
1: Leveraging Earmarked Funds
Instructional time will be expanded at the school-level using academic need
funding.
Schools are using $5.8M of
academic need funding to expand
school time. Through the strategic
use of earmark funding, $5.3M is
funded via Title I.
General Fund ($500K)
Title I ($5.3M)
29
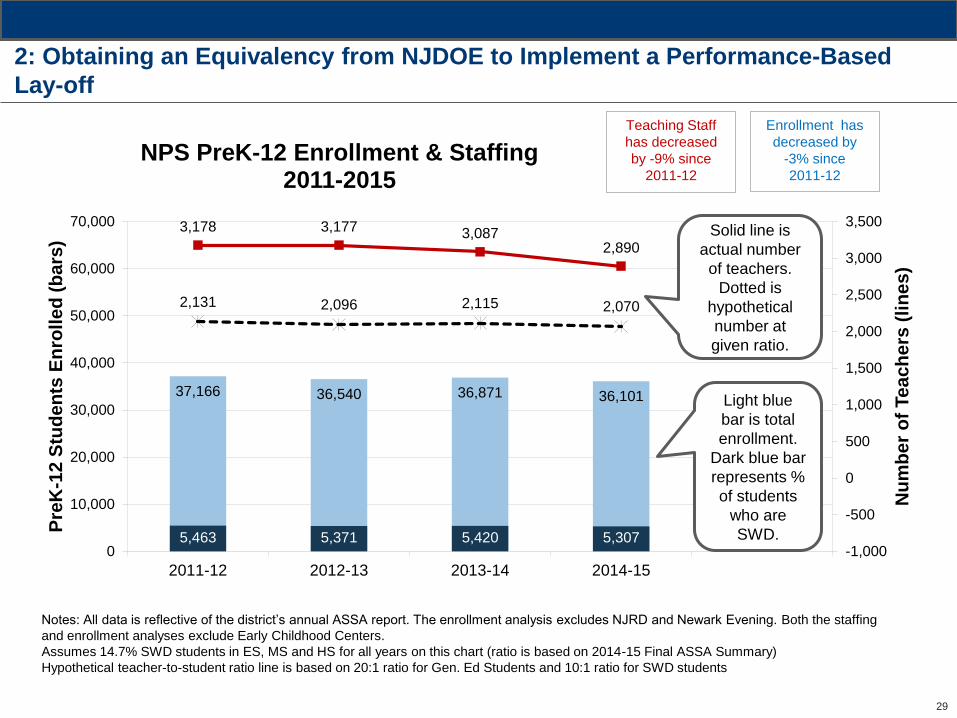
2: Obtaining an Equivalency from NJDOE to Implement a Performance-Based
Lay-off
Notes: All data is reflective of the district’s annual ASSA report. The enrollment analysis excludes NJRD and Newark Evening. Both the staffing
and enrollment analyses exclude Early Childhood Centers.
Assumes 14.7% SWD students in ES, MS and HS for all years on this chart (ratio is based on 2014-15 Final ASSA Summary)
Hypothetical teacher-to-student ratio line is based on 20:1 ratio for Gen. Ed Students and 10:1 ratio for SWD students
37,166 36,540 36,871 36,101
5,463 5,371 5,420 5,307
3,178 3,177 3,087 2,890
2,131 2,096 2,115 2,070
-1,000
-500
0
500
1,000
1,500
2,000
2,500
3,000
3,500
0
10,000
20,000
30,000
40,000
50,000
60,000
70,000
2011-12 2012-13 2013-14 2014-15
Nu
mb
er
of
Te
ac
he
rs (
lin
es
)
Pre
K-1
2 S
tud
en
ts E
nro
lle
d (
ba
rs)
NPS PreK-12 Enrollment & Staffing 2011-2015
Teaching Staff
has decreased
by -9% since
2011-12
Enrollment has
decreased by
-3% since
2011-12
Solid line is
actual number
of teachers.
Dotted is
hypothetical
number at
given ratio.
Light blue
bar is total
enrollment.
Dark blue bar
represents %
of students
who are
SWD.

30
2: Obtaining an Equivalency from NJDOE to Implement a Performance-Based
Lay-off
• School-based budgeting – hiring and staffing based on student need – results in an
excess of staff members in certain titles
• Current seniority regulations require NPS to lay off all non-tenured teachers within a
title before a tenured teacher can be laid off within that title
• Conducting a layoff under current regulations would have disastrous impacts on our
schools:
Notes: The results above are from modeling conducted by NPS which simulated a layoff at the end of the 2012-13 school year. At that time, 159
teachers were in the EWPS pool. The purpose of the model was to compare the impact of a performance-based layoff to the impact of a years of
service-based layoff.
31
2: Obtaining an Equivalency from NJDOE to Implement a Performance-Based
Lay-off
• To avoid harming children by laying off high-performing, early-career teachers, NPS
places tenured teachers who are cut and do not secure a budgeted position into the
EWPS pool, where they are placed into instructional positions at schools as
additional support
− 243 educators were in the EWPS pool as of 3/19
• EWPS staff are given opportunities to apply for full-time budgeted positions through
career fairs and Talent Match, and those that do not find positions remain in the
EWPS pool
• EWPS teachers are almost six times as likely to be rated ineffective than teachers
with full-time, budgeted positions in schools
• Paying for the EWPS pool places a financial burden on the district and prevents it
from funding strategic initiatives that will increase student achievement
32
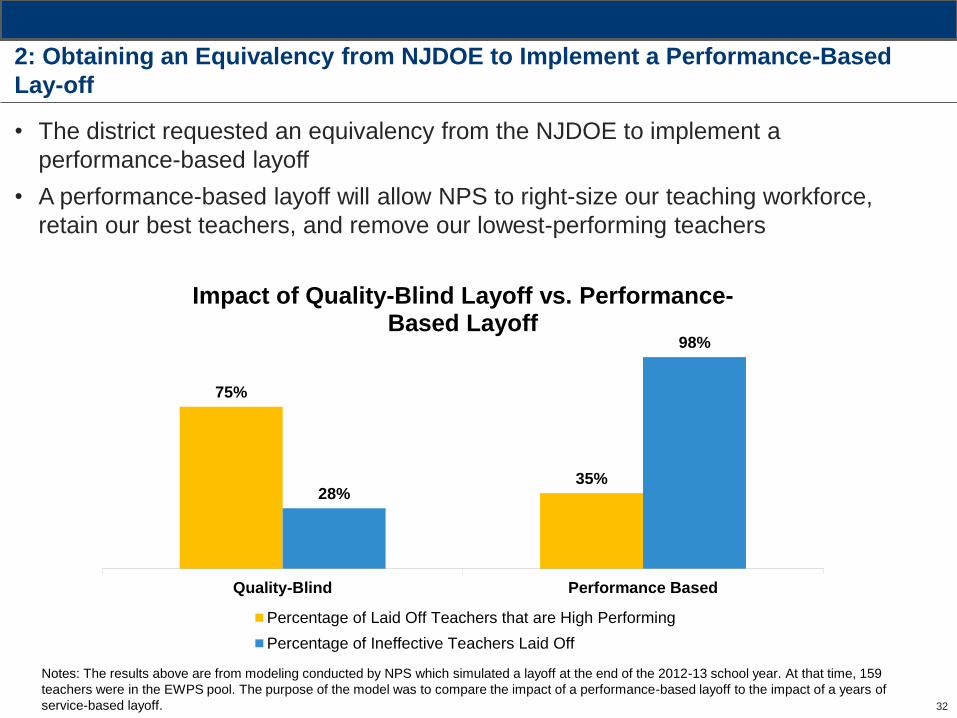
2: Obtaining an Equivalency from NJDOE to Implement a Performance-Based
Lay-off
• The district requested an equivalency from the NJDOE to implement a
performance-based layoff
• A performance-based layoff will allow NPS to right-size our teaching workforce,
retain our best teachers, and remove our lowest-performing teachers
75%
35% 28%
98%
Quality-Blind Performance Based
Impact of Quality-Blind Layoff vs. Performance-Based Layoff
Percentage of Laid Off Teachers that are High Performing
Percentage of Ineffective Teachers Laid Off
Notes: The results above are from modeling conducted by NPS which simulated a layoff at the end of the 2012-13 school year. At that time, 159
teachers were in the EWPS pool. The purpose of the model was to compare the impact of a performance-based layoff to the impact of a years of
service-based layoff.
33
3: Achieving Efficiencies at Central Office
• We are targeting ~$20M in savings from Central Office
• In order to ensure the highest level of operational efficiency, we are reducing
spending in the following areas: supplies, per diems and overtime spending, and
professional services
• We will need to conduct a reduction in force; however, we will try to meet our
efficiency goals first through natural attrition and closing vacancies
− The number of potentially impacted staff will continue to change until: (1) the
budget has been approved by NJDOE, (2) the district receives a response on the
equivalency request, and (3) all potential separations from the district are known,
including but not limited to retirements, FMLA, tenure charges, and non-renewals
− Given historical trends, we do know that the number of impacted staff declines
from the amount originally projected because of separations
• In FY14-15, we projected 200-300 staff would be impacted
• As a result of attrition and vacancy closings, 167 FTEs were impacted

34
Appendix

35
SAB Engagement
Date Agenda
Budget Committee 1 2/4/15 1. Strategic Priorities for FY16: SUCCESS Goals, Projected
Fiscal Climate & Budget Committee Process
2. Key Facts About the NPS Budget
3. Update on Current Budget
Budget Committee 2 3/3/15 1. Goals-Based Budgeting
2. Update on Revenue for FY15-16
3. Operationalizing Goals-Based Budgeting: GAAP Codes &
NPS Chart of Accounts
Budget Committee 3 3/10/15 1. Update on the FY15-16 Preliminary Budget Submission
2. Overview of Strategic Planning Process for Schools
3. Weighted Student Funding Components & Key Changes
4. School Budget Case Study
Budget Committee 4 3/23/15 1. Review Budget Hearing Presentation
2. Discuss and Incorporate Feedback for Thursday’s hearing
3. Q&A
Budget Committee 5 3/31/15 1. Next Steps for Final Submission
36
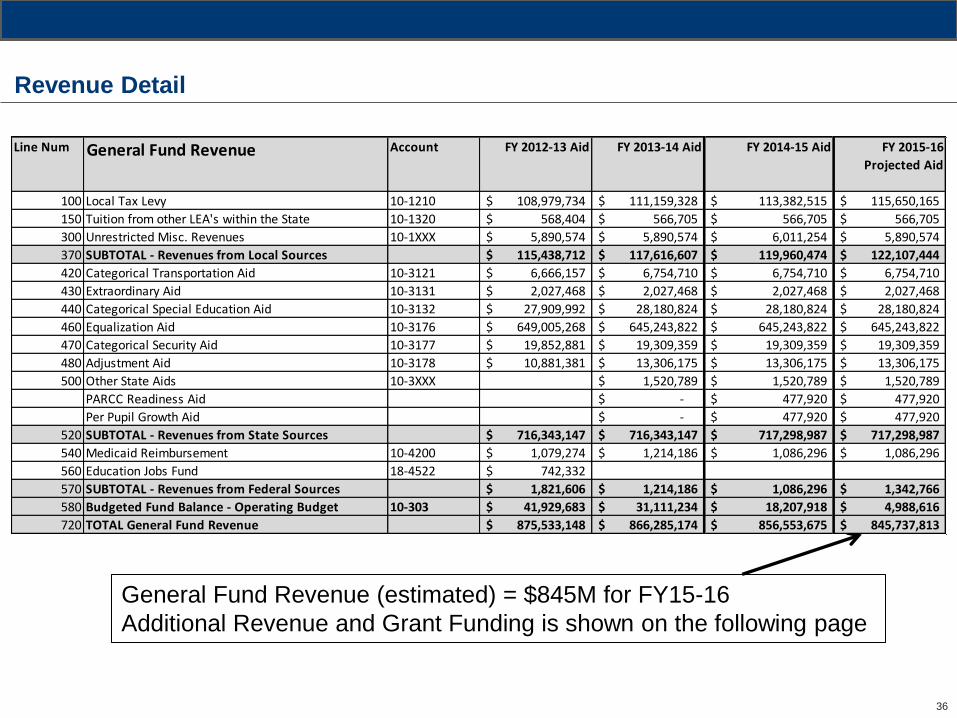
Revenue Detail
General Fund Revenue (estimated) = $845M for FY15-16
Additional Revenue and Grant Funding is shown on the following page
Line Num General Fund Revenue Account FY 2012-13 Aid FY 2013-14 Aid FY 2014-15 Aid FY 2015-16
Projected Aid
100 Local Tax Levy 10-1210 108,979,734$ 111,159,328$ 113,382,515$ 115,650,165$
150 Tuition from other LEA's within the State 10-1320 568,404$ 566,705$ 566,705$ 566,705$
300 Unrestricted Misc. Revenues 10-1XXX 5,890,574$ 5,890,574$ 6,011,254$ 5,890,574$
370 SUBTOTAL - Revenues from Local Sources 115,438,712$ 117,616,607$ 119,960,474$ 122,107,444$
420 Categorical Transportation Aid 10-3121 6,666,157$ 6,754,710$ 6,754,710$ 6,754,710$
430 Extraordinary Aid 10-3131 2,027,468$ 2,027,468$ 2,027,468$ 2,027,468$
440 Categorical Special Education Aid 10-3132 27,909,992$ 28,180,824$ 28,180,824$ 28,180,824$
460 Equalization Aid 10-3176 649,005,268$ 645,243,822$ 645,243,822$ 645,243,822$
470 Categorical Security Aid 10-3177 19,852,881$ 19,309,359$ 19,309,359$ 19,309,359$
480 Adjustment Aid 10-3178 10,881,381$ 13,306,175$ 13,306,175$ 13,306,175$
500 Other State Aids 10-3XXX 1,520,789$ 1,520,789$ 1,520,789$
PARCC Readiness Aid -$ 477,920$ 477,920$
Per Pupil Growth Aid -$ 477,920$ 477,920$
520 SUBTOTAL - Revenues from State Sources 716,343,147$ 716,343,147$ 717,298,987$ 717,298,987$
540 Medicaid Reimbursement 10-4200 1,079,274$ 1,214,186$ 1,086,296$ 1,086,296$
560 Education Jobs Fund 18-4522 742,332$
570 SUBTOTAL - Revenues from Federal Sources 1,821,606$ 1,214,186$ 1,086,296$ 1,342,766$
580 Budgeted Fund Balance - Operating Budget 10-303 41,929,683$ 31,111,234$ 18,207,918$ 4,988,616$
720 TOTAL General Fund Revenue 875,533,148$ 866,285,174$ 856,553,675$ 845,737,813$

37
Summary of all Revenues including Pre-K, Grants, Title Funds, & I.D.E.A. FY 2014-15 Aid FY2015-16 Aid
(estimated)
Increase
(decrease)
FY15 to FY16
see abv General Fund Revenues (unrestricted) 856,553,675$ 845,737,813$ (10,815,862)$
Pre-K Pre-K Revenues (restricted) 91,020,427$ 87,794,798$ (3,225,629)$
Title* Title I (restricted) 24,245,304$ 24,245,304$
Title* Title II (restricted) 4,554,379$ 4,554,379$
Title* Title III (restricted) 815,191$ 815,191$
Title* Title IV (restricted) -$ -$
Title* Title V (restricted) 103,846$ 103,846$
Title* Title VI (restricted) -$ -$
Other Grant Other Special Programs (restricted) 4,841,150$ 4,841,150$
Other Grant Vocational Education (restricted) 571,137$ 571,137$
Other Grant Other Federal Programs, includes Headstart and other (restricted) 9,457,362$ 9,457,362$
Other Grant Local Projects Grant funding (restricted) 1,848,115$ 1,848,115$
I.D.E.A.** IDEA Grant funds (restricted) 9,818,933$ 9,818,933$
I.D.E.A.** IDEA Preschool Grant funds (restricted) 246,323$ 246,323$
Total of all revenues FY 2014-15 (restricted and unrestricted) 1,004,075,842$ 990,034,351$ -1.4%
Other amounts Enterprise Funds; funds 61 & 60 (for NJ Regional Day and for Food Service) 28,040,658$ This Rev. comes linked to add'l expense
incl'd carryover Capital Projects Fund; SDA projects; fund 30 23,471,197$ This Rev. comes linked to add'l expense
encumbrances One time loan dollars for PARCC equipment (estimated amount) 5,030,000$
enterprise funds & Preschool Education Aid - Prior Year (carryover) 1,304,506$
one time amounts I.D.E.A (carryover) 6,283,152$
Title funds (carryover) 8,670,593$
Prior Year Encumbrances (encumbered but not restricted) 24,964,709$ This Rev. comes linked to add'l expense
Total including Prior Year Carryover and Prior Year Encumbered Funds 1,101,840,657$
* Title Grants are budgeted at about 75% of full year until final calc. from feds. (full year for 2014-15 is approx. $29.7M plus $8.7M carryover)
** I.D.E.A. Grants are budgeted at about 85% of full year until final calc. from feds. (full year for 2014-15 is approx. $10.1M plus $6.3M carryover)
Revenue Detail, continued
Items in yellow are estimates

38
Revenue Detail, cont.: Annual Rent from Charter Leases (Misc. Revenue)
Charter Partner Location Annual Rent
Paulo Freire Burnet (Sole Occupancy) $254,997.00
TEAM Carver (Co-location) $137,451.80
People’s Prep Camden Middle (Co-location) $209,626.05
North Star MLK (Sole Occupancy) $356,664.00
North Star 15th Avenue(Sole Occupancy) $193,629.00
North Star Alexander Street (Sole Occupancy) $224,532.00
North Star Boylan Annex(Sole Occupancy) $72,249.00
TEAM Bragaw (Sole Occupancy) $194,391.00
Newark Legacy Madison (Sole Occupancy) $247,470.00
Annual Total $1,891,009.85
39
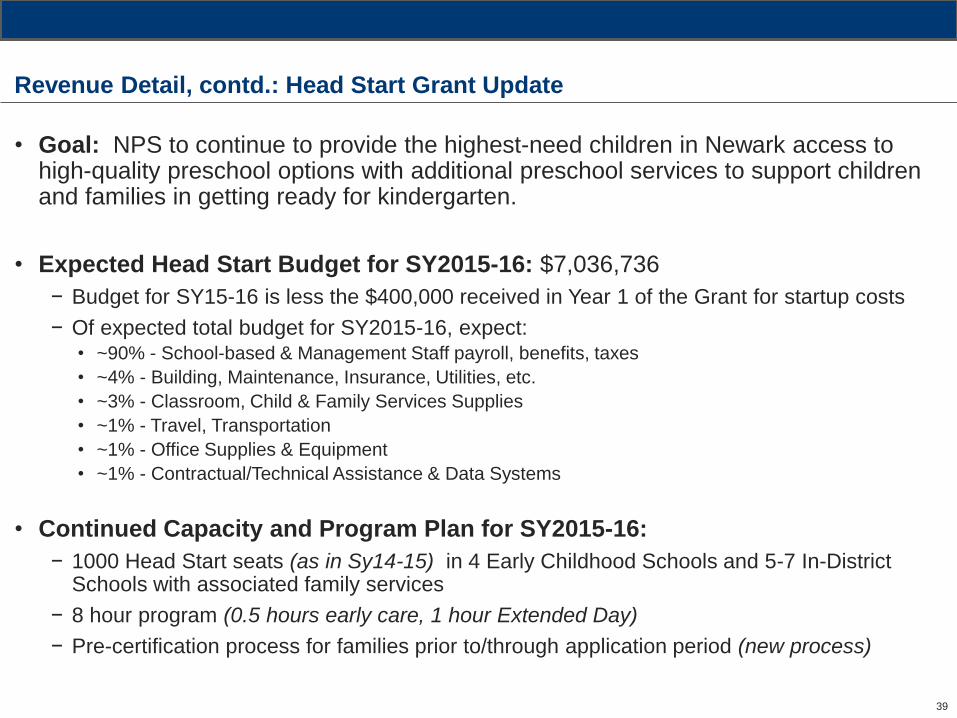
Revenue Detail, contd.: Head Start Grant Update
• Goal: NPS to continue to provide the highest-need children in Newark access to high-quality preschool options with additional preschool services to support children and families in getting ready for kindergarten.
• Expected Head Start Budget for SY2015-16: $7,036,736
− Budget for SY15-16 is less the $400,000 received in Year 1 of the Grant for startup costs
− Of expected total budget for SY2015-16, expect: • ~90% - School-based & Management Staff payroll, benefits, taxes
• ~4% - Building, Maintenance, Insurance, Utilities, etc.
• ~3% - Classroom, Child & Family Services Supplies
• ~1% - Travel, Transportation
• ~1% - Office Supplies & Equipment
• ~1% - Contractual/Technical Assistance & Data Systems
• Continued Capacity and Program Plan for SY2015-16:
− 1000 Head Start seats (as in Sy14-15) in 4 Early Childhood Schools and 5-7 In-District Schools with associated family services
− 8 hour program (0.5 hours early care, 1 hour Extended Day)
− Pre-certification process for families prior to/through application period (new process)
40
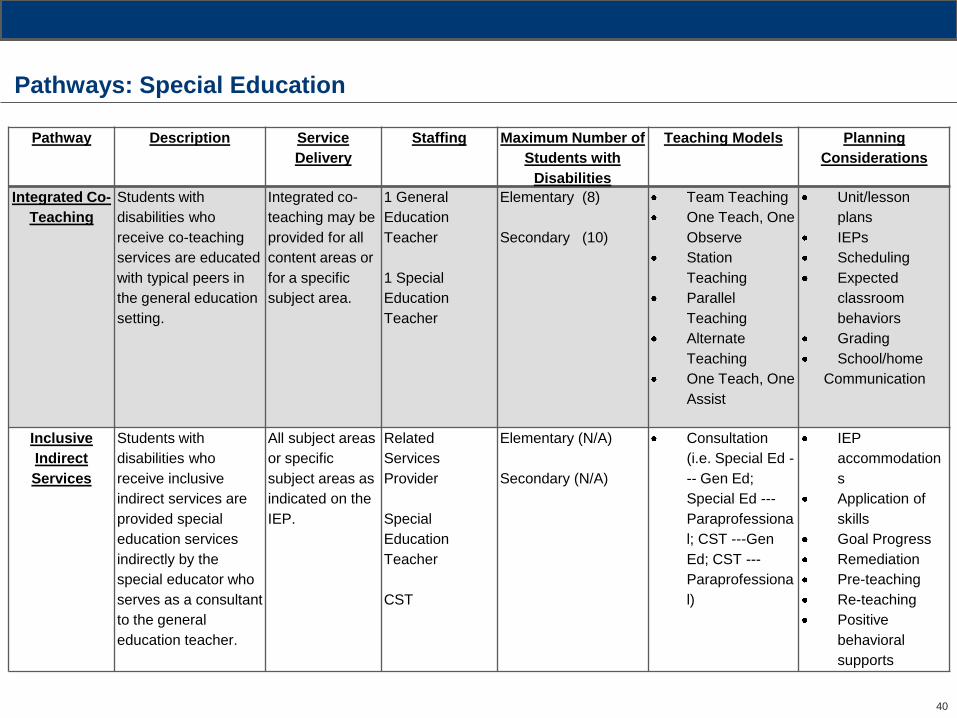
Pathways: Special Education
Pathway Description Service
Delivery
Staffing Maximum Number of
Students with
Disabilities
Teaching Models Planning
Considerations
Integrated Co-
Teaching
Students with
disabilities who
receive co-teaching
services are educated
with typical peers in
the general education
setting.
Integrated co-
teaching may be
provided for all
content areas or
for a specific
subject area.
1 General
Education
Teacher
1 Special
Education
Teacher
Elementary (8)
Secondary (10)
Team Teaching
One Teach, One
Observe
Station
Teaching
Parallel
Teaching
Alternate
Teaching
One Teach, One
Assist
Unit/lesson
plans
IEPs
Scheduling
Expected
classroom
behaviors
Grading
School/home
Communication
Inclusive
Indirect
Services
Students with
disabilities who
receive inclusive
indirect services are
provided special
education services
indirectly by the
special educator who
serves as a consultant
to the general
education teacher.
All subject areas
or specific
subject areas as
indicated on the
IEP.
Related
Services
Provider
Special
Education
Teacher
CST
Elementary (N/A)
Secondary (N/A)
Consultation
(i.e. Special Ed -
-- Gen Ed;
Special Ed ---
Paraprofessiona
l; CST ---Gen
Ed; CST ---
Paraprofessiona
l)
IEP
accommodation
s
Application of
skills
Goal Progress
Remediation
Pre-teaching
Re-teaching
Positive
behavioral
supports
41
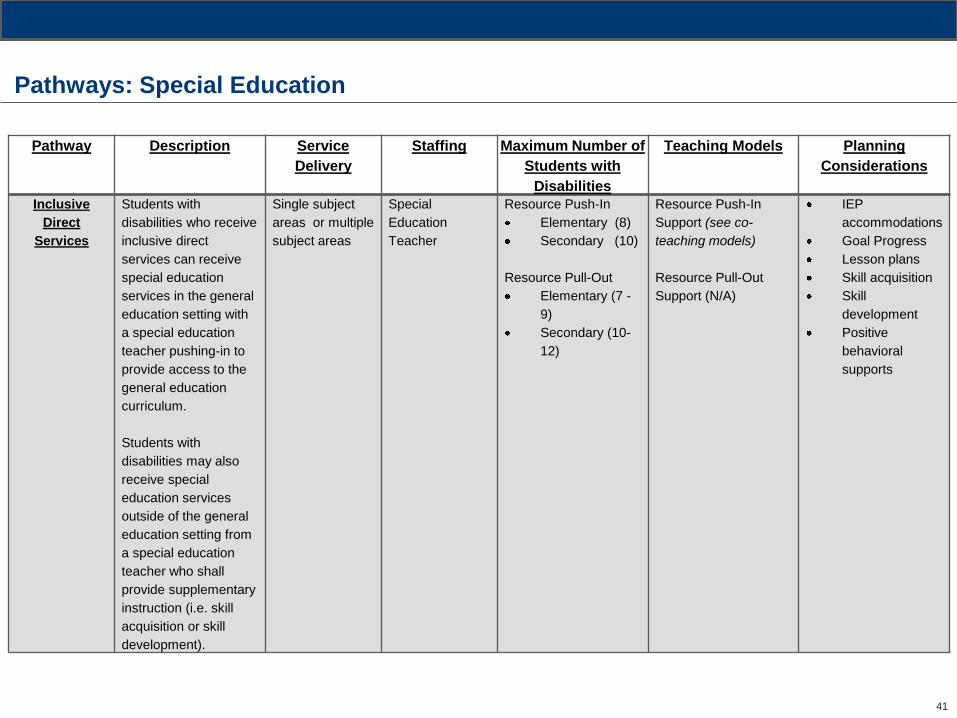
Pathways: Special Education
Pathway Description Service
Delivery
Staffing Maximum Number of
Students with
Disabilities
Teaching Models Planning
Considerations
Inclusive
Direct
Services
Students with
disabilities who receive
inclusive direct
services can receive
special education
services in the general
education setting with
a special education
teacher pushing-in to
provide access to the
general education
curriculum.
Students with
disabilities may also
receive special
education services
outside of the general
education setting from
a special education
teacher who shall
provide supplementary
instruction (i.e. skill
acquisition or skill
development).
Single subject
areas or multiple
subject areas
Special
Education
Teacher
Resource Push-In
Elementary (8)
Secondary (10)
Resource Pull-Out
Elementary (7 -
9)
Secondary (10-
12)
Resource Push-In
Support (see co-
teaching models)
Resource Pull-Out
Support (N/A)
IEP
accommodations
Goal Progress
Lesson plans
Skill acquisition
Skill
development
Positive
behavioral
supports
42
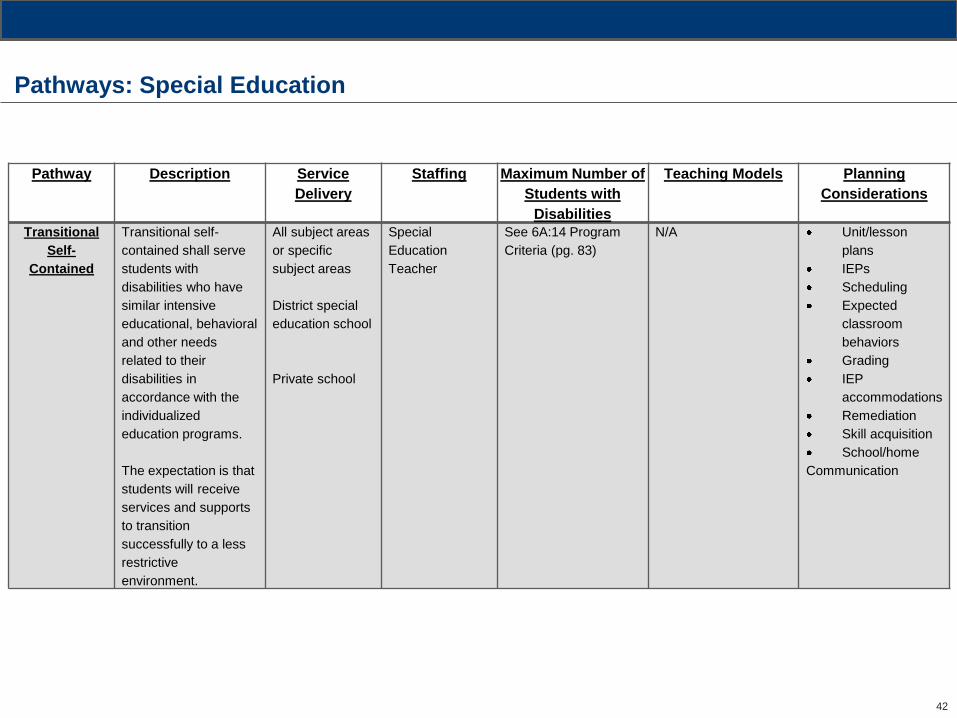
Pathways: Special Education
Pathway Description Service
Delivery
Staffing Maximum Number of
Students with
Disabilities
Teaching Models Planning
Considerations
Transitional
Self-
Contained
Transitional self-
contained shall serve
students with
disabilities who have
similar intensive
educational, behavioral
and other needs
related to their
disabilities in
accordance with the
individualized
education programs.
The expectation is that
students will receive
services and supports
to transition
successfully to a less
restrictive
environment.
All subject areas
or specific
subject areas
District special
education school
Private school
Special
Education
Teacher
See 6A:14 Program
Criteria (pg. 83)
N/A Unit/lesson
plans
IEPs
Scheduling
Expected
classroom
behaviors
Grading
IEP
accommodations
Remediation
Skill acquisition
School/home
Communication
43
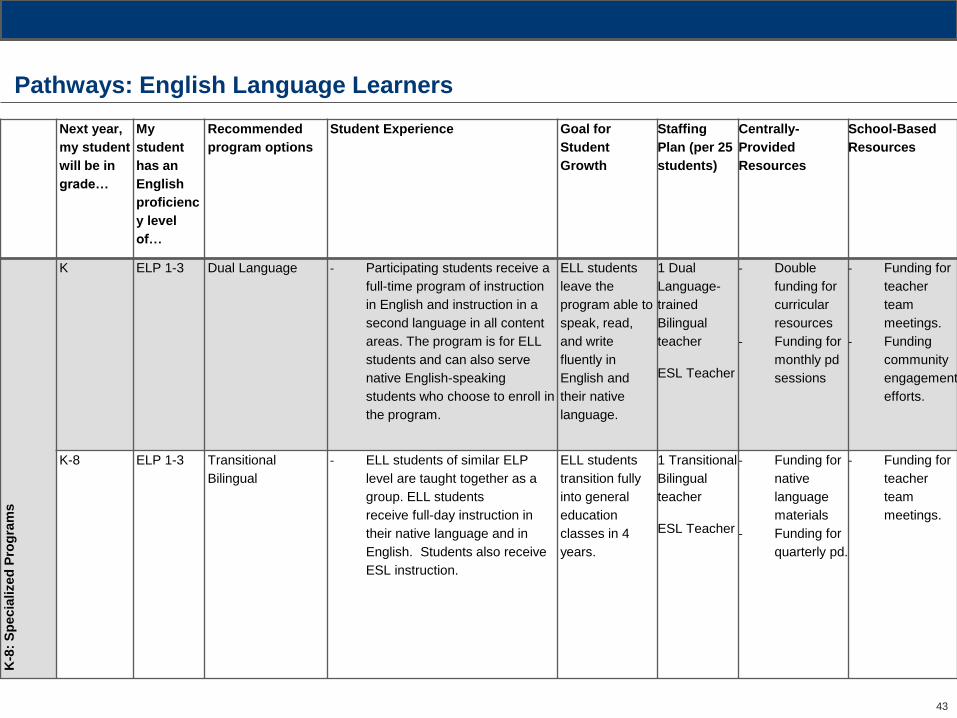
Pathways: English Language Learners
Next year,
my student
will be in
grade…
My
student
has an
English
proficienc
y level
of…
Recommended
program options
Student Experience Goal for
Student
Growth
Staffing
Plan (per 25
students)
Centrally-
Provided
Resources
School-Based
Resources
K-8
: S
pecia
lized
Pro
gra
ms
K ELP 1-3 Dual Language - Participating students receive a
full-time program of instruction
in English and instruction in a
second language in all content
areas. The program is for ELL
students and can also serve
native English-speaking
students who choose to enroll in
the program.
ELL students
leave the
program able to
speak, read,
and write
fluently in
English and
their native
language.
1 Dual
Language-
trained
Bilingual
teacher
ESL Teacher
- Double
funding for
curricular
resources
- Funding for
monthly pd
sessions
- Funding for
teacher
team
meetings.
- Funding
community
engagement
efforts.
K-8 ELP 1-3 Transitional
Bilingual
- ELL students of similar ELP
level are taught together as a
group. ELL students
receive full-day instruction in
their native language and in
English. Students also receive
ESL instruction.
ELL students
transition fully
into general
education
classes in 4
years.
1 Transitional
Bilingual
teacher
ESL Teacher
- Funding for
native
language
materials
- Funding for
quarterly pd.
- Funding for
teacher
team
meetings.
44
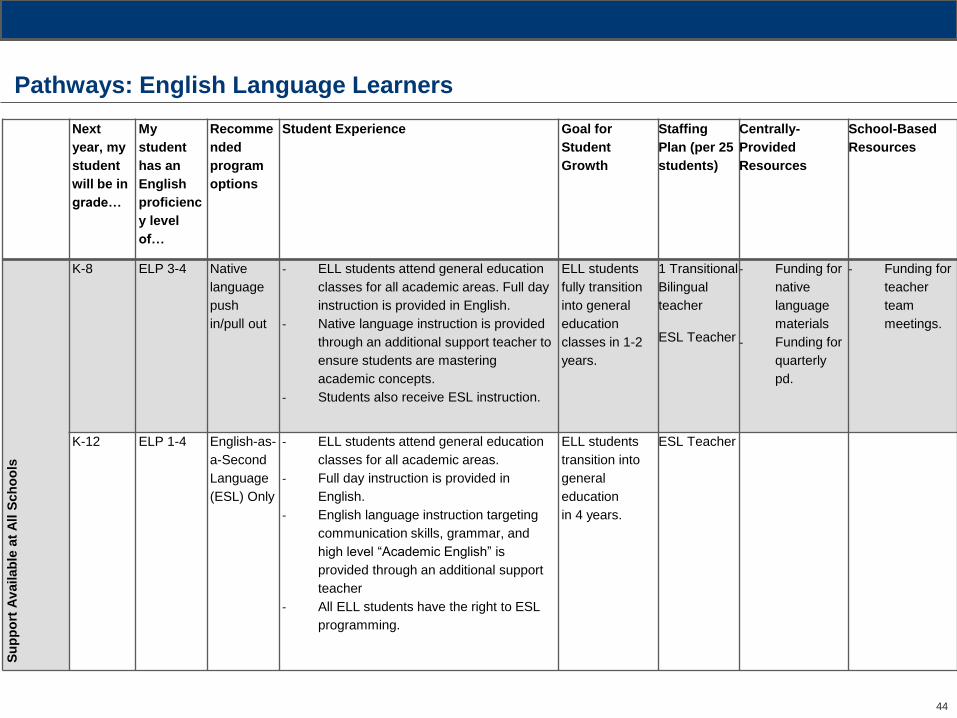
Pathways: English Language Learners
Next
year, my
student
will be in
grade…
My
student
has an
English
proficienc
y level
of…
Recomme
nded
program
options
Student Experience Goal for
Student
Growth
Staffing
Plan (per 25
students)
Centrally-
Provided
Resources
School-Based
Resources
Su
pp
ort
Av
ailab
le a
t A
ll S
ch
oo
ls
K-8 ELP 3-4 Native
language
push
in/pull out
- ELL students attend general education
classes for all academic areas. Full day
instruction is provided in English.
- Native language instruction is provided
through an additional support teacher to
ensure students are mastering
academic concepts.
- Students also receive ESL instruction.
ELL students
fully transition
into general
education
classes in 1-2
years.
1 Transitional
Bilingual
teacher
ESL Teacher
- Funding for
native
language
materials
- Funding for
quarterly
pd.
- Funding for
teacher
team
meetings.
K-12 ELP 1-4 English-as-
a-Second
Language
(ESL) Only
- ELL students attend general education
classes for all academic areas.
- Full day instruction is provided in
English.
- English language instruction targeting
communication skills, grammar, and
high level “Academic English” is
provided through an additional support
teacher
- All ELL students have the right to ESL
programming.
ELL students
transition into
general
education
in 4 years.
ESL Teacher

45
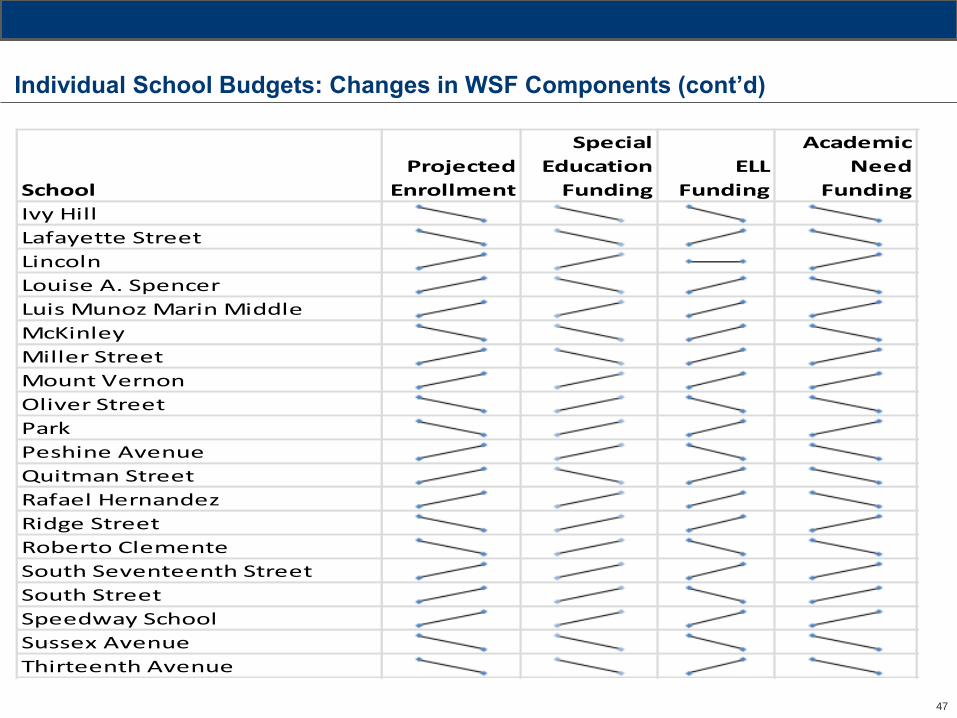
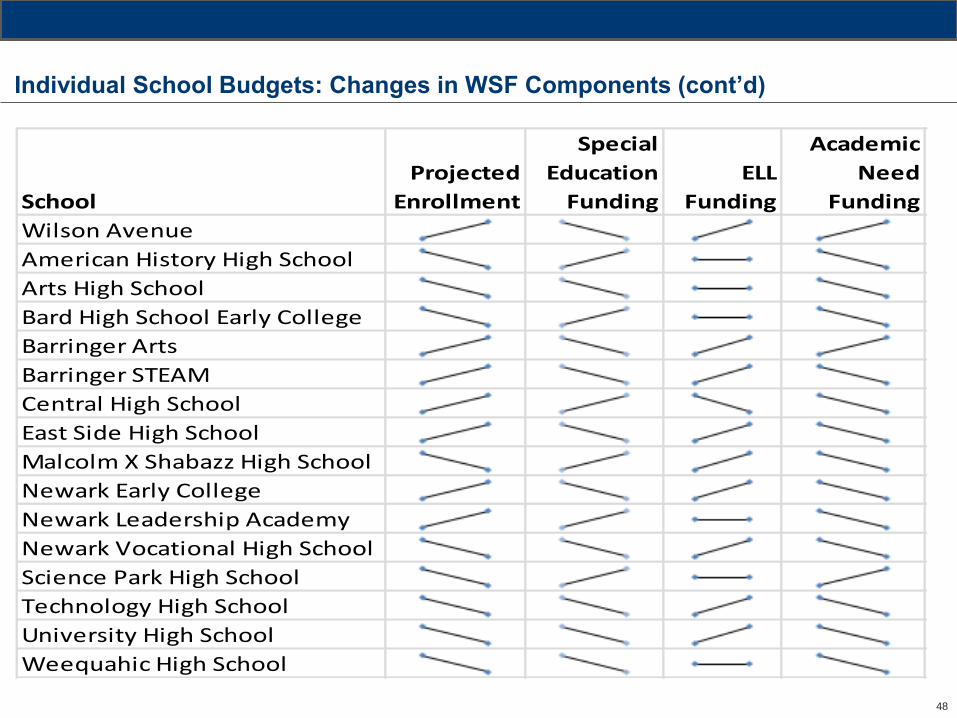
Individual School Budgets: Changes in WSF Components
• The following pages indicate student funding trends based on projected
FY2015-2016 enrollment compared to FY2014-15 enrollment
• Legend:
− Increase in Enrollment Projection:
− Flat Enrollment Projection:
− Decrease in Enrollment Projection:
* Assumes district is able to meet all budget priorities. Per pupil figures do NOT include funds budgeted centrally.

46
Individual School Budgets: Changes in WSF Components
School
Projected
Enrollment
Special
Education
Funding
ELL
Funding
Academic
Need
Funding
Abington Avenue
Ann Street
Avon Avenue
Belmont Runyon
Branch Brook
Camden Street
Chancellor Avenue
Cleveland
Dr. E. Alma Flagg
Dr. William H. Horton
Eagle Academy
Elliott Street
First Avenue
Fourteenth Avenue
Franklin
George W. Carver
Girl's Academy of Newark
Harriet Tubman
Hawkins Street
Hawthorne Avenue
47
Individual School Budgets: Changes in WSF Components (cont’d)
School
Projected
Enrollment
Special
Education
Funding
ELL
Funding
Academic
Need
Funding
Ivy Hill
Lafayette Street
Lincoln
Louise A. Spencer
Luis Munoz Marin Middle
McKinley
Miller Street
Mount Vernon
Oliver Street
Park
Peshine Avenue
Quitman Street
Rafael Hernandez
Ridge Street
Roberto Clemente
South Seventeenth Street
South Street
Speedway School
Sussex Avenue
Thirteenth Avenue
48
Individual School Budgets: Changes in WSF Components (cont’d)
School
Projected
Enrollment
Special
Education
Funding
ELL
Funding
Academic
Need
Funding
Wilson Avenue
American History High School
Arts High School
Bard High School Early College
Barringer Arts
Barringer STEAM
Central High School
East Side High School
Malcolm X Shabazz High School
Newark Early College
Newark Leadership Academy
Newark Vocational High School
Science Park High School
Technology High School
University High School
Weequahic High School

49
Individual School Budgets: Preliminary Allocations
School Enrollment Total Budget Overall Dollar per Student
FY15
Proj.
FY15
Act.
FY16
Orig.
Proj.
% Chg.
FY15
Proj to
FY16
Proj.
% Chg.
FY15 Act.
to FY16
Proj. FY15 FY16 Prel.
% Chg.
FY15 to
FY16 Proj.
Abington Avenue 744 717 776 4.30% 8.23% $6,297,717 $6,718,265 6.68%
Ann Street 1389 1336 1336 -3.82% 0.00% $9,568,450 $10,755,348 12.40%
Branch Brook 168 156 120 -28.57% -23.08% $1,795,858 $1,737,718 -3.24%
Dr. William H. Horton 796 814 794 -0.25% -2.46% $6,756,417 $7,474,217 10.62%
First Avenue 1082 1062 1060 -2.03% -0.19% $8,301,211 $8,643,814 4.13%
Harriet Tubman 319 328 347 8.78% 5.79% $2,834,129 $3,295,495 16.28%
Hawkins Street 645 634 691 7.13% 8.99% $5,214,560 $6,129,399 17.54%
Luis Munoz Marin Middle 920 940 987 7.28% 5.00% $7,698,534 $9,602,813 24.74%
Ivy Hill 561 521 522 -6.95% 0.19% $5,159,747 $5,049,239 -2.14%
Lafayette Street 1030 1007 1016 -1.36% 0.89% $7,847,843 $8,009,323 2.06%
Oliver Street 964 934 932 -3.32% -0.21% $7,427,733 $8,048,509 8.36%
Park 855 816 852 -0.35% 4.41% $6,666,359 $7,177,255 7.66%
South Street 342 328 345 0.88% 5.18% $2,968,359 $3,150,579 6.14%
Speedway School 564 539 578 2.48% 7.24% $4,570,267 $5,527,849 20.95%
50
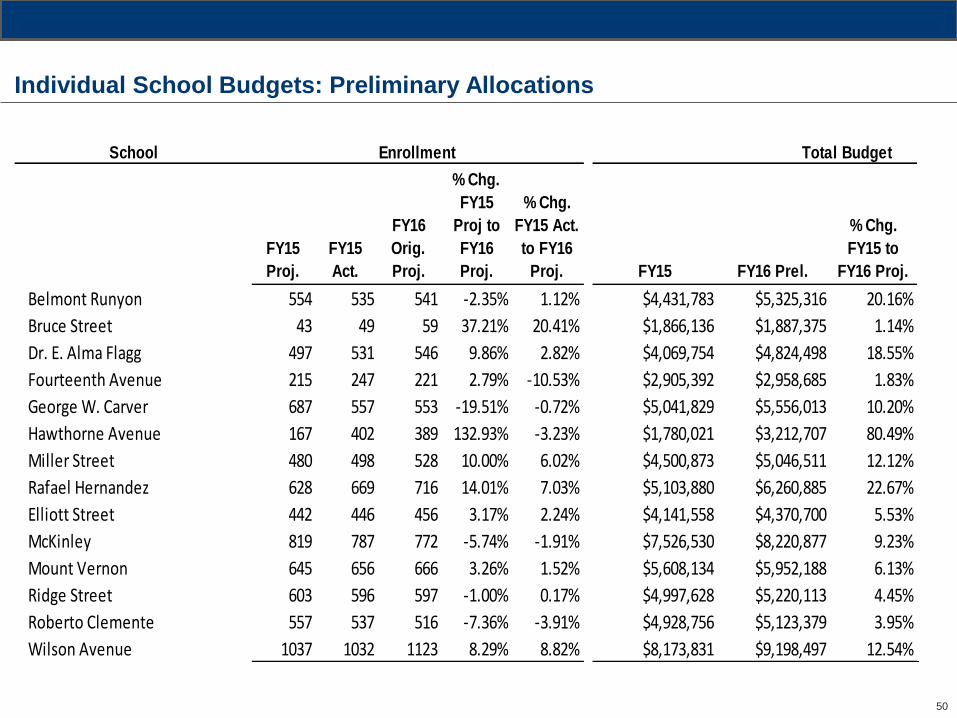
Individual School Budgets: Preliminary Allocations
School Enrollment Total Budget Overall Dollar per Student
FY15
Proj.
FY15
Act.
FY16
Orig.
Proj.
% Chg.
FY15
Proj to
FY16
Proj.
% Chg.
FY15 Act.
to FY16
Proj. FY15 FY16 Prel.
% Chg.
FY15 to
FY16 Proj.
Belmont Runyon 554 535 541 -2.35% 1.12% $4,431,783 $5,325,316 20.16%
Bruce Street 43 49 59 37.21% 20.41% $1,866,136 $1,887,375 1.14%
Dr. E. Alma Flagg 497 531 546 9.86% 2.82% $4,069,754 $4,824,498 18.55%
Fourteenth Avenue 215 247 221 2.79% -10.53% $2,905,392 $2,958,685 1.83%
George W. Carver 687 557 553 -19.51% -0.72% $5,041,829 $5,556,013 10.20%
Hawthorne Avenue 167 402 389 132.93% -3.23% $1,780,021 $3,212,707 80.49%
Miller Street 480 498 528 10.00% 6.02% $4,500,873 $5,046,511 12.12%
Rafael Hernandez 628 669 716 14.01% 7.03% $5,103,880 $6,260,885 22.67%
Elliott Street 442 446 456 3.17% 2.24% $4,141,558 $4,370,700 5.53%
McKinley 819 787 772 -5.74% -1.91% $7,526,530 $8,220,877 9.23%
Mount Vernon 645 656 666 3.26% 1.52% $5,608,134 $5,952,188 6.13%
Ridge Street 603 596 597 -1.00% 0.17% $4,997,628 $5,220,113 4.45%
Roberto Clemente 557 537 516 -7.36% -3.91% $4,928,756 $5,123,379 3.95%
Wilson Avenue 1037 1032 1123 8.29% 8.82% $8,173,831 $9,198,497 12.54%

51
Individual School Budgets: Preliminary Allocations
School Enrollment Total Budget Overall Dollar per Student
FY15
Proj.
FY15
Act.
FY16
Orig.
Proj.
% Chg.
FY15
Proj to
FY16
Proj.
% Chg.
FY15 Act.
to FY16
Proj. FY15 FY16 Prel.
% Chg.
FY15 to
FY16 Proj.
Avon Avenue 689 632 626 -9.14% -0.95% $5,280,121 $5,302,325 0.42%
Camden Street 645 598 621 -3.72% 3.85% $7,224,295 $7,833,585 8.43%
Chancellor Avenue 570 544 566 -0.70% 4.04% $5,449,643 $6,131,741 12.52%
Cleveland 458 401 415 -9.39% 3.49% $4,156,811 $4,300,843 3.46%
Franklin 636 628 680 6.92% 8.28% $5,935,251 $6,504,723 9.59%
Lincoln 416 431 425 2.16% -1.39% $3,489,657 $3,707,667 6.25%
Louise A. Spencer 425 411 427 0.47% 3.89% $4,976,567 $4,540,257 -8.77%
Peshine Avenue 731 688 795 8.76% 15.55% $6,216,332 $7,018,758 12.91%
Quitman Street 585 589 647 10.60% 9.85% $5,868,583 $6,195,272 5.57%
South Seventeenth Street 456 502 498 9.21% -0.80% $4,003,738 $4,451,996 11.20%
Sussex Avenue 509 485 505 -0.79% 4.12% $4,150,570 $4,593,749 10.68%
Thirteenth Avenue 716 724 690 -3.63% -4.70% $7,638,384 $7,032,665 -7.93%
52
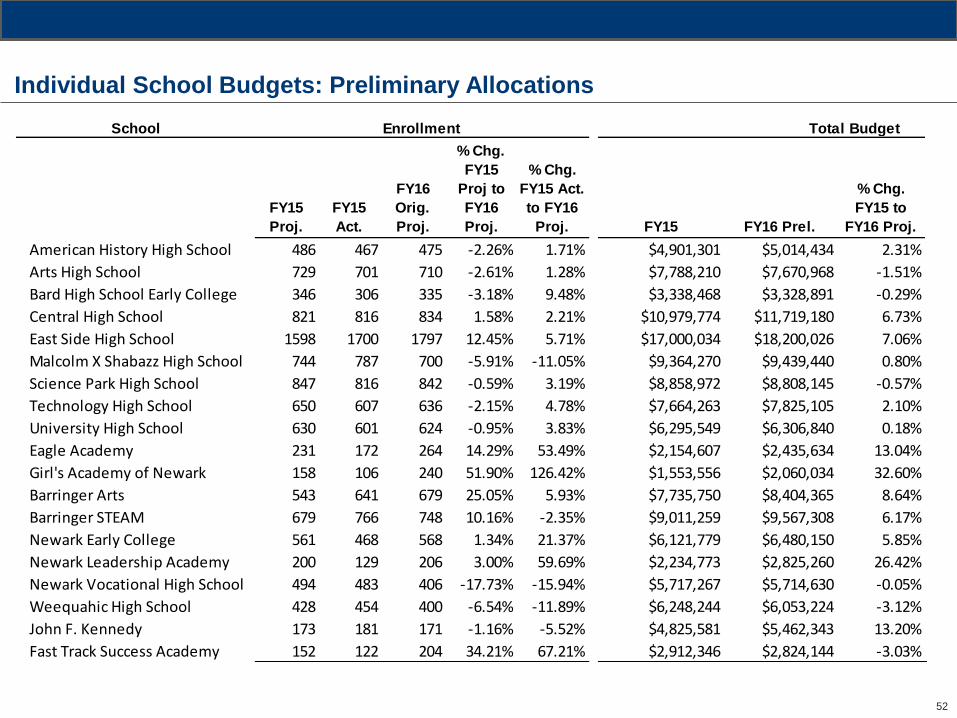
Individual School Budgets: Preliminary Allocations
School Enrollment Total Budget Overall Dollar per Student
FY15
Proj.
FY15
Act.
FY16
Orig.
Proj.
% Chg.
FY15
Proj to
FY16
Proj.
% Chg.
FY15 Act.
to FY16
Proj. FY15 FY16 Prel.
% Chg.
FY15 to
FY16 Proj.
American History High School 486 467 475 -2.26% 1.71% $4,901,301 $5,014,434 2.31%
Arts High School 729 701 710 -2.61% 1.28% $7,788,210 $7,670,968 -1.51%
Bard High School Early College 346 306 335 -3.18% 9.48% $3,338,468 $3,328,891 -0.29%
Central High School 821 816 834 1.58% 2.21% $10,979,774 $11,719,180 6.73%
East Side High School 1598 1700 1797 12.45% 5.71% $17,000,034 $18,200,026 7.06%
Malcolm X Shabazz High School 744 787 700 -5.91% -11.05% $9,364,270 $9,439,440 0.80%
Science Park High School 847 816 842 -0.59% 3.19% $8,858,972 $8,808,145 -0.57%
Technology High School 650 607 636 -2.15% 4.78% $7,664,263 $7,825,105 2.10%
University High School 630 601 624 -0.95% 3.83% $6,295,549 $6,306,840 0.18%
Eagle Academy 231 172 264 14.29% 53.49% $2,154,607 $2,435,634 13.04%
Girl's Academy of Newark 158 106 240 51.90% 126.42% $1,553,556 $2,060,034 32.60%
Barringer Arts 543 641 679 25.05% 5.93% $7,735,750 $8,404,365 8.64%
Barringer STEAM 679 766 748 10.16% -2.35% $9,011,259 $9,567,308 6.17%
Newark Early College 561 468 568 1.34% 21.37% $6,121,779 $6,480,150 5.85%
Newark Leadership Academy 200 129 206 3.00% 59.69% $2,234,773 $2,825,260 26.42%
Newark Vocational High School 494 483 406 -17.73% -15.94% $5,717,267 $5,714,630 -0.05%
Weequahic High School 428 454 400 -6.54% -11.89% $6,248,244 $6,053,224 -3.12%
John F. Kennedy 173 181 171 -1.16% -5.52% $4,825,581 $5,462,343 13.20%
Fast Track Success Academy 152 122 204 34.21% 67.21% $2,912,346 $2,824,144 -3.03%
53
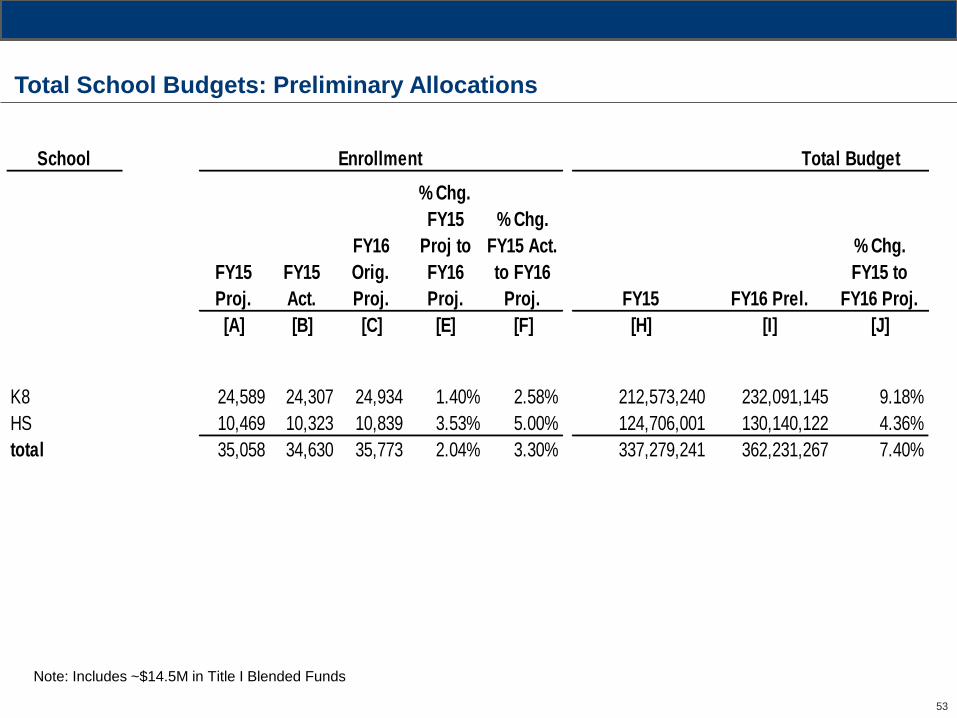
Total School Budgets: Preliminary Allocations
School Enrollment Total Budget Overall Dollar per Student
FY15
Proj.
FY15
Act.
FY16
Orig.
Proj.
% Chg.
FY15
Proj to
FY16
Proj.
% Chg.
FY15 Act.
to FY16
Proj. FY15 FY16 Prel.
% Chg.
FY15 to
FY16 Proj.
[A] [B] [C] [E] [F] [H] [I] [J]
K8 24,589 24,307 24,934 1.40% 2.58% 212,573,240 232,091,145 9.18%
HS 10,469 10,323 10,839 3.53% 5.00% 124,706,001 130,140,122 4.36%
total 35,058 34,630 35,773 2.04% 3.30% 337,279,241 362,231,267 7.40%
Note: Includes ~$14.5M in Title I Blended Funds
54
Proposed School Advisory Board Budget FY16
• The district has created a proposed budget for the School Advisory Board for
FY16 equal to $21,000.
• The budget is made up of the following main categories:
− $12,000 SAB meeting(s) taping
− $ 6,000 SAB meeting food
− $ 1,500 technology upgrades
− $ 650 new member placards/business cards