fiscal year 2018/19 annual results › documents › en › ir › briefing...3. statement of income...
TRANSCRIPT

Fiscal Year 2018/19 Annual Results
May 24, 2019

Summary of Financial Results for FY2018 Ended March 31, 2019
(April 1, 2018 – March 31, 2019)

1 . Business environment
Japanese economy
Global economy
USA
Europe
China
Steady employment environment
Increases in capital investment and improvements in corporate performance
The economy continued to be on a moderate
recovery track, however, it slowed down
in the second half.
H1: staved off the slowdown in its economic growth and
showed signs of recovery.
H2: decelerated by slowdown of capital investments and
decrease in exports due to US-China trade friction.
continued solid economic growth due to improvement of employment environment and steady growth of consumer spending
recovered moderately despite the uncertainty due to Brexit.

2. FY2018 sales and profit factors
Net sales 27,121 mil. yen +7.2 % (year-to-year)
Operating income 2,787 mil. yen - 8.5 % (year-to-year)
Operating income margin 10.3 % 12.0 % (pervious period)
ROE 9.3 % 11.2 % (pervious period)
Dividend 75 yen (outlook) 75 yen (pervious period)
• Thermistor sensors for air conditioners and automobiles were strong.
• Costs increased to meet surging demand for thermistor sensors for air conditioners.
• Large capital investment was made to meet expanding demand for thermistor elements and thermistor sensors, resulting in an increase in expenses such as depreciation.
• Sales were sluggish in the second half due to China’s economic slowdown.

3. Statement of income (Summary)
FY2017 (ended March 31, 2018) FY2018 (ended March 31, 2019)
Amount Composition
ratioAmount
Composition
ratio
Comparison
with last year
Net sales 25,289 100.0 27,121 100.0 1,832
Cost of sales 19,102 75.5 20,897 77.0 1,794
Gross profit 6,186 24.5 6,224 23.0 38
Selling, general and
administrative expenses3,141 12.4 3,437 12.7 296
Operating income 3,045 12.0 2,787 10.3 -258
Non-operating income 88 0.3 114 0.4 26
Non-operating expenses 62 0.2 38 0.1 -23
Ordinary income 3,071 12.1 2,863 10.6 -208
Extraordinary income 0 0.0 0 0.0 0
Extraordinary loss 36 0.1 56 0.2 20
Income taxes and others 744 2.9 746 2.8 2
Net income attributable to
owners of the parent2,280 9.0 2,055 7.6 -225
ROE(%) 11.2 ― 9.3 ― ―
(Amount: mil. yen, comparison: %)

4. Net sales and operating income
14,546
13,099
16,548 17,086 16,143
18,757
20,113
21,261
22,071
25,289 27,121
27,500
1,214
869
2,055 1,778
849
1,366
1,889
1,663
2,394
3,045
2,787
2,500
0
2,500
5,000
0
15,000
30,000
FY2008 FY2009 FY2010 FY2011 FY2012 FY2013 FY2014 FY2015 FY2016 FY2017 FY2018 FY2019
Outlook
Net sales Operating income
(Mil. yen) (Mil. yen)

5. Balance sheet (Summary)
Mar. 31,
2018
Mar. 31,
2019Change
Current liabilities 7,760 9,024 1,263
Account payable 3,749 4,276 527
Short-term loan
payable831 1,124 293
Others 3,180 3,623 443
Noncurrent liabilities 1,503 2,973 1,470
Long-term loan
payable1,167 2,596 1,428
Others 335 377 41
Total liabilities 9,263 11,997 2,733
Net assets 21,468 22,678 1,210
Total liabilities and
net assets30,732 34,676 3,943
Mar. 31,
2018
Mar. 31,
2019Change
Current assets 21,047 22,512 1,465
Cash and
deposits 7,130 7,480 349
Account
receivable7,373 7,377 4
Inventory assets 5,699 6,614 915
Others 844 1,040 196
Noncurrent assets 9,684 12,163 2,478
Property, plant
and equipment8,477 10,895 2,418
Intangible assets 132 125 -7
Investments and
other assets1,074 1,142 67
Total assets 30,732 34,676 3,943
(Mil. yen)
Assets Liabilities and shareholders’ equity
(Mil. yen)

18,126 18,441
19,343
21,468
22,678
68.170.6 70.9 69.7
65.3
-10
0
10
20
30
40
50
60
70
80
5,000
15,000
25,000
Mar. 31,
2015
Mar. 31,
2016
Mar. 31,
2017
Mar. 31
2018
Mar. 31,
2019
6. Balance sheet items
(Mil. yen)
26,462 25,987 27,113
30,732
34,676
Mar. 31,
2015
Mar. 31,
2016
Mar. 31,
2017
Mar. 31,
2018
Mar. 31,
2019
4,340
4,799
5,091
5,699
6,614
Mar. 31,
2015
Mar. 31,
2016
Mar. 31,
2017
Mar. 31,
2018
Mar. 31,
2019
(Mil. yen) (Mil. yen)
Shareholders’ equity and equity ratioInventory assetsTotal assets
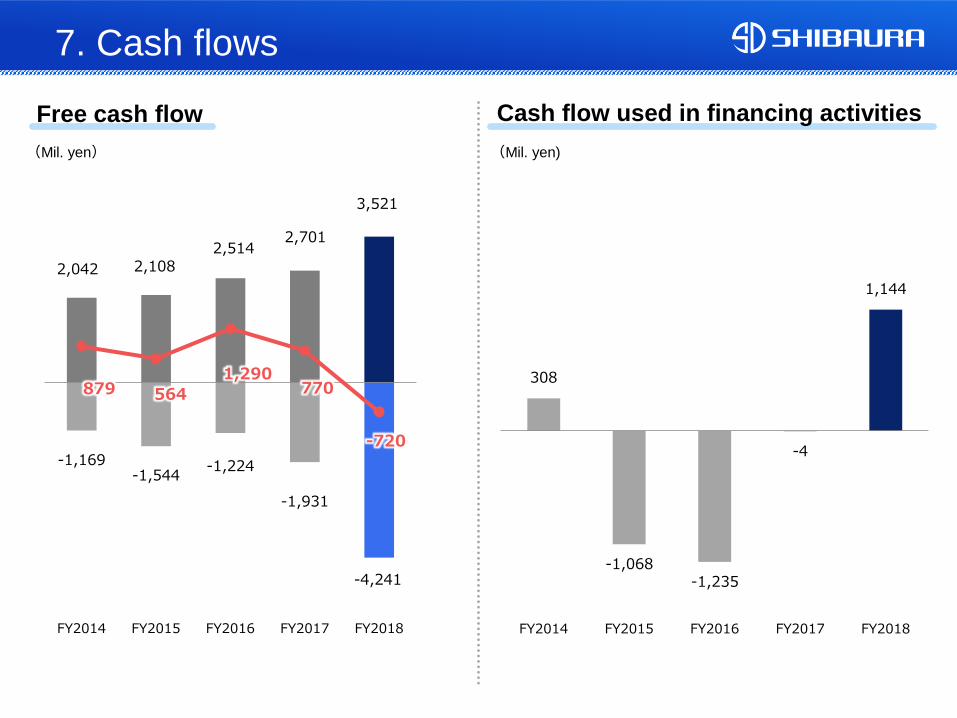
7. Cash flows
308
-1,068 -1,235
-4
1,144
FY2014 FY2015 FY2016 FY2017 FY2018
(Mil. yen)
Cash flow used in financing activities
-1,169 -1,544
-1,224
-1,931
-4,241
2,042 2,108 2,514
2,701
3,521
879 564
1,290 770
-720
-4,500
-3,500
-2,500
-1,500
-500
500
1,500
2,500
3,500
4,500
FY2014 FY2015 FY2016 FY2017 FY2018
(Mil. yen)
Free cash flow

(Mil. yen)(Mil. yen)
1,392
1,282
1,369
1,685
2,040
1,562
1,214
1,941
4,198
2,000
8. Capital expenditure, depreciation, R&D expenditure
(Mil. yen)
Capital expenditure DepreciationResearch and development
expenditures
435 438
724
386
500
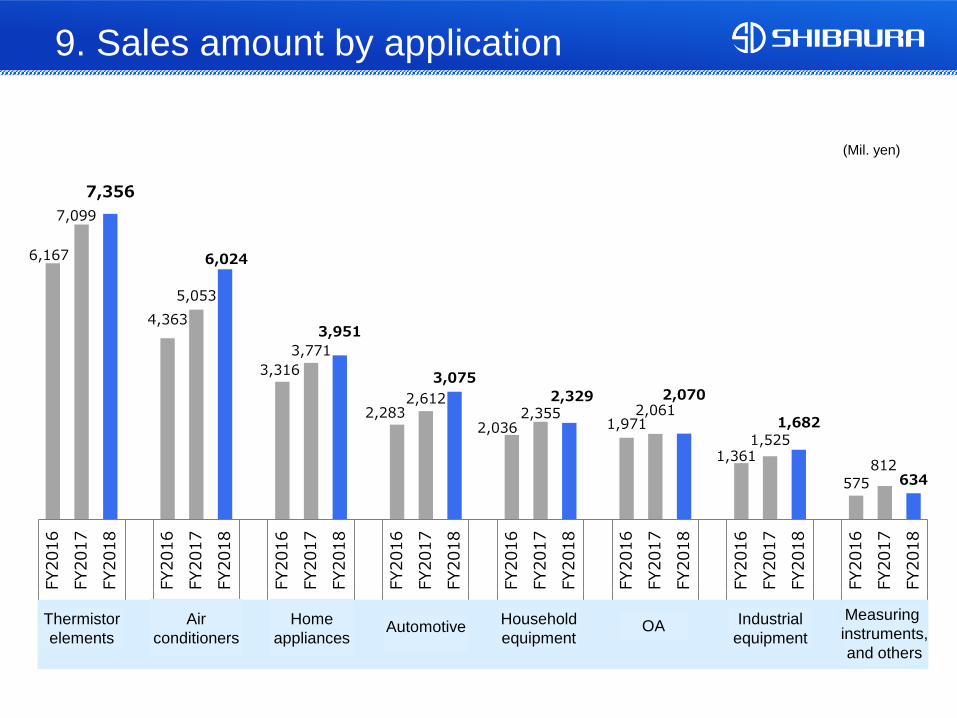
6,167
7,099
7,356
4,363
5,053
6,024
3,316
3,771
3,951
2,283 2,612
3,075
2,036 2,355
2,329
1,971 2,061
2,070
1,361 1,525
1,682
575
812 634
FY2016
FY2017
FY2018
FY2016
FY2017
FY2018
FY2016
FY2017
FY2018
FY2016
FY2017
FY2018
FY2016
FY2017
FY2018
FY2016
FY2017
FY2018
FY2016
FY2017
FY2018
FY2016
FY2017
FY2018
素子 空調機器 家電 自動車 住設機器 OA Industrial
equipment
Measuring
equipment
9. Sales amount by application
(Mil. yen)
Thermistor
elements
Air
conditioners
Home
appliancesAutomotive
Household
equipment
Industrial
equipmentOA
Measuring
instruments,
and others

10. Sales by application
Automotive
Air conditioners
Homeappliances
Household
equipment
OA
Industrial equipment
Others
FY 2017Ended Mar. 31, 2018
29.6%
20.7%17.1%
10.8%
8.4%
6.9%
Automotive
Air conditioners
Home appliances
10.3%
7.8%
7.0% 29.6%
22.8%16.9%
FY 2018Ended Mar. 31, 2019Household
equipment
OA
Industrial equipment
Others

11. FY2019 (ending March 31, 2020) business outlook
Net sales 27,500 mil. yen +1.4% (year-to-year)
Operating income 2,500 mil. yen -10.3% (year-to-year)
・Global economy has many uncertain factors.
- US-China trade friction, Brexit, protectionism, etc.
・Japanese economy is slowing and its future outlook is unclear.
・Demand for temperature sensors is expected to remain strong.
・Depreciation is to increase due to aggressive capital investment.
- Production capacity expansion and production efficiency
enhancement enable us to meet growing demand in a timely
manner.

12. FY2019 (ending March 31, 2020) business outlook
FY2018
actual
H1 FY2019
outlook
H2 FY2019
outlook
FY2019
full year
outlook
Net sales27,121 13,500 14,000 27,500
(7.2) (-0.9) (3.7) (1.4)
Operating income2,787 1,100 1,400 2,500
(-8.5) (-29.3) (13.6) (-10.3)
Ordinary income2,863 1,110 1,390 2,500
(-6.8) (-28.9) (6.8) (-12.7)
Net income
attributable to
owners of the parent
2,055 810 1,010 1,820
(-9.9) (-26.3) (5.6) (-11.4)
(Amount: mil. yen, comparison: %)
( ): Year-to-year comparison

Business Deployment

13. Growth strategy
Further enhancement of
research & development system
Focus on “green-oriented”, “energy-saving”
and “safety-related” fields
Aggressive expansion into overseas markets
Enhancement of production system
Aggressive investment toward market share expansion

14. Enhancement of production system
Aomori constructed its 3rd building.
Shanghai moved to expand floor space.
Thai constructed its 5th building.
Fukushima constructed its 2nd factory (Matsukawa).
Fukushima renovated the acquired adjacent factory.
Kakunodate constructed its 3rd building.
Tohoku constructed its 3rd building.
Fukushima completed the construction of its 10th building.
Sep. 2012
Dec. 2013
Apr. 2015
Jul. 2017
Sep. 2017
Dec. 2017
May 2019
Thai constructed its 6th building.Jun. 2018

15. Aggressive expansion into overseas markets
Sales Division
Overseas Sales Department
Japan
China
Shanghai Shibaura
Electronics Co., Ltd.*
Dongguan Shibaura
Electronics Co., Ltd.*
Shibaura Electronics
Hong Kong Co., Ltd.
*Sales divisions of the manufacturing sites
Shibaura Electronics USA
America
Sales network in Europe, America, and China
Shibaura Electronics
Europe GmbH (Germany)
Europe
Collaborate with a distributor Collaborate with
a sales representativeCollaborate with a distributor

16. Focus on “green-oriented”, “energy-saving” and “safety-related” fields
Responding to the environmental needs which continue to increase globally
Larger share in growing fieldsExpanding
applications
<<World trends>>
Green-oriented
Energy-saving
Highly-functional
Safety-related
Thermistor elements
Household equipment
Air conditioners
Home appliances
OA
Industrial equipment
Automotive
-Colorization -Highly-functional (Non-contact)
-Green-oriented -Energy-saving -Safety-related
-Green-oriented -Energy-saving -Europe & Emerging Countries -Safety-related
-Green-oriented -Energy-saving -All electrification -Highly-functional -Emerging countries
-High quality -Wide temperature range -Large supply
-Green-oriented -Energy-saving -Production automatization -Robot
-Green-oriented -Energy-saving -Hybrid -EV
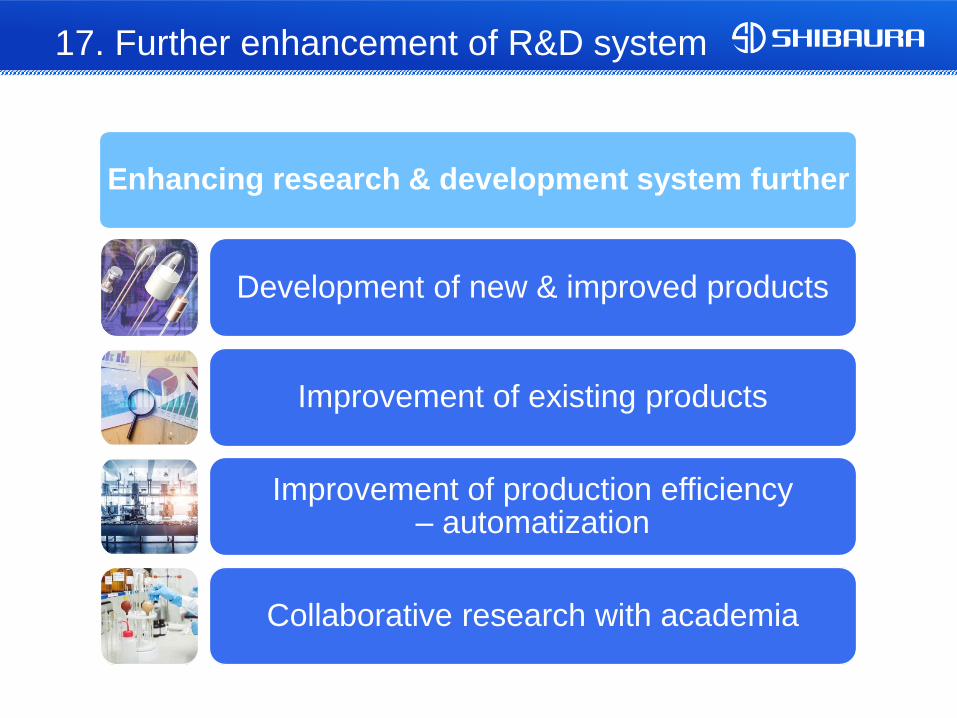
17. Further enhancement of R&D system
Enhancing research & development system further
Development of new & improved products
Improvement of existing products
Improvement of production efficiency – automatization
Collaborative research with academia
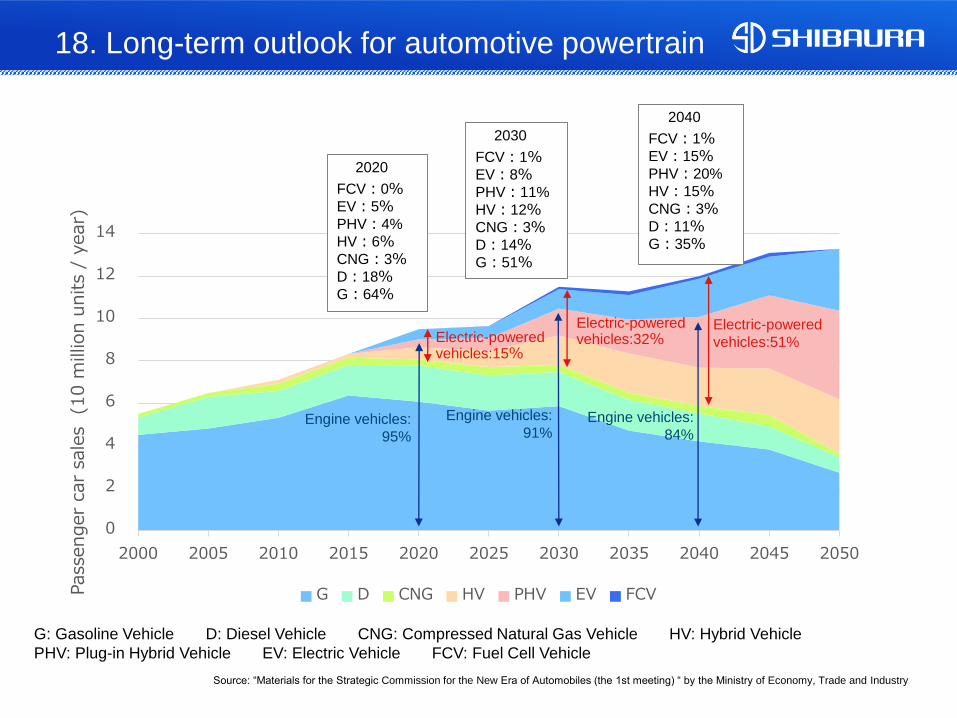
18. Long-term outlook for automotive powertrain
0
2
4
6
8
10
12
14
2000 2005 2010 2015 2020 2025 2030 2035 2040 2045 2050
Pass
enger
car
sale
s (
10 m
illion u
nits
/ year)
G D CNG HV PHV EV FCV
2020
FCV:0%EV:5%PHV:4%
HV:6%CNG:3%D:18%G:64%
2030
FCV:1%EV:8%PHV:11%
HV:12%CNG:3%D:14%G:51%
2040
FCV:1%EV:15%PHV:20%
HV:15%CNG:3%D:11%G:35%
G: Gasoline Vehicle D: Diesel Vehicle CNG: Compressed Natural Gas Vehicle HV: Hybrid Vehicle
PHV: Plug-in Hybrid Vehicle EV: Electric Vehicle FCV: Fuel Cell Vehicle
Source: “Materials for the Strategic Commission for the New Era of Automobiles (the 1st meeting) “ by the Ministry of Economy, Trade and Industry
Electric-powered vehicles:15%
Engine vehicles:
95%
Engine vehicles:
91%Engine vehicles:
84%
Electric-powered vehicles:32%
Electric-powered
vehicles:51%

19. Shareholder return
25 30
35 40 40
50 55
60
75 75 75
23.417.3 20.7
61.4
26.5 23.6
35.2 25.5 25.3 28.1
31.8
-100
-80
-60
-40
-20
0
20
40
60
0
10
20
30
40
50
60
70
80
90
100
2010 2011 2012 2013 2014 2015 2016 2017 2018 2019 2020
(Outlook)
Stable dividend
Dividend (yen)
Dividend payout ratio (%)

Disclaimer regarding forward-looking statements
The foregoing statements regarding future results reflect the Company‘s expectations based on information available at the time of announcement. The information contains certain forward-looking statements that are subject to known and unknown risks and uncertainties that could cause actual results to differ materially from those expressed or implied by such statements.
Thank you very much.

References

Corporate name SHIBAURA ELECTRONICS CO., LTD.
Start of operation March 3, 1953
Head office Kamiochiai, Chuo-ku, Saitama City, Saitama, Japan
Representative Hiroyuki Hashikura, President
Business
Manufacturing and sales of thermistor elements and applied products
using them (temperature sensors, humidity sensors, hygrometers,
temperature controllers, anemometers, etc.)
Capital 2,144 million yen (as of March 31, 2019)
Net sales 27.1 billion yen (FY2018 / Consolidated)
Ordinary income 2.8 billion yen (FY2018 / Consolidated)
Manufacturing
sites6 sites in Japan, 3 overseas sites in Thailand and China
Number of
employeesApprox. 4,700 (as of March 31, 2019 / Consolidate)
Stock exchange
listingJASDAQ Standard, Tokyo Stock Exchange (Code number : 6957)
Share unit 100 shares
[Reference]Corporate Info
Head office of
Shibaura Electronics Co., Ltd.

Th
erm
isto
r e
lem
en
t p
rod
uctio
n
• Fukushima
Mo
the
r fa
cto
rie
s
• Tohoku
• Iwate
• Kakunodate
• Aomori
• Miharu
Ove
rsea
s m
an
ufa
ctu
rin
g s
ite
s
• Thai
• Shanghai
• Dongguan
Te
st ce
nte
rs
• Tohoku
• Fukushima
• Iwate
Research on thermistor elements
Basic research
Technologies development
New & value-added products
Guidance for overseas factories
Mass production
Quality assurance
Design verification
[Reference]Production system
Shibaura ElectronicsShibaura Electronics Research, development and designing・
A thermistor is a thermally sensitive resistor generally composed of semiconductor materials, and its
resistance varies significantly with temperature.
Thermistors are economical and stable, and operate in the temperature range that covers the whole
range necessary for ordinary temperature control. They therefore are used in a wide range of
applications.
Shibaura produces NTC (negative temperature coefficient) thermistors only.
They exhibit decreasing resistance with increasing temperature, and are used in temperature detection
sensors. There are also PTC (positive temperature coefficient) and CTR (critical temperature resistor)
thermistors.
[Reference]Definition of terms
Thermistor
PSB thermistor element
Shibaura independently developed glass-encapsulated thermistors.
With excellent heat-resisting property, mechanical strength and stability, they are now Shibaura’s main
products.
PSB thermistors were patented in major countries (Japan, the U.S., the U.K., Germany, France,
Canada, Italy and Switzerland).

[Reference]Number of thermistors installed in a product
Household
equipment
Solar system Shower toilet Water heaterHighly efficient hot
water supply system
[ 1 to 3 ] [ 2 to 3 ] [ 2 to 5 ] [ 10 to 20 ]
A/C
Fan heater Room A/C Industrial A/C
[ 2 to 3 ] [ 2 to 5 ] [ 5 to 15 ]
Home
appliances
Microwave oven Rice cooker Refrigerator IH cooker
[ 2 to 3 ] [ 2 to 3 ] [ 2 to 8 ] [ 5 to 15 ]
OA
Printer Copy machineMulti-functional
copier
[ 2 ] [ 2 to 3 ] [ 3 to 5 ]
Industrial
equipment
Fire alarm Machine, robot Freezing showcase Freezing container
[ 2 ] [ 1 to 2 ] [ 2 to 5 ] [ 5 to 10 ]
Automotive
Car A/C Intake air, exhaust gas, water, fuel, oil Hybrid system
[ 4 to 5 ] [ 8 to 10 ] [ 8 to 10 ]
[ ]: Number of thermistors in a product

[Reference]Applications for various temperature ranges
From -50℃ to 1,000℃. Thermistor technology produces high added value.
Existing products(Glass coated thermistors)
High-value-added products(Glass coated thermistors for high temperature)
-50℃ 0℃ 50℃ 100℃ 300℃ 500℃ 1,000℃
Shibaura’s original technology
Applications
●(Tuna) stock freezer
●Refrigerator
●Air conditioner
●EcoCute(CO2 heat pomp)
●Hot-water supply
●Automotive (Water)
●Dishwasher (Drying)
●Rice cooker
●Microwave oven
●Automotive(HV & EV motors)
●Copy machine
●IH cooker
●Fan heater
●Automotive (EGR)
●Oven●Household equipment
(Gas flame)
●Automotive(DPF)